summary of safety and effectiveness data (ssed) · pdf filesummary of safety and effectiveness...
TRANSCRIPT

SUMMARY OF SAFETY AND EFFECTIVENESS DATA (SSED)
I. GENERAL INFORMATION
Device Generic Name: viral load detection.
In vitro polymerase chain reaction (PCR) based assay for HBV
Device Trade Name: Abbott RealTime HBV Assay, Abbott RealTime HBV Amplification Reagent Kit, Abbott RealTime HBV Calibrator Kit, Abbott RealTime HBV Control Kit.
Applicant's Name and Address: Abbott Molecular Inc., 1300 E. Touhy Avenue, Des Plaines, IL 60018
Date(s) of Panel Recommendation: None
Premarket Approval Application (PMA) Number: P080026
Date of FDA Notice of Approval: August 13, 2010
Expedited: Not applicable
II. INDICATIONS FOR USE
Abbott RealTime HBV assay is an in vitro polymerase chain reaction (PCR) assay for use with the Abbott m2000 SystemDNA reagents and with the Abbott m2000sp and m2000rt instruments for the quantitation of Hepatitis B Virus (HBV) DNA in human serum or plasma (EDTA) from chronically HBV-infected individuals. The assay is intended for use as an aid in the management of patients with chronic HBV infection undergoing antiviral therapy. The assay can be used to measure HBV DNA levels at baseline and during treatment to aid in assessing response to treatment. The results from the Abbott RealTime HBV assay must be interpreted within the context of all relevant clinical and laboratory findings.
Assay performance for determining the clinical stage of HBV infection has not been established. Clinical performance characteristics have been established for individuals treated with adefovir dipivoxil. This assay is not intended for use as a screening test in blood or blood products for HBV or as a diagnostic test to confirm the presence of HBV infection.
III. CONTRAINDICATIONS
None known
IV. WARNINGS AND PRECAUTIONS
PMA P080026: FDA Summary of Safety and Effectiveness Data page I
For in vitro diagnostic use only The warnings and precautions for the Abbott RealTime HBV assay are stated in the respective product labeling.
V. DEVICE DESCRIPTION
The Abbott RealTime HBV assay is an in vitro polymerase chain reaction (PCR) assay for the quantitation of HBV DNA in human plasma (EDTA) or serum from HBV-infected individuals. The Abbott RealTime HBV assay uses PCR to generate amplified product from the DNA genome of HBV in clinical specimens. The Abbott RealTime HBV assay uses the Abbott m2000sp instrument for processing samples and the Abbott m2000rt instrument for amplification and detection. The m2000sp and m2000rt instruments, as a part of the m2000 System, were approved in the Abbott RealTime HIV1 PMA BP060002, May 11, 2007, and subsequently cleared in the Abbott RealTime CT/NG 510(k) k080739 on 7/10/2008. The Abbott m2000sp uses the Abbott mSample Preparation SystemDNA reagents to extract DNA for amplification and detection. The mSample Preparation reagents include lysis reagent, magnetic particle reagent for capturing nucleic acids, wash, and elution reagents. Proteinase K is included in the lysis step to digest proteins associated with the nucleic acids. The Abbott m2000sp provides automated sample eluate transfer to an Abbott 96Deep Well Plate, and reaction assembly in the Abbott 96-Well Optical Reaction Plate. The 96-Well Optical Reaction Plate is manually sealed and transferred to the m2000rt to perform the amplification and real-time fluorescence detection reaction. Results are automatically reported on the m2000rt workstation. An internal control nucleic acid is introduced into each sample during the sample preparation process and measured on the m2000rt to demonstrate that the process was completed correctly for each sample and control. The Abbott RealTime HBV assay contains sufficient reagents to process approximately 96 tests. A total of 48 samples can be processed in each run. A negative control, a low positive control, and a high positive control must be included in each run, therefore allowing a maximum of 45 specimens to be processed in each run. Application parameters specific to the Abbott RealTime HBV assay are contained on an assay specific application file, housed on a CD-ROM and loaded onto the m2000sp and m2000rt instruments. The Abbott RealTime HBV assay consists of three kits:
Abbott RealTime HBV Amplification Reagent Kit (List No. 2N40-90) Abbott RealTime HBV Control Kit (List No. 2N40-80) Abbott RealTime HBV Calibrator Kit (List No. 2N40-70)
Sample Preparation The purpose of sample preparation is to extract and concentrate nucleic acid, to make the target accessible for amplification, and to remove potential inhibitors of amplification from the extract. This process is accomplished by the m2000sp, an automated sample preparation system designed to use magnetic microparticle processes for the purification of nucleic acids from samples. The Abbott mSample Preparation SystemDNA reagents lyse the virion, capture the nucleic acids and wash the particles to remove unbound sample components. Proteinase K is
PMA P080026: FDA Summary of Safety and Effectiveness Data page 2
- 6

included in the lysis step to digest proteins associated with the nucleic acids The bound nucleic acids are eluted and transferred to a 96-deep well plate. The nucleic acids are then ready for amplification. The Internal Control (IC) is introduced into the Sample Preparation Protocol and is processed along with the calibrators, controls, and specimens.
Reagent Preparation and Reaction Plate Assembly The Abbott m2000sp combines the Abbott RealTime HBV amplification reagent components (HBV Oligonucleotide Reagent, DNA Polymerase, and Activation Reagent). The Abbott m2000sp dispenses the resulting master mix to the Abbott 96-Well Optical Reaction Plate along with aliquots of the nucleic acid samples prepared by the Abbott m2000sp. After manual application of the Abbott Optical Adhesive Cover, the plate is ready for transfer to the Abbott m2000rt.
Amplification During the amplification/detection reaction on the m2000rt instrument, the target DNA is amplified by the DNA polymerase in the presence of deoxynucleotide triphosphates (dNTPs) and magnesium. First, the HBV and Internal Control primers anneal to their respective targets and are extended by the polymerase. After a denaturation step in which the temperature of the reaction is raised above the melting point of the double-stranded DNA product, the newly created DNA strand is denatured from the target DNA. During each round of thermal cycling, amplification products dissociate to single strands at high temperature allowing primer annealing and extension as the temperature is lowered. Exponential amplification of the target is achieved through repeated cycling between high and lower temperatures. Amplification of both targets (HBV and IC) takes place simultaneously in the same reaction. The target sequence for the Abbott RealTime HBV assay is in the Surface gene in the HBV genome. This region is specific for HBV and is highly conserved. The primers are designed to hybridize to this region with the fewest possible mismatches among HBV genotypes A through H. The target sequence for the Internal Control is derived from the hydroxypyruvate reductase gene from the pumpkin plant Cucurbitapepo,and is provided as a DNA plasmid in a buffered solution.
Detection The presence of HBV amplification products is detected during the extension/anneal step by measuring the fluorescence of the HBV probe that binds to the target during the extension/anneal step. Similarly, the presence of IC amplification is detected during the extension/anneal step by measuring the fluorescence of the IC probe. The HBV and IC probes are single-stranded DNA oligonucleotides consisting of a probe sequence with a fluorescent moiety that is covalently linked to the 5' end of the probe and a quenching moiety that is covalently linked to the 3' end of the probe. In the absence of the HBV or IC target sequences, probe fluorescence is quenched. In the presence of the HBV or IC target, the HBV or IC probes specifically bind to their target. During the extension/anneal step, the DNA polymerase cleaves, or nucleolytically digests, the bound probe as the polymerase moves along the template strand. This
PMA P080026: FDA Summary of Safety and Effectiveness Data page 3

separates the fluorophore from the quencher, allowing fluorescent emission and detection. The HBV and IC specific probes are each labeled with a different fluorophore, thus allowing for simultaneous detection of both amplified products at each cycle. The amplification cycle at which fluorescent signal is detected by the Abbott m2000rt is inversely related to the log of the HBV DNA concentration present in the original sample.
Abbott RealTime HBV Amplification Reagent Kit Description The Abbott RealTime HBV Amplification Reagent Kit consists of: * *
* * *
Abbott RealTime HBV Internal Control (List No. 2G34Y) Abbott RealTime HBV Amplification Reagent Pack (List No. 2N40), which contains:
DNA Polymerase (Part 33794) HBV Oligonucleotide Reagent (List No. 2G34L) Activation Reagent (Part 51-503200)
The Abbott RealTime HBV Amplification Reagent Kit contains four vials of Abbott RealTime HBV Internal Control and four Abbott RealTime HBV Amplification Reagent Packs.
Abbott RealTime HBV Internal Control (List No. 2G34Y) The Abbott RealTime HBV Internal Control consists of noninfectious linearized DNA plasmid in a buffer solution with carrier DNA and contains the preservatives sodium azide and ProClin®950. Prior to sample preparation, the Internal Control is introduced into the lysis buffer, which is then used during the processing of each specimen, calibrator and control and measured on the m2000rt instrument to demonstrate proper sample processing and assay validity
Abbott RealTime HBV Amplification Reagent Pack (List No. 2N40) The Abbott RealTime HBV Amplification Reagent Pack consists of the DNA polymerase the HBV Oligonucleotide Reagent, and the Activation Reagent.
DNA Polymerase (Part No. 33794) Each vial contains DNA polymerase in a buffered solution with stabilizers. The DNA polymerase functions as an enzyme in PCR amplification. HBV Oligonucleotide Reagent (List No. 2G34L) Each vial of HBV Oligonucleotide Reagent contains two pairs of oligonucleotide primers and three probes; one primer pair and two probes are specific for amplifying and detecting HBV DNA, and the other primer pair and remaining probe are specific for amplifying and detecting Internal Control DNA. The reagent also contains dNTPs and ROXTM passive reference dye. The reagent is formulated in a TRIS-potassium chloride buffer with the preservatives sodium azide and ProClin 950. Activation Reagent (Part No. 51-503200) Each vial of Activation Reagent contains a 38 mM magnesium chloride solution and the preservatives sodium azide and ProClin 950.
PMA P080026: FDA Summary of Safety and Effectiveness Data page 4
8
Abbott RealTime HBV Control Kit (List No. 2N40-80) The Abbott RealTime HBV Control Kit consists of:
Abbott RealTime HBV Negative Control (List No. 2G34Z) Abbott RealTime HBV Low Positive Control (List No. 2G34W) Abbott RealTime HBV High Positive Control (List No. 2G34X)
The Abbott RealTime HBV Control Kit contains three controls (eight vials of Abbott RealTime HBV Negative Control, eight vials of Abbott RealTime HBV Low Positive Control, and eight vials of Abbott RealTime HBV High Positive Control) that are used to establish the run validity of the Abbott RealTime HBV assay. The Abbott RealTime HBV Negative Control contains negative human plasma that is tested and found to be nonreactive by FDA licensed tests for antibody to HCV, antibody to HIV-1, antibody to HIV-2, and HBsAg. The material is also tested and found to be negative by FDA licensed PCR methods for HIV- 1 RNA and HCV RNA, and contains the antinmicrobials ProClin 300 and ProClin 950. The Abbott RealTime HBV Low Positive Control and High Positive Control contain heat-inactivated plasma reactive for HBV DNA in negative human plasma. The negative human plasma used in the Abbott RealTime HBV Low Positive Control and High Positive Control is tested and found to be nonreactive by FDA licensed tests for antibody to HCV, antibody to HIV-1, antibody to HIV-2, and HBsAg. The material is also tested and found to be negative by FDA licensed PCR methods for HIV-1I RNA and HCV RNA, and contains the preservatives ProClin 300 and ProClin 950.
2.1I0.7 Abbott RealTime HBV Calibrator Kit (List No. 2N40-70) The Abbott RealTime HBV Calibrator Kit consists of:
Abbott RealTime HBV Calibrator A (List No. 2G34A) Abbott Realfime HBV Calibrator B (List No. 2G34B)
The Abbott RealTime HBV Calibrator Kit contains two calibrators (12 vials of Abbott RealTime HBV Calibrator A and 12 vials of Abbott RealTime HBV Calibrator B) that are used to generate a calibration curve for the quantitative determination of HBV in human plasma. The Abbott RealTime HBV Calibrator A and Calibrator B contain noninfectious linearized HBV DNA plasmid in a buffer solution and contains the antimicrobials sodium azide and ProClin 950.
Assay Calibration A calibration curve is required to quantitate HBV DNA in the specimens and controls. Two assay calibrators are run in replicates of three to generate a calibration curve (HBV concentration [log IU/mL] versus the threshold cycle [Ct] at which a reactive level of fluorescent signal is detected). The lot specific values for Calibrator A and Calibrator B are specified on each Abbott RealTime HBV Calibrator Kit Card and must be entered into the assay test order when a run is performed. The calibration curve slope and intercept are calculated and stored on the instrument. The concentration of the HBV DNA in a sample is calculated from the calibration curve. Results are automatically reported on
PMA P080026: FDA Summary of Safety and Effectiveness Data page 5

the m2000rt workstation. The Low and High Positive Controls and Negative Control must be included in the calibration run. Once an Abbott RealTime HBV calibration is accepted and stored, it may be used for six months. During this time, all subsequent samples may be tested without further calibration unless a new lot of the Abbott RealTime HBV Amplification Reagent Kit or new lot of an Abbott mSample Preparation SystemDNA is used; an Abbott RealTime HBV application specification file for a different sample volume is used; or an updated version of the Abbott RealTime HBV application specification file is installed.
Quality Control Procedures: Detection of Inhibition An IC threshold cycle [Ct] assay validity parameter is established during a calibration run. Prior to sample preparation, a defined, consistent quantity of the IC is introduced into the lysis buffer, which is then used during the processing of each specimen, calibrator, and control, and measured on the m2000rt instrument to demonstrate proper sample processing and assay validity. The IC is comprised of a DNA sequence unrelated to the HBV target sequence. The median amplification cycle at which the IC target sequence fluorescent signal is detected in calibration samples establishes an IC Ct validity range to be met by all subsequent processed specimens. Specimens whose IC Ct value falls outside of the established range must be retested starting with sample preparation.
Negative and Positive Controls A negative control, a low positive control, and a high positive control are included in each run to evaluate run validity. The lot specific values for the low positive control and high positive control are specified on each Abbott RealTime HBV Control Kit Card and must be entered into the assay test order when a run is performed. If negative or positive controls are out of range, all of the specimens and controls from that run must be reprocessed, beginning with sample preparation. The presence of HBV must not be detected in the negative control. HBV detected in the negative control is indicative of contamination by other samples or by amplified product introduced during sample preparation or during preparation of the Abbott 96-Well Optical Reaction Plate.
Results Calculation The concentration of HBV DNA in a sample or control is calculated from either a stored calibration curve, or a calibration curve created by calibrators within a calibration or sample run. The Abbott m2000rt instrument automatically reports the results on the m2000rt workstation. Assay results are reported in IU/mL or log IU/mL. Results can also be reported in copies/mL or log copies/mL using a conversion factor of 3.41 (1 IU = 3.41 copies). Note: The assay is calibrated to the WHO International Standard for HBV. The 3.41 conversion factor is an approximation based on an average conversion factor across the assay dynamic range. The following table represents the potential m2000rt outputs. Interpretation of Results:
Sample Volume Result Interpretation
PMA P080026: FDA Summary of Safety and Effectiveness Data page 6
10

0.5 mL Not Detected Target not detected
< 1.00 Log 1U/mLa Detectedc
1.00 to 9.00 Log 1U/mL d
> 9.00 Log IU/mL > ULQ¢
0.2 mL Not Detected Target not detected
< 1.18 Log 1lJ/mLb Detectedc
1.18 to 9.00 Log 1U/mL
> 9.00 Log IU/mL > ULQV
10 IU/mL b 15 IU/mL' Below LLQ - below lower limit of quantitation or LLoQ; HBV DNA is not quantifiable. dCalculated results are within assay linear range. If a calculated result isobtained, the Interpretation field is left blank.
>ULQ- above upper limit of quantitation or ULoQ; if IU/mL are above the linear range of the assay, results are
reported as ">1,000,000,000 IU/mL HBV DNA."
If negative or positive controls are out of range, all of the specimens and controls from that run must be reprocessed, beginning with sample preparation. If quantitative results are desired for those specimens reported as > ULQ, the original specimen should be diluted 1:50 with HBV-negative human plasma or serum (consistent with the matrix of the original specimen), and the test repeated. Multiply the reported result by the dilution factor of 50 to obtain the quantitative result.
VI. ALTERNATIVE PRACTICES AND PROCEDURES
Currently, methods for following the progress of antiviral therapy include immunoassay (serological tests, enzyme immunoassay), biochemical (alanine aminotransferase), and histological (liver biopsy - fibrosis, inflammation). A molecular method commercially available to follow HBV DNA response to antiviral therapy during the course of treatment is the Roche Cobas® TaqMan® HBV Test.
VII. MARKETING HISTORY
The Abbott RealTime HBV assay received CE certification and was launched in May 2007 outside of the United States, under the list number of 2G34. The following countries receive the Abbott RealTime HBV assay: Australia, Austria, Belgium, Central Africa, Croatia, Czech Republic, Finland, France, Germany, Ireland, Italy, Netherlands, Norway, West Africa, Poland, Portugal, Romania, Saudi Atabia, South Africa, Spain, Sweden, Switzerland, Turkey, and United Kingdom. In Asia, it is currently being marketed in Korea. This product has not been withdrawn from the market from any country related to safety or effectiveness, or for any other reasons.
PMA P080026: FDA Summary of Safety and Effectiveness Data page 7
11

VIII. POTENTIAL ADVERSE EFFECTS OF THE DEVICE ON HEALTH
To aid in the management of patients with chronic HBV infection undergoing anti-viral therapy, the results from the Abbott RealTime HBV assay must be interpreted within the context of all relevant clinical and laboratory findings. Failure of the Abbott RealTime HBV assay to perform as indicated or human error in use of the product may result in an erroneous test result that is too low or too high. An erroneous low test result may lead to inappropriate treatment, or instill a false sense of security in a patient. An erroneous high test result may contribute to unnecessary treatment or create anxiety in the patient. The assay is not intended for use as a screening test for blood or blood products for the presence of HBV or as a diagnostic test to confirm the presence of HBV infection. Assay performance characteristics have been established for individuals treated with adefovir dipivoxil. Assay performance for determining the state of HBV infection has not been established.
IX. SUMMARY OF PRECLIINICAL STUDIES
A. Laboratory Studies
Traceability to the WHO Standard
The figure below demonstrates the comparison of Abbott RealTime HBV Assay *Calibrators to the WHO International HBV DNA Standard. Abbott RealTime HBV Calibrators trace to the World Health Organization (WHO) International Standard for Hepatitis B Virus DNA (NIBSC Code 97/746) each time a lot is manufactured. Each lot of calibrator is specifically assigned a quantitation value through testing with HBV Primary Calibrators, which are directly tested against the WHO Standard. The lot-specific quantitation values for each HBV calibrator are entered into the m2000rt software when a run is being performed. The evaluation was conducted with the WHO 1st International HBV DNA Standard, and one lot of HBV Calibrators, and was performed on one run. The WHO International HBV DNA Standard was reconstituted to a concentration of 1X io5 IU/mL and then diluted tol X104~, 1 X 10o, and I X 102 IU/mL in negative human plasma. The highest assay calibrator, Calibrator B, which is lot-assigned at 6.42 log IU/mL, was diluted to 1 XB35,i1 X104, 1 x 10³, and 1 X 10² IU/mL in Tris-EDTA (TE) buffer. The data for Calibrator B and its dilution series are presented in comparison to the WHO International HBV DNA Standard dilution series in the figure below. The results indicate that the assay standardization process provides quantitation values for the RealTime HBV Calibrators and the WHO International HBV DNA Standard that are similar to the expected values *with deviation of not more than 0.33 log IU/mL. The maximum deviation was obtained at the assay ULQ.
Comparison of WHO 1999 Is'International Standard with Abbott RealTime HBV Calibrators:
PMA P080026: FDA Summary of Safety and Effectiveness Data page 8

7.00
6.00
o 5.00
0 -J~~~~~~~~~~~~~~~~~~~~~~~~~~~~ .''/
C)0
Z 3.00
00
1.00
0.00 -
0.00 1.00 2.00 3.00 4.00 5.00 .0o0 7.00
Expected HBV DNA Concentration (Log IU/mL)
0 Abbott ReaMme HBV Calibmators
A WHO 1999 1st International Standard dlutlonseWes
Linear Range
In one study, a 13-member panel prepared by diluting an HBV-positive specimen targeted from 9.13 log IU/mL to 0.29 log IU/mL in HBV negative human plasma was tested and evaluated in accordance with methods defined in the CLSI EP6-A, using the 0.5 mL sample preparation protocol. The Abbott RealTime HBV assay was shown to be linear in plasma across the range of HBV DNA concentrations tested (shown in the figure below) with deviation from linearity of not more than 0.20 log IU/mL.
PMA P080026: FDA Summary of Safety and Effectiveness Data page 9
13

Abbott RealTime HBV Linear Range Least Squares Linear Regression Analysis:
10t -.00x00 ,y * 0.ssx~+ 0.01
1.00 r - O.99 n= 77
E TOD 10,
?,0
-9 100
03 e o
4.00
4,00
2.DO
1.00
0.M 1.00 2.0 8.00 4.00 5.00 6.00 7.00 6.00 !. 10.00
Target Concerwration (Log IU/mL)
In a second study, one panel consisting of Genotype A and one panel consisting of Genotype C were tested. The two 10-member panels were prepared by diluting to concentrations targeted from 1.27 log IU/mL to 8.47 log IU/mL for Genotype A and 1.59 log IU/mL to 8.79 log IU/mL for Genotype C. The two panels were prepared with high copy HBV-positive specimens diluted in HBV serologically-negative human plasma. Least squares linear regression analysis was performed for Genotypes A and C separately. Analysis for Genotype A and Genotype C is shown in the two figures below. The Abbott RealTime HBV assay was shown to be linear in plasma across the range of HBV DNA concentrations tested for HBV Genotype A and HBV Genotype C.
PMA P080026: FDA Summary of Safety and Effectiveness Data page 10 14

Abbott RealTime HBV linear range least squares linear regression analysis Genotype A: S
y - o.99x-. 10 r -0.998
8 n - 80
7
-.E 6
0)0
>-3Jx
4;
3~
2 ' 4
+
01 2 3 4 5 6 7 8 9
Target Conceitraflon (Log IU/mL)
PMA P080026: FDA Summary of Safety and Effectiveness Data page 11 15l

Abbott RealTime HBV linear range least squares linear regression analysis Genotype C:
9
y - OSeex -0.09
r - 0.999 nn-GO
7
E
0
0 3 4J6
> B~ ~ ~~~~~agtCocrtatn:LgUrL
Inaddtoa,-e brsrmpnladaIOm me lsapnltreigtelna rag fteasywstse spr fterpouiiiysuisadeautd
Th4botRa~m B sa a hw ogv ierrsos rmI Um (10 o Um)HVDAto19I/L(.0lgI/m)HVDAi ohET pasm, n eu ihdvainfo iertyntmr hn02 o Um o h .
Ineaditon, aeieda seru aondentat10-meember plasma panelbargetingthe linear14-eme pNAne rangdeteofithe assy wstestengdiastpart of the repOducenaibilit Stuisandar evalueated.s
ThermArbbotRealysisme thBVdassay was ushow to gietarinea rhesponsenfratom 10 IU/LH
Limitof (LoD WHtOinterntionIUStmLarDeectio usrgethCne
plasmarad serumte with deiaio fromablinerttoymr.hn020lgI/L o h .
wtdeiiofrmlnarty log Lu/mLafrithed mLe sample prepaatoopoocl TerslsothLoinplasma and serum noth smorethanu0.2 0.2
Limit800of FDetection LoD)y EfcivnternatioaltandardSafethe WHO 1
TheBVoDdefnedasNA oncntrtiohe deectd wth prbablit of956

[ SampleVolume
Sample Matrix
Concentration 95%
Detected with Probability
Confidenc Concentration Deece5wt Detectedcewith
nevlProbability
95%
Confidence Itra
Log IU/mL IU/mL
0.5 ml, Plasma 0.81 (0.60, 1.12) 6.40 (3.97, 13.03)
0.2 mL Plasma 1.03 (0.85, 1.29) 10.66 (7.11, 19.38)
0.5 mL Serum 0.58 (0.19, 1.84) 3.82 (1.55, 69.76)
0.2 mL Serum 0.75 (0.56, 1.04) 5.61 (3.62, 10.94)
Limit of detection (LoD) in plasma using WHO international standard; 0.5 mL sample pr aration protocol:
IU/mnL Number Tested Number Detected Percent Detected
20.00 26 26 100
10.00 26 *25 96
5.00 26 26 100
2.50 26 23 88
1.00 26 12 46
0.50 26 7 27
0.25 26 7 27
0.10 26 4 1 5
Probit analysis of the data determined that the concentration of HBV DNA detected with 95% probability was 6.40 IU/mL (95% CI 3.97-13.03 IU/mL).
Limit o f detection (LoD) in serum using WHO International Standard 0.5 mL sample prepraion protocol:
IU/mL Number Tested Number Detected Percent Detected
20.00 30 30 100
10.00 30 30 100
5.00 30 30 100
2.50 30 29 97
1.00 30 17 57
0.50 30 16 53
0.25 30 1 3
0.10 30 8 27
Probit analysis of the data determined that the concentration of HBV DNA detected with 95% probability was 3.82 IU/mL (95% CI 1.55-69.76 IU/mL).
Limit of detection (LoD) in plasma using WHO International Standard 0.2 ml,sample preparation protocol:
PMA P080026: FDA Summary of Safety and Effectiveness Data page 13

IU/mL Number Tested Number Detected Percent Detected
40.00 27 27 100
20.00 27 27 100
10.00 27 26 96
5.00 27 23 85
2.50 27 12 44
1.00 27 11 41
0.50 27 6 22
0.20 27 0 0
Probit analysis of the data determined that the concentration of HBV DNA detected with 95% probability was 10.66 IU/mL (95% CI7.11-19.38 lU/mL).
Limit of detection (LoD) in serum using WHO International Standard 0.2 mL sample preparation protocol:
IU/mL Number Tested Number Detected Percent Detected
40.00 30 30 100
20.00 30 30 100
10.00 30 30 100
5.00 29a 25 86
2.50 30 27 90
1.00 30 17 57
0.50 30 17 57
0.20 30 4 13
One replicate was deleted due to instrument error. Probit analysis of the data determined that the concentration of HBV DNA detected with 95% probability was 5.61 1U/mL (95% Cl 3.62-10.94 IU/mL).
The LoD of the Abbott RealTime HBV assay is determined as 10 IU/mL for the 0.5 mL sample preparation protocol and 15 IU/mL for the 0.2 mL sample preparation protocol.
Limit ofDetection (LoD) by Genotype Usine Clinical Specimens
The LoD was determined by analysis of a dilution series of patient samples representing HBV Genotypes A, B, C, D, E, F, G, H and of the WHO (World Health Organization) International Standard. One patient sample for each HBV genotype was tested. Serial dilutions were made in HBV serologically negative human plasma and serum to create an eight-member panel with the target concentrations 0.10 IU/mL, 0.25 IU/mL, 0.50 IU/mL, 1.00 IU/mL, 2.50 IU/mL, 5.00 IU/mL, 10.0 IU/mL, and 20.0 IU/mL for the 0.5 mL sample preparation protocol; and target concentrations of 0.20 IU/mL, 0.50 IU/mL, 1.00 IU/mL, 2.50 IU/mL, 5.00 IU/mL, 10.00 IU/mL, 20.00 IU/mL, and 40.00 IU/mL for the 0.2 mL sample preparation protocol.
PMA P080026: FDA Summary of Safety and Effectiveness Data page 14

Probit analysis of the data was used to determine the concentration of each HBV genotype detected with 95% probability. Summaries of the results of LoD by genotype at both volumes are shown in tables below.
Summary of LoD by genotype for 0.5 mL sample preparation protocol:
Genotype Tested
Plasma Serum
Concentration Detected (IU/mL) (95% Confidence Interval)
Concentration Detected (IU/mL) (95% Confidence Intervals)
WHO 3.69 (2.59, 6.19) *
A 2.31 (1.59, 4.08) 5.49 (2.86, 19.05)
B 2.96 (2.12, 4.90) **
C 4.53 (3.18, 7.58) 3.92 (2.09, 14.50)
D 3.23 (2.23, 5.62) **
E 4.73 (2.11, 39.36) 3.72 (2.55, 6.47)
F 4.22 (2.80, 7.73) **
G 2.51 (1.80, 4.21) 1.94 (1.43, 3.14)
H 8.11 (4.18, 27.97) **
· WHO standard was not tested inserum inthis study. · * Genotypes B, D, F, and Hwere tested inserum with 0.2 mL volume only.
The LoD for the assay to detect HBV in clinical specimens using 0.5 mL sample preparation protocol volume, detecting any of the eight genotypes tested, considering that assay does not differentiate between HBV genotypes, is determined to be 10 LU/mL.
Summary of LoD by genotype for 0.2 mL sample preparation protocol:
Genotype Tested
Plasma Serum
Concentration Detected (IU/mL) (95% Confidence Interval)
Concentration Detected (IU/mL) (95% Confidence Intervals)
WHO 8.16 (5.63, 13.93) *
A 5.86 (4.00, 10.22) **
B 5.37 (3.72, 9.23) 2.40 (1.61, 4.65)
C 8.61 (5.95, 14.68) **
D 5.34 (3.54, 9.93) 2.26 (1.55, 4.21)
E 14.57 (9.63, 26.28) **
F 6.60 (4.41, 11.98) 7.18 (4.75, 13.20)
PMA P080026: FDA Summary of Safety and Effectiveness Data page 15 19

G 3.84 (2.61, 6.94) **
H 19.10) (7.34, 10.86 7.65 (5.01, 14.26) * WHO standard was not tested in serum in this study. ** Genotypes A, C, E, and G were tested in serum with 0.5 mL volume only.
The LoD for the assay to detect HBV in clinical specimens using 0.2 mL sample preparation protocol volume, detecting any of the eight genotypes tested, considering that assay does not differentiate between HBV genotypes, is determined to be 15 IU/mL.
Limit of Ouantitation
The total analytical error (TAE) was calculated using estimates determined from the reproducibility studies that were conducted at three sites: two external sites and one internal site. Genotypes A and C were tested at both sample volumes and in both plasma and serum. Presented in the table below are the TAE estimates for the plasma panel members that had an observed concentration at or near the assay limit of detection, for each sample input volume.
Plasma: Total Analytical Error Estimates (Log IU/mL)
Sample Protocol Volume (mL) n
HBV Genotype (Panel Member)
Expected Cone.
Observed Cone.
Absolute Bias SD'
TAEc Absolute Bias + (2 x SD)
TAE d
SQRT(2) x 2 x SD
0.5 110 A (5) 1.04 0.90 a 0.14 0.32 0.78 a 0.91 a
0.5 119 C(10) 1.14 1.13 0.01 0.29 0.59 0.82
0.2 37 A (5) 1.04 1.03 a 0.01 0.40 0.810 1.13 a
0.2 46 C (10) 1.14 1.24 0.10 0.30 0.70 0.85
'Panel Member is below the assay Limit of Detection (1.00 log IU/ml for 0.5 ml and 1.18 log IU/ml for 0.2 ml). TAE is provided for information only.
bSD = within-run component variability + between-run component variability. Per Section 5.1 ofEP17-A CLSI guideline. Based on difference between two measurements approach.
Presented in the table below are the TAE estimates for the serum panel study. TAE was estimated by two different methods (see table footnotes).
Serum: Total Analytical Error Estimates (Log IU/mL)
Sample Protocol Volume (mL) n
HBV Genotype (Panel Member)
Expected Cone.
Observed Conc.
Absolute Bias SDb
TAEc Absolute Bias + (2 x SD)
TAEd SQRT(2) x 2 x SD
0.5 88 A (6) 1.36 1.04 0.32 0.20 0.72 0.57 0.5 90 C (12) 1.48 1.29 0.19 0.20 0.59 0.57 0.5 88 C (13) 1.27 0.95 a 0.32 0.25 0.82 a 0.718
0.2 88 A (5) 1.56 1.100 0.46 0.24 0.94a 0.68a
0.2 89 C (12) 1.48 1.14 0.34 0.24 0.82 0.68
PMA P080026: FDA Summary of Safety and Effectiveness Data page 16
20

' Panel Member is below the assay Limit of Detection (1.00 log IU/ml for 0.5 ml and 1.18 log IU/ml for 0.2
ml). TAE is provided for information only.SD = within-run component variability + between-run component variability.
'Per Section 5.1 of EP17-A CLSI guideline. dBased on difference between two measurements approach.
These studies demonstrated that the Abbott RealTime HBV assay can determine with an acceptable level of accuracy the concentration of HBV DNA in EDTA plasma and serum at concentrations of 10 IU/mL (1.00 log IU/mL) for the 0.5 mL sample protocol volume and 15 IU/mL (1.18 log IU/mL) for the 0.2 mL sample protocol volume. At these concentrations, the difference between two measurements of more than 1.0 log 1U/mL is statistically significant.
Linearily ofassay by HBVugenotvpe
The ability of the RealTime HBV assay to detect and quantitate HBV genotypes was evaluated through linearity studies by diluting eight specimens, one of each genotype A through H, to target concentrations of 4.47 log 1U/mL, 3.47 log IU/mL, 2.47 log IU/mL, and 1.17 log IU/mL in HBV serologically negative human plasma. Three replicates were tested at each concentration for each genotype, using the 0.5 mL sample preparation protocol. The results are summarized in the table and figure below.
Abbott RealTime HBV linearity of assay by HBV Genotype
HBV Genotype
Linear Equation in Linearity Study
Maximum Difference' Between Genotype A and
Corresponding Genotype (log IU/mL)
A. y = 0.95x + 0.19 n/a
B y = 0.89x + 0.40 0.35
C y =0.93x+ 0.32 0.11
D y = 0.89x + 0.43 0.32
E y = 0.86x + 0.58 0.44
F y = 0.90x + 0.42 0.23
G y =0.85x + 0.61 0.51
H y = 0.86x + 0.60 0.42
The maximum difference was obtained at the assay ULoQ or LLoQ.
PMA P080026: FDA Summary of Safety and Effectiveness Data page 17
21

Abbott RealTime HBV linearity of assay by HBV genotypes (dilutional linearity): 7.00
0.00~~~~~~~~~~~~~~~~~~~~~~~~~~~~~~~~~~~~.
$.00
2.00
1.OO
0.00ojoo 3.o 2.io
"1'argatCor
,.0o rmt-lr
4.0 (LOaU IU/nL.)
,.0
Oeatxayp IS Gatp F ~*'-I Gncltype G r~nalp Hr I.
The data from the studies demonstrate that the Abbott RealTime HBV assay iscapable to quantitate different HBV genotypes across the linear range with deviation of not more 0.51 log IU/mL.
Precision
Within-Lahoratorv Precision(Lot-to-Lot)
The between instrument and lot precision of the assay was evaluated within a laboratory using an 8-member panel. Panel members 2, 3, 5, and 7 were prepared by diluting a high copy HBV patient sample in HBV serologically negative human serum. Panel members 1,4, 6,and 8 were prepared by diluting the same high copy HBV patient sample into HBV serologically negative human plasma. A total of three reagent lots were used and each lot was assigned an m2000sp and m2000rt instrument pair. A total of 45 replicates were tested for each panel member across the three pairs of m2OOOsp and m2000rt instruments. One run was performed per day on each instrument pair for five days for a total of 15 runs. Panel members I through 8 were run in replicates of three. The 0.5 mL, sample preparation protocol was used. Results are summarized in the table below.
Abbott RealTime HBV Within-Laboratory Precision for the 0.5 ml, Sample Preparation Protocol:
PMA P080026: FDA Summary of Safety and Effectiveness Data page 18

Panel Specimen
Type' n Mean Cone. (Log IU/mL)
Within-Run Component
SDb
Between-Run/Day
Component Sob
Between-Lot/Instrument Component SD b
Total SDbC
I P 45 1.41 0.19 0.00 0.08 0.21
2 S 45 2.32 0.07 0.04 0.07 0.11
3 S 45 3.48 0.06 0.05 0.08 0.11
4 P 45 4.38 0.06 0.06 0.08 0.12
5 S 45 5.47 0.09 0.00 0.10 0.13
6 P 45 6.38 0.06 0.07 0.11 0.15
7 S 45 7.54 0.05 0.08 0.14 0.17
8 P 45 8.44 0.04 0.05 0.13 0.14
P = Plasma; S= Serum b Standard deviations (SD) are in log 1U/mL.
Total precision includes within-run, between-run and between-lot components of precision
The between-lot Component of precision was less or equal to 0.14 log IU/mL.
Within-Laboratory Precision (Operator-to-Operator)
The within-run, between-run, and between-technician (operator) precision of the Abbott RealTime HBV assay was evaluated by testing 84 replicates of each HBV panel member that span the dynamic range of the assay from approximately 1.0 log IU/mL to approximately 9.00 log IU/mL, for HBV Genotypes A and C. Panel members I through 5 were HBV Genotype A, and panel members 6 through 10 were HBV Genotype C. The 0.5 mL sample preparation protocol was used for this study. This same panel was also used as a part of the site-to-site reproducibility study. One lot of amplification reagents was run on one m2000sp and m2000rt instrument pair by three technicians. Each technician completed one run per day for seven days, for a total of 21 runs. Four replicates were run for each panel member. The SD for the between-technician component and the total SD for the Abbott RealTime HBV assay were found to be less than or equal to 0.06 log 1U/mL and 0.11 log IU/mL, respectively, for all panel members greater than the assay limit of detection (1.00 log IU/mL). The between-technician precision component was lower than the within-run component for all panel members. The results are summarized in the table below.
PMA P080026: FDA Summary of Safety and Effectiveness Data page 19
L.4

Abbott RealTime HBV Within-Laboratory Precision (Operator-to-Operator):
Panel Member ni
Mean Concentration
(log IU/mL)
Within-Run Component
Sia
Between-Run/Day
Component SDt
Between-Technician Component
Sia Total SD"'
1 84 8.87 0.06 0.03 0.05 0.08
2 84 6.77 0.05 0.03 0.01 0.06
3 84 4.53 0.10 0.00 0.05 0.11
4 84 2.72 0.06 0.02 0.02 0.07
5 73"' ~~0.49 0.24 0.00 0.07 0.25
6 84 8.57 0.08 0.02 0.06 0.10
7 84 6.72 0.07 0.00 0.04 0.08
8 84 4.66 0.09 0.03 0.04 0.10
9 83' 2.69 0.07 0.03 0.05 0.09
10 84 0.78 0.19 0.00 0.04 0.19
a'Standard Deviations (SD) are in log ltJ/rnL biTarget not detected for 10 samples
Error code 4457 "Internal Control Failed" for one sample "Total precision includes within-mun, between-mun and between-technician components of precision
Reproducibility in Plasma
The plasma reproducibility panel was tested at three different sites by one technologist and one instrument pair at each site. Panels tested at each site consisted of a 40-member panel (10 unique panel members) that included five concentration levels of one prevalent HBV genotype and five concentration levels of a second prevalent IIBV genotype, repeated four ,times within the panel. The concentration levels targeted for the reproducibility panels spanned the linear quantitation range of the assay. The HBV genotypes selected for the reproducibility panels were genotype A and genotype C, recognized as prevalent in the US population. Each 5-member panel was prepared from a high copy source sample, which was comprised of at least two individual patient specimens that had a common genotype. A total of three reagent lots were used. For the 0.5 mL reproducibility, each of the three clinical sites tested two of the three lots for five days each. Site.1 used lots A and B, Site 2 used lots B and C, and Site 3 used lots A and C. The 0.2 mL. reproducibility was tested at each of the three clinical sites using two lots for two days each. The SD for the between-site component was less than or equal to 0.10O log IU/mL. The results are summarized in tables below.
Abbott RealTime HBV Reproducibility in Plasma - 0.5 mL Sample Preparation Protocol:
Panel Genotype n
Mean Concen tration (Log
Mean Concentration
(IU/mL)
Within-Run Component
SD'
Between-Run
Component SD'
Between-Lot
Component SW
Between-Site
Component SDc
Toa S~
PMA P080026: FDA Summary of Safety and Effectiveness Data page 20
L24

RJ/mL)
I A 120 8.93 872,502,276 0.07 0.00 0.03 0.08 0.11
2 A I 19' 6.84 7,087,010 0.04 0.03 0.06 0.05 0.09
3 A 120 4.70 52,574 0.09 0.02 0.06 0.10 0.15
4 A 120 2.81 665 0.05 0.02 0.06 0.08 0.12
5 A 1 10b 0.90e 27 0.31 0.07 0.26 0.10 0.42
6 C Il9- 8,64 446,037,175 0.07 0.01 0.04 0.07 0.11
7 C 120 6.83 6,922,148 0.06 0.01 0.06005 .1
8- C 119 4.84 72,954 0.08 0.00 0.08 0.09 0.15
9 C 10 2.84 722 0.06 0.02 0.090.8 .1
1 0 C 1 19b 1.13 26 10.2 .002.0 03
aInvalid replicate not included. bTarget not detected not included. cStandard deviations (SD) are in log FU/mL. dThe total precision includes within-run, between-run, between-lot, and between-site components of precision. 'Concentration is below the assay LoD.
Abbott RealTime HBV Reproducibility in Plasma (0.2 mL Sample Preparation Protocol):
1
1 _ _ _ _ _ _ _ _ _ _
Panel Genotype n
Mean Concen tration (Log
IU/mL)
Mean Concentration
(10/mL
Within-Run
Component t SD'
Between-Run
Componen t SD b
Between-Lot Component
SD'
BetweenSite
Componen t SDb
Total SDbxc
I A 48 8.99 1,019,710,342
0.07 0.00 0.13 0.00 0.15
2 A 148 6.87 7,526,185 0.04 0.05 0.09 0.00 10.12
3 A 48 4.70 52,678 0.06 0.08 0.14 0.00 0.17
4 A 48 2.83 716 .0.06 0.06 0.13 0.00 0.16
5 A 37' 1.0 3d 21 0O40 0.00 0.18 0.02 0A44
6 C 48 8.64 451,101,262 0.05 0.05 0.12 0.00 0.14
7 C 48 6.85 7,255,246 0.05 0.05 0.11 0.00 0.13
8 C 481 4.83 71,717 0.08 0.07 0.14 0.00 0.18
9 C 481 2.84 738 0.08 0.0 0.15 0.00 0.1
10 C 46- 1.24 26 0.30 0.00 0.27 0.00 04 Target not detected not included. bStandard deviations (SD) are in log IU/mL. oThe total precision includes within-run, between-run, between-lot, and between-site components of precision. *1Concentration is below the assay LoD.
Reproducibility in Serum
The serum reproducibility panel tested at each site consisted of a 42-member panel (14 unique panel members) that included seven concentration levels of one prevalent HBV genotype and seven concentration levels of a second prevalent HBV genotype, repeated three times within the panel. The concentration levels targeted for the reproducibility panels spanned the linear
PMA P080026: FDA Summary of Safety and Effectiveness Data page 21

quantitation range of the assay and also included some members below the lower limit of quantitation. The HBV genotypes selected for the serum reproducibility panels were genotypes that were recognized as prevalent in the US population. Each seven-member panel was prepared from a high copy source sample. A total of three reagent lots were used. Each of the three clinical sites tested two of the three amplification reagent lots for five days each. Site 1used lots A and B, Site 2 used lots B and C, and Site 3 used lots A and C. Each site conducted the five day reproducibility at both the 0.2 mL volume and 0.5 mL volume for two lots of amplification reagents. The results are summarized in tables below.
Abbott Reproducibility in Serum (0.5 mL Sample Preparation Protocol):
Panel Genotype n
Mean Concen tration (Log
IU/mL)
Mean Concentration
(IU/mL)
Within-Run Component
SDW
Between-Run
Component cSD
Between-Lot
Component cSD
BetweenSite
Component SDc
Total SD'd
I A 898 8.24 184,508,108 0.13 0.07 0.07 0.06 0.17
2 A 90 6.19 1,613,319 0.04 0.07 0.07 0.03 0.11
3 A 90 3.94 9,725 0.07 0.08 0.11 0.19 024
4 A 89' 1.96 105 0.12 0.07 0.07 0.20 0.25
5 A 90 1.25 22 0.20 0.10 0.12 0.20 0.32
6 A 886 1.04 13 0.17 0.10 0.08 0.18 0.28
7 A 84b 0.740 7' 0.22 0.12 0.21 0.12 0.35
8 C 90 7.22 17,211,265 0.05 0.05 0.08 0.05 0.12
9 C 90 6.23 1,741,264 0.05 0.06 0.08 0.02 0.12
to C 89' 3.89 9,068 0.11 0.07 0.10 0.21 0.27
11 C 89' 1.64 55 0.18 0.12 0.06 0.28 0.36
12 C 90 1.29 23 0.18 0.09 0.12 0.15 0.27
13 C 886 0.95c 12' 0.24 0.08 0.15 0.24 0.38
14 C 87b 0.88' 9c 0.23 0.06 0.10 0.10 0.28 Invalid replicate not included. Target not detected not included. Standard deviations (SD) are inlog IU/mL.
dThe total precision includes within-run, between-run, between-lot, and between-site components of precision. · Concentration isbelow the assay LoD.
Abbott RealTime V Reroducibility in Serum (0.2 mL Sampl Preparation Protocol):
Panel Genotype n
Mean Concen tration (Log
IU/mL)
Mean Concentration
(IU/mL)
Within-Run Component
SD'
Between-Run
Component SD'
Between-Lot
Component SD'
Between-Site
Component SD' Total
cSD" I A 90 8.28 205,545,691 0.16 0.04 0.03 0.00 0.17
PMA P080026: FDA Summary of Safety and Effectiveness Data page 22
26

2 A 882 6.21 1,638,140 0.04 0.04 0.03 0.00 0.06
3 A 89 a 3.89 8,306 0.10 0.07 0.07 0.13 0.19
4 A 892 1.90 95 0.22 0.04 0.16 0.16 0.32
5 A 88 1.10e 16e 0.21 0.12 0.07 0.18 0.31
6 A 86 kb 0.89e 10~ 0.27 0.03 0.10 0.10 0.31
7 A 82ob 0.62e 7C 0.33 0.00 0.06 0.16 0.37
8 C 90 7.22 16,648,045 0.05 0.02 0.04 0.00 0.07
9 C 90 6.25 1,776,403 0.04 0.04 0.04 0.00 0.07
10 C 90 3.84 7,550 0.12 0.07 0.07 0.13 0.20
11 C 90 1.57 48 0.18 0.10 0.02 0.31 0.37
12 C 1.14c 17C 0.22 0.10 0.11 0.12 0.29
13 C 87lb 0.80C 8~ 0.26 0.13 0.15 0.08 0.34
14 C 82 0.73 9" 0.35 0.06 0.17 0.00 0.39
Invalid replicate not included. bTarget not detected not included. cStandard deviations (SD) are in log IU/mL. dThe total precision includes within-run, between-run, between-lot, and between-site components of precision.
Concentration is below the assay LoD.
Analytical Specificity
PotentiallyInterferingSubstances
The susceptibility of the Abbott RealTime HBV assay to interference by elevated levels of potentially interfering substances was evaluated. HBV-negative samples and HBV-positive samples containing 2,933 IU/mL (3.47 log IU/mL) of HBV DNA were tested. Potential interference at HBV DNA concentrations close to the assay LLoQ was not assessed. HBV-negative and positive samples were tested in a plasma matrix and were not tested in serum.
No interference in the performance of the Abbott RealTime HBV assay was observed in the presence of high levels of hemoglobin (500 mg/dL), triglycerides (3,000 mg/dL), bilirubin (20 mg/dL), and protein (9 g/dL). For hemoglobin and protein, there was a slight trend towards lowering of the values of the high level HBV specimens in the presence of interfering substances. The mean differences of the test and control conditions for hemoglobin and protein are small (-0.058 and -0.112 log IU/mL, respectively) compared to the clinically significant difference between two samples (1 log); as such, these values are not expected to be clinically significant.
Antivirals and antibiotics at concentrations equal to or in excess of peak plasma or serum levels were tested in five pools. No interference in the performance of the Abbott RealTime HBV assay was observed in the presence of the following drug pools for all HBV-positive and negative samples tested:
PMA P080026: FDA Summary of Safety and Effectiveness Data page 23
27

Drug Pool Drugs Tested
1 Zidovudine, Saquinavir, Ritonavir, Clarithromycin, Interferon 2a, Interferon 2b, Didanosine
2 Abacavir sulfate, Amprenavir, Peginterferon 2a, Peginterferon 2b, Ribavirin,Entecavir, Adefovir
Tenofovir, Lamivudine, Indinavir, Ganciclovir, Valganciclovir, Acyclovir, Paroxetine
Stavudine, Efavirenz, Lopinavir, Enfuvirtide, Ciprofloxacin, Fluoxetine
Zalcitabine, Nevirapine, Nelfinavir, Azithromycin, Valacyclovir, Sertraline
A consideration was made to avoid combining specific drugs within a pool that would not be used together in a clinical setting. However, because the listed drugs were tested only as pools, individual drug effects were not assessed.
Cross-reactivity studies with clinical specimens
The specificity of the assay was evaluated by testing 60 clinical specimens that were positive for at least one of the following DNA virus markers, RNA viruses, non-viral hepatitis, or autoimmune disease states (summarized in table below). Clinical specimens that were tested for DNA virus markers were serum. Clinical specimens that were tested for RNA virus markers were plasma or serum. HBV DNA was not detected in any of the 60 specimens tested.
DNA and RNA Viruses Non-viral Hepatitis and Autoimmune States Epstein Barr Virus (EBV) Anti-nuclear Antibody (ANA) Herpes Simplex Virus I (HSV-1) Rheumatoid Factor (RF) Herpes Simplex Virus 2 (HSV-2) Cirrhosis Cytomegalovirus (CMV) Alcoholic Hepatitis
Human Immunodeficiency Virus (HIV-I)
Non-alcoholic Steatohepatitis (NASH)
Hepatitis C Virus (HCV) Autoimmune Hepatitis (AUH) Hepatitis A Virus (HAV) Hepatocellular Carcinoma
Performance of the assay with HB V-Negative Specimens
Performance of the Abbott RealTime HBV assay was evaluated by testing 124 HBV seronegative serum and 125 HBV seronegative plasma specimens from blood donors. The specimens were tested on one m2000 instrument system with one lot of amplification reagents. HBV DNA was not detected for all 249 specimens, resulting in 100% correct
28 PMA P080026: FDA Summary of Safety and Effectiveness Data page 24

results: 100% (124/124) with 95% CI: 97.0% to 100% for serum samples and 100% (125/125) with 95% CI: 97.0% to 100% for plasma samples.
Cross-Reactivitystudies using nucleic acid or virallysate
The viruses and microorganisms in the table below were evaluated for potential cross-reactivity in the Abbott RealTime HBV assay. Purified nucleic acid or viral lysate from each microorganism or virus was added at a concentration of 100,000 copies/mL to HBV DNA negative samples and HBV DNA positive samples that contained 2,933 IU/mL HBV DNA (3.47 log IU/mL). No interference in the Abbott RealTime HBV assay was observed in the presence of nucleic acids from potentially cross-reactant microorganisms or viruses for all the HBV-positive and negative samples tested.
Microorganism/Virus Source Human immunodeficiency virus I (HIV-1) Viral lysate, cell culture Human immunodeficiency virus 2 (HIV-2) Viral lysate, cell culture Human T-lymphotropic virus I (HTLV-I) Viral lysate, cell culture Hepatitis C virus (HCV) Viral lysate, human
specimen Hepatitis A virus (HAV) Purified nucleic acid Epstein-Barr virus (EBV) Purified nucleic acid Herpes simplex virus 1(HSV-1) Purified nucleic acid Herpes simplex virus 2 (HSV-2) Purified nucleic acid Cytomegalovirus (CMV) Purified nucleic acid Human herpesvirus 6B (HHV-6B) Purified nucleic acid Human herpesvirus 8 (HHV-8) Purified nucleic acid Varicella-zoster virus (VZV) Purified nucleic acid Vaccinia virus (VACV) Purified nucleic acid BK human polyomavirus Purified nucleic acid Human papilloma virus 16 (HPV-16) Purified nucleic acid Human papilloma virus 18 (HPV- 18) Purified nucleic acid Neisseriagonorrhoeae Purified nucleic acid Chlamydia trachomatis Purified nucleic acid Candida albicans Purified nucleic acid Staphylococcus aureus Purified nucleic acid Staphylococcus epidermidis Purified nucleic acid Mycobacteriumgoidonae Purified nucleic acid Mycobacterium smegmatis Purified nucleic acid
Analytical Carryover
Potential carryover was determined by performing three studies in which high copy HBV-positive samples were interspersed with negative samples in a checkerboard pattern. For these studies, the targeted level for the high copy HBV-positive samples was greater than 8 log IU/ml. The carryover rate is defined as the number of HBV-negative samples that have a
29 PMA P080026: FDA Summary of Safety and Effectiveness Data page 25

concentration reported greater than assay LoD over the total number of HBV-negative samples tested. The carryover rate in these representative studies ranged from 0% to 2% with an overall rate of 0.63% (95% CI 0.08%-2.24%). Results from the three studies are summarized in the table below.
Study Number of
Runs
Number of Negatives
Tested Number Detected
Number Detected (> LoD)
Percent Detected (> LoD)
95% CI of Percent Detected
I 5 100 I 0 0.00 (0.00, 3.62)
2 5 too 2 2 2.00 (0.24, 7.04)
3 6 120 2 0 0.00 (0.00, 3.03)
Overall 16 320 5 2 0.63 (0.08, 2.24)
Comparison of 0.2 mL vs. 0.5 mL Sample Preparation Protocols
This study used the Abbott RealTime HBV assay to quantitate HBV-positive patient Specimens. Sixty HBV-positive EDTA plasma specimens were tested in duplicate with both the 0.2 mL and 0.5 mL sample preparation protocols. Each duplicate pair was tested in the same run. The study was designed to cover the dynamic range of the Abbott RealTime HBV assay With actual patient samples representing genotypes (A, B, C, D) commonly encountered within the US. The data showed a slope of 0.99 and an intercept of 0.09. The results are summarized in the figure below.
30 PMA P080026: FDA Summary of Safety and Effectiveness Data page 26

Abbott RealTime HBV Correlation of 0.2 mL vs. 0.5 mL Sample Preparation Protocols
Least Squares Linear Regression
79
7
16
9. +
4+
2
1 2 3 4 6 6 7 8 9
03imL Mean . (kog IU/Ln)
Sample Size (n). OD Correlation Coefficient (r) 0.999
slope 0.99 950CI for sope i0..qe 1.00) Intercept 0.09 95% CI for Intercept (0.03, 0.14) 0.5 mL mean con. (log In/mL) Min 1.4iax 8.75 0.2 mL Mdean conc. (log IU/mL) Miii L1 Max~ 8.71
The observed lowest value in the specimen population for the 0.2 mL sample volume was 1:33 log IU/mL (mean value of the duplicate pair was 1i51 log IU/mL). For the 0.5 mL sample volume, the same specimen had an observed lowest value of 1.40 log IU/mL (mean value of duplicate pair was 1.46 log IU/mL).
31 PMA P080026: FDA Summary of Safety and Effectiveness Data page 27

Sample Handlingand Collection
The assay is for use with serum or EDTA plasma specimens only.
Serum vs. PlasmaAcross the LinearRange
Specimens from 30 individual HBV serologically-negative donors were tested. The specimens from each donor were collected as matched sets in serum and in EDTA- plasma tubes. Each pair of serum and plasma specimens was spiked with HBV-positive material at two targeted concentration levels throughout the dynamic range of the Abbott RealTime HBV assay. Specimen types at each targeted concentration were tested once using the 0.5 mL sample preparation protocol. Two plasma-serum pairs had quantitation values below the assay dynamic range and were excluded from the analysis.
Using a sample size of 58, linear regression analysis demonstrated a slope of 1.00 (95% CI 0.98 to 1.01) and an intercept of 0.03 (95% C1 -0.04 to 0.10). The mean difference between serum and plasma specimens was -0.02 log 1U/mL (95% C1-0.05 to 0.01). The results are summarized in the figure below.
52
PMA P080026: FDA Summary of Safety and Effectiveness Data page 28

Abbott RealTime HBV Specimen Type - Sertun vs. Plasma Least Squares Linear Regression
a
+
6
J4
4
1
1 2 a 4 6 6 7 a
Sample Size- Qi) Corelaion Coeffidet&) O(5
Slope · L0 96%ci rSope (o~ I) Intel"pt o03 95% CI for Interept (-0.04, 0.10)
1.2 Max 7.9 PWama (og IUhnL) min Serum (log lUML) Me 12 M 7.89
Recommended storage stability
The stability study data supports 18 month dating for the Abbott RealTime HBV Amplification Reagent Kits. The stability study data supports 18 month dating for the Abbott RealTime HBV Control and Calibrator Kit components and the Internal Control from the Amplification Reagent Kit.
Recommended sample stability
337 PMA P080026: FDA Summary of Safety and Effectiveness Data page 29

Human serum or plasma specimens may be stored at 15 to 300 C for up to 24 hours or at 2 to Soc for up to three days. Freshly drawn whole blood (plasma or serum) specimens may be held for up to 6 hours at 2 to 30 0C prior to centrifuigation. Freeze/thaw effect was tested in both serum and plasma for up to eight cycles. Frozen specimens may be thawed at 15 to 300C or 2 to 80C. Thawed specimens may be stored at 2 to 80C for up to 6 hours, if not processed immediately. Serum and plasma specimens may be stored at -200 C or colder for longer term storage. Stability testing results are sumnmarized in the table below.
Specimen Stability (Log IU/mL)
Sample Type Test Condition Test
Condition Mean CoBaseline
ndition Mean DMean
ifference
Plasma 24-26h at 28-320C 3.781 3.722 0.059
72-74h at 2-80C 3.777 3.722 0.055
Serum 24-26h at 28-32 0C 3.871 3.844 0.027
72-74h at 2-80C 3.870 3.844 0.026
Plasma (Whole
Blood)
6-8h at 28-32 0C 3.863 3.866 -0.003
~~6-8h at 2-8 0C 3..862 3.866 -0.004
Serum (Whole Blood)
6-8hat 28-32 0C 3.823 3.628, 0.195
06-8h at 2-8 C 3.730 3.628 0.102
Plasma Freeze/Thaw
8 freeze/thaw cycles(frozen at -200 C or
colder for a minimum of
8 hours; ~~thawed at 150C to 300 C ~~for a maximum of 24
hours)
2.704 2.693 0.011
Serum Serum
Freeze/Thaw 2.722 2.714 0.007
X. SUMMARY OF PRIMARY CLINICAL STUDIES
A summary of the clinical study is presented below.
B. Study Population and Baseline Parameters
The clinical performance of the Abbott RealTime HBV Assay for use with the m2000 System was evaluated by assessing the antiviral therapy response in chronic HBV-infected subjects undergoing treatment with adefovir dipivoxil. The HBV DNA data were obtained from testing patient samples previously collected under two study protocols, one of which evaluated patients with chronic HBeAg-positive HBV
PMA P080026: FDA Summary of Safety and Effectiveness Data page 30
_ _ _ _ _ _ _ _ _ _ _ _ _ _ _ _ _
_ _ _ _ _ _ _ _ _ _ _ _ _ _ _ _ _ _ _ _ _ _ _ _ _

infection and compensated liver function9 and one that evaluated patients with HBeAg-negative HBV infection with compensated liver function.' 0 The relationship between HBV DNA viral levels at various time points to histologic, biochemical, and serological responses to treatment was determined in this study. The study population consisted of chronic HBV-infected subjects enrolled in double-blind, randomized, placebo-controlled studies of adefovir dipivoxil that spanned 240 weeks. In the HBeAg-positive protocol, patients were randomized to 10 mg adefovir dipivoxil, 30 mg adefovir dipivoxil, or placebo for the first 48 weeks. Only the 10mg adefovir dipivoxil treated patients (169) and placebo patients (60) were included in this study. Viral load testing was performed at baseline and at weeks 12, 24, and 48. The viral load results were evaluated against histologic, biochemical, and serological response at 48 weeks. In addition, patients that remained on the 10 mg adefovir dipivoxil treatment were also tested at weeks 144, 192, 240, as available. In the HBeAg-negative protocol, patients were randomized to either. 10 mg adefovir dipivoxil or placebo for the first 48 weeks. The adefovir dipivoxil treated patients (123) and placebo patients (61) were tested at baseline and at weeks 12, 24, and 48. The viral load results were evaluated against histologic and biochemical response at 48 weeks. In addition, patients that remained on the 10 mg adefovir dipivoxil treatment were also tested at weeks 96, 144, 192, and 240, as available. Demographic data, HBV genotype, HBeAg, anti-HBe, and HBsAg seroconversion results, and baseline (pretreatment) and post-treatment liver biopsy results were available. The table below summarizes the, subject demographics.
Subject Demographics Characteristic
Category Summary Statistics
H~eAg+ HBeAg- Total
Total Number of Subjects n 229 184 413
Placebo n(%) 60' (26.20) 61 (33.15) 121
10 mg adefovir dipivoxil
n (%) 169' (73.80) 123 (66.85) 292
Total Number of Subjects with Demographic Information
n 220 184 404
Median 34 46 40 (Min, Max) (16, 65) (18, 65) (16, 65)
Weight (kg) Median 71 74.55 72.5 (Min, Max) (43, 117.73) (46, 135) (43, 135)
Sex Male n (%) 164 (74.55) 152 (82.61) 316 (78.22)
Female n (%) 56 (25.45) 32 (17.39) 88 (21.78)
Race
White n (%) 80 (36.36) 122 (66.30) 202 (50.00)
Asian n (%) 129 (58.64) 56 (30.43) 185 (45.79)
Other n (%) 11 (5.00) 6 (3.26) 17 (4.21)
Genotype A n (%) 64 (29.09) 11 (5.98) 75 (18.56)
B n(%) 41 (18.64) 31 (16.85) 72 (17.82)
page 31
35 PMA P080026: FDA Summary of Safety and Effectiveness Data
_ _ _ _ _ _ _

C n (%) 82 (37.27) 24 (13.04) 106 (26.24)
D n (%) 27 (12.27) 114 (61.96) 141 (34.90)
Other n (%) 6 (2.73) 4 (2.17) 10 (2.48)
Knodell Score n 210 175 385
Total Mean (SD) 9.38 (3.29) 9.35 (3.34) 9.37 (3.31)
Necroinflammatory Mean (SD) 7.70 (2.71) 7.50 (2.75) 7.61 (2.73)
Fibrosis Mean (SD) 1.67 (1.09) 1.86 (1.15) 1.76 (1.12)
'Clinical response data was not provided for three placebo and six treatment subjects
The HBeAg-positive subjects were primarily Asian and HBV Genotypes A and C, while the HBeAg-negative subjects were primarily White and HBV Genotype D. Patients included in the clinical performance analysis received either the standard 10 mg adefovir dipivoxil dosing or placebo.
The table below summarizes available subjects by treatment arm.
Summary of Available Subjects by Treatment Arm
Population
Number of Subjects -
Placebo
Number of Subjects
-10 mg Adefovir
No. of Specimens
per Subject'
Total No. of Specimens
Tested
Chronic HBeAg+ 60 169 2 to 7 1,036
Chronic HBeAg- 61 123 2 to 8 939
Total subjects tested 121 292 2 to 8 1,975
'This number is reported as a range because the number of specimens varied for each subject.
Within-Subject Variability in Absence of Treatment
The objective of this analysis was to assess the change in viral load (in log IU/mL units) between two successive measurements of placebo patients. There were 55 patients in the placebo arm of the HBeAg-positive group and 57 patients in the HBeAg-negative group that had available results for both Weeks 0 and 12. These results were used to estimate within-subject variability, which includes biological variability as well as total assay variability. The within-subject variability (SD) based on these results was estimated to be 0.79 log IU/mL for HBeAg-positive patients and 0.86 log IU/mL for HBeAg-negative patients. Biological variability was similar to the within-subject variability since the assay variability was negligible. The median change (Week 12 - Week 0) of viral load within a subject was estimated to be 0.00 log IU/mL for HBeAg-positive patients and -0.28 log IU/mL for HBeAg-negative patients. Approximately 89% of the HBeAgpositive patient's and 81% of HBeAg-negative patient's change of viral load was less than 2.0 log IU/mL.
C. Safety and Effectiveness Results
PMA P080026: FDA Summary of Safety and Effectiveness Data page 32
7, .,

Clinical Study Results and Statistical Analyse
Statistical analysis of clinical data was used to assess whether viral response to treatment measured with Abbott RealTime HBV Assay for use with the in2000 System is infdrmative for assessing the response to treatment in HBeAg+ and HBeAg- patients with chronic hepatitis B. Observing changes in viral load in individual patients over time may help the clinician in the assessment of a patient's response to therapy.
HBeAg-Positive Patients
The table and figure below illustrate the efficacy of treating HBeAg-positive patients with 10mg adefovir dipivoxil compared to placebo, based on HBV viral load testing results using Abbott RealTime HBV Assay for use with the m2000 System. At Week 48, 22.92% (33/144) of HBeAg-positive patients on treatment vs. 0% (0/55) on placebo had achieved very low viral loads below 100 IUJ/mL. In addition, only 23.6 1%(34/144) of patients on treatment vs. 81.82% (45/55) on placebo had viral loads greater than or equal to 106 IU/mL.
Distribution of HBV Viral Load at Week 48 for HBe gPositive Patients:
Viral Load
(HJ/mL)
Adefovir Dipivoxil Placebo
n % Cumulative % n % Cumulative %
TNDa 4 2.78 2.78 0 0.0 0.0
< 15 13 9.03 11.81 0 0.0 0.0
15-< 100 16 11.11 22.92 0 0.0 0.0
100-< IO, 21 14.58 37.50 2 3.64 3.64
io0-_< 104 18 12.50 50.00 I 1.82 5.46
104 -_< io5 14 9.72 59.72 4 7.27 12.73
10 106 24 16.67 76.39 3 5.45 18.18
i106 _io10 32 22.22 98.61 43 78.18 96.36
Ž IO, 2 1.39 100.00 2 3.64 100.00
Total 144 100.00 55 100.00
'Target not detected.
The figure below demonstrates the median Viral load change and inter-cjuartile range of change from baseline for HBeAg-positive subjects on treatment compared to placebo. This shows the impact of treatment with adefovir dipivoxil on the viral load of the 1HBeAg-positive patients with chronic hepatitis B.
Median and inter-quartile range of change ini HBV DNA from baseline (HBeAg-positive subjects):
PMA P080026: FDA Summary of Safety and Effectiveness Data page 33
27 7

5
4
3
2
El i-
E .1
z0 -2
3i
;C . 4 co-
C~ -6
.? -7
-e o 12 24 48
Study iimepoint (Week)
---- Patients on Placebo -- Patients on Treatment
The goal of therapy for patients with chronic HBV infection is to reduce the HBV DNA to low or undetectable levels, and monitor for viral rebound that could be associated with resistance. Results in the table below show that 70.41% (119/169) of the treated subjects achieved a nadir, or lowest concentration, viral load level by Week 48. Of the 49 subjects that achieved a nadir by Week 24, 13.79% (4/29) subjects had a greater than or equal to one log IU/mL increase by Week 48 (20 of these subjects did not have a Week 48 result).
Distribution of the HBeAg-positive subjects by week on treatment and the viral load at which the nadir was reached:
Nadir Viral Load
(IU/mL)
Number (%) of Patients With the Nadir Viral Load Achieved By Week
Total By
Viral Load
Cumulative By Viral
Load
12 24 48 144 192 240
TND a 0 0 4 I 1 4 10 10 (0.00) (0.00) (2.37) (0.59) (0.59) (2.37) (5.92) (5.92)
<15 0 1 13 1 6 I 22 32 (0.00) (0.59) (7.69) (0.59) (3.55) (0.59) (13.02) (18.94)
15 -<10 0 0 12 3 4 2 21 53 (0.00) (0.00) (7.10) (1.78) (2.37) (1.18) (12.43) (31.37)
100-< 103 1 3 15 0 1 7 27 80 (0.59) (1.78) (8.88) (0.00)(0.59) (4.14) (15.98) (47.35)
PMA P080026: FDA Summary of Safety and Effectiveness Data page 34
38

Io,-< Io, 3 8 5 It t 2 20 100 (1.78) (4.73) (2.96) (0.59) (0.59) (1.18) (11.83) (59.18)
Io,-< IO, 3 5 7 3 I 2 21 121 (1.78) (2.96) (4.14) (1.78) (0.59) (1.18) (12.43) (71.61)
105_< 106 3 5 8 1 3 2 22 143 (1.78) (2.96) (4.73) (0.59) (1.78) (1.18) (13.02) (84.63)
106_ < 10 9 8 9 6 1 0 2 26 169 (4.73) (5.33) (3.55) (0.59) (0.00) (1.18) (15.38) (100.00)
Total by Week
18 31 70 11 17 22 (10.65) (18.34) (41.42) (6.51) (10:06) (13.02)
Cumulative By Week
18 49 119 130 147 169 (10.65) (28.99) (70.41) (76.92) (86.98) (100.00)
aTarget Not Detected
Two patients out of 169 achieved HBsAg seroconversion. One patient had results showing HBsAg serconversion at both Weeks 192 and 240. The other patient achieved
seroconversion at Week 240. These two patients were white males, HBV genotype A,
and > 30 years of age. A summary of these results is provided in the table below.
HBeAg-Positive Subjects with HBsAg Seroconversion:
Concentration (Log IU/mL)
Week 0 Week 12 Week 24 Week 48 Week 144 Week 192 Week 240
Subject I 6.99 4.98 2.08 1.50 TND* TND* TND*
Subject 2 8.59 6.57 6.85 6.72 5.68 1.45 **
* TND = Target Not Detected The Abboh RealTime HBV result for the Week 240 time point was excluded due to technician error.
Summaries of the effect of baseline covariates for the HBeAg-negative population are
provided in the three tables that follow.
Association between responses to treatment at week 48 and baseline covariates for HBeAg-positive patients association:
TReatmsento Treatment
Covariate Category n No. of Patients
with Response
Proportion (%) of Patients with
Response
Unadjusted Odds Ratio(95%C1)
Histological Race
Asian 75 47 62.67 1.44 (0.66, 3.14)
Other 52 28 53.85
Sex Male 97 58 59.79
1.14 (0.45, 2.8 !) Female 30 17 56.67
Age <30 52 34 65.38
1.57 (0.71, 3.49) > 30 75 41 54.67
Genotype B,C 72 47 65.28 1.81 (0.83, 3.95)
~39
.
PMA P080026: FDA Summary of Safety and Effectiveness Data page 35
Repne95Ct

Non-B,C 55 28 50.91
Biochemical
Race Asian 82 47 57.32
1.77 (0.82, 3.82) Other 51 22 43.14
Sex Male 102 53 51.96
1.01 (0.42, 2.45) Female 31 16 51.61
Age <_30 56 33 58.93
1.63 (0.77, 3.48) > 30 77 36 46.75
Genotype B,C 79 45 56.96
1.65 (0.78, 3.53) Non-B,C 54 24 44.44
Responseto Treatment
Covariate Category No. of Patients No.ofPaen with Response
Proportion (%) of Patients with
Response (95%
Unadjusted Odds Ratio
CI)
HBeAg Loss
Race Asian 84 21 25.00
0.89 (0.38, 2.09) Other 55 15 27.27
Sex Male 105 26 24.76
0.79 (0.31, 2.11) Female 34 10 29.41
Age <30 59 13 22.03
0.70 (0.29, 1.63) > 30 80 23 28.75
Genotype B,C 80 19 23.75
0.77 (0.34, 1.78) Non-B,C 59 17 28.81
HBeAg Sero-
conversion
Race Asian 84 8 9.52
0.47 (0.15, 1.45) Other 55 10 18.18
Sex Male 105 14 13.33
1.15 (0.33, 5.18) Female 34 4 11.76
Age <30 59 7 11.86
0.84 (0.26, 2.58) > 30 80 I 1 13.75
Genotype B,C 80 6 7.50
0.32 (0.09, 1.00) Non-BC 59 12 20.34
The statistical significance of the associations of the Race, Sex, Age and Genotype covariates with viral response was studied and the results are summarized in the two tables below. All lower limits of the 95% confidence intervals in these two tables are smaller than 1,except for Race and Genotype at Weeks 12 and 24 (when response is defined as <2000 IU/mL). This is in agreement with logistic regression analyses resulting in no statistically significant associations between the four covariates and viral load. All lower limits of the 95% confidence intervals in Table 25 are smaller than 1
PMA P080026: FDA Summary of Safety and Effectiveness Data page 36
40

(when viral response is defined as > 2 log decrease). When response is defined as > 2
log decrease, logistic regression analyses resulted in only gender at Week 12 showing a borderline statistically significant association (p = 0.043) with viral load. Generally, the virological responses at Weeks 12, 24 and 48 do not appear to be correlated with Race, Sex, Age and HBV Genotype.
Odds ratios for the association between viral response (<2000 IU/mL) and covariates,
by week, for an H ~eAg-positive opation:
No. BelowUndutdOs 2000 IU/mL
Proportion (%)Below 2000
IU/mL
Unadjusted Odds Ratio (95% CI)
Race
Asian 12
87 21 24.14 2.92 (1.04, 9.41)
Other 61 6 9.84
Asian 24
81 30 37.04 3.20 (1.30, 8.42)
Other 58 9 15.52
Asian 48
79 34 43.04 1.56 (0.71, 3.47)
Other 52 17 32.69
Sex
Male 12
112 20 17.86 0.90 (0.32, 2.78)
Female 36 7 19.44
Male 24
104 27 25.96 0.67 (0.28, 1.70)
Female 35 12 34.29
Male 48
100 37 37.00 0.71 (0.29, 1.76)
Female 31 14 45.16
Age
<30 12
63 10 15.87 0.75 (0.28, 1.92)
> 30 85 17 20.00
<30 24
61 18 29.51 1.14 (0.50, 2.55)
> 30 78 21 26.92
5<30 48
55 21 38.18 0.95 (0.44, 2.05)
> 30 76 30 39.47
Genotype
B~C 12
81 20 24.69 2.81 (1.04, 8.41)
Non-B,C 67 7 10.45
B,C 24
76 29 38.16 3.27 (1.36, 8.29)
Non-B,C 63 10 15.87
B,C 48
74 32 43.24 32i.52 (0.70, 3.34)
Non-B,C 57 19 33.33
Odds ratios for the association between viral response (> 2 log decrease from baseline
result) and covariates, by week, for an HBeAg-positive population:
PMA P080026: FDA Summary of Safety and Effectiveness Data page 37
4 1

Covariate Category Week
n
No.ithŽ2 Log ih Log2
Decrease
Proportion (%) with Ž-
Log Decrease
Unadjusted OddsRatio (95% CI)
Race
Asian 12
87 54 62.07 -0.86 (0.41,1.79)
Other 6 1 40 65.57
24an 6 6.4 1.24 (0.53, 2.88) Other 58 ,42724
Asian 48
79 56 70.89 -0.81 (0.33, 1.91)
Other 52 39 75.00
Sex
Male 12 112 66 58.93 ~~~~~~~0.41 (0.15, 1.03)
Female 36 28 77.78
Male 24
104 74 71.15 -0.41 (0.11, 1.22)
Female 315 30 85.71
Male 48
100 71 71.00 0.71 (0.23, 1.96)
Female 3 1 24 77.42
Age
•30 12
63 41 65.08 -1.13 (0.54, 2.36)
> 30 85 53 62.35
• 30 24
61 44 72.13 0.78 (0.34, 1.81)
> 30 -
78 60 76.92
•30 ~~48 407.3 1.02 (0.44, 2.41)
> 30 76 55 72.37
Genotype
BC ~ 12 8 1696 0.95 (0.46, 1.96)
Non-B,C 67 43 64.18
B,C 24
76 58 76.32 1.19 (0.51,2.75)
Non-B,C 63 46 73.02
B,C 48
74 52 70.27 -0.77 (0.32, 1.80)
Non-B,C 157 43 75.44
Positive Predictive Value (PPV), Negative Predictive Value (NPV), and Odds Ratio (OR) Analysis in an ilBeAg-Positive Population
For each patient, the clinical responses - Histologic, Biochemical, HBeAg Loss, Anti-HBe Gain and Seroconversion were measured at various times on treatment. These clinical responses were defined as follows:
Histologic response - improvement of histologic status by at least 2 units of the Knodell necro-inflammnatory score withbut deterioration of the fibrosis score compared to the histologic status at baseline
PMA P080026: FDA Summary of Safety and Effectiveness Data page 38
42
~N Week Category
_____
Covariate

*
*
Biochemical response - normalization of ALT test result compared to the biochemical status at baseline HBeAg Loss - HBeAg undetectable Anti-HBe Gain - antibody against HBeAg detected Seroconversion - HBeAg undetectable and antibody against HBeAg detected
Additionally, HBsAg seroconversion data was also collected. Two patients out of 169
achieved HBsAg seroconversion. One patient had results showing HBsAg ·serconversion at both Weeks 192 and 240. The other patient achieved seroconversion at Week 240. These two patients were white males, HBV genotype A, and > 30 years of age. A summary of these results is provided in the following table:
HBeAg-Positive Subjects with HBsAg Seroconversion Concentration (Log IU/mL)
Week 0
Week 12
Week 24
Week 48
Week 144
Week 192
Week 240
Subject I 6.99 4.98 2.08 1.50 TND" TNDI TND'
Subject 2 8.59 6.57 6.85 6.72 5.68 1.45 b
a Target Not Detected bThe Abbott RealTime HBV result for the Week 240 time point was excluded due to technician error.
Viral load response was defined as either HBV DNA less than 2000 IU/mL or greater than or equal to 2 log IU/mL decrease from baseline. Statistical analysis (PPV) was performed to evaluate the association between the clinical responses at Weeks 48, 144, 192, or 240 and a viral load response at Weeks 12, 24, or 48 of treatment. Statistical analysis (NPV) was performed to evaluate whether there is an association between the clinical non-responses at Weeks 48, 144, 192, or 240 and a viral load non-response at Weeks 12, 24, or 48 of treatment.
Viral Response < 2000 IU/mL
As shown in the table below, early viral response (Weeks 12, 24, 48) is informative in predicting clinical responses at Weeks 48. The PPV is the highest for the association of viral response and the histologic and biochemical responses; while NPV is the highest for the association of viral response and the serological responses (HBeAg loss, anti-HBe gain, and seroconversion).
Viral response at Weeks 12, 24, and 48 is informative in predicting biochemical, HBeAg loss, anti-HBe gain, and seroconversion at Week 48 (i.e., the lower 95% CI limits for the odds ratio exceeding 1.0). Viral response at Week 24 is also informative in predicting histologic improvement at Week 48. Viral response at Week 24 is informative in predicting HBeAg Loss at Week 144 and viral response at Week 48 is also informative in predicting anti-HBe gain and seroconversion at Week 240 of treatment.
PMA P080026: FDA Summary of Safety and Effectiveness Data page 39
4 3

An association with, rather than prediction of, clinical responses is demonstrated when measuring the viral response at Week 48. PPV, NPV, and Odds Ratio for individual clinical responses during treatment predicted by early viral response (< 2000 IU/mL) in HBeAg-positive subjects (clinical response assessed at week 48):
Week of Viral
Response
WeekWeekWeekofofof Clinical
Response Response Clinical
PPV ()
(Proportion)
PPV(95%
CI)
NPV (%)
(Proportion)
NP 9%
CI)
OdOdds Ratio(95%
CI)
12 48
Histologic 79.2 (19/24) (57.3, 92.1) 43.3 (39/90) (33.1, 54.2)
2.91 (0.93,1.6 10.76)
Biochemical 84.0 (21/25) (63.1, 94.7) 55.3 (52/94) (44.7, 65.5) 6.50 (I.95,27.66)
HBeAg Loss 64.0 (16/25) (42.6, 81.3) 82.8 (82(99) (73.6, 89.4) 8.58 (2.94,25.54)
Anti-HBe Gain 36.0 (9/25) (18.7, 57.4) 91.9 (91/99) (84.2, 96.2) 6.40 (1.85,21.90)
Seroconversion a 36.0 (9/25) (18.7, 57.4) 91.9 (91/99) (84.2, 96.2) 6.40 (1.85,21.90)
24 48
Histologic 80.0 (28/35) (62.5, 90.9) 49.3 (37/75) (37.7, 61.0) 3.89 (1.42,11.76)
Biochemical 83.8 (31/37) (67.3, 93.2) 59.7 (46/77) (47.9, 70.6) ___________
7.67 (2.68. 24.74)
HBeAg Loss 62.2 (23/37) (44.8, 77.1) 90.2 (74/82) (81.2, 95.4) 15.20 (5.15,46.52)
Anti-HBe Gain 24.3 (9/37) (12.4, 41.6) 92.7 (76/82) (84.2, 97.0) 4.07(1.16.15.06)
Seroconversion 24.3 (9/37) (12.4, 41.6) 92.7 (76/82) (84.2, 97.0) 4.07 (1.16,15.06)
48 48
Histologic 74.0 (37/50) (59.4, 84.9) 49.3 (35/71) (37.3, 61.3) 2.77(1.19,6.62)
Biochemical 78.0 (39/50) (63.7, 88.0) 63.2 (48/76) (51.3, 73.7) 6.08 (2.52,15.15)
HBeAg Loss 62.7 (32/51) (48.1, 75.5) 97.5 (78/80) (90.4, 99.6) 65.68 (14.10,587.82)
Anti-HBe Gain 33.3 (17/51) (21.1, 48.0) 100.0 (80/80)
(94.3,100.0)
Seroconversion 33.3 (17/51) (21.1, 48.0 1
100.0 ) ~~~~(80/8)100
(94.3,) >39.50
Seroconversion: HBeAg undetectable and antibody against HBeAg detected. bThe odds ratio calculations are undefined when NPV is 100% or PPV is 100% or missing. Where the
denominators for both the NPV and PPV are greater than five, a "minimum" odds ratio was determined
by subtracting one specimen from the numerator of the 100% parameter estimate (NPV or PPV).
PMA P080026: FDA Summary of Safety and Effectiveness Data page 40
44
__________
100.0

PPV, NPV, and Odds Ratio for individual clinical responses during treatment predicted by early viral response (< 2000 lU/mL) in HBeAg-positive subjects (clinical response assessed at week 144):
Weekiff Viral Virespol
Respo~]se
Week of ClinicalIIIResponse Response
Clinical
Response PPV (%)
(Proportion) PPV(95%
Cl) NPV (%)
(Proportion) NPV (95%
Cl) Odds Ratio (95% C!)
e r o c 120 n
e
A
l44
Histologic not available
Biochemical 66.7 (4/6) (24.1, 94.0) 55.6
(25/45) (40.1, 70.0)
1 2.50 (0.31,
29.77)
HBeAg Loss 12 n 144 14~~~~~~~~~~~~~~~~4.50.0 (3/6) (13.9, 86.1) 845) (69.9. 93.0) 5.43 (0.58,47.41)
Anti-HBe Gain 33.3 (2/6) (2/6)~~~~~~~~~~33.3(6.0, 75.9)
(6.0, 75.9) 86.7
(39/45) (e3/40)
(72.5, 94.5) 28.53)
3.25 (0.24 3.5(.
28
~~~~~~~~~~~~~~(38/45)
Seroconversion a 33.3 (2/6) (6.0, 75.9) 86.7(39/45) (72.5,94.5) 3.00 (0.37,3.2(4
28.53)
o
n
: 248
H B
A
144
Histologic not available
Biochemical 70.0 (7/10) (35.4, 91.9 ) (23/40)
(41.0, 72.6) 3.6(21.20)
HBeAg Loss 50.0 (5/10) (2.4, 79.9) 87.5
(3 U9.9) (72.4, 95.3) 3.00.54, 7 1.11
UAnti-HBe Gain 30.0 (3/10) (8.1, 64.6) ~~~~ 5 (35/40) ~ (72.4,2953.3 .45~~~~~~~~~~573.6(0.60,
.19.68)
Seroconversion 30.0 (3/11) (8.1, 64.6) 87.5 ( (35/4)
(72.4, 95.3) 3.0300 (0.37,19.68)
u
Viral
t
dr86.1
Cli44cal
Histologic t not available
B iochemical 63. i 7/l (31.6, 87.6)d 58.32.5(.,
(21/36)
73.05964
(40.9, 74.0)
3.00 (0.36,
2.45 (0.50,13.33)
RHBeAg Loss 36.4(4/I (124 6) W kf e o
(1/36) Cic8 (69.7,194.8)
295.2C) 3.54 (0.54.
(31/36) 245 21.52)
S eroconversion 27.3 (3/Il) (7.3, 60.7) 88.9
(32/36) (73.0, 96.4) 0.92 (0.07,
3.00 (0.6.,21.45)
ble and antibody against HBeAg detected.
PPV, NxPV, and Odds Ratio for individual clinical responses during treatment Biochemcl.Gai .0~(3,15) 1170927 889 (73 3.00 (0.36,predicted by early viral response (< 2000 IU/mL) in HBeAg-positive subjects (clinical
responseassessed at week 192):e Anti. H~~~~e Gain (27.383/) (40.9, 73.3) 9730,26.)
Week of Viral
RepneWeekof
Response Clinical Clinical
Response PPV (%)
(Proportion) Cl) P NPV (%) JOdrdsRatio (95% NPV (95%)I
CI)
Odds Ratio
(95% CI)
12 192 Histologic not available
Biochemical 60.0 (3/5) (17.0, 92.7) (15/38)
(45 66 .8(.013.02)
H~e~g Loss 40.0 (2/5) (7.3, 83.0) (2/8902 (40.9, 0.92 (0.07,
Gain Anti-fie 40.0 (2/5) (7.3, 83.0)76.3
(29/38) (94 80 21(.5
.5(.5 '21.62)
PMA P080026: FDA Summary of Safety and Effectiveness Data
45
s
~~~~
~~~~~~~~~~~~~~~~~~88.
___________
.page 41
P ~~PV

Seroconversiona 40.0 (2/5) (7.3, 83.0) 76.3 (29/38) (59.4,88.0)- 2.l5 (0.15,21.62)21.62)
24 192
Histologic not available
Biochemical 66.7 (6/9) (30.9, 91.0) 40.6 (13/32)
(24.2, 59.2) 1.37 (0.24,9.92)
HBeAg Loss 44.4 62.5
(20/32) (43747833 (43.7, 78.3
21.33 (0.22,7.58)
Anti-HBe Gain 33.3 (3/9) (9.0, 69.1) 78.1 (25/32)
(59.6, 90.1) 1.79 (0.23,11.22)
Seroconversion 33.3 (3/9) (9.0, 69.1) 78 (25/32)
(59.6, 90.1) 1.79 (0.23,11.22)
48 192
Histologic not available
Biochemical 77.8 (7/9) (40.2, 96.1) 3(21.7, (12/32)
56.3) 2.10 (0.32,23.57)
1-IBeAg Loss 66.7 62.5
(20/32) (
9 .7, 3 43.7.978.3)23.33 (0.56,
23.78)
Anti-HBe Gain 55.6 (5/9) (22.7, 84.7) 81.3 (26/32) .
(63.0, 92.1) 5.42 (0.83,35.32)
Seroconversion Seroconversion55.6(5/9)
55.6 (5/9) ~
(22.7, 84.7) 81.3
(26/32) (63.0, 92.1) 5.42 (0.83,
35.32) Seroconversion: HBeAg undetectable and antibody against HBeAg detected.
PPV, NPV, and Odds Ratio for individual clinical responses during treatment predicted by early viral response (< 2000 IU/mL) in HBeAg-positive subjects clinical response assessed at week 240):
Week of Viral Virespon ~~~Response
Week of Clinical
Response Rsos
Clinical Response
PPV (%) (Proportion)
PPV (95% CI)
NPV (%) (Proportion)
NPV (95% CI)
Odds Ratio (95% CI)
12 240
Histologic *(0/0) 33.3 (3/9) (9.0, 69.1)
Biochemical 66.7 (2/3) (12.5, 98.2) 29.0 (9/31) (14.9, 48.2) 0.82 (0.04.53.57)
HBeAg Loss 66.7 (2/3) (12.5, 98.2) 58.1 (18/31) (39.3, 74.9) 2.77 (0.13,
172.28)
Anti-HBe Gain 33.3 (1/3) (1.8, 87.5) 86.7 (26/30) (68.4, 95.6) 3.25 (0.04,73.98)
Seroconversion' 33.3 (1/3) (1.8, 87.5) 87.1 (27/31) (69.2, 95.8) 338 (0.05,76.68)
24 240
Histologic 0.0 (0/1) (0.0, 94.5) 37.5 (3/8) (10.2, 74.1) 0.00 (0.00,15.20)
Biochemical 60.0 (3/5) (17.0, 92.7) 29.6 (8/27) (14.5, 50.3) 0.63 (0.06.9.06)
HBeAg Loss 60.0 (3/5) (17.0, 92.7) 63.0 (17/27) (42.5, 79.9) 2.55(0.24,34.44)
Anti-HBe Gain 20.0 (1/5) (I.], 70. ) 84.6 (22/26) (64.3, 95.0) 1.38 (0.02,20.07)
Seroconversion 20.0(1/5) (I.1, 70.1) 85.2 (23/27) (65.4, 95.1) 1.44 (0.02.20.91)
48 240 Histologic 100.0 (I/I) (5.5. 100.0) 57.1 (4/7) (20.2, 88.2) *
Biochemical 83.3 (5/6) (36.5, 99.1) 30.8 (8/26) (15.1, 51.9) 2.22 (0.19,118.05)
PMA P080026: FDA Summary of Safety and Effectiveness Data page 42
46
I___I__I_____I_________ I________________ __________

HBeAg Loss 83.3 (5/6) (36.5, 99.1) 65.4 (17/26) (44.4, 82.1) 4 (0.81, 472.23)
Anti-HBe Gain 50.0 (3/6) (13.9, 86.1) 96.0 (24/25)
(4~~~~4 812.1)
(77.7 99.8)
.00
24.00(.21,1309.0)00(77.7269.8 Seroconversion 50.0 (3/6) (13.9, 86.1) 96.2 (25/26) (78,4, 98)
~~~2 25.00 (.26,
1361.3) * Undefined (division by zero). *Seroconversion: HBeAg undetectable and antibody against HBeAg detected.
The following two tables demonstrate that the NPV is high (greater than 89% for Week 48 of clinical response) for the association of early viral response with the combination of all three responses (histologic, biochemical, and serological - HBeAg loss or seroconversion). These data indicate that HBeAg-positive subjects without an early viral response (defined as < 2000 IU/mL decrease) are very unlikely to achieve all three clinical responses by Week 48, as a result of treatment. The number of subjects at Week 240 was small, and therefore available data is inadequate to draw conclusions about the association of the early viral response with clinical responses at later weeks.
PPV, NPV, and Odds Ratio (OR) for a combination of histologic, biochemical, and HBeAg loss responses during treatment predicted by an early viral response (<2000 IU/mL) in HBeAg-positive subjects:
Week of Vrl
Response ~~~Response
Week of ClinicalResponseRsos
P (%) (Proportion)
PPV
(95% Cl) NPV (%)
(Proportion) NPV
(95% CI) Odds Ratio (95%
CI)
12 48 41.7 (10/24) (22.8, 63.1) 89.9 (80/89) (81.2, 95.0) 6.35 (1.90, 20.95)
24 48 42.9 (15/35) (26.8, 60.5) 97.3 (72/74) (89.7, 99.5) 27.00 (5.38,25.97)~~~~~~~~~~~~252.97)
48 48 36.7 (18/49) (23.8, 51.7)
1
98.6 (70/71) (91.3, 99.9) 40.65 (5.75,1716.7)
12 240 * (0/0) * 55.6 (5/9) (22.7, 84.7) *
24 240 0.0 (0/i) (0.0, 94.5) 62.5 (5/8) (25.9, 89.8) 0.00 (0.00, 38.00)
48 240 100.0 (1/I) (5.5, 100.0) 71.4 (5/7) (30.3, 94.9)
* Undefined (division by zero). An association with, rather than prediction of, clinical responses is demonstrated when measuring the viral response at Week 48.
PPV, NPV, and Odds Ratio (OR) for a combination of histologic, biochemical, and seroconversion responses during treatment predicted by an early viral response (<2000 IU/mL) in HBeAg-positive subjects:
Week of Viral
Response Week of Clinical
Response PPV (%)
(Proportion)
PPV
(95% CI)
NPV (%)
(Proportion)
NPV
(95% CI)
Odds Ratio (95%
CI)
12 48 25.0 (6/24) (10.6, 47.1) 97.8 (87/89) (91.4, 99.6) 14.50 (2.28,
PMA P080026: FDA Summary of Safety and Effectiveness Data page 43
47
__________
___________

152.63)
24 48 17.1 (6/35) (7.2, 34.3) 98.6 (73/74) (91.7, 99.9) 15.10 (1.68,
703.89)
48 48 16.3 (8/49) (7.8, 30.2) 100.0 (71/71) (93.6, 100.0) >13.66 a
12 240 (0/0) - 77.8 (7/9) (40.2, 96.1)
24 240 0.0 (0/I) (0.0, 94.5) 75.0 (6/8) (35.6, 95.5) 0.00 (0.00, 66.50)
48 240 100.0 (!/1) (5.5, 100.0) 100.0 (7/7) (56.1, 100.0) *
* Undefined (division by zero). The odds ratio calculations are undefined when NPV is 100% or PPV is 100% or missing. Where the denominators for both the NPV and PPV are greater than five, a "minimum" odds ratio was determined by subtracting one specimen from the numerator of the 100% parameter estimate (NPV or PPV).
An association with, rather than prediction of, clinical responses is demonstrated when measuring the viral response at Week 48.
Viral Response > 2 Log IU/mL Decrease
As shown in the table below, early viral response (Weeks 12, 24, 48) is informative in
predicting clinical responses at Weeks 48. High NPV (>90.9%) is observed for the
association of viral response and the serological responses (HBeAg loss, anti-HBe gain,
and seroconversion).
The significance of a viral response at Weeks 12, 24, and 48 in predicting histologic,
biochemical, HBeAg loss, anti-HBe gain, and seroconversion at Week 48 and later time
points is assessed by the lower 95% CI limit for the odds ratio exceeding 1.0.
An association with, rather than prediction of, clinical responses is demonstrated when
measuring the viral response at Week 48. PPV, NPV, and Odds Ratio for individual
clinical responses during treatment predicted by early viral response (> 2 Log IU/mL
decrease) in HBeAg-positive subjects (clinical response assessed at week 48):
Week of Viral
Response
Week of Clinical Response
Clinical Response
PPV (%) (Proportion)
PPV (95% CI)
NPV (%) (Proportion)
NPV (95% CI)
Odds Ratio (95% C1)
12 48
Histologic 67.5 (52/77) (55.8, 77.5) 51.4 (19/37) (34.7,67.8) 2.20 (0.91,5.28)
Biochemical 58.2 (46/79) (46.6, 69.1) 57.5 (23/40) (41.0, 72.6) 1.89 (0.82.4.39)
HBecAg Loss 36.3 (29/80) (26.0, 47.8) 90.9 (40/44) (77.4, 97.0) 5.69 (1.76,23.79)
Anti-HBe Gain 18.8 (15/80) (11.2, 29.4) 95.5 (42/44) (83.3, 99.2) 4.85 (1.03,45.38)
Seroconversion 18.8 (15/80) (11.2, 29.4) 95.5 (42/44) (83.3, 99.2) 4.85 (1.03,45.38)
24 48 Histologic 62.7 (52/83) (51.3, 72.8) 48.1 3/27) (29.2,( 67.6) 4.09)59
Biochemical 59.3 (51/86) (48.2, 69.6) 60.7 (17/28) (40.7, 77.9) 2.25 (0.87, 5.98)
HBA2Loss 1s33.3 (30/90) .(24.0a44.1 AI 96.6 (28/29) I(80.4. 99.8) 14.00 (2.07.
PMA P080026: FDA Summary of Safety and Effectiveness Data page 44
48
_____________________________ ____________ _____________ ____________

591.20)
Anti-HBe Gain 16.7 (15/90) (9.9, 26.3) 100.0 (29/29) (85.4, 100.0) >5 .60b
Seroconversion 16.7 (15/90) (9.9 26.3) 100.0 (29/29) (85.4, 100.0) >5 .6 0b
48 48
Histologic 66.7 (60/90) (55.9, 76.0) 58.1 (18/31) (39.3, 74.9) 2.77 (1.11,
7.00)7.00)
Biochemical 63.4 (59/93) (52.8, 73.0) 75.8 (25/33) (57.4, 88.3) 5.42 (2.06,15.32)
HBeAg Loss 35.8 (34/95) (26.4, 46.3) 100.0 (36/36) (88.0,100.0) > 19.51 b
Anti-HBe Gain 17.9 (17/95) (11.1,27.4) 100.0 (36/36) (88.0,100.0) >7.63b
Seroconversion 17.9(17/95) (11.1, 27.4) 100.0 (36/36) (88.0,100.0)63
Seroconversion: HBeAg undetectable and antibody against HBeAg detected. The odds ratio calculations are undefined when NPV is 100% or PPV is 100% or missing. Where the
denominators for both the NPV and PPV are greater than five, a "minimum" odds ratio was determined
by subtracting one specimen from the numerator of the 100% parameter estimate (NPV or PPV).
PPV, NPV, and Odds Ratio for individual clinical responses during treatment predicted by early viral response ( > 2 Log IU/mL decrease) in HBeAg-positive subjects (clinical response assessed at week 144):
Week of Viral Vras on
Week of ClinicalCliResonsl
ResponseRepneI
Clinical Response
PPV (%) (Proportion)
PPV (95% CI)
NPV (%) (Proportion)
NPV (95% CI)
Odds Ratio (95% CI)
12 144
Histologic not available
Biochemical 43.3 (13/30) (26.0, 62.3) 47.6 (10/21) (26.4, 69.7) 0.70 (0.20,2.46)
HBeAg Loss 23.3 (7/30) (10.6, 42.7) 1 85.7 (18/21) (62.6, 96.2) 1.83 (0.35,~~~~~~~~~~~~~~~~~12.35) Anti-HBe Gain 16.7 (5/30) (6.3, 35.5) 85.7 (18/21) (62.6, 96.2) 1.20 (0.20,
* 8.70)
Seroconversion' 16.7 (5/30) (6.3, 35.5) 85.7 (18/21) (62.6, 96.2) 1.20 (0.20,I 8.70)
24 144
Histologic not available
Biochemical 44.7 (17/38) (29.0, 61.5) 41.7 (5/12) (16.5, 71.4) 0.58 (0.12,2.59)
HBeAg Loss 26.3 (10/38) (14.0, 43.4) 100.0 (12/12) (69.9, 100.0) >3 .93b
Anti-HBe Gain 21.1 (8/38) (10.1, 37.8) 100.0 (12/12) (69.9, 100.0) >2 .93 b
Seroconversion 21.1 (8/38) (10.1, 37.8) 100.0 (12/12) (69.9, 100.0) >2.93 b
48 144
Histologic not available
Biochemical 48.3 (14/29) (29.9, 67.1) 55.6 (10/18) (31.3, 77.6) 1,17 (0.31,4.49)
HBeAg Loss ·
20.7 (6/29) (8.7, 40.3) 83.3 (15/18) (57.7, 95.6) 1.30 (0.23,9.25)
Anti-HBe Gain 17.2 (5/29) (6.5, 36.5) 88.9 (16/18) (63.9 98.1) 1.67 (0.23,19.34)
Seroconversion 17.2 (5/29) (6.5, 36.5) 88.9 (16/18) (63.9, 98.1) 1.67 (0.23,19.34)
Seroconversion: HBeAg undetectable and antibody against HBeAg detected.
PMA P080026: FDA Summary of Safety and Effectiveness Data page 45
49
___________

'The odds ratio calculations are undefined when NPV is 100% or PPV is 100% or missing. Where the
denominators for both the NPV and PPV are greater than five, a "minimum" odds ratio was determined by subtracting one specimen from the numerator of the 100% parameter estimate (NPV or PPV).
PPV, NPV, and Odds Ratio for individual clinical responses during treatment predicted by early viral response (> 2 Log IU/mL decrease) in HBeAg-positive subjects (clinical response assessed at week 192):
Week of Clirial
Response
Week of ViraCliicalClinical
Response
C iI
Response PPV (%)
rtion) PPV
(95% CI) NPV (%)
(Proportion NOV(9Ratio5% CI)
Odds
(95% CI)
12 192
Histologic not available
Biochemical 60.0 (15/25) (38.9, 78.2) 3819 (7/18) (18.3,63.9) 0.95 (0.23,3.89)
HBeAg Loss 48.0 (12/25) (28.3, 68.2) 66.7 (12/18) (41.2,85.6) 1.85 (0.45,
7.9(04
Anti-HBe Gain 28,0 (7/25) (12.9, 49.6) 77.8 (14/IS) (51.9,92.6) 1.36 (0.27,7.62)
Scroconversion a
28.0 (7/25) (12.9, 49.6) 77.8 (14/18) (51.9,926) 1.36 (0.27, 7.62)
24 192
Histologic not available
Biochemical 56.7 (17/30) (37.7, 74.0) 27.3 (3/Il) (7.3,60.7) 0.49 (0.07,2.64)
HBeAg Loss 43.3 (13/30) (26.0, 62.3) 72.7 (8/Il) (39.3,92.7) 40.38,
Anti-HBe Gain 33.3 (10/30) (17.9, 52.9) 100.0 (11/Il) (67.9, 100.0)
____________14.07)
>5 .0 0b
Seroconversion 33.3 (10/30) (17.9, 52.9) 100.0 (1 I/I) (67.9.100.0) >5 .0 0 b
48 192
Histologic not available
Biochemical 76.9 (20/26) (55.9, 90.2) 53.3 (8/15) (27.4,77.7) 3.81 (0.80,18.49)
HBeAg Loss 46.2 (12/26) (27.1, 66.3) 60.0 (9/I5) (32.9, 82.5) 1.29 (0.30,5.77)
Anti-HBe Gain 34.6 (9/26) (17.9, 55.6) 86.7 (13/15) (58.4, 97.7) 3.4055, 37.07)
Seroconversion 34.6 (9/26) (17.9, 55.6) 86.7 (13/15) (58.4, 97.7) 3.44 (0.55,37.07)
a Seroconversion: HBeAg undetectable and antibody against HBeAg detected. b The odds ratio calculations are undefined when NPV is 100% or PPV is 100% or missing. Where the
denominators for both the NPV and PPV are greater than five, a"minimum" odds ratio was determined by subtracting one specimen from the numerator of the 100% parameter estimate (NPV or PPV).
PPV, NPV, and Odds Ratio for individual clinical responses during treatment predicted by early viral response (> 2 Log IU/mL decrease) in HBeAg-positive subjects (clinical response assessed at week 240):
Week of Viral Virespon ~~~Response
Week of Clinical Rsos Response
Clinical
Response
PPV (%)
(Proportion)
PPV (95% Cl)
NPV (%)
(Proportion)
NPV
(95% Ci)
Odds Ratio
(95% CI)
12 240 Histologic 100.0 (5/5) (46.3, 100.0) 75.0 (3/4) (21.9, 98.7) *
Biochemical 73.7 (14/19) (48.6, 89.9) 33.3 (5/15) (13.0, 61.3) 1.40 (0.25.7.92)
PMA P080026: FDA Summary of Safety and Effectiveness Data page 46
50

HBeAg Loss 57.9 (11/19) (34.0, 78.9) 73.3 (11/IS) (44.8, 91.1) 3.78 (0.72, ~~~~21.84)
Anti-HBe Gain 27.8 (5/IS) (10.7, 53.6) 100.0 (15/IS)
1
(74.7, 100.0) >5.38b
Seroconversion' 26.3 (5119) (10.1, 51.4) 100.0 (15/15) (74.7, 100.0) >5 00b
24 240
Histologic 71.4 (517) (30.3, 94.9) 100.0 (2/2) (19.8, 100.0)
Biochemical 69.6 (16/23) (47.0, 85.9) 33.3 (3/9) (9.0, 69.1) 114 (0.14,7.48)
HBeAg Loss 52.2 (12123) (31.1, 72.6) 88.9 (8/9) (50.7, 99.4) 8.73 (0.86,418.80)
Anti-HBe Gain 22.7 (5/22) (8.7, 45.8) 100.0 (9/9) (62.9. lORO0) >2.3 5
Seroconversion 21.7 (5/23) (8.3, 44.2) 100.0 (9/9) (62.9, 100.0) >2.22"
48 240
Histologic 66.7 (4/6) (24.1, 94.0) 100.0 (2/2) (19.8, 100.0)
Biochemical 77.3 (17/22) (54.2, 91.3) 40.0 (4/10) (13.7, 72.6) 24.276(032
HBeAg Loss 54.5 (12/22) (32.7, 74.9) 80.0 (8/10) (44.2, 96.5) 4.80 (0.69,~~~~53.92)
Anti-HBe Gain 19.0 (4/21) (6.3, 42.6) 100.0 (10/10)
1
(65.5, 100.0) >2.12"
Seroconversion 18.2 (4/22) (6.0, 41.0) 100.0 (10/10) 1(65.5, 100.0) >2.00b
*Undefined (division by zero). Seroconversion: HBeAg undetectable and antibody against HBeAg detected.
bThe odds ratio calculations are undefined when NPV is 100% or PPV is 100% or missing. Where the
denominators for both the NPV and [PV are greater than five, a "minimum" odds ratio was determined
by subtracting one specimen from the numerator of the 100% parameter estimate (NPV or PPV).
The following two tables demonstrate that the NPV is very high (greater than or equal to 97% for response at Week 48) for the association of early viral response with the combination of all three responses (histologic, biochemical, and serological - HBeAg loss or seroconversion). These data indicate that HBeAg-positive subjects without an early viral response (defined as Ž 2 log IU/mL decrease) are unlikely to achieve all three clinical responses by Week 48, as a result of treatment. The number of subjects at Week 240 was small, and therefore available data is inadequate to draw conclusions about the association of the early viral response with clinical responses at this time point.
An association with, rather than prediction of, clinical responses is demonstrated when measuring the viral response at Week 48. PPV, NPV, and Odds Ratio (OR) for a combination of histologic, biochemical, and HBeAg loss responses during treatment predicted by an early viral response (Ži 2 Log IU/mL decrease) in HBeAg-positive subjects:
PMA P080026: FDA Summary of Safety and Effectiveness Data page 47

Week of Vir.al Respos
Response
Week of Clinical
Resnseal Response
PPV (%) (Proportion)
PPV (95% CI)
NPV (%) (Proportion)
NPV (95% CI)
Odds Ratio (95%CI)
12 U 48 23.7 (18/76) (15.0, 35.1) 97.3 (36/37) (84.2, 99.9) 11.17 (1.60,478.17) n
24 d 48 20.7 (17/82) (12.9,31.4) 100.0(27/27) (84.5, 100.0) >6.80'
48 f 48 21.3 (19/89) (13.7, 31.6) 100.0 (31/31) (86.3, 100.0) >8.14 a
12 n 240 60.0 (3/5) (17.0, 92.7) 75.0 (3/4) (21.9, 98.7) 4.50 (0.15, 313.49) e
24 d 240. 42.9 (3/7) (11.8, 79.8) 100.0 (2/2) (19.8, 100.0)
48 240 50.0 (3/6) (13.9, 86.1) 100.0 (2/2) (19.8, 100.0) *
·~..
~~~~~~~~~~~~~~~~~~~~~~~~~~~~~~~~~~~~~~~i
d · Undefined (division by zero).
The odds ratio calculations are undefined when NPV is 100% or PPV is 100% or missing. Where the denominators for both the NPV and PPV are greater than five, a "minimum" odds ratio was determined by subtracting one specimen from the numerator of the 100% parameter estimate (NPV or PPV).
PPV, NPV, and Odds Ratio (OR) for a combination of histologic, biochemical, and seroconversion responses during treatment predicted by an early viral response ( 2 Log IU/mL decrease) in HBeAg-positive subjects:
Week of Viral Virespon
Week of ClinicalRespnsea Rsos ~~~Response
PPV (%)
(Proportion)
PPV
(95% CI)
NPV (%)
(Proportion)
NPV
(95% CI)
Odds Ratio
(95% CI)
12 48 10.5 (8/76) (5.0, 20.2) 100.0 (37/37) (88.3, 100.0) >4.24'
24 48 8.5 (7/82) (3.8, 17.3) 100.0 (27/27) (84.5, 100.0) >2.43a
48 48 9.0 (8/89) (4.2, 17.4) 100.0 (31/31) (86.3, 100.0) >2.96'
12 240 40.0 (2/5) (7.3, 83.0) 100.0 (4/4) (39.6, 100.0) *
24 240 28.6 (2/7) (5.1, 69.7) 100.0 (2/2) (19.8, 100.0)
48 240 16.7 (1/6) (0.9, 63.5) 100.0 (2/2) (19.8, 100.0) *
· Undefined (division by zero). The odds ratio calculations are undefined when NPV is 100% or PPV is 100% or missing. Where the denominators for both the NPV and PPV are greater than five, a "minimum" odds ratio was determined by subtracting one specimen from the numerator of the 100% parameter estimate (NPV or PPV).
HBeAg-Negative Patients
The table below demonstrates the efficacy, based on HBV viral load testing, of treating HBeAg-negative patients with 10 mg adefovir dipivoxil compared to placebo. At Week 48, 48.72% (57/117) of HBeAg-negative patients on treatment vs. 0% (0/55) on placebo
PMA P080026: FDA Summary of Safety and Effectiveness Data page 48
52

had achieved vets low viral loads below 100 IU/mL. Furthermore, 3.42% (4/117) of patients on treatment vs. 30.91 % (17/55) on placebo had viral loads greater than or equal to 106 IU/mL.
Distribution of HBV Viral Load at Week 48 for RHeAg-Negative Patients:
Adefovir Dipivoxil Placebo Viral Load
(IU/mL) n % %Cumulative n % %Cumulative
TNI~a 9 7.69 7.69 0 0.00 0.00
<15 20 17.09 24.79 ~ 0 0.00 0.00
15 -<100 I28 23.93 48.72 0 0.00 0.00
100-< IO, 33 28.21 76.92 7 12.73 12.73
IO, -< IO, 9 7.69 84.62 5 9.09 21.82
io4 _< Io1 6 5.13 89.74 1 1 20.00 41.82
IO, -< 106 8 6.84 96.58 15 27.27 69.09
IO, -< 109 4 3.42 100.00 17 30.91 100.00
Ž io9 0 0.00 100.00 0 0.00 100.00
Total 117 100.00 t<'55 100,00
Target Not Detected.
The figure below demonstrates the median viral load change and inter-quartile range of change from baseline for HBeAg-negative subjects on treatment compared to placebo. This shows the impact of treatment with adefovir dipivoxil on the viral load of the HBeAg-negative patients with chronic hepatitis B.
PMA P080026: FDA Summary of Safety and Effectiveness Data page 49
½7 J'
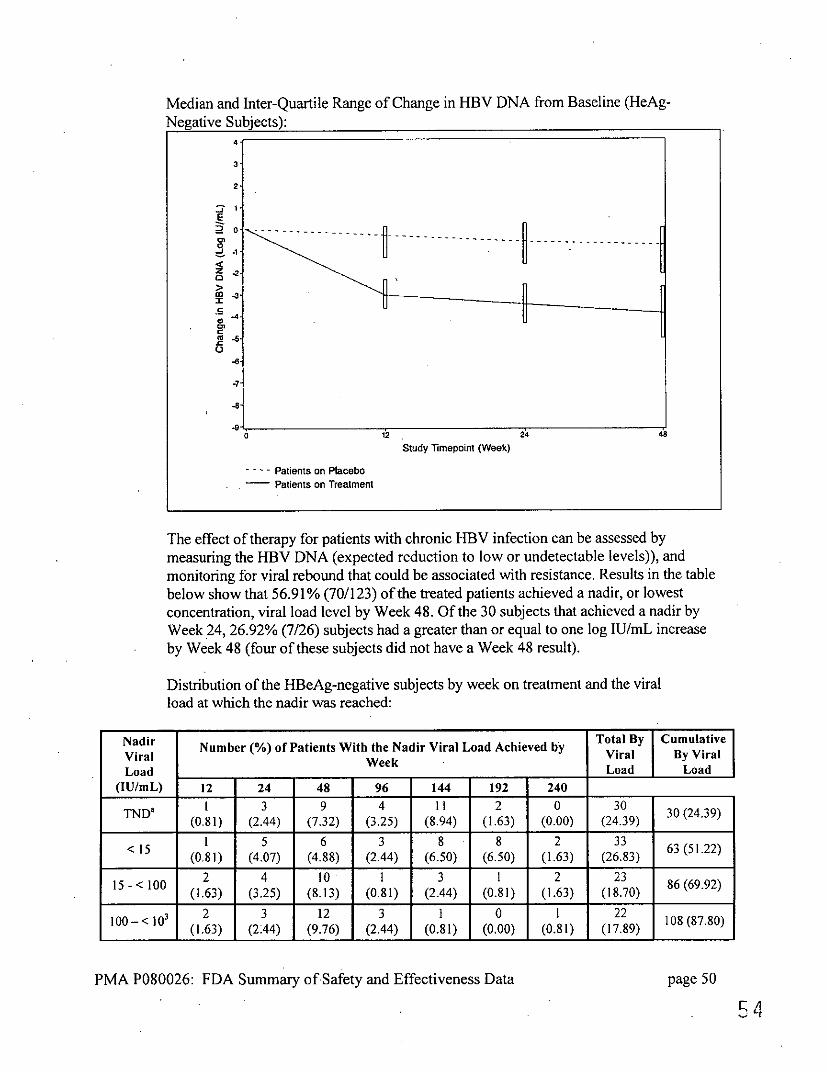
Median and Inter-Quartile Range of Change in HBV DNA from Baseline (HeAg-Negative Subjects):
4
3
2
2'0 F
.C. -8.---
O
4-7 02~~~~~~~~~~~~~~~~~~~2
.-e -8'
Study Timepoint (Week)
-.-- Patients on Placebo Patients on Treatment
The effect of therapy for patients with chronic HBV infection can be assessed by measuring the HBV DNA (expected reduction to low or undetectable levels)), and monitoring for viral rebound that could be associated with resistance. Results in the table below show that 56.91% (70/123) of the treated patients achieved a nadir, or lowest concentration, viral load level by Week 48. Of the 30 subjects that achieved a nadir by Week 24, 26.92% (7/26) subjects had a greater than or equal to one log IU/mL increase by Week 48 (four of these subjects did not have a Week 48 result).
Distribution of the HBeAg-negative subjects by week on treatment and the viral load at which the nadir was reached:
Nadir Viral LoadWLoad
(IU/mL)
Number (%) of Patients With the Nadir Viral Load Achieved by Total ByViral
Cumulative By Viral
Load 12 24 48 96 144 192 240
TND' 1 3 9 4 11 2 0 30 (0.81) (2.44) (7.32) (3.25) (8.94) (1.63) (0.00) (24.39)
< 15 6 3 8 8 2 33 .22) (0.81) (4.07) (4.88) (2.44) (6.50) (6.50) (1.63) (26.83)
2 4 10 I 3 1 2 23 86(69.92) (1.63) (3.25) (8.13) (0.81) (2.44) (0.81) (1.63) (18.70)
_____-<Io__
2 3 12 3 t 0 1 22 108 (87.80) (1.63) (2:44) (9.76) (2.44) (0.81) (0.00) (0.81) (17.89)
PMA P080026: FDA Summary ofSafety and Effectiveness Data page 50
54

103 -<104 2
(1.63) 0
(0.00) 1
(0.81) 0
(0.00) 0
(0.00) 1
(0.81) I
(0.81) 5
(4.07) 13(9187)
i04 -<l I 104-< 105
0 (0.00)
2 (1.63)
I (0.81)
0 (0.00)
0 (0.00)
0 (0.00)
0 (0.00)
3 (2.44)
105-< 06 2
(1.63) 1
(0.81) I
(0.81) 0
(0.00) I
(0.81) 0
(0.00) 0
(0.00) 5
(4.07) 121 (98.37
106~ I ~I (0.81)
. (0.81)
0 (0.00)
0 (0.00)
0 (0.00)
0 (0.00)
0 (0.00)
2 (I.63)
123 (100.00)
Total By Week
II (8.94)
19 (15.45)
40 (32.52)
11 (8.94)
24 (19.51)
12 (9.76)
6 (4.88)
Cumulative By Week
II (8.94)
30 (24.39)
70 (56.91)
81 (65.85)
105 (85.37)
117 (95.12)
123 (100.00)
Target Not Detected.
Two patients out of 123 achieved HBsAg seroconversion. One patient was a white female, HBV genotype D, > age 30, and seroconverted at Week 96. The other patient was a white male, HBV genotype D, > age 30, and seroconverted at Week 240. A summary of these results is provided in Table 34.
HBeAg-Negative Subjects with HBsAg Seroconversion:
Concentration (Log iU/mL)
Week 0 Week 12 Week 24 Week 48 Week 96 Week 144 Week 192 Week 240
Subject 1 6.86 3.83 3.25 < 1.18 TND* n/a** n/a** n/a**
Subject 2 6.36 4.53 4.56 5.04 5.09 < 1.00 TND* TND*
aTarget Not Detected Aliquot not available for testing
Summaries of the effect of baseline covariates for the HBeAg-negative population are provided in the two tables below.
Association between responses to treatment at week 48 and baseline covariates for HBeAg-negative patients:
Response to Treatment
Cjt
Category n
No. of Patients
with Response
Proportion (%) of
Patients with Response
Unadjusted Odds Ratio (95% CI)
Histological Race
Asian 32 19 59.38 0.52 (0.20, 1.38)
Other 76 56 73.68
Sex Male 90 63 70.00
1.17 (0.32, 3.79) Female 18 12 66.67
Age <30 7 6 85.71
2.78 (0.31, 131.93) >30 101 69 68.32
PMA P080026: FDA Summary of Safety and Effectiveness Data page 51
55
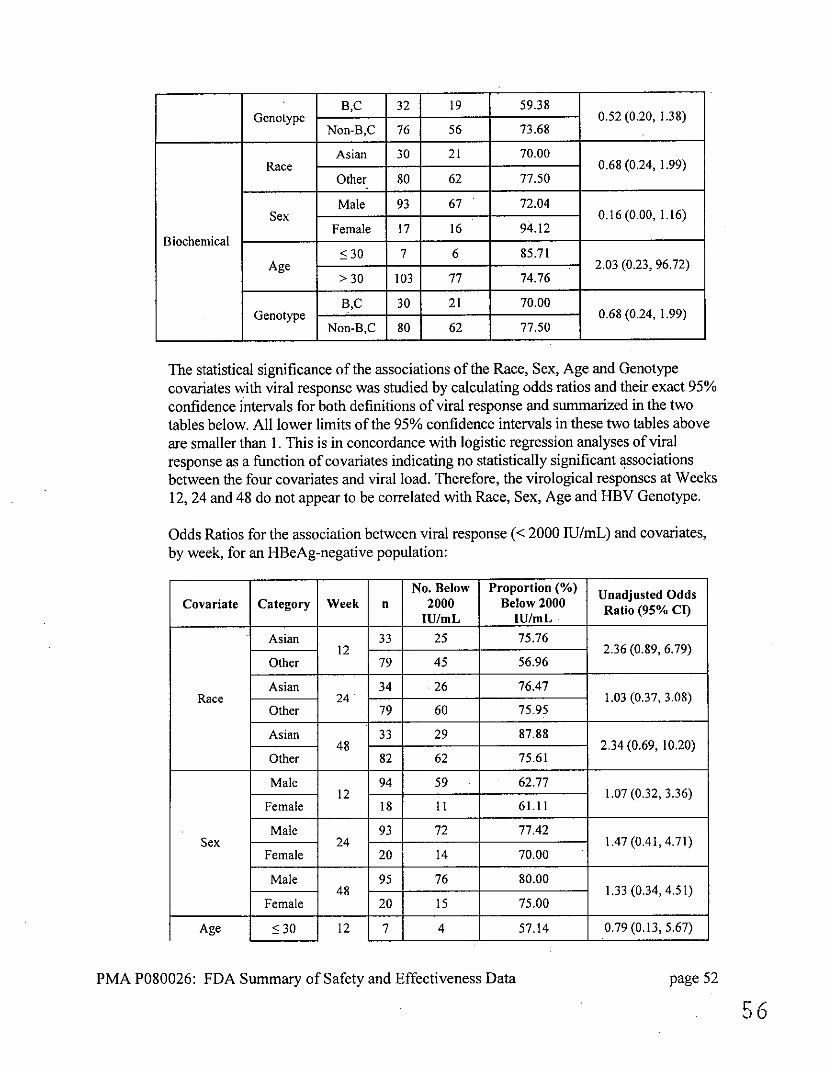
Genotype B,C 32 19 59.38
0.52 (0.20, 1.38) Non-B,C 76 56 73.68
Biochemical
Race Asian 30 21 70.00
0.68 (0.24, 1.99) Other 80 62 77.50
Sex Male 93 67 72.04
0.16 (0.00, 1.16) Female 17 16 94.12
Age <30 7 6 85.71
2.03 (0.23, 96.72) > 30 103 77 74.76
Genotype B,C 30 21 70.00
0.68 (0.24, 1.99) Non-B,C 80 62 77.50
The statistical significance of the associations of the Race, Sex, Age and Genotype
covariates with viral response was studied by calculating odds ratios and their exact 95%
confidence intervals for both definitions of viral response and summarized in the two
tables below. All lower limits of the 95% confidence intervals in these two tables above
are smaller than 1. This is in concordance with logistic regression analyses of viral
response as a function of covariates indicating no statistically significant associations
between the four covariates and viral load. Therefore, the virological responses at Weeks
12, 24 and 48 do not appear to be correlated with Race, Sex, Age and HBV Genotype.
Odds Ratios for the association between viral response (< 2000 IU/mL) and covariates,
by week, for an HBeAg-negative population:
Covariate Category Week n No. Below
2000 ______IU/mL
Proportion (%) Below 2000
IU/mL
Unadjusted Odds Ratio (95% CI)
Race
Asian 12
33 25 75.76 2.36 (0.89, 6.79)
Other 79 45 56.96
Asian 24
34 26 76.47 1.03 (0.37, 3.08)
Other 79 60 75.95
Asian 48
33 29 87.88 2.34 (0.69, 10.20)
Other 82 62 75.61
Sex
Male 12
94 59 62.77 1.07 (0.32, 3.36)
Female 18 11 61.11
Male 24
93 72 77.42 1.47 (0.41,4.71)
Female 20 14 70.00
Male 48
95 76 80.00 1.33 (0.34, 4.51)
Female 20 15 75.00
Age • 30 12 7 4 57.14 0.79 (0.13, 5.67)
PMA P080026: FDA Summary of Safety and Effectiveness Data page 52
.56

.
> 30 105 66 62.86
<30 24
7 5 71.43 0.77 (0.12, 8.59)
> 30 106 81 76.42
<30 48
6 4 66.67 0.51 (0.07, 5.97)
> 30 109 87 79.82
Genotype
B,C 12
33 25 75.76 2.36 (0.89, 6.79)
Non-B,C 79 45 56.96
B,C 24
34 26 76.47 1.03 (0.37, 3.08)
Non-B,C 79 60 75.95
B,C 48
33 29 87.88 2.34 (0.69, 10.20)
Non-B,C 82 62 75.61
Odds Ratios for the association between viral response (> 2 Log decrease from baseline result) and covariates, by week, for an HBeAg-negative population:
Covariate Category Week N No. with >2 Log
Decrease
Proportion (%) with >2 Log
Decrease Ratio (95% CI)
Race
Asian 12
33 25 75.76 0.86 (0.30, 2.60)
Other 79 62 78.48
Asian 24
34 31 91.18 1.50 (0.35, 9.02)
Other 79 69 87.34
Asian 48
33 31 93.94 2.15 (0.42, 21.22)
Other 82 72 87.80
Sex
Male 12
94 72 76.60 0.65 (0.11, 2.64)
Female 18 15 83.33
Male 24
93 82 88.17 0.83 (0.08, 4.32)
Female 20 18 90.00
Male 48
95 83 87.37 0.00 (0.00, 1.28)
Female 20 20 100.00
Age
<30 12
7 5 71.43 0.70 (0.11, 7.84)
> 30 105 82 78.10
<30 24
7 6 85.71
> 30 106 94 88.68
5<30 48
6 5 83.33 0.56 (0.06, 28.93)
> 30 109 98 89.91
Genotype B,C 12 33 25 75.76 0.86 (0.30, 2.60)
PMA P080026: FDA Summary of Safety and Effectiveness Data page 53
57

Non-B,C 79 62 78.48
B,C 24
34 31 91.18 1.50 (0.35, 9,02)
Non-B,C 79 69 87.34
B,C 48
33 31 93.94 2.15 (0.42, 21.22)
Non-B,C -
82 72 87.80
Positive Predictive Value (PPV), Negative Predictive Value (NPV), and Odds Ratio (OR) Analysis for HBeAg-Negative Patients
For each patient, two responses - Histologic and Biochemical - were measured at various times during treatment. *
*
Histologic response - improvement of histologic status by at least 2 units of the Knodell necroinflammatory score without deterioration of the fibrosis score compared to the histologic status at baseline Biochemical response - normalization of ALT test result compared to the biochemical status at the baseline
Additionally, HBsAg seroconversion data was also collected.
Viral load response was defined as either HBV DNA less than 2000 IU/mL or greater than or equal to 2 log IU/mL decrease from baseline. Statistical analysis (PPV) was performed to evaluate the association between the clinical responses at Weeks 48, 96, 144, 192, or 240 and a viral load response at Weeks 12, 24, or 48. Statistical analysis (NPV) was performed to evaluate whether there is an association between the clinical non-responses at Weeks 48, 96, 144, 192, or 240 and a viral load non-response at Weeks 12, 24, or 48.
Viral Response <2000 IU/mL
As shown in the table below, viral response at Weeks 24, 48, (when defined as < 2000 IU/mL decrease in value from the baseline viral load result) appears informative (i.e., lower 95% CI limit forthe odds ratio exceeding 1.0) in predicting biochemical response at 48 and 96 weeks on treatment. The PPV for the association of viral response and histologic response increased throughout the study. The PPV was > 68.3% at Week 48 and > 85.7% at the end of the study. The PPV for the association of vital response and biochemical response was > 78.3% at Week 48 and remained consistent through the end of the study.
PPV, NPV, and Odds Ratio for individual clinical responses during treatment predicted by early viral response (< 2000 IU/mL) in HBeAg-negative subjects:
PMA P080026: FDA Summary of Safety and Effectiveness Data page 54
53

Week of Viral
RepneResponse
Week of Clinical
Response
Clncl Clipnica
PV%)NV (Propo(%)o PPV (95% Cl) NPVV%
(Proportion)(rptin NP(5%C)
OdRai Ods Rati
(95% CI)
12 48
Histologic 68.3 (41/60) (54.9, 79.4) _2.
29.7 (11/37) (16.4, 47.2) 0.91 (0.34, 1
Biochemical 78.3 (47/60) (65.5, 87.5) 27.5 (11/40) (15.1, 44.1) 137(.48,
24 48 ~~Histologic 71.4 (55/77) (59.8, 80.9) 30.4 (7/23) (14.1, 53.0) 3.3090.3
Biochemical 81.6 (62/76) (70.7, 89.2) 44.0(11/25) (25.0, 64.7) 3.48 (1.15,~~~~~~10.28)
48 48 ~~Histologic 69.8 (60/86) (58.8, 79.0) 35.0 (7/20) (16.3, 59.1) 1.8240.7
Biochemical 83.3 (70/84) (73.3, 90.3) 45.8 (11/24) (26.2, 66.8) 4.23 (1.39, 12.62)
12 96 Histologic 88.9 (8/9) (50.7, 99.4) 16.7 (1/6) (0.9, 63.5) 1.0(02
Biochemical 83.3 (25/30) (64.5, 93.7) 32.1 (9/28) (16.6, 52.4) 2.37 (0.59,10.41I)
24. 96 Histologic 84.6 (11/13) (53.7, 97.3) 33.3 (1/3) (1.8, 87.5) 2.75 (0.03,
Biochemical 87.8 (36/41) (73.0, 95.4) 56.3 (9/16) (30.6, 79.2) __ ____ ____
7.2 9.26 (1.97,
45.25)
48 96 Histologic 85.7 (12/14) (56.2, 97.5) 25.0 (1/4) (1.3, 78.1) 2.00 (0.03,
Biochemical 82.6 (38/46) (68.0, 91.7) 50.0 (7/14) (24.0, 76.0) 5.7
40.75(.6
12 144
Histologic not available
Biochemical 72.7 (24/33) (54.2, 86.1) 30.4 (7/23) (14.1, 53.0) 1.17 (030, 4.37)
24 144283062 Histologic not available
Biochemical 76.7 (33/43) (61.0, 87.7) 46.2 (6/13) (20.4, 73.9) 1283(062
48 144
Histologic not available
~~Biochemical 74.5 (35/47) (59.4, 85.6) 41.7 (5/12) (16.5, 71.4) 2.08 (0.43,~~~~9.30)
Week of Viral
Response ClinicalPV95 Week of
Response
Clinical
Response
PPV (%)
(Proportion)
PPV (95%
CI)
NPV %
(Proportion)FP(9%C)
[ C)
Odds Ratio
(95% Cl)
12 192
Histologic not available
-Biochemical 82.8 (24/29) (63.5, 93.5) 10.0 (2/20) f(1.8, 33.1) 0.53 (0.05,
24 192
Histologic not available
Biochemical 84.6 (33/39) (68.8, 93.6) 22.2 (2/9) (3.9, 59.8) 1.57 (0.13,
48 12
Histologic not available
Biochemical 86.0'(37/43' I \ I
'71.4 94.2' , .J\
25.0 '2/8' I
(4.5, 64.4' l15.55)
2.06 (0.16,
PMA P080026: FDA Sumnmary of Safety and Effectiveness Data page 55
_ _ _ _ _ _ _ _ _ _ _ _ _ _ _ _ _ _ _ _ _ _ _
___________
______________
.
___________ ___________
______________ ____________ ____________ _____
________ ____ __
1_09__0_3.82
________________________________________
~
~~~~
_____

12 240 Histologic 85,7 (6/7) (42.0, 99.2) 25.0 (3/12) (6.7, 57.2 .00 (0.12, 122.23)
Biochemical 78.3 (18/23) (55.8, 91.7) 6.3 (1/16) (0.3, 32.3) ~~~~~~~~~~~~~~~~~~~~~~~0.24(0.00,
2.00, 2.5 8)
24 240 Histologic 100.0 (69.9, 42.9 (3/7) (11.8, 79.8) >8.25
Biochemical (12/12)
80,0 (24/30) 100.0)
(60.9, 91.6) 111.1I(1 /9) (0.,6, 49.3) 0.50 (0.01,
5.31)
48 240 Histologic. 100.0
(12/12) (69.9,
100.0)
42.9 (3/7) (11.8, 79.8) >8.25
Biochemical 80.6 (25/31) (61.9, 91.9) 11.1(1/9) (0.6, 49.3) ___0_5
0.5 1,
aThe odds ratio calculations are undefined when NPV is 100% or PPV is 100% or missing. Where the
denominators for both the NPV and PPV are greater than five, a "minimum" odds ratio was determined by subtracting one specimen from the numerator of the 100% parameter estimate (NPV or PPV).
An association with, rather than prediction of. clinical responses is demonstrated when measurina the viral response at Week 48.
The table below shows PPV, NPV and OR results for a combination of both histologic and biochemical responses. PPV for the association of viral response at 12, 24 and 48 weeks (when defined as <2000 IU/mL with the combination of both responses
(histologic and biochemical) (12/12) 19037)at Week 240 ranges from 85% to 100% (however 95% C>
is wide and OR is not significant with the available population).
PPV, NPV, and Odds Ratio (OR) for a combination of histologic and biochemical responses during treatment predicted by an early vital response (< 2000 IU/mL) in HiBeAg-negative subjects:
Week of Viral
Response
Week of Clinical
Response
PPV (%) (Proportion) (95% CI)
NPV(% (Proportion)
NPV (95% CT) (950/ Odds'Ratio CI)
12 48 60.0 (33/55) (45.9, 72.7) (%1 47 (34.7, 67.8) 1.58 (0.63, 3.99)
69,752(0.01,
12 96 55.6 (5/9) (22.7, 84.7) 50.0(3/6) (13.9, 86.1) 1.25 (0.10, 15.38)
24 96 61.5 (8/13) (32.3, 84.9) 100.0 (3/3) (31.0, 100.0)*
48 96 64.3 (9/14) (35.6, 86.0) 75.0 (3/4) (21.9, 98.7) 5.40 (0.30, 314.24)
12 240 85.7 (6/7) (42.0, 99.2) 25.0 (3/12) (6.7, 57.2) 2.00(0.12, 122.23)
24, 240 100.0 (12/12) (69.9, 100.0) 42.9 (3/7) (11.8, 79.8) >8.25a
48 240 100.0 (12/12) (69.9, 100.0) 42.9 (3/7) (11.8, 79.8) >8.25a *5Undefined (division by zero).
aThe odds ratio calculations are undefined when NPV is 100% or PPV is I00% or missing. Where the
denominators for both the NPV and PPV are greater than five, a "minimum" odds ratio was determined by subtracting one specimen from the numerator of the 100% parameter estimate (NPV or PPV).
An association with, rather than prediction of, clinical responses is demonstrated when measuring the viral response at Week 48.
PMA P080026: FDA Summary of Safety and Effectiveness Data page 56
12~~__ _ _ _ _ _ _ _ __ _ _ _ _ _ _ _ _ _ _ _ _ _ _ _ _ _ _
____ ________ ________ _____ ___ ____ ____ ____ ___ ____ ____ ___
240
_____ _____________
12
wieadO is~~~~~~~~~~~~~~~~~~ sntsgiiatwihteaalbepplto
~

Viral Response Ž 2 Log lU/niL Decrease
As shown in the table below, viral response at Weeks 12, 24, 48, when defined as?> 2 log decrease in value from the screening viral load result, is informative (i.e., lower limits of the 95% CIs exceed 1)in predictihg biochernical response at Week 48 of treatment. Viral response at weeks 12 and 48 is also informative for predicting biochemical response at week 96 on treatment.
The PPV for the association of viral response at weeks 12, 24 and 48 and histologic response at the end of the study (240 weeks) was 76.9 %, 86.7%, and 82.4, respectively. The PPV for the association of viral response and biochemical response was > 78.9% for biochemical response at Week 48 and remained consistent through the end of the study.
PPV, NPV, and Odds Ratio for individual clinical responses during treatment predicted by early viral response (Ž 2 Log fU/mL decrease) in HBeAg-negative subj ects:
Week of Viral
Response
Week of Clinical
Response
Clinical
Response
PPV ()
(Proportion)
PPV
(95% CI)
NPV(%
(Proportion)
NPV
(95% CI
Odds Ratio
(95% CI)
12 4845114
Histoogic 71.2 (52/73) (59.3, 80.9) 37.5 (9/24) 11.,92.4930.49
Biochemical 83.1 (64/77) (72.5, 90.4) 47.8 (11/23) (27.4, 68.9) 43.51 (1.44
Histologic 70.8 (63/89) (60.0, 79.7) 27.3 (3/11) (7.3, 60.7) (091448
24 48 Biochemical 78.9 (71/90) (68.8, 86.5) 54.5 (6/l1) (24.6, 81.9)
~~~~~~~~~~~~~~~~~~~~~~~4.48(1.00, 20.41)
48 48 ~~Histologic 68.0 (66/97) (57.7, 76.9) 22.2 (2/9) (3.9, 59.8) 0.61 (0.06,
3.46)
Biochemical 83.3 (80/96) (74.0, 89.9) 75.0 (9/12) (42.8, 93.3) 92.00(12)
12 96 ~~~Histologic 83.3 (10/12) (50.9, 97.1) 0.0 (0/3) (0.0, 69.0) 15(.31)
Biochemical 84.1 (37/44) (69.3, 92.8) 50.0 (7/14) . (24.0, 76.0) .5221.4.0)
24 967
Histoogic 84.6 (11/13) (53.7, 97.3) 33.3 (1/3) (1.8,875 2-7(0.03,
Biochemical 81.3 (39/48) (66.9, 90.6) 55.6 (5/9) (22.7, 84.7) 5.42 (0.92, 32.22)
48 96 ~~Histologic 82.4 (14/17) (55.8, 95.3) 0.0 (0/1) (0.0, 94.5) 0.00 (0.00,
-95.00)
Biochemical 80.0 (44/55) (66.6, 89.1) 80.0 (4/5) (29.9, 98.9) 86050(-2)
12 144 Histologic not available
-2.14 Biochemical 75,0 (33/44) (59.4, 86.3) 41.7 (5/12) (16.5, 71.4)
(0.44, 9.72)
24 144 Histologic not available
PMIA P080026: FDA Summary of Safety and Effectiveness Data page 57
61
__ __ __ __ __ _ _ _ __ __ __ _ __ __ __ _

Biochemical 72.9 (35/48) (57.9, 84.3) 37.5 (3/8) (10.2, 74.1) 0.21.62 (0.22,
48 144 Histologic not available
Biochemical 72.7 (40/55) (58.8, 83.5) 50.0 (2/4) (9.2, 90.8) 2.7(.82.67 (0.18,39.14)
Week of Viral
Response RespnseRespnse
Week of Clinical
Response
Clinical
Response
PPV (%)
(Proportion)
PPv
(95% Cl)
NPV (%)
(Proportion)
NPV
(95% Cl)
Odds Ratio
(95% CI)
12 192
Histologic not available
Biochemical 89.7 (35/39) (74.8, 96.7) [i3.75_(0.44,
30.0 (3/10) (8.1, 64.6) 27.27)
24 192
Histologic not available
Biochemical 85.4 (35/41) (70.1, 93.9) 28.6 (2/7) (5.1, 69.7) 2[ 3(.82.33 (0.18,18.75)
48 192
Histologic not available
Biochemical 87.5 (42/48) (74.1, 94.8) 66.7 (2/3) (12.5, 98.2) 14.00 (0.59,
844.47)
12 24 Histologic 76.9 (10/13) (46.0, 93.8) 16.7 (1/6) (0.9, 63.5) 67 (0.01,
11.40)
Biochemical 82.8 (24/29) (63.5, 93.5) 10.0 (1/10) (0.5, 45.9) 0.53 (0.01,5.0)
24 240 Histologic 86.7 (13/15) (58.4, 97.7) 25.0 (1/4) (1.3, 78.1) 5.35
54.35)Biochemical 78.8 (26/33) (60.6, 90.4) 0.0 (0/6) (0.0,48.3)
( 0 (0.00,2.99)
48 240 Histologic 82.4 (14/17) (55.8, 95.3) 0.0 (0/2) (0.0, 80.2)
0.00 (0.00, 20.71)
Biochemical 81.6 (31/38) (65.1, 91.7) 0.0 (0/2) (0.0, 80.2) 0.)00 (0.00
0 17.04)
The table below shows PPV, NPV and OR results for a combination of both histologic and biochemical responses. PPV for the association of viral response at 12, 24 and 48 weeks (when defined as > 2 Log IU/mL decrease in value from the baseline viral load result) with the combination of both responses (histologic and biochemical) at Week 240 ranges from 76.9% to 86.7% (however 95% CI is wide, and OR is not significant with the available population).
PPV, NPV, and Odds Ratio (OR) for a combination of histologic and biochemical responses during treatment predicted by an early viral response ( > 2 Log IU/mL decrease) in HBeAg-negative subjects:
Week of Viral
Response
Week of Clinical
Response PPV %
(Proportion) PPV
(95% CO)
NPV % NPV %
(Proportion)
] NPV NPV
(95% CI) Odds Ratio (95%CI)
PMA P080026: FDA Summary of Safety and Effectiveness Data page 58
I I
62
I I ~ 1 Biochemical~~~~~~~~~~~~~~~.6
~~~~~~~~~~9.67)
-
_ _ _ _ _ _ _ _ _ _ _ _ _ _ _ _ _

12 48 61.4 (43/70) (49.0, 72.6) 63.6 (14/22) (40.8, 82.0) 2.79 (0.93, 8.68)
24 48 59.5 (50/84) (48.2, 69.9) 60.0 (6/10) (27.4, 86.3) 2.21 (0.48, 11.36)
48 48 60.4 (55/91) (49.6, 70.4) 88.9 (8/9) (50.7, 99.4) 12.22 (1.50, 551.92)
12 96 58.3 (7/12) (28.6, 83.5) 66.7 (2/3) (12.5, 98.2) 2.80 (0.11, 188.36)
24 96 53.8 (7/13) (26.1, 79.6) 66.7 (2/3) (12.5, 98.2) 2.33 (0.09, 157.00)
48 96 58.8 (10/17) (33.5, 80.6) 100.0 (1/1) (5.5, 100.0)
12 240 76.9 (10/13) (46.0, 93.8) 16.7 (1/6) (0.9, 63.5) 0.67 (0.01, 11.40)
24 240 86.7 (13/15) (58.4, 97.7) 25.0 (1/4) (13, 78.1) 2.17 (0.03, 54.35)
48 240 82.4 (14/17) (55.8, 95.3) 0.0 (0/2) (0.0,80.2) 0.00 (0.00, 20.71)
Undefined (Division by Zero) An association with, rather than prediction of, clinical responses is demonstrated when measuring the viral response at Week 48.
X. SUMMARY OF SUPPLEMENTAL CLINICAL INFORMATION
Guidelinesfor HB VDNA Testing in ClinicalPractice
Published guidelines and the medical literature support the importance of measuring HBV levels at baseline prior to treatment, and at intervals during treatment. 1.2,3 The American Association for the Study of Liver Disease (AASLD) Practice Guidelines state that serum HBV DNA quantification using highly sensitive assays with a wide dynamic range, such as real-time PCR technology, is a crucial component in the evaluation of chronically HBV infected patients and the assessment of the efficacy of antiviral treatment." 2 The most recent guidelines highlight the importance of serial testing of HBV DNA levels, and describe issues with using the specific cutoff values to define treatment indications and response. 1
XI. PANEL MEETING RECOMMENDATION AND FDA'S POST-PANEL ACTION
In accordance with the provisions of section 515(c)(2) of the act as amended by the Safe Medical Devices Act of 1990, this PMA was not referred tothe Microbiology Advisory Panel, an FDA advisory committee, for review and recommendation because the
I Lok ASF, McMahon BJ. Chronic hepatitis B: update 2009. AASLD Practice Guidelines. Hepatology 2009;50:661-662.
2 Lok ASF, McMahon BJ. Chronic hepatitis B.AASLD Practice Guidelines. Hepatology 2007;45:507-539.
3Keeffe EB, Dieterich DT, Han SB, Jacobson IM, Martin P, Schiff ER, Tobias H, Wright TL. A treatment algorithm for the management of chronic hepatitis B virus infection in the U.S. Clin Gastroenterol Hepatol 2004;2:87-106.
PMA P080026: FDA Summary of Safety and Effectiveness Data page 59 63

information in the PMA substantially duplicates information previously reviewed by this panel.
XI. CONCLUSION.S DRAWN FROM PRECLINICAL AND CLINICAL STUDIES
A. Safety Conclusions
Based on the results of the preclinical and clinical laboratory studies, Abbott RealTime HBV assay, when used according to the provided directions and in conjunction with other serological and clinical information, should be safe and pose minimal risk to the patient due to false test results.
B. Effectiveness Conclusions
The effectiveness of the Abbott RealTime HBV assay has been demonstrated for use in quantitation of Hepatitis B Virus (HBV) DNA in human serum or plasma. A reasonable determination of effectiveness of the Abbott RealTime HBV assay for aiding in the management of patients with chronic HBV infection undergoing antiviral therapy, by measuring HBV DNA levels at baseline and during treatment, to aid in assessing response to treatment in conjunction with other laboratory results and clinical information has been demonstrated.
C. Overall Conclusions
The data in this application support the reasonable assurance of safety and effectiveness of this device when used in accordance with the indications for use. The data from the nonclinical studies demonstrated acceptable analytical sensitivity, traceability, linearity, precision, and analytical specificity of the Abbott RealTime HBV assay when used according to the instructions for use as stated in the labeling, the warnings and precautions, and limitations sections of the labeling. The clinical studies and the statistical analysis of clinical data in this application has shown that viral response to treatment measured with Abbott RealTime HBV assay is informative for assessing the effect of treatment in patients with chronic hepatitis B, and that the assay is safe and effective when used according to the directions for use in the labeling.
Risk and benefit analysis: As a diagnostic test, the Abbott RealTime HBV assay involves removal of blood from an individual for testing purposes. This test presents no more of a safety hazard to an individual than is presented to an individual who is having their blood drawn for any other diagnostic evaluation. The benefits to chronically HBV-infected individuals undergoing antiviral therapy tested by the assay outweigh any potential adverse event or risk to the patient or user due to assay malfunction or operator error. The potential risks encountered with this in vitro diagnostic test are not unusual in the clinical laboratory setting. Appropriate warnings for these risks are contained in the labeling and package inserts for the device.
PMA P080026: FDA Summary of Safety and Effectiveness Data page 60
64

Standard good laboratory practices are considered sufficient to mitigate the risks to the end user.
XII. CDRH DECISION
CDRH issued an approval order on August 13, 2010. The final conditions of approval cited inthe approval order are described below.
The applicant's manufacturing facility was inspected and found to be in compliance with the device Quality System (QS) regulation (21 CFR 820).
XIII. APPROVAL SPECIFICATIONS
Directions for use: See device labeling.
Hazards to Health from Use of the Device: See Indications, Contraindications, Warnings, Precautions, and Adverse Events in the device labeling.
Post-approval Requirements and Restrictions: See approval order.
XIV. REFERENCES
1.Lok ASF, McMahon BJ. Chronic hepatitis B: update 2009. AASLD Practice
Guidelines. Hepatology 2009;50:661-662.
2. Lok ASF, McMahon BJ. Chronic hepatitis B. AASLD Practice Guidelines. Hepatology
2007;45:507-539.
3. Keeffe EB, Dieterich DT, Han SB, Jacobson IM, Martin P, Schiff ER, Tobias H,
Wright TL. A treatment algorithm for the management of chronic hepatitis B virus
infection in the U.S. Clin Gastroenterol Hepatol 2004;2:87-106.4.
PMA P680026: FDA Summary of Safety and Effectiveness Data page 61
65