summary of experiment series e4.1 results (ignition ... · summary of experiment series e4.1...
TRANSCRIPT
Pre-normative REsearch for Safe use of Liquid Hydrogen (PRESLHY)
Fuel Cells and Hydrogen Joint Undertaking (FCH 2 JU)
Grant Agreement Number 779613
Summary of experiment series E4.1 results (Ignition parameters)
Deliverable Number: 4.4 (D21)
Version 1.0
Author(s): C. Proust, INERIS
Submitted Date: 25 July 2019
Due Date: 30 November 2018
Report Classification: Confidential
Grant Agreement No: 779613 D4.4 Summary of E4.1 results
ii
History
Nr. Date Changes/Author
1.0 25.7.2019 Original version by C. Proust/INERIS
Approvals
Version Name Organisation Date
1.0 Alexander Lelyakin KIT 9.8.2019
1.0 Simon Coldrick HSE 12.8.2019
Key words
Cryogenic temperature, flowing mixture, minimum ignition energy, hot surface ignition,
laminar flame propagation and explosion
Acknowledgements, Preface and Disclaimer
The PRESLHY project has received funding from the Fuel Cells and Hydrogen 2 Joint
Undertaking under the European Union’s Horizon 2020 research and innovation programme
under grant agreement No 779613.
The test program for the investigation of the ignition properties of a cryogenic hydrogen air
flow was spilt into two parts. The first is devoted to the ignition of flowing (up to, 30 m/s) and
cold (down to -130°C) hydrogen-air mixtures and the second to the spark ignition of the same
mixtures. Given the very sensitive aspects associated with controlling very weak electrical
sparks, requiring a highly controlled atmosphere, the same apparatus could not be used for both
measurement series.
After some preliminary field tests, it was decided to run the hot surface ignition tests in the
open atmosphere outside using a specially constructed tunnel. The spark energy measurements
were done in a transparent vessel in a laboratory. The flowing aspect was dropped since
ignition is immediate so that for the ignition process, the atmosphere is still. The possibility for
the initial flame kernel to spread out in the flow is a distinct flame propagation problem.
The hot surface ignition work is completed now and is presented herein. The spark generator is
available and was tested against various mixtures including hydrogen-air. Cold tests will be
performed in the near future. The hardware (refrigerating system, chamber) is under design and
construction.

Grant Agreement No: 779613 D4.4 Summary of E4.1 results
iii
This report contains the “meta data” of the respective experiments, providing description of the
experimental set-up, sensors and results. Detailed evaluation of the results, as well as any
modelling work is excluded here and left for subsequent work.
Despite the care that was taken while preparing this document the following disclaimer applies:
The information in this document is provided as is and no guarantee or warranty is given that
the information is fit for any particular purpose. The user thereof employs the information at
his/her sole risk and liability.
The document reflects only the authors’ views. INERIS and the European Union are not liable
for any use that may be made of the information contained therein.
Grant Agreement No: 779613 D4.4 Summary of E4.1 results
iv
Publishable Short Summary
This report describes a test programme for the investigation of the ignition properties of a
cryogenic hydrogen air flow. The programme was spilt into two parts. Approximately 200
experiments were made with the facilities described in this report varying the hydrogen
concentration in air (between 4 and 75%), the flow velocity, U, (0 to 35 m/s) and the temperature
of the mixture T0 (ambient to -130 °C). Note that the latter temperature is the lowest that can be
achieved in a jet of LH2 and air at the upper flammability limit.
The device used to measure the hot surface temperature (Tpcrit) is a straight horizontal tube, 10 cm
diameter, 2.5 m long equipped with a flange in which gaseous hydrogen, gaseous nitrogen,
gaseous oxygen and when required liquid nitrogen are admitted and mixed. This arrangement
enables independent variation of %H2, U and T0. The hot body is a nichrome wire spiralled
around a 10 mm alumina core. It is electrically heated and the temperature can be varied.
The device used to measure the minimum ignition energy (MIE) is a transparent chamber of a
few litres capacity. The aim is to be able to measure the maximum explosion pressure, possibly
the minimum flame kernel and the flame velocity in addition of the MIE since all these
parameters are coupled (deliverable D4.1). Currently, the spark generator is operational and has
been tested on propane-air and hydrogen-air mixtures. The corresponding results are presented
in this report. The refrigerating device is under construction and the rest of the tests will be
performed subsequently.
A surprising result was obtained which was not expected. Tpcrit does not vary with %H2, U or
T0 and is close to 600°C, very close to the autoignition temperature (AIT). For standard
hydrocarbons, Tpcrit is much larger than AIT.
Grant Agreement No: 779613 D4.4 Summary of E4.1 results
v
Table of Contents
Key words .................................................................................................................................. ii
Acknowledgements, Preface and Disclaimer ........................................................................ ii
Publishable Short Summary ...................................................................................................iv
1 Purpose of the Tests – Knowledge Gap Addressed ..................................................... 1
2 Measurement of Tpcrit for LH2 releases ........................................................................... 1
2.1 Hardware and measurements ...................................................................................... 1
2.2 Results .......................................................................................................................... 4
3 Measurement of MIE for cold H2-air mixtures ................................................................ 6
3.1 Hardware and measurements ...................................................................................... 6
3.2 Preliminary results ...................................................................................................... 13
Grant Agreement No: 779613 D4.4 Summary of E4.1 results
1
1 Purpose of the Tests – Knowledge Gap Addressed
In work package 4.1 of the PRESLHY project, the fundamental ignition parameters of
hydrogen air mixtures issued from a release of LH2 have to be measured. To the knowledge
of the present authors this has never been done before.
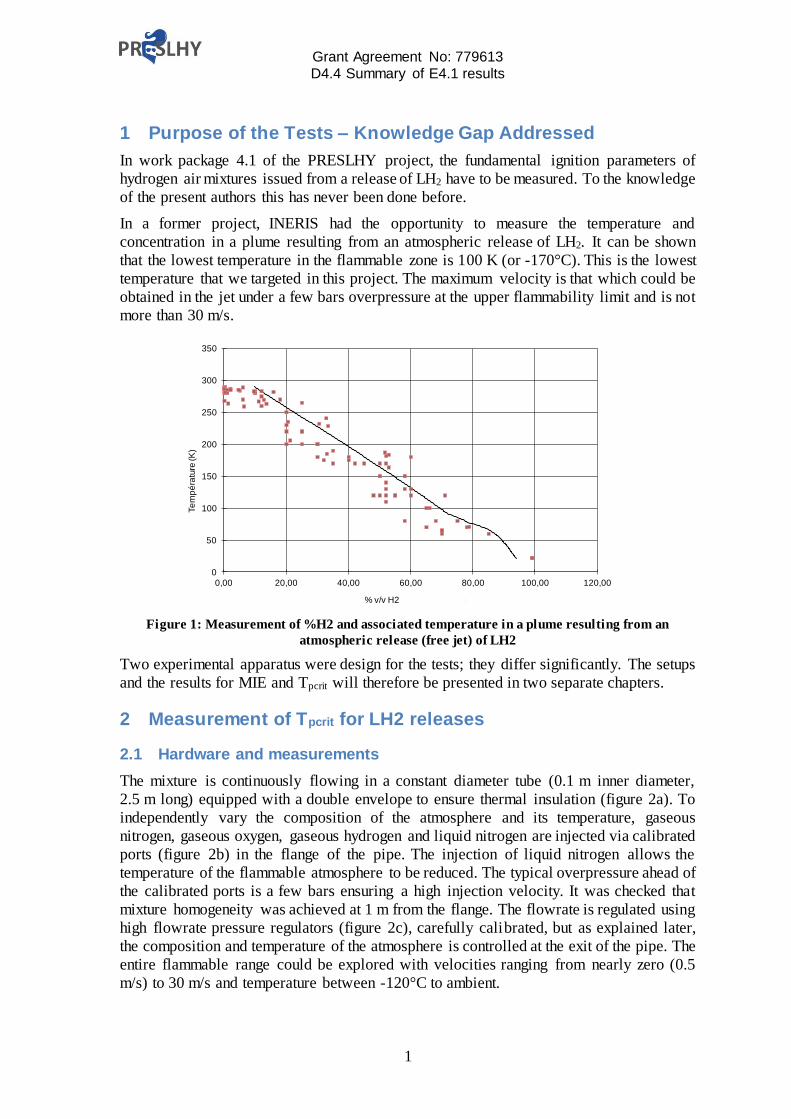
In a former project, INERIS had the opportunity to measure the temperature and
concentration in a plume resulting from an atmospheric release of LH2. It can be shown
that the lowest temperature in the flammable zone is 100 K (or -170°C). This is the lowest
temperature that we targeted in this project. The maximum velocity is that which could be
obtained in the jet under a few bars overpressure at the upper flammability limit and is not
more than 30 m/s.
Figure 1: Measurement of %H2 and associated temperature in a plume resulting from an
atmospheric release (free jet) of LH2
Two experimental apparatus were design for the tests; they differ significantly. The setups
and the results for MIE and Tpcrit will therefore be presented in two separate chapters.
2 Measurement of Tpcrit for LH2 releases
2.1 Hardware and measurements
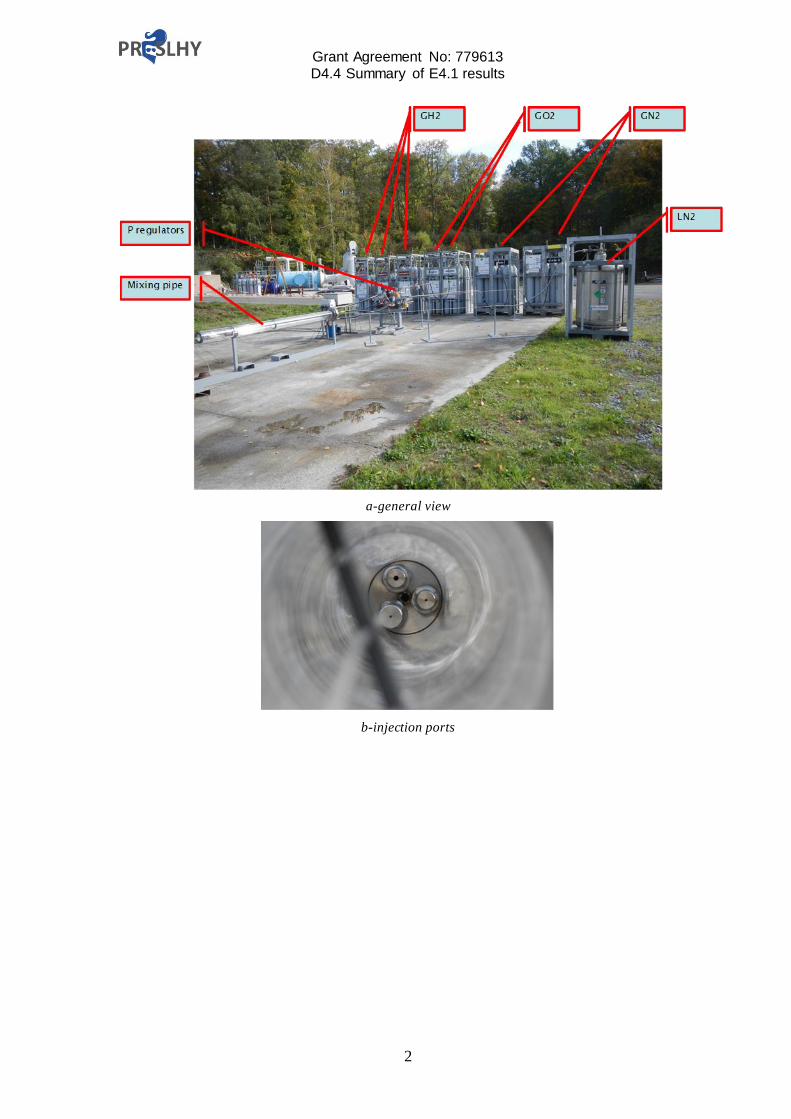
The mixture is continuously flowing in a constant diameter tube (0.1 m inner diameter,
2.5 m long) equipped with a double envelope to ensure thermal insulation (figure 2a). To
independently vary the composition of the atmosphere and its temperature, gaseous
nitrogen, gaseous oxygen, gaseous hydrogen and liquid nitrogen are injected via calibrated
ports (figure 2b) in the flange of the pipe. The injection of liquid nitrogen allows the
temperature of the flammable atmosphere to be reduced. The typical overpressure ahead of
the calibrated ports is a few bars ensuring a high injection velocity. It was checked that
mixture homogeneity was achieved at 1 m from the flange. The flowrate is regulated using
high flowrate pressure regulators (figure 2c), carefully calibrated, but as explained later,
the composition and temperature of the atmosphere is controlled at the exit of the pipe. The
entire flammable range could be explored with velocities ranging from nearly zero (0.5
m/s) to 30 m/s and temperature between -120°C to ambient.
0
50
100
150
200
250
300
350
0,00 20,00 40,00 60,00 80,00 100,00 120,00
Te
mp
éra
ture
(K
)
% v/v H2 dans le mélange
Grant Agreement No: 779613 D4.4 Summary of E4.1 results
2
a-general view
b-injection ports
Grant Agreement No: 779613 D4.4 Summary of E4.1 results
3
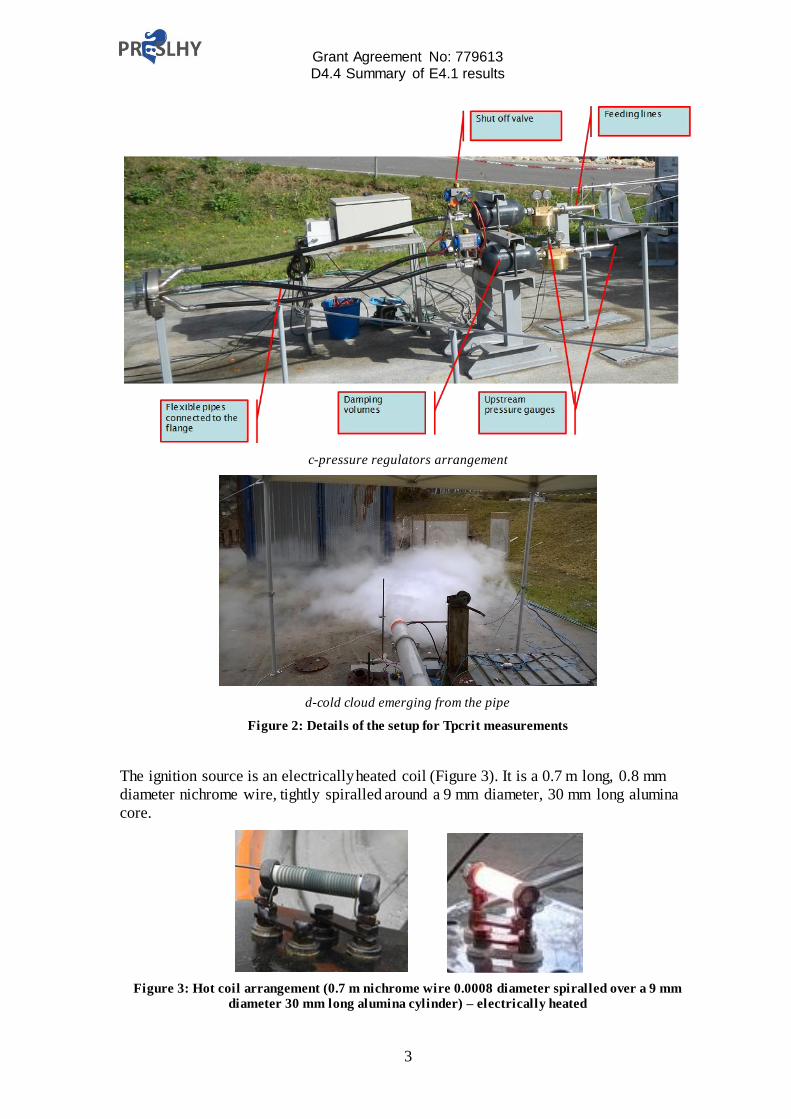
c-pressure regulators arrangement
d-cold cloud emerging from the pipe
Figure 2: Details of the setup for Tpcrit measurements
The ignition source is an electrically heated coil (Figure 3). It is a 0.7 m long, 0.8 mm
diameter nichrome wire, tightly spiralled around a 9 mm diameter, 30 mm long alumina
core.
Figure 3: Hot coil arrangement (0.7 m nichrome wire 0.0008 diameter spiralled over a 9 mm
diameter 30 mm long alumina cylinder) – electrically heated
Grant Agreement No: 779613 D4.4 Summary of E4.1 results
4
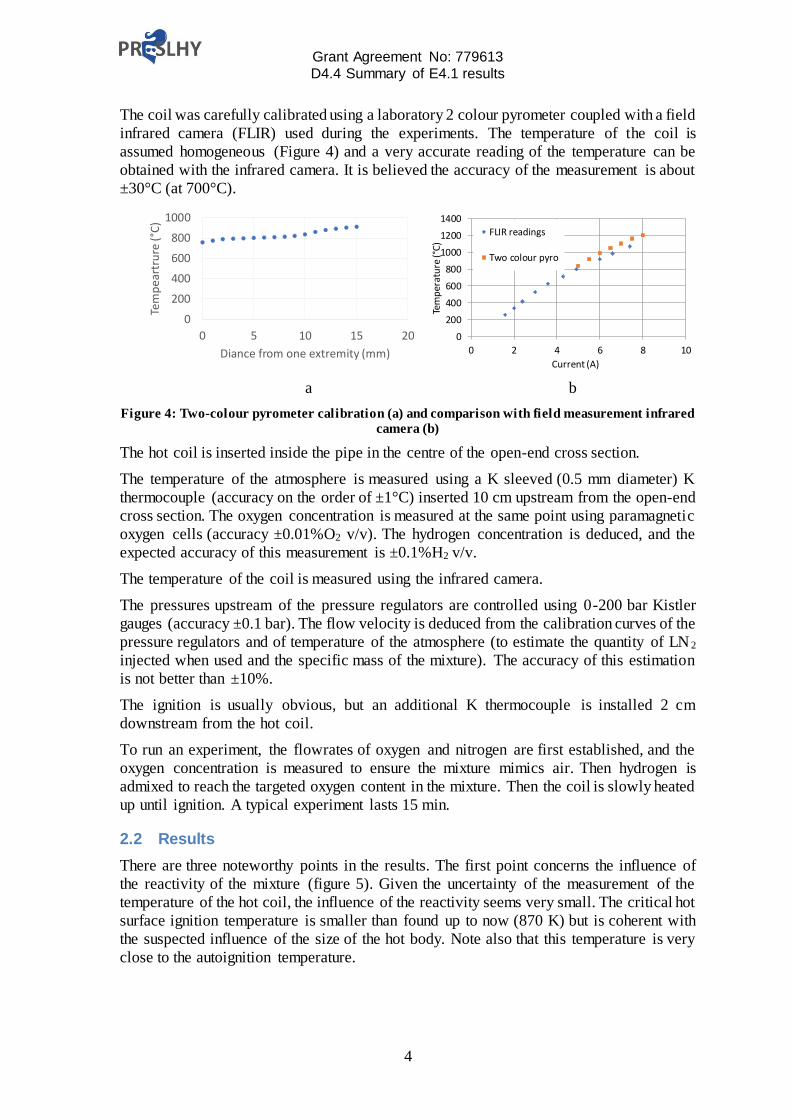
The coil was carefully calibrated using a laboratory 2 colour pyrometer coupled with a field
infrared camera (FLIR) used during the experiments. The temperature of the coil is
assumed homogeneous (Figure 4) and a very accurate reading of the temperature can be
obtained with the infrared camera. It is believed the accuracy of the measurement is about
±30°C (at 700°C).
a b
Figure 4: Two-colour pyrometer calibration (a) and comparison with field measurement infrared
camera (b)
The hot coil is inserted inside the pipe in the centre of the open-end cross section.
The temperature of the atmosphere is measured using a K sleeved (0.5 mm diameter) K
thermocouple (accuracy on the order of ±1°C) inserted 10 cm upstream from the open-end
cross section. The oxygen concentration is measured at the same point using paramagnetic
oxygen cells (accuracy ±0.01%O2 v/v). The hydrogen concentration is deduced, and the
expected accuracy of this measurement is ±0.1%H2 v/v.
The temperature of the coil is measured using the infrared camera.
The pressures upstream of the pressure regulators are controlled using 0-200 bar Kistler
gauges (accuracy ±0.1 bar). The flow velocity is deduced from the calibration curves of the
pressure regulators and of temperature of the atmosphere (to estimate the quantity of LN 2
injected when used and the specific mass of the mixture). The accuracy of this estimation
is not better than ±10%.
The ignition is usually obvious, but an additional K thermocouple is installed 2 cm
downstream from the hot coil.
To run an experiment, the flowrates of oxygen and nitrogen are first established, and the
oxygen concentration is measured to ensure the mixture mimics air. Then hydrogen is
admixed to reach the targeted oxygen content in the mixture. Then the coil is slowly heated
up until ignition. A typical experiment lasts 15 min.
2.2 Results
There are three noteworthy points in the results. The first point concerns the influence of
the reactivity of the mixture (figure 5). Given the uncertainty of the measurement of the
temperature of the hot coil, the influence of the reactivity seems very small. The critical hot
surface ignition temperature is smaller than found up to now (870 K) but is coherent with
the suspected influence of the size of the hot body. Note also that this temperature is very
close to the autoignition temperature.
0
200
400
600
800
1000
0 5 10 15 20
Tem
pea
rtru
re (
°C)
Diance from one extremity (mm)
0
200
400
600
800
1000
1200
1400
0 2 4 6 8 10
Tem
per
atu
re ( °
C)
Current (A)
FLIR readings
Two colour pyro
Grant Agreement No: 779613 D4.4 Summary of E4.1 results
5
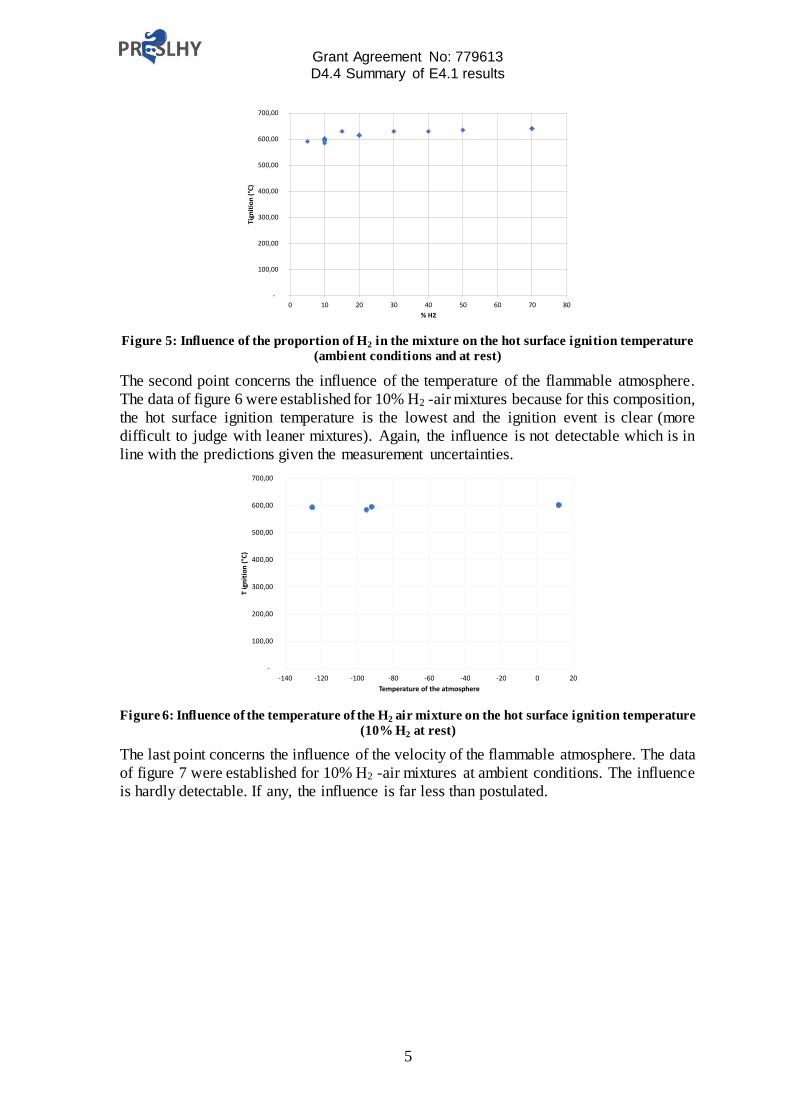
Figure 5: Influence of the proportion of H2 in the mixture on the hot surface ignition temperature
(ambient conditions and at rest)
The second point concerns the influence of the temperature of the flammable atmosphere.
The data of figure 6 were established for 10% H2 -air mixtures because for this composition,
the hot surface ignition temperature is the lowest and the ignition event is clear (more
difficult to judge with leaner mixtures). Again, the influence is not detectable which is in
line with the predictions given the measurement uncertainties.
Figure 6: Influence of the temperature of the H2 air mixture on the hot surface ignition temperature
(10% H2 at rest)
The last point concerns the influence of the velocity of the flammable atmosphere. The data
of figure 7 were established for 10% H2 -air mixtures at ambient conditions. The influence
is hardly detectable. If any, the influence is far less than postulated.
-
100,00
200,00
300,00
400,00
500,00
600,00
700,00
0 10 20 30 40 50 60 70 80
Tign
itio
n (
°C)
% H2
-
100,00
200,00
300,00
400,00
500,00
600,00
700,00
-140 -120 -100 -80 -60 -40 -20 0 20
T ig
nit
ion
(°C
)
Temperature of the atmosphere
Grant Agreement No: 779613 D4.4 Summary of E4.1 results
6
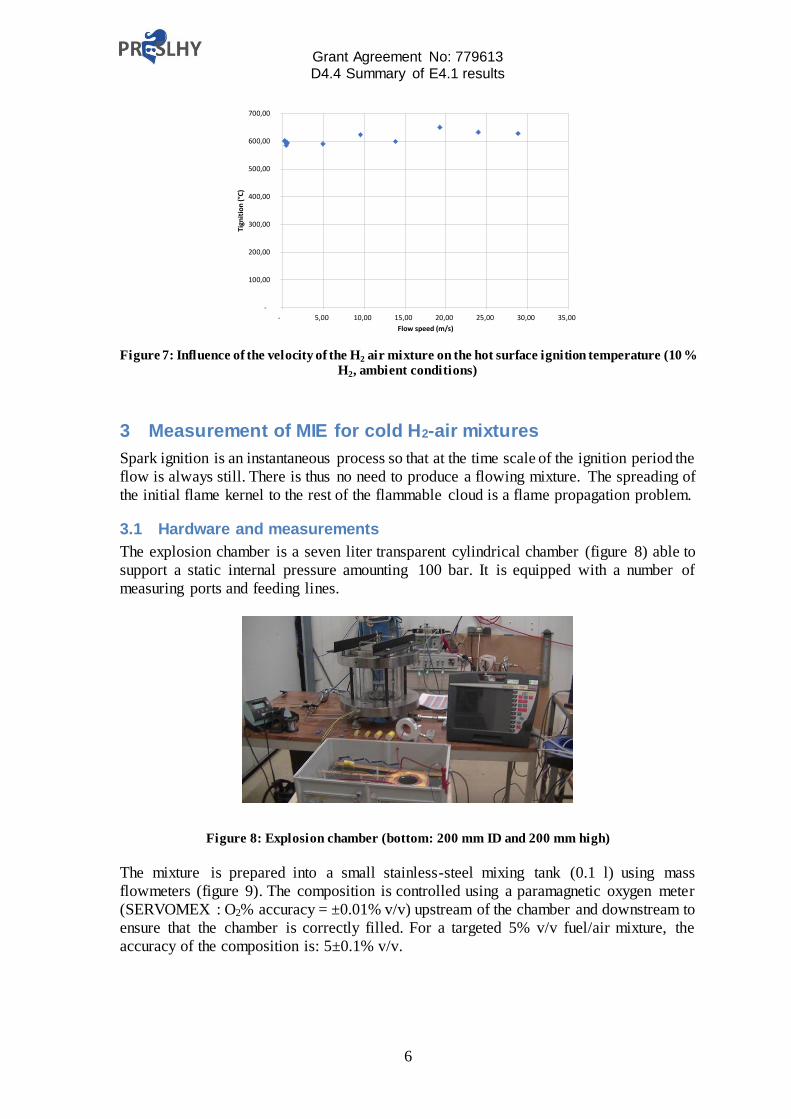
Figure 7: Influence of the velocity of the H2 air mixture on the hot surface ignition temperature (10 %
H2, ambient conditions)
3 Measurement of MIE for cold H2-air mixtures
Spark ignition is an instantaneous process so that at the time scale of the ignition period the
flow is always still. There is thus no need to produce a flowing mixture. The spreading of
the initial flame kernel to the rest of the flammable cloud is a flame propagation problem.
3.1 Hardware and measurements
The explosion chamber is a seven liter transparent cylindrical chamber (figure 8) able to
support a static internal pressure amounting 100 bar. It is equipped with a number of
measuring ports and feeding lines.
Figure 8: Explosion chamber (bottom: 200 mm ID and 200 mm high)
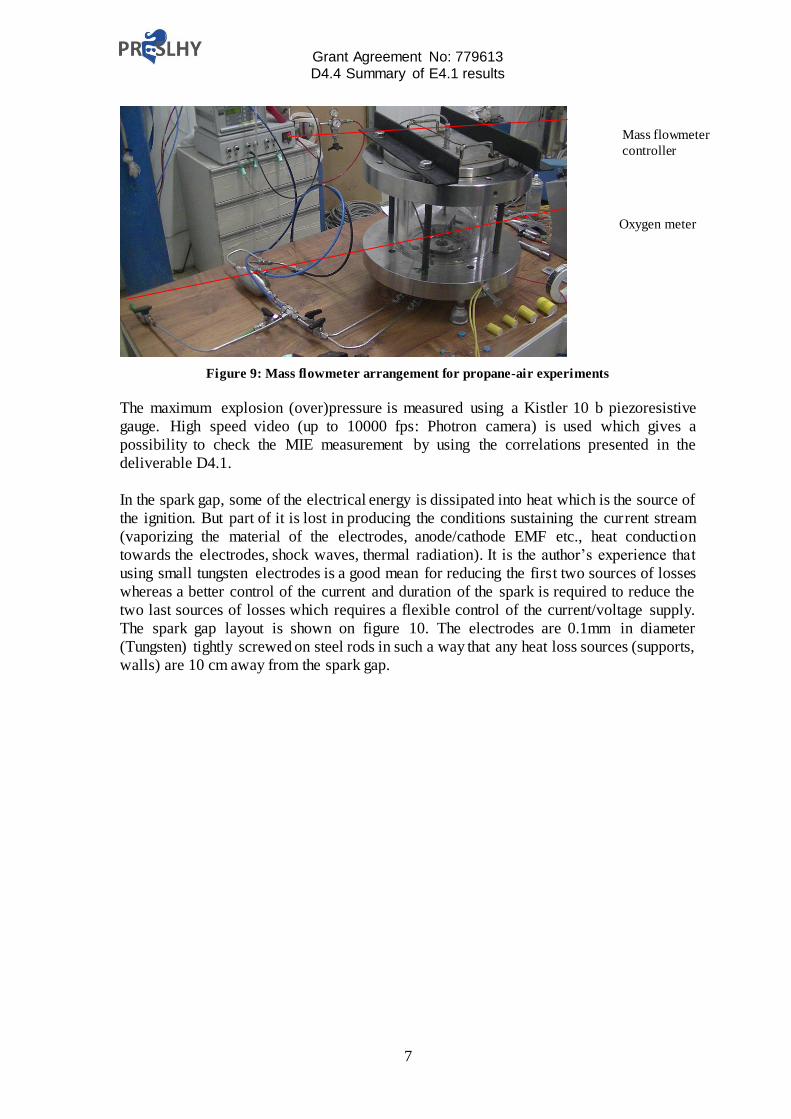
The mixture is prepared into a small stainless-steel mixing tank (0.1 l) using mass
flowmeters (figure 9). The composition is controlled using a paramagnetic oxygen meter
(SERVOMEX : O2% accuracy = ±0.01% v/v) upstream of the chamber and downstream to
ensure that the chamber is correctly filled. For a targeted 5% v/v fuel/air mixture, the
accuracy of the composition is: 5±0.1% v/v.
-
100,00
200,00
300,00
400,00
500,00
600,00
700,00
- 5,00 10,00 15,00 20,00 25,00 30,00 35,00
Tign
itio
n (
°C)
Flow speed (m/s)
Grant Agreement No: 779613 D4.4 Summary of E4.1 results
7
Figure 9: Mass flowmeter arrangement for propane-air experiments
The maximum explosion (over)pressure is measured using a Kistler 10 b piezoresistive
gauge. High speed video (up to 10000 fps: Photron camera) is used which gives a
possibility to check the MIE measurement by using the correlations presented in the
deliverable D4.1.
In the spark gap, some of the electrical energy is dissipated into heat which is the source of
the ignition. But part of it is lost in producing the conditions sustaining the current stream
(vaporizing the material of the electrodes, anode/cathode EMF etc., heat conduction
towards the electrodes, shock waves, thermal radiation). It is the author’s experience that
using small tungsten electrodes is a good mean for reducing the first two sources of losses
whereas a better control of the current and duration of the spark is required to reduce the
two last sources of losses which requires a flexible control of the current/voltage supply.
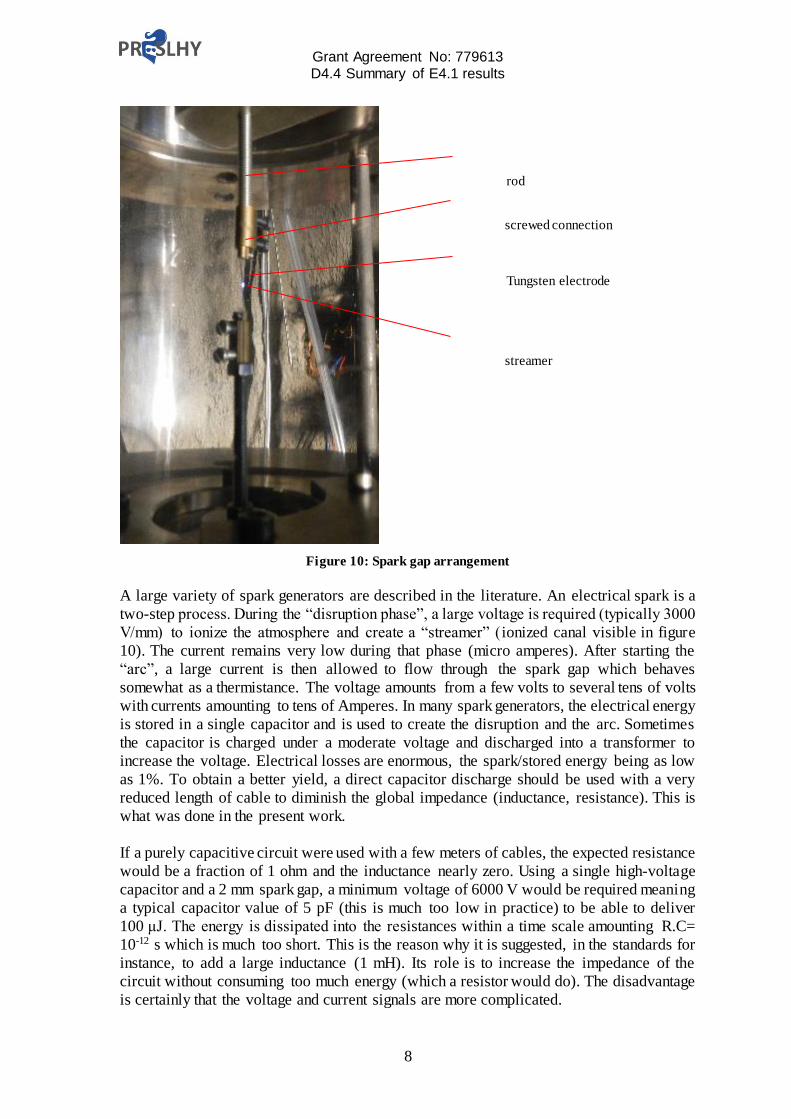
The spark gap layout is shown on figure 10. The electrodes are 0.1mm in diameter
(Tungsten) tightly screwed on steel rods in such a way that any heat loss sources (supports,
walls) are 10 cm away from the spark gap.
Mass flowmeter
controller
Oxygen meter
Grant Agreement No: 779613 D4.4 Summary of E4.1 results
8
Figure 10: Spark gap arrangement
A large variety of spark generators are described in the literature. An electrical spark is a
two-step process. During the “disruption phase”, a large voltage is required (typically 3000
V/mm) to ionize the atmosphere and create a “streamer” (ionized canal visible in figure
10). The current remains very low during that phase (micro amperes). After starting the
“arc”, a large current is then allowed to flow through the spark gap which behaves
somewhat as a thermistance. The voltage amounts from a few volts to several tens of volts
with currents amounting to tens of Amperes. In many spark generators, the electrical energy
is stored in a single capacitor and is used to create the disruption and the arc. Sometimes
the capacitor is charged under a moderate voltage and discharged into a transformer to
increase the voltage. Electrical losses are enormous, the spark/stored energy being as low
as 1%. To obtain a better yield, a direct capacitor discharge should be used with a very
reduced length of cable to diminish the global impedance (inductance, resistance). This is
what was done in the present work.
If a purely capacitive circuit were used with a few meters of cables, the expected resistance
would be a fraction of 1 ohm and the inductance nearly zero. Using a single high-voltage
capacitor and a 2 mm spark gap, a minimum voltage of 6000 V would be required meaning
a typical capacitor value of 5 pF (this is much too low in practice) to be able to deliver
100 μJ. The energy is dissipated into the resistances within a time scale amounting R.C=
10-12 s which is much too short. This is the reason why it is suggested, in the standards for
instance, to add a large inductance (1 mH). Its role is to increase the impedance of the
circuit without consuming too much energy (which a resistor would do). The disadvantage
is certainly that the voltage and current signals are more complicated.
rod
screwed connection
Tungsten electrode
streamer
Grant Agreement No: 779613 D4.4 Summary of E4.1 results
9
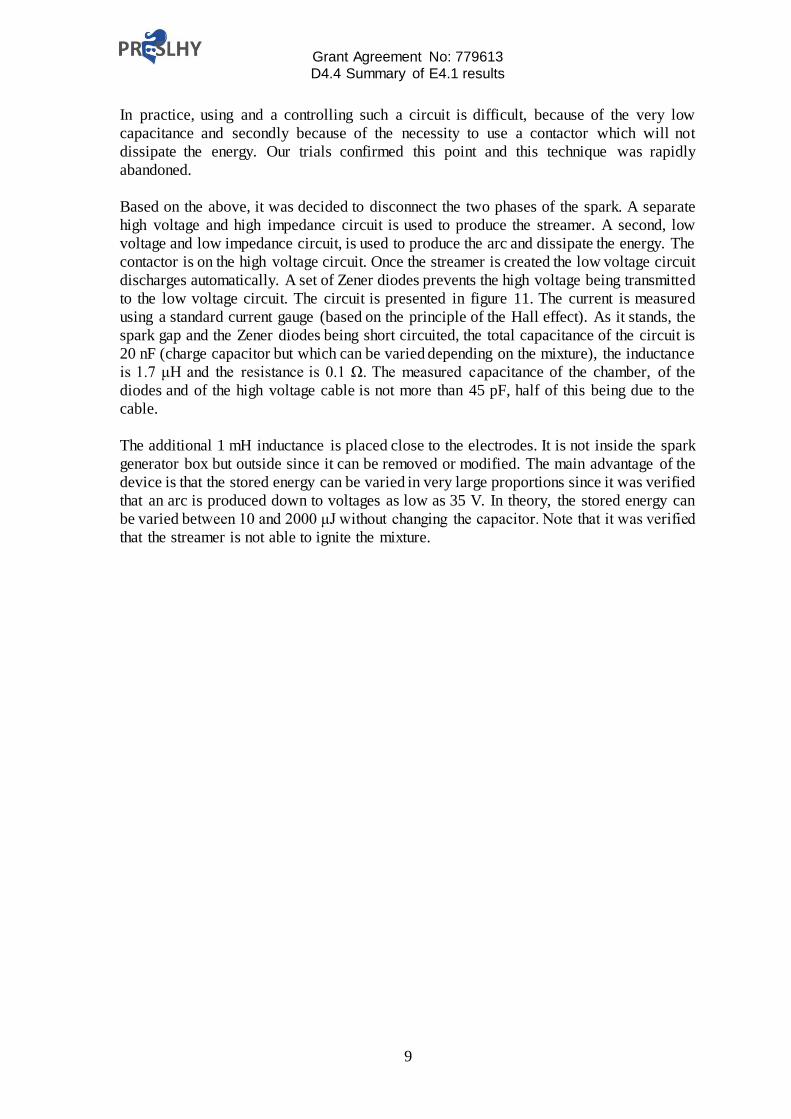
In practice, using and a controlling such a circuit is difficult, because of the very low
capacitance and secondly because of the necessity to use a contactor which will not
dissipate the energy. Our trials confirmed this point and this technique was rapidly
abandoned.
Based on the above, it was decided to disconnect the two phases of the spark. A separate
high voltage and high impedance circuit is used to produce the streamer. A second, low
voltage and low impedance circuit, is used to produce the arc and dissipate the energy. The
contactor is on the high voltage circuit. Once the streamer is created the low voltage circuit
discharges automatically. A set of Zener diodes prevents the high voltage being transmitted
to the low voltage circuit. The circuit is presented in figure 11. The current is measured
using a standard current gauge (based on the principle of the Hall effect). As it stands, the
spark gap and the Zener diodes being short circuited, the total capacitance of the circuit is
20 nF (charge capacitor but which can be varied depending on the mixture), the inductance
is 1.7 μH and the resistance is 0.1 Ω. The measured capacitance of the chamber, of the
diodes and of the high voltage cable is not more than 45 pF, half of this being due to the
cable.
The additional 1 mH inductance is placed close to the electrodes. It is not inside the spark
generator box but outside since it can be removed or modified. The main advantage of the
device is that the stored energy can be varied in very large proportions since it was verified
that an arc is produced down to voltages as low as 35 V. In theory, the stored energy can
be varied between 10 and 2000 μJ without changing the capacitor. Note that it was verified
that the streamer is not able to ignite the mixture.
Grant Agreement No: 779613 D4.4 Summary of E4.1 results
10
Figure 11: Scheme of the electrical circuit and photograph
Tests were performed without the high voltage part (to limit the noise affecting the very
beginning of the signal at the start of the breakdown). In the first test (figure 12), the diodes
were removed and the discharge was obtained by short circuiting manually the electrodes.
Doing this, a short spark is produced over a length amounting to a fraction of a mm during
some tens of microseconds.
6 KV
109 MΩ
0-400 V
Spark gap
11 MΩ
0.1 Ω
0 – 1 mH
Zener diodes
20 nF
U
I
Grant Agreement No: 779613 D4.4 Summary of E4.1 results
11
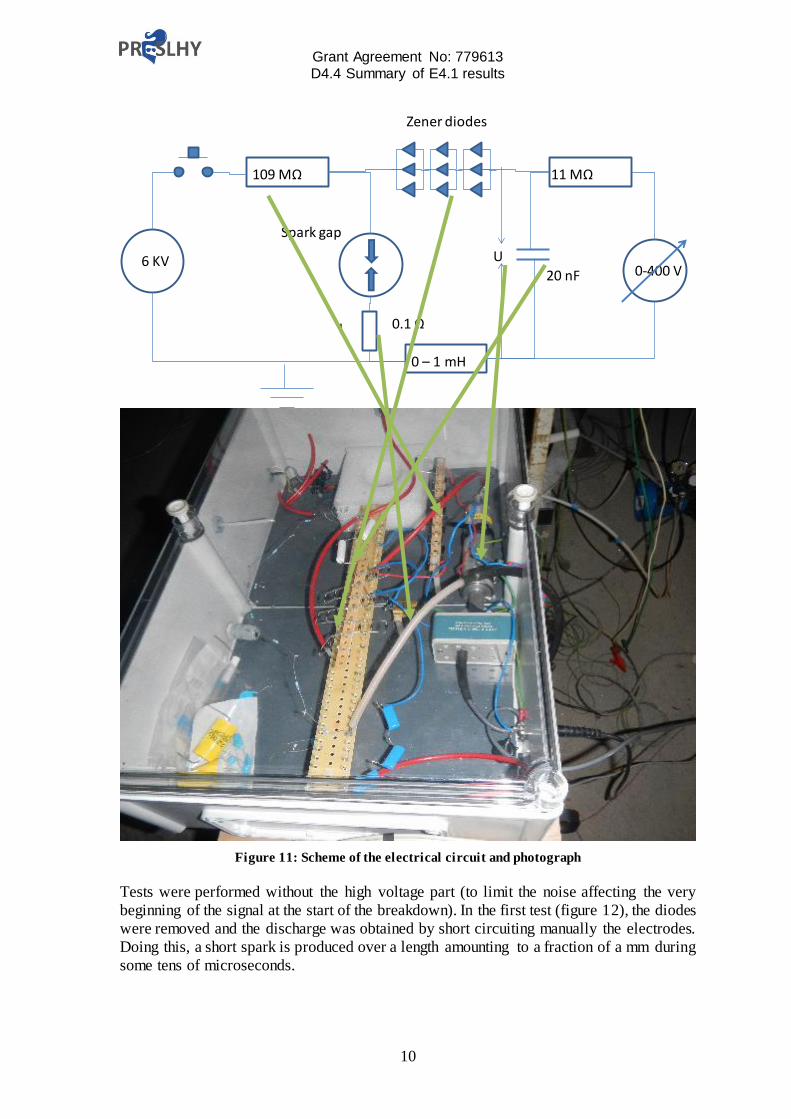
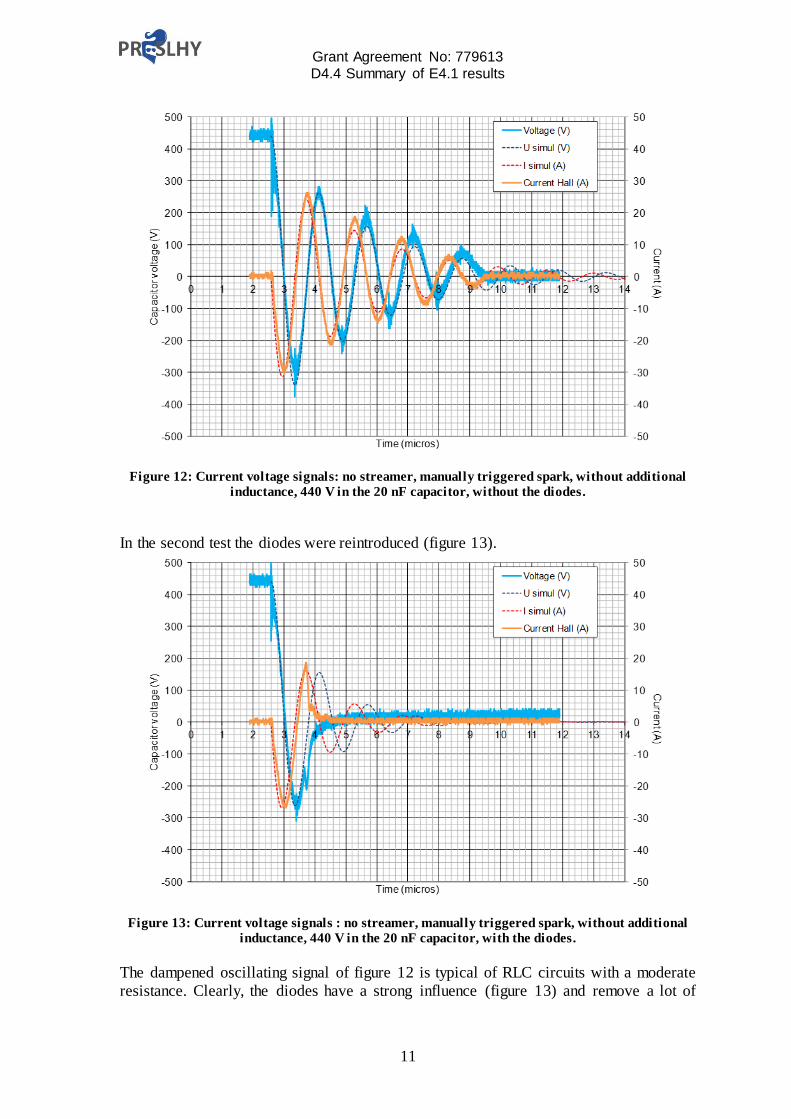
Figure 12: Current voltage signals: no streamer, manually triggered spark, without additional
inductance, 440 V in the 20 nF capacitor, without the diodes.
In the second test the diodes were reintroduced (figure 13).
Figure 13: Current voltage signals : no streamer, manually triggered spark, without additional
inductance, 440 V in the 20 nF capacitor, with the diodes.
The dampened oscillating signal of figure 12 is typical of RLC circuits with a moderate
resistance. Clearly, the diodes have a strong influence (figure 13) and remove a lot of
Grant Agreement No: 779613 D4.4 Summary of E4.1 results
12
energy. A simulation of the RLC circuit was performed, and the results are the dotted lines
on figures 12 and 13. It turns out that the best fit is obtained with an inductance of 3 μH
(capacitor = 20 nF) and a resistance of 2 Ω for figure 12 and an inductance of 3 μH
(capacitor = 20 nF) and a resistance of 4 Ω for figure 13.When the diodes are short circuited,
it can be verified that all the energy is consumed in the resistance. The latter is much larger
than the natural resistance of the wires and charge resistor as measured initially. Most
probably it is therefore that of the spark gap. When the diodes are incorporated, the best fit
is obtained with R = 4Ω at least until about 3.5 μs. After this, a catastrophic change appears
suggesting a strong increase of the resistance as the Zener diodes start to open the circuit.
The characteristic of the circuit turns from a LC to a RC dominated. In terms of energy, the
average resistance needed to close the balance would be 6 Ω. It means that about half of
the energy is dissipated in the spark gap.
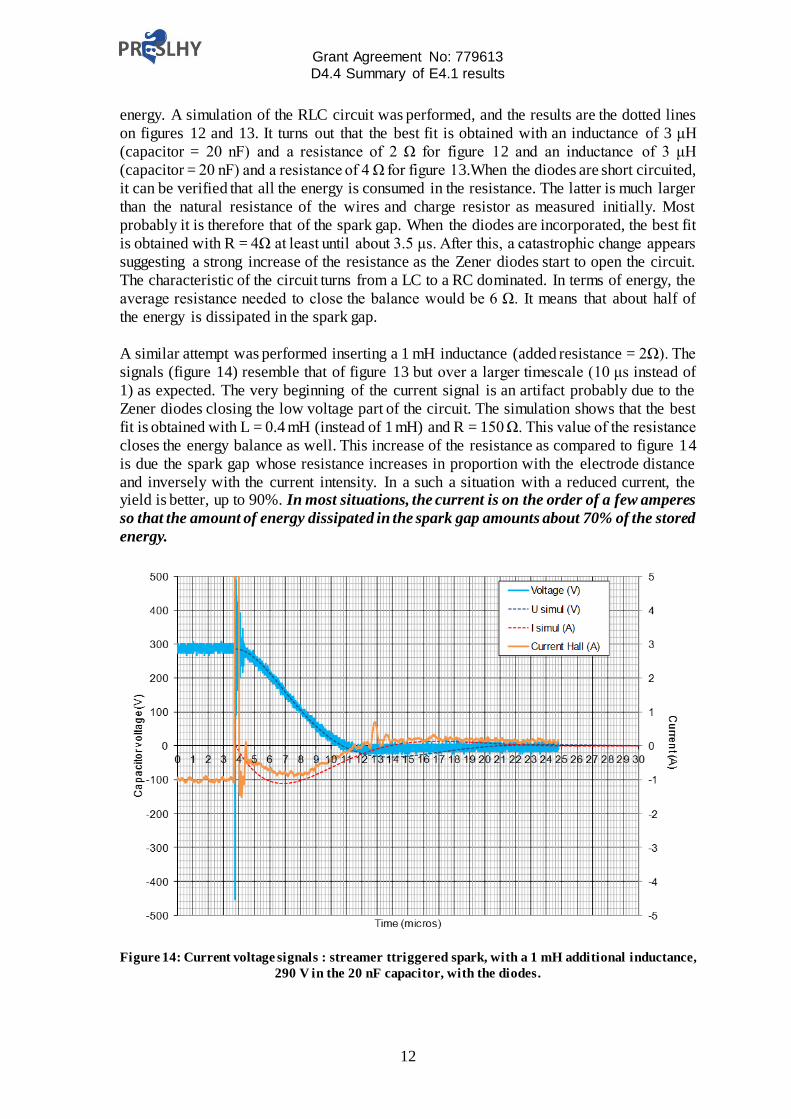
A similar attempt was performed inserting a 1 mH inductance (added resistance = 2Ω). The
signals (figure 14) resemble that of figure 13 but over a larger timescale (10 μs instead of
1) as expected. The very beginning of the current signal is an artifact probably due to the
Zener diodes closing the low voltage part of the circuit. The simulation shows that the best
fit is obtained with L = 0.4 mH (instead of 1 mH) and R = 150 Ω. This value of the resistance
closes the energy balance as well. This increase of the resistance as compared to figure 14
is due the spark gap whose resistance increases in proportion with the electrode distance
and inversely with the current intensity. In a such a situation with a reduced current, the yield is better, up to 90%. In most situations, the current is on the order of a few amperes
so that the amount of energy dissipated in the spark gap amounts about 70% of the stored
energy.
Figure 14: Current voltage signals : streamer ttriggered spark, with a 1 mH additional inductance,
290 V in the 20 nF capacitor, with the diodes.
Grant Agreement No: 779613 D4.4 Summary of E4.1 results
13
3.2 Preliminary results
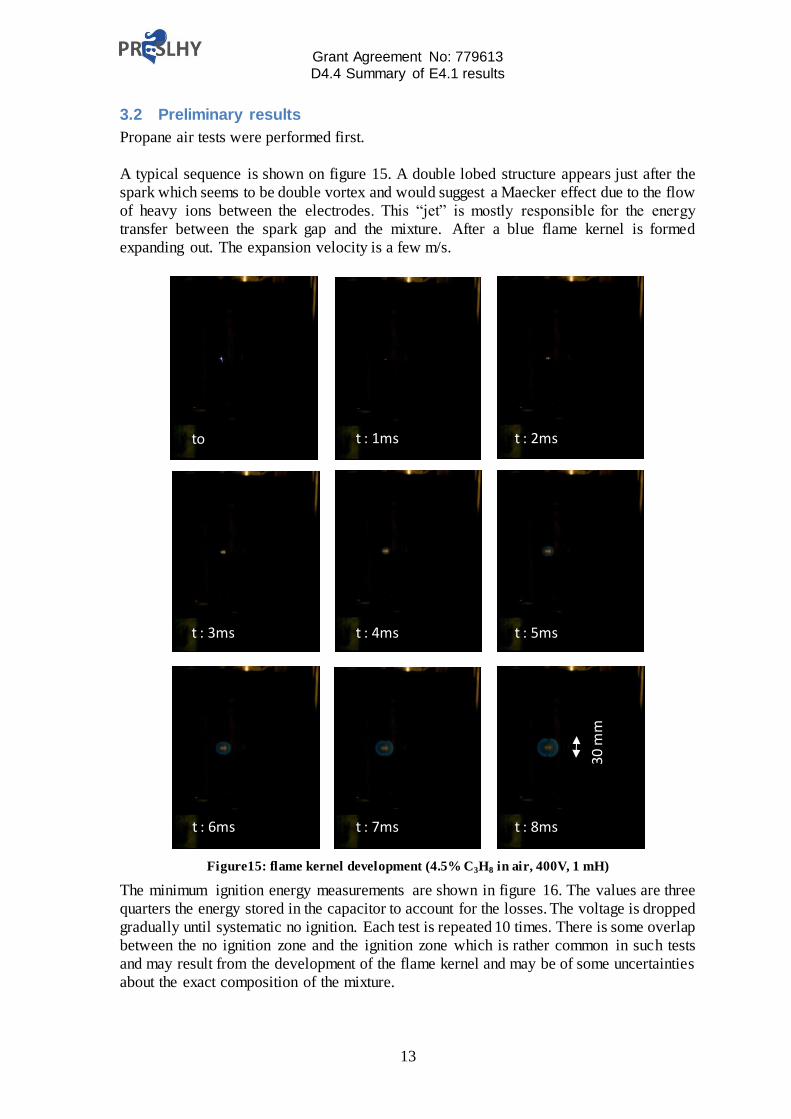
Propane air tests were performed first.
A typical sequence is shown on figure 15. A double lobed structure appears just after the
spark which seems to be double vortex and would suggest a Maecker effect due to the flow
of heavy ions between the electrodes. This “jet” is mostly responsible for the energy
transfer between the spark gap and the mixture. After a blue flame kernel is formed
expanding out. The expansion velocity is a few m/s.
Figure15: flame kernel development (4.5% C3H8 in air, 400V, 1 mH)
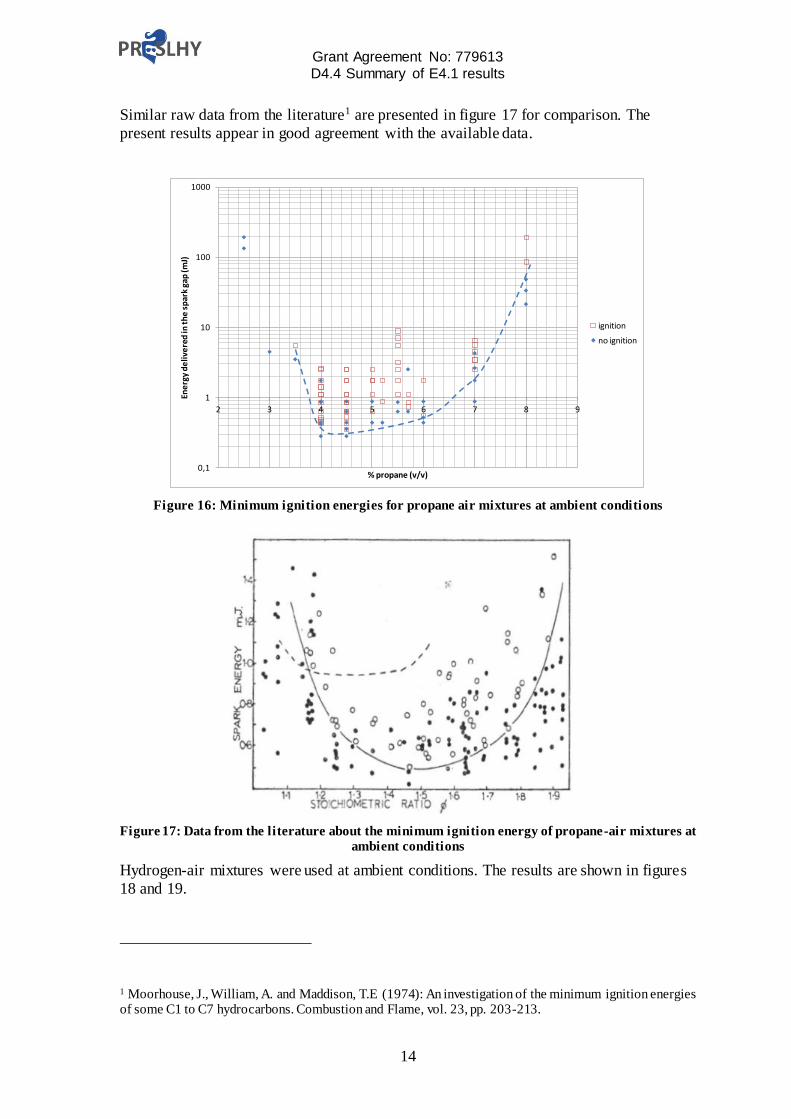
The minimum ignition energy measurements are shown in figure 16. The values are three
quarters the energy stored in the capacitor to account for the losses. The voltage is dropped
gradually until systematic no ignition. Each test is repeated 10 times. There is some overlap
between the no ignition zone and the ignition zone which is rather common in such tests
and may result from the development of the flame kernel and may be of some uncertainties
about the exact composition of the mixture.
30
mm
to t : 1ms t : 2ms
t : 3ms t : 4ms t : 5ms
t : 6ms t : 7ms t : 8ms
Grant Agreement No: 779613 D4.4 Summary of E4.1 results
14
Similar raw data from the literature1 are presented in figure 17 for comparison. The
present results appear in good agreement with the available data.
Figure 16: Minimum ignition energies for propane air mixtures at ambient conditions
Figure 17: Data from the literature about the minimum ignition energy of propane-air mixtures at
ambient conditions
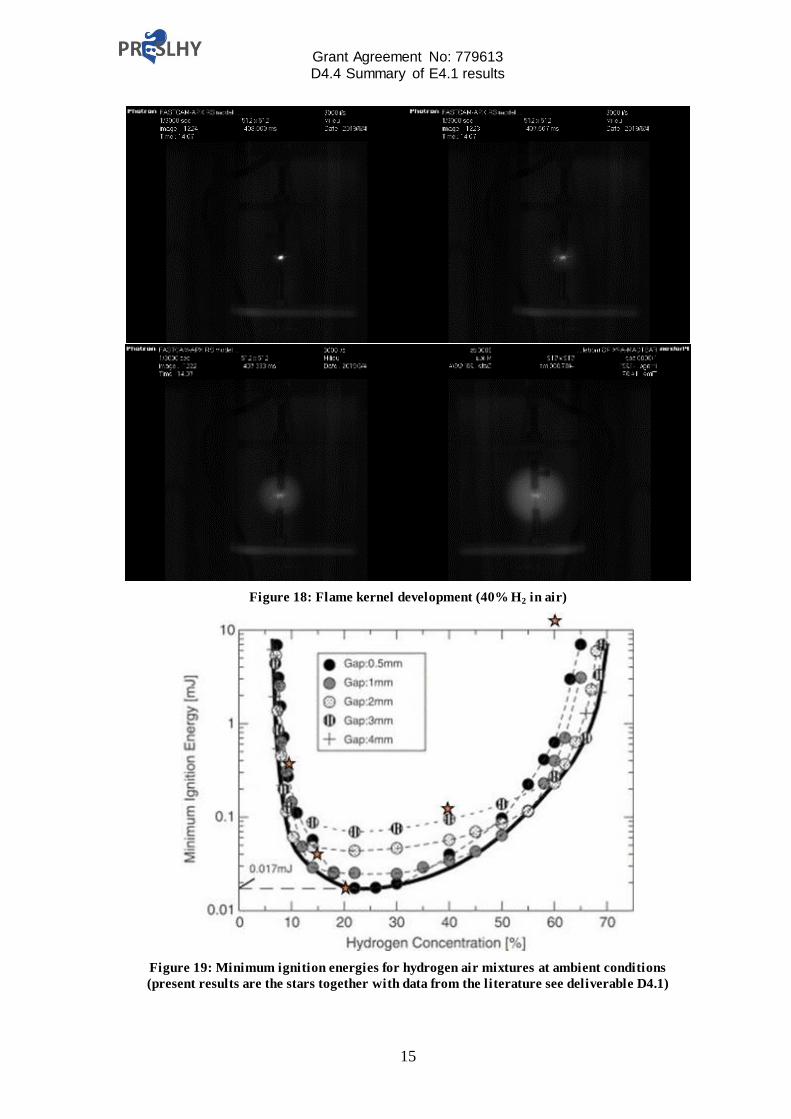
Hydrogen-air mixtures were used at ambient conditions. The results are shown in figures
18 and 19.
1 Moorhouse, J., William, A. and Maddison, T.E (1974): An investigation of the minimum ignition energies of some C1 to C7 hydrocarbons. Combustion and Flame, vol. 23, pp. 203-213.
0,1
1
10
100
1000
2 3 4 5 6 7 8 9
Ene
rgy
de
live
red
in t
he
sp
ark
gap
(mJ)
% propane (v/v)
ignition
no ignition
Grant Agreement No: 779613 D4.4 Summary of E4.1 results
15
Figure 18: Flame kernel development (40% H2 in air)
Figure 19: Minimum ignition energies for hydrogen air mixtures at ambient conditions
(present results are the stars together with data from the literature see deliverable D4.1)