suicide in minnesota, 1999- 2017 · comparing suicide rates by race during the 2013-2017 period,...
TRANSCRIPT
Suicide in Minnesota, 1999-2017 DATA BRIEF 12/13/2018
S U I C I D E I N M I N N E S O T A , 1 9 9 9 - 2 0 1 7
2
Suicide in Minnesota, 1999-2017
Minnesota Department of Health Injury and Violence Prevention Section PO Box 64822 St. Paul, MN 55164-0882 [email protected]
Suggested Citation Heinen M, Roesler J. Suicide in Minnesota, 1999-2017 - Data Brief. Saint Paul, MN: Minnesota Department of Health, December 2018.
To obtain this information in a different format, call: 651-201-5400. Printed on recycled paper.
S U I C I D E I N M I N N E S O T A , 1 9 9 9 - 2 0 1 7
3
Contents Preventable Deaths ................................................................................................................. 4
Minnesota Suicide Prevention Program: Suicide is Preventable ............................................ 4
Suicide in Minnesota: A Growing Problem ............................................................................. 4
Minnesota Suicides Increased 5 percent from 2016 to 2017 ................................................. 5
Male Suicide Rate Increased 9 percent and Female Suicide Rate Decreased 10 percent from 2016 to 2017 .................................................................................................................. 6
Firearm Suicide Rate Increased 10 percent for Males from 2016 to 2017 ............................ 7
Suicides Increased for Most Races.......................................................................................... 8
Male Suicides Increased by 18 percent in 7-County Metro Area ........................................... 9
White Male Firearm Suicides increased by 34 percent in 7-County Metro Area ................... 9
Greater Minnesota Suicide Rate is Higher than 7-County Metro Area ................................ 10
Data Sources ......................................................................................................................... 12
4
S U I C I D E I N M I N N E S O T A , 1 9 9 9 - 2 0 1 7
Preventable Deaths Suicide is the eighth leading cause of death in Minnesota and tenth nationally. This data brief analyzes suicide data from death certificates from 1999-2017. Suicide is not experienced equally across age groups, genders or geography in Minnesota.
Minnesota Suicide Prevention Program: Suicide is Preventable Minnesota’s suicide prevention efforts are based on the evidence that suicides are preventable, mental illness is treatable and recovery is possible and outlined in the Minnesota Suicide Prevention Plan: Goals and Objectives for Action 2015-2020. The ultimate goal of the Plan is to reduce suicide in Minnesota by 10 percent in 2020 and by 20 percent in 2025, ultimately working toward zero deaths.
In 2017, some populations experienced a decrease in suicide rates. Females experienced a ten percent decrease and Greater Minnesota experienced a three percent decrease. Nationally, Minnesota had the 14th lowest rate among all fifty states.
Suicide in Minnesota: A Growing Problem Despite a ten percent decrease in suicides among females in Minnesota in 2017 compared to 2016, overall suicides in Minnesota increased five percent. This increase was driven by a nine percent increase among males.
Nearly 80 percent of all firearm deaths are suicides. Firearms are the leading mechanism of suicide deaths for males, and account for 54 percent of male suicide deaths.
The male suicide rate increased 18 percent in the 7-county metro area, but remained lower than the Greater Minnesota male suicide rate. The increased suicide rate among males was primarily driven by White urban males who died by firearm.
Comparing suicide rates by race during the 2013-2017 period, the American Indian population experienced the greatest rate in Minnesota and had a rate nearly two times greater than the national rate.
5
S U I C I D E I N M I N N E S O T A , 1 9 9 9 - 2 0 1 7
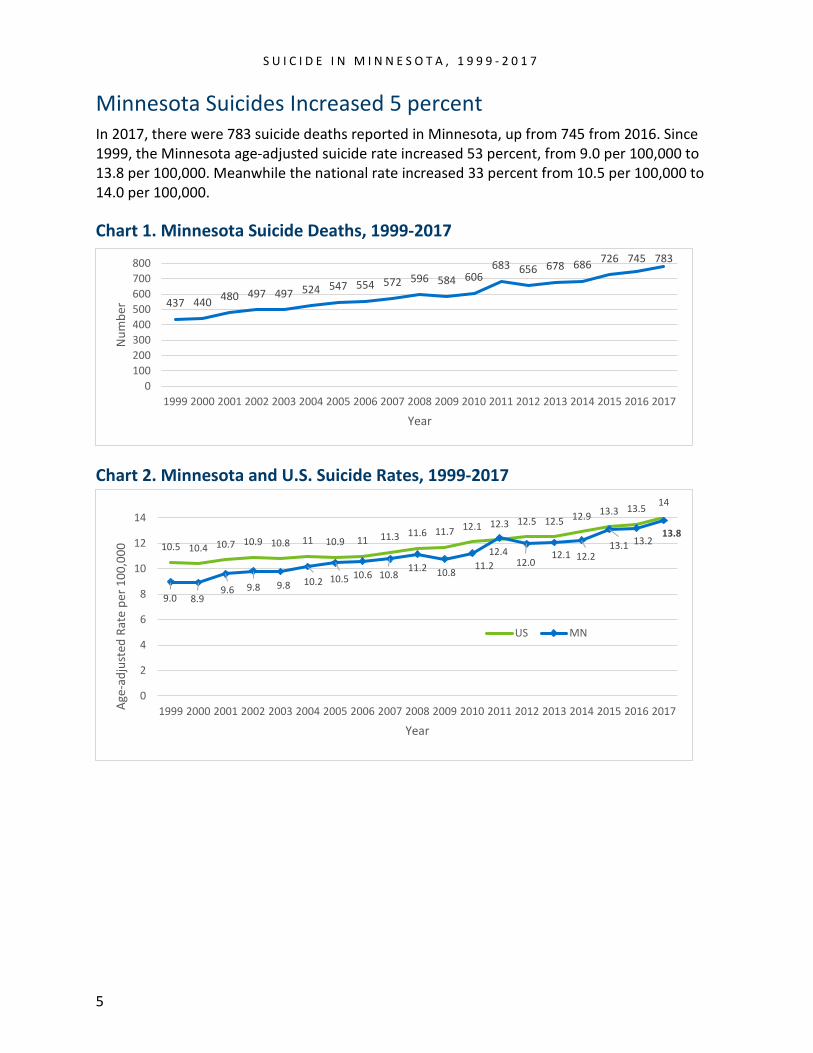
Minnesota Suicides Increased 5 percent In 2017, there were 783 suicide deaths reported in Minnesota, up from 745 from 2016. Since 1999, the Minnesota age-adjusted suicide rate increased 53 percent, from 9.0 per 100,000 to 13.8 per 100,000. Meanwhile the national rate increased 33 percent from 10.5 per 100,000 to 14.0 per 100,000.
Chart 1. Minnesota Suicide Deaths, 1999-2017
Chart 2. Minnesota and U.S. Suicide Rates, 1999-2017
437 440 480 497 497 524 547 554 572 596 584 606683 656 678 686 726 745 783
0100200300400500600700800
1999 2000 2001 2002 2003 2004 2005 2006 2007 2008 2009 2010 2011 2012 2013 2014 2015 2016 2017
Num
ber
Year
10.5 10.4 10.7 10.9 10.8 11 10.9 11 11.3 11.6 11.7 12.1 12.3 12.5 12.5 12.9 13.3 13.5 14
9.0 8.99.6 9.8 9.8 10.2 10.5 10.6 10.8
11.2 10.811.2
12.412.0
12.1 12.213.1 13.2
13.8
0
2
4
6
8
10
12
14
1999 2000 2001 2002 2003 2004 2005 2006 2007 2008 2009 2010 2011 2012 2013 2014 2015 2016 2017Age-
adju
sted
Rat
e pe
r 100
,000
Year
US MN
S U I C I D E I N M I N N E S O T A , 1 9 9 9 - 2 0 1 7
6
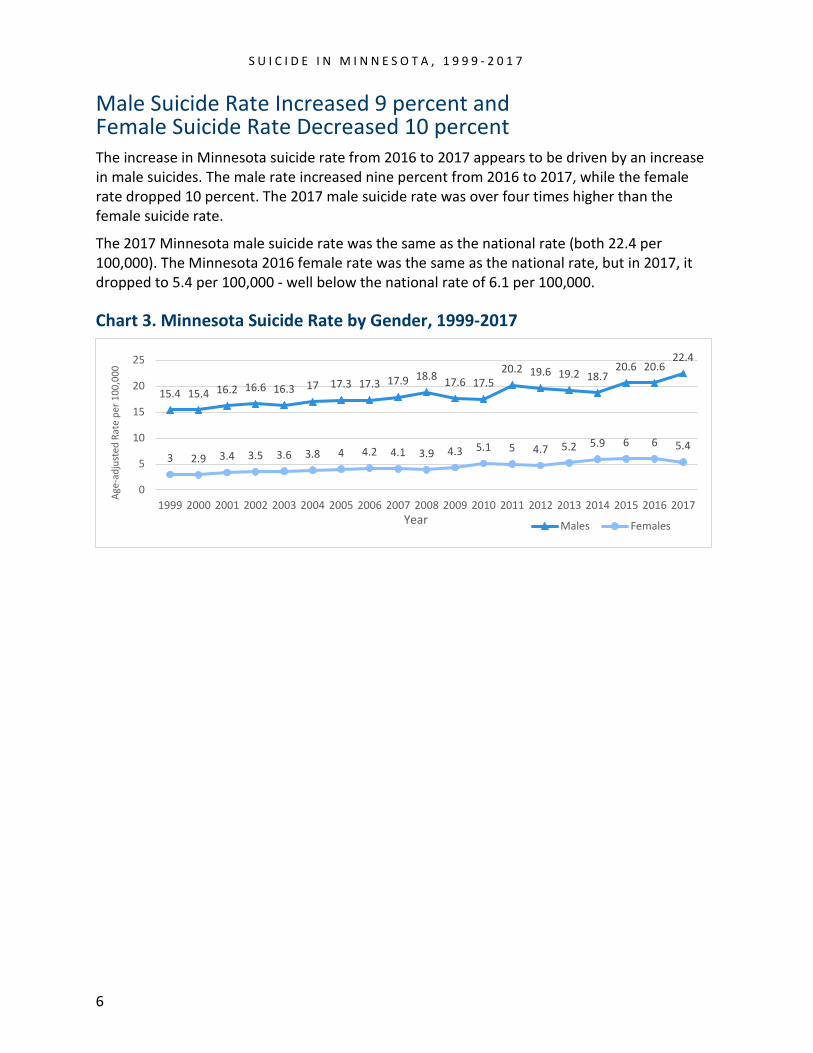
Male Suicide Rate Increased 9 percent and Female Suicide Rate Decreased 10 percent The increase in Minnesota suicide rate from 2016 to 2017 appears to be driven by an increase in male suicides. The male rate increased nine percent from 2016 to 2017, while the female rate dropped 10 percent. The 2017 male suicide rate was over four times higher than the female suicide rate.
The 2017 Minnesota male suicide rate was the same as the national rate (both 22.4 per 100,000). The Minnesota 2016 female rate was the same as the national rate, but in 2017, it dropped to 5.4 per 100,000 - well below the national rate of 6.1 per 100,000.
Chart 3. Minnesota Suicide Rate by Gender, 1999-2017
15.4 15.4 16.2 16.6 16.3 17 17.3 17.3 17.9 18.8 17.6 17.520.2 19.6 19.2 18.7
20.6 20.622.4
3 2.9 3.4 3.5 3.6 3.8 4 4.2 4.1 3.9 4.3 5.1 5 4.7 5.2 5.9 6 6 5.4
0
5
10
15
20
25
1999 2000 2001 2002 2003 2004 2005 2006 2007 2008 2009 2010 2011 2012 2013 2014 2015 2016 2017
Age-
adju
sted
Rat
e pe
r 100
,000
Year Males Females
S U I C I D E I N M I N N E S O T A , 1 9 9 9 - 2 0 1 7
7
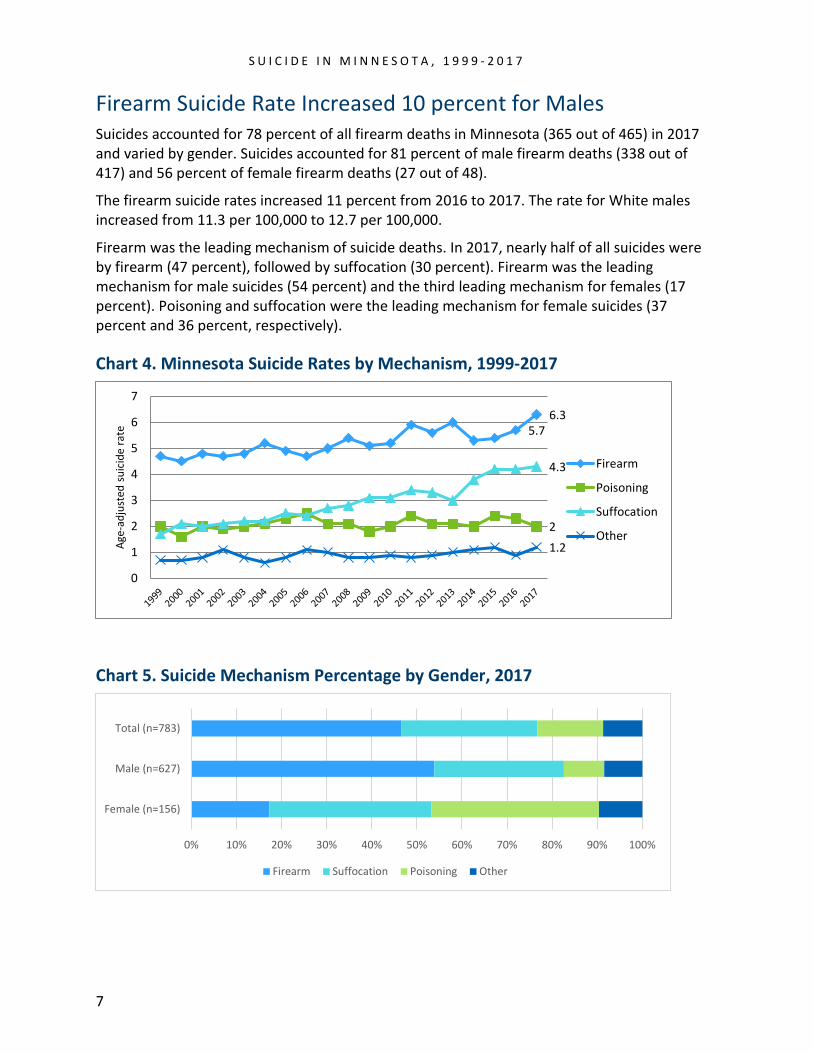
Firearm Suicide Rate Increased 10 percent for Males Suicides accounted for 78 percent of all firearm deaths in Minnesota (365 out of 465) in 2017 and varied by gender. Suicides accounted for 81 percent of male firearm deaths (338 out of 417) and 56 percent of female firearm deaths (27 out of 48).
The firearm suicide rates increased 11 percent from 2016 to 2017. The rate for White males increased from 11.3 per 100,000 to 12.7 per 100,000.
Firearm was the leading mechanism of suicide deaths. In 2017, nearly half of all suicides were by firearm (47 percent), followed by suffocation (30 percent). Firearm was the leading mechanism for male suicides (54 percent) and the third leading mechanism for females (17 percent). Poisoning and suffocation were the leading mechanism for female suicides (37 percent and 36 percent, respectively).
Chart 4. Minnesota Suicide Rates by Mechanism, 1999-2017
Chart 5. Suicide Mechanism Percentage by Gender, 2017
5.76.3
2
4.3
1.2
0
1
2
3
4
5
6
7
Age-
adju
sted
sui
cide
rate
Firearm
Poisoning
Suffocation
Other
0% 10% 20% 30% 40% 50% 60% 70% 80% 90% 100%
Female (n=156)
Male (n=627)
Total (n=783)
Firearm Suffocation Poisoning Other
8
S U I C I D E I N M I N N E S O T A , 1 9 9 9 - 2 0 1 7
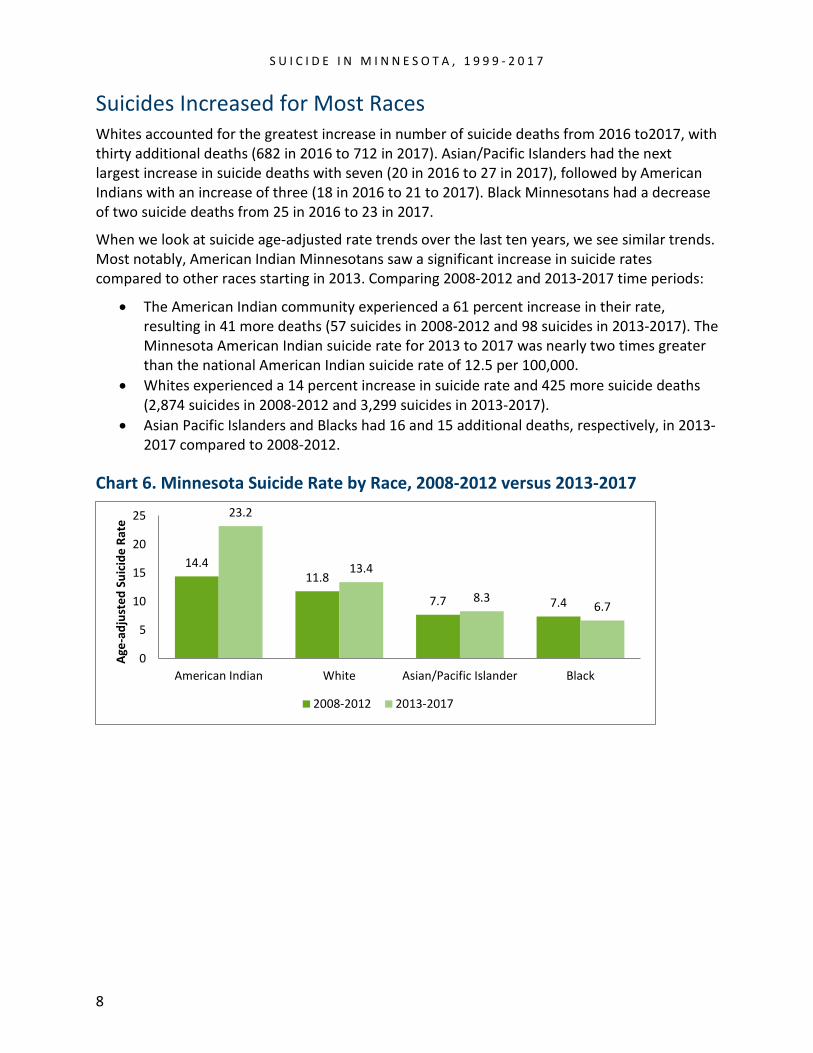
Suicides Increased for Most Races Whites accounted for the greatest increase in number of suicide deaths from 2016 to2017, with thirty additional deaths (682 in 2016 to 712 in 2017). Asian/Pacific Islanders had the next largest increase in suicide deaths with seven (20 in 2016 to 27 in 2017), followed by American Indians with an increase of three (18 in 2016 to 21 to 2017). Black Minnesotans had a decrease of two suicide deaths from 25 in 2016 to 23 in 2017.
When we look at suicide age-adjusted rate trends over the last ten years, we see similar trends. Most notably, American Indian Minnesotans saw a significant increase in suicide rates compared to other races starting in 2013. Comparing 2008-2012 and 2013-2017 time periods:
• The American Indian community experienced a 61 percent increase in their rate,resulting in 41 more deaths (57 suicides in 2008-2012 and 98 suicides in 2013-2017). TheMinnesota American Indian suicide rate for 2013 to 2017 was nearly two times greaterthan the national American Indian suicide rate of 12.5 per 100,000.
• Whites experienced a 14 percent increase in suicide rate and 425 more suicide deaths(2,874 suicides in 2008-2012 and 3,299 suicides in 2013-2017).
• Asian Pacific Islanders and Blacks had 16 and 15 additional deaths, respectively, in 2013-2017 compared to 2008-2012.
Chart 6. Minnesota Suicide Rate by Race, 2008-2012 versus 2013-2017
14.411.8
7.7 7.4
23.2
13.4
8.36.7
0
5
10
15
20
25
American Indian White Asian/Pacific Islander Black
Age-
adju
sted
Sui
cide
Rat
e
2008-2012 2013-2017
9
S U I C I D E I N M I N N E S O T A , 1 9 9 9 - 2 0 1 7
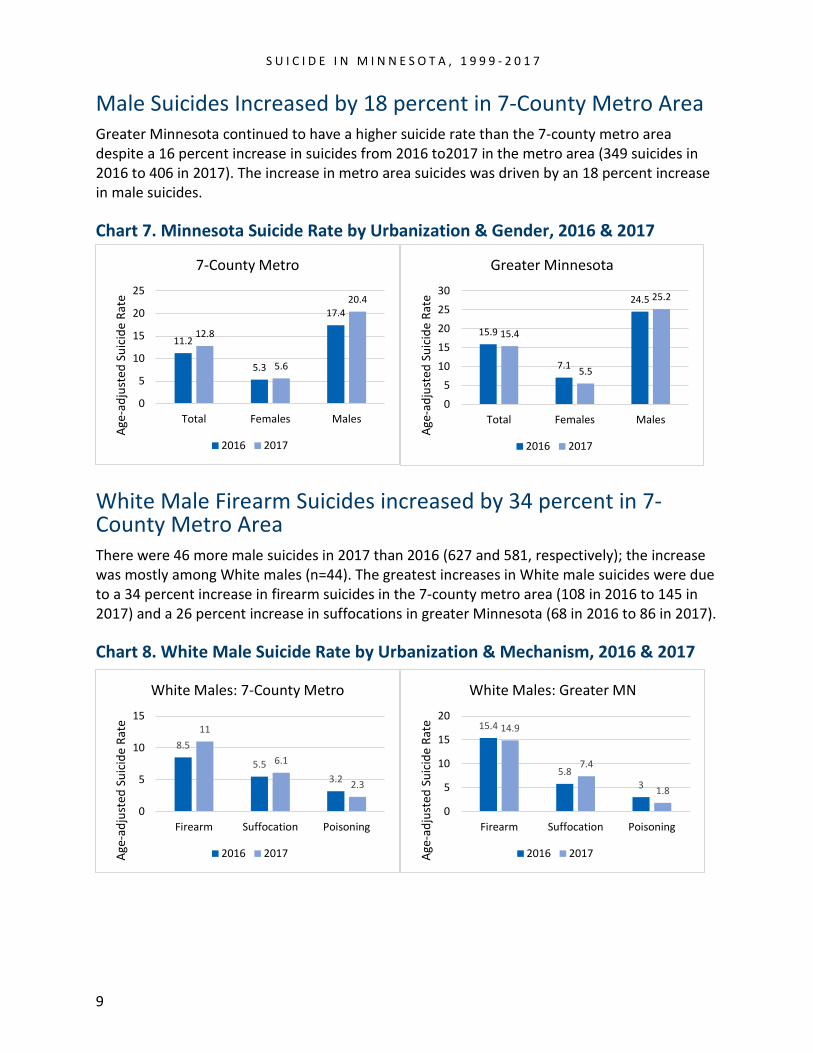
Male Suicides Increased by 18 percent in 7-County Metro Area Greater Minnesota continued to have a higher suicide rate than the 7-county metro area despite a 16 percent increase in suicides from 2016 to2017 in the metro area (349 suicides in 2016 to 406 in 2017). The increase in metro area suicides was driven by an 18 percent increase in male suicides.
Chart 7. Minnesota Suicide Rate by Urbanization & Gender, 2016 & 2017
White Male Firearm Suicides increased by 34 percent in 7-County Metro Area There were 46 more male suicides in 2017 than 2016 (627 and 581, respectively); the increase was mostly among White males (n=44). The greatest increases in White male suicides were due to a 34 percent increase in firearm suicides in the 7-county metro area (108 in 2016 to 145 in 2017) and a 26 percent increase in suffocations in greater Minnesota (68 in 2016 to 86 in 2017).
Chart 8. White Male Suicide Rate by Urbanization & Mechanism, 2016 & 2017
11.2
5.3
17.4
12.8
5.6
20.4
0
5
10
15
20
25
Total Females Males
Age-
adju
sted
Sui
cide
Rat
e
7-County Metro
2016 2017
15.9
7.1
24.5
15.4
5.5
25.2
05
1015202530
Total Females MalesAg
e-ad
just
ed S
uici
de R
ate
Greater Minnesota
2016 2017
8.5
5.53.2
11
6.1
2.3
0
5
10
15
Firearm Suffocation Poisoning
Age-
adju
sted
Sui
cide
Rat
e
White Males: 7-County Metro
2016 2017
15.4
5.83
14.9
7.4
1.8
0
5
10
15
20
Firearm Suffocation Poisoning
Age-
adju
sted
Sui
cide
Rat
e
White Males: Greater MN
2016 2017
10
S U I C I D E I N M I N N E S O T A , 1 9 9 9 - 2 0 1 7
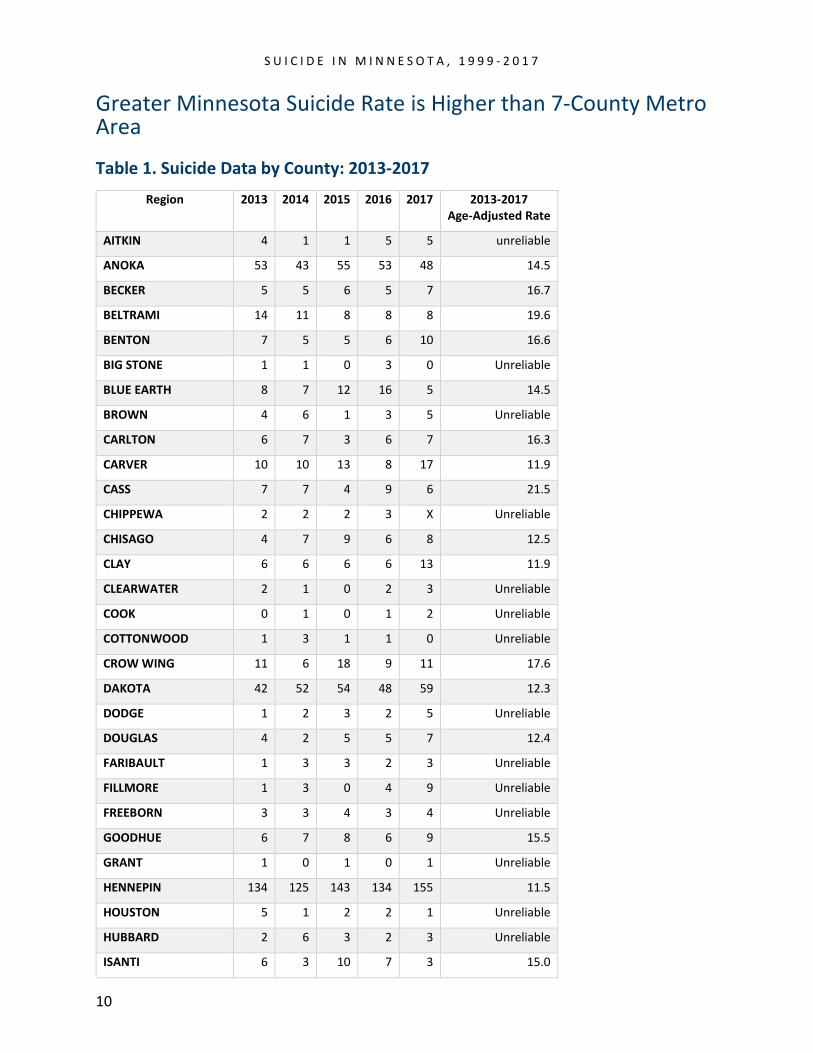
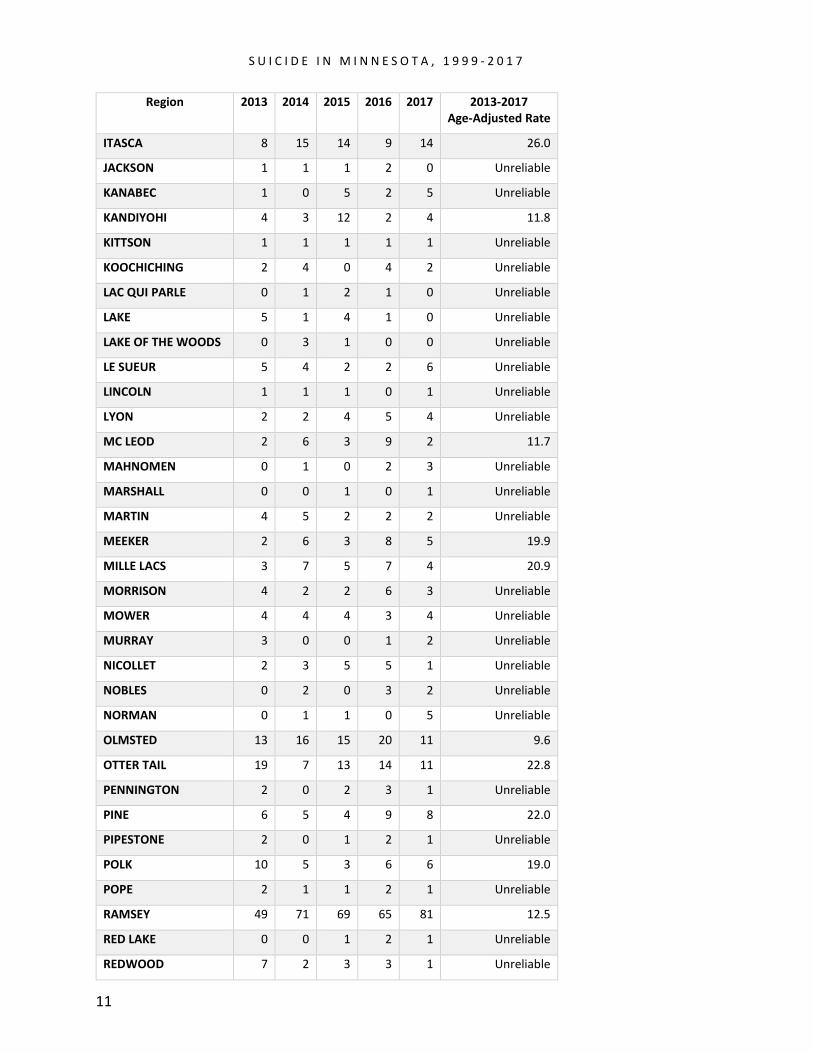
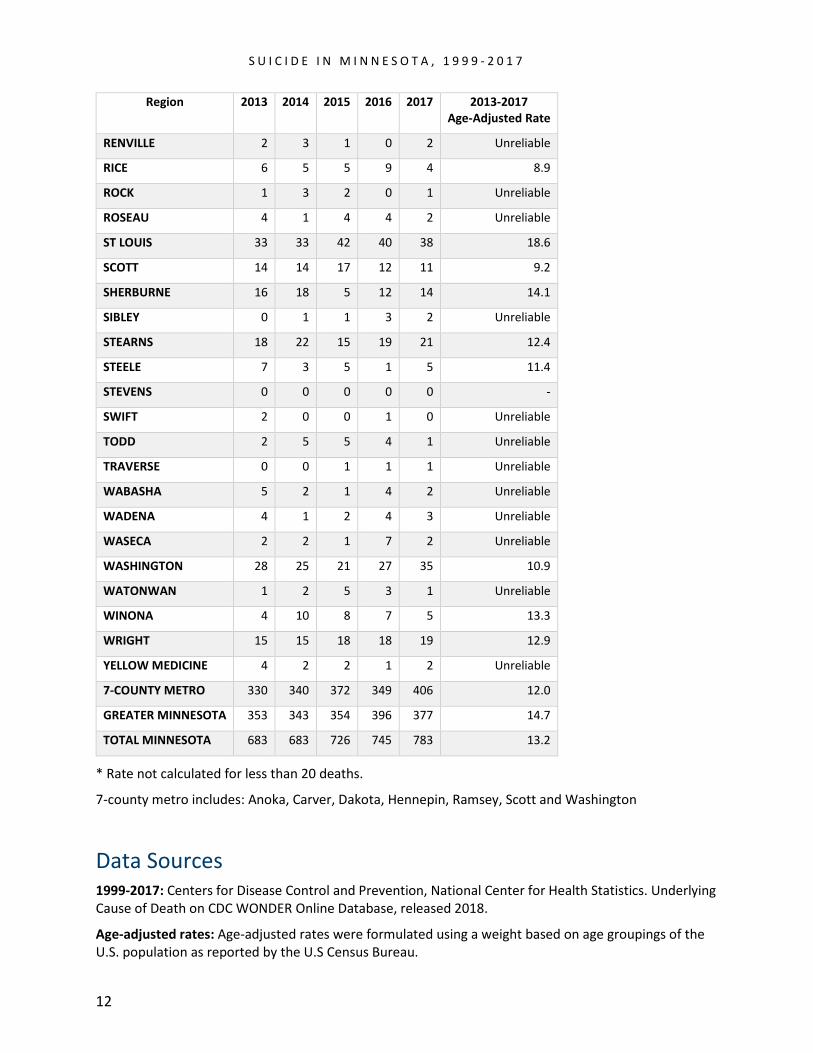
Greater Minnesota Suicide Rate is Higher than 7-County Metro Area
Table 1. Suicide Data by County: 2013-2017
Region 2013 2014 2015 2016 2017 2013-2017 Age-Adjusted Rate
AITKIN 4 1 1 5 5 unreliable
ANOKA 53 43 55 53 48 14.5
BECKER 5 5 6 5 7 16.7
BELTRAMI 14 11 8 8 8 19.6
BENTON 7 5 5 6 10 16.6
BIG STONE 1 1 0 3 0 Unreliable
BLUE EARTH 8 7 12 16 5 14.5
BROWN 4 6 1 3 5 Unreliable
CARLTON 6 7 3 6 7 16.3
CARVER 10 10 13 8 17 11.9
CASS 7 7 4 9 6 21.5
CHIPPEWA 2 2 2 3 X Unreliable
CHISAGO 4 7 9 6 8 12.5
CLAY 6 6 6 6 13 11.9
CLEARWATER 2 1 0 2 3 Unreliable
COOK 0 1 0 1 2 Unreliable
COTTONWOOD 1 3 1 1 0 Unreliable
CROW WING 11 6 18 9 11 17.6
DAKOTA 42 52 54 48 59 12.3
DODGE 1 2 3 2 5 Unreliable
DOUGLAS 4 2 5 5 7 12.4
FARIBAULT 1 3 3 2 3 Unreliable
FILLMORE 1 3 0 4 9 Unreliable
FREEBORN 3 3 4 3 4 Unreliable
GOODHUE 6 7 8 6 9 15.5
GRANT 1 0 1 0 1 Unreliable
HENNEPIN 134 125 143 134 155 11.5
HOUSTON 5 1 2 2 1 Unreliable
HUBBARD 2 6 3 2 3 Unreliable
ISANTI 6 3 10 7 3 15.0
S U I C I D E I N M I N N E S O T A , 1 9 9 9 - 2 0 1 7
11
Region 2013 2014 2015 2016 2017 2013-2017 Age-Adjusted Rate
ITASCA 8 15 14 9 14 26.0
JACKSON 1 1 1 2 0 Unreliable
KANABEC 1 0 5 2 5 Unreliable
KANDIYOHI 4 3 12 2 4 11.8
KITTSON 1 1 1 1 1 Unreliable
KOOCHICHING 2 4 0 4 2 Unreliable
LAC QUI PARLE 0 1 2 1 0 Unreliable
LAKE 5 1 4 1 0 Unreliable
LAKE OF THE WOODS 0 3 1 0 0 Unreliable
LE SUEUR 5 4 2 2 6 Unreliable
LINCOLN 1 1 1 0 1 Unreliable
LYON 2 2 4 5 4 Unreliable
MC LEOD 2 6 3 9 2 11.7
MAHNOMEN 0 1 0 2 3 Unreliable
MARSHALL 0 0 1 0 1 Unreliable
MARTIN 4 5 2 2 2 Unreliable
MEEKER 2 6 3 8 5 19.9
MILLE LACS 3 7 5 7 4 20.9
MORRISON 4 2 2 6 3 Unreliable
MOWER 4 4 4 3 4 Unreliable
MURRAY 3 0 0 1 2 Unreliable
NICOLLET 2 3 5 5 1 Unreliable
NOBLES 0 2 0 3 2 Unreliable
NORMAN 0 1 1 0 5 Unreliable
OLMSTED 13 16 15 20 11 9.6
OTTER TAIL 19 7 13 14 11 22.8
PENNINGTON 2 0 2 3 1 Unreliable
PINE 6 5 4 9 8 22.0
PIPESTONE 2 0 1 2 1 Unreliable
POLK 10 5 3 6 6 19.0
POPE 2 1 1 2 1 Unreliable
RAMSEY 49 71 69 65 81 12.5
RED LAKE 0 0 1 2 1 Unreliable
REDWOOD 7 2 3 3 1 Unreliable
S U I C I D E I N M I N N E S O T A , 1 9 9 9 - 2 0 1 7
12
Region 2013 2014 2015 2016 2017 2013-2017 Age-Adjusted Rate
RENVILLE 2 3 1 0 2 Unreliable
RICE 6 5 5 9 4 8.9
ROCK 1 3 2 0 1 Unreliable
ROSEAU 4 1 4 4 2 Unreliable
ST LOUIS 33 33 42 40 38 18.6
SCOTT 14 14 17 12 11 9.2
SHERBURNE 16 18 5 12 14 14.1
SIBLEY 0 1 1 3 2 Unreliable
STEARNS 18 22 15 19 21 12.4
STEELE 7 3 5 1 5 11.4
STEVENS 0 0 0 0 0 -
SWIFT 2 0 0 1 0 Unreliable
TODD 2 5 5 4 1 Unreliable
TRAVERSE 0 0 1 1 1 Unreliable
WABASHA 5 2 1 4 2 Unreliable
WADENA 4 1 2 4 3 Unreliable
WASECA 2 2 1 7 2 Unreliable
WASHINGTON 28 25 21 27 35 10.9
WATONWAN 1 2 5 3 1 Unreliable
WINONA 4 10 8 7 5 13.3
WRIGHT 15 15 18 18 19 12.9
YELLOW MEDICINE 4 2 2 1 2 Unreliable
7-COUNTY METRO 330 340 372 349 406 12.0
GREATER MINNESOTA 353 343 354 396 377 14.7
TOTAL MINNESOTA 683 683 726 745 783 13.2
* Rate not calculated for less than 20 deaths.
7-county metro includes: Anoka, Carver, Dakota, Hennepin, Ramsey, Scott and Washington
Data Sources 1999-2017: Centers for Disease Control and Prevention, National Center for Health Statistics. Underlying Cause of Death on CDC WONDER Online Database, released 2018.
Age-adjusted rates: Age-adjusted rates were formulated using a weight based on age groupings of the U.S. population as reported by the U.S Census Bureau.