sugarcane production in louisiaana i
TRANSCRIPT

22001144 PPrroojjeecctteedd CCoommmmooddiittyy CCoossttss AAnndd RReettuurrnnss
SSuuggaarrccaannee PPrroodduuccttiioonn iinn LLoouuiissiiaannaa
Michael E. Salassi, Michael A. Deliberto and Brian M. Hilbun
Farm Management Research & Extension
Department of Agricultural Economics & Agribusiness A.E.A. Information Series No. 295 - January 2014
January 2014 A.E.A. Information Series No. 295
PROJECTED COSTS AND RETURNS - SUGARCANE LOUISIANA, 2014 by Michael E. Salassi, Michael A. Deliberto, and Brian M. Hilbun Louisiana State University Agricultural Center Louisiana Agricultural Experiment Station/Louisiana Cooperative Extension Service
www.lsuagcenter.com
ii
TABLE OF CONTENTS PAGE INTRODUCTION .................................................................................................. 1 SUGARCANE BUDGETS ........................................................................................... 1 PROCEDURE ............................................................................................................. 3
Machinery Costs ............................................................................................ 4 Price Data ...................................................................................................... 4 Overhead Costs ............................................................................................. 5 Machinery Size .............................................................................................. 5
APPENDIX A - PROCEDURE FOR BUDGET USE ................................................... 28 LIST OF TABLES TABLE PAGE 1A Projected Costs and Returns on 1000 Acres of Sugarcane, 4-Year Rotation,
Harvest through 2nd stubble, Tenant-Operator, Louisiana, 2014................................... 7 1B Expected Sugar Yield per Rotational Acre of Sugarcane, 4-Year Rotation, Harvest
through 2nd stubble, Tenant-Operator, Louisiana 2014. ............................................... 8
1C Breakeven Selling Prices for Raw Sugar for Selected Yields and Rental Arrangements, 4-Year Rotation, Harvest through 2nd stubble, Tenant-Operators, Louisiana, 2014. ....... 8
1D Breakeven Raw Sugar Yields for Selected Prices and Rental Arrangements, 4-Year Rotation, Harvest through 2nd stubble, Tenant-Operators, Louisiana, 2014. ....... 8
2A Projected Costs and Returns on 1000 Acres of Sugarcane, 5-Year Rotation,
Harvest through 3rd stubble, Tenant-Operator, Louisiana, 2014. .................................. 9 2B Expected Sugar Yield per Rotational Acre of Sugarcane, 5-Year Rotation, Harvest
through 3rd stubble, Tenant-Operator, Louisiana 2014. .............................................. 10 2C Breakeven Selling Prices for Raw Sugar for Selected Yields and Rental Arrangements,
5-Year Rotation, Harvest through 3rd stubble, Tenant-Operators, Louisiana, 2014. ...... 10 2D Breakeven Raw Sugar Yields for Selected Prices and Rental Arrangements,
5-Year Rotation, Harvest through 3rd stubble, Tenant-Operators, Louisiana, 2014. ...... 10 3A Projected Costs and Returns on 1000 Acres of Sugarcane, 6-Year Rotation,
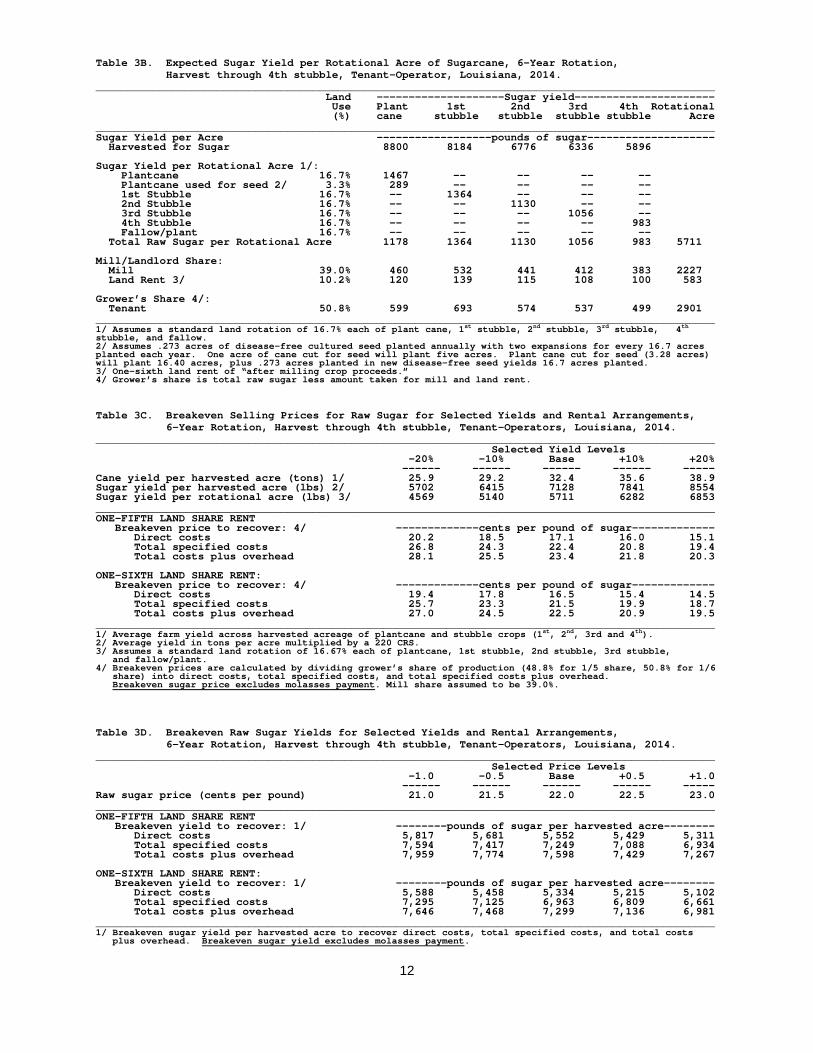
Harvest through 4th stubble, Tenant-Operator, Louisiana, 2014. ................................. 11 3B Expected Sugar Yield per Rotational Acre of Sugarcane, 6-Year Rotation, Harvest
through 4th stubble, Tenant-Operator, Louisiana, 2014. ............................................. 12
iii
List of Tables (continued) TABLE PAGE 3C Breakeven Selling Prices for Raw Sugar for Selected Yields and Rental Arrangements,
6-Year Rotation, Harvest through 4th stubble, Tenant-Operators, Louisiana, 2014. ...... 12 3D Breakeven Raw Sugar Yields for Selected Prices and Rental Arrangements,
6-Year Rotation, Harvest through 4th stubble, Tenant-Operators, Louisiana, 2014. ...... 12
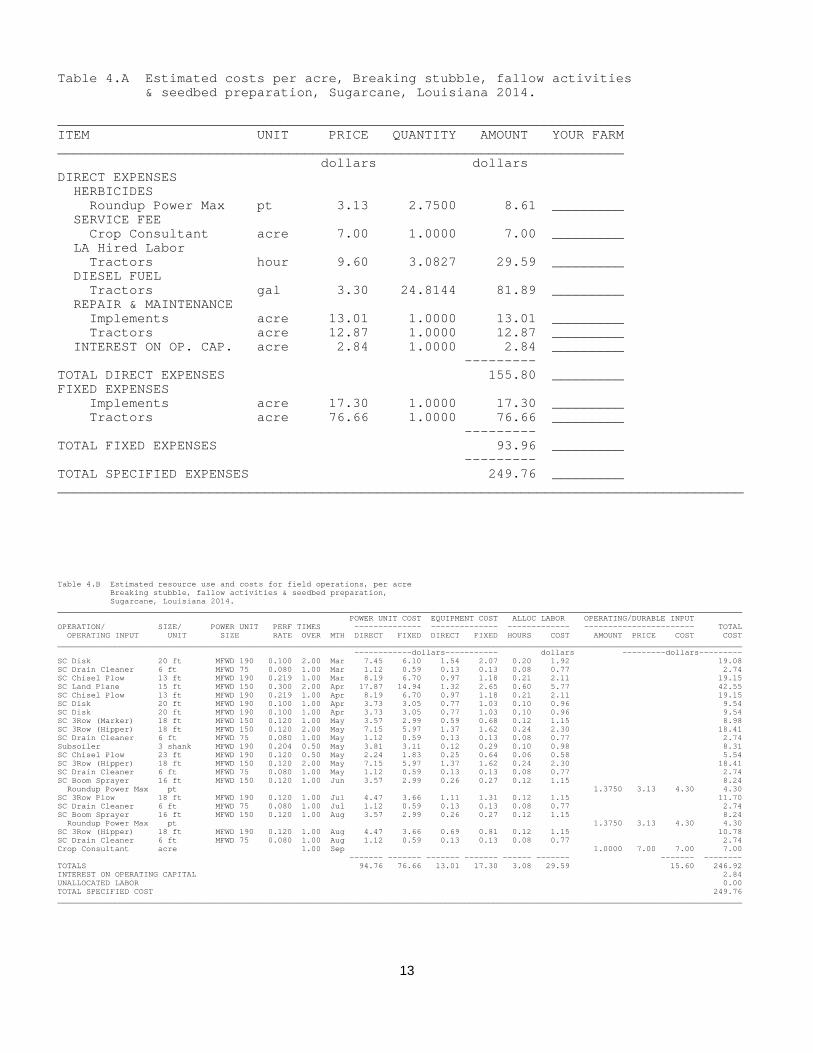
4A Estimated Costs per Acre -- Sugarcane, Breaking Stubble, Fallow Activities, and Seedbed Preparation, Louisiana 2014. ..................................................................... 13
4B Estimated Resource Use and Costs per Acre for Field Operations -- Sugarcane,
Breaking Stubble, Fallow Activities, and SeedBed Preparation, Louisiana 2014. ...................................................................................................... 13
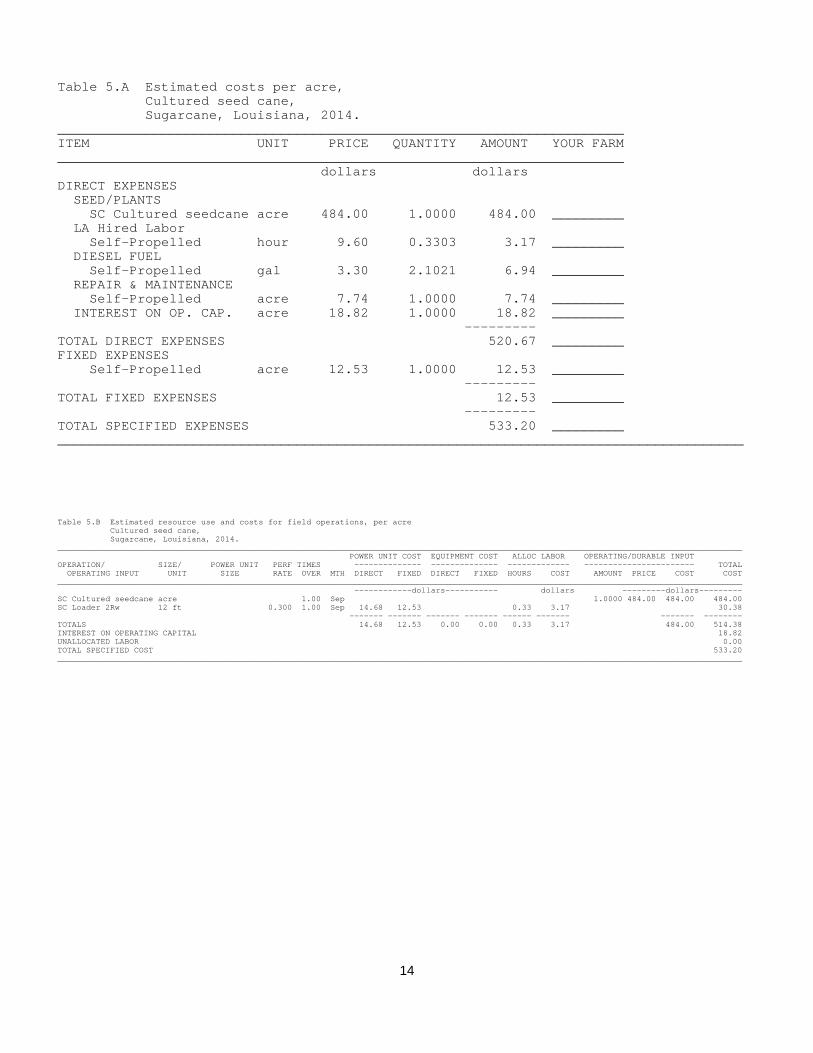
5A Estimated Costs per Acre -- Sugarcane,
Cultured Seed Cane, Louisiana 2014. ...................................................................... 14 5B Estimated Resource Use and Costs per Acre for Field Operations -- Sugarcane,
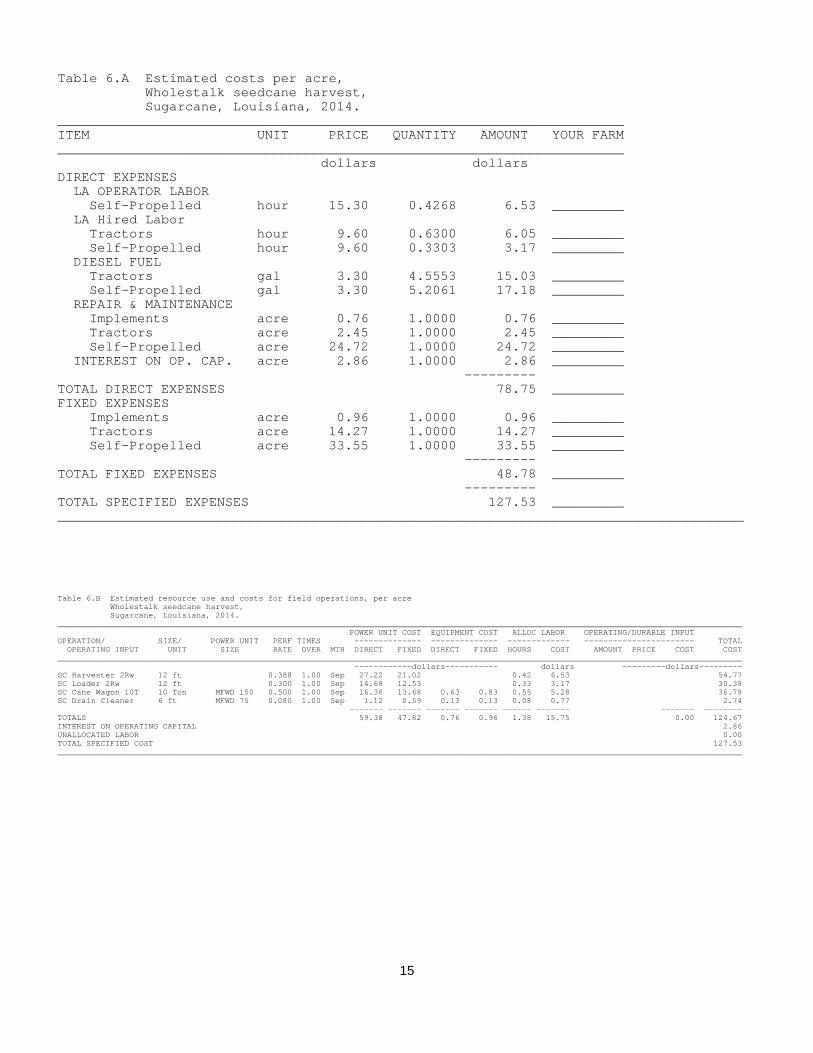
Cultured Seed Cane, Louisiana 2014. ...................................................................... 14 6A Estimated Costs per Acre -- Sugarcane,
Wholestalk Seed Cane Harvest, Louisiana 2014. ...................................................... 15 6B Estimated Resource Use and Costs per Acre for Wholestalk Seed Cane Harvest B
Sugarcane, Propagated Seed Cane, Louisiana 2014. ................................................ 15 7A Estimated Costs per Acre -- Sugarcane,
Billet Sugarcane Harvest, Louisiana 2014. ................................................................ 16 7B Estimated Resource Use and Costs per Acre for Billet Seed Cane Harvest B
Sugarcane, Propagated Seed Cane, Louisiana 2014. ................................................ 16 8A Estimated Costs per Acre -- Sugarcane,
Hand Planting, 1-Row Wholestalk, Louisiana 2014. ................................................... 17 8B Estimated Resource Use and Costs per Acre for Field Operations -- Sugarcane,
Hand Planting, 1-Row Wholestalk, Louisiana 2014. ................................................... 17 9A Estimated Costs per Acre -- Sugarcane,
Mechanical Planting, 1-Row Wholestalk, Louisiana 2014. .......................................... 18

iv
List of Tables (continued) TABLE PAGE 9B Estimated Resource Use and Costs per Acre for Field Operations -- Sugarcane,
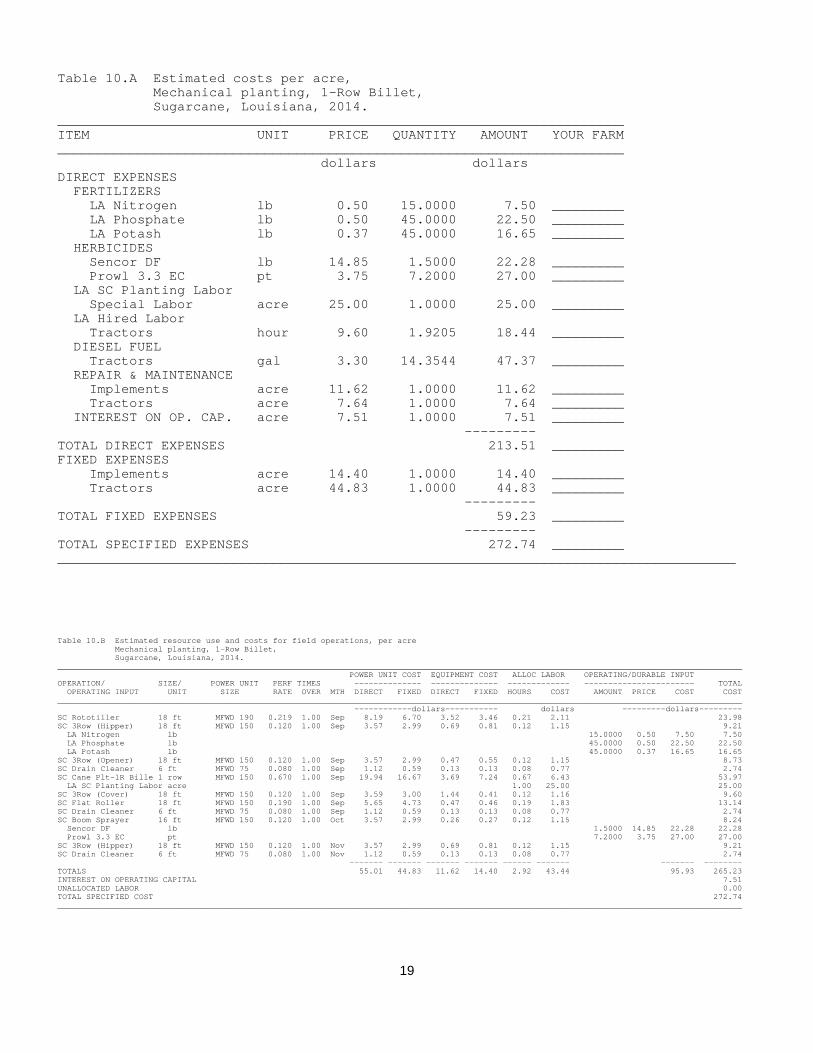
Mechanical Planting, 1-Row Wholestalk, Louisiana 2014. .......................................... 18 10A Estimated Costs per Acre -- Sugarcane,
Mechanical Planting, 1-Row Billet, Louisiana 2014. ................................................... 19 10B Estimated Resource Use and Costs per Acre for Field Operations -- Sugarcane,
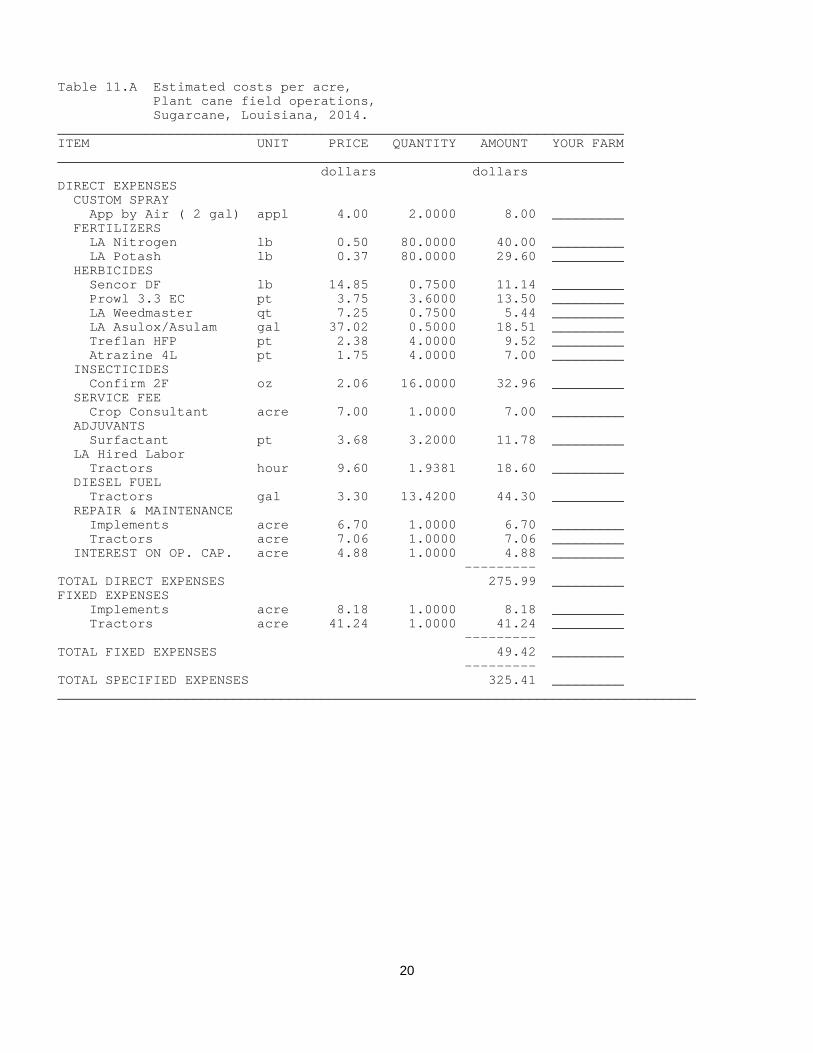
Mechanical Planting, 1-Row Billet, Louisiana 2014. ................................................... 19 11A Estimated Costs per Acre -- Sugarcane,
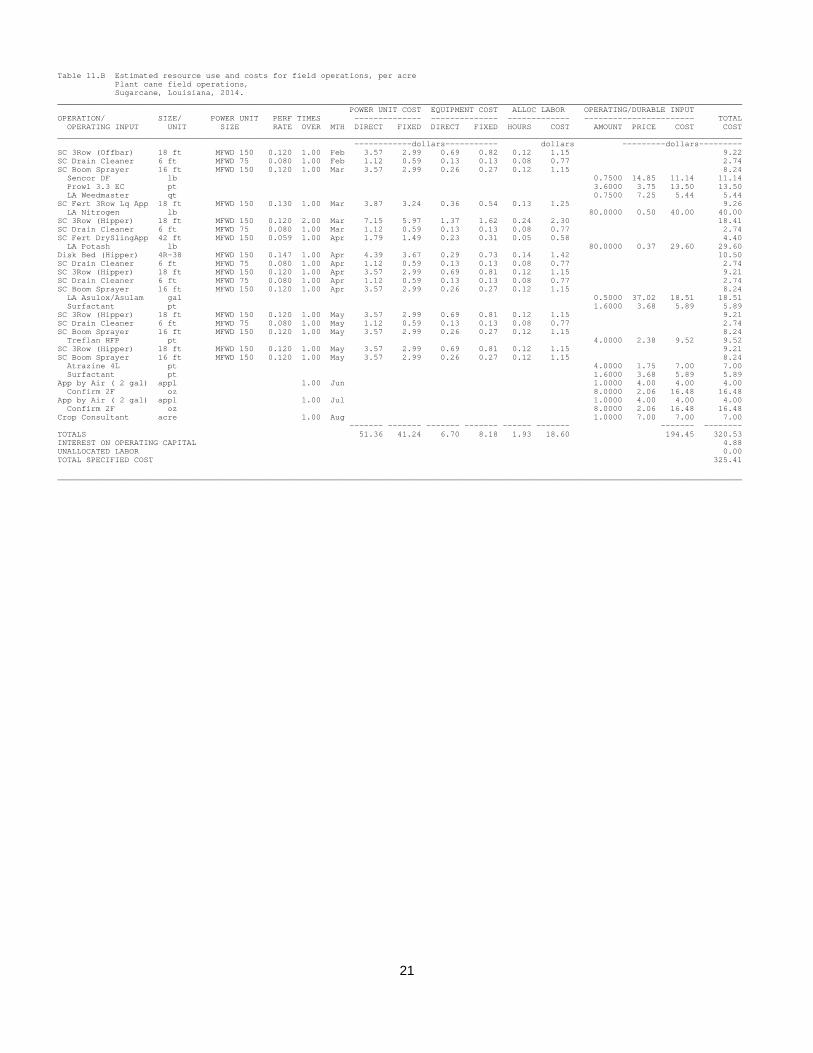
Plant Cane, Louisiana 2014. .................................................................................... 20 11B Estimated Resource Use and Costs per Acre for Field Operations -- Sugarcane,
Plant Cane, Louisiana 2014. .................................................................................... 21 12A Estimated Costs per Acre -- Sugarcane,
First Stubble, Louisiana 2014. ................................................................................. 22 12B Estimated Resource Use and Costs per Acre for Field Operations -- Sugarcane,
First Stubble, Louisiana 2014. ................................................................................. 23 13A Estimated Costs per Acre -- Sugarcane,
Second Stubble and Older, Louisiana 2014. ............................................................. 24 13B Estimated Resource Use and Costs per Acre for Field Operations -- Sugarcane,
Second Stubble and Older, Louisiana 2014. ............................................................. 25 14A Estimated Costs per Acre -- Sugarcane,
Harvesting Millable Sugarcane, 1-Row Combine Harvester, 10-Ton High Dump Wagons, Custom Truck/Trailer Haul, Louisiana 2014. ............................................................. 26
14B Estimated Resource Use and Costs per Acre for Field Operations -- Sugarcane,
Harvesting Millable Sugarcane, 1-Row Combine Harvester, 10-Ton High Dump Wagons, Custom Truck/Trailer Haul, Louisiana 2014. .............................................................. 26
15A Estimated Costs per Acre -- Sugarcane,
Harvesting Millable Sugarcane, 2-Row Wholestalk Harvester and Loader, 10-Ton Transfer Wagons, Custom Truck/Trailer Haul, Louisiana 2014. ....................... 27

v
List of Tables (continued) TABLE PAGE 15B Estimated Resource Use and Costs per Acre for Field Operations -- Sugarcane,
Harvesting Millable Sugarcane, 2-Row Wholestalk Harvester and Loader, 10-Ton Transfer Wagons, Custom Truck/Trailer Haul, Louisiana 2014. ....................... 27
LIST OF APPENDIX TABLES TABLE PAGE 1 Estimated Fuel Prices, Labor Wage Rates, and Interest Rates,
Louisiana 2014. ...................................................................................................... 32 2 Tractors: Estimated Useful Life, Annual Use, Purchase Price, Repair Cost,
Fuel Consumption Rate, and Direct and Fixed Cost per Hour, Louisiana 2014. ...................................................................................................... 32
3 Self Propelled Equipment: Estimated Performance Rate, Life, Annual Use,
Purchase Price, Repair Cost, Fuel Use, and Direct and Fixed Costs Per Hour and Per Acre, Louisiana 2014. ................................................................................. 33
4 Implements: Estimated Performance Rate, Life, Annual Use, Purchase Price,
Repair Cost, and Direct and Fixed Costs Per Hour and Per Acre, Louisiana 2014. ...................................................................................................... 33
5 Operating Inputs: Estimated Prices, Louisiana 2014 . ................................................ 34
vi
ACKNOWLEDGMENTS
Many persons played a major role in making this report possible. The authors wish to acknowledge the assistance and advice of cooperating producers, who provided the basic information on production practices, as well as farm suppliers and agribusiness firms for supplying price information. Annual projections of commodity costs and returns are a joint effort of the Department of Agricultural Economics and Agribusiness Farm Management Committee. The authors would like to especially thank the Farm Management Committee for their assistance in preparing these estimates and Dr. Gail Cramer, Department Head, for his review and support in the preparation of this report.
INTERNET ACCESS This publication, along with 2014 projected costs and returns for other commodities as well as other farm management publications, is available on the Internet on the LSU Ag Center web page under “Money and Business - Farm and Business - Budgets”. This publication is also available on the LSU Ag Center web page under “Crops and Livestock - Sugarcane - Economics.” The web address for the LSU Ag Center is: www.lsuagcenter.com

1
PROJECTED COSTS AND RETURNS -- SUGARCANE, LOUISIANA, 2014 by Michael E. Salassi, Michael Deliberto, and Brian M. Hilbun1 INTRODUCTION
This report presents estimates of costs and returns associated with sugarcane production practices in Louisiana for 2014. It is part of a continuing effort to provide farmers, researchers, extension personnel, lending agencies and others working in agriculture and/or agribusiness timely planning information. Sugarcane production is unique in that it is a perennial crop grown in a rotation. Land planted to sugarcane in late summer will be harvested for the following three to five years before replanting is necessary. In addition, processing, storage and marketing services of the raw sugar and molasses final products are provided by the raw sugar factory, taking a share of the crop as payment for these services. Typically, this mill share of the crop is in the range of 37% to 40% of crop proceeds. Further, the large majority of growers are tenant producers, paying a portion of the crop (after mill charges) as rent to landowners. Although some sugarcane land may be cash rented, the majority is leased under a share rental arrangement. The most common share rental arrangement for sugarcane produced in Louisiana is a one-sixth crop share, with a small number of leases using a one-fifth crop share or a one-seventh crop share. Returns shown in Table 1A-3C and in the whole farm analysis in Appendix A reflect returns to management and risk. No charges for family living expenses or management are included as a cost in this analysis. SUGARCANE BUDGETS
The enterprise budgets for tenant-operators producing sugarcane are presented in two formats. One format is a summary of costs and returns for a particular phase of sugarcane production. This format presents costs by broad categories such has fertilizer, herbicides, insecticides, labor, fuel and repairs, etc. The other format presents a detailed listing of the operations, the equipment size and the associated power unit along with the date performed and the associated costs for tractor, machinery and materials. Together these budget formats provide the detailed information necessary to adjust the sugarcane budgets to individual situations. In addition, the appendix to this report contains detailed cost estimates for an extensive list of equipment and operating inputs. These may be used to modify budgets contained in this report or construct new enterprise budgets.
Whole farm income and expense summary tables presented in this report (Tables 1A, 2A and
3A) present estimates of projected income and expenses for a sugarcane farming operation on 1,000 acres of sugarcane. A mill charge of 39.0% and a crop share land charge of 16.7% (a one-sixth crop share lease after mill charges) are used. Under these assumptions, the distribution of crop proceeds are as follows: 39.0% to the mill, 50.8% to the grower, and 10.2% to the landlord.
1 Professor and Research Associates, Department of Agricultural Economics and Agribusiness, Louisiana Agricultural Experiment Station, Louisiana State University Agricultural Center, Baton Rouge, Louisiana.
2
This report presents 2014 projected costs and returns associated with the various phases of
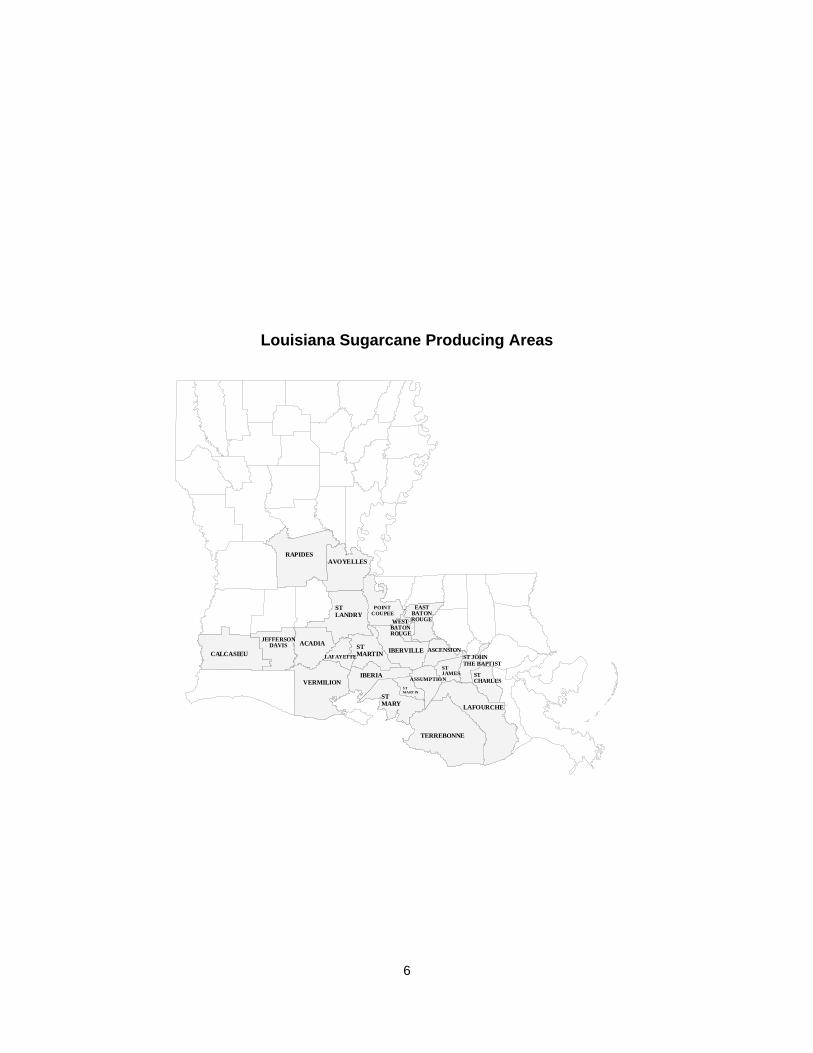
sugarcane production using three row machinery and the production practices followed by most growers in the main sugarcane producing area of the state (see figure on page 6). Fertilizer and chemical rates were based on recommendations of the LSU Agricultural Center.2,3 Only tenant-operator budgets are presented in this report, reflecting the predominant share rent land tenure situation. The landlord does not share in any of the production expenses other than seed cane (in the form of reduced current year income) and provides little assistance in maintaining or improving farm housing, drainage, and roads.
Determination of costs associated with sugarcane is not a straight forward process. The uniqueness of the production rotation normally associated with sugarcane coupled with the fact that a portion of the rotation is non-income generating creates some difficulty. Thus, the sugarcane budgets presented in this report reflect costs per acre of land. Returns are based on pounds of raw sugar and gallons of molasses per acre of land harvested. Yield information used in estimating income in these budgets is based on typical yield levels per harvested acre. These typical yield levels reflect the approximate state-level sugarcane yield per acre harvested for sugar. Grower income reflects the usual disposition of raw sugar and molasses between the grower, landlord and mill.4
Projections of harvest costs are included for 1 and 2-row wholestalk (soldier) harvesters. The harvest budgets (Tables 14 and 15) includes the costs of hauling cane directly from the field to the mill (direct haul) with tractors using two 10-ton cane wagons. Under this scenario, the hauling rebate from the mill would be paid to the producer.
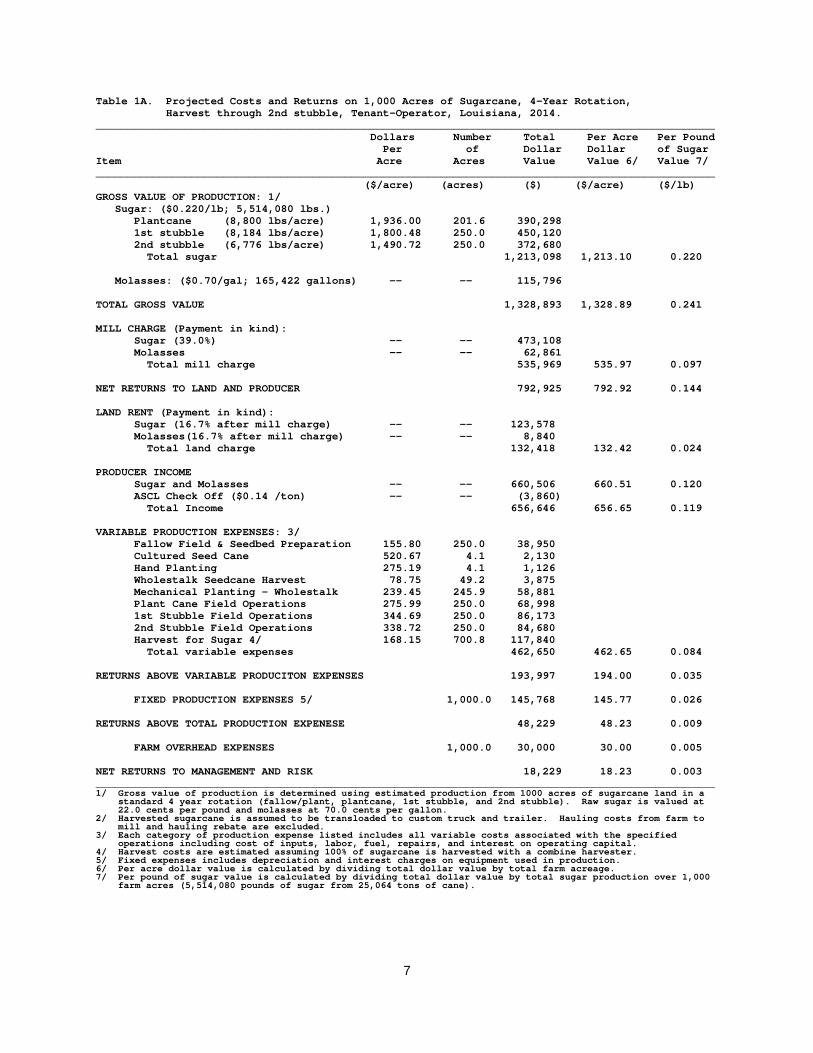
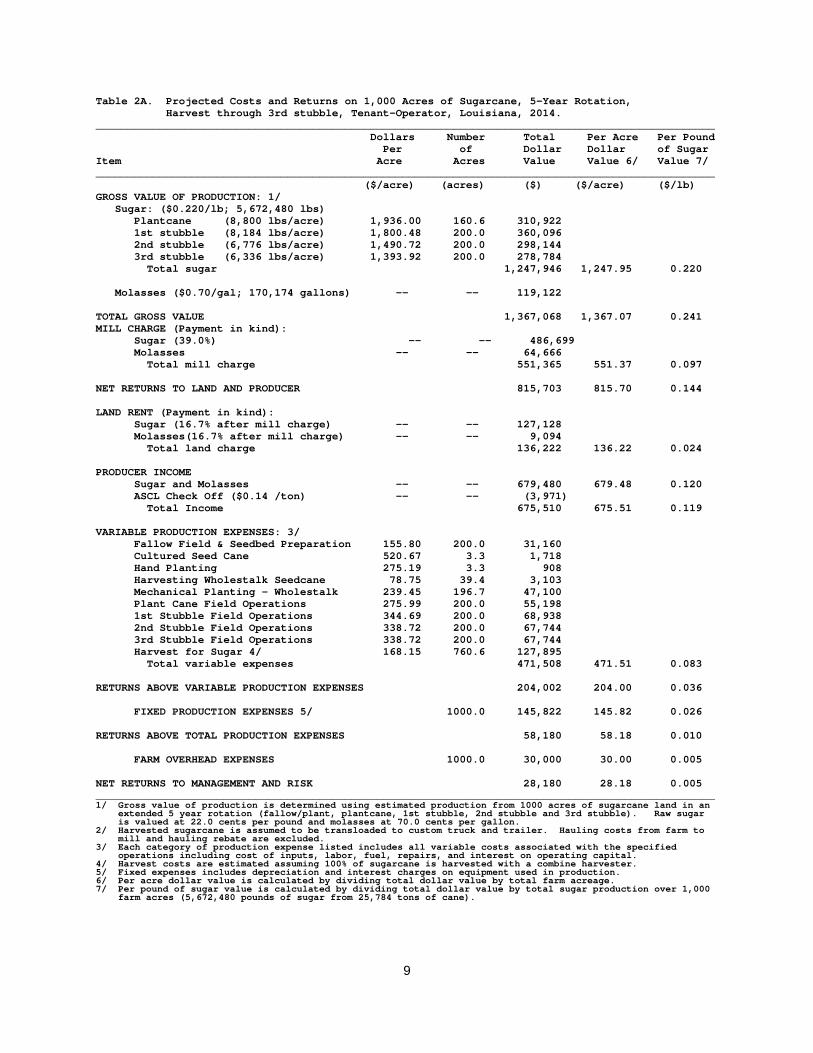
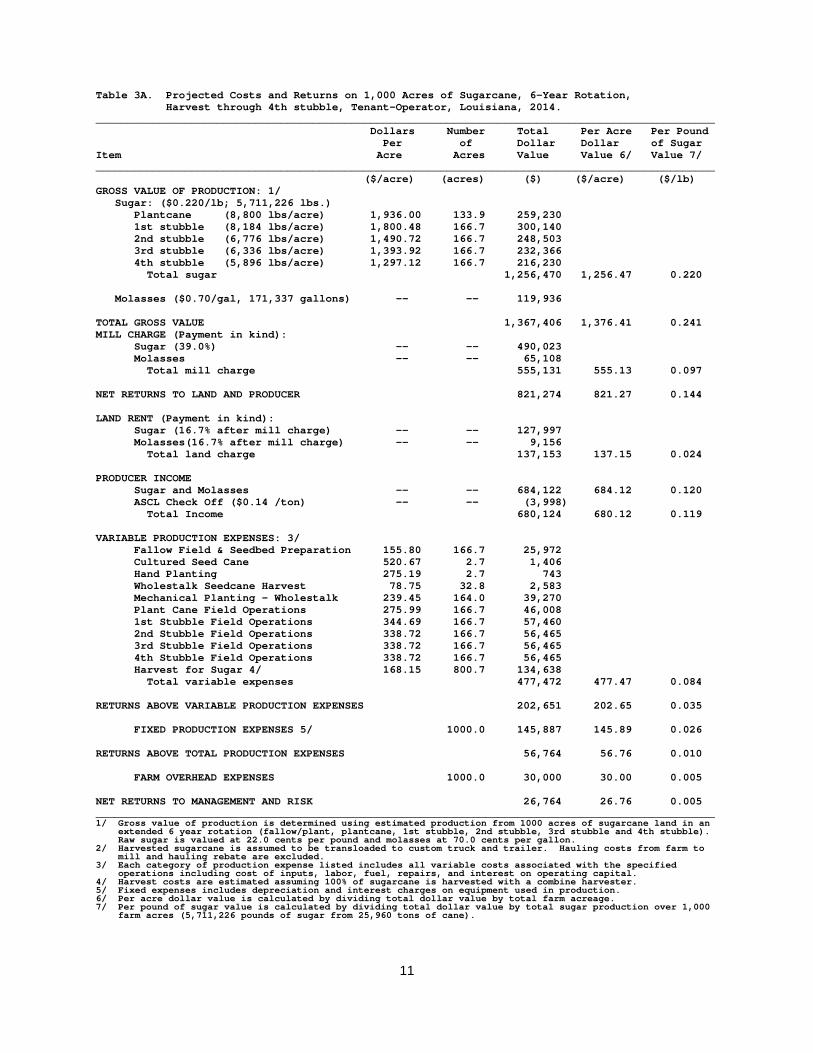
Projected total costs and returns for sugarcane production on a representative 1000 acre farm are shown in Table 1A, 2A, and 3A. Table 1A uses a 4-year land rotation with 250 acres each of plantcane, first stubble, second stubble, and fallow/plant. Table 2A uses a 5-year rotation with 200 acres of plantcane, first stubble, second stubble, third stubble and fallow/plant. Table 3A uses a 6-year rotation with 167 acres of plantcane, first stubble, second stubble, third stubble, fourth stubble, and fallow/plant. Gross value of production is shown, along with estimated mill and land charges, as well as producer income and expenses for each scenario. Net returns to management and risk are estimated. No charges for management, risk or family living expenses are included.
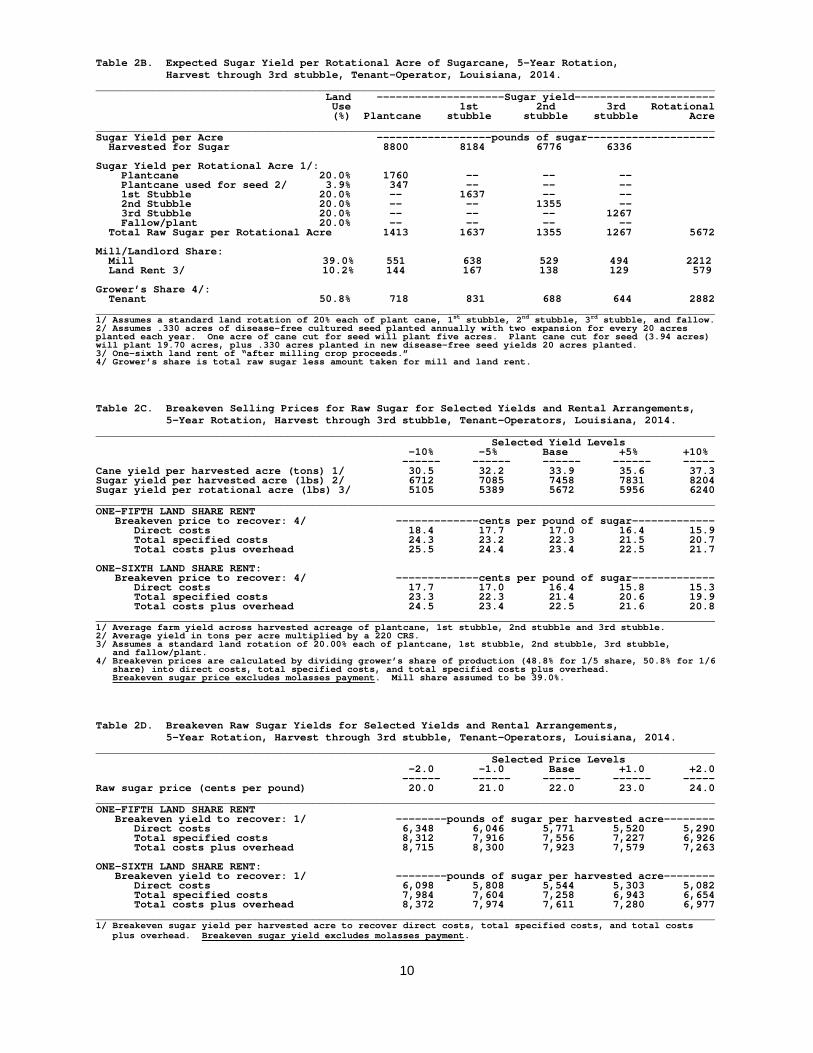
Projected output per rotational acre and its distribution between the grower and suppliers of land and milling services is presented in Table 1B, 2B and 3B. Table 1B reflects the output distribution associated with a 4-year sugarcane rotation and approximates the projected average
2 “Sugarcane Fertilization,” Sugarcane Production Handbook – 2001, Louisiana State
University Agricultural Center, Baton Rouge, LA, Pub. No. 2859.
3 “Controlling Weeds in Sugarcane,” Sugarcane Production Handbook – 2001, Louisiana State University Agricultural Center, Baton Rouge, LA, Pub. No. 2859.
4 In a typical situation, sugar mills would retain about 39 percent of the raw sugar and slightly more than 50 percent of the molasses to cover hauling and processing of sugarcane and storage and marketing of raw sugar. Landlords normally retain 16.7 percent of the remaining raw sugar and molasses for land rent under a one-sixth crop share lease arrangement.
3
yield levels in 2014 for established producers. Sugarcane land under a standard rotation is assumed to have 25 percent each of land in plant cane, first stubble, second stubble, and fallow/plant. Sugar output per rotational for land under an extended 5-year and 6-year rotation, with harvest through third stubble and fourth stubble, respectively, are shown in Tables 2B and 3B. Sugar yields for plantcane and stubble crops presented in this report are based on research results from outfield variety trials for commercial varieties of sugarcane currently grown in Louisiana, adjusted to reflect average producer yields.5
Tables 1C, 2C and 3C presents breakeven raw sugar selling prices required to cover production costs for selected yield levels and rental arrangements. Base yield level reflects budgeted yields included in Tables 1A, 2A and 3A. Distribution shares of sugar production to mill, landlord, and grower, in pounds of sugar per rotational acre, are shown for a 1/5 and a 1/6 share rent arrangement. Breakeven prices per pound of raw sugar are calculated by dividing grower’s share of production into direct costs, total specified costs, and total specified costs plus overhead expenses. PROCEDURE
Survey data collected from sugarcane producers provided basic production practice, equipment and input information. The survey indicated that farm size was increasing. Producer’s complement of tractors were larger, and the use of high clearance tractors with mechanical front wheel drive was common. Producers are cultivating both fallow and cane crops more. Nearly all producers use cultured seed cane in their clean seed program. They were or intended on keeping some stubble beyond the standard 4 year rotations.
Current estimates of machinery and other input costs were used in conjunction with the production practices and input data to estimate costs of production for sugarcane. Input price data were collected in late 2013 from farm suppliers throughout the sugarcane producing area to provide a basis for estimating projected 2014 budgets. Machinery price data were obtained from machinery dealers in 2012. Detailed machinery cost data are shown in the Appendix.
The general procedure used in this report was to apply current machinery and other input price data to the production practices noted above. Production practice data were based on a sample of sugarcane farms randomly drawn by size of farm and area. In an effort to simplify the budgets, individual budgets for separate production areas and soil types were eliminated. The costs associated with operations specific to certain areas or situations can be added to any budget to more accurately match a specific farm situation.
Sugarcane budgets presented in this report were developed using a microcomputer enterprise budget generator program. The budget generator is a computer program that specifies a system of sequential computational procedures for calculating costs and returns associated with the production of a specific agricultural commodity. It also includes report writing features for printing the final budget(s) in standardized terminology. The user specifies the data requirements essential for preparation of a particular budget (e.g. field operations, input quantities and prices, interest rates, fuel consumption, etc.). The user dictates the computations to be made and data sets used for the selected computations to be made. Functions, such as repair costs, depreciation and performance rates for machinery and equipment are specified by the user of the budget generator.
5 “Sugarcane Outfield Variety Trials,” Sugarcane Research, Annual Progress Report – 2012, Louisiana State University Agricultural Center, Baton Rouge, LA.
4
While selected data sets may be stored in the system, the user has the prerogative of substituting data. The responsibility for selection of appropriate data sets used in the program rests with the user. The program includes standardized procedures for developing estimates for selected data elements for users with limited information.
Budget information is presented for ten activity sets, an overhead budget, and projected revenues. The activities include breaking stubble and fallow operations, seedbed preparation, cutting and planting seed cane (propagated and field run), cultural regimes for the plant cane and first stubble, second stubble and older and succession planting on a per acre of land basis. An individual may select those budgets that fit his "unique" situation to develop cost and return estimates reflecting his land situation and production activities. Machinery Costs
Machinery cost data for implements were obtained from annual surveys of machinery dealers. In addition, these data were supplemented with data from a recent issue of Official Guide, Tractors and Farm Equipment.6 Purchase prices for machinery items used in this report may be found in the Appendix. Purchase prices for tractors and harvesting equipment were updated in 2014. Appendix Tables 1-4 provide pertinent information used to compute direct and fixed costs per acre and per hour for new powered and towed machines. Machinery performance rates are based on survey data collected from sugarcane producers. These tables are the basis for all machinery costs shown in the budgets and accompanying tables. Price Data
Input price data reflect current quotes obtained from suppliers of agricultural chemicals and services in the area, Appendix Tables 1 and 5. These data were used as a basis for estimating input costs for 2014. Chemical weed control practices are identified as individual operations within the production sequence. Materials are designated by common name and reflect recommended rates. Chemical names are for identification purposes only and do not constitute endorsement of these products.
Regular hired farm labor was charged at $9.60 per hour. This wage rate includes a $7.50 per hour basic wage rate plus additional costs (27.65%) for social security, Medicare, and workman’s compensation (6.2%, 1.45%, 20%). Operator labor was charged at $15.30 per hour, which includes a basic wage rate of $12.00 per hour plus (27.65%) for social security, Medicare, and workman’s compensation (6.2%, 1.45%, 20%). Labor charged at the lower rate includes time spent operating tractors as well as time spent in direct support of any field operation, while labor charged at the higher rate reflects only the time required for operating self-propelled (harvest) machines. It is recognized that full time labor is not generally available on an hourly basis. However, for a single enterprise, the hourly charge represents a practical approach for charging the enterprise for labor necessary to produce that enterprise.
Interest on operating capital was charged at 3.75 percent. Operating capital was assumed borrowed only for the length of time necessary to secure inputs in a timely fashion. Diesel fuel was priced at $3.30 per gallon and regular gasoline at $3.30 per gallon. Variable costs for operating
6 Official Guide Tractors and Farm Equipment. St. Louis: National Farm and Power
Services, Inc., Fall 1993.

5
tractors and self-propelled machines include fuel, lubrication and repairs. Variable costs for machinery items include lubrication and repairs. The "sequence of operations" tables for each production activity show both variable and fixed costs per acre for performing each machine operation. The non-land capital or intermediate term interest rate was charged at a historical real rate of 4.50 percent.
Product price projections were made in January 2014, based primarily upon existing supply
and use and government program information. Price forecasting at this time has a low degree of reliability since most factors affecting both supply and demand cannot be ascertained at this time. However, the product price estimates are made for the primary purpose of making comparative evaluations among alternative sugarcane production systems or across alternative crops. Return estimates in this report are computed using a $0.220 per pound raw sugar market price and a selling price for molasses of $0.70 per gallon. Overhead Costs
Overhead costs reflect significant expenses associated with the operation of the entire farm business, but are not necessarily attributable to a specific enterprise. Examples of farm overhead costs include tax services, record keeping, utilities, farmstead maintenance, and insurance and property taxes where applicable.
Overhead cost projections presented in this report are based on the 2000 ERS survey of overhead costs. This survey is conducted every three to eight years. Methodology and detailed information can be found on the ERS website at http://www.ers.usda.gov. Forecasts for general farm overhead, and taxes and insurance for corn, soybeans, cotton and rice for regions that include Louisiana for 2005 were averaged. The percentage difference between 2005 and the projected costs for 2014 for each crop national average was calculated and these were averaged. The 2005 regional average was then increased by this average to produce the figure used in this report.
Projected enterprise budgets for sugarcane production included in this report incorporate the variable and fixed cost overhead components as a single lump sum. The total overhead costs for a farm firm are related to tenure and size of business. The overhead costs included in this report were estimated on a per acre basis, and thus are included on a per acre of land use basis. Machinery Size
The budgets in this report are based on typical size machines for performing each of the various operations. Appendix Tables 2 and 3 present information for each of the machines used in the budgets found in this report. This machinery information (Appendix Tables 2 and 3) can be used to adjust machinery costs and labor requirements for budgets presented in this report to fit a particular farm situation.
6
Louisiana Sugarcane Producing Areas
STLANDRY
AVOYELLES
STMARTIN
STMART IN
ACADIA
VERMILIONIBERIA
STMARY
TERREBONNE
LAFOURCHE
STCHARLES
ST JOHNTHE BAPTIST
STJAMES
ASSUMPTION
ASCENSIONIBERVILLE
EASTBATONROUGEWEST
BATONROUGE
POINTCOUPEE
JEFFERSONDAVIS
CALCASIEU LAFAYETTE
RAPIDES
7
Table 1A. Projected Costs and Returns on 1,000 Acres of Sugarcane, 4-Year Rotation, Harvest through 2nd stubble, Tenant-Operator, Louisiana, 2014. _________________________________________________________________________________________________ Dollars Number Total Per Acre Per Pound Per of Dollar Dollar of Sugar Item Acre Acres Value Value 6/ Value 7/ _________________________________________________________________________________________________ ($/acre) (acres) ($) ($/acre) ($/lb) GROSS VALUE OF PRODUCTION: 1/ Sugar: ($0.220/lb; 5,514,080 lbs.) Plantcane (8,800 lbs/acre) 1,936.00 201.6 390,298 1st stubble (8,184 lbs/acre) 1,800.48 250.0 450,120 2nd stubble (6,776 lbs/acre) 1,490.72 250.0 372,680 Total sugar 1,213,098 1,213.10 0.220 Molasses: ($0.70/gal; 165,422 gallons) -- -- 115,796
TOTAL GROSS VALUE 1,328,893 1,328.89 0.241 MILL CHARGE (Payment in kind): Sugar (39.0%) -- -- 473,108 Molasses -- -- 62,861 Total mill charge 535,969 535.97 0.097 NET RETURNS TO LAND AND PRODUCER 792,925 792.92 0.144 LAND RENT (Payment in kind): Sugar (16.7% after mill charge) -- -- 123,578 Molasses(16.7% after mill charge) -- -- 8,840 Total land charge 132,418 132.42 0.024 PRODUCER INCOME Sugar and Molasses -- -- 660,506 660.51 0.120 ASCL Check Off ($0.14 /ton) -- -- (3,860) Total Income 656,646 656.65 0.119 VARIABLE PRODUCTION EXPENSES: 3/ Fallow Field & Seedbed Preparation 155.80 250.0 38,950 Cultured Seed Cane 520.67 4.1 2,130 Hand Planting 275.19 4.1 1,126 Wholestalk Seedcane Harvest 78.75 49.2 3,875 Mechanical Planting - Wholestalk 239.45 245.9 58,881 Plant Cane Field Operations 275.99 250.0 68,998 1st Stubble Field Operations 344.69 250.0 86,173 2nd Stubble Field Operations 338.72 250.0 84,680 Harvest for Sugar 4/ 168.15 700.8 117,840 Total variable expenses 462,650 462.65 0.084 RETURNS ABOVE VARIABLE PRODUCITON EXPENSES 193,997 194.00 0.035 FIXED PRODUCTION EXPENSES 5/ 1,000.0 145,768 145.77 0.026 RETURNS ABOVE TOTAL PRODUCTION EXPENESE 48,229 48.23 0.009 FARM OVERHEAD EXPENSES 1,000.0 30,000 30.00 0.005 NET RETURNS TO MANAGEMENT AND RISK 18,229 18.23 0.003 _________________________________________________________________________________________________ 1/ Gross value of production is determined using estimated production from 1000 acres of sugarcane land in a standard 4 year rotation (fallow/plant, plantcane, 1st stubble, and 2nd stubble). Raw sugar is valued at 22.0 cents per pound and molasses at 70.0 cents per gallon. 2/ Harvested sugarcane is assumed to be transloaded to custom truck and trailer. Hauling costs from farm to mill and hauling rebate are excluded. 3/ Each category of production expense listed includes all variable costs associated with the specified operations including cost of inputs, labor, fuel, repairs, and interest on operating capital. 4/ Harvest costs are estimated assuming 100% of sugarcane is harvested with a combine harvester. 5/ Fixed expenses includes depreciation and interest charges on equipment used in production. 6/ Per acre dollar value is calculated by dividing total dollar value by total farm acreage. 7/ Per pound of sugar value is calculated by dividing total dollar value by total sugar production over 1,000 farm acres (5,514,080 pounds of sugar from 25,064 tons of cane).

8
Table 1B. Expected Sugar Yield per Rotational Acre of Sugarcane, 4-Year Rotation, Harvest through 2nd stubble, Tenant-Operator, Louisiana, 2014. _________________________________________________________________________________________________ Land -------------------Sugar yield----------------------- Use 1st 2nd Rotational (%) Plantcane stubble stubble Acre _________________________________________________________________________________________________ Sugar Yield per Acre -----------------pounds of sugar--------------------- Harvested for Sugar 8800 8184 6776 Sugar Yield per Rotational Acre 1/: Plantcane 25.0% 2200 -- -- Plantcane used for seed 2/ 4.9% 433 -- -- 1st Stubble 25.0% -- 2046 -- 2nd Stubble 25.0% -- -- 1694 Fallow/plant 25.0% -- -- -- Total Raw Sugar per Rotational Acre 1767 2046 1694 5507 Mill/Landlord Share: Mill 39.0% 689 798 661 2148 Land Rent 3/ 10.2% 180 209 173 562 Grower’s Share 4/: Tenant 50.8% 898 1039 861 2798 _________________________________________________________________________________________________ 1/ Assumes a standard rotation of 25% each of plantcane, 1st stubble, 2nd stubble, and fallow/plant. 2/ Assumes .409 acres of disease-free cultured seed planted annually with two expansions of plant cane and first stubble cultured seed cane crops, using a 5:1 planting ratio, for every 25 acres planted each year. Plantcane cut for seed (4.92 acres) will plant 24.6 acres, plus .409 acres planted in cultured seed, yields 25 acres planted. 3/ One-sixth land rent of “after milling crop proceeds.” 4/ Grower’s share is total raw sugar less amount taken for mill and land rent. Table 1C. Breakeven Selling Prices for Raw Sugar for Selected Yields and Rental Arrangements, 4-Year Rotation, Harvest through 2nd stubble, Tenant-Operators, Louisiana, 2014. _________________________________________________________________________________________________ Selected Yield Levels -20% -10% Base +10% +20% ------ ------ ------ ------ ----- Cane yield per harvested acre (tons) 1/ 28.6 32.1 35.7 39.3 42.8 Sugar yield per harvested acre (lbs) 2/ 6283 7069 7854 8639 9425 Sugar yield per rotational acre (lbs) 3/ 4406 4956 5507 6058 6608 _________________________________________________________________________________________________ ONE-FIFTH LAND SHARE RENT Breakeven price to recover: 4/ -------------cents per pound of sugar------------- Direct costs 20.4 18.6 17.2 16.0 15.1 Total specified costs 27.2 24.6 22.6 21.0 19.6 Total costs plus overhead 28.6 25.9 23.7 22.0 20.5 ONE-SIXTH LAND SHARE RENT: Breakeven price to recover: 4/ -------------cents per pound of sugar------------- Direct costs 19.6 17.9 16.5 15.4 14.5 Total specified costs 26.1 23.7 21.7 20.1 18.8 Total costs plus overhead 27.4 24.8 22.8 21.1 19.7 _________________________________________________________________________________________________ 1/ Average farm yield across harvested acreage of plantcane, 1st stubble and 2nd stubble. 2/ Average yield in tons per acre multiplied by a 220 CRS. 3/ Assumes a standard land rotation of 25% each of plantcane, 1st stubble, 2nd stubble, and fallow/plant. 4/ Breakeven prices are calculated by dividing grower’s share of production (48.8% for 1/5 share, 50.8% for 1/6 share) into direct costs, total specified costs, and total specified costs plus overhead. Breakeven sugar price excludes molasses payment. Mill share assumed to be 39.0%.
Table 1D. Breakeven Raw Sugar Yields for Selected Yields and Rental Arrangements, 4-Year Rotation, Harvest through 2nd stubble, Tenant-Operators, Louisiana, 2014. _________________________________________________________________________________________________ Selected Price Levels -1.0 -0.5 Base +0.5 +1.0 ------ ------ ------ ------ ----- Raw sugar price (cents per pound) 21.0 21.5 22.0 22.5 23.0 _________________________________________________________________________________________________ ONE-FIFTH LAND SHARE RENT Breakeven yield to recover: 1/ --------pounds of sugar per harvested acre-------- Direct costs 6,440 6,290 6,147 6,011 5,880 Total specified costs 8,469 8,272 8,084 7,905 7,733 Total costs plus overhead 8,887 8,680 8,483 8,294 8,114 ONE-SIXTH LAND SHARE RENT: Breakeven yield to recover: 1/ --------pounds of sugar per harvested acre-------- Direct costs 6,187 6,043 5,905 5,774 5,649 Total specified costs 8,136 7,947 7,766 7,593 7,428 Total costs plus overhead 8,537 8,338 8,149 7,968 7,795 _________________________________________________________________________________________________ 1/ Breakeven sugar yield per harvested acre to recover direct costs, total specified costs, and total costs plus overhead. Breakeven sugar yield excludes molasses payment.
9
Table 2A. Projected Costs and Returns on 1,000 Acres of Sugarcane, 5-Year Rotation, Harvest through 3rd stubble, Tenant-Operator, Louisiana, 2014. _________________________________________________________________________________________________ Dollars Number Total Per Acre Per Pound Per of Dollar Dollar of Sugar Item Acre Acres Value Value 6/ Value 7/ _________________________________________________________________________________________________ ($/acre) (acres) ($) ($/acre) ($/lb) GROSS VALUE OF PRODUCTION: 1/ Sugar: ($0.220/lb; 5,672,480 lbs) Plantcane (8,800 lbs/acre) 1,936.00 160.6 310,922 1st stubble (8,184 lbs/acre) 1,800.48 200.0 360,096 2nd stubble (6,776 lbs/acre) 1,490.72 200.0 298,144 3rd stubble (6,336 lbs/acre) 1,393.92 200.0 278,784 Total sugar 1,247,946 1,247.95 0.220
Molasses ($0.70/gal; 170,174 gallons) -- -- 119,122
TOTAL GROSS VALUE 1,367,068 1,367.07 0.241 MILL CHARGE (Payment in kind): Sugar (39.0%) -- -- 486,699 Molasses -- -- 64,666 Total mill charge 551,365 551.37 0.097 NET RETURNS TO LAND AND PRODUCER 815,703 815.70 0.144 LAND RENT (Payment in kind): Sugar (16.7% after mill charge) -- -- 127,128 Molasses(16.7% after mill charge) -- -- 9,094 Total land charge 136,222 136.22 0.024 PRODUCER INCOME Sugar and Molasses -- -- 679,480 679.48 0.120 ASCL Check Off ($0.14 /ton) -- -- (3,971) Total Income 675,510 675.51 0.119 VARIABLE PRODUCTION EXPENSES: 3/ Fallow Field & Seedbed Preparation 155.80 200.0 31,160 Cultured Seed Cane 520.67 3.3 1,718 Hand Planting 275.19 3.3 908 Harvesting Wholestalk Seedcane 78.75 39.4 3,103 Mechanical Planting - Wholestalk 239.45 196.7 47,100 Plant Cane Field Operations 275.99 200.0 55,198 1st Stubble Field Operations 344.69 200.0 68,938 2nd Stubble Field Operations 338.72 200.0 67,744 3rd Stubble Field Operations 338.72 200.0 67,744 Harvest for Sugar 4/ 168.15 760.6 127,895 Total variable expenses 471,508 471.51 0.083 RETURNS ABOVE VARIABLE PRODUCTION EXPENSES 204,002 204.00 0.036 FIXED PRODUCTION EXPENSES 5/ 1000.0 145,822 145.82 0.026 RETURNS ABOVE TOTAL PRODUCTION EXPENSES 58,180 58.18 0.010 FARM OVERHEAD EXPENSES 1000.0 30,000 30.00 0.005 NET RETURNS TO MANAGEMENT AND RISK 28,180 28.18 0.005 _________________________________________________________________________________________________ 1/ Gross value of production is determined using estimated production from 1000 acres of sugarcane land in an extended 5 year rotation (fallow/plant, plantcane, 1st stubble, 2nd stubble and 3rd stubble). Raw sugar is valued at 22.0 cents per pound and molasses at 70.0 cents per gallon. 2/ Harvested sugarcane is assumed to be transloaded to custom truck and trailer. Hauling costs from farm to mill and hauling rebate are excluded. 3/ Each category of production expense listed includes all variable costs associated with the specified operations including cost of inputs, labor, fuel, repairs, and interest on operating capital. 4/ Harvest costs are estimated assuming 100% of sugarcane is harvested with a combine harvester. 5/ Fixed expenses includes depreciation and interest charges on equipment used in production. 6/ Per acre dollar value is calculated by dividing total dollar value by total farm acreage. 7/ Per pound of sugar value is calculated by dividing total dollar value by total sugar production over 1,000 farm acres (5,672,480 pounds of sugar from 25,784 tons of cane).
10
Table 2B. Expected Sugar Yield per Rotational Acre of Sugarcane, 5-Year Rotation, Harvest through 3rd stubble, Tenant-Operator, Louisiana, 2014. _________________________________________________________________________________________________ Land --------------------Sugar yield---------------------- Use 1st 2nd 3rd Rotational (%) Plantcane stubble stubble stubble Acre _________________________________________________________________________________________________ Sugar Yield per Acre ------------------pounds of sugar-------------------- Harvested for Sugar 8800 8184 6776 6336 Sugar Yield per Rotational Acre 1/: Plantcane 20.0% 1760 -- -- -- Plantcane used for seed 2/ 3.9% 347 -- -- -- 1st Stubble 20.0% -- 1637 -- -- 2nd Stubble 20.0% -- -- 1355 -- 3rd Stubble 20.0% -- -- -- 1267 Fallow/plant 20.0% -- -- -- -- Total Raw Sugar per Rotational Acre 1413 1637 1355 1267 5672 Mill/Landlord Share: Mill 39.0% 551 638 529 494 2212 Land Rent 3/ 10.2% 144 167 138 129 579 Grower’s Share 4/: Tenant 50.8% 718 831 688 644 2882 _________________________________________________________________________________________________ 1/ Assumes a standard land rotation of 20% each of plant cane, 1st stubble, 2nd stubble, 3rd stubble, and fallow. 2/ Assumes .330 acres of disease-free cultured seed planted annually with two expansion for every 20 acres planted each year. One acre of cane cut for seed will plant five acres. Plant cane cut for seed (3.94 acres) will plant 19.70 acres, plus .330 acres planted in new disease-free seed yields 20 acres planted. 3/ One-sixth land rent of “after milling crop proceeds.” 4/ Grower’s share is total raw sugar less amount taken for mill and land rent. Table 2C. Breakeven Selling Prices for Raw Sugar for Selected Yields and Rental Arrangements, 5-Year Rotation, Harvest through 3rd stubble, Tenant-Operators, Louisiana, 2014. _________________________________________________________________________________________________ Selected Yield Levels -10% -5% Base +5% +10% ------ ------ ------ ------ ----- Cane yield per harvested acre (tons) 1/ 30.5 32.2 33.9 35.6 37.3 Sugar yield per harvested acre (lbs) 2/ 6712 7085 7458 7831 8204 Sugar yield per rotational acre (lbs) 3/ 5105 5389 5672 5956 6240 _________________________________________________________________________________________________ ONE-FIFTH LAND SHARE RENT Breakeven price to recover: 4/ -------------cents per pound of sugar------------- Direct costs 18.4 17.7 17.0 16.4 15.9 Total specified costs 24.3 23.2 22.3 21.5 20.7 Total costs plus overhead 25.5 24.4 23.4 22.5 21.7 ONE-SIXTH LAND SHARE RENT: Breakeven price to recover: 4/ -------------cents per pound of sugar------------- Direct costs 17.7 17.0 16.4 15.8 15.3 Total specified costs 23.3 22.3 21.4 20.6 19.9 Total costs plus overhead 24.5 23.4 22.5 21.6 20.8 _________________________________________________________________________________________________ 1/ Average farm yield across harvested acreage of plantcane, 1st stubble, 2nd stubble and 3rd stubble. 2/ Average yield in tons per acre multiplied by a 220 CRS. 3/ Assumes a standard land rotation of 20.00% each of plantcane, 1st stubble, 2nd stubble, 3rd stubble, and fallow/plant. 4/ Breakeven prices are calculated by dividing grower’s share of production (48.8% for 1/5 share, 50.8% for 1/6 share) into direct costs, total specified costs, and total specified costs plus overhead. Breakeven sugar price excludes molasses payment. Mill share assumed to be 39.0%. Table 2D. Breakeven Raw Sugar Yields for Selected Yields and Rental Arrangements, 5-Year Rotation, Harvest through 3rd stubble, Tenant-Operators, Louisiana, 2014. _________________________________________________________________________________________________ Selected Price Levels -2.0 -1.0 Base +1.0 +2.0 ------ ------ ------ ------ ----- Raw sugar price (cents per pound) 20.0 21.0 22.0 23.0 24.0 _________________________________________________________________________________________________ ONE-FIFTH LAND SHARE RENT Breakeven yield to recover: 1/ --------pounds of sugar per harvested acre-------- Direct costs 6,348 6,046 5,771 5,520 5,290 Total specified costs 8,312 7,916 7,556 7,227 6,926 Total costs plus overhead 8,715 8,300 7,923 7,579 7,263 ONE-SIXTH LAND SHARE RENT: Breakeven yield to recover: 1/ --------pounds of sugar per harvested acre-------- Direct costs 6,098 5,808 5,544 5,303 5,082 Total specified costs 7,984 7,604 7,258 6,943 6,654 Total costs plus overhead 8,372 7,974 7,611 7,280 6,977 _________________________________________________________________________________________________ 1/ Breakeven sugar yield per harvested acre to recover direct costs, total specified costs, and total costs plus overhead. Breakeven sugar yield excludes molasses payment.
11
Table 3A. Projected Costs and Returns on 1,000 Acres of Sugarcane, 6-Year Rotation, Harvest through 4th stubble, Tenant-Operator, Louisiana, 2014. _________________________________________________________________________________________________ Dollars Number Total Per Acre Per Pound Per of Dollar Dollar of Sugar Item Acre Acres Value Value 6/ Value 7/ _________________________________________________________________________________________________ ($/acre) (acres) ($) ($/acre) ($/lb) GROSS VALUE OF PRODUCTION: 1/ Sugar: ($0.220/lb; 5,711,226 lbs.) Plantcane (8,800 lbs/acre) 1,936.00 133.9 259,230 1st stubble (8,184 lbs/acre) 1,800.48 166.7 300,140 2nd stubble (6,776 lbs/acre) 1,490.72 166.7 248,503 3rd stubble (6,336 lbs/acre) 1,393.92 166.7 232,366 4th stubble (5,896 lbs/acre) 1,297.12 166.7 216,230 Total sugar 1,256,470 1,256.47 0.220
Molasses ($0.70/gal, 171,337 gallons) -- -- 119,936
TOTAL GROSS VALUE 1,367,406 1,376.41 0.241 MILL CHARGE (Payment in kind): Sugar (39.0%) -- -- 490,023 Molasses -- -- 65,108 Total mill charge 555,131 555.13 0.097 NET RETURNS TO LAND AND PRODUCER 821,274 821.27 0.144 LAND RENT (Payment in kind): Sugar (16.7% after mill charge) -- -- 127,997 Molasses(16.7% after mill charge) -- -- 9,156 Total land charge 137,153 137.15 0.024 PRODUCER INCOME Sugar and Molasses -- -- 684,122 684.12 0.120 ASCL Check Off ($0.14 /ton) -- -- (3,998) Total Income 680,124 680.12 0.119 VARIABLE PRODUCTION EXPENSES: 3/ Fallow Field & Seedbed Preparation 155.80 166.7 25,972 Cultured Seed Cane 520.67 2.7 1,406 Hand Planting 275.19 2.7 743 Wholestalk Seedcane Harvest 78.75 32.8 2,583 Mechanical Planting - Wholestalk 239.45 164.0 39,270 Plant Cane Field Operations 275.99 166.7 46,008 1st Stubble Field Operations 344.69 166.7 57,460 2nd Stubble Field Operations 338.72 166.7 56,465 3rd Stubble Field Operations 338.72 166.7 56,465 4th Stubble Field Operations 338.72 166.7 56,465 Harvest for Sugar 4/ 168.15 800.7 134,638 Total variable expenses 477,472 477.47 0.084 RETURNS ABOVE VARIABLE PRODUCTION EXPENSES 202,651 202.65 0.035 FIXED PRODUCTION EXPENSES 5/ 1000.0 145,887 145.89 0.026 RETURNS ABOVE TOTAL PRODUCTION EXPENSES 56,764 56.76 0.010 FARM OVERHEAD EXPENSES 1000.0 30,000 30.00 0.005 NET RETURNS TO MANAGEMENT AND RISK 26,764 26.76 0.005 _________________________________________________________________________________________________ 1/ Gross value of production is determined using estimated production from 1000 acres of sugarcane land in an extended 6 year rotation (fallow/plant, plantcane, 1st stubble, 2nd stubble, 3rd stubble and 4th stubble). Raw sugar is valued at 22.0 cents per pound and molasses at 70.0 cents per gallon. 2/ Harvested sugarcane is assumed to be transloaded to custom truck and trailer. Hauling costs from farm to mill and hauling rebate are excluded. 3/ Each category of production expense listed includes all variable costs associated with the specified operations including cost of inputs, labor, fuel, repairs, and interest on operating capital. 4/ Harvest costs are estimated assuming 100% of sugarcane is harvested with a combine harvester. 5/ Fixed expenses includes depreciation and interest charges on equipment used in production. 6/ Per acre dollar value is calculated by dividing total dollar value by total farm acreage. 7/ Per pound of sugar value is calculated by dividing total dollar value by total sugar production over 1,000 farm acres (5,711,226 pounds of sugar from 25,960 tons of cane).
12
Table 3B. Expected Sugar Yield per Rotational Acre of Sugarcane, 6-Year Rotation, Harvest through 4th stubble, Tenant-Operator, Louisiana, 2014. _________________________________________________________________________________________________ Land --------------------Sugar yield---------------------- Use Plant 1st 2nd 3rd 4th Rotational (%) cane stubble stubble stubble stubble Acre _________________________________________________________________________________________________ Sugar Yield per Acre ------------------pounds of sugar-------------------- Harvested for Sugar 8800 8184 6776 6336 5896 Sugar Yield per Rotational Acre 1/: Plantcane 16.7% 1467 -- -- -- -- Plantcane used for seed 2/ 3.3% 289 -- -- -- -- 1st Stubble 16.7% -- 1364 -- -- -- 2nd Stubble 16.7% -- -- 1130 -- -- 3rd Stubble 16.7% -- -- -- 1056 -- 4th Stubble 16.7% -- -- -- -- 983 Fallow/plant 16.7% -- -- -- -- -- Total Raw Sugar per Rotational Acre 1178 1364 1130 1056 983 5711 Mill/Landlord Share: Mill 39.0% 460 532 441 412 383 2227 Land Rent 3/ 10.2% 120 139 115 108 100 583 Grower’s Share 4/: Tenant 50.8% 599 693 574 537 499 2901 _________________________________________________________________________________________________ 1/ Assumes a standard land rotation of 16.7% each of plant cane, 1st stubble, 2nd stubble, 3rd stubble, 4th stubble, and fallow. 2/ Assumes .273 acres of disease-free cultured seed planted annually with two expansions for every 16.7 acres planted each year. One acre of cane cut for seed will plant five acres. Plant cane cut for seed (3.28 acres) will plant 16.40 acres, plus .273 acres planted in new disease-free seed yields 16.7 acres planted. 3/ One-sixth land rent of “after milling crop proceeds.” 4/ Grower’s share is total raw sugar less amount taken for mill and land rent. Table 3C. Breakeven Selling Prices for Raw Sugar for Selected Yields and Rental Arrangements, 6-Year Rotation, Harvest through 4th stubble, Tenant-Operators, Louisiana, 2014. _________________________________________________________________________________________________ Selected Yield Levels -20% -10% Base +10% +20% ------ ------ ------ ------ ----- Cane yield per harvested acre (tons) 1/ 25.9 29.2 32.4 35.6 38.9 Sugar yield per harvested acre (lbs) 2/ 5702 6415 7128 7841 8554 Sugar yield per rotational acre (lbs) 3/ 4569 5140 5711 6282 6853 _________________________________________________________________________________________________ ONE-FIFTH LAND SHARE RENT Breakeven price to recover: 4/ -------------cents per pound of sugar------------- Direct costs 20.2 18.5 17.1 16.0 15.1 Total specified costs 26.8 24.3 22.4 20.8 19.4 Total costs plus overhead 28.1 25.5 23.4 21.8 20.3 ONE-SIXTH LAND SHARE RENT: Breakeven price to recover: 4/ -------------cents per pound of sugar------------- Direct costs 19.4 17.8 16.5 15.4 14.5 Total specified costs 25.7 23.3 21.5 19.9 18.7 Total costs plus overhead 27.0 24.5 22.5 20.9 19.5 _________________________________________________________________________________________________ 1/ Average farm yield across harvested acreage of plantcane and stubble crops (1st, 2nd, 3rd and 4th). 2/ Average yield in tons per acre multiplied by a 220 CRS. 3/ Assumes a standard land rotation of 16.67% each of plantcane, 1st stubble, 2nd stubble, 3rd stubble, and fallow/plant. 4/ Breakeven prices are calculated by dividing grower’s share of production (48.8% for 1/5 share, 50.8% for 1/6 share) into direct costs, total specified costs, and total specified costs plus overhead. Breakeven sugar price excludes molasses payment. Mill share assumed to be 39.0%.
Table 3D. Breakeven Raw Sugar Yields for Selected Yields and Rental Arrangements, 6-Year Rotation, Harvest through 4th stubble, Tenant-Operators, Louisiana, 2014. _________________________________________________________________________________________________ Selected Price Levels -1.0 -0.5 Base +0.5 +1.0 ------ ------ ------ ------ ----- Raw sugar price (cents per pound) 21.0 21.5 22.0 22.5 23.0 _________________________________________________________________________________________________ ONE-FIFTH LAND SHARE RENT Breakeven yield to recover: 1/ --------pounds of sugar per harvested acre-------- Direct costs 5,817 5,681 5,552 5,429 5,311 Total specified costs 7,594 7,417 7,249 7,088 6,934 Total costs plus overhead 7,959 7,774 7,598 7,429 7,267 ONE-SIXTH LAND SHARE RENT: Breakeven yield to recover: 1/ --------pounds of sugar per harvested acre-------- Direct costs 5,588 5,458 5,334 5,215 5,102 Total specified costs 7,295 7,125 6,963 6,809 6,661 Total costs plus overhead 7,646 7,468 7,299 7,136 6,981 _________________________________________________________________________________________________ 1/ Breakeven sugar yield per harvested acre to recover direct costs, total specified costs, and total costs plus overhead. Breakeven sugar yield excludes molasses payment.
13
Table 4.A Estimated costs per acre, Breaking stubble, fallow activities & seedbed preparation, Sugarcane, Louisiana 2014. _______________________________________________________________________ ITEM UNIT PRICE QUANTITY AMOUNT YOUR FARM _______________________________________________________________________ dollars dollars DIRECT EXPENSES HERBICIDES Roundup Power Max pt 3.13 2.7500 8.61 _________ SERVICE FEE Crop Consultant acre 7.00 1.0000 7.00 _________ LA Hired Labor Tractors hour 9.60 3.0827 29.59 _________ DIESEL FUEL Tractors gal 3.30 24.8144 81.89 _________ REPAIR & MAINTENANCE Implements acre 13.01 1.0000 13.01 _________ Tractors acre 12.87 1.0000 12.87 _________ INTEREST ON OP. CAP. acre 2.84 1.0000 2.84 _________ --------- TOTAL DIRECT EXPENSES 155.80 _________ FIXED EXPENSES Implements acre 17.30 1.0000 17.30 _________ Tractors acre 76.66 1.0000 76.66 _________ --------- TOTAL FIXED EXPENSES 93.96 _________ --------- TOTAL SPECIFIED EXPENSES 249.76 _________ ______________________________________________________________________________________ Table 4.B Estimated resource use and costs for field operations, per acre Breaking stubble, fallow activities & seedbed preparation, Sugarcane, Louisiana 2014. _______________________________________________________________________________________________________________________________________________ POWER UNIT COST EQUIPMENT COST ALLOC LABOR OPERATING/DURABLE INPUT OPERATION/ SIZE/ POWER UNIT PERF TIMES -------------- -------------- ------------- ----------------------- TOTAL OPERATING INPUT UNIT SIZE RATE OVER MTH DIRECT FIXED DIRECT FIXED HOURS COST AMOUNT PRICE COST COST _______________________________________________________________________________________________________________________________________________ ------------dollars----------- dollars ---------dollars--------- SC Disk 20 ft MFWD 190 0.100 2.00 Mar 7.45 6.10 1.54 2.07 0.20 1.92 19.08 SC Drain Cleaner 6 ft MFWD 75 0.080 1.00 Mar 1.12 0.59 0.13 0.13 0.08 0.77 2.74 SC Chisel Plow 13 ft MFWD 190 0.219 1.00 Mar 8.19 6.70 0.97 1.18 0.21 2.11 19.15 SC Land Plane 15 ft MFWD 150 0.300 2.00 Apr 17.87 14.94 1.32 2.65 0.60 5.77 42.55 SC Chisel Plow 13 ft MFWD 190 0.219 1.00 Apr 8.19 6.70 0.97 1.18 0.21 2.11 19.15 SC Disk 20 ft MFWD 190 0.100 1.00 Apr 3.73 3.05 0.77 1.03 0.10 0.96 9.54 SC Disk 20 ft MFWD 190 0.100 1.00 Apr 3.73 3.05 0.77 1.03 0.10 0.96 9.54 SC 3Row (Marker) 18 ft MFWD 150 0.120 1.00 May 3.57 2.99 0.59 0.68 0.12 1.15 8.98 SC 3Row (Hipper) 18 ft MFWD 150 0.120 2.00 May 7.15 5.97 1.37 1.62 0.24 2.30 18.41 SC Drain Cleaner 6 ft MFWD 75 0.080 1.00 May 1.12 0.59 0.13 0.13 0.08 0.77 2.74 Subsoiler 3 shank MFWD 190 0.204 0.50 May 3.81 3.11 0.12 0.29 0.10 0.98 8.31 SC Chisel Plow 23 ft MFWD 190 0.120 0.50 May 2.24 1.83 0.25 0.64 0.06 0.58 5.54 SC 3Row (Hipper) 18 ft MFWD 150 0.120 2.00 May 7.15 5.97 1.37 1.62 0.24 2.30 18.41 SC Drain Cleaner 6 ft MFWD 75 0.080 1.00 May 1.12 0.59 0.13 0.13 0.08 0.77 2.74 SC Boom Sprayer 16 ft MFWD 150 0.120 1.00 Jun 3.57 2.99 0.26 0.27 0.12 1.15 8.24 Roundup Power Max pt 1.3750 3.13 4.30 4.30 SC 3Row Plow 18 ft MFWD 190 0.120 1.00 Jul 4.47 3.66 1.11 1.31 0.12 1.15 11.70 SC Drain Cleaner 6 ft MFWD 75 0.080 1.00 Jul 1.12 0.59 0.13 0.13 0.08 0.77 2.74 SC Boom Sprayer 16 ft MFWD 150 0.120 1.00 Aug 3.57 2.99 0.26 0.27 0.12 1.15 8.24 Roundup Power Max pt 1.3750 3.13 4.30 4.30 SC 3Row (Hipper) 18 ft MFWD 190 0.120 1.00 Aug 4.47 3.66 0.69 0.81 0.12 1.15 10.78 SC Drain Cleaner 6 ft MFWD 75 0.080 1.00 Aug 1.12 0.59 0.13 0.13 0.08 0.77 2.74 Crop Consultant acre 1.00 Sep 1.0000 7.00 7.00 7.00 ------- ------- ------- ------- ------ ------- ------- -------- TOTALS 94.76 76.66 13.01 17.30 3.08 29.59 15.60 246.92 INTEREST ON OPERATING CAPITAL 2.84 UNALLOCATED LABOR 0.00 TOTAL SPECIFIED COST 249.76 _______________________________________________________________________________________________________________________________________________
14
Table 5.A Estimated costs per acre, Cultured seed cane, Sugarcane, Louisiana, 2014. _______________________________________________________________________ ITEM UNIT PRICE QUANTITY AMOUNT YOUR FARM _______________________________________________________________________ dollars dollars DIRECT EXPENSES SEED/PLANTS SC Cultured seedcane acre 484.00 1.0000 484.00 _________ LA Hired Labor Self-Propelled hour 9.60 0.3303 3.17 _________ DIESEL FUEL Self-Propelled gal 3.30 2.1021 6.94 _________ REPAIR & MAINTENANCE Self-Propelled acre 7.74 1.0000 7.74 _________ INTEREST ON OP. CAP. acre 18.82 1.0000 18.82 _________ --------- TOTAL DIRECT EXPENSES 520.67 _________ FIXED EXPENSES Self-Propelled acre 12.53 1.0000 12.53 _________ --------- TOTAL FIXED EXPENSES 12.53 _________ --------- TOTAL SPECIFIED EXPENSES 533.20 _________ ______________________________________________________________________________________ Table 5.B Estimated resource use and costs for field operations, per acre Cultured seed cane, Sugarcane, Louisiana, 2014. _______________________________________________________________________________________________________________________________________________ POWER UNIT COST EQUIPMENT COST ALLOC LABOR OPERATING/DURABLE INPUT OPERATION/ SIZE/ POWER UNIT PERF TIMES -------------- -------------- ------------- ----------------------- TOTAL OPERATING INPUT UNIT SIZE RATE OVER MTH DIRECT FIXED DIRECT FIXED HOURS COST AMOUNT PRICE COST COST _______________________________________________________________________________________________________________________________________________ ------------dollars----------- dollars ---------dollars--------- SC Cultured seedcane acre 1.00 Sep 1.0000 484.00 484.00 484.00 SC Loader 2Rw 12 ft 0.300 1.00 Sep 14.68 12.53 0.33 3.17 30.38 ------- ------- ------- ------- ------ ------- ------- -------- TOTALS 14.68 12.53 0.00 0.00 0.33 3.17 484.00 514.38 INTEREST ON OPERATING CAPITAL 18.82 UNALLOCATED LABOR 0.00 TOTAL SPECIFIED COST 533.20 _______________________________________________________________________________________________________________________________________________
15
Table 6.A Estimated costs per acre, Wholestalk seedcane harvest, Sugarcane, Louisiana, 2014. _______________________________________________________________________ ITEM UNIT PRICE QUANTITY AMOUNT YOUR FARM _______________________________________________________________________ dollars dollars DIRECT EXPENSES LA OPERATOR LABOR Self-Propelled hour 15.30 0.4268 6.53 _________ LA Hired Labor Tractors hour 9.60 0.6300 6.05 _________ Self-Propelled hour 9.60 0.3303 3.17 _________ DIESEL FUEL Tractors gal 3.30 4.5553 15.03 _________ Self-Propelled gal 3.30 5.2061 17.18 _________ REPAIR & MAINTENANCE Implements acre 0.76 1.0000 0.76 _________ Tractors acre 2.45 1.0000 2.45 _________ Self-Propelled acre 24.72 1.0000 24.72 _________ INTEREST ON OP. CAP. acre 2.86 1.0000 2.86 _________ --------- TOTAL DIRECT EXPENSES 78.75 _________ FIXED EXPENSES Implements acre 0.96 1.0000 0.96 _________ Tractors acre 14.27 1.0000 14.27 _________ Self-Propelled acre 33.55 1.0000 33.55 _________ --------- TOTAL FIXED EXPENSES 48.78 _________ --------- TOTAL SPECIFIED EXPENSES 127.53 _________ ______________________________________________________________________________________ Table 6.B Estimated resource use and costs for field operations, per acre Wholestalk seedcane harvest, Sugarcane, Louisiana, 2014. _______________________________________________________________________________________________________________________________________________ POWER UNIT COST EQUIPMENT COST ALLOC LABOR OPERATING/DURABLE INPUT OPERATION/ SIZE/ POWER UNIT PERF TIMES -------------- -------------- ------------- ----------------------- TOTAL OPERATING INPUT UNIT SIZE RATE OVER MTH DIRECT FIXED DIRECT FIXED HOURS COST AMOUNT PRICE COST COST _______________________________________________________________________________________________________________________________________________ ------------dollars----------- dollars ---------dollars--------- SC Harvester 2Rw 12 ft 0.388 1.00 Sep 27.22 21.02 0.42 6.53 54.77 SC Loader 2Rw 12 ft 0.300 1.00 Sep 14.68 12.53 0.33 3.17 30.38 SC Cane Wagon 10T 10 Ton MFWD 150 0.500 1.00 Sep 16.36 13.68 0.63 0.83 0.55 5.28 36.78 SC Drain Cleaner 6 ft MFWD 75 0.080 1.00 Sep 1.12 0.59 0.13 0.13 0.08 0.77 2.74 ------- ------- ------- ------- ------ ------- ------- -------- TOTALS 59.38 47.82 0.76 0.96 1.38 15.75 0.00 124.67 INTEREST ON OPERATING CAPITAL 2.86 UNALLOCATED LABOR 0.00 TOTAL SPECIFIED COST 127.53 _______________________________________________________________________________________________________________________________________________

16
Table 7.A Estimated costs per acre, Billet seedcane harvest, Sugarcane, Louisiana, 2014. _______________________________________________________________________ ITEM UNIT PRICE QUANTITY AMOUNT YOUR FARM _______________________________________________________________________ dollars dollars DIRECT EXPENSES LA OPERATOR LABOR Self-Propelled hour 15.30 0.7700 11.78 _________ LA Hired Labor Tractors hour 9.60 0.7400 7.11 _________ DIESEL FUEL Tractors gal 3.30 5.4046 17.84 _________ Self-Propelled gal 3.30 8.4000 27.72 _________ REPAIR & MAINTENANCE Implements acre 5.46 1.0000 5.46 _________ Tractors acre 2.93 1.0000 2.93 _________ Self-Propelled acre 27.07 1.0000 27.07 _________ INTEREST ON OP. CAP. acre 3.75 1.0000 3.75 _________ --------- TOTAL DIRECT EXPENSES 103.66 _________ FIXED EXPENSES Implements acre 4.09 1.0000 4.09 _________ Tractors acre 17.01 1.0000 17.01 _________ Self-Propelled acre 31.56 1.0000 31.56 _________ --------- TOTAL FIXED EXPENSES 52.66 _________ --------- TOTAL SPECIFIED EXPENSES 156.32 _________ ______________________________________________________________________________________ Table 7.B Estimated resource use and costs for field operations, per acre Billet seedcane harvest, Sugarcane, Louisiana, 2014. _______________________________________________________________________________________________________________________________________________ POWER UNIT COST EQUIPMENT COST ALLOC LABOR OPERATING/DURABLE INPUT OPERATION/ SIZE/ POWER UNIT PERF TIMES -------------- -------------- ------------- ----------------------- TOTAL OPERATING INPUT UNIT SIZE RATE OVER MTH DIRECT FIXED DIRECT FIXED HOURS COST AMOUNT PRICE COST COST _______________________________________________________________________________________________________________________________________________ ------------dollars----------- dollars ---------dollars--------- SC Billet Harvester 6 ft 0.700 1.00 Sep 54.79 31.56 0.77 11.78 98.13 SC Cane Wgn Billt HD 10Ton MFWD 150 0.600 1.00 Sep 19.65 16.42 5.33 3.96 0.66 6.34 51.70 SC Drain Cleaner 6 ft MFWD 75 0.080 1.00 Sep 1.12 0.59 0.13 0.13 0.08 0.77 2.74 ------- ------- ------- ------- ------ ------- ------- -------- TOTALS 75.56 48.57 5.46 4.09 1.51 18.89 0.00 152.57 INTEREST ON OPERATING CAPITAL 3.75 UNALLOCATED LABOR 0.00 TOTAL SPECIFIED COST 156.32 _______________________________________________________________________________________________________________________________________________

17
Table 8.A Estimated costs per acre, Hand planting, 1-Row Wholestalk, Sugarcane, Louisiana, 2014. _______________________________________________________________________ ITEM UNIT PRICE QUANTITY AMOUNT YOUR FARM _______________________________________________________________________ dollars dollars DIRECT EXPENSES FERTILIZERS LA Nitrogen lb 0.50 15.0000 7.50 _________ LA Phosphate lb 0.50 45.0000 22.50 _________ LA Potash lb 0.37 45.0000 16.65 _________ HERBICIDES Sencor DF lb 14.85 1.5000 22.28 _________ Prowl 3.3 EC pt 3.75 7.2000 27.00 _________ LA SC Planting Labor Special Labor acre 25.00 3.0000 75.00 _________ LA Hired Labor Tractors hour 9.60 2.2505 21.61 _________ DIESEL FUEL Tractors gal 3.30 17.0264 56.19 _________ REPAIR & MAINTENANCE Implements acre 16.37 1.0000 16.37 _________ Tractors acre 8.98 1.0000 8.98 _________ INTEREST ON OP. CAP. acre 1.11 1.0000 1.11 _________ --------- TOTAL DIRECT EXPENSES 275.19 _________ FIXED EXPENSES Implements acre 23.74 1.0000 23.74 _________ Tractors acre 52.77 1.0000 52.77 _________ --------- TOTAL FIXED EXPENSES 76.51 _________ --------- TOTAL SPECIFIED EXPENSES 351.70 _________ _____________________________________________________________________________________ Table 8.B Estimated resource use and costs for field operations, per acre Hand planting, 1-Row Wholestalk, Sugarcane, Louisiana, 2014. _______________________________________________________________________________________________________________________________________________ POWER UNIT COST EQUIPMENT COST ALLOC LABOR OPERATING/DURABLE INPUT OPERATION/ SIZE/ POWER UNIT PERF TIMES -------------- -------------- ------------- ----------------------- TOTAL OPERATING INPUT UNIT SIZE RATE OVER MTH DIRECT FIXED DIRECT FIXED HOURS COST AMOUNT PRICE COST COST _______________________________________________________________________________________________________________________________________________ ------------dollars----------- dollars ---------dollars--------- SC Rototiller 18 ft MFWD 190 0.219 1.00 Sep 8.19 6.70 3.52 3.46 0.21 2.11 23.98 SC 3Row (Hipper) 18 ft MFWD 150 0.120 1.00 Sep 3.57 2.99 0.69 0.81 0.12 1.15 9.21 LA Nitrogen lb 15.0000 0.50 7.50 7.50 LA Phosphate lb 45.0000 0.50 22.50 22.50 LA Potash lb 45.0000 0.37 16.65 16.65 SC 3Row (Opener) 18 ft MFWD 150 0.120 1.00 Sep 3.57 2.99 0.47 0.55 0.12 1.15 8.73 SC Drain Cleaner 6 ft MFWD 75 0.080 1.00 Sep 1.12 0.59 0.13 0.13 0.08 0.77 2.74 SC Cane Planters Aid 6 ft MFWD 150 1.000 1.00 Sep 29.76 24.88 8.44 16.58 1.00 9.60 89.26 LA SC Planting Labor acre 3.00 75.00 75.00 SC 3Row (Cover) 18 ft 2WD 170 0.120 1.00 Sep 3.93 2.73 1.44 0.41 0.12 1.16 9.67 SC Flat Roller 18 ft MFWD 150 0.190 1.00 Sep 5.65 4.73 0.47 0.46 0.19 1.83 13.14 SC Drain Cleaner 6 ft MFWD 75 0.080 1.00 Sep 1.12 0.59 0.13 0.13 0.08 0.77 2.74 SC Boom Sprayer 16 ft MFWD 150 0.120 1.00 Sep 3.57 2.99 0.26 0.27 0.12 1.15 8.24 Sencor DF lb 1.5000 14.85 22.28 22.28 Prowl 3.3 EC pt 7.2000 3.75 27.00 27.00 SC 3Row (Hipper) 18 ft MFWD 150 0.120 1.00 Oct 3.57 2.99 0.69 0.81 0.12 1.15 9.21 SC Drain Cleaner 6 ft MFWD 75 0.080 1.00 Oct 1.12 0.59 0.13 0.13 0.08 0.77 2.74 ------- ------- ------- ------- ------ ------- ------- -------- TOTALS 65.17 52.77 16.37 23.74 5.25 96.61 95.93 350.59 INTEREST ON OPERATING CAPITAL 1.11 UNALLOCATED LABOR 0.00 TOTAL SPECIFIED COST 351.70 _______________________________________________________________________________________________________________________________________________

18
Table 9.A Estimated costs per acre, Mechanical planting, 1-Row Wholestalk, Sugarcane, Louisiana, 2014. _______________________________________________________________________ ITEM UNIT PRICE QUANTITY AMOUNT YOUR FARM _______________________________________________________________________ dollars dollars DIRECT EXPENSES FERTILIZERS LA Nitrogen lb 0.50 15.0000 7.50 _________ LA Phosphate lb 0.50 45.0000 22.50 _________ LA Potash lb 0.37 45.0000 16.65 _________ HERBICIDES Sencor DF lb 14.85 1.5000 22.28 _________ Prowl 3.3 EC pt 3.75 7.2000 27.00 _________ LA SC Planting Labor Special Labor acre 25.00 2.0000 50.00 _________ LA Hired Labor Tractors hour 9.60 1.9205 18.44 _________ DIESEL FUEL Tractors gal 3.30 14.3544 47.37 _________ REPAIR & MAINTENANCE Implements acre 11.62 1.0000 11.62 _________ Tractors acre 7.64 1.0000 7.64 _________ INTEREST ON OP. CAP. acre 8.45 1.0000 8.45 _________ --------- TOTAL DIRECT EXPENSES 239.45 _________ FIXED EXPENSES Implements acre 14.40 1.0000 14.40 _________ Tractors acre 44.83 1.0000 44.83 _________ --------- TOTAL FIXED EXPENSES 59.23 _________ --------- TOTAL SPECIFIED EXPENSES 298.68 _________ _____________________________________________________________________________________ Table 9.B Estimated resource use and costs for field operations, per acre Mechanical planting, 1-Row Wholestalk, Sugarcane, Louisiana, 2014. _______________________________________________________________________________________________________________________________________________ POWER UNIT COST EQUIPMENT COST ALLOC LABOR OPERATING/DURABLE INPUT OPERATION/ SIZE/ POWER UNIT PERF TIMES -------------- -------------- ------------- ----------------------- TOTAL OPERATING INPUT UNIT SIZE RATE OVER MTH DIRECT FIXED DIRECT FIXED HOURS COST AMOUNT PRICE COST COST _______________________________________________________________________________________________________________________________________________ SC Rototiller 18 ft MFWD 190 0.219 1.00 Sep 8.19 6.70 3.52 3.46 0.21 2.11 23.98 SC 3Row (Hipper) 18 ft MFWD 150 0.120 1.00 Sep 3.57 2.99 0.69 0.81 0.12 1.15 9.21 LA Nitrogen lb 15.0000 0.50 7.50 7.50 LA Phosphate lb 45.0000 0.50 22.50 22.50 LA Potash lb 45.0000 0.37 16.65 16.65 SC 3Row (Opener) 18 ft MFWD 150 0.120 1.00 Sep 3.57 2.99 0.47 0.55 0.12 1.15 8.73 SC Drain Cleaner 6 ft MFWD 75 0.080 1.00 Sep 1.12 0.59 0.13 0.13 0.08 0.77 2.74 SC Cane Plt-Whlstalk 6 ft MFWD 150 0.670 1.00 Sep 19.94 16.67 3.69 7.24 0.67 6.43 53.97 LA SC Planting Labor acre 2.00 50.00 50.00 SC 3Row (Cover) 18 ft MFWD 150 0.120 1.00 Sep 3.59 3.00 1.44 0.41 0.12 1.16 9.60 SC Flat Roller 18 ft MFWD 150 0.190 1.00 Sep 5.65 4.73 0.47 0.46 0.19 1.83 13.14 SC Drain Cleaner 6 ft MFWD 75 0.080 1.00 Sep 1.12 0.59 0.13 0.13 0.08 0.77 2.74 SC Boom Sprayer 16 ft MFWD 150 0.120 1.00 Oct 3.57 2.99 0.26 0.27 0.12 1.15 8.24 Sencor DF lb 1.5000 14.85 22.28 22.28 Prowl 3.3 EC pt 7.2000 3.75 27.00 27.00 SC 3Row (Hipper) 18 ft MFWD 150 0.120 1.00 Nov 3.57 2.99 0.69 0.81 0.12 1.15 9.21 SC Drain Cleaner 6 ft MFWD 75 0.080 1.00 Nov 1.12 0.59 0.13 0.13 0.08 0.77 2.74 ------- ------- ------- ------- ------ ------- ------- -------- TOTALS 55.01 44.83 11.62 14.40 3.92 68.44 95.93 290.23 INTEREST ON OPERATING CAPITAL 8.45 UNALLOCATED LABOR 0.00 TOTAL SPECIFIED COST 298.68 _______________________________________________________________________________________________________________________________________________
19
Table 10.A Estimated costs per acre, Mechanical planting, 1-Row Billet, Sugarcane, Louisiana, 2014. _______________________________________________________________________ ITEM UNIT PRICE QUANTITY AMOUNT YOUR FARM _______________________________________________________________________ dollars dollars DIRECT EXPENSES FERTILIZERS LA Nitrogen lb 0.50 15.0000 7.50 _________ LA Phosphate lb 0.50 45.0000 22.50 _________ LA Potash lb 0.37 45.0000 16.65 _________ HERBICIDES Sencor DF lb 14.85 1.5000 22.28 _________ Prowl 3.3 EC pt 3.75 7.2000 27.00 _________ LA SC Planting Labor Special Labor acre 25.00 1.0000 25.00 _________ LA Hired Labor Tractors hour 9.60 1.9205 18.44 _________ DIESEL FUEL Tractors gal 3.30 14.3544 47.37 _________ REPAIR & MAINTENANCE Implements acre 11.62 1.0000 11.62 _________ Tractors acre 7.64 1.0000 7.64 _________ INTEREST ON OP. CAP. acre 7.51 1.0000 7.51 _________ --------- TOTAL DIRECT EXPENSES 213.51 _________ FIXED EXPENSES Implements acre 14.40 1.0000 14.40 _________ Tractors acre 44.83 1.0000 44.83 _________ --------- TOTAL FIXED EXPENSES 59.23 _________ --------- TOTAL SPECIFIED EXPENSES 272.74 _________ _____________________________________________________________________________________ Table 10.B Estimated resource use and costs for field operations, per acre Mechanical planting, 1-Row Billet, Sugarcane, Louisiana, 2014. _______________________________________________________________________________________________________________________________________________ POWER UNIT COST EQUIPMENT COST ALLOC LABOR OPERATING/DURABLE INPUT OPERATION/ SIZE/ POWER UNIT PERF TIMES -------------- -------------- ------------- ----------------------- TOTAL OPERATING INPUT UNIT SIZE RATE OVER MTH DIRECT FIXED DIRECT FIXED HOURS COST AMOUNT PRICE COST COST _______________________________________________________________________________________________________________________________________________ ------------dollars----------- dollars ---------dollars--------- SC Rototiller 18 ft MFWD 190 0.219 1.00 Sep 8.19 6.70 3.52 3.46 0.21 2.11 23.98 SC 3Row (Hipper) 18 ft MFWD 150 0.120 1.00 Sep 3.57 2.99 0.69 0.81 0.12 1.15 9.21 LA Nitrogen lb 15.0000 0.50 7.50 7.50 LA Phosphate lb 45.0000 0.50 22.50 22.50 LA Potash lb 45.0000 0.37 16.65 16.65 SC 3Row (Opener) 18 ft MFWD 150 0.120 1.00 Sep 3.57 2.99 0.47 0.55 0.12 1.15 8.73 SC Drain Cleaner 6 ft MFWD 75 0.080 1.00 Sep 1.12 0.59 0.13 0.13 0.08 0.77 2.74 SC Cane Plt-1R Bille 1 row MFWD 150 0.670 1.00 Sep 19.94 16.67 3.69 7.24 0.67 6.43 53.97 LA SC Planting Labor acre 1.00 25.00 25.00 SC 3Row (Cover) 18 ft MFWD 150 0.120 1.00 Sep 3.59 3.00 1.44 0.41 0.12 1.16 9.60 SC Flat Roller 18 ft MFWD 150 0.190 1.00 Sep 5.65 4.73 0.47 0.46 0.19 1.83 13.14 SC Drain Cleaner 6 ft MFWD 75 0.080 1.00 Sep 1.12 0.59 0.13 0.13 0.08 0.77 2.74 SC Boom Sprayer 16 ft MFWD 150 0.120 1.00 Oct 3.57 2.99 0.26 0.27 0.12 1.15 8.24 Sencor DF lb 1.5000 14.85 22.28 22.28 Prowl 3.3 EC pt 7.2000 3.75 27.00 27.00 SC 3Row (Hipper) 18 ft MFWD 150 0.120 1.00 Nov 3.57 2.99 0.69 0.81 0.12 1.15 9.21 SC Drain Cleaner 6 ft MFWD 75 0.080 1.00 Nov 1.12 0.59 0.13 0.13 0.08 0.77 2.74 ------- ------- ------- ------- ------ ------- ------- -------- TOTALS 55.01 44.83 11.62 14.40 2.92 43.44 95.93 265.23 INTEREST ON OPERATING CAPITAL 7.51 UNALLOCATED LABOR 0.00 TOTAL SPECIFIED COST 272.74 _______________________________________________________________________________________________________________________________________________
20
Table 11.A Estimated costs per acre, Plant cane field operations, Sugarcane, Louisiana, 2014. _______________________________________________________________________ ITEM UNIT PRICE QUANTITY AMOUNT YOUR FARM _______________________________________________________________________ dollars dollars DIRECT EXPENSES CUSTOM SPRAY App by Air ( 2 gal) appl 4.00 2.0000 8.00 _________ FERTILIZERS LA Nitrogen lb 0.50 80.0000 40.00 _________ LA Potash lb 0.37 80.0000 29.60 _________ HERBICIDES Sencor DF lb 14.85 0.7500 11.14 _________ Prowl 3.3 EC pt 3.75 3.6000 13.50 _________ LA Weedmaster qt 7.25 0.7500 5.44 _________ LA Asulox/Asulam gal 37.02 0.5000 18.51 _________ Treflan HFP pt 2.38 4.0000 9.52 _________ Atrazine 4L pt 1.75 4.0000 7.00 _________ INSECTICIDES Confirm 2F oz 2.06 16.0000 32.96 _________ SERVICE FEE Crop Consultant acre 7.00 1.0000 7.00 _________ ADJUVANTS Surfactant pt 3.68 3.2000 11.78 _________ LA Hired Labor Tractors hour 9.60 1.9381 18.60 _________ DIESEL FUEL Tractors gal 3.30 13.4200 44.30 _________ REPAIR & MAINTENANCE Implements acre 6.70 1.0000 6.70 _________ Tractors acre 7.06 1.0000 7.06 _________ INTEREST ON OP. CAP. acre 4.88 1.0000 4.88 _________ --------- TOTAL DIRECT EXPENSES 275.99 _________ FIXED EXPENSES Implements acre 8.18 1.0000 8.18 _________ Tractors acre 41.24 1.0000 41.24 _________ --------- TOTAL FIXED EXPENSES 49.42 _________ --------- TOTAL SPECIFIED EXPENSES 325.41 _________ ________________________________________________________________________________
21
Table 11.B Estimated resource use and costs for field operations, per acre Plant cane field operations, Sugarcane, Louisiana, 2014. _______________________________________________________________________________________________________________________________________________ POWER UNIT COST EQUIPMENT COST ALLOC LABOR OPERATING/DURABLE INPUT OPERATION/ SIZE/ POWER UNIT PERF TIMES -------------- -------------- ------------- ----------------------- TOTAL OPERATING INPUT UNIT SIZE RATE OVER MTH DIRECT FIXED DIRECT FIXED HOURS COST AMOUNT PRICE COST COST _______________________________________________________________________________________________________________________________________________ ------------dollars----------- dollars ---------dollars--------- SC 3Row (Offbar) 18 ft MFWD 150 0.120 1.00 Feb 3.57 2.99 0.69 0.82 0.12 1.15 9.22 SC Drain Cleaner 6 ft MFWD 75 0.080 1.00 Feb 1.12 0.59 0.13 0.13 0.08 0.77 2.74 SC Boom Sprayer 16 ft MFWD 150 0.120 1.00 Mar 3.57 2.99 0.26 0.27 0.12 1.15 8.24 Sencor DF lb 0.7500 14.85 11.14 11.14 Prowl 3.3 EC pt 3.6000 3.75 13.50 13.50 LA Weedmaster qt 0.7500 7.25 5.44 5.44 SC Fert 3Row Lq App 18 ft MFWD 150 0.130 1.00 Mar 3.87 3.24 0.36 0.54 0.13 1.25 9.26 LA Nitrogen lb 80.0000 0.50 40.00 40.00 SC 3Row (Hipper) 18 ft MFWD 150 0.120 2.00 Mar 7.15 5.97 1.37 1.62 0.24 2.30 18.41 SC Drain Cleaner 6 ft MFWD 75 0.080 1.00 Mar 1.12 0.59 0.13 0.13 0.08 0.77 2.74 SC Fert DrySlingApp 42 ft MFWD 150 0.059 1.00 Apr 1.79 1.49 0.23 0.31 0.05 0.58 4.40 LA Potash lb 80.0000 0.37 29.60 29.60 Disk Bed (Hipper) 4R-38 MFWD 150 0.147 1.00 Apr 4.39 3.67 0.29 0.73 0.14 1.42 10.50 SC Drain Cleaner 6 ft MFWD 75 0.080 1.00 Apr 1.12 0.59 0.13 0.13 0.08 0.77 2.74 SC 3Row (Hipper) 18 ft MFWD 150 0.120 1.00 Apr 3.57 2.99 0.69 0.81 0.12 1.15 9.21 SC Drain Cleaner 6 ft MFWD 75 0.080 1.00 Apr 1.12 0.59 0.13 0.13 0.08 0.77 2.74 SC Boom Sprayer 16 ft MFWD 150 0.120 1.00 Apr 3.57 2.99 0.26 0.27 0.12 1.15 8.24 LA Asulox/Asulam gal 0.5000 37.02 18.51 18.51 Surfactant pt 1.6000 3.68 5.89 5.89 SC 3Row (Hipper) 18 ft MFWD 150 0.120 1.00 May 3.57 2.99 0.69 0.81 0.12 1.15 9.21 SC Drain Cleaner 6 ft MFWD 75 0.080 1.00 May 1.12 0.59 0.13 0.13 0.08 0.77 2.74 SC Boom Sprayer 16 ft MFWD 150 0.120 1.00 May 3.57 2.99 0.26 0.27 0.12 1.15 8.24 Treflan HFP pt 4.0000 2.38 9.52 9.52 SC 3Row (Hipper) 18 ft MFWD 150 0.120 1.00 May 3.57 2.99 0.69 0.81 0.12 1.15 9.21 SC Boom Sprayer 16 ft MFWD 150 0.120 1.00 May 3.57 2.99 0.26 0.27 0.12 1.15 8.24 Atrazine 4L pt 4.0000 1.75 7.00 7.00 Surfactant pt 1.6000 3.68 5.89 5.89 App by Air ( 2 gal) appl 1.00 Jun 1.0000 4.00 4.00 4.00 Confirm 2F oz 8.0000 2.06 16.48 16.48 App by Air ( 2 gal) appl 1.00 Jul 1.0000 4.00 4.00 4.00 Confirm 2F oz 8.0000 2.06 16.48 16.48 Crop Consultant acre 1.00 Aug 1.0000 7.00 7.00 7.00 ------- ------- ------- ------- ------ ------- ------- -------- TOTALS 51.36 41.24 6.70 8.18 1.93 18.60 194.45 320.53 INTEREST ON OPERATING CAPITAL 4.88 UNALLOCATED LABOR 0.00 TOTAL SPECIFIED COST 325.41 _______________________________________________________________________________________________________________________________________________

22
Table 12.A Estimated costs per acre, First Stubble field operations, Sugarcane, Louisiana, 2014. _______________________________________________________________________ ITEM UNIT PRICE QUANTITY AMOUNT YOUR FARM _______________________________________________________________________ dollars dollars DIRECT EXPENSES CUSTOM SPRAY App by Air ( 2 gal) appl 4.00 3.0000 12.00 _________ FERTILIZERS LA Nitrogen lb 0.50 100.0000 50.00 _________ LA Phosphate lb 0.50 40.0000 20.00 _________ LA Potash lb 0.37 100.0000 37.00 _________ Sulfur lb 0.30 24.0000 7.20 _________ HERBICIDES Sencor DF lb 14.85 0.7500 11.14 _________ Prowl 3.3 EC pt 3.75 3.6000 13.50 _________ LA Weedmaster qt 7.25 0.7500 5.44 _________ LA Asulox/Asulam gal 37.02 0.5000 18.51 _________ Treflan HFP pt 2.38 4.0000 9.52 _________ Atrazine 4L pt 1.75 4.0000 7.00 _________ INSECTICIDES Confirm 2F oz 2.06 16.0000 32.96 _________ GROWTH REGULATORS LA Polado oz 0.38 8.0000 3.04 _________ SERVICE FEE Crop Consultant acre 7.00 1.0000 7.00 _________ ADJUVANTS Surfactant pt 3.68 4.8000 17.66 _________ LA Hired Labor Tractors hour 9.60 2.1506 20.63 _________ DIESEL FUEL Tractors gal 3.30 15.0607 49.72 _________ REPAIR & MAINTENANCE Implements acre 8.06 1.0000 8.06 _________ Tractors acre 7.97 1.0000 7.97 _________ INTEREST ON OP. CAP. acre 6.33 1.0000 6.33 _________ --------- TOTAL DIRECT EXPENSES 344.69 _________ FIXED EXPENSES Implements acre 9.35 1.0000 9.35 _________ Tractors acre 46.53 1.0000 46.53 _________ --------- TOTAL FIXED EXPENSES 55.88 _________ --------- TOTAL SPECIFIED EXPENSES 400.57 _________ ________________________________________________________________________________

23
Table 12.B Estimated resource use and costs for field operations, per acre First Stubble field operations, Sugarcane, Louisiana, 2014. _______________________________________________________________________________________________________________________________________________ POWER UNIT COST EQUIPMENT COST ALLOC LABOR OPERATING/DURABLE INPUT OPERATION/ SIZE/ POWER UNIT PERF TIMES -------------- -------------- ------------- ----------------------- TOTAL OPERATING INPUT UNIT SIZE RATE OVER MTH DIRECT FIXED DIRECT FIXED HOURS COST AMOUNT PRICE COST COST _______________________________________________________________________________________________________________________________________________ ------------dollars----------- dollars ---------dollars--------- SC 3Row (Offbar) 18 ft MFWD 150 0.120 2.00 Feb 7.15 5.97 1.38 1.63 0.24 2.30 18.43 SC Drain Cleaner 6 ft MFWD 75 0.080 1.00 Feb 1.12 0.59 0.13 0.13 0.08 0.77 2.74 SC Boom Sprayer 16 ft MFWD 150 0.120 1.00 Mar 3.57 2.99 0.26 0.27 0.12 1.15 8.24 Sencor DF lb 0.7500 14.85 11.14 11.14 Prowl 3.3 EC pt 3.6000 3.75 13.50 13.50 LA Weedmaster qt 0.7500 7.25 5.44 5.44 SC Fert 3Row Lq App 18 ft MFWD 150 0.130 1.00 Mar 3.87 3.24 0.36 0.54 0.13 1.25 9.26 LA Nitrogen lb 100.0000 0.50 50.00 50.00 SC 3Row (Offbar) 18 ft MFWD 150 0.120 2.00 Mar 7.15 5.97 1.38 1.63 0.24 2.30 18.43 SC Drain Cleaner 6 ft MFWD 75 0.080 1.00 Mar 1.12 0.59 0.13 0.13 0.08 0.77 2.74 SC Fert DrySlingApp 42 ft MFWD 150 0.059 1.00 Mar 1.79 1.49 0.23 0.31 0.05 0.58 4.40 LA Phosphate lb 40.0000 0.50 20.00 20.00 LA Potash lb 100.0000 0.37 37.00 37.00 Sulfur lb 24.0000 0.30 7.20 7.20 SC 3Row (Hipper) 18 ft MFWD 150 0.120 1.00 Mar 3.57 2.99 0.69 0.81 0.12 1.15 9.21 SC Drain Cleaner 6 ft MFWD 75 0.080 1.00 Mar 1.12 0.59 0.13 0.13 0.08 0.77 2.74 SC Boom Sprayer 16 ft MFWD 150 0.120 1.00 Mar 3.57 2.99 0.26 0.27 0.12 1.15 8.24 Surfactant pt 1.6000 3.68 5.89 5.89 SC 3Row (Hipper) 18 ft MFWD 150 0.120 1.00 Apr 3.57 2.99 0.69 0.81 0.12 1.15 9.21 SC Drain Cleaner 6 ft MFWD 75 0.080 1.00 Apr 1.12 0.59 0.13 0.13 0.08 0.77 2.74 SC Boom Sprayer 16 ft MFWD 150 0.120 1.00 Apr 3.57 2.99 0.26 0.27 0.12 1.15 8.24 LA Asulox/Asulam gal 0.5000 37.02 18.51 18.51 Surfactant pt 1.6000 3.68 5.89 5.89 SC 3Row (Hipper) 18 ft MFWD 150 0.120 1.00 May 3.57 2.99 0.69 0.81 0.12 1.15 9.21 SC Drain Cleaner 6 ft MFWD 75 0.080 1.00 May 1.12 0.59 0.13 0.13 0.08 0.77 2.74 SC Boom Sprayer 16 ft MFWD 150 0.120 1.00 May 3.57 2.99 0.26 0.27 0.12 1.15 8.24 Treflan HFP pt 4.0000 2.38 9.52 9.52 SC 3Row (Hipper) 18 ft MFWD 150 0.120 1.00 May 3.57 2.99 0.69 0.81 0.12 1.15 9.21 SC Boom Sprayer 16 ft MFWD 150 0.120 1.00 May 3.57 2.99 0.26 0.27 0.12 1.15 8.24 Atrazine 4L pt 4.0000 1.75 7.00 7.00 Surfactant pt 1.6000 3.68 5.89 5.89 App by Air ( 2 gal) appl 1.00 Jun 1.0000 4.00 4.00 4.00 Confirm 2F oz 8.0000 2.06 16.48 16.48 App by Air ( 2 gal) appl 1.00 Jul 1.0000 4.00 4.00 4.00 Confirm 2F oz 8.0000 2.06 16.48 16.48 App by Air ( 2 gal) appl 1.00 Sep 1.0000 4.00 4.00 4.00 LA Polado oz 8.0000 0.38 3.04 3.04 Crop Consultant acre 1.00 Sep 1.0000 7.00 7.00 7.00 ------- ------- ------- ------- ------ ------- ------- -------- TOTALS 57.69 46.53 8.06 9.35 2.15 20.63 251.98 394.24 INTEREST ON OPERATING CAPITAL 6.33 UNALLOCATED LABOR 0.00 TOTAL SPECIFIED COST 400.57 _______________________________________________________________________________________________________________________________________________

24
Table 13.A Estimated costs per acre, Second Stubble and older field operations, Sugarcane, Louisiana, 2014. _______________________________________________________________________ ITEM UNIT PRICE QUANTITY AMOUNT YOUR FARM _______________________________________________________________________ dollars dollars DIRECT EXPENSES CUSTOM SPRAY App by Air ( 2 gal) appl 4.00 3.0000 12.00 _________ FERTILIZERS LA Nitrogen lb 0.50 110.0000 55.00 _________ LA Phosphate lb 0.50 40.0000 20.00 _________ LA Potash lb 0.37 100.0000 37.00 _________ Sulfur lb 0.30 24.0000 7.20 _________ HERBICIDES Sencor DF lb 14.85 0.7500 11.14 _________ Prowl 3.3 EC pt 3.75 3.6000 13.50 _________ LA Weedmaster qt 7.25 0.7500 5.44 _________ LA Asulox/Asulam gal 37.02 0.5000 18.51 _________ Treflan HFP pt 2.38 4.0000 9.52 _________ Atrazine 4L pt 1.75 4.0000 7.00 _________ INSECTICIDES Confirm 2F oz 2.06 16.0000 32.96 _________ GROWTH REGULATORS LA Polado oz 0.38 8.0000 3.04 _________ SERVICE FEE Crop Consultant acre 7.00 1.0000 7.00 _________ ADJUVANTS Surfactant pt 3.68 3.2000 11.78 _________ LA Hired Labor Tractors hour 9.60 2.0306 19.48 _________ DIESEL FUEL Tractors gal 3.30 14.1338 46.66 _________ REPAIR & MAINTENANCE Implements acre 7.80 1.0000 7.80 _________ Tractors acre 7.46 1.0000 7.46 _________ INTEREST ON OP. CAP. acre 6.23 1.0000 6.23 _________ --------- TOTAL DIRECT EXPENSES 338.72 _________ FIXED EXPENSES Implements acre 9.08 1.0000 9.08 _________ Tractors acre 43.54 1.0000 43.54 _________ --------- TOTAL FIXED EXPENSES 52.62 _________ --------- TOTAL SPECIFIED EXPENSES 391.34 _________ _____________________________________________________________________________________
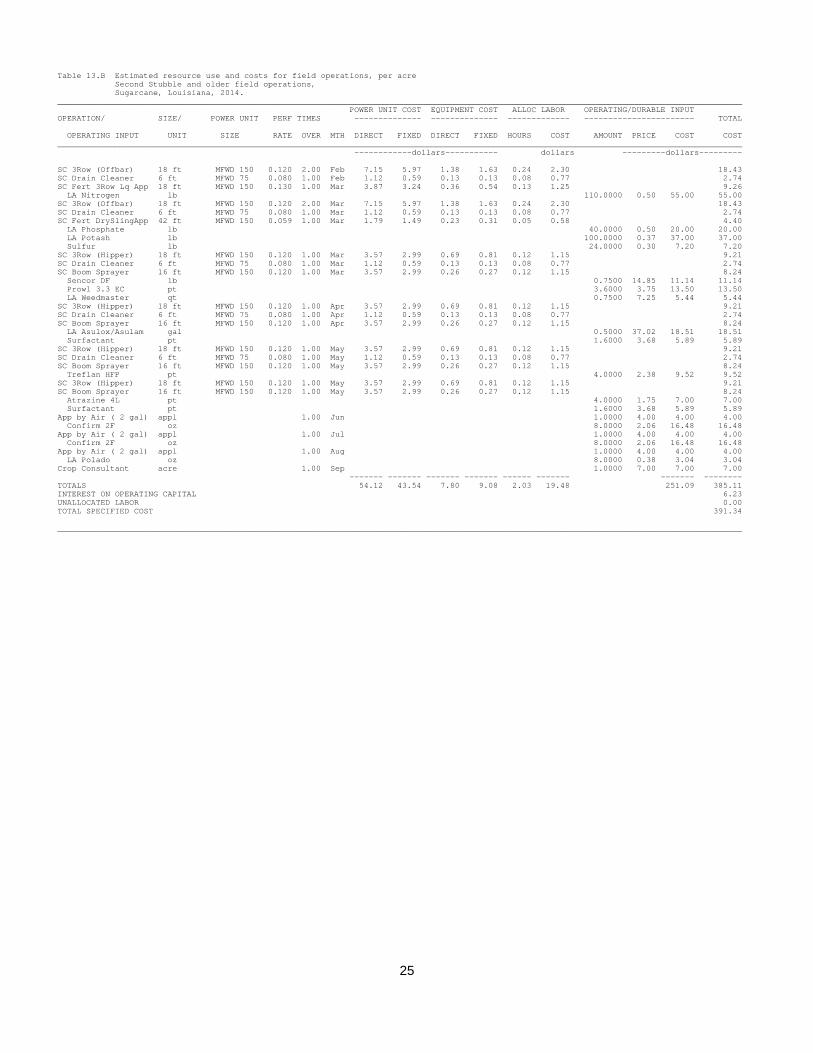
25
Table 13.B Estimated resource use and costs for field operations, per acre Second Stubble and older field operations, Sugarcane, Louisiana, 2014. _______________________________________________________________________________________________________________________________________________ POWER UNIT COST EQUIPMENT COST ALLOC LABOR OPERATING/DURABLE INPUT OPERATION/ SIZE/ POWER UNIT PERF TIMES -------------- -------------- ------------- ----------------------- TOTAL OPERATING INPUT UNIT SIZE RATE OVER MTH DIRECT FIXED DIRECT FIXED HOURS COST AMOUNT PRICE COST COST _______________________________________________________________________________________________________________________________________________ ------------dollars----------- dollars ---------dollars--------- SC 3Row (Offbar) 18 ft MFWD 150 0.120 2.00 Feb 7.15 5.97 1.38 1.63 0.24 2.30 18.43 SC Drain Cleaner 6 ft MFWD 75 0.080 1.00 Feb 1.12 0.59 0.13 0.13 0.08 0.77 2.74 SC Fert 3Row Lq App 18 ft MFWD 150 0.130 1.00 Mar 3.87 3.24 0.36 0.54 0.13 1.25 9.26 LA Nitrogen lb 110.0000 0.50 55.00 55.00 SC 3Row (Offbar) 18 ft MFWD 150 0.120 2.00 Mar 7.15 5.97 1.38 1.63 0.24 2.30 18.43 SC Drain Cleaner 6 ft MFWD 75 0.080 1.00 Mar 1.12 0.59 0.13 0.13 0.08 0.77 2.74 SC Fert DrySlingApp 42 ft MFWD 150 0.059 1.00 Mar 1.79 1.49 0.23 0.31 0.05 0.58 4.40 LA Phosphate lb 40.0000 0.50 20.00 20.00 LA Potash lb 100.0000 0.37 37.00 37.00 Sulfur lb 24.0000 0.30 7.20 7.20 SC 3Row (Hipper) 18 ft MFWD 150 0.120 1.00 Mar 3.57 2.99 0.69 0.81 0.12 1.15 9.21 SC Drain Cleaner 6 ft MFWD 75 0.080 1.00 Mar 1.12 0.59 0.13 0.13 0.08 0.77 2.74 SC Boom Sprayer 16 ft MFWD 150 0.120 1.00 Mar 3.57 2.99 0.26 0.27 0.12 1.15 8.24 Sencor DF lb 0.7500 14.85 11.14 11.14 Prowl 3.3 EC pt 3.6000 3.75 13.50 13.50 LA Weedmaster qt 0.7500 7.25 5.44 5.44 SC 3Row (Hipper) 18 ft MFWD 150 0.120 1.00 Apr 3.57 2.99 0.69 0.81 0.12 1.15 9.21 SC Drain Cleaner 6 ft MFWD 75 0.080 1.00 Apr 1.12 0.59 0.13 0.13 0.08 0.77 2.74 SC Boom Sprayer 16 ft MFWD 150 0.120 1.00 Apr 3.57 2.99 0.26 0.27 0.12 1.15 8.24 LA Asulox/Asulam gal 0.5000 37.02 18.51 18.51 Surfactant pt 1.6000 3.68 5.89 5.89 SC 3Row (Hipper) 18 ft MFWD 150 0.120 1.00 May 3.57 2.99 0.69 0.81 0.12 1.15 9.21 SC Drain Cleaner 6 ft MFWD 75 0.080 1.00 May 1.12 0.59 0.13 0.13 0.08 0.77 2.74 SC Boom Sprayer 16 ft MFWD 150 0.120 1.00 May 3.57 2.99 0.26 0.27 0.12 1.15 8.24 Treflan HFP pt 4.0000 2.38 9.52 9.52 SC 3Row (Hipper) 18 ft MFWD 150 0.120 1.00 May 3.57 2.99 0.69 0.81 0.12 1.15 9.21 SC Boom Sprayer 16 ft MFWD 150 0.120 1.00 May 3.57 2.99 0.26 0.27 0.12 1.15 8.24 Atrazine 4L pt 4.0000 1.75 7.00 7.00 Surfactant pt 1.6000 3.68 5.89 5.89 App by Air ( 2 gal) appl 1.00 Jun 1.0000 4.00 4.00 4.00 Confirm 2F oz 8.0000 2.06 16.48 16.48 App by Air ( 2 gal) appl 1.00 Jul 1.0000 4.00 4.00 4.00 Confirm 2F oz 8.0000 2.06 16.48 16.48 App by Air ( 2 gal) appl 1.00 Aug 1.0000 4.00 4.00 4.00 LA Polado oz 8.0000 0.38 3.04 3.04 Crop Consultant acre 1.00 Sep 1.0000 7.00 7.00 7.00 ------- ------- ------- ------- ------ ------- ------- -------- TOTALS 54.12 43.54 7.80 9.08 2.03 19.48 251.09 385.11 INTEREST ON OPERATING CAPITAL 6.23 UNALLOCATED LABOR 0.00 TOTAL SPECIFIED COST 391.34 _______________________________________________________________________________________________________________________________________________

26
Table 14.A Estimated costs per acre, Harvest-1R Combine Harvester, 10-Ton High Dump wagons, Custom truck/trailer haul, Sugarcane, Louisiana, 2014. _______________________________________________________________________ ITEM UNIT PRICE QUANTITY AMOUNT YOUR FARM _______________________________________________________________________ dollars dollars DIRECT EXPENSES LA OPERATOR LABOR Self-Propelled hour 15.30 0.7700 11.78 _________ LA Hired Labor Tractors hour 9.60 2.0600 19.79 _________ DIESEL FUEL Tractors gal 3.30 15.5962 51.48 _________ Self-Propelled gal 3.30 8.4000 27.72 _________ REPAIR & MAINTENANCE Implements acre 16.12 1.0000 16.12 _________ Tractors acre 8.59 1.0000 8.59 _________ Self-Propelled acre 27.07 1.0000 27.07 _________ INTEREST ON OP. CAP. acre 5.60 1.0000 5.60 _________ --------- TOTAL DIRECT EXPENSES 168.15 _________ FIXED EXPENSES Implements acre 12.01 1.0000 12.01 _________ Tractors acre 49.85 1.0000 49.85 _________ Self-Propelled acre 31.56 1.0000 31.56 _________ --------- TOTAL FIXED EXPENSES 93.42 _________ --------- TOTAL SPECIFIED EXPENSES 261.57 _________ ________________________________________________________________________________ Table 14.B Estimated resource use and costs for field operations, per acre Harvest-1R Combine Harvester, 10-Ton High Dump wagons, Custom truck/trailer haul, Sugarcane, Louisiana, 2014. _______________________________________________________________________________________________________________________________________________ POWER UNIT COST EQUIPMENT COST ALLOC LABOR OPERATING/DURABLE INPUT OPERATION/ SIZE/ POWER UNIT PERF TIMES -------------- -------------- ------------- ----------------------- TOTAL OPERATING INPUT UNIT SIZE RATE OVER MTH DIRECT FIXED DIRECT FIXED HOURS COST AMOUNT PRICE COST COST _______________________________________________________________________________________________________________________________________________ ------------dollars----------- dollars ---------dollars--------- SC Billet Harvester 6 ft 0.700 1.00 Nov 54.79 31.56 0.77 11.78 98.13 SC Cane Wgn Billt HD 10Ton MFWD 150 0.600 1.00 Nov 19.65 16.42 5.33 3.96 0.66 6.34 51.70 SC Cane Wgn Billt HD 10Ton MFWD 150 0.600 1.00 Nov 19.65 16.42 5.33 3.96 0.66 6.34 51.70 SC Cane Wgn Billt HD 10Ton MFWD 150 0.600 1.00 Nov 19.65 16.42 5.33 3.96 0.66 6.34 51.70 SC Drain Cleaner 6 ft MFWD 75 0.080 1.00 Nov 1.12 0.59 0.13 0.13 0.08 0.77 2.74 ------- ------- ------- ------- ------ ------- ------- -------- TOTALS 114.86 81.41 16.12 12.01 2.83 31.57 0.00 255.97 INTEREST ON OPERATING CAPITAL 5.60 UNALLOCATED LABOR 0.00 TOTAL SPECIFIED COST 261.57 ______________________________________________________________________________________________________________________________________________
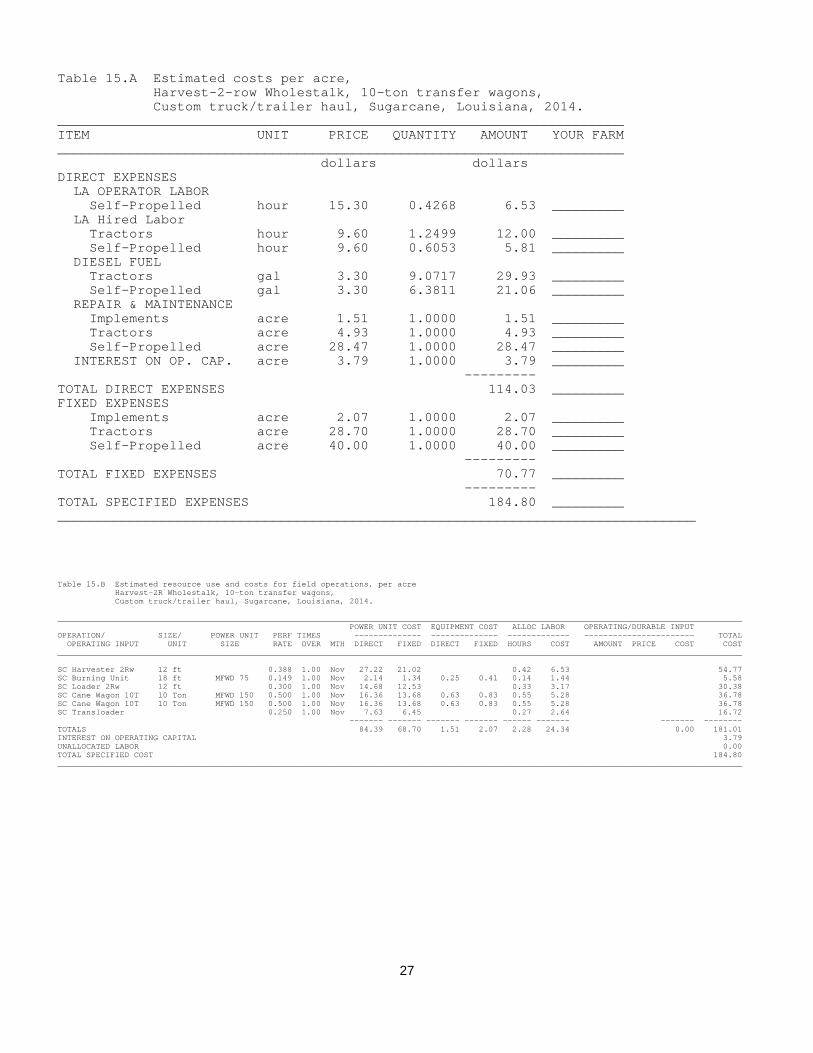
27
Table 15.A Estimated costs per acre, Harvest-2-row Wholestalk, 10-ton transfer wagons, Custom truck/trailer haul, Sugarcane, Louisiana, 2014. _______________________________________________________________________ ITEM UNIT PRICE QUANTITY AMOUNT YOUR FARM _______________________________________________________________________ dollars dollars DIRECT EXPENSES LA OPERATOR LABOR Self-Propelled hour 15.30 0.4268 6.53 _________ LA Hired Labor Tractors hour 9.60 1.2499 12.00 _________ Self-Propelled hour 9.60 0.6053 5.81 _________ DIESEL FUEL Tractors gal 3.30 9.0717 29.93 _________ Self-Propelled gal 3.30 6.3811 21.06 _________ REPAIR & MAINTENANCE Implements acre 1.51 1.0000 1.51 _________ Tractors acre 4.93 1.0000 4.93 _________ Self-Propelled acre 28.47 1.0000 28.47 _________ INTEREST ON OP. CAP. acre 3.79 1.0000 3.79 _________ --------- TOTAL DIRECT EXPENSES 114.03 _________ FIXED EXPENSES Implements acre 2.07 1.0000 2.07 _________ Tractors acre 28.70 1.0000 28.70 _________ Self-Propelled acre 40.00 1.0000 40.00 _________ --------- TOTAL FIXED EXPENSES 70.77 _________ --------- TOTAL SPECIFIED EXPENSES 184.80 _________ ________________________________________________________________________________ Table 15.B Estimated resource use and costs for field operations, per acre Harvest-2R Wholestalk, 10-ton transfer wagons, Custom truck/trailer haul, Sugarcane, Louisiana, 2014. _______________________________________________________________________________________________________________________________________________ POWER UNIT COST EQUIPMENT COST ALLOC LABOR OPERATING/DURABLE INPUT OPERATION/ SIZE/ POWER UNIT PERF TIMES -------------- -------------- ------------- ----------------------- TOTAL OPERATING INPUT UNIT SIZE RATE OVER MTH DIRECT FIXED DIRECT FIXED HOURS COST AMOUNT PRICE COST COST _______________________________________________________________________________________________________________________________________________ SC Harvester 2Rw 12 ft 0.388 1.00 Nov 27.22 21.02 0.42 6.53 54.77 SC Burning Unit 18 ft MFWD 75 0.149 1.00 Nov 2.14 1.34 0.25 0.41 0.14 1.44 5.58 SC Loader 2Rw 12 ft 0.300 1.00 Nov 14.68 12.53 0.33 3.17 30.38 SC Cane Wagon 10T 10 Ton MFWD 150 0.500 1.00 Nov 16.36 13.68 0.63 0.83 0.55 5.28 36.78 SC Cane Wagon 10T 10 Ton MFWD 150 0.500 1.00 Nov 16.36 13.68 0.63 0.83 0.55 5.28 36.78 SC Transloader 0.250 1.00 Nov 7.63 6.45 0.27 2.64 16.72 ------- ------- ------- ------- ------ ------- ------- -------- TOTALS 84.39 68.70 1.51 2.07 2.28 24.34 0.00 181.01 INTEREST ON OPERATING CAPITAL 3.79 UNALLOCATED LABOR 0.00 TOTAL SPECIFIED COST 184.80 _______________________________________________________________________________________________________________________________________________

28
APPENDIX A PROCEDURE FOR USING BUDGETS TO ESTIMATE COSTS AND RETURNS
Select the appropriate budgets to reflect your farm situation. This typically includes a cost budget for fallow activities and seedbed preparation, cultured and propagated seedcane, planting seed cane (hand or mechanical), cultural practices for each sugarcane crop (i.e., plantcane, first stubble, second stubble and older, and succession plant as applicable), specified harvest activities, and overhead costs. Income budgets are required for each sugarcane crop producing income.
The situation in this illustration assumes a 1,000 acre sugarcane farm which employs new 3-row equipment and has implemented a cultured seedcane program. The illustration assumes an extended 5 year rotation scheme (harvest through third stubble crop) presented in Table 2A. Its structure contains 20 percent plantcane, 20 percent first stubble, 20 percent second stubble, 20 percent 3rd stubble and 20 percent fallow/plant. Purchased cultured seedcane is expanded twice before being planted as millable cane (plantcane only used for seed), with its first and second stubble being grown for sugar. One acre of propagated seed cane is harvested and used for seed for each five acres to be planted. The cost and yield information used in the illustration comes from tables 4, 5, 6, 8, 9, 11, 12, 13, and 14.
The mill charge is assumed to be payment-in-kind, 39.0 % of the total value of raw sugar output. This percentage represents approximately the average share of the sugarcane crop taken by the mill as payment for processing. The illustration assumes a tenant-operator situation, where land cost is 16.7 % (one-sixth share) of the raw sugar output remaining after mill charges are removed (10.2% of total production). For illustrative purposes, a selling price of raw sugar of 22.0 cents per pound and a molasses price of 70.0 cents per gallon are used in calculating returns. COST CALCULATION
Total specified cost per acre presented in each of the budget tables is multiplied by the appropriate number of acres to give total farm cost. _________________________________________________________________________________________________
Total Specified Total Farm Crop Cost per Acre Acres Cost
_________________________________________________________________________________________________ (dollars/acre) (acres) (dollars)
Fallow Field and Seedbed Preparation 249.76 200.00 49,952.00 Cultured Seed Cane 533.20 3.30 1,759.56 Hand Planting Seedcane 351.70 3.30 1,160.61 Wholestalk Seedcane Harvest 127.53 39.40 5,024.68 Mechanical Planting Seedcane 298.68 196.70 58,750.36 Plant Cane Field Operations 325.41 200.00 65,082.00 1st Stubble Field Operations 400.57 200.00 80,114.00 2nd Stubble Field Operations 391.34 200.00 78,268.00 3rd Stubble Field Operations 391.34 200.00 78,268.00 Harvest for Sugar 261.57 760.60 198,950.14 Overhead 30.00 1000.00 30,000.00
========== Total Specified Expenses 647,329.35
_________________________________________________________________________________________________

29
OUTPUT CALCULATIONS RAW SUGAR
Total raw sugar output is determined by multiplying the raw sugar yield per acre for each crop by the number of acres of each crop. _________________________________________________________________________________________________
Tons of Cane Raw Sugar Total Raw Crop per Acre CRS per Acre Acres Sugar
_________________________________________________________________________________________________ (tons/acre) (lbs/ton) (cwt/acre) (acres) (cwt)
Plantcane 40.0 220.00 88.00 160.60 14,133
1st Stubble 37.2 220.00 81.84 200.00 16,368 2nd Stubble 30.8 220.00 67.76 200.00 13,552 3rd Stubble 28.8 220.00 63.36 200.00 12,672
Total 56,725 _________________________________________________________________________________________________
MOLASSES
The total molasses output is determined by multiplying the total raw sugar output for each crop by the molasses-to-raw sugar ratio, (assumed to be 3.0 gallons of molasses per cwt. of raw sugar). _________________________________________________________________________________________________
Total Raw Molasses/Sugar Total Crop Sugar Ratio Molasses
_________________________________________________________________________________________________ (cwt) (gallons/cwt) (gallons)
Plantcane 14,133 3.0 42,398 1st Stubble 16,368 3.0 49,104 2nd Stubble 13,552 3.0 40,656 3rd Stubble 12,672 3.0 38,016
Total 170,174 _________________________________________________________________________________________________
ADJUSTMENT FOR MILL CHARGE AND LAND RENT
Total raw sugar output is reduced by the mill share and the landlord share (39.0% and 10.2% respectively) to determine the portion of output available to a tenant grower to cover production costs. _________________________________________________________________________________________________ Total Mill Landlord Grower
Commodity Output Share Share Share _________________________________________________________________________________________________ ----------------------------(cwt)-------------------------
Sugar 56,725 (22,123) (5,779) 28,824 “one-sixth share rent” _________________________________________________________________________________________________
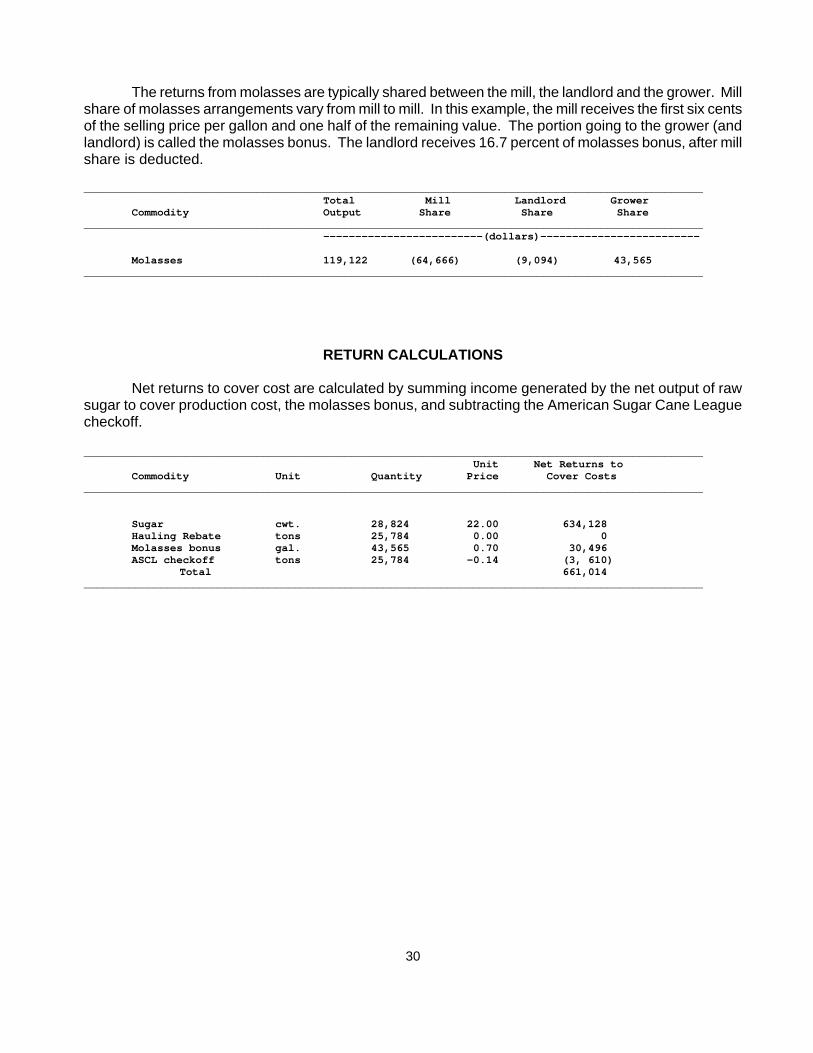
30
The returns from molasses are typically shared between the mill, the landlord and the grower. Mill share of molasses arrangements vary from mill to mill. In this example, the mill receives the first six cents of the selling price per gallon and one half of the remaining value. The portion going to the grower (and landlord) is called the molasses bonus. The landlord receives 16.7 percent of molasses bonus, after mill share is deducted. _________________________________________________________________________________________________
Total Mill Landlord Grower Commodity Output Share Share Share
_________________________________________________________________________________________________ -------------------------(dollars)-------------------------
Molasses 119,122 (64,666) (9,094) 43,565
_________________________________________________________________________________________________
RETURN CALCULATIONS
Net returns to cover cost are calculated by summing income generated by the net output of raw
sugar to cover production cost, the molasses bonus, and subtracting the American Sugar Cane League checkoff. _________________________________________________________________________________________________
Unit Net Returns to Commodity Unit Quantity Price Cover Costs
_________________________________________________________________________________________________
Sugar cwt. 28,824 22.00 634,128 Hauling Rebate tons 25,784 0.00 0 Molasses bonus gal. 43,565 0.70 30,496 ASCL checkoff tons 25,784 -0.14 (3, 610)
Total 661,014 _________________________________________________________________________________________________
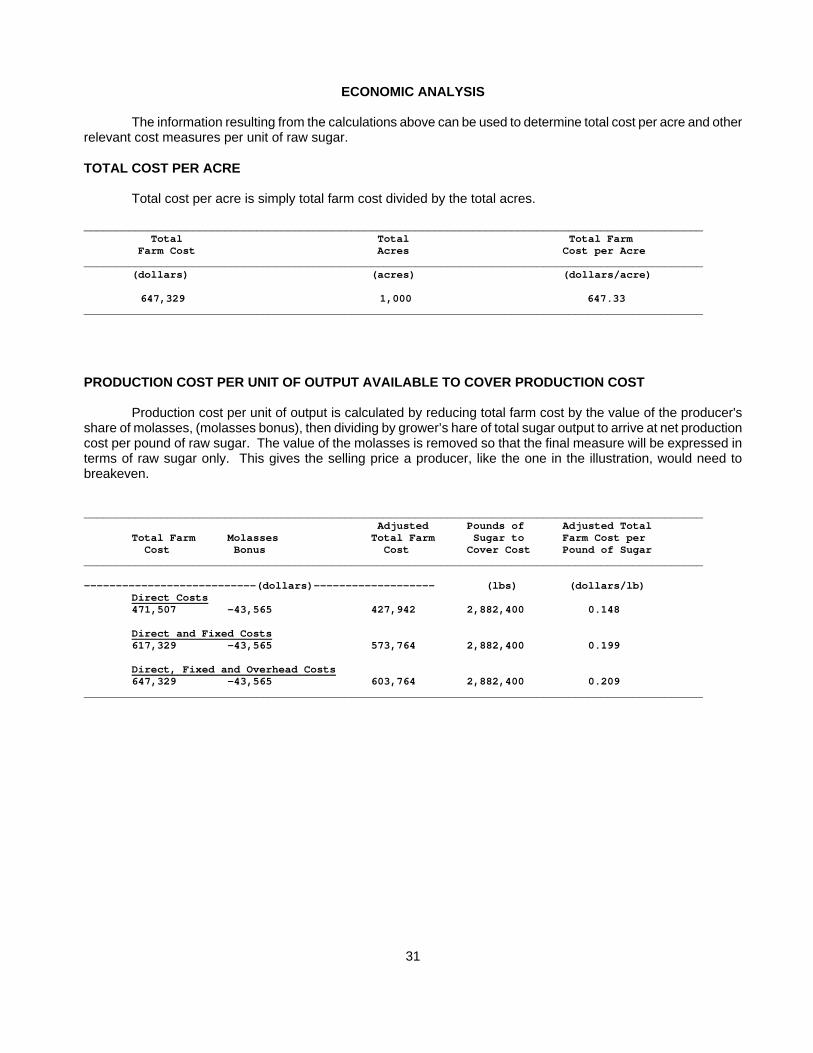
31
ECONOMIC ANALYSIS
The information resulting from the calculations above can be used to determine total cost per acre and other relevant cost measures per unit of raw sugar. TOTAL COST PER ACRE
Total cost per acre is simply total farm cost divided by the total acres. _________________________________________________________________________________________________
Total Total Total Farm Farm Cost Acres Cost per Acre
_________________________________________________________________________________________________ (dollars) (acres) (dollars/acre)
647,329 1,000 647.33
_________________________________________________________________________________________________ PRODUCTION COST PER UNIT OF OUTPUT AVAILABLE TO COVER PRODUCTION COST
Production cost per unit of output is calculated by reducing total farm cost by the value of the producer's share of molasses, (molasses bonus), then dividing by grower’s hare of total sugar output to arrive at net production cost per pound of raw sugar. The value of the molasses is removed so that the final measure will be expressed in terms of raw sugar only. This gives the selling price a producer, like the one in the illustration, would need to breakeven. _________________________________________________________________________________________________ Adjusted Pounds of Adjusted Total
Total Farm Molasses Total Farm Sugar to Farm Cost per Cost Bonus Cost Cover Cost Pound of Sugar
_________________________________________________________________________________________________ ---------------------------(dollars)------------------- (lbs) (dollars/lb) Direct Costs
471,507 -43,565 427,942 2,882,400 0.148 Direct and Fixed Costs 617,329 -43,565 573,764 2,882,400 0.199 Direct, Fixed and Overhead Costs 647,329 -43,565 603,764 2,882,400 0.209
_________________________________________________________________________________________________
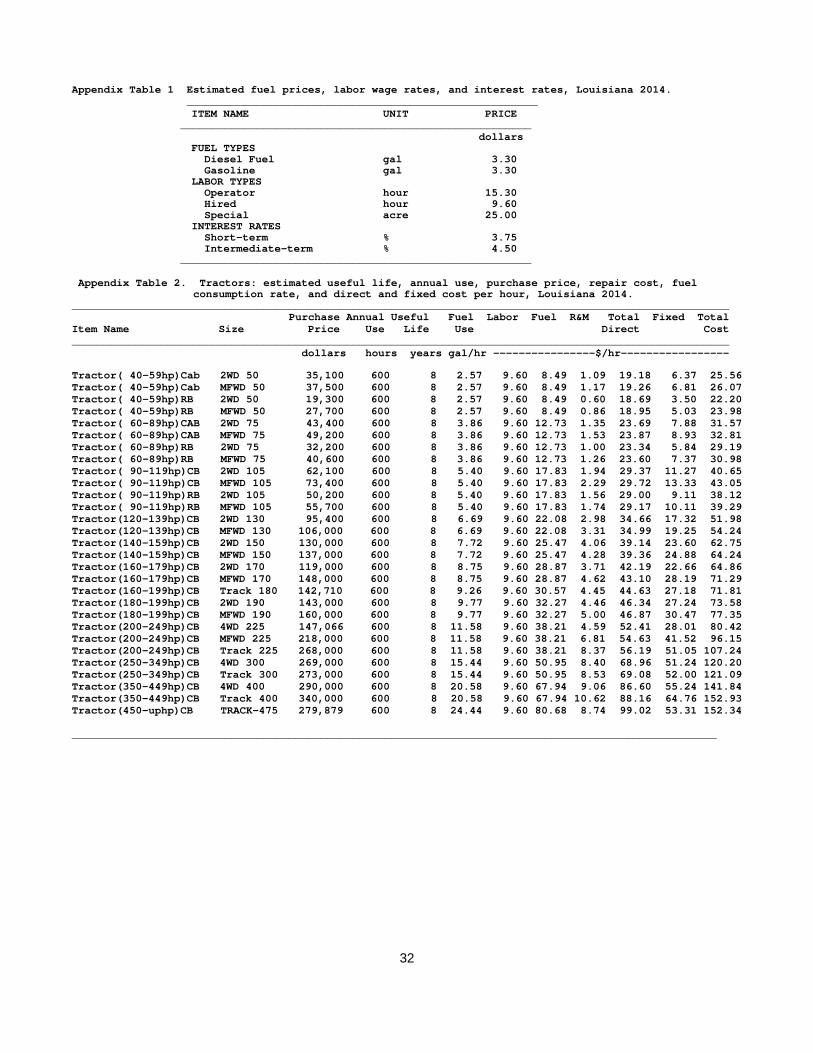
32
Appendix Table 1 Estimated fuel prices, labor wage rates, and interest rates, Louisiana 2014. _______________________________________________________
ITEM NAME UNIT PRICE _______________________________________________________
dollars FUEL TYPES Diesel Fuel gal 3.30 Gasoline gal 3.30 LABOR TYPES Operator hour 15.30 Hired hour 9.60 Special acre 25.00 INTEREST RATES Short-term % 3.75 Intermediate-term % 4.50
_______________________________________________________ Appendix Table 2. Tractors: estimated useful life, annual use, purchase price, repair cost, fuel
consumption rate, and direct and fixed cost per hour, Louisiana 2014. _______________________________________________________________________________________________________ Purchase Annual Useful Fuel Labor Fuel R&M Total Fixed Total Item Name Size Price Use Life Use Direct Cost _______________________________________________________________________________________________________ dollars hours years gal/hr ----------------$/hr----------------- Tractor( 40-59hp)Cab 2WD 50 35,100 600 8 2.57 9.60 8.49 1.09 19.18 6.37 25.56 Tractor( 40-59hp)Cab MFWD 50 37,500 600 8 2.57 9.60 8.49 1.17 19.26 6.81 26.07 Tractor( 40-59hp)RB 2WD 50 19,300 600 8 2.57 9.60 8.49 0.60 18.69 3.50 22.20 Tractor( 40-59hp)RB MFWD 50 27,700 600 8 2.57 9.60 8.49 0.86 18.95 5.03 23.98 Tractor( 60-89hp)CAB 2WD 75 43,400 600 8 3.86 9.60 12.73 1.35 23.69 7.88 31.57 Tractor( 60-89hp)CAB MFWD 75 49,200 600 8 3.86 9.60 12.73 1.53 23.87 8.93 32.81 Tractor( 60-89hp)RB 2WD 75 32,200 600 8 3.86 9.60 12.73 1.00 23.34 5.84 29.19 Tractor( 60-89hp)RB MFWD 75 40,600 600 8 3.86 9.60 12.73 1.26 23.60 7.37 30.98 Tractor( 90-119hp)CB 2WD 105 62,100 600 8 5.40 9.60 17.83 1.94 29.37 11.27 40.65 Tractor( 90-119hp)CB MFWD 105 73,400 600 8 5.40 9.60 17.83 2.29 29.72 13.33 43.05 Tractor( 90-119hp)RB 2WD 105 50,200 600 8 5.40 9.60 17.83 1.56 29.00 9.11 38.12 Tractor( 90-119hp)RB MFWD 105 55,700 600 8 5.40 9.60 17.83 1.74 29.17 10.11 39.29 Tractor(120-139hp)CB 2WD 130 95,400 600 8 6.69 9.60 22.08 2.98 34.66 17.32 51.98 Tractor(120-139hp)CB MFWD 130 106,000 600 8 6.69 9.60 22.08 3.31 34.99 19.25 54.24 Tractor(140-159hp)CB 2WD 150 130,000 600 8 7.72 9.60 25.47 4.06 39.14 23.60 62.75 Tractor(140-159hp)CB MFWD 150 137,000 600 8 7.72 9.60 25.47 4.28 39.36 24.88 64.24 Tractor(160-179hp)CB 2WD 170 119,000 600 8 8.75 9.60 28.87 3.71 42.19 22.66 64.86 Tractor(160-179hp)CB MFWD 170 148,000 600 8 8.75 9.60 28.87 4.62 43.10 28.19 71.29 Tractor(160-199hp)CB Track 180 142,710 600 8 9.26 9.60 30.57 4.45 44.63 27.18 71.81 Tractor(180-199hp)CB 2WD 190 143,000 600 8 9.77 9.60 32.27 4.46 46.34 27.24 73.58 Tractor(180-199hp)CB MFWD 190 160,000 600 8 9.77 9.60 32.27 5.00 46.87 30.47 77.35 Tractor(200-249hp)CB 4WD 225 147,066 600 8 11.58 9.60 38.21 4.59 52.41 28.01 80.42 Tractor(200-249hp)CB MFWD 225 218,000 600 8 11.58 9.60 38.21 6.81 54.63 41.52 96.15 Tractor(200-249hp)CB Track 225 268,000 600 8 11.58 9.60 38.21 8.37 56.19 51.05 107.24 Tractor(250-349hp)CB 4WD 300 269,000 600 8 15.44 9.60 50.95 8.40 68.96 51.24 120.20 Tractor(250-349hp)CB Track 300 273,000 600 8 15.44 9.60 50.95 8.53 69.08 52.00 121.09 Tractor(350-449hp)CB 4WD 400 290,000 600 8 20.58 9.60 67.94 9.06 86.60 55.24 141.84 Tractor(350-449hp)CB Track 400 340,000 600 8 20.58 9.60 67.94 10.62 88.16 64.76 152.93 Tractor(450-uphp)CB TRACK-475 279,879 600 8 24.44 9.60 80.68 8.74 99.02 53.31 152.34 _____________________________________________________________________________________________________

33
Appendix Table 3. Self-propelled machines: estimated performance rate, useful life, annual use, purchase price, repair cost, fuel consumption rate, and direct and fixed cost per hour and per acre, Louisiana 2014.
____________________________________________________________________________________________________________ Purchase Annual Useful Fuel Perf Labor Fuel R&M Total Fixed Total Item Name Size Price Use Life Use Rate Direct Cost ____________________________________________________________________________________________________________ dollars hours years gal/hr hr/ac ----------------$/acre--------------- LA Pickup Truck 1/2 ton 25,000 800 5 2.50 1.000 9.60 8.25 2.81 20.66 6.54 27.20 SC Billet Harvester 6 ft 290,000 750 10 12.00 0.700 11.78 27.72 27.06 66.56 31.56 98.13 SC Harvester 1Rw 6 ft 115,000 400 12 6.80 0.875 14.72 19.63 20.96 55.32 25.96 81.28 SC Harvester 2Rw 12 ft 210,000 400 12 8.00 0.388 6.53 10.24 16.97 33.74 21.02 54.76 SC Loader 1Rw 6 ft 85,000 425 10 5.10 0.598 6.32 10.07 8.74 25.14 14.16 39.30 SC Loader 2Rw 12 ft 150,000 425 10 7.00 0.300 3.17 6.93 7.73 17.84 12.53 30.37 SC Transloader 30,000 120 12 4.70 0.250 2.64 3.87 3.75 10.26 6.44 16.71 SC Truck&Trailer 30 Ton 45,000 400 10 7.00 1.000 10.56 23.10 7.87 41.53 13.30 54.83 Sprayer( 300-450Gal 47' 0 350 8 5.40 0.022 0.38 0.40 0.00 0.78 0.00 0.78 Sprayer( 300-450Gal 60' 103,000 350 8 5.66 0.017 0.30 0.32 0.09 0.72 0.62 1.34 Sprayer( 300-450Ga 80' 103,000 350 8 5.66 0.013 0.22 0.24 0.07 0.54 0.46 1.01 Sprayer( 600-750Ga 60' 172,000 350 8 10.29 0.017 0.30 0.59 0.16 1.06 1.03 2.09 Sprayer( 600-825Ga 80' 174,000 350 8 10.29 0.013 0.22 0.44 0.12 0.79 0.78 1.58 Sprayer( 600-825Ga 90' 240,000 350 8 10.29 0.011 0.20 0.39 0.15 0.75 0.96 1.71 Sprayer(1000-1400Ga 90' 286,000 350 8 14.15 0.014 0.24 0.65 0.21 1.11 1.37 2.49 Sprayer(1200PlusG 120' 289,000 350 8 15.44 0.008 0.15 0.44 0.13 0.73 0.87 1.60 _________________________________________________________________________________________________________ Appendix Table 4. Implements: estimated performance rate, useful life, annual use, purchase price, repair cost, and direct and fixed cost per hour and per acre, Louisiana 2014. ___________________________________________________________________________________________________________________________ Power Purchase Annual Useful Perf Labor Fuel ---R&M---- Total --Fixed--- Total Item Name Size Unit Price Use Life Rate Imp. P.U. Direct Imp. P.U. Cost ___________________________________________________________________________________________________________________________ dollars hours years hr/ac ----------------------$/acre--------------------- SC 3Row (Cover) 18 ft MFWD 150 10,750 200 9 0.120 1.15 3.06 1.43 0.51 6.18 0.41 2.99 9.59 SC 3Row (Hipper) 18 ft MFWD 150 10,500 200 9 0.120 1.15 3.05 0.68 0.51 5.41 0.80 2.98 9.20 SC 3Row (Marker) 18 ft MFWD 150 8,800 200 9 0.120 1.15 3.05 0.58 0.51 5.31 0.67 2.98 8.97 SC 3Row (Offbar) 18 ft MFWD 150 11,500 200 10 0.120 1.15 3.05 0.69 0.51 5.41 0.81 2.98 9.21 SC 3Row (Opener) 18 ft MFWD 150 7,800 200 10 0.120 1.15 3.05 0.46 0.51 5.19 0.55 2.98 8.73 SC 3Row Plow 18 ft MFWD 190 17,000 200 9 0.120 1.15 3.87 1.11 0.60 6.73 1.30 3.65 11.70 SC Blade 8 ft MFWD 150 3,500 100 12 0.877 8.42 22.34 2.55 3.75 37.08 2.05 21.82 60.96 SC Boom Sprayer 16 ft MFWD 150 2,900 150 10 0.120 1.15 3.05 0.25 0.51 4.98 0.27 2.98 8.24 SC Burning Unit 18 ft 2WD 105 1,300 85 6 0.149 1.43 2.67 0.24 0.29 4.65 0.41 1.69 6.75 SC Cane Planters Aid 6 ft MFWD 150 4,500 20 20 1.000 9.60 25.47 8.43 4.28 47.79 16.57 24.88 89.25 SC Cane Plt-1R Bille 1 row MFWD 150 22,000 150 20 0.670 6.43 17.07 3.68 2.86 30.05 7.24 16.66 53.96 SC Cane Plt-3R Bille 3 row 2WD 50 34,000 50 20 0.200 1.92 1.69 5.10 0.12 8.83 10.02 0.70 19.56 SC Cane Plt-Whlstalk 6 ft MFWD 150 22,000 150 20 0.670 6.43 17.07 3.68 2.86 30.05 7.24 16.66 53.96 SC Cane Wagon 10T 10 Ton MFWD 150 7,500 400 15 0.500 5.28 14.01 0.62 2.35 22.27 0.82 12.44 35.54 SC Cane Wgn Billt HD 10Ton MFWD 150 40,000 750 9 0.600 6.33 16.81 5.33 2.82 31.31 3.95 14.92 50.19 SC Chisel Plow 13 ft MFWD 190 6,000 200 6 0.219 2.10 7.09 0.96 1.09 11.26 1.18 6.69 19.14 SC Chisel Plow 23 ft MFWD 190 12,000 200 6 0.120 1.15 3.87 0.49 0.60 6.11 1.28 3.65 11.06 SC Cultimulcher 12 ft 2WD 105 5,500 120 15 0.110 1.05 1.96 0.29 0.21 3.52 0.44 1.24 5.21 SC Cultivate + Post 6 Row 2WD 170 8,200 200 10 0.110 1.05 3.17 0.39 0.40 5.03 0.53 2.49 8.06 SC Cultivator 30" 6 Row 2WD 150 5,350 200 10 0.140 1.34 3.56 0.32 0.56 5.81 0.44 3.30 9.56 SC Disk 12 ft 2WD 50 8,500 200 10 0.149 1.43 1.27 0.56 0.09 3.36 0.75 0.52 4.64 SC Disk 20 ft MFWD 190 17,500 200 10 0.100 0.96 3.22 0.77 0.50 5.45 1.03 3.04 9.53 SC Disk 26 ft 2WD 170 21,000 200 10 0.069 0.67 2.02 0.64 0.26 3.59 0.86 1.58 6.05 SC Disk + Pre 6 row 2WD 170 9,250 200 10 0.100 0.96 2.88 0.40 0.37 4.62 0.54 2.26 7.44 SC Double Hitch DBLHTCH 2WD 50 0 1000 10 0.000 0.00 0.00 0.00 0.00 0.00 0.00 0.00 0.00 SC Drain Cleaner 6 ft MFWD 75 3,750 300 9 0.080 0.76 1.01 0.13 0.10 2.02 0.12 0.58 2.74 SC Fert 3Row Lq App 18 ft MFWD 150 7,000 200 10 0.130 1.24 3.31 0.36 0.55 5.48 0.53 3.23 9.25 SC Fert DrySlingApp 42 ft MFWD 150 6,500 150 10 0.059 0.57 1.52 0.22 0.25 2.58 0.30 1.49 4.38 SC Flat Roller 18 ft MFWD 150 1,400 75 9 0.190 1.82 4.84 0.47 0.81 7.95 0.45 4.73 13.14 SC Hauling Hitch 6 ft 4WD 225 1,000 500 15 1.000 9.60 38.21 0.13 4.59 52.54 0.17 28.01 80.73 SC Land Plane 15 ft MFWD 150 10,000 200 15 0.300 2.88 7.65 0.66 1.28 12.48 1.32 7.47 21.27 SC Rotary Ditcher 6 ft MFWD 150 12,500 100 10 0.250 2.40 6.36 3.12 1.07 12.96 3.69 6.22 22.88 SC Rotary Hoe 18 ft 2WD 130 4,500 75 12 0.080 0.76 1.76 0.41 0.23 3.18 0.48 1.38 5.06 SC Rotary Mower 13.1 ft MFWD 75 7,000 150 10 0.250 2.40 3.18 0.51 0.31 6.41 1.37 1.84 9.63 SC Rototiller 18 ft MFWD 190 20,000 150 10 0.219 2.10 7.09 3.51 1.09 13.81 3.46 6.69 23.98 SC Tractor Blade 6 ft 2WD 105 3,500 100 15 1.000 9.60 17.83 0.86 1.94 30.23 3.09 11.27 44.60 SC Tractor Spreader 20 ft 2WD 105 700 150 10 0.110 1.05 1.96 0.04 0.21 3.27 0.06 1.24 4.57 SC Trailer Utility 10 ft 2WD 130 2,000 200 15 1.000 9.60 22.08 0.23 2.98 34.89 0.88 17.32 53.10 SCMechanical Planter 6 ft MFWD 150 15,500 160 10 1.000 9.60 25.47 7.26 4.28 46.62 11.45 24.88 82.96 _________________________________________________________________________________________________________________________

34
Appendix Table 5. Operating inputs: estimated prices, Louisiana 2014. _______________________________________________________________________________________________________ ITEM NAME UNIT PRICE ITEM UNIT PRICE _______________________________________________________________________________________________________ dollars ADJUVANTS Crop Oil ( Seed Oil) pt 4.68 Crop Oil (Petroleum) pt 3.72 Surfactant pt 3.68 CUSTOM FERT/LIME App Fert by Air cwt 7.00 App Fert by Air(Min) appl 7.00 Custom Spread(Truc appl 4.50 Lime (Spread) ton 48.00 CUSTOM SPRAY App by Air ( 2 gal) appl 4.00 App by Air ( 3 gal) appl 5.00 App by Air ( 5 gal) appl 6.00 App by Air (10 gal) appl 7.75 FERTILIZERS Amm Nitrate (34% N) cwt 22.50 Amm Sulfate (21% N) cwt 17.75 Fert 10-34-0 cwt 28.25 Fert 41-0-0-4 cwt 20.50 LA Nitrogen lb 0.50 LA Phosphate lb 0.50 LA Potash lb 0.37 Phosphorus(46% P2O5) cwt 24.00 Potash (60% K2O) cwt 23.75 UAN (32% N) cwt 19.50 Urea, Solid (46% N) cwt 22.60 HERBICIDES 2,4-D Amine 4 pt 2.25 Atrazine 4L pt 1.75 Atrazine 90DF lb 3.50
Basagran pt 11.88 Command 3ME pt 17.75 Direx 4L pt 3.25 Direx 80 DF lb 7.37 Gramoxone Max pt 5.46 Karmex DF lb 6.50 LA Asulox gal 37.02 LA Weedmaster qt 7.25 Prowl 3.3 EC pt 3.75 Roundup Original pt 6.00 Roundup Original Max oz 0.38 Roundup Power MAX pt 3.13 Roundup WeatherMax oz 0.25 Sencor 4F pt 14.74 Sencor DF lb 14.85 Treflan HFP pt 2.38 INSECTICIDES Asana .66 XL oz 0.72 Baythroid 2 oz 2.30 Confirm 2F oz 2.06 Fury 1.5 EC oz 1.30 Karate Z oz 3.40 Mustang Max oz 1.60 Thimet 20-G lb 3.50 RIPENER Polado oz 0.38 SEED CANE Cultured seedcane acre 484.00