successful processes to design and evaluate industrial and
TRANSCRIPT

S C I E N C E & T E C H N O L O G Y P O L I C Y I N S T I T U T E
Successful Processes to Designand Evaluate Industrial and
Innovation Policies
Keith W. CraneAsha Balakrishnan
Todd D. RinglerLisa M. Van Pay
Lincoln M. ButcherMarilyn G. HarbertAndrew B. Ware
June 2021Approved for public release;
distribution is unlimited.
IDA Document D-22714 Log: H 21-000231
IDA SCIENCE & TECHNOLOGY POLICY INSTITUTE
1701 Pennsylvania Ave., NW, Suite 500 Washington, DC 20006-5805

About This Publication
This work was conducted by the IDA Science and Technology Policy Institute (STPI) under contract NSFOIA-0408601, Project TP-20-1005.CR, “Review of Successful Processes to Design and Evaluate Industrial Policies,” for the Office of Science and Technology Policy. The views, opinions, and findings should not be construed as representing the official positions of the National Science Foundation or the sponsoring agency.
For More Information
Keith W. Crane, Project Leader [email protected], 202-419-3736
Kristen M. Kulinowski, Director, Science and Technology Policy Institute [email protected], 202-419-5491
Copyright Notice
© 2021 Institute for Defense Analyses 4850 Mark Center Drive, Alexandria, Virginia 22311-1882 • (703) 845-2000.
This material may be reproduced by or for the U.S. Government pursuant to the copyright license under the clause at FAR 52.227-14 (May 2014).
The Institute for Defense Analyses is a nonprofit corporation that operates three Federally Funded Research and Development Centers. Its mission is to answer the most challenging U.S. security and science policy questions with objective analysis, leveraging extraordinary scientific, technical, and analytic expertise.
S C I E N C E & T E C H N O L O G Y P O L I C Y I N S T I T U T E
IDA Document D-22714
Successful Processes to Designand Evaluate Industrial and
Innovation Policies
Keith W. CraneAsha Balakrishnan
Todd D. RinglerLisa M. Van Pay
Lincoln M. ButcherMarilyn G. HarbertAndrew B. Ware


iii
Executive Summary
Purpose This report identifies effective processes to better design and evaluate innovation and
industrial policies. It concentrates on three types of policies: (1) selecting critical technologies and industries, (2) designing and operating effective manufacturing institutes, and (3) ensuring supply chain resilience and security. The report focuses particular attention on how to effectively collect information from stakeholders to better design such policies. The report was written to provide guidance to the Office of Science and Technology Policy (OSTP) as it assists the Administration in designing effective policies in these areas.
Selecting Critical Technologies and Industries Countries target technologies and industries that they hope will accelerate economic
growth, increase employment in higher wage occupations, and foster national security, among other goals. Portfolio selection is the process of gathering the relevant data and information needed to accurately compare and contrast candidate technologies or industries to be designated as worthy of government support.
We identified the following key points in terms of selection processes for critical technologies and industries:
• Government engagement in selecting critical technologies or industries should be based on a clear articulation of the motivations, vision, and intended outcomes of favoring one technology or industry over others.
• The selection process needs to be transparent.
• Companies need to play a major role in the selection process; they need to back up their choices with substantial commitments of funds or other resources, such as key staff.
• Commercial prospects should be a key criterion in the selection process.
• Technologies or industries should be selected based on existing endowments; efforts to create completely new industries without an existing base generally fail.
• Among others, the governments of Japan, South Korea, and Taiwan think highly of the U.S. system of selecting and funding new technologies using venture

iv
capital coupled with startups; they are attempting to create similar systems of their own.
• In addition to financial support for companies and procurements, governments can foster the success of selected industries through their roles in facilitating the development of standards and ensuring protection of intellectual property.
• Selected technologies and industries need to be evaluated on an ongoing basis. Failed technologies need to be abandoned to free up resources for more successful ones.
• The data gathering processes created for portfolio selection should support regular updates to promote evaluation.
Designing and Operating Effective Manufacturing Institutes Many industrialized nations design and implement government-funded (or co-
funded) institutes to accelerate technology development. Several countries and institutions have established manufacturing institutes or innovation centers. To identify more successful ways of establishing and operating such institutes and centers, we looked at the experiences of the United States with the Manufacturing USA Institutes and those of several other countries with their analogous manufacturing institutes (Appendices A and B). We examined how governments or industry (1) establish and operate institutes and centers to advance new technologies and (2) the extent to which those institutes or centers have achieved their goals.
Key findings include:
• Government funding for institutes should have a long, predictable time horizon.
• Industry needs to contribute funds or otherwise have a vested interest.
• Institutes and centers need to collaborate closely with universities and industry, allowing for the exchange of talent among institutions.
• Projects and investments are largely dictated by industry needs.
• Many projects and investments are geared to incremental improvements in products and processes; in Europe, efforts frequently do not focus on high-risk, high-reward research.
Ensuring Supply Chain Resilience and Security Supply chains “encompass the linkage of stages in a process from the initial raw
material or commodity sourcing through various stages of manufacture, processing, storage, transportation to the eventual delivery and consumption by the end consumer”

v
(Zsidisin and Ritchie 2009). Supply chain resilience and security refer to vulnerabilities and risks associated with supply chains.
There are some common principles and processes that organizations and governments use to enhance supply chain resilience and security, including to reduce U.S. supply vulnerabilities concerning critical materials. We find:
• For industry, all inputs are critical; the loss of any single input can halt production, so measures to ensure supply chain resilience and security need to be prepared to address any input.
• Measures to provide supply chain resilience and security include:
– Sourcing from more than one supplier;
– Designing products so that substitute inputs can be employed; and
– Preparing to respond rapidly to disruptions
• Supply chain security and resilience efforts need to include considerations of costs and competitiveness.
• Suppliers from friends and allies should be treated the same as domestic producers.
• Capital subsidies to develop alternative suppliers are more effective than tariffs because they improve the competitiveness of the domestic supplier rather than creating an insulated, high cost domestic market for the input that increases costs for domestic users.
• Procurement contracts have also been useful for supporting the emergence of alternative suppliers.
• Government support and mandates may be needed to provide end-to-end supply chain visibility.
• New policies and possibly legislative action may be necessary to ensure that intelligence about threats can be shared more widely.
• Metrics for evaluating measures to improve supply chain resilience and security include:
– Reduction in production lost as a percentage of lost output;
– Time to recovery to full production;
– Reduction in losses of sales because of the disruption; and
– Financial cost of measures.


vii
Contents
1. Introduction .................................................................................................................9 A. Purpose ................................................................................................................9 B. Background .........................................................................................................9
1. Industrial Policy ..........................................................................................10 2. Innovation Policy ........................................................................................14
C. Approach ...........................................................................................................18 2. Selecting Critical Technologies and Industries .........................................................19
A. Introduction .......................................................................................................19 1. Definition .....................................................................................................19 2. Evaluating Choices of Critical Technologies or Industries .........................19
B. Key Principles for Selecting Critical Technologies and Industries ...................19 1. Statement of Purpose ...................................................................................20 2. Transparency ...............................................................................................20
C. Processes for Selecting Technologies or Industries ..........................................20 1. Selection Systems ........................................................................................20 2. Roles of Stakeholders ..................................................................................22 3. Conditions for Successful Selection of Innovative Technologies and
Industries .....................................................................................................22 4. Selection Criteria .........................................................................................23
D. Government Roles and Responsibilities ............................................................24 1. Standards .....................................................................................................24 2. Protection of Intellectual Property ..............................................................24 3. Focusing on Existing Strengths ...................................................................24
E. Evaluation of the Selection of Critical Industries and Technologies ................25 F. Observations ......................................................................................................25
3. Designing and Operating Effective Manufacturing Institutes ...................................27 A. Introduction .......................................................................................................27
1. Definition .....................................................................................................27 2. Successful Manufacturing Institutes and Centers .......................................27
B. Establishing and Operating Institutes and Centers ............................................28 1. Governance ..................................................................................................28 2. Long-Term Approach ..................................................................................29 3. Criteria for Selecting the Research Focus of Centers and Institutes ...........29 4. Collaboration across Organizations .............................................................30 5. Workforce Training .....................................................................................30
C. Process for Evaluating the Effectiveness of Centers or Institutes .....................30 D. Observations ......................................................................................................31

viii
4. Ensuring Supply Chain Resilience and Security .......................................................33 A. Introduction .......................................................................................................33
1. Definition .....................................................................................................33 2. Differences between Supply Chain Resilience and Security and
Access to Critical Materials ........................................................................34 B. Managing Supply Chain Security and Resilience .............................................34
1. Making Supply Chains Visible....................................................................35 2. Improving Supply Chain Resilience and Security ......................................35
C. Evaluating Supply Chain Resilience Efforts .....................................................36 1. Have the Measures Improved Supply Chain Resilience and Security? ......37 2. Have the Measures Been Widely Adopted? ................................................37 3. Have the Costs of the Measures Reduced U.S. Competitiveness? ..............38
D. Government Efforts to Reduce Supply Vulnerabilities to Critical Materials ...38 1. DoD Process ................................................................................................38 2. The CISA Process .......................................................................................40 3. Comparison of Processes .............................................................................41
E. Supply Chain-related Policy Considerations .....................................................41 F. Observations ......................................................................................................43
Appendix A. Examples of Other Countries’ Innovation and Industrial Policies ............ A-1 Appendix B. Examples of Manufacturing Institutes ........................................................B-1 References ........................................................................................................................C-1 Abbreviations .................................................................................................................. D-1

9
1. Introduction
A. Purpose This report identifies effective processes to better design and evaluate industrial or
innovation policies. It focuses on three sets of policies: (1) selecting critical technologies and industries, (2) designing and operating effective manufacturing institutes, and (3) ensuring supply chain resilience and security. The report was written to provide guidance to the Office of Science and Technology Policy (OSTP) as it assists the Administration in designing effective policies in these areas.
As the U.S. Government launches new policies and programs in these three areas, it behooves it to learn from its own experiences and those of other countries. In particular, answers to the following questions would be useful: What are the strengths and drawbacks of alternative policies? Which planning and evaluation processes have resulted in successful industrial policies? How have governments, including our own, collected information about industry’s needs without falling capture to the interests of industries and government agencies?
B. Background The Administration and the Congress of the United States are supporting a number of
initiatives to strengthen U.S. industry and secure U.S. supply chains.1 In particular, the Administration wishes to increase the share of manufactured goods made in the United States in the total share of U.S. purchases of these goods (EOP 2021a), substantially increase the number of workers in manufacturing that earn higher than average wages (Biden 2021), and maintain world leadership in the technologies and industries of the future (Biden 2021a). The Administration and many members of Congress are contemplating large increases in expenditures on supporting selected U.S. industries by increasing funding for research and development (R&D), expanding U.S. Government-supported manufacturing institutes, and adopting measures to improve supply chain resilience and security. To ensure these funds are spent to good effect, the Administration and Congress will need to design and implement effective policies and procedures in these areas.
1 Initiatives include the Executive Order on America’s Supply Chains (EOP 2021), provisions of the
National Defense Authorization Act 2021 (NDAA 2021) on microchips and artificial intelligence (Congress 2021), provisions of the various versions of the proposed Creating Helpful Incentives to Produce Semiconductors (CHIPS) for America Act (Congress 2020), and provisions in the proposed Endless Frontier Act (Congress 2020a).
10
Policy makers and analysts classify the proposed initiatives as industrial or innovation policy instruments. Below, we first provide definitions of and rationales for industrial and innovation policies and the differences between them. We then discuss how one evaluates the overall effectiveness of industrial and innovation policies, with an eye to assessing alternative policy instruments within the three sets of policies on which the paper focuses.
1. Industrial Policy
a. Definitions Krugman and Obstfeld (1991) define industrial policy as “an attempt by a government
to encourage resources to move into particular sectors that the government views as important to future economic growth.” In a similar vein, Price (1981) defines industrial policy “as any government measure, or set of measures, to promote or prevent structural change.” Aiginger and Rodrik (2020) define industrial policy more broadly, describing it as a systemic approach that coordinates innovation, regional, and trade policies, with manufacturing at its core. Most economists define the purpose of industrial policies as improving “growth and competitive performance” (Adams and Klein 1983). Aiginger and Rodrik (2020) argue industrial policy should also be steered by societal goals, extending beyond the correction of market failures. For the purposes of this report, we use the definition of Krugman and Obstfeld (1991).
Geroski (1989) notes that industrial policies include a “wide-ranging, ill-assorted collection of micro-based supply initiatives which are designed to improve market performance in a variety of occasionally mutually inconsistent ways.” Such initiatives have been used for centuries. Historically, industrial policies involved the use of embargos, tariffs (Juhasz 2018), restrictions on the transfer of technologies, and limitations on labor entering restricted occupations, like trade guilds (Stantchev 2012). Going back to the Middle Ages, many countries or regions often employed “buy local” regulations to ensure that some products could only be purchased from local sources—high quality cloth in Bruges, for example (Stantchev 2012). Since World War II, industrial policies have been characterized by top-down policy making, targeting pre-selected sectors, and the use of tariffs, import quotas, capital and labor subsidies, state ownership, and other incentives to foster growth in specific sectors in manufacturing, and at times, the mining industry (Aiginger and Rodrik 2020).
The United States has implemented many types of industrial policies. Trade policies in the 19th Century, which involved the imposition of tariffs on manufactured imports, were designed to foster the development of domestic manufacturing, especially in textiles and machinery, in addition to raising revenues. Consumers of the taxed imported goods paid the price of these policies. For example, farmers of export crops—such as cotton and

11
wheat—who purchased imported goods from abroad suffered net welfare losses from these tariffs.
Even as the U.S. Government has liberalized trade, it has continued to pursue some industrial policies, especially in the energy sector. In the 1970s, it provided substantial subsidized loans and other support to a synthetic fuels industry, which collapsed in the 1980s (Priddy 2013). Since the 1950s, it has adopted a number of measures to create and support the nuclear power industry, including providing subsidized loans for the construction of two new nuclear reactors in Georgia in 2008 (Abrahams et al. 2018). It also provides grants to energy technology companies through Advanced Research Projects Agency-Energy (ARPA-E) (ARPA-E n.d.). The Department of Energy (DOE) continues to provide tax credits and production subsidies for renewable sources of electricity (EPA 2016).
b. Rationales for Industrial Policies Governments adopt industrial policies for numerous political, social, national
security, and economic reasons. Countries frequently erect barriers to trade—such as tariffs, quotas, import licenses, and national standards—because of pressures or favors from politically important constituencies. Barriers to trade have frequently been raised in exchange for bribes (Bjørnskov 2012). Social pressures to maintain traditional lifestyles or protect the production of a socially important product have resulted in policies to protect the production of the socially sensitive (and politically sensitive) product, for example, Japan’s subsidies, tight quotas, and high tariffs on rice (Hayami and Godo 1997).
Industrial policies are frequently employed for reasons of national security. The ability to manufacture weapons domestically is generally considered important for protecting national security. Countries frequently adopt industrial policies to ensure that adversaries cannot disrupt supply chains for weapons and other military equipment.
Economic arguments for industrial policies primarily focus on “infant industry” or agglomeration effects. Agglomeration effects are competitive advantages that accrue from industries where suppliers and final producers congregate in geographical proximity to each other (Porter 1990). Such clusters benefit from amassing pools of skilled labor, reduced logistics costs because of the proximity of suppliers, and more rapid rates of technological change as companies quickly learn about new technologies and products and knowledge is shared as workers move from one company to another (Porter 1990). Supporters of industrial policies argue that by providing support for a new industry, a cluster will form, creating a dynamic comparative advantage and resulting in the country enjoying more rapid economic growth and net welfare than it otherwise would because of rapid growth in output, added value, and employment in the favored industry.
12
c. Evaluating Industrial Policies Although indicators such as probability of reelection or the preservation of valued
traditions and domestic products can be collected, for the purposes of this paper, we focus only on the successes of industrial policies in preventing reliance on adversaries for key components of weapons and military equipment, and in improving economic indicators of competitiveness. Supply chain analyses that identify critical materials or components by country of origin can determine reliance on adversaries. An industrial policy can broadly be considered successful if materials, components, or products sourced domestically or from friendly nations replace those that had previously been procured from an unfriendly country, ending U.S. reliance on that country.
Measuring the economic success of industrial policies is more complicated. Industrial policies can generally succeed by expanding output or employment in an existing industry or by preventing its collapse. However, increasing industrial output from a particular industry is not an end in itself. During the 1960s and 1970s, many developing countries built up manufacturing industries, like steel and aluminum. Many of these industries produced poor quality products at high cost and lost substantial sums of money, reducing gross domestic product (GDP) and net social welfare (Kroeger 1990). For example, many of Ghana’s industries, built in the 1960s, operated at very low capacity levels and incurred large losses in the 1970s (Berry 1994).
Some industrial policy goals face strong countervailing trends. A frequently cited industrial policy goal is to raise employment in manufacturing (Biden 2021) or the share of GDP contributed by manufacturing (EC 2014). Like agriculture in the 19th and 20th centuries, however, employment in manufacturing in total and as a share of total employment has been on a downward trend in most countries. For example, after peaking at 232.4 million workers in 2012, manufacturing employment in China had fallen by 19.4 million workers, 8.3 percent, by 2019 (National Bureau of Statistics of China 2020).
Thus, economists focus on measuring increases in total factor productivity within the targeted industry to weigh the benefits against the costs of industrial policies (Lane 2020). If the rate of increase in total factor productivity accelerates or surpasses rates in a suitable competitor country, there is evidence that the policy has been successful. An alternative measure is changes in global competitiveness in the industry following the intervention. This can be measured by increases in global market share by the industry.
Despite the availability these measures of success, determining whether an industrial policy has been effective is difficult. First, as noted above, governments have used a wide range of policy instruments to pursue industrial policies, often in combination with each other, so untangling which policy or combination of policies has led to positive outcomes and which have not is challenging. Second, in many cases, employment of industrial policy instruments undergoes changes over time, often in just a few years. Determining which
13
instruments have been more successful than others is difficult, and has not been an effective approach (Lane 2020). Another challenge is that to judge whether a policy has been successful, one needs to compare the results of the policy with the results from a country in which the policy has not been employed. Researchers have developed approaches to developing counterfactuals through natural experiments, but this problem remains.
There is strong empirical evidence that some industrial policy instruments are detrimental to economic growth. State-owned companies generally perform worse than privately-owned companies in terms of growth in output, profitability, and employment. State-ownership tends to result in management choices dictated by political pressures rather than performance, such as overstaffing, avoiding closing loss-making operations, underinvestment due to government demand for funds, and nepotism (Krueger 1990).
Since the 1980s, unhappy experiences with state-owned companies led many governments in Europe, Latin America, South Asia, and Africa to privatize state-owned companies (OECD 2018). Revealed preference suggests that government ownership and operation of manufacturing companies is no longer considered an effective policy. Governments around the world have continued to sell off state-owned enterprises, generating substantial revenues in the process: globally, revenues from privatization rose from $110 billion in 2008 to $266 billion in 2016 (OECD 2018).
Tariffs have also fallen into disfavor because they reduce overall welfare and slow growth in output and overall employment by propping up uncompetitive domestic industries (Krueger 1990). The effects of tariffs are especially harmful for export industries because they raise the cost of inputs, making it more difficult for these industries to compete in world markets. For a recent example, the Trump Administration’s imposition of tariffs led to a decline in U.S. manufacturing output and employment because downstream industries became less competitive than their foreign competitors because of the higher costs they had to pay for steel, aluminum, and components (Flaaen and Pierce 2019). The tariffs increased prices for U.S. consumers and generated significant reductions in aggregate welfare (dead weight losses) to the U.S. economy (Amiti et al. 2019).
Because of trade agreements, direct subsidies to targeted industries have become less tenable. In Europe, the European Commission has foreclosed national programs to provide direct subsidies or subsidized lending to targeted industries as part of the Single Market Act under the argument that net social welfare is improved by letting companies freely compete on a level playing field (EC 2010).
Even in the case of countries like Japan, South Korea, and Taiwan, which enjoyed rapid growth during periods where they employed a range of industrial policies—including tariffs, quotas, and targeted subsidized lending2—it is unclear which, if any, of these 2 See Appendix A for examples of policies in these three countries.
14
instruments were helpful to the rapid, transformative growth of these countries or even whether these policies contributed to rather than slowed economic growth (Porter 1990). By the 1980s, Japan and South Korea were shifting away from policies supporting selected manufacturing industries to measures more focused on fostering innovation (Appendix A).
2. Innovation Policy
a. Definitions Edler and Fagerberg (2017) define innovation as the introduction and diffusion of
new solutions in response to problems, challenges, or opportunities that arise in society or the economy. It has been the primary determinant of economic growth (Romer 1990). Edler and Fagerberg (2017) define innovation policies, in turn, as measures taken by governments to influence a country’s innovation performance. Innovation policies are adopted to pursue social aims, support national security goals, and accelerate economic growth through the creation of new products and markets, reductions in costs, and improvements in quality, providing a domestic industry with a globally competitive edge.
Innovation policies include government expenditures on R&D and technological diffusion in areas considered to be of high importance (Edler and Fagerberg 2017). In addition to R&D grants, governments provide access to government research infrastructure, such as opening testing facilities to innovators; investment subsidies, like government-backed loan guarantees; preferential tax treatment; and favorable treatment in government procurement to support applied R&D—including precommercial procurement—in an effort to accelerate the creation of innovations. Governments also seek to foster the development of environments congenial to innovation through educational and training programs to create a suitable workforce for the targeted innovation sector; the provision of technical services and advice; hosting or sponsoring fora where researchers, companies, and prospective customers may exchange information; and other such measures (Edler and Fagerberg 2017).
b. Rationales for Innovation Policies Because innovation is seen as a solution to many public policy problems,
governments seek to encourage the development and diffusion of innovations to address a broad range of public policy concerns. For example, innovation policy is playing a preeminent role in efforts to decrease emissions of greenhouse gases (ARPA-E n.d.). Innovation policy has also been employed to reduce the number of people addicted to opioids and the consequences thereof (HRSA n.d.). This broad range of goals for innovation policies contrasts with industrial policies, which focus primarily on accelerating economic growth by supporting targeted manufacturing industries.

15
For the purposes of this paper, we focus on innovation policies directed at accelerating economic growth. One of the economic rationales for government support for innovation is market failure. Arrow (1962) and other economists argue that in a market economy, private investors underinvest in basic research because they are unable to fully capture the returns from innovations developed from that research. Uncertainties associated with moving from basic research to a marketable product, the long timelines needed to develop marketable products from basic research, and difficulties in capturing returns from innovations built on basic research (or even tracing innovations to the original research) reduce incentives for private sector companies to invest in basic research.
Progress on research is accelerated when results are spread widely; widespread dissemination of research results, however, undermines potential payoffs for private investors. As a consequence, private rates of return from basic research are less than social rates of return: society would benefit if more basic R&D were undertaken (Arrow 1962). Under this argument, support by governments, foundations, and universities for basic research improves net public welfare by increasing the rate of innovation.
A second, related rationale for innovation policy is premised on the importance of the social and economic environment for fostering innovation. Successful innovation depends not only on factors internal to the organization, but also on interactions with external actors (Fagerberg and Hutschenreiter 2020). Firms and other organizations benefit from interacting with customers, academic researchers, competitors, investors, suppliers, and other groups during the process of innovation. Because of barriers to information flows and the costs of engaging with other participants, innovation may proceed more slowly and less smoothly than in a more hospitable environment. According to Fagerberg and Hutschenreiter (2020), governments can implement policies that help rectify some of these deficiencies.
A third rationale for government policies in support of innovation focuses on the role of access to finance in the growth of innovative firms and by extension the diffusion of new innovations through the growth of those firms. According to this argument, difficulties in accurately communicating prospects about small innovative firms to investors, among other problems with transmitting reliable information, result in underinvestment in those firms and therefore in innovation (Howell 2017).
c. Evaluating Innovation Policy For the same reasons that evaluating the effectiveness of industrial policy instruments
is difficult, so too is evaluating innovation policy instruments. Most countries employ several policies to foster innovation. These policy instruments are often employed in combination, the policies and programs change over time, and factors external to government policy may have had a more decisive impact on innovation outcomes than the policy instruments themselves. Determining which of these policies or combinations of

16
policies have been successful, especially when considering characteristics that differ between countries—skilled workforce, historical strengths in particular industries, and others—is difficult. Moreover, the outcomes of innovation often take an extended period of time to materialize. Consequently, causality is difficult to determine.
Despite these problems, hundreds of studies have been conducted to assess innovation policies. One approach has been to attempt to understand why some countries are more innovative than others. These studies often focus on the national innovation system (Freeman 1987), which can be defined as the environment for innovation and includes the availability of sector knowledge, technical skills, financial resources, and demand for innovations. Performance of a national innovation system can be measured in terms of the development of new products and processes, changes in revenues from new products and services, changes in the country’s global market share and employment in the targeted sector, and changes in relative wages or the numbers of workers being paid above-average wages in the country. On the basis of these metrics, the United States scores very well.
Indices have been created that combine several of these metrics to provide overall rankings of countries. One example, the European Innovation Scorecard, is an index composed of four broad categories—framework conditions, investments, innovation activities, and impacts—which in turn are compiled from subindices constructed from a number of statistics (Hollanders 2020).3 The Scorecard is used to rank all the European countries annually in terms of innovation.
One can argue about what statistical series are included and how those series are weighted, but on the basis of these measures, many of the traditional higher income countries—like Finland, Germany, the Netherlands, Sweden, and the United States—score well. Among countries that have risen into the ranks of the higher income countries more recently, Israel, South Korea, and Taiwan also do well (Appendix A). China and India have also risen in rankings over the last two decades. Most other lower and middle-income countries rank lower.
Countries that score highly tend to have commonalities: strong universities, highly skilled labor forces, and corporations that focus on markets where innovation is a distinguishing feature, like microchips, pharmaceutical and other “high technology” sectors, but also motor vehicles and machine tools. From a policy perspective, more successful countries tend to have governments that provide substantial funding for basic research, both at universities and independent laboratories, and applied research. Funding
3 For example, the index for framework conditions consists of three subcategories: human resources,
attractive research systems, and innovation friendly environment. The subindex for attractive research systems includes data on the number of the country’s international scientific co-publications, the number of journal articles in the top 10 percent of the most cited publications in a field, and the number of foreign doctoral students (Hollanders 2020).

17
for applied research tends to require participation by companies through either cost sharing or in-kind contributions (Fagerberg and Hutschenreiter 2020). In general, more successful innovation—as measured by new products, global market shares, and more rapid growth in revenues and employment—tends to occur in areas in which the country has already demonstrated a comparative advantage (See Appendix A for a discussion of this point).
Highly ranked countries on these lists tend to share characteristics such as high levels of education; good universities; large, globally competitive companies; and substantial government support for R&D. But a shared set of characteristics does not explain what causes successful innovations and innovative industries to emerge. Case studies are frequently employed in an attempt to uncover the factors, including policy initiatives, that may lead to the rise and fall of innovative industries (e.g., Fagerberg and Hutschenreiter 2020). Assessments based on econometric methods have also been employed (Lane 2020). Such studies are often suggestive, but frequently not definitive (Lane 2020).
Some studies have been able to identify whether specific policies have successfully contributed to fostering innovation. Howell (2017) found definitive evidence that research grants to small companies can increase innovation. Howell (2017) assessed the Small Business Innovation Research (SBIR) program in DOE and found that an early-stage SBIR award approximately doubles the probability that a firm receives subsequent venture capital; SBIR grant awards also have large, positive impacts on patenting and future sales revenues. Another study led by Howell examined reforms to the Air Force SBIR program. The paper found that by opening up SBIR solicitations to ideas generated by applicants rather than stipulating specific technologies, the SBIR grants were more successful as measured by the age of the firm (younger was considered better), previous awards (fewer awards were considered better), post-award investments by venture capital, non-SBIR contract awards, and number of patents as measures of success (Howell et al. 2020). Studies of less quantifiable activities such as hosting networking events or assessing the contributions of national research councils have had greater difficulty in determining the impacts of these efforts.
Because identifying which particular policies foster innovation is so difficult, some assessments of individual innovation policy instruments have focused on targeted measures of outputs or outcomes rather than their broader effects on innovation. For example, Manufacturing USA, the organization charged with running the U.S. manufacturing institute program, employs output metrics such as the number of collaborative projects with industry, the numbers of organizations and individuals engaged, and amounts of co-funding to measure the program’s performance; these metrics are inadequate for assessing the utility of the institutes (Manufacturing USA Program 2019).
18
C. Approach In this introduction, we have discussed the definitions, rationales, and measures of
success for industrial and innovation policies so as to provide context for the rest of the report, which we have organized into three chapters: (1) selecting critical technologies and industries, (2) designing and operating effective manufacturing institutes, and (3) ensuring supply chain resilience and security. We have chosen to categorize the first two subjects as related to innovation policy, whereas ensuring supply chain resilience and security was categorized as related to industrial policy.
We begin each of these chapters by defining the activity. We then draw on a series of case studies of the processes employed to select critical technologies and industries, and to design and operate manufacturing institutes, to describe the policies employed in the United States and elsewhere that have had success using some of the metrics noted above. Our list of industrialized entities and countries includes the European Union (EU), Germany, Israel, Japan, the Republic of Korea, Sweden, and Taiwan. Despite the important role industrial policies have played in China, we do not draw on China’s experience directly because its economic system is so different from that of the United States, in particular the role the Chinese Communist Party (CCP) plays in society and the economy, including the means by which the Chinese government and the CCP gather information to develop policies and allocate R&D funding.
Our research draws on interviews, public documents, previous assessments of policy making in these areas, and the economics literature, with a particular focus on the public finance literature. For our assessments of technology selection processes and manufacturing institutes, we draw on the results from past studies and on revealed preference—the extent to which countries continue to employ similar programs and policy instruments. Although one can argue that governments, like people, are susceptible to fads, programs and policy instruments that endure and have been widely adopted are likely to be more effective than those that have been dropped. We also describe how past policies have collected and incorporated information from stakeholders and how countries have sought to avoid policy capture by stakeholders, including government agencies and corporations, drawing on prior studies and interviews.

19
2. Selecting Critical Technologies and Industries
A. Introduction
1. Definition Countries target technologies and industries, often characterized as critical, that they
hope will accelerate economic growth, increase employment in higher wage occupations, and foster national security, among other goals. Portfolio selection is the process of gathering the relevant data and information needed to accurately compare and contrast candidate technologies or industries to be designated as worthy of government support.
Jaffe et al. (2005) notes that portfolio selection is not a one-time action but involves a continuous process of evaluation. Every industry, technology, or strategy that is chosen carries with it the opportunity cost of all the industries, technologies, and strategies that are not chosen. While the opportunity cost is deemed acceptable at the time of the decision, new data or new circumstances may change the calculations of net benefits, indicating that policy makers should restructure the portfolio. Adjustments may also need to be made to address weaknesses in selection criteria.
2. Evaluating Choices of Critical Technologies or Industries The success of the selection of industries to be favored can be measured by increases
in global market share by favored companies in their respective markets, the origination of key new technologies and products from domestic companies, growth in employment in the favored sector, and more rapid growth in the favored sector than in other sectors of the economy. To assess the effectiveness of the policies employed, these achievements are compared against the cost of the policies.
B. Key Principles for Selecting Critical Technologies and Industries At least 50 nations have adopted national innovation strategies; many have set up
agencies or foundations with the specific purpose of developing, implementing, and monitoring these strategies (Ezell et al. 2015). We have identified key principles for selecting critical technologies and industries from documents and literature on the experiences of several of these countries and from interviews with individuals who have led these institutions and other subject matter experts.

20
1. Statement of Purpose
According to our interviewees, sound processes for selecting critical technologies or industries should be based on a clear statement of purpose that articulates the motivation, vision, and intended outcomes of the selection. The statement of purpose should answer the following questions: Who will benefit if the policy is successfully executed? What outcomes define success? What are the top-level criteria for evaluating programs, strategies, and investments used in executing the policy? In addition, the statement of purpose for the selection process should be technologically neutral, to the extent possible (Fagerberg and Hutschenreiter 2020).
One example of a clear statement of purpose designed to provide rationales and guidelines for selecting and supporting specific areas of innovation is that of the Swedish innovation agency, Vinnova:
Our mission is to promote sustainable growth by improving the conditions for innovations, as well as funding needs-driven research. Vinnova’s vision is for Sweden to be a world-leading country in research and innovation, an attractive place in which to invest and conduct business. We promote collaborations between companies, universities, research institutes and the public sector. We do this by stimulating a greater use of research, by making long-term investment in strong research and innovation milieus and by developing catalytic meeting places (Vinnova n.d.).
2. Transparency
Because the selection of technologies and industries has important financial as well as economic implications, selection procedures should be transparent. One interviewee noted that the selection of industries and technologies needs to take place using “open covenants, openly negotiated.” Transparency promotes a shared understanding of purpose across stakeholder groups with diverse backgrounds and interests. It also allays problems associated with policy capture by stakeholders, including government agencies and corporations. Transparent information gathering and evaluation procedures, such as workshops, advisory committees, and publicly released strategy documents, guard against unintended capture by stakeholders.
C. Processes for Selecting Technologies or Industries
1. Selection Systems Governments frequently use high-level commissions composed of prominent
individuals from industry and academia, as well as government, to provide guidance on which future technologies to focus. For example, the European Commission selected a group of 20 experts representing small and big businesses, traditional and disruptive
21
industries, trade unions, the innovation and research community, as well as finance and academia for a high-level industrial roundtable that wrote A Vision for the European Industry until 2030 (Directorate-General for Internal Market, Industry, Entrepreneurship and SMEs 2019). Participants were selected through a competition. In the United States, the President’s Council of Advisors on Science and Technology (PCAST) advises the President on matters involving science, technology, education, and innovation policy. Members are appointed by the President and include distinguished individuals from sectors outside of the Federal Government who have diverse perspectives and expertise in science, technology, education, and innovation (DOE n.d.). PCAST publishes policy papers, some of which highlight areas on which it recommends the government focus R&D funding.
Other countries give more authority to high-level councils. Sweden uses a Technical Research Council to make decisions on funding basic engineering research (Elg and Håkansson 2012). Finland employs a Research and Innovation Council (RIC), which is chaired by the Prime Minister. However, following Finland’s back-to-back recessions in 2009 and 2012, the prominence of the RIC has fallen, as Finland has focused more on stimulating the growth of new innovative companies than on a national applied R&D program (Fagerberg and Hutschenreiter 2020). The Netherlands has set up its Innovation Platform, inspired by Finland’s RIC (Fagerberg and Hutschenreiter 2020). South Korea has a National Science and Technology Commission that develops R&D plans by conducting evaluations of prospects for new technologies, drawing on the advice of representatives from industry, government, government research institutes, and universities (Gupta et al. 2013). The Council also oversees ministries’ R&D budgets (Pak and Rhee 2016).
Perhaps not surprisingly, at a high level, during a specific period of time these councils tend to select similar technological areas on which to concentrate. For example, in 2020 and 2021, the bodies cited above have recommended funding for R&D and other support for microelectronics, quantum technologies, renewable energy, and artificial intelligence, reflecting discussions in the popular scientific press and the research community about important emerging technologies.
At a more practical level, these countries use councils, industry advisory boards, and review panels staffed by individuals with expertise in research, engineering, or production processes or who have decision-making authority in their companies or institutions to help guide selections of specific technologies or innovations on which to concentrate. Participants on selection boards for funding for applied R&D are vetted to screen out those with financial interests in the outcome of the selection.
Evaluations of the research advisory boards in Finland, the Netherlands, and Sweden found that all three tended to make funding decisions that focused on current areas of expertise and often on more immediate problems of applied technology. These boards, as well as those of Germany’s Fraunhofer manufacturing institutes, have not done a good job

22
of supporting the emergence of innovative new industries (Fagerberg and Hutschenreiter 2020; Appendix B).
An alternative approach to selecting innovative new industries has been to rely on financial and market mechanisms to identify likely innovative technologies. The U.S. system of selecting and funding new technologies, primarily driven by the private sector through venture capital coupled with startups, and R&D by large corporations, is highly regarded across the world. Several governments, including those of South Korea and Taiwan, have endeavored to create environments of their own, similar to the system in the United States, that are supportive of new entrepreneurial startups and venture capital, (Appendix A).
2. Roles of Stakeholders Over the past few decades, governments—European governments in particular—
have made a concerted effort to include a broader spectrum of stakeholders in portfolio selection, often by appointing individuals from a wider range of stakeholder groups to technology selection panels. In the United States, stakeholders have included individuals from local and State governments; from academic institutions; chief executive officers from small, medium, and large companies; entrepreneurs; subject matter experts from the public, private, and nonprofit sectors; career Federal civil servants; Federal political appointees; and Members of Congress and their staff. Processes for selecting technologies or industries have been expanded to address the varied interests of stakeholder coalitions. Stakeholders are also being asked to articulate their value propositions. By so doing, the conveners of panels believe they can promote transparency and help set more effective criteria for selecting industries and technologies.
Regional stakeholders are often important for linking technologies or industries to regional clusters and infrastructure. The value of selecting and supporting innovative technologies and industries to regional governments is clear: growth in economic output, development of new industries, increased employment, the creation of magnets to attract a more highly skilled workforce, and spillover opportunities. Regional partnerships can also serve as key linkages in global strategic value chains that require regional proximity (Popper 1998).
3. Conditions for Successful Selection of Innovative Technologies and Industries
Historical evidence from executed innovation and industrial policies suggests that the time horizon for successful outcomes is typically a decade or more (Gerstel and Goodman 2020; Office of Technology Assessment 1991). This long time horizon creates political and economic risks. In particular, the coalitions that initially selected the innovative technology or industry may fray over time. The durability of coalitions is an important factor in maintaining support for the area of innovation, especially as stakeholder coalitions

23
for specific sectors are diverse, ranging from local governments to senior Federal officials to private sector CEOs to academics.
One way to build a durable coalition is through joint development, management, and funding of shared initiatives. For example, 14 U.S. corporations, leading universities, national laboratories, and the U.S. Government jointly created and led Sematech, an initiative to support the U.S. semiconductor industry. Through joint investment of nearly $2 billion over the course of a decade, semiconductor corporations and the U.S. Government tackled a set of technical challenges confronting the U.S semiconductor industry. After 10 years, however, the joint venture was dissolved and reconstituted as a collaboration among global semiconductor companies, as the initial impetus of concerns about foreign competition diminished and key stakeholders became less committed (Gerstel and Goodman 2020).
In addition to stakeholders, panels to select innovative industries and technologies often engage “neutral parties” to participate or to provide support and advice. Even using the most transparent of processes, stakeholders bring with them biases and policy preferences. External review guards against poor policy choices stemming from groupthink, overconfidence, and confirmation bias. External neutral parties are drawn from academia, think tanks, federally funded research and development centers, associations, and career civil servants from Federal agencies.
4. Selection Criteria At the national or regional level, portfolio selection involves choosing among a suite
of candidate technologies. One of the key criteria for selection is commercial prospects. Germany and Sweden, for example, explicitly use commercial prospects as a criterion for supporting a technology or industry. Selection processes sometimes incorporate detailed roadmaps to commercialization that forecast when the government may be able to reduce support.
In regions and countries that have successfully employed industrial policies, the choice of technologies and industries is often dictated by historical assets from an established industrial base, including existing or analogous infrastructure. For example, Denmark’s Vesta, now a world leader in onshore wind turbines, was previously a crane manufacturer (Gerstel and Goodman 2020). Vesta’s existing equipment and plants and workforce, skilled in building heavy machinery, were transferable from cranes to wind turbines. Taiwan now dominates the world’s dedicated chip foundry market. Although Taiwan did not initially have a microchip manufacturing industry, it did have a well-

24
developed electronics industry and a highly skilled workforce with deep electrical engineering expertise on which to build.4
D. Government Roles and Responsibilities Governments can help to make selections more successful by supporting
preconditions that are likely to make the innovations more successful. Preconditions include the following:
1. Standards For many new technologies, products change rapidly, making it difficult to settle on
standards. The government can facilitate the development of standards on a timeline commensurate with the deployment and commercialization of the technologies by serving as a convener. When the government is a major customer for the technology, it can also help set standards by incorporating them into its procurements.
2. Protection of Intellectual Property Industrial policies frequently enable the creation of new intellectual property (IP).
The government can play an important role in facilitating the creation and dissemination of new technologies by articulating rules for accessing and protecting IP.
3. Focusing on Existing Strengths The U.S. Government employs a range of policy instruments to encourage the
development and commercialization of a broad range of new technologies: expenditures on basic R&D through the National Science Foundation and other agencies, R&D tax credits, SBIR and Small Business Technology Transfer Research (STTR) programs, and Manufacturing USA Institutes, among others (Ezell 2019). Aligning these policy instruments with industry’s needs is an important criterion for the success of industrial and innovation policies. For example, the key to developing Denmark’s wind turbine industry was replacing capital subsidies with power purchase agreements. These agreements provided investors with assured revenue streams, offering sufficient incentives for deployment of wind farms (Gerstel and Goodman 2020).
Joint investments by the private and government sectors in key infrastructure in selected industries can serve as a mechanism through which the U.S. Government may initiate a new activity with the intention of transferring ownership to the private sector at a later date (e.g., Manufacturing USA).
4 See Appendix A for a more detailed discussion of the Taiwanese government’s support for microchip
foundries.
25
E. Evaluation of the Selection of Critical Industries and Technologies The ability of anyone to predict which technologies will succeed is limited (Morris et
al. 2012). As a result, the processes used to select critical technologies and industries need to acknowledge risk. They also need to periodically evaluate the opportunity costs of investments using standardized evaluation processes (Jaffe et al. 2005). Abandoning failed strategies is as important as embracing successful strategies. A prerequisite for adaptive industrial policy making is “continuous, systematic, quantitative assessment of technology funding with standardized data so that effectiveness of alternative policy approaches can be compared over time and used to improve the program” (Jaffe et al. 2005; Morris et al. 2012). Evaluations need to be conducted using quantitative metrics, like industry sales of new products, global market shares, and successful establishment of new firms that manufacture the innovation. Gathering data for these metrics can be outsourced to contractors with expertise in the field. For example, DOE contracts with a private company for market analysis and evaluation of its high-performance computing, quantum computing, and artificial intelligence strategies. The data gathering processes for portfolio selection should support regular updates to promote evaluation. Collecting information as projects are proposed, executed, and terminated is necessary for rigorous initial and retrospective analysis.
F. Observations • Government engagement in selecting critical technologies or industries should
be based on a clear articulation of the motivations, vision, and intended outcomes of favoring one technology or industry over others.
• The selection process needs to be transparent.
• Companies need to play a major role in the selection process; they need to back up their choices with substantial commitments of funds or other resources, such as key staff.
• Commercial prospects should be a key criterion in the selection process.
• Technologies or industries should be selected based on existing endowments; efforts to create completely new industries without an existing base generally fail.
• Among others, the governments of Japan, South Korea, and Taiwan think highly of the U.S. system of selecting and funding new technologies using venture capital coupled with startups; they are attempting to create similar systems of their own.

26
• In addition to financial support, governments can foster the success of selected industries through their roles in facilitating the development of standards and ensuring protection of IP.
• Selected technologies and industries need to be evaluated on an ongoing basis. Failed technologies need to be abandoned to free up resources for more successful ones.
The data gathering processes created for portfolio selection should support regular updates to promote evaluation.

27
3. Designing and Operating Effective Manufacturing Institutes
A. Introduction The purpose of this chapter is to describe what other countries and institutions have
done to design and operate manufacturing institutes and to highlight which organizational structures and operating procedures have been effective. To provide this information, we looked at the experiences of the United States and several other countries with manufacturing institutes, including the Manufacturing USA Institutes (Appendices A and B). We examined how governments or industry (1) establish and operate institutes and centers to advance new technologies and (2) the extent to which those institutes or centers have achieved their goals.
1. Definition Manufacturing institutes or centers are organizations engaged in applied research that
supports the development and advancement of new technologies for the benefit of a particular industry. They are typically financed through a combination of government and industry funding. Many collaborate closely with universities and are often located on or near affiliated university campuses. In the United States, Manufacturing USA supports pre-competitive research for industry to advance new technologies. Germany’s Fraunhofer Institutes, Sweden’s competence centers, the United Kingdom’s Catapult centers, and the Electric Power Research Institute (EPRI) based in the United States have the same mission. Taiwan’s Industrial Technology Research Institute (ITRI) leads applied research in Taiwan on manufacturing microchips (Appendix A). However, each country and institute pursues sectoral innovation in somewhat different ways.
2. Successful Manufacturing Institutes and Centers The success of manufacturing institutes and centers can be measured by the
development and diffusion of new technologies they have developed. None of the centers discussed in this chapter track and use this metric, but it is not clear from public sources the scope of evaluative activities. The number and distribution of individuals who have worked in institutes and centers throughout industry is another such metric. For example, in Taiwan, many senior managers in the microchip industry worked at ITRI. Both the Fraunhofer Institutes and ITRI track this metric (Appendices A and B).

28
Highly regarded manufacturing institutes and centers, like the Fraunhofer Institutes and Sweden’s competence centers, employ long-term approaches to innovation and advancement of technologies, not quick exit strategies (Appendix B). Germany, South Korea, and Taiwan invest in institutes and centers to support major industries as well as to build strong ties between the countries’ academic institutions and industry (Appendices A and B). Many institutes and centers are affiliated or co-located with universities, like in Sweden and Germany. At these institutes and centers, university professors flow back and forth from employment at the institutes to working at their affiliated academic institutions. Graduate students and post-doctoral scholars conduct their research at the institutes and earn their degrees conducting applied and translational research, rather than only focusing on basic research funded by the government.
B. Establishing and Operating Institutes and Centers
1. Governance The governance and structure of the institutes and centers for which we conducted
case studies vary slightly, but they all bring together a number of stakeholders and aim to foster cooperation among them. That said, governance is implemented differently.
The competence centers in Sweden focus on “industrially-relevant research,” and aim to foster collaboration between academia and industry (Stern et al. 2013). Though these centers are associated with a university, most have a board that is independent of the university that consists of a broad range of stakeholders, including representatives from business and society.
The Fraunhofer Institutes also have close ties with universities, but are governed by a General Assembly, Senate, and Science and Technology Council (Fraunhofer-Gesellschaft 2015). All of these groups have representation from either within the Fraunhofer Institute leadership or from industry and academia.
Another interesting feature of some of the institutes studied is that they are sponsored by industry and not by government. In the United States EPRI is sponsored by industry, although it applies for and wins government funds for specific research projects. EPRI members design EPRI’s annual research portfolio, identify critical and emerging electricity industry issues, and support the application and technology transfer of EPRI's R&D through several advisory councils (EPRI n.d.). Sector Councils composed of executives from member companies develop EPRI’s research programs, which are located within four sectors: Nuclear Power, Fossil Generation, Environment and Renewable Energy, and Power Delivery and Utilization.

29
2. Long-Term Approach Long-term, predictable funding is a key feature across many of the institutes and
centers, particularly those in European and Asian countries (Appendices A and B). For example, the Fraunhofer Institutes do not have a cut-off period for government funding, nor do they have a requirement to become self-sustaining entities with only industry funds after a certain period of time. The original design of the Manufacturing USA Institutes was for them to become self-sustaining in 5 years, but according to a Government Accountability Office (GAO) report, they have been unable to do so (GAO 2019). That said, industry needs to have “skin in the game”; Fraunhofer Institutes must attract industry and state and local funding or lose their funding from the German federal government (Interview; Lal et al. 2012). EPRI’s overall research program is updated annually, but individual programs may run for years. Members who are interested in participating in a particular program commit to providing funding and technical support for the research (EPRI 2020).
3. Criteria for Selecting the Research Focus of Centers and Institutes In many cases, the governing body of the institute or center is ultimately responsible
for selecting the institute’s focus. The Senate of the Fraunhofer Institutes decides on future directions with input from the Scientific and Technology Council and the General Assembly; for the most part, it does not seek input from the German government. The Senate can dissolve or form institutes; it adapts the profile of institutes based on demand from industrial companies (Lal et al. 2012). As a consequence of the Institutes’ need to obtain industry financing, one interviewee said that research often tends to be focused on incremental improvements in processes and products. The major role of established industries in funding R&D tends to keep the institutes focused on traditional industries rather than new industries. The Swedish competence centers are chosen through a competitive research proposal process. The selection criteria include the number of companies interested in funding and participating in center activities as well as “ambition to involve various technologies and industrial sectors” (Stern et al. 2013).
The winning team for The National Institute of Standards and Technology-funded Manufacturing USA Center—the National Institute for Innovation in Manufacturing Biopharmaceuticals (NIIMBL), which is the only Manufacturing USA Institute authorized and directed by statute with a set of selection criteria—was chosen through a competitive process based on:
1. The potential of the proposers to advance domestic manufacturing and economic impact;
2. The proposers’ commitment and potential to attract non-government financial support;

30
3. Engagement with small and medium-sized enterprises (SMEs) and workforce development; and
4. Other considerations related to supporting pre-competitive research (CRS 2021).
4. Collaboration across Organizations We found that in many of the case studies, there was close collaboration and
cooperation among academia, industry, and government. Universities are a central feature of many institutes; however, the degree of their engagement with industry to advance a technology through the development and deployment phase seems to be especially important for generating useful innovations (Interviews). Institutes can make investments in facilities and equipment that universities may not normally be able to afford. Fraunhofer Institutes, Manufacturing USA, and some of the investments made by Taiwan and Korea provide researchers with access to high-quality, industrial-level tools and instruments to test and develop new technologies (Appendices A and B).
5. Workforce Training The workforce is often a critical feature of successful institutes. The Fraunhofer
Institutes are praised for their close relationships with academia. In Germany, it is common for PhD candidates and postdoctoral fellows to take classes at the university but do their dissertation work on industry research projects at a Fraunhofer Institute (National Research Council 2013). As a result, the Fraunhofer Institutes are a source of new talent experienced in applied research upon which industry can draw (Lal et al. 2012). There is a pathway for progress and advancement at Fraunhofer Institutes by which students can eventually become researchers, move to their careers in industry, and then return to the Fraunhofer Institutes. The free flow and exchange of talent across organizations is often highlighted as an important feature in workforce development.
C. Process for Evaluating the Effectiveness of Centers or Institutes Many institutes and centers have developed approaches to evaluating their
expenditures, although they implement them differently. In the case of Sweden’s Vinnova Institutes, evaluations of the performance of competence centers occur 2, 5, and 8 years after each is established, and are conducted by scientific peers as well as experts in center development and management (Stern et al. 2013). An example of a recommendation that emerged from the 2013 report on the long-term industrial impacts of the Swedish competence centers was to make certain that doctoral students are able to write their dissertations as an integral part of the work of the competence centers, recognizing the important role this work plays in the development of human capital.

31
With members from industry, government, and academia, the advisory council for each Fraunhofer Institute examines progress on research and assesses returns on investments (Schuelke 2021). One interviewee suggested that Fraunhofer Institutes could benefit from improved project management processes such as those at The Defense Advanced Research Projects Agency (DARPA)—where projects are reviewed more frequently to determine whether they are achieving their objectives. If a DARPA project is not meeting milestones, it is cancelled. That does not currently take place in the Fraunhofer Institutes. Several interviewees indicated that evaluations are more effective when they are embedded into the fabric of a program.
The Manufacturing USA Institutes have developed metrics to help evaluate their progress towards four main goals: (1) impact on the innovation ecosystem, (2) financial leverage, (3) technology advancement, and (4) workforce development. The Manufacturing USA Institutes 2019 Report to Congress indicates progress towards these goals, but typically counts the number of people that manufacturers engaged without normalizing for the number of institutes (Manufacturing USA Program 2019). These metrics are collected from the institutes each year and recorded, but a formal evaluation has not yet been undertaken.
D. Observations • Government funding for institutes should have a long, predictable time horizon.
• Industry needs to contribute funds or otherwise have a vested interest.
• Institutes and centers need to closely collaborate with universities and industry, allowing for the exchange of talent among institutions.
• Projects and investments are largely dictated by industry needs.
• Many projects and investments are geared to incremental improvements in products and processes; in Europe, efforts frequently do not focus on high-risk, high-reward research.


33
4. Ensuring Supply Chain Resilience and Security
A. Introduction In this chapter we describe and comment upon common principles and processes that
organizations and governments use to enhance supply chain resilience and security. In addition, we discuss U.S. supply vulnerabilities to critical materials. The purpose of the chapter is to provide guidance to OSTP as it assists the Administration in developing Federal-level processes to review and enhance U.S. supply chain resilience and security in key industries and government operations.
1. Definition Supply chains “encompass the linkage of stages in a process from the initial raw
material or commodity sourcing through various stages of manufacture, processing, storage, transportation to the eventual delivery and consumption by the end consumer (Zsidisin and Ritchie 2009).” They often engage many tiers of suppliers who connect to provide materials and other inputs to manufacturers or other organizations that transform them into intermediate inputs, and ultimately end products. Supply chain resilience and security refer to vulnerabilities and risks associated with supply chains. Supply chain risk management refers to the suite of measures that organizations employ to manage supply chain risks and improve response and recovery times when supply chain disruptions occur.
There is a substantial academic literature on both supply chain risk management (SCRM) and supply chain resilience (SCRES).5 Since the early 2000s the concept of SCRM has evolved into SCRES, reflecting the need for companies to expand their planning processes beyond managing risk, to incorporate a “systems approach” that both captures vulnerabilities and builds capacity to overcome supply chain disruptions, but also takes into account cost (Pettit et al. 2019). SCRM and SCRES have generated an industry that provides services to organizations that seek help in managing risks associated with their supply chains.
A review of the literature yielded the following definition of SCRES:
The adaptive capability of a supply chain to prepare for and/or respond to disruptions, to make a timely and cost effective recovery, and therefore
5 See Pettit et al. (2019) and Zsidisin and Ritchie (2009) for some of the more prominent examples.

34
progress to a post-disruption state of operations – ideally, a better state than prior to the disruption (Tukamuhabwa et al. 2015).
2. Differences between Supply Chain Resilience and Security and Access to Critical Materials Companies and the academic literature note that all inputs to a production process can
be critical (Zsidisin and Ritchie 2009). For example, if Volkswagen is unable to procure the cloth needed for its interiors, production halts, even though fabric is generally not thought of as a critical material. A shortage of basic, low-cost computer chips in 2021 that led to the closure of motor vehicle assembly lines in the United States and Europe is another example of how for industry, supply chain resilience and security applies to every input (Ewing and Boudette 2021). Assuring supply chain resilience and security is not just a problem for industry. The U.S. Department of Defense (DoD) manages massive logistical operations to move supplies and weapons to bases and operating units. It too has to ensure supply chain resilience and security for everything it transports.
In addition to traditional challenges of assuring supply chain resilience and security, DoD seeks to address issues concerning potential access to critical materials or components, materials or components that would be difficult to obtain in the event of a disruption from traditional sources of supply. DoD seeks to ensure that these materials or components are available from sources other than unfriendly nations. Dependencies on critical materials or components tend to be long-lasting and may manifest themselves due to political actions rather than more typical disruptions. DoD devotes substantial resources to designing and implementing measures to address potential shortages or disruptions of critical materials or components (DLA 2020).
B. Managing Supply Chain Security and Resilience Managing supply chain risks involves mapping out vulnerabilities, forecasting risks,
and detecting and creating buffers to potential disruptions. It also involves developing and implementing strategies to recover once a chain is disrupted (Asbjørnslett 2009). The factors that contribute most to supply chain resilience and security vary from firm to firm and across industries and sectors. However, a number of well-documented factors are precursors to using SCRM to help establish and maintain resilient supply chains, including visibility throughout the supply chain; standard vetting procedures for suppliers, which can enable cooperation with trusted partners; and sharing information, in particular the ability to share information on potential supply chain threats (Zsidisin and Ritchie 2009; Asbjørnslett 2009).

35
1. Making Supply Chains Visible Supply chain visibility facilitates tracking raw materials, components, or final
products from the manufacturer to the customer. It involves close collaboration with suppliers to map out the entire chain. End-to-end supply chain visibility provides key information an organization can use to anticipate and prepare for potential disruptions. It also involves verification measures, often using third parties. Verification may have to be mandated by governments, as companies often have competitive and proprietary reasons for not making their supply chains visible to outsiders. Governments that desire visibility into a company’s supply chain need to provide assurances that the information will be treated confidentially or companies may be unwilling to comply. To identify supply chain vulnerabilities, organizations may use a risk map. Risk maps put risks on one axis and link them to risk management processes on the other (Hauser 2003).
2. Improving Supply Chain Resilience and Security As shown in Figure 1, common strategies to reduce supply chain risk include
establishing end-to-end supply chain visibility, favoring suppliers from trusted partners, avoiding situations where there is a single source for a key material or service, utilizing external information on potential supply chain threats or disruptions, building strategic stockpiles of key materials, and stockpiling designs for substituting an available input for one that has been disrupted.
Figure 1. Common Strategies to Reduce Supply Chain Risk
Setting up a globally dispersed portfolio of suppliers, customers, and facilities helps avoid a single event, such as a natural disaster, affecting all of a company’s operations at the same time. Multi-sourcing can be used as a hedge against risks of quality, quantity, disruption, and price, and act as a shield against single-supplier opportunism (Manuj and Mentzer 2008). Production risks can be reduced by operating faster, more flexible plants (Manuj and Mentzer 2008).
Set up systems to track
sources of inputs
Use more than one supplier; Favor suppliers from trusted partners
Increase access to information on
potential threats, disruptions
Build stockpiles; Design for substitution
36
Companies and other organizations endeavor to use more than one supplier for every major module or component. Suppliers of major modules, in turn, seek to have more than one supplier for major components. Working with two suppliers not only helps mitigate disruptions when one supplier is unable to meet its obligations, it also stimulates innovation and cost-reduction efforts, as the purchasing company shifts the preponderance of its purchases to the supplier that provides a superior product with better service, and at lower cost. With the advent of just-in-time delivery systems, corporations endeavor to establish close ties with major suppliers, tying quality assurance, shipping, and inventory systems of those suppliers directly to the corporation’s own systems. With just-in-time delivery, corporations have gravitated to those suppliers that are most reliable and provide the best product, not necessarily the lowest price. Most companies rely on imports for some components and other inputs. These companies do not differentiate between domestic and foreign partners, but rather focus on ensuring that their foreign suppliers are reliable.
Organizations engage in a variety of activities to improve their ability to recover from a potential disruption, including maintaining an appropriate level of redundancy, contingency planning, and increasing flexibility to adapt to changing requirements with little time and effort (Manuj and Mentzer 2008). They may make plans to find substitutes in the event that components or other inputs become unavailable. For example, in New England, gas-fired combined cycle generating plants keep diesel fuel on hand. Although diesel is usually more expensive than natural gas, natural gas supplies are limited by pipeline capacity in New England. In the event that natural gas supplies to the power plant are disrupted because of pipeline constraints, often triggered by cold weather and increased use of natural gas for home heating, these electric power producers are able to keep their generators online by substituting diesel fuel (ISO-New England n.d.). Organizations may also engage in regular exercises to simulate and develop mitigation responses to specific threat scenarios to establish and maintain capacity to recover from supply chain disruptions.
Inventories and stockpiles are another tool that organizations use to improve supply chain resilience and security. For example, releases from the U.S. Government’s Strategic Petroleum Reserve have helped to stabilize prices on global oil markets (Kilian and Zhou 2020). However, stockpiles need to be managed, sometimes by cycling materials and components, so that they do not deteriorate during storage.
C. Evaluating Supply Chain Resilience Efforts Evaluations of measures to improve supply chain resilience and security, including
U.S. Government policies, should focus on whether the measures effectively improve supply chain resilience and security, the extent to which companies and other organizations adopt and implement these measures, and whether the cost of employing these measures undermines the global competitiveness of U.S. industry.

37
1. Have the Measures Improved Supply Chain Resilience and Security? A standard approach used by organizations to assess the efficacy of measures to
improve supply chain resilience and security is to run exercises during which one supplier or another ceases to be able to supply the organization. Companies then assess their mitigation plans by measuring (1) the extent of the production loss as a percentage of lost output; (2) time to recovery to full production; (3) loss in sales over the period; (4) estimates of future loss in sales because of loss of customers’ confidence because of the disruption; and (5) additional costs due to the disruption.
DoD’s Defense Logistics Agency (DLA) also makes plans and institutes measures to ensure the security and resilience of its nine supply chains for supplying U.S. forces (DLA 2020). It uses a Resilient Supply Chain Operations Scorecard, a real-time information technology tool, to monitor and plan for disruptions in supply chains (DLA 2020). Measures used by DLA to assess its operations include service readiness, which may be measured by the reductions in the number of weapons systems that are non-mission capable due to lack of DLA parts. A second metric is supply availability, which is measured by DLA’s ability to meet day-to-day customer needs. A third is acquisition timeliness, which is measured by DLA’s ability to meet on-time delivery and decrease production lead time. A fourth is business health, which involves maintaining a strong and sustainable financial position. A fifth is liquidity, which involves optimizing cash levels to meet day-to-day operational requirements. Others include price competitiveness, which involves providing the best value at the right price; customer satisfaction as measured using customers’ feedback; and employee engagement (DLA 2020).
2. Have the Measures Been Widely Adopted? Some U.S. Government departments already track certain industries to determine
whether they are on track to meet targets set by the government. For example, the U.S. railroads have been tasked with installing automatic train protection (ATP) systems. The Federal Railroad Administration in the Department of Transportation tracks the number of locomotives and railroad cars that have been equipped with those systems. Another example is that the Federal Energy Regulatory Commission (FERC) mandates that utilities implement measures to ensure grid security. FERC tracks utility performance on a regular basis (FERC n.d.). In the case of supply chain resilience and security, the appropriate U.S. Government agencies could charge industry associations and Fortune 500 companies with reporting on the extent to which supply chain resilience and security measures have been adopted. The percentage of companies that have adopted these measures by number and sales could be tracked over time.
38
3. Have the Costs of the Measures Reduced U.S. Competitiveness? SCRM assessments incorporate costs as well as benefits from taking measures to
improve supply chain security and resilience. The U.S. Government could task outside evaluators to assess the costs of complying with potential mandates for supply chain resilience and security measures by industry subsector. The studies would estimate and compare differences in costs, reliability, and quality from using suppliers that have been approved by the U.S. Government with those that have not. Such studies could then measure changes in U.S. global market shares for the affected industries and attempt to determine whether additional costs associated with supply chain resilience and security have affected changes in the global market shares of U.S. companies.
D. Government Efforts to Reduce Supply Vulnerabilities to Critical Materials Another question pertaining to supply chain resilience and security is the national
origins of supplier companies. The U.S. Government has had a long-standing concern about U.S. reliance on countries considered unfriendly to the United States for critical materials and components needed for military equipment and weaponry. It is also concerned about dependencies of the U.S. economy more broadly on goods sourced from unfriendly or unstable countries. The processes employed to identify concerns about sources of supply differ from those used by companies or government agencies, like DLA, to address the resilience and security of their day-to-day supply operations.
Over the past 4 years, a number of Executive orders have been issued to address these concerns about sources of supply, including Executive Order 13806 and Executive Order 13873. In response to these two orders, DoD and the Cyber and Infrastructure Security Agency (CISA) have written and released reports detailing their assessments of sources of critical materials, components, and equipment on which DoD and the Department of Homeland Security (DHS) rely to fulfill their missions (DoD 2018; CISA 2020b). DoD and CISA used very different processes to perform their assessments. The next section compares the DoD and CISA processes.
1. DoD Process For the DoD report, Assessing and Strengthening the Manufacturing and Defense
Industrial Base and Supply Chain Resiliency of the United States, the White House Office of Trade and Manufacturing Policy and DoD’s Office of Industrial Policy established an Interagency Task Force (DoD 2018). The Task Force, led by DoD, created 16 working groups, mainly composed of Federal employees, with participants from several offices within DoD and from the Departments of Commerce, Education, Energy, Homeland Security, and Labor, among others. The groups focused on sectors that have been traditionally relevant to DoD such as aircraft, shipbuilding, and ground systems, as well as
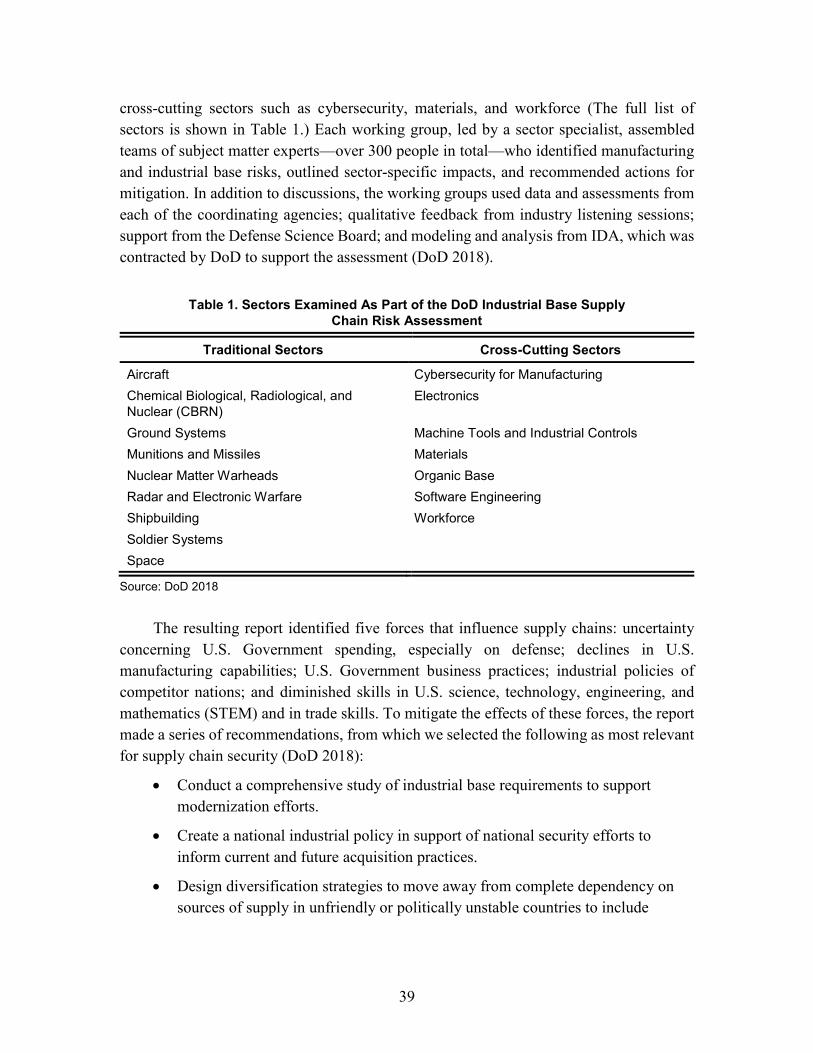
39
cross-cutting sectors such as cybersecurity, materials, and workforce (The full list of sectors is shown in Table 1.) Each working group, led by a sector specialist, assembled teams of subject matter experts—over 300 people in total—who identified manufacturing and industrial base risks, outlined sector-specific impacts, and recommended actions for mitigation. In addition to discussions, the working groups used data and assessments from each of the coordinating agencies; qualitative feedback from industry listening sessions; support from the Defense Science Board; and modeling and analysis from IDA, which was contracted by DoD to support the assessment (DoD 2018).
Table 1. Sectors Examined As Part of the DoD Industrial Base Supply
Chain Risk Assessment
Traditional Sectors Cross-Cutting Sectors
Aircraft Cybersecurity for Manufacturing Chemical Biological, Radiological, and Nuclear (CBRN)
Electronics
Ground Systems Machine Tools and Industrial Controls Munitions and Missiles Materials Nuclear Matter Warheads Organic Base Radar and Electronic Warfare Software Engineering Shipbuilding Workforce Soldier Systems Space
Source: DoD 2018
The resulting report identified five forces that influence supply chains: uncertainty
concerning U.S. Government spending, especially on defense; declines in U.S. manufacturing capabilities; U.S. Government business practices; industrial policies of competitor nations; and diminished skills in U.S. science, technology, engineering, and mathematics (STEM) and in trade skills. To mitigate the effects of these forces, the report made a series of recommendations, from which we selected the following as most relevant for supply chain security (DoD 2018):
• Conduct a comprehensive study of industrial base requirements to support modernization efforts.
• Create a national industrial policy in support of national security efforts to inform current and future acquisition practices.
• Design diversification strategies to move away from complete dependency on sources of supply in unfriendly or politically unstable countries to include

40
reengineering, expanded use of the National Defense Stockpile program, and qualification of new suppliers.
• Expand direct investment in the lower tier of the industrial base through DoD’s Defense Production Act Title III, Manufacturing Technology, and Industrial Base Analysis and Sustainment programs to address critical bottlenecks, support fragile suppliers, and mitigate single points-of-failure.
• Work with allies and partners on joint industrial base challenges through the National Technology Industrial Base and similar structures.
• Support a DoD program for Microelectronics Innovation for National Security and Economic Competitiveness to increase domestic capabilities.
• Create a National Advanced Manufacturing Strategy for advanced manufacturing to be overseen by OSTP.
• Implement a risk-based methodology for oversight of contractors in the National Industrial Security Program to assess and counter threats to critical technologies and priority assets.
• Reduce the personnel security clearance backlog through more efficient processes.
2. The CISA Process In contrast to the DoD effort, CISA’s efforts to assess the information and
communications technology (ICT) supply chain was conducted by a task force chartered as a consensus-based body under the Critical Infrastructure Partnership Advisory Council (CIPAC). CIPAC was established by DHS to facilitate interactions between the Federal Government and private sector owners and operators of critical infrastructure.
The Information and Communications Technology Supply Chain Risk Management Task Force (ICT SCRM Task Force), established in December 2018, is a public-private partnership whose purpose is to provide advice and recommendations to DHS and industry as they work to assess and manage risks associated with the ICT supply chain. The task force is composed of approximately 60 members, with 40 representatives from the private sector IT and communications industries and approximately 20 representatives from the Federal Government. It is led by three co-chairs representing the communications sector, the IT sector, and the Federal Government. In addition to its voting membership, at the discretion of its leadership, the task force may utilize external subject matter experts.
The task force set up four working groups in its first year: (1) Information Sharing, (2) Threat Evaluation, (3) Qualified Bidder Lists and Qualified Manufacturer Lists (QBL/QML), and (4) Policy Recommendations to Incentivize Purchase of ICT from Original Equipment Manufacturers (OEM) and Authorized Resellers. In the second year,

41
working groups for a Vendor SCRM Assurance template and a COVID-19 Impact Study were set up (CISA 2020b). As of March 4, 2021, most of the working groups have sunset with the exception of the Information Sharing Working Group. New working groups include the Small and Medium-sized Businesses Working Group, the Product Use Acceleration Working Group, and a Study Group on Lessons Learned from Recent Software Supply Chain Attacks. A “tiger team” has built an inventory of relevant supply chain programs, initiatives, and guidance to identify existing supply chain activities that could be utilized as SCRM efforts are expanded in other sectors.
In an effort that drew on ICT SCRM Task Force expertise, but functioned parallel to the CISA initiative, DHS developed an ICT framework to serve as a generic representation of different roles and sub-roles within the communications and information technology sector supply chains in response to Executive Order 13873. With assistance from Argonne National Laboratory and Sandia National Laboratories, DHS developed a two-step process to characterize the components and roles within the supply chain and develop an approach to analyze the level of criticality of each element (CISA 2020a).
3. Comparison of Processes The two assessments took different approaches to assessing sector-wide risks and
developing recommendations to improve supply chain resilience and security overall. The approach used by the Interagency Task Force led by DoD relied on subject matter experts but does not appear to have included suppliers as official members of the group. Running this process as a government-led effort likely allowed progress to be made at a quicker pace, but may not have fully reflected the concerns of the private sector.
The public-private partnership established by DHS involved equal representation across the Federal Government, the communications sector, and the IT sector. The findings and recommendations were consensus-based. The ICT SCRM Task Force has been operating for more than 2 years, and the work of this group continues. Though it has taken some time to develop the reports and follow-on products, it appears that industry is supportive of and utilizing many of the products the task force has generated.
Both approaches have merit. Departments or agencies seeking to engage in a supply chain risk assessment process should consider the timeline for completion, the extent to which the activities or end products that need to be assessed are public or private goods or services, whether the main purchaser of these services or products is public or private, and whether there are other resilience and security concerns.
E. Supply Chain-related Policy Considerations If governments perceive a need to develop alternative suppliers, subsidies—
preferably R&D and capital subsidies—are better than tariffs. R&D and capital subsidies
42
defray the costs of developing and constructing a new facility, after which the facility should have to compete on price and quality with alternative suppliers, foreign and domestic. In contrast, tariffs permit the domestic supplier to raise prices above global market levels, enabling domestic production when the domestic producer is not globally competitive. Uncompetitive domestic producers may eventually go bankrupt. In the meantime, they elevate costs for those domestic companies that use the inputs they produce, undermining the global competitiveness of those companies. Because of their effect on the competitiveness of companies that use inputs on which tariffs have been levied, tariffs are counterproductive. They fail to improve long-term supply chain security and resilience.
In the course of performing their supply chain risk assessments, both DoD and CISA identified policy issues that should be addressed to improve supply chain resilience and security. Their recommendations included diversifying material sources and suppliers as well as working closely with allies and partners to address challenges (DoD 2018). The two reports also recommend that the United States design and implement an industrial policy to support national security efforts. The DoD report has a classified Action Plan that may include recommendations specific to additional national security challenges.
One key policy issue discussed as part of the CISA ICT supply chain assessment process involves information sharing on potential supply chain threats or disruptions. Existing laws and policies pertaining to information sharing between and among industry partners and government do not protect businesses from potential liability associated with disclosures made in good faith. In particular, corporations have been looking for guidance and protection from liabilities associated with claims of anti-competitive behavior, false information or defamation claims, or breach of obligations of confidentiality if they disclose what they believed to be a potential threat to the supply chain.
Another key policy issue is developing incentives to ensure that ICT products are being purchased from the original equipment manufacturers. Counterfeit products are a concern in this sector. One working group advocated providing incentives for purchasing from trusted vendors, which is consistent with the practice of favoring suppliers who are trusted partners.
At the national level, France and Germany have both enacted supply chain-specific legislation; however, their laws do not focus on supply chain resilience and security, but rather serve as a mechanism to hold corporations accountable for human rights violations of their foreign suppliers. The United States has implemented this on a smaller scale with the Conflict Minerals Rule, included in section 1502 of the Dodd-Frank Wall Street Reform and Consumer Protection Act of 2010, to discourage use of minerals originating in the Democratic Republic of the Congo or an adjoining country.

43
F. Observations • For industry, all inputs are critical; the loss of any single input can halt
production, so measures to ensure supply chain resilience and security need to be prepared to address any input.
• Measures to provide supply chain resilience and security include:
– Sourcing from more than one supplier;
– Designing products so that substitute inputs can be employed; and
– Preparing to respond rapidly to disruptions.
• Supply chain security and resilience efforts need to include considerations of costs and competitiveness.
• Suppliers from friends and allies should be treated the same as domestic producers.
• Capital subsidies to develop alternative suppliers are more effective than tariffs because they improve the competitiveness of the domestic supplier rather than creating an insulated, high cost domestic market for the input that increases costs for domestic users.
• Procurement contracts have also been useful for supporting the emergence of alternative suppliers.
• Government support and mandates may be needed to provide end-to-end supply chain visibility.
• New policies and possibly legislative action may be necessary to ensure that intelligence about threats can be shared more widely.
• Metrics for evaluating measures to improve supply chain resilience and security include:
– Reduction in production lost as a percentage of lost output;
– Time to recovery to full production;
– Reduction in losses of sales because of the disruption; and
– Financial cost of measures.


A-1
Appendix A. Examples of Other Countries’ Innovation and
Industrial Policies
Israel Over the past 50 years, Israel has built a reputation as a country that supports and
facilitates innovation, specifically in the technology sector. In the 1960s and 1970s, Motorola, IBM, and Intel established research and production facilities in Israel, creating an ICT cluster with similarities to Silicon Valley. Economic reforms in the 1980s and 1990s, increased R&D by the Israel Defense Force (IDF), an expanded technical workforce due to immigration from the former Soviet republics, and further investment by multinational corporations (MNCs) created conditions that allowed these elements to flourish (Nataraj et al. 2012). Innovative clusters have expanded beyond the ICT sector to include medicine, biotechnology, and other life sciences (Beyar et al. 2017).
According to several measures, R&D intensity in Israel has been high for more than 20 years. Since 2010, Israel’s R&D expenditures as a percentage of GDP have tied with South Korea for the highest in the world (OECD 2021). In addition to being a leader in R&D, a recent Pricewaterhouse Coopers Israel (PwC Israel) report on Israel describes the country as a leader in venture capital investments; at $674 per capita, venture capital invested in Israel is the highest in the world (PwC Israel 2019).
Overall, Israel operates a robust innovation system, attractive to MNCs and startups. Israel reports the formation of around 1,500 new high-tech companies annually (Invest In Israel 2021c), and 6,600 plus startups (PwC Israel 2019). At least 40 MNCs have partnered with Israeli startups to support innovation activities (Invest In Israel 2021a). These companies scout early stage startups and establish R&D centers in Israel. Israel is attractive to MNCs as an area of high innovation activity. Figure A-1 shows the types of innovation activities in which companies in different sectors are participating. Over 500 MNCs are represented by the graphic.
Innovation Policies and Programs The success of the Israel’s efforts to support innovation is largely attributed to a
combination of policies and programs that:
• Provide incentives for entrepreneurial development, such as support for venture capital;
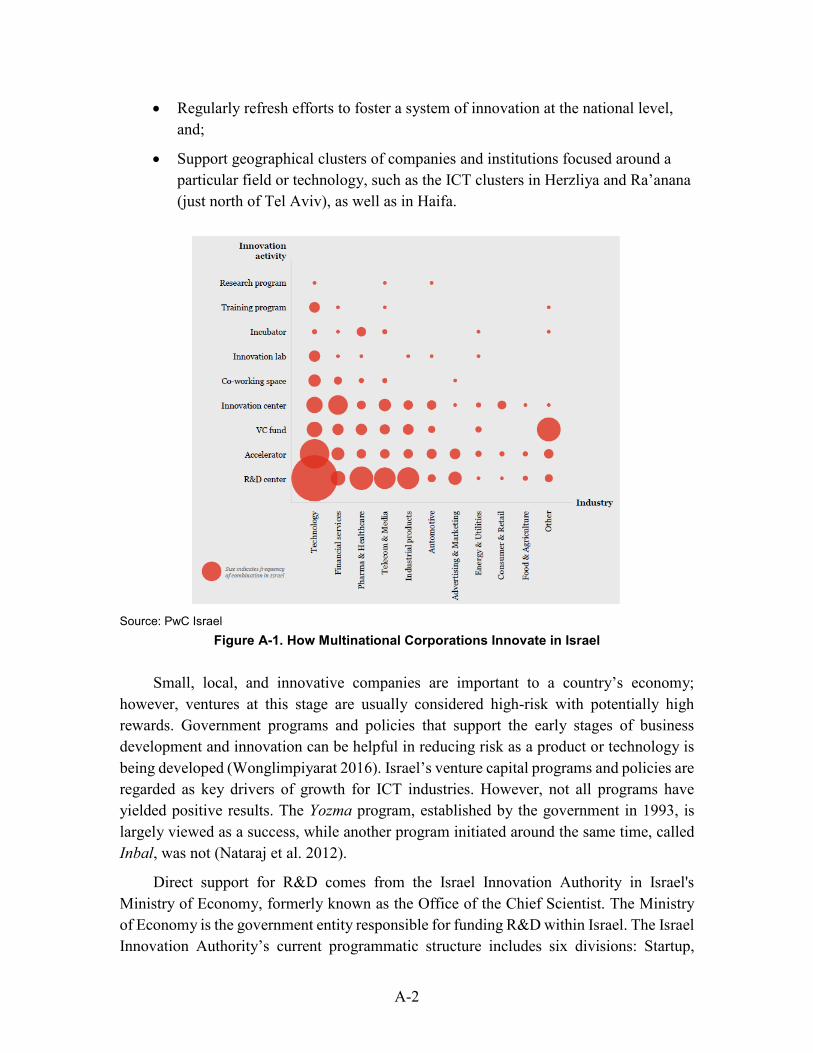
A-2
• Regularly refresh efforts to foster a system of innovation at the national level, and;
• Support geographical clusters of companies and institutions focused around a particular field or technology, such as the ICT clusters in Herzliya and Ra’anana (just north of Tel Aviv), as well as in Haifa.
Source: PwC Israel
Figure A-1. How Multinational Corporations Innovate in Israel
Small, local, and innovative companies are important to a country’s economy; however, ventures at this stage are usually considered high-risk with potentially high rewards. Government programs and policies that support the early stages of business development and innovation can be helpful in reducing risk as a product or technology is being developed (Wonglimpiyarat 2016). Israel’s venture capital programs and policies are regarded as key drivers of growth for ICT industries. However, not all programs have yielded positive results. The Yozma program, established by the government in 1993, is largely viewed as a success, while another program initiated around the same time, called Inbal, was not (Nataraj et al. 2012).
Direct support for R&D comes from the Israel Innovation Authority in Israel's Ministry of Economy, formerly known as the Office of the Chief Scientist. The Ministry of Economy is the government entity responsible for funding R&D within Israel. The Israel Innovation Authority’s current programmatic structure includes six divisions: Startup,

A-3
Growth, Technological Infrastructure, International Collaboration, Advanced Manufacturing, and Societal Challenges. This structure aims to support key stages or aspects of the innovation system (Israel Innovation Authority 2021). Programs within these divisions leverage funds from MNCs to support a number of different approaches to R&D, including corporate R&D, collaborations between industry and academia, and collaborations between MNCs and startups (PwC Israel 2019).
Since an initial cluster of innovation in the ICT industry was established in the 1960s and 1970s, the Israeli government has funded programs in other areas and sectors (Nataraj et al. 2012). Medical device companies that integrate electronics, communications, and robotics have been a natural extension of the ICT sector; many medical startup companies have been fostered within ICT clusters. An incubator program established in the 1990s has provided support for almost 700 companies, with roughly half the companies engaged in manufacturing medical devices or pharmaceuticals, or in biotechnology (Beyar 2017).
Government Incentives for Partnerships and Private Investment in R&D Innovation can occur through both open and closed approaches. In the context of
innovation by MNCs, closed approaches refer to activities that are internal to the company; open activities involve collaboration with third parties, including startups. In Israel, most R&D is closed, although partnership-led open innovation is growing more rapidly and is supported by Israel’s tax regime, which provides incentives for commercial collaboration in R&D (PwC Israel 2019).
Israeli innovation policy targets both foreign and domestic investment in strategic technologies. In 2015, MNC-led R&D constituted 47 percent of total business R&D expenditures in Israel (Invest In Israel 2021a); commercial partnerships for R&D continue to grow (PwC Israel 2019). The Israel Innovation Authority also manages grant programs supporting public R&D at eight universities and seven public research institutions. There are also around 320 foreign R&D institutes currently operating in Israel (Invest In Israel 2021a).
All technology sectors are eligible to participate in Israeli R&D programs. However, cyber, renewable energy, life sciences, alternative fuels, space technologies, dual use (Military and Commercial) technologies, and AgriTech are considered sectors with the highest potential; they are eligible for additional support from the Israel Innovation Authority (Invest In Israel 2021a). As of 2017, companies most actively pursuing open innovation models offered through Israel’s R&D partnership incentives were companies in the health care, technology, automotive, and pharmaceutical sectors (PwC Israel 2019). Many of these R&D projects are located in Israel’s major cities: Tel Aviv, Herzliya, Jerusalem, Haifa, Rehovot, and Be’er Sheva (Invest In Israel 2021a).

A-4
Numerous policies are intended to pair MNCs with domestic entities. Among industry R&D institutes, current policy allows MNCs to maintain IP rights and the opportunity to scout partnerships (Invest In Israel 2021a). Royalties are paid when the product becomes commercialized (Invest In Israel 2021a). The Israel Innovation Authority supports selected startups with grants covering 20 to 50 percent of the approved funding (Invest In Israel 2021a). The MNC may provide cash funding in some cases, but more importantly it is expected to provide consulting services, infrastructure (e.g., equipment, laboratories, and software), and technological guidance (Invest In Israel 2021a).
The Israeli government also supports innovation through MAGNET consortia. The consortia promote cooperation among Israeli companies and universities in innovative technology areas. MAGNET industrial consortium grants cover 66 percent of the budget for industrial companies and 80 percent for universities with no royalties; these grants usually last 3 to 5 years (Invest In Israel 2021a). Typically, 80 percent of project funding comes from the grant while the remaining funds are provided by consortia companies (Israel Innovation 2021). Non-Israeli companies can participate in a consortium, if approved by all the Israeli members. Non-Israeli companies may receive IP and technology benefits but they are not eligible for grants (Israel Innovation 2021).
The Israeli Investment Promotion Agency promotes foreign investment and innovation through its Innovation Box incentives. Companies that spend more than 7 percent of their revenues on R&D and either employ 20 percent of their workforce in R&D, have received venture capital funding, or report sales or employee growth of 25 percent over a 3-year period may participate in the Innovation Box program (Invest In Israel 2021b). Participating entities are eligible for reduced corporate tax rates on eligible income, reduced dividend tax rates on eligible income, and reduced tax rates on capital gains (Invest In Israel 2021a).
Observations • Israel has successfully fostered a culture of innovation within geographic
clusters, which operate as dynamic locations where R&D, investment, innovation, entrepreneurship, and training converge around a local talent pool.
• Major factors in the development of a culture of innovation include foreign direct investment, close ties to the global economy and the waves of skilled/educated people from the former Soviet Union.
• Funding for R&D by the IDF provided important support for high technology companies.
• Early-stage government funding has helped defray some of the risks of entrepreneurial ventures, and has often been helpful in obtaining private sector investment.
A-5
• The Israel Innovation Authority’s innovation policies and programs support R&D by both foreign and domestic companies.
Japan
Institutional Framework After the Second World War, industrial policy in Japan was led by the Ministry of
International Trade and Industry (MITI). MITI worked to consolidate Japanese production under several “winners” that would occupy separate market spaces. However, MITI did not have the authority to force the consolidation of an industry. For example, Honda entered the automobile market despite MITI’s disapproval. MITI influenced industries by providing funding and advising services to industry clusters. The winners were selected on a non-competitive basis and services were given to political insiders at the expense of newcomers.
In the late 1970s, Japanese policy shifted towards promoting R&D through financial, fiscal, and tax incentives. In 2001, MITI was replaced by the Ministry of Economy, Trade, and Industry (METI). METI was established to promote private industry, economic relationships, and secure Japanese supply chains (METI 2021).
Government Policies to Support the Innovation METI has sought to enhance Japan’s domestic competitiveness through the Industrial
Cluster Project. The Industrial Cluster Project established local innovation networks connecting SMEs, universities, independent researchers, and venture capitalists to promote a Silicon Valley-type environment for innovation where innovators could connect and share resources (Nezu 2007). The Industrial Cluster Projects targeted industries of national importance, chosen by METI. METI targeted 17 industry clusters. Some of the initial industries targeted within the plan included IT, bioengineering, environmental technology, and manufacturing (METI 2006). By 2009, 8 years into the policy, 18 clusters had emerged and 10,200 SMEs and 560 universities participated in the program (METI 2009). The clusters are currently administered by private organizations or local governments (METI 2019).
METI gave full authority to its 10 regional bureaus to support the emergence of industry clusters in the ways most beneficial to the targeted industry and the local region (METI 2006).6 Participating institutions filed an application to become a “project
6 The 10 regional centers implementing the industrial cluster policy are: Hokkaido, Tohoku, Kanto,
Chubu, Kinki, Chugoku, Shikoku, and Kyushu Regional Bureau; Hokuriku Branch of Electricity and Gas Department of Chubu Regional Bureau; and Economy and Industry Department of Okinawa General Bureau (METI 2006).

A-6
promotion organization.” As a project promotion organization, they became eligible for workshops and program grants (METI 2006). METI provided tax incentives, facilities, and support for R&D (METI 2006). METI also supported the industries through networking and mediating conversations between firms and banks (Okazaki 2017).
Japanese businesses and other stakeholders have consulted with METI and across the Japanese government to push the project forward. Following the program’s launch in 2006, cluster managers met regularly to share information about the status of their industrial clusters (METI 2006). The third phase of the Industrial Policy Project has focused on becoming the clusters financially self-sufficient.
Early assessments of the program were mixed. With the exception of the Nagoya and Kyushu regions, which benefited from the expansion of the automotive and IT industries, participating regions did not experience above average growth (Nezu 2007). The clusters are not seen to have had a positive influence on administrative pressures from politically connected organizations (Nishimura and Okamuro 2011). Another source is more positive. It notes several major technologies have been developed in the clusters (Nezu 2007). For example, the Digital Concept Partners Project matches large IT companies with startups. The Project funded 383 business proposals over a 3-year span (METI 2009). The Keihin Gateway Project matched SMEs and venture capital funds with large manufacturers at three business-matching forums; the forums included 74 SMEs and 37 large companies (METI 2009).
Government Policies to Support Supply Chain Resilience and Security The COVID-19 pandemic and U.S.-China trade disputes brought to light supply chain
insecurities Japan is now working to address. The Program for Promoting Investment in Japan to Strengthen Supply Chains (2020) works to secure a domestic production base (METI 2020). The Program aims to increase the viability of supply chains with a focus on manufacturing and logistics (Secretariat 2020). Through the Program, METI subsidizes Japanese factories in manufacturing, information, or communications. The subsidies also go towards logistics facilities in a number of industries (Secretariat 2020). Projects funded by the Strengthen Supply Chains Competition in 2020 must be completed by 2022 (Secretariat 2020). In total, 146 entities were selected in the Securing Japanese Supply Chains Competition. The list includes pharmaceuticals, logistics, aerospace, and manufacturing companies (METI 2020).
Aside from supply chain resilience, Japan is working to make its supply chains more secure. A 2018 Diet Resolution decreed companies working with the government must comply with guidelines in the 2013 Secrets Protection Act (Herman 2018). The Act designates a government-wide standard for state secrets. Japan is working to establish procedures for industrial security based off the 2017 METI guidelines (Herman 2018).

A-7
Republic of Korea South Korea has been highly successful economically and technologically. Increases
in GDP and per capita GDP since 1960 have been among the highest in the world. Korea’s large, family-controlled conglomerates, called chaebols, have become major global companies with sizeable global market shares in memory chips, televisions, and smart phones. Korea is also home to leading global companies in automobiles and shipbuilding. In recent years, growth has been driven by increased output and exports of innovative electronics. South Korea has now caught up technologically with other industrialized countries.
Industrial and Innovation Policies In the 1960s, the Korean government encouraged established companies and
entrepreneurs to develop export industries like textiles and footwear to move the predominantly agricultural workforce into light manufacturing. Light industries like textiles generated a large share of Korea’s industrial output in the 1960s. In the 1970s, the government, working closely with the chaebols, targeted heavy industries, like steel, shipbuilding, and chemicals, to spur growth. The rationale for selecting these industries was based on Korea’s capabilities and the potential of the industries in the global market (Jang 2021). In the 1980s and 1990s, Korean policy shifted to developing the country’s own advanced technologies through increased national R&D programs and government support for the development of global high technology champions through tax, export, and import policies (Jang 2012). The government used R&D programs to encourage private companies to increase their own expenditures on R&D. Korean high technology companies now account for most of Korea’s R&D expenditures through their own internal R&D programs (Jang 2012).
South Korea’s industrial policies between 1960 and 2000 were driven by the central government. As South Korea became more democratic and in response to widening differences between incomes and employment opportunities between the capital region and other heavily industrialized regions and more rural regions, the Korean government developed regional policies designed to support economic growth in poorer areas of the country. More recently, the Korean government has focused on creating regional research hubs coordinated by both central and local government leaders. Early evaluations of South Korea’s regional technology parks indicate the parks have contributed to technology transfers, sales, and employment, although some parks have been more successful than others (OECD 2012).
The Korean government supported the creation of Government Research Institutes (GRIs) as part of its innovation strategy and to support regional development. Each GRI has its own individual area of technological focus (Jung 2019). Currently, they primarily focus on “basic science and long-term research” (Gupta et al. 2013). Industry leads
A-8
technological R&D, while GRIs assist, collaborating with universities and industry (Jang 2012). The Korean Ministry of Commerce, Industry, and Energy also sponsors talent programs to attract students into STEM disciplines (OECD 2012).
Some of the government agencies and non-governmental organizations that have driven South Korea’s industrial, innovation, and regional development policies include:
MOTIE: In 2013, under directions from the Park Administration the Ministry of Trade, Industry, and Energy (MOTIE) took over the Ministry of the Knowledge Economy’s (MKE’s) responsibilities for developing industrial policy (MOTIE 2016), including the Leading Industry Program. Under the MKE, the Leading Industry Program supported R&D funded by consortia of companies, research institutes, and academia (OECD 2012).
National Science and Technology Commission: Launched in 2011, the National Science and Technology Commission develops R&D plans by conducting evaluations of prospects for new technologies, drawing on the advice of representatives from industry, especially the chaebols; government; the GRIs; and universities (Gupta et al. 2013). The Commission also oversees ministries’ R&D budgets (Pak and Rhee 2016).
Korea’s National Science and Technology Council (NSTC), a different institution than National Science and Technology Commission, was created in 2013 in response to a need for “an institute that deliberates, coordinates, and operates research and development” (Kang 2019). Sitting under the office of the Prime Minister, the Prime Minster acts as chair of the NSTC, with co-chairmen from industry (Kang 2019). Members of academia and the ministers of related government departments also sit on the council (Kang 2019). The NSTC allocates approximately 70 percent of the government’s R&D budget (Gupta 2013). In 2012, around 50 percent of the NSTC budget went to public research institutes, 25 percent went to universities, and 25 percent to industry (Gupta 2013). Korea’s NSTC also selects specific technologies for long-term national investment (Gupta 2013). When considering on which technologies to focus, the NSTC takes input from evaluation studies and comes to a consensus based on a model similar to U.S. and EU science and technology innovation planning (Gupta 2013).
The Presidential Committee on Regional Development: The Roh Administration (2003–2008) set up the Presidential Committee on Balanced National Development, later renamed the Presidential Committee on Regional Development. The Presidential Committee on Regional Development is composed of cabinet ministers and civilians. The Committee outlines a vision and draws up plans for Korean economic development (OECD 2012).

A-9
Technology plans at the national level are adopted and incorporated into policy at the regional level. Innovation programs have been administered through local bodies. Initially, the Leading Industries Program was implemented by the Economic Regional Development Committee, which set priorities for the region, applying regional context to national goals. Subsequently, the Leading Industries Program was administered by the Leading Industries Office, which coordinates activities between MKE and local participants (OECD 2012). The Program provides funding for R&D among businesses, universities, and consortia. Recipients have to match funds provided by the government to at least 25 percent of project costs (OECD 2012). Regional governments support Innovation Clusters by funding convergence technologies (Pak and Rhee 2016).7 The study by the OECD found that the Leading Industries Program contributed to increasing sales, exports, and employment in high technologies industries, and in attracting foreign direct investment to targeted regions (OECD 2012).
Innovation clusters, similar to GRIs, support regional development by bringing research institutions and facilities closer to one another. In Gyeonggi Province, the provincial government helped stand up at least two clusters: the Gwanggyo Techno Valley and the Pangyo Techno Valley (Pak and Rhee 2016). At Gwanggyo Techno Valley in Suwon, Gyeonggi, the cluster hosts 240 startups and centers for SMEs as well as several research institutes (Pak and Rhee 2016). In the Pangyo Techno Valley, 870 companies had settled in the region as of 2014 (Pak and Rhee 2016). The provincial government has supported development by building public support facilities, a global R&D center, and an industry-academia-government laboratory R&D center (Pak and Rhee 2016). These clusters, and other clusters like them, host research on key convergence industries such as IT, biotechnology, nanotechnology, environmental/energy technology, space technology, and cultural/contents technology (Pak and Rhee 2016).
Since the 1990s, Korea’s science and technology innovation policies have contributed to an increase in patents, scientific publications, and high technology exports. Despite its successes, over the last two decades the Korean government has changed its industrial and innovation policies to be more “American” by encouraging the development of more disruptive technologies in an effort to foster the growth of dynamic, entrepreneurial companies. The government is concerned that past policies have failed to foster the growth and development of SMEs. The Korean government and the Korean society more broadly are concerned that chaebols still dominate the economy, especially high technology sectors. Other criticisms of Korea’s past industrial and innovation policies include regional competition among governments and industrial parks for the most desirable industries and the concentration of high technology industries in just a few sectors (Gupta et al. 2013).
7 “Convergence Technologies” is a term the Ministry of Science uses to describe interdisciplinary fields
and technology that offer future societal or economic benefits (Pak and Rhee 2016).

A-10
Supply Chain Resilience and Security Exports are critical to South Korea’s economy. The semiconductor and automotive
industries are among Korea’s most important export industries; the Korean government sees these industries as central to the nation’s competitiveness with Japan and other countries (Kim 2020). South Korea conglomerates, such as Samsung and Hyundai, rely on vertically integrated supply chains in manufacturing as a strategy to improve supply chain security and resilience (He-suk and Hyon-hee 2011). By controlling as many aspects of their supply chains as they can, from processing raw materials to producing finished goods, Korean companies have had greater flexibility and resilience in the face of events that have an adverse impact on manufacturing compared to some competitors.
The Korean government has provided substantial support to export industries, including measures to improve supply chain resilience. While efforts to improve supply chain resilience through vertical integration have been successful, challenges to maintaining supply chain security persist. The semiconductor supply chain is globally integrated, and therefore susceptible to changes in trade policy. In 2019, Japan introduced export controls on exports of chemicals needed to manufacture computer chips, threatening Korea’s semiconductor and electronics manufacturers (Goodman et al. 2019). In response to Japan’s trade restrictions, the South Korean government announced a plan to spend $6.6 billion on R&D over 7 years to establish a domestic supply of key materials for the manufacture of semiconductors (Stangarone 2020). The government’s efforts also include encouraging private sector investments to strengthen the country’s supply chain security by waiving corporate taxes for 4 years for companies that re-shore and providing a 50 percent corporate tax cut for the following 2 years; incentives also include funding to cover relocation costs (Stangarone 2020). The government and companies in South Korea are also working to reduce reliance on Japanese and other suppliers by diversifying suppliers.
Digital and physical vulnerabilities present challenges to maintaining supply chain security. In 2020, malware was introduced into companies through legitimate South Korean security software and the digital certificates of two companies (Scammell 2020). This malware targeted a less secure part of the supply chain, highlighting the importance of robust security in all organizations to protect against cyberattacks.
North Korea poses another threat. An analysis by Resilinc, a global supply chain mapping organization, found that over 200 suppliers in South Korea reported that they are dependent on sites within range of artillery from the North Korean Kaesong base; a further 1,300 suppliers depend on sites within a zone at high risk of a coordinated attack from North Korea (Gendtron 2017).

A-11
Taiwan
Motivations for Innovation Policy Like several other East Asian countries, Taiwan enjoyed rapid growth from 1960 until
1990 (Republic of China n.d.). In the 1980s, however, the Taiwanese government became concerned about future sources of growth. In contrast to the economies of the Republic of Korea and Japan, countries in which large corporate amalgamations—chaebols and keiretsu, respectively—play major roles, small to medium-sized export-oriented manufacturing firms dominate Taiwan’s economy. Although by the 1980s, the Taiwanese had invested heavily in education and the country had created a skilled labor force with a high level of engineering skills, these smaller companies lacked the resources to invest heavily in R&D (Chen et al. 2013).
Role of R&D Institutes and Industrial Parks in Taiwan’s Industrial Policy Over the last 40 years, Taiwan has utilized quasi-governmental institutions to advance
its industrial policies. To develop high technology industries, it set up non-governmental research institutes with close ties to industry and high technology industrial parks. The Taiwanese government began funding these nonprofit R&D institutions in the 1970s. The ITRI has been the most prominent. ITRI was founded by Taiwan's Ministry of Economic Affairs in 1973. It now employs more than 6,000 people. It supports the government’s industrial policy goals by playing a major role in setting and implementing Taiwan’s industrial policies and as a technical resource center for private enterprises (Chen et al. 2013). It develops pre-competitive and applied technologies and transfers them to enterprises. ITRI collaborates closely with recipient firms. It also plays a role in introducing, assimilating, and improving foreign technologies. Technologies are diffused through non-exclusive technology transfers, seminars, workshops, and industrial services (Jan and Chen 2006). ITRI also offers over 300 basic and advanced classes, covering both technical and management topics. Its staff have been an important source of industrial leaders for Taiwan’s high technology sector.
The Hsinchu Science-based Industrial Park (HSIP), established in 1980, was the first high technology industrial park in Taiwan. HSIP’s mission was to attract a critical mass of high technology industries and individuals to create a world-class industrial cluster. HSIP offers a range of special benefits to participating firms, such as low-interest government loans, matching funds for R&D, tax benefits, reductions in commodity and business taxes, special tariff exemptions, and government-subsidized purchases of foreign technologies needed by companies residing in the park. In addition to companies, HSIP houses three national laboratories: the Synchrotron Radiation Research Centre, the National Space Program Office, and the National Centre for High-Performance Computing—the only one of the three that appears to be directly associated with computing or microelectronics.

A-12
Because of their proximity to each other, HSIP integrated circuit (IC) design companies can more easily secure timely support from foundry and assembly/testing houses, facilitating industry integration. Information about corporate capabilities and needs are circulated throughout the park (Chen et al. 2013).
Collaboration between foundries and design houses has contributed to the emergence of globally prominent IC design houses and semiconductor foundries. United Microelectronics Corporation (UMC Group) and Taiwan Semiconductor Manufacturing Company (TSMC), both located in HSIP, have captured most of the world’s dedicated chip foundry market. They are both spin-offs from ITRI research projects (Chen et al. 2013). TMSC is the world’s largest semiconductor foundry. Established in 1987, it pioneered the pure-play foundry business model by focusing on only manufacturing other companies’ products. Customer diversification smooths fluctuations in demand, which, in turn, helps maintain higher levels of capacity utilization (TMSC n.d.).
Policies and Programs The Department of Industrial Technology in the Ministry of Economic Affairs
formulates industrial development policies and identifies promising technological areas. It provides funds to nonprofit research institutes, which in turn provide funding to universities. ITRI has been a major beneficiary of this funding, in some years receiving over half of all government funding for nonprofit research institutes (Chen et al. 2013). Taiwanese government assistance has included providing information, human resource training, automation transformation guidance, and technology guidance.
After the IC industry was selected as a strategic industry by the Ministry of Economic Affairs through the Department of Industrial Technology, ITRI was made responsible for introducing, assimilating, and improving IC technology. It has played an integral role in selecting technologies and screening manufacturers. Once a manufacturer has been selected for support, ITRI develops detailed product and manufacturing plans with the company. ITRI provides support for full-scale automation, technology consultation, technology transfer, R&D, and advice on improving production (Chen et al. 2013).
Observations • Taiwan’s research institutes and industrial parks, especially ITRI, play a much
greater role in driving and implementing the country’s industrial policies than such organizations do in other countries.
• ITRI and HSIP, in particular, have supported Taiwan’s SMEs, helping them overcome constraints on their workforce and lack of resources for R&D.
• Taiwan’s focus on semiconductor technologies and the semiconductor industry has been successful. The country is now a global leader in semiconductor design

A-13
and stand-alone foundries, accounting for most global revenues of the stand-alone foundry business.
• The clusters that have emerged around HSIP and other science-based parks have made rapid knowledge diffusion possible and contributed to making Taiwan’s semiconductor industry more adaptable and quicker to respond to changing market circumstances. The infrastructure provided in and around HSIP has been especially valuable (Chen et al. 2013).


B-1
Appendix B. Examples of Manufacturing Institutes
Electric Power Research Institute The EPRI is an independent, nonprofit organization that conducts R&D related to the
generation, delivery, and use of electricity. It focuses on improving reliability, efficiency, and the affordability of electric power. It also conducts research on health, safety, and environmental issues pertaining to electric power. EPRI is headquartered in Palo Alto, California; it has research laboratories in Knoxville, Tennessee; Charlotte, North Carolina; Dallas, Texas; and Lenox, Massachusetts. Each laboratory specializes in a specific research area: Knoxville in distribution and control technologies; Charlotte on nuclear power, advanced materials, transmission and sensors, and next generation technologies; Dallas on grid modernization, among other topics; and Lenox on high voltage power equipment (EPRI n.d.).
Governance In contrast to the other manufacturing institutes we discuss, EPRI is sponsored by
industry, not government, although it does accept government funding for specific research projects. Over 1,000 organizations are members, of which many are from outside the United States. While most members are electric utilities, businesses, government agencies, regulators and other public or private entities with an interest in electric power are also members. Almost all large U.S. utilities are members; revenues of EPRI’s members account for about 90 percent of all U.S. electric utility revenues (EPRI n.d.).
EPRI members help inform the development of EPRI's annual research portfolio, identify critical and emerging electricity industry issues, and support the application and technology transfer of EPRI's R&D through several advisory councils (EPRI n.d.). In addition to a traditional Board of Directors, EPRI has an Advisory Council that represents regulatory, academic, environmental, and scientific organizations, finance and business sectors, and other stakeholders. The Advisory Council advises EPRI’s management and Board of Director on trends that affect electric utilities, and assists with prioritizing research and ensuring its relevance to serving the public interest (EPRI n.d.).
EPRI also has a Research Advisory Committee that advises EPRI management on key aspects of research, development and demonstration programs; provides strategic links between sector councils and EPRI’s Board of Directors; and champions university, national laboratory, and Federal outreach initiatives to industry (EPRI n.d.).
B-2
EPRI’s Technology Management Committee is composed of advisors from EPRI's member companies. Members are known as Managers of EPRI Technology Transfer (METT). The Technology Management Committee facilitates the business aspects of METT’s respective company engagements in EPRI while ensuring that EPRI results are applied by supporting technology transfer.
Sector Councils are composed of executives from member companies. These councils shape and prioritize collaborative research programs that fall under four sectors: Nuclear Power, Fossil Generation, Environment and Renewable Energy, and Power Delivery and Utilization.
Program Committees work with EPRI within each research area to define scope, assess priorities, and determine the best mechanisms to deliver the results of research. Each member company that invests in a research program is entitled to appoint representatives to the research Program Committee.
Programs EPRI conducts collaborative research for its members. The Sector Councils develop
research programs, which are located within the four sectors. The overall research program is updated annually, but individual programs may run for years. Members who are interested in participating in a particular program commit to providing funding and technical support for the research (EPRI 2020). Technical support may include testing the technologies on the systems of the members participating in the programs. EPRI collaborates with DOE on projects and also wins a substantial number of research grants for its programs. Research programs range from water chemistry to steam boilers to decommissioning nuclear power plants (EPRI 2020).
Observations Several metrics suggest that EPRI is a successful manufacturing institute. It has over
1,000 members, which in addition to electric utilities, include universities, government agencies, and other stakeholders. Members are located in 38 countries in addition to the United States. EPRI runs four laboratories and has developed a large number of patented technologies that it provides its members. The adoption of these technologies by participants in the programs is reportedly high. Although EPRI benefits from government grants, members fund a large share of its research. Formal evaluations of EPRI do not seem to be publicly accessible, but they offer lists of accomplishments and deliverables from each project.
Features of EPRI that have contributed to its success include:
• Its focus on a single industry, electric power;
• Members decide and fund research programs;
B-3
• Research is conducted at dedicated laboratories that specialize in specific electric power technologies; and
• It has designed and employs effective mechanisms for testing and transferring the technologies it develops to its members.
Germany’s Fraunhofer Institutes The Fraunhofer Society (Fraunhofer-Gesellschaft) is a nonprofit German
organization composed of 75 institutes and research institutions (Fraunhofer-Gesellschaft 2021). Founded in 1949, the institutes currently have around 29,000 staff members and an annual budget of 2.8 billion euros (Fraunhofer-Gesellschaft 2021). Around two-thirds of the institutes’ budgets consist of contracts (both public and private) and one-third direct governmental funding not dependent on contracts (Fraunhofer-Gesellschaft 2021). Each of the 75 Fraunhofer Institutes focuses on a different technology area. Most institutes are located at a German university (Lal et al. 2012).
Governance The Fraunhofer Society is governed by its General Assembly, Senate, and Scientific
and Technical Council (Fraunhofer-Gesellschaft 2015). The General Assembly consists of members of the Fraunhofer Society; membership is open to any person or organization who applies for membership, pays the fees, and is approved by the Senate (Fraunhofer-Gesellschaft 2015). The General Assembly has several responsibilities, but most importantly, it elects individuals from academia, industry, and government to serve on the Fraunhofer Senate (Fraunhofer-Gesellschaft 2015).
The Senate is made up of approximately 30 members, representing industry, academia, the federal and state governments, and members of the Scientific and Technical Council (Fraunhofer 2021). Each member is elected by the General Assembly to serve a 3-year term (Fraunhofer-Gesellschaft 2015). Up to 18 members may come from industry and academia, three members come from the Scientific and Technical Council, and seven members from the government, as determined by the federal and state governments (Fraunhofer-Gesellschaft 2015). Among the Senate’s powers is the ability to create or dissolve a Fraunhofer Institute (Fraunhofer 2021). The Senate is responsible for the general scientific and research policy for the Fraunhofer Society (Fraunhofer-Gesellschaft 2015). It also has the power to accept new members to the General Assembly, and direct long-term and medium-term budgeting (Fraunhofer-Gesellschaft 2015).
The Fraunhofer Scientific and Technical Council is composed of representatives from each institute, as well as the head of each institute (Fraunhofer-Gesellschaft 2015). The Council makes recommendations about research and scientific policy to the Senate

B-4
(Fraunhofer-Gesellschaft 2015). It also crafts long-term plans for the Fraunhofer Society (Fraunhofer-Gesellschaft 2015).
Characteristics Each Fraunhofer Institute operates as an accountable R&D organization able to serve
clients, including large corporations, SMEs, governments, and other organizations (Lal et al. 2012). Within each institute there are separate research and business units (National Research Council 2013). The business units draw up contracts with industry and serve as a link between companies and the research (National Research Council 2013). When a company requests help with research from a Fraunhofer Institute, the business unit assesses the cost, feasibility, and terms of the contract (National Research Council 2013). It also chooses which research units should conduct the research from the different components of the research request (National Research Council 2013).
Most Fraunhofer research projects take from 6 months to 2 years to complete. The projects aim to make “incremental improvements in existing products and processes that will have an immediate market impact” (National Research Council 2013). Fraunhofer’s focus on incremental improvements to industrial products and processes is credited with helping SMEs in Germany remain successful in their specific industrial niches (National Research Council 2013).
One of the main strengths of the Fraunhofer Institutes is their close relationship with academia. Germany employs a “dual system,” pairing vocational studies with practical industry training; Fraunhofer utilizes this system (National Research Council 2013). At the end of 2019, the institutes employed 27,988 people, including 7,517 students and 535 trainees (Fraunhofer-Gesellschaft 2021). PhD candidates and postdoctoral students study at university while also learning skills and gaining experience working in the Fraunhofer Institutes (National Research Council 2013). Many junior researchers leave after several years to work in industry (Lal et al. 2012). As a result, the Fraunhofer Institutes are a source of new talent experienced in applied research upon which industry can draw to continually renew its labor force (Lal et al. 2012). The director of every Fraunhofer Institute is also a university professor, creating links between the basic research conducted at universities and the applied research conducted at the Fraunhofer Institutes, facilitating training and project development for doctoral and other junior researchers (Lal et al. 2012).
The institutes have the advantages of critical mass, brand recognition, and political support (Lal et al. 2012). These features have resulted in the Fraunhofer Institutes being closely integrated into Germany’s industrial innovation system, contributing to the value they add to the competitiveness of German industry (Lal et al. 2012). Unlike some other R&D funding institutions, Fraunhofer continues to support successful industries, not just newer industries in need of support (National Research Council 2013). This has led to long-

B-5
term leadership in more traditional industries for Germany (National Research Council 2013).
The model is viewed as flexible and able to quickly respond to market demands by rapidly establishing “expert networks” spanning universities, industry, and the government. Some criticize the bureaucratic structure of the Fraunhofer Institutes for “rigidity”—their emphasis on industries in which Germany historically has been strong, but ignoring emerging industries that could help the German economy retain (if not expand) its competitive advantage in the global economy (Lal et al. 2012). The Fraunhofer Institutes are also not considered as closely tied to basic research institutions (such as the Max Planck institutes) as might be beneficial (Lal et al. 2012).
Processes The Fraunhofer Institutes choose their focuses through three main routes. The upper
level of management of the Fraunhofer Society, primarily the Senate, makes broad decisions about the future of the Fraunhofer Institutes; it is influenced by the General Assembly and Scientific and Technical Council. Industry dictates decisions as to what research to pursue at each institute through contracts. Each individual institute has a wide degree of freedom over its research pursuits. With a few exceptions, the German government does not intervene in the direction of the Fraunhofer Institutes.
The Fraunhofer Senate has the most direct power over decisions concerning the focus of the individual Fraunhofer Institutes through its ability to form or dissolve institutes, its direction of long-term research and scientific policy, and its power over the budget (Fraunhofer 2021). The General Assembly controls the composition of the Fraunhofer Senate by electing members of the Senate every 3 years. The Scientific and Technical Council influences the Senate through its advice on scientific and research policy, and the requirement that three members of the Council always be in the Senate. The Fraunhofer portfolio evolves strategically in other top-down ways (Lal et al. 2012). The institutes identify “lead innovations” that are then discussed with experts and aligned to the Fraunhofer Institutes’ core expertise (Lal et al. 2012).
Fraunhofer Institutes remain relevant to industry needs because they must receive one-third of their funding from industry contracts (Lal et al. 2012). The portfolios of the institutes evolve organically by adapting to the anticipated demand of industrial companies—and through the creation of new institutes (Lal et al. 2012). Fraunhofer Institutes open and close based on industry needs (Burton and Hansen 1993). Burton and Hansen list four conditions they see as necessary for a new Fraunhofer Institute to open: “a clear need for the proposed research of the institute, solid industrial support, state government support, and advocacy and leadership by a strong individual ‘champion’” (Burton and Hansen 1993).

B-6
Each institute has a wide degree of freedom to allocate its budget, to determine its research strategy, and to form industry partnerships (National Research Council 2013). Each institute has an advisory council with members from industry, government, and academia (Schuelke 2021). Typically, the members also have some level of expertise in the technical focus of the institute (Schuelke 2021). The council examines the institute’s progress on its research and its return on investment (Schuelke 2021).
Fraunhofer Institutes have generally benefitted from a lack of political intervention since an agreement was reached in the 1970s on stable budgeting (National Research Council 2013). Since that time the German government has occasionally given special responsibilities to the Fraunhofer Institutes, but they have not faced major political or budgetary threats (National Research Council 2013).
Observations • There are three primary routes through which the Fraunhofer Institutes choose
their focuses.
– The upper level of management of the Fraunhofer Society, mostly the Senate, influences by the General Assembly and Scientific and Technical Council, makes broad decisions about the future of the Fraunhofer Institutes.
– Industry influences what each institute pursues in research through research contracts.
– Institute directors and councils have the power to decide directions for research.
• The reliance on industry contracts for funding ensures that the direction of any given institute stays relevant to industry needs within its technological area.
• The institutes play an important role in workforce training for the industries through the large number of students on staff.
Sweden’s Competence Centers Sweden’s competence centers provide a framework for bringing together universities,
research institutes, companies, and public organizations to conduct research in close cooperation on a specific topic. Competence centers focus on longer-term, mission-oriented research and strengthening the pipeline of research-trained people from academia to industry. They are hosted at universities and involve a consortium of companies working together over a period of at least 10 years. These cooperative research centers are similar to but distinct from manufacturing and research institutes in that competence centers aim to strengthen the broader innovation and research system over a long period of time in addition to producing quality research (Vinnova 2019). The network of research institutes

B-7
in Sweden is comparatively small in the context of the broader research and innovation environment.
Structure and Processes The competence center program in Sweden was launched in 1993 to perform
“industrially relevant research,” create product innovations, develop human capital, and strengthen the research environment (Stern et al. 2013). In addition to research, a primary objective of these centers is to strengthen the innovation system, fostering collaboration between academia and industry. The development of the competence center program in Sweden emerged from a movement in the 1980s that began with the National Science Foundation’s Engineering Research Centers. The movement was motivated by a lack of incentives for Swedish researchers to engage with industry (Åström and Swenning 2013).
Competence centers are established following a call for proposals targeted at university research groups. Proposals are assessed by a central policy group and expert groups with representatives from industry, research councils, and universities in Sweden and other countries. The selection criteria include the number of companies interested in funding and participating in center activities as well as “ambition to involve various technologies and industrial sectors” (Stern et al. 2013).
The first competence centers in Sweden received funding in the early 2000s. Among more than 300 applications, 28 centers were funded (Stern et al. 2013). Vinnova, Sweden’s innovation agency, took over funding the majority of the centers from its predecessor, Nutek, when Vinnova was founded in 2001. The Swedish Energy Agency is another government agency that has been responsible for funding competence centers. Each center initially received 10 years of funding from a government agency, a contribution matched by the host university and participating companies. The government, the university, and industry participants each provide one-third of total research support; research support can be provided in-kind, as in the form of faculty time, as well as cash. In recent years, Vinnova has held an open call for proposals every 3 years with the intention of funding an additional eight centers; these newer centers are funded for up to 5 years (Vinnova 2019).
The KTH Royal Institute of Technology is a public research university in Stockholm that hosts 50 competence centers—many of which are connected to departments of the university but all of which conduct research autonomously (KTH Royal Institute of Technology 2020). Most of these centers have a board independent from the university that consists of a number of stakeholders, including representatives from business and society. This structure enables research that benefits the university, participating industry partners, and the broader research and innovation system in Sweden.

B-8
Evaluation Evaluations of the performance of competence centers occur 2, 5, and 8 years after
each is established. They are conducted by scientific peers as well as experts in center development and management (Stern et al. 2013). These assessments consider the research activities and agenda of centers as well processes and governance. Evaluators include international experts. Evaluators investigate the development and management of the centers and compare them with similar structures abroad. For competence centers to be considered successful, they are expected to be innovative not only in their research outputs but also in procedures, governance, and knowledge sharing.
The evaluations include an assessment of the scientific performance of centers, their impact on industry, and whether they have reached a critical mass of projects and research. Scientific performance is determined by assessing the quality and relevance of the research conducted at the center compared to scientific research elsewhere in the world, and by evaluating whether the center has become a global leader in its field. Evaluators also assess the impact on industry of the center and by whether the center has contributed to the development of new processes or products. Evaluators assess whether a critical mass has been reached and whether evaluators believe that a center seems likely to continue after government agency funding ends (Stern et al. 2013). Based on these metrics, most competence centers have been found to be largely successful.
Feedback is provided to centers following evaluations. Government agencies that provide funding can decide to cease funding a center if it is ineffective or falling short of expectations. However, competence centers have largely been found to be successful, serving to “generate long-term relationships and links between industrial and academic research” (Åström and Swenning 2013).
A study by Vinnova of the long-term effects of the centers that were initially established estimated the value generated to be roughly €270 million (Stern et al. 2013). This estimate is approximately three times the expenditures by Swedish government agencies on the centers. The value generated includes increased business among companies participating in centers, the economic value from PhD education, and spinoffs.
Observations • Competence centers have been a successful vehicle for fostering a collaborative
research environment that engages universities and industry. In addition to meeting or exceeding expectations for scientific performance, impact on industry, and critical mass, centers have been found to stimulate competitiveness, growth, and the early development of industries (Stern et al. 2013).
B-9
• Competence centers have encouraged researchers in academia to interact with industry, providing an environment for practical, valuable training and for strengthening the pipeline of talent from universities to industry.
• Continued agency support and efforts to establish new competence centers by Vinnova and other agencies are another indicator of the success of the centers.
• Competence centers effectively contribute to enhancing international competitiveness and strengthening the workforce of Sweden.
Satellite Applications Catapult
Structure In 2013, the government of the United Kingdom concluded that technologies at mid-
technology readiness levels (TRLs) were receiving insufficient attention from organizations engaged in R&D in the United Kingdom. Universities, research centers, and other institutes were developing technologies to low TRLs, while the business community was primarily interested in developing technologies for markets once they reached TRL 6 or 7, leaving a gap in the development pipeline. To address this issue, the United Kingdom established Catapult centers, private technology acceleration institutes that receive a portion of their funding from the government. The primary purpose of the Catapult centers is to help the research community transition products to the commercial sector with the end goal of developing industries in emerging technologies in the United Kingdom. The Catapult centers specialize in a particular technology area (e.g., biomedical engineering, factory operation and automation, or laser technology) and conduct client-oriented, applied research supported by contracts from government and industry. They are modeled after Germany’s Fraunhofer Institutes in that base funding from the government is to be about a third of their total budget. The rest of the budget is supplemented with R&D contracts with industry and grants received from competing for public research funds at the national or regional level (Catapult Network n.d.).
Processes Catapults centers use their funds to help companies raise financing, demonstrate their
technologies, gain access to government support, support early demonstrations of technologies at TRL 3–5, and identify potential customers. In the beginning stages of each project, the Catapult centers finance significant aspects of the product or relationship, although over time the customer’s share of funding is expected to increase until the Catapult center is no longer involved (Catapult Network n.d.). The Catapult centers have addressed the issue of competition with industry sensitively, bidding only on work that they can uniquely do, avoiding displacing commercial activities that would have occurred without their involvement. For example, the Satellite Applications Catapult works to

B-10
develop the United Kingdom’s private space industry and supports private sector users of space technologies. This center focuses on the challenges businesses face when using or developing products that rely on satellite technologies by addressing demand-side barriers to adopting those technologies. Of Satellite Application Catapult’s 140 employees, about a third are space technology specialists. The remainder work in business development and marketing or have experience in targeted sectors (e.g., agriculture, health, and defense). To build awareness of the benefits of satellite information and services within a specific sector, the center usually hires a senior leader in that sector as a consultant to inform others in the field about satellite technologies (Satellite Applications Catapult 2013).
Evaluation Catapult centers measure the contributions of their sectors to GDP growth and job
creation. A center’s success is measured by a number of metrics, including the number of new products that are coming into service, the number of direct sales the team has mediated, the value of the investments the team has helped broker, the exports the team has supported, and the value of those exports. The downstream results of an initial investment are taken into consideration as well—centers conduct a value analysis of investments to track their contributions to testing and prototyping to create a new product or service that will in turn generate revenues for that business.
Observations • Catapult centers demonstrate the importance of forming connections with the
technology community—reaching across a number of sectors for potential applications. These connections have facilitated the ability of the centers to leverage technology sectors through their consultants and other outreach efforts.
• Clearly communicating project descriptions and having a strong awareness of activities in sectors beyond the immediate technology area of the center is important to enable staff to expand the use of the technologies on which the center focuses into businesses outside the area of the technology.
• Center staff need to be technically adept and work to ensure their efforts are publicly accessible and easily understood by their target audience, which includes current and aspiring companies in their technology area as well as organizations that hope to use and benefit from those capabilities.

C-1
References
Abrahams, Leslie, Christopher Clavin, and Michelle Hindman. 2018. The Federal Role in the Development and Deployment of U.S. Civilian Nuclear Power. IDA Science and Technology Policy Institute: Washington, DC.
Adams, F. Gerard and Lawrence Robert Klein. 1983. Industrial Policies for Growth and Competitiveness. Lexington Books. Lexington, Massachusetts.
Advanced Research Projects Agency-Energy (ARPA-E). No date. “About.” https://arpa-e.energy.gov/about
Aiginger, Karl and Dani Rodrik. 2020. “Rebirth of Industrial Policy and an Agenda for the Twenty-First Century.” Journal of Industry, Competition and Trade. (20):189–207. https://link.springer.com/content/pdf/10.1007/s10842-019-00322-3.pdf
Amiti, Mary, Stephen J. Redding, and David E. Weinstein. 2019. “The Impact of the 2018 Tariffs on Prices and Welfare.” Journal of Economic Perspectives. 33 (4): 187–210. https://www.jstor.org/stable/pdf/26796842.pdf
Arrow, Kenneth. 1962. “Economic Welfare and the Allocation of Resources for Innovation.” in The Rate and Direction of Inventive Activity. R. R. Nelson (ed.). Princeton University Press. Princeton, New Jersey.
Asbjørnslett, Bjørn Egil. 2009. “Chapter 2: Assessing the Vulnerability of Supply Chains.” in Supply Chain Risk: A Handbook of Assessment, Management, and Performance. George A. Zsidisin and Bob Ritchie (eds.). Springer. New York, New York. DOI: 10.1007/978-0-387-79933-9
Åström, T. and A. Swenning. 2013. “Meta-evaluation of six competence centres in Sweden (Summary).” Technopolis Group. https://www.technopolis-group.com/de/report/meta-evaluation-of-six-competence-centres-in-sweden/
Atkinson, Robert D. 2020. The Case for a National Industrial Strategy to Counter China's Technological Rise. Information Technology and Innovation Foundation. Washington, D.C.
——–. 2020. A Fresh Start for OTA. Creating the lean, dynamic technology assessment agency Congress needs today. Information Technology and Innovation Foundation. Washington, D.C.
——–. 2014. Understanding the U.S. National Innovation System. Information Technology and Innovation Foundation. Washington, D.C.
Beath, J. 2002. “UK Industrial Policy: Old Tunes on New Instruments?” Oxford Review of Economic Policy. 18(2).
Berry, LaVerle (ed.). 1994. Ghana: A Country Study. Federal Research Division: Library of Congress. Washington, D.C. https://tile.loc.gov/storage-

C-2
services/master/frd/frdcstdy/gh/ghanacountrystud00berr_0/ghanacountrystud00berr_0.pdf
Beyar, Rafael, Benny Zeevi, and Gideon Rechavi. 2017. “Israel: a start-up life science nation.” Lancet. (389): 2563–69. https://doi.org/10.1016/S0140-6736(17)30704-3
Biden, Joseph R. 2021. “A Letter to Dr. Eric S. Lander, the President’s Science Advisor and nominee as Director of the Office of Science and Technology Policy.” January 20. Executive Office of the President. https://www.whitehouse.gov/briefing-room/statements-releases/2021/01/20/a-letter-to-dr-eric-s-lander-the-presidents-science-advisor-and-nominee-as-director-of-the-office-of-science-and-technology-policy/
——–. 2021a. “Remarks as Prepared for Delivery by President Biden — Address to a Joint Session of Congress.” April 28. Executive Office of the President. https://www.whitehouse.gov/briefing-room/speeches-remarks/2021/04/28/remarks-as-prepared-for-delivery-by-president-biden-address-to-a-joint-session-of-congress/
Bjørnskov, Christian. 2012. “Can bribes buy protection against international competition?” Review of World Economy. (148): 751–775. https://doi.org/10.1007/s10290-012-0128-z
Burton, Daniel F., and Kathleen M. Hansen. 1993. “German technology policy: incentive for industrial innovation.” Challenge. 36 (1): 37-47.
Catapult Network. No date. “About the Catapult Network.” https://catapult.org.uk/about-us/why-the-catapult-network/
Chen, Chia-Yi; Yu-Ling Lin, and Po-Young Chu. 2013. “Facilitators of national innovation policy in a SME-dominated country: A case study of Taiwan.” Innovation: Management, Policy & Practice. (15) 4: 405-415.
Chu, P. Y., Y. L. Lin, H. H. Hsiung, and T. Y. Liu. 2006. “Intellectual capital: An empirical study of ITRI.” Technological Forecasting & Social Change 73 (7): 886-902.
Congress of the United States of America (U.S. Congress). 2021. “National Defense Authorization Act (NDAA) for Fiscal Year (FY) 2021 (Pub. L. No. 116-283).” https://congress.gov/116/plaws/publ92/PLAW-116publ92.pdf
——–. 2020a. “S.3832 - Endless Frontier Act.” https://www.congress.gov/bill/116th-congress/senate-bill/3832
——–. 2020. “S.3933 - CHIPS for America Act.” https://www.congress.gov/bill/116th-congress/senate-bill/3933/text
Congressional Research Service. 2021. “Manufacturing USA: Advanced Manufacturing Institutes and Network.” R46703. March 3. U.S. Congress, Washington, D.C. https://crsreports.congress.gov/product/pdf/R/R46703
Cyber and Infrastructure Security Agency (CISA). 2019. Information and Communications Technology Supply Chain Risk Management Task Force: Interim Report. https://www.cisa.gov/sites/default/files/publications/ICT%20Supply%20Chain%20

C-3
Risk%20Management%20Task%20Force%20Interim%20Report%20%28FINAL%29_508.pdf
——–. 2020. “Executive Order 13873 Response: Methodology for Assessing the Most Critical Information and Communications Technologies and Services.” https://www.cisa.gov/sites/default/files/publications/eo-response-methodology-for-assessing-ict_v2_508.pdf
——–. 2020. Information and Communications Technology Supply Chain Risk Management Task Force Year 2 Report. https://www.cisa.gov/sites/default/files/publications/ict-scrm-task-force_year-two-report_508.pdf
Defense Logistics Agency (DLA). 2020. DLA Strategic Plan 2021- 2026. U.S. Department of Defense. Arlington, Virginia. https://www.dla.mil/Info/strategicplan/SupplyChainSecurityStrategy/
Department of Defense (DoD). 2018. Assessing and Strengthening the Manufacturing and Defense Industrial Base and Supply Chain Resiliency of the United States. https://media.defense.gov/2018/Oct/05/2002048904/-1/-1/1/ASSESSING-AND-STRENGTHENING-THE-MANUFACTURING-AND-DEFENSE-INDUSTRIAL-BASE-AND-SUPPLY-CHAIN-RESILIENCY.PDF
Department of Energy (DOE). No date. “PCAST: About.” U.S. Department of Energy. Washington, D.C. https://science.osti.gov/About/PCAST/About
Directorate-General for Internal Market, Industry, Entrepreneurship and SMEs. 2019. A vision for the European industry until 2030. European Commission. doi:10.2873/34695 Brussels, Belgium. https://op.europa.eu/en/publication-detail/-/publication/339d0a1b-bcab-11e9-9d01-01aa75ed71a1/
——–. 2019a. Strengthening Strategic Value Chains for a future-ready EU Industry. Report of the Strategic Forum for Important Projects of Common European Interest. European Commission. Brussels, Belgium. https://europa.eu/!nT98kN.
Dubey, R., A. Gunasekaran, S. J. Childe, T. Papadopoulos, C. Blome, and Z. Luo. 2019. “Antecedents of Resilient Supply Chains: An empirical study.” IEEE Transactions on Engineering Management, 66 (1):8-19. DOI:10.1109/TEM.2017.2723042.
Edler, Jakob, and Jan Fagerberg. 2017. “Innovation policy: What, why, and how.” Oxford Review of Economic Policy. 33 (1): 2-23. https://doi.org/10.1093/oxrep/grx001
Electric Power Research Institute (EPRI). No date. “About.” https://www.epri.com/about ——–. 2020. “2021 Research Portfolio: Years Ahead, Decades Ahead: Research
Offerings to Shape the Future of Electricity.” Palo Alto, California. Elg, Lennart and Staffan Håkansson. 2012. Impacts of innovation policy - Lessons from
VINNOVA´s impact studies. Vinnova Analysis VA, 1. Stockholm, Sweden. https://www.vinnova.se/contentassets/c3cbb583e3d0470f8cdb78f92b5070e8/va-12-01.pdf

C-4
Environmental Protection Agency (EPA). 2016. “Renewable Electricity Production Tax Credit Information.” Washington, D.C. https://www.epa.gov/lmop/renewable-electricity-production-tax-credit-information
European Commission (EC). 2014. “Member States need to act to boost European industry.” Memo/14/37. January 22. Brussels, Belgium. https://ec.europa.eu/commission/presscorner/detail/en/MEMO_14_37
——–. 2010. “Your Single Market.” Brussels, Belgium. ISBN 978-92-79-16933-5; doi: 10.2780/19934.
Executive Office of the President (EOP). 2021. “Executive Order on America’s Supply Chains.” February 21. https://www.whitehouse.gov/briefing-room/presidential-actions/2021/02/24/executive-order-on-americas-supply-chains/
——–. 2021a. “Executive Order on Ensuring the Future is Made in All of America by All America’s Workers.” January 25. https://www.whitehouse.gov/briefing-room/presidential-actions/2021/01/25/executive-order-on-ensuring-the-future-is-made-in-all-of-america-by-all-of-americas-workers/
Ewing, Jack and Neal E. Boudette. 2021. “A Tiny Part’s Big Ripple: Global Chip Shortage Hobbles the Auto Industry.” April 23. New York Times. https://www.nytimes.com/2021/04/23/business/auto-semiconductors-general-motors-mercedes.html#:~:text=A%20modern%20car%20can%20easily,tiny%20share%20of%20chip%20demand.&text=Over%20all%2C%20the%20chip%20shortage,to%20IHS%20Markit%2C%20a%20consultancy.
Ezell, S., F. Spring, and K. Bitka. 2015. The Global Flourishing of National Innovation Foundations. Information Technology and Innovation Foundation. Washington, D.C.
Ezell, S. (ed.). 2019. National Innovation Policies: What Countries Do Best and How They Can Improve. Global Trade and Innovation Policy Alliance. Washington, D.C.
Fagerberg, Jan and Gernot Hutschenreiter. 2020. “Coping with Societal Challenges: Lessons for Innovation Policy Governance. Journal of Industry, Competition and Trade. (20): 279–305.
Flaaen, Aaron and Justin Pierce. 2019. Disentangling the Effects of the 2018-2019 Tariffs on a Globally Connected U.S. Manufacturing Sector. Paper 2019-086. December 23. Finance and Economics Discussion Series. Divisions of Research & Statistics and Monetary Affairs Federal Reserve Board. Washington, D.C. https://www.federalreserve.gov/econres/feds/files/2019086pap.pdf?
Federal Energy Regulatory Commission (FERC). No date. “Cyber and Grid Security.” Washington, D.C. https://www.ferc.gov/industries-data/electric/industry-activities/cyber-and-grid-security
Fortune Business Insights. 2021. “Supply Chain Risk Management market size, share and industry analysis, By Component (Software, Services), By Risk Type (Operational Risks, Disruptive Risks), By Industry (Manufacturing, Retail, Chemical, Consumer Packaged Goods, Automotive) and regional forecast 2020-2027.” February 9.
C-5
https://www.fortunebusinessinsights.com/supply-chain-risk-management-market-103757
Fraunhofer. 2021. “Senate of the Fraunhofer-Gesellschaft.” February 8. https://www.fraunhofer.de/en/about-fraunhofer/profile-structure/structure-organization/fraunhofer-senate.html
Fraunhofer-Gesellschaft. 2015. Statute of the Fraunhofer-Gesellschaft. https://www.fraunhofer.de/content/dam/zv/en/documents/Statute-of-the-Fraunhofer-Gesellschaft.pdf
——–. 2021. “Facts and Figures.” https://www.fraunhofer.de/en/about-fraunhofer/profile-structure/facts-and-figures.html#:~:text=Founded%20in%201949%2C%20the%20Fraunhofer,budget%20of%202.8%20billion%20euros.
Geroski, Paul A. 1989. “European Industrial Policy and Industrial Policy in Europe.” Oxford Review of Economic Policy. 5(2): 20-36.
Gerstel, D. and M. P. Goodman. 2020. From Industrial Policy to Innovation Strategy. Lessons from Japan, Europe, and the United States. Center for Strategic & International Studies. Washington, D.C.
Goodman, S., D. Kim, and J. VerWey. 2019. The South Korea-Japan Trade Dispute in Context: Semiconductor Manufacturing, Chemicals, and Concentrated Supply Chains. United States International Trade Commission. https://usitc.gov/publications/332/working_papers/the_south_korea-japan_trade_dispute_in_context_semiconductor_manufacturing_chemicals_and_concentrated_supply_chains.pdf
Government Accountability Office (GAO). 2019. Advanced Manufacturing: Innovation Institutes Have Demonstrated Initial Accomplishments, but Challenges Remain in Measuring Performance and Ensuring Sustainability. May. Washington. D.C. https://www.gao.gov/assets/gao-19-409.pdf
Gupta, N., D. W. Healey, A. M. Stein, and S.S. Shipp. 2013. Innovation Policies of South Korea. D-4984. Institute for Defense Analyses: Alexandria, Virginia.
Hauser, Lisa M. 2003. “Risk-Adjusted Supply Chain Management.” Supply Chain Management Review. 7 (6): 64-71.
Hayami, Yujiro, and Yoshihisa Godo. 1997. “Economics and Politics of Rice Policy in Japan: A Perspective on the Uruguay Round Regionalism versus Multilateral Trade Arrangements.” in NBER-EASE Volume 6. Takatoshi Ito and Anne O. Krueger, eds. University of Chicago Press. Chicago, Illinois. ISBN: 0-226-38672-4. http://www.nber.org/books/ito_97-1
Health Resources and Services Administration (HRSA). No date. “Opioid Crisis.” Department of Health and Human Services. Washington, D.C. https://www.hrsa.gov/opioids

C-6
Herman, A. 2018. “Closing the Defense Industrial Security Gap with Japan.” Hudson Institute. https://www.hudson.org/research/14441-closing-the-defense-industrial-security-gap-with-japan.
He-suk, C. and S. Hyon-hee. 2011. “Vertical integration key strategy for conglomerates.” The Korean Herald. http://www.koreaherald.com/view.php?ud=20110622000890
Hollanders, Hugo. 2020. “European Innovation Scoreboard 2020; Methodology Report.” European Commission. Brussels, Belgium. https://ec.europa.eu/docsroom/documents/41861
Howell, Sabrina T. 2017. “Financing innovation: Evidence from R&D grants." American Economic Review. 107 (4): 1136-64. https://pubs.aeaweb.org/doi/pdfplus/10.1257/aer.20150808
Howell, Sabrina, Jason Rathje, John Van Reenen and Jun Wong. 2020. “Opening up Military Innovation: An Evaluation of Reforms to the U.S. Air Force SBIR Program.” November 26. U.S. Department of Defense. Washington, D.C. http://nebula.wsimg.com/41e3675c95963a0e69ea7b1dc9e373bd?AccessKeyId=1EB5B81197329425B7C4&disposition=0&alloworigin=1
Invest In Israel. 2021a. “R&D Centers”. Ministry of Economy and Industry State of Israel. https://investinisrael.gov.il/HowWeHelp/Pages/Resources.aspx.
——–. 2021b. “Israel’s Innovation Box: An Unprecedented Opportunity For Multinational Companies”. https://investinisrael.gov.il/HowWeHelp/Pages/Resources.aspx.
——–. 2021c. “Innovation and Scouting Centers.” https://investinisrael.gov.il/HowWeHelp/Pages/Resources.aspx.
——–. 2021. “MAGNET Consortiums | Israel Innovation.” https://innovationisrael.org.il/en/program/magnet-consortiums
Israel Innovation Authority. 2021. “About Us: The Israel Innovation Authority.” https://innovationisrael.org.il/en/contentpage/israel-innovation-authority.
ISO-New England. No date. “Natural Gas Infrastructure Constraints.” Independent System Operator (ISO) New England. https://www.iso-ne.com/about/what-we-do/in-depth/natural-gas-infrastructure-constraints
Jaffe, Adam B., R.G. Newell, and Robert N. Stavins. 2005. “A tale of two market failures: Technology and environmental policy.” Ecological Economics 54 (2-3): 164–174. DOI: 10.1016/j.ecolecon.2004.12.027.
Jan, T. S., and H.H. Chen. (2005). “Systems approaches for the industrial development of a developing country.” Systemic Practice and Action Research. 18 (4): 365-377.
Jang, Yongsuk. 2012. “Evolution of Korean STI policies.” STI Policy Review 2(4): 1-8. ——–. 2021. Personal interview with STPI researchers. Washington, D.C, March 30. Juhasz, Reka. 2018. “Temporary protection and technology adoption: evidence from the
Napoleonic blockade.” American Economic Review. 108 (11): 3339–3376. https://doi.org/10.1257/aer.20151730

C-7
Jung, Y., E. Kim, and W. Kim. 2019. “The scientific and technological interdisciplinary research of government research institutes: network analysis of the innovation cluster in South Korea.” Policy Studies. 42 (2): 132-151. https://doi.org/10.1080/01442872.2019.1593343
Kang, Daekook, Wooseok Jang, Yoonjo Kim, and Jeonghwan Jeon. 2019. “Comparing national innovation system among the USA, Japan, and Finland to improve Korean deliberation organization for national science and technology policy.” Journal of Open Innovation: Technology, Market, and Complexity. 5 (4): 82.
Kilian, Lutz and Xiaoqing Zhou. 2020. “Does Drawing Down the U.S. Strategic Petroleum Reserve Help Stabilize Oil Prices?” Journal of Applied Econometrics. 35 (6) 673-691.
Kim, S. 2020. “Korea Warns of Trade Pain That Will Shift Supply Chains.” Bloomberg. https://www.bloomberg.com/news/articles/2020-05-10/korea-warns-of-sharper-trade-pain-that-will-shift-supply-chains
Krueger, Anne O. 1990. “Government Failures in Development.” Journal of Economic Perspectives. 4 (3): 9-23. DOI: 10.1257/jep.4.3.9. https://www.aeaweb.org/articles?id=10.1257/jep.4.3.9
Krugman, Paul R. 1996. Rethinking International Trade. MIT Press. Krugman, Paul R. and Maurice Obstfeld. 1991. International Economics: Theory and
Policy. HarperCollins. New York, New York. KTH Royal Institute of Technology. 2020. “Competence centres.”
https://www.kth.se/en/om/organisation/kompetenscentrum-1.11756. Lal, Bhavya, Asha Balakrishnan, Craig Boardman, and Stephanie Shipp. 2012. “Lessons
Learned from the U.S.-Based Fraunhofer Centers.” August 23. IDA Science and Technology Policy Institute: Washington, D.C.
Lane, Nathaniel. 2020. “The Empirics of Industrial Policy.” Journal of Industry, Competition and Trade. (20): 209–234. https://link.springer.com/article/10.1007/s10842-019-00323-2
Håkansson, Staffan and Lennart Elg. 2012. “Impacts of Innovation Policy - lessons from VINNOVA's impact studies.” Vinnova. https://www.vinnova.se/contentassets/c3cbb583e3d0470f8cdb78f92b5070e8/va-12-01.pdf
Magaziner, I. and Robert Reich. 1982. Minding America's Business: The Decline and Rise of the American Economy. New York, NY: Harcourt Brace Jovanovich Publishers.
Manufacturing USA Program. 2020. “Report to Congress: Fiscal Year 2019.” https://www.manufacturingusa.com/reports/report-congress-fiscal-year-2019
Manuj, Ila and John T. Mentzer. 2008. “Global Supply Chain Risk Management.” Journal of Business Logistics. 20(1): 133-55. https://onlinelibrary.wiley.com/doi/epdf/10.1002/j.2158-1592.2008.tb00072.x

C-8
Ministry of the Economy, Trade, and Industry (METI). 2021. “METI's Mission.” https://www.meti.go.jp/english/aboutmeti/data/meti_mission.html
——–. 2020. “Announcement of Progress in Program for Promoting Investment in Japan to Strengthen Supply Chains: Current Situations of Application Filing and Schedule for Selecting Applications.” https://www.meti.go.jp/english/press/2020/0805_001.html.
——–. 2019. “Industrial Cluster Policy.” https://www.meti.go.jp/english/policy/sme_chiiki/industrial_cluster_en.html, updated on 1/31/2019, checked on 3/11/2021.
——–. 2009. “Industrial Cluster Project.” https://www.meti.go.jp/policy/local_economy/tiikiinnovation/source/2009Cluster(E).pdf
——–. 2006. “Second Term Medium-range Industrial Cluster Plan.” https://www.meti.go.jp/policy/local_economy/tiikiinnovation/source/METI, 2006.pdf.
Ministry of Trade, Industry and Energy (MOTIE). 2016. “Introduction.” http://english.motie.go.kr/en/am/introduction/introduction.jsp.
Morris, A., P. Nivola, and C. Schultze. 2012. “Clean Energy: Visiting the challenges of industrial policy.” Brookings. Washington, D.C.
Nataraj, Shanthi, Howard J. Shatz, Keith Crane, Steven W. Popper, Xiao Wang, and Chaoling Feng. 2012. Creating an Innovation System for Knowledge City. TR-1293-GDD. The RAND Corporation. Santa Monica, California. https://www.rand.org/pubs/technical_reports/TR1293.html
National Bureau of Statistics of China. 2020. “Number of Employed Persons at Year-end by Three Strata of Industry.” China Statistical Yearbook 2020. Beijing, Peoples’ Republic of China. http://www.stats.gov.cn/tjsj/ndsj/2020/indexeh.htm
National Economic Council and Office of Science and Technology Policy. 2015. A Strategy for American Innovation. Washington, D.C.
National Institute of Standards and Technology (NIST). 2020. Manufacturing USA program: Report to Congress for Fiscal Year 2019. Washington, D.C.
National Research Council. 2001. Energy Research at DOE: Was It Worth It? Energy Efficiency and Fossil Energy Research 1978 to 2000. Washington, D.C.
——–. 2013. 21st century manufacturing: The role of the manufacturing extension partnership program. National Academies Press. Washington, D.C.
Nezu, R. 2007. “Industrial Policy in Japan”. Journal of Industry, Competition and Trade. pp. 229–243. DOI: 10.1007/s10842-007-0018-6.
Nishimura, J. Okamuro, H. 2011. “R&D productivity and the organization of cluster policy: an empirical evaluation of the Industrial Cluster Project in Japan”. The Journal of Technology Transfer. 36 (2): 117-144.
C-9
Organisation of Economic Co-operation and Development (OECD). 2012. Industrial Policy and Territorial Development: Lessons from Korea. OECD Publishing. Paris, France. https://doi.org/10.1787/9789264173897-en.
——–. 2021. “OECD Main Science and Technology Indicators.” http://www.oecd.org/sti/msti-highlights-march-2021.pdf
——–. 2018. Privatisation and the Broadening of Ownership of State-Owned Enterprises: Stocktaking of National Practices. OECD Publishing. Paris, France. https://www.oecd.org/daf/ca/Privatisation-and-the-Broadening-of-Ownership-of-SOEs-Stocktaking-of-National-Practices.pdf
Office of Technology Assessment. 1991. “Competing Economies: America, Europe, and the Pacific Rim.” OTA-ITE-498. October. U.S. Congress. Washington, D.C.
Okazaki, T. 2017. “Industrial Policy in Japan: 70-Year History since World War II.” https://www.rieti.go.jp/en/papers/contribution/okazaki/06.html.
Pak, E. Y. and W. Rhee. 2016. “Convergence Science and Technology at Seoul National University.” https://link.springer.com/content/pdf/10.1007%2F978-3-319-07052-0_58.pdf.
Pettit, T.J., K.L. Croxton, and J. Fiksel. 2019. “The Evolution of Resilience in Supply Chain Management: A Retrospective on Ensuring Supply Chain Resilience.” Journal of Business Logistics. 40: 56-65. https://doi.org/10.1111/jbl.12202
Popper, S., C. Wagner, and E. Larson. 1998. New Forces at Work: Industry Views Critical Technologies. RAND Corporation. Santa Monica, California.
Porter, Michael. 1990. “The Competitive Advantage of Nations.” Harvard Business Review. March-April: 73-91
Price, Victoria Curzon. 1981. “Industrial Policies in the European Community.” Trade Policy Research Centre. London, United Kingdom.
Priddy, Hervey Amsler. 2013. United States Synthetic Fuels Corporation: Its Rise and Demise. Dissertation. The University of Texas at Austin. https://repositories.lib.utexas.edu/handle/2152/21978?show=full
PwC Israel. 2019. The State of Innovation: Operating model frameworks, findings and resources for multinationals innovating in Israel. http://mlp.startupnationcentral.org/rs/663-SRH472/images/The%20State%20of%20Innovation.pdf.
Republic of China. No date. “National Accounts: Principal Figures.” Statistical Bureau. https://eng.stat.gov.tw/ct.asp?xItem=37408&CtNode=5347&mp=5
Romer, P. M. 1990. “Endogenous Technological Change.” Journal of Political Economy. 98 (5): 71–102.
Sargent, John. 2021. Manufacturing USA: Advanced Manufacturing Institutes and Network. R46703. Congressional Research Service. U.S. Library of Congress.
Scammell, R. 2020. “Lazarus malware deployed in South Korea supply chain hack.” Verdict. https://www.verdict.co.uk/lazarus-malware-supply-chain/

C-10
Schuelke, Thomas and Russell Zarras. 2021. Interview with Asha Balakrishnan. Personal interview. March 17, 2021. IDA Science and Technology Policy Institute: Washington, D.C.
Secretariat of the Program for Promoting Investment in Japan to Strengthen Supply Chains. 2020. Program for Promoting Investment in Japan to Strengthen Supply Chains Application Guidelines. https://www.jetro.go.jp/ext_library/1/_Newsroom/2020/2nd/DomesticInvestment0618.pdf
Stangarone, T. 2020. “South Korea’s Struggle to Bring Manufacturing Home.” The Diplomat. https://thediplomat.com/2020/09/south-koreas-struggle-to-bring-manufacturing-home/
Stantchev, Stefan. 2012. “The Medieval Origins of Embargo as a Policy Tool.” History of Political Thought. Autumn. 33 (3): 373-399.
Stern, P., E. Arnold, M. Carlberg, T. Fridholm, C. Rosemberg, and M. Terrell. 2013. “Long term industrial impacts of the Swedish competence centres.” VINNOVA. https://www.vinnova.se/contentassets/110915c66b9346b4a4fb8fa2d287bd35/va_13_10.pdf.
Tukamuhabwa, Benjamin R., Mark Stevenson, Jerry Busby, and Marta Zorzini. 2015. “Supply chain resilience: definition, review and theoretical foundations for further study.” International Journal of Production Research, 53 (18): 5592-5623. DOI: 10.1080/00207543.2015.1037934
Vinnova. 2019. “Eight new world-class research environments to be funded.” https://www.vinnova.se/en/news/2019/06/efforts-on-world-class-research-environments/.
——–. No Date. “The Swedish governmental agency for innovation systems (Vinnova) – Sweden.” https://www.flagera.eu/ourfunders/the-swedish-governmental-agency-for-innovation-systems-vinnova-sweden/#:~:text=Our%20mission%20is%20to%20promote,to%20invest%20and%20conduct%20business.
Wonglimpiyarat, Jarunee. 2016. “Government policies towards Israel’s high-tech powerhouse.” Technovation 52–53:18–27. https://doi.org/10.1016/j.technovation.2016.02.001.
World Bank Group. “Government Objectives: Benefits and Risks of PPPs.” https://ppp.worldbank.org/public-private-partnership/overview/ppp-objectives
Yülek, Murat A. (ed.). 2018. Industrial Policy and Sustainable Growth. Springer Singapore. Singapore.
Zsidisin, George A. and Bob Ritchie. 2009. “Chapter 1: Supply Chain Risk Management Developments, Issues and Challenges.” in Supply Chain Risk: A Handbook of Assessment, Management, and Performance. George A. Zsidisin and Bob Ritchie (eds.). Springer. New York, New York. DOI: 10.1007/978-0-387-79933-9

D-1
Abbreviations
ARPA-E Advanced Research Projects Agency-Energy ATP automatic train protection CBRN Chemical Biological, Radiological, and Nuclear CCP Chinese Communist Party CHIPS Creating Helpful Incentives to Produce Semiconductors CIPAC Critical Infrastructure Partnership Advisory Council CISA Cyber and Infrastructure Security Agency DARPA Defense Advanced Research Projects Agency DHS Department of Homeland Security DLA Defense Logistics Agency DoD Department of Defense DOE Department of Energy EOP Executive Office of the President EPA Environmental Protection Agency EPRI Electric Power Research Institute EU European Union FERC Federal Energy Regulatory Commission GDP gross domestic product GRIs government research institutes HSIP Hsinchu Science-based Industrial Park IC integrated circuit ICT information and communications technology IDA Institute for Defense Analyses IDF Israeli Defense Force IP intellectual property ITRI Industrial Technology Research Institute METI Ministry of Economy, Trade, and Industry METT Managers of EPRI Technology Transfer MITI Ministry of International Trade and Industry MKE Ministry of the Knowledge Economy MNCs multinational corporations MOTIE Ministry of Trade, Industry, and Energy NDAA National Defense Authorization Act NIIMBL National Institute for Innovation in Manufacturing
Biopharmaceuticals NSTC National Science and Technology Council (Korea) OECD Organisation of Economic Co-operation and
Development OEM Original Equipment Manufacturers (working group) OSTP Office of Science and Technology Policy
D-2
PCAST President’s Council of Advisors on Science and Technology
QBL/QML Qualified Bidder Lists and Qualified Manufacturer Lists (working group)
R&D research and development RIC Research and Innovation Council SBIR Small Business Innovation Research SCRES supply chain resilience SCRM supply chain risk management SME small and medium-sized enterprises STEM science, technology, engineering, and mathematics STPI Science and Technology Policy Institute STTR Small Business Technology Transfer Research TRL technology readiness level TSMC Taiwan Semiconductor Manufacturing Company UMC United Microelectronics Corporation

Standard Form 298 (Rev. 8/98)
REPORT DOCUMENTATION PAGE
Prescribed by ANSI Std. Z39.18
Form Approved OMB No. 0704-0188
The public reporting burden for this collection of information is estimated to average 1 hour per response, including the time for reviewing instructions, searching existing data sources, gathering and maintaining the data needed, and completing and reviewing the collection of information. Send comments regarding this burden estimate or any other aspect of this collection of information, including suggestions for reducing the burden, to Department of Defense, Washington Headquarters Services, Directorate for Information Operations and Reports (0704-0188), 1215 Jefferson Davis Highway, Suite 1204, Arlington, VA 22202-4302. Respondents should be aware that notwithstanding any other provision of law, no person shall be subject to any penalty for failing to comply with a collection of information if it does not display a currently valid OMB control number. PLEASE DO NOT RETURN YOUR FORM TO THE ABOVE ADDRESS. 1. REPORT DATE (DD-MM-YYYY) 2. REPORT TYPE 3. DATES COVERED (From - To)
4. TITLE AND SUBTITLE 5a. CONTRACT NUMBER
5b. GRANT NUMBER
5c. PROGRAM ELEMENT NUMBER
5d. PROJECT NUMBER
5e. TASK NUMBER
5f. WORK UNIT NUMBER
6. AUTHOR(S)
7. PERFORMING ORGANIZATION NAME(S) AND ADDRESS(ES) 8. PERFORMING ORGANIZATIONREPORT NUMBER
9. SPONSORING/MONITORING AGENCY NAME(S) AND ADDRESS(ES) 10. SPONSOR/MONITOR'S ACRONYM(S)
11. SPONSOR/MONITOR'S REPORTNUMBER(S)
12. DISTRIBUTION/AVAILABILITY STATEMENT
13. SUPPLEMENTARY NOTES
14. ABSTRACT
15. SUBJECT TERMS
16. SECURITY CLASSIFICATION OF:a. REPORT b. ABSTRACT c. THIS PAGE
17. LIMITATION OFABSTRACT
18. NUMBEROFPAGES
19a. NAME OF RESPONSIBLE PERSON
19b. TELEPHONE NUMBER (Include area code)