success user engagement - national climatic data center · success stories on user engagement 4 2....
TRANSCRIPT

1 | P a g e
Success Stories on User Engagement Global Science & Technology, Inc.
Case Study 2: Forensic Analysis of Aviation
Incidents and Accidents
March 18, 2016
2016
2 | P a g e
Table of Contents:
1. Success stories on user engagement 4
2. Introduction 5
3. What is NEXRAD? 7
4. How does NEXRAD work? 9
5. Real‐time and archive 11
6. Case studies:
6.1. National Transportation Safety Board 12
6.2. Federal Aviation Administration & Massachusetts Institute of Technology, Lincoln
Laboratory 19
6.3. General aviation 20
6.4. Airline ticket profits 21
6.5. Hawaiian Airlines & WxOps 22
6.6. Southwest Airlines 27
7. The path forward 29
8. Conclusion 30
9. References 31

3 | P a g e
Acronyms used
CONUS: Continental United State
FAA: Federal Aviation Administration
MITLL: Massachusetts Institute of Technology, Lincoln Laboratory
NCEI: National Center’s for Environmental Information
NEXRAD: Next Generation Radar
NOAA: National Oceanic and Atmospheric Administration
NSSL: National Severe Storms Laboratory
NTSB: National Transportation Safety Board
NWS: National Weather Service (NOAA)
WSR‐88D: Weather Surveillance Radar 1988 Doppler

4 | P a g e
1. Success stories on user engagement
This report serves as the second of three in‐depth case studies that examine user engagement with National
Centers for Environmental Information’s (NCEI) climate and weather data. The case studies demonstrate the
value that the free and publicly available provision of NCEI’s climate and weather data has provided to key
sectors utilizing this service, and also to society at large. Each case study focuses on a different NCEI weather
and data product, in‐situ, radar, or satellite and explains the application of these data to an essential sector in
the U.S. economy. The extensive research and interviews that inform these case studies detail how
organizations and companies have used NCEI’s climate and weather data, for what purpose, and ultimately
what benefit the use of these data has provided to either their own business and / or to end users. The three
case studies demonstrate that climate and weather data are an indispensable public and societal good that is
informing smart economic and environmental decision‐making.

5 | P a g e
2. Introduction
Aviation is the safest mode of transportation in absolute terms. The likelihood of the average American being
killed in a plane crash is approximately 1 in 11 million (Ropeik, 2006). However, in the interest of the airline
industry continuing to grow safely and efficiently, it is necessary to address the key factors that continue to
challenge aviation operations. Weather remains one of the leading causes of airline incidents and accidents
and poses the largest threat to the safety and profitability of airline operations (Vigeant‐Langlois & Hansman,
2004). Convective weather can pose serious risks to aviation operations as it is often accompanied by
turbulence, lightening, heavy rain, poor visibility, restricted ceiling, icing and strong winds. There are about
100,000 thunderstorms each year in the U.S. alone (NSSL, 2016), and at any given time 7,000 commercial
airplanes flying over the US (FAA, 2014).
Aviation accidents1 and incidents2 may result in passenger and crew injury or loss of life and catastrophic
economic losses and reputational impacts, and therefore avoiding accidents and incidents is of the utmost
importance for the viability of any airline. Costs associated with accidents and incidents include; liability costs
to injured or killed passengers (paid out through insurance), lawsuits, cost of aircraft repairs, lost revenue
through inoperability of aircraft, cost of rerouting passengers to their final destination and decreased demand
for services. As adverse weather is a constant threat that airlines face, an improved understanding of
convective activity can help improve safety and save revenue through avoided hazards (Vigeant‐Langlois &
Hansman, 2004).
Airplanes are flying continuously during periods of convective activity. It is therefore critical for airlines to
understand how to navigate convective activity to avoid putting the plane and its passengers and crew in
harms way. Considering the astronomical fuel costs that airlines bear an unnecessary diversion could mean
thousands of dollars in lost revenue per flight. Understanding how to navigate bad weather is also important to
maintaining a strong bottom line.
1 The National Transportation Safety Board defines an accident as “an occurrence associated with the operation of an aircraft which take place between the time any person boards the aircraft with the intention of flight and when all such passengers have disembarked, in which any person suffers death or serious injury, in which the aircraft receives substantial damage” (ICAO, 2013). 2 The National Transportation Safety Board defines an incident as “an occurrence other than an accident, associated with the operation of an aircraft which affects of could affect the safety of the operation” (ICAO, 2013).
Convective weather: the vertical transfer of heat by a fluid movement to a cooler area. Thunderstorms are
a form of convection (NWS, 2010b).

6 | P a g e
“Hawaiian [airlines] has to squeeze between things that show up on the radar and the satellite. They do it
every day. They cross through the inter‐tropical convergence zone3 which always has thunderstorms in it.
They need to decide on what side of the thunderstorm they should route, how close they can get to it and
still have a measure of safety. Sometimes you go through it and that’s an informed risk. We keep
monitoring the weather and keep refining procedures” ‐ Mark Spence, Retired Manager of Dispatch,
Hawaiian Airlines.
In order to understand the cause(s) of an accident / incident, analysts reconstruct the event to understand the
factors (i.e. convective, mechanical, biological) that led to the accident / incident, along with the pilot’s
decision‐making process. The NEXRAD archive at NOAA’s National Centers for Environmental Information
serves as the official archive of NEXRAD data and is utilized by analysts across the sector to understand the
causes of accident / incident4. These forensic analyses are developed and used by government agencies in the
interest of providing safety recommendations, and by airlines to inform training and safety programs and to
structure internal policies (Paul Suffern personal communication, 2016, Mark Spence & Scott Shipley, personal
communication, 2015).
The purpose of this case study is to document the value of NCEI’s archived NEXRAD data to the aviation sector.
The use of the archive provides value in two primary ways; ensuring the safety of the travelling public and
airline cost savings through avoided accidents and incidents. This research is informed by interviews with the
National Transportation Safety Research Board (NTSB), the Federal Aviation Administration (FAA), the
Massachusetts Institute of Technology Lincoln Laboratory (MITLL), Embry‐Riddle Aeronautical University,
Hawaiian Airlines via their weather service provider WxOps, and Southwest Airlines.
Figure 1: Airplane in the sky. Retrieved from pixabay.com
3 ITCA: An area near the equator where the northeast and southeast trade winds meet. It is known for having convective regions that generate vigorous thunderstorms over large regions (Mark Spence, personal communication, 2015). 4 NCEI also archives Terminal Doppler Weather Radar (TSWR) Level III products (Steve Delgreco, personal communication, 2016)
7 | P a g e
3. What is NEXRAD?
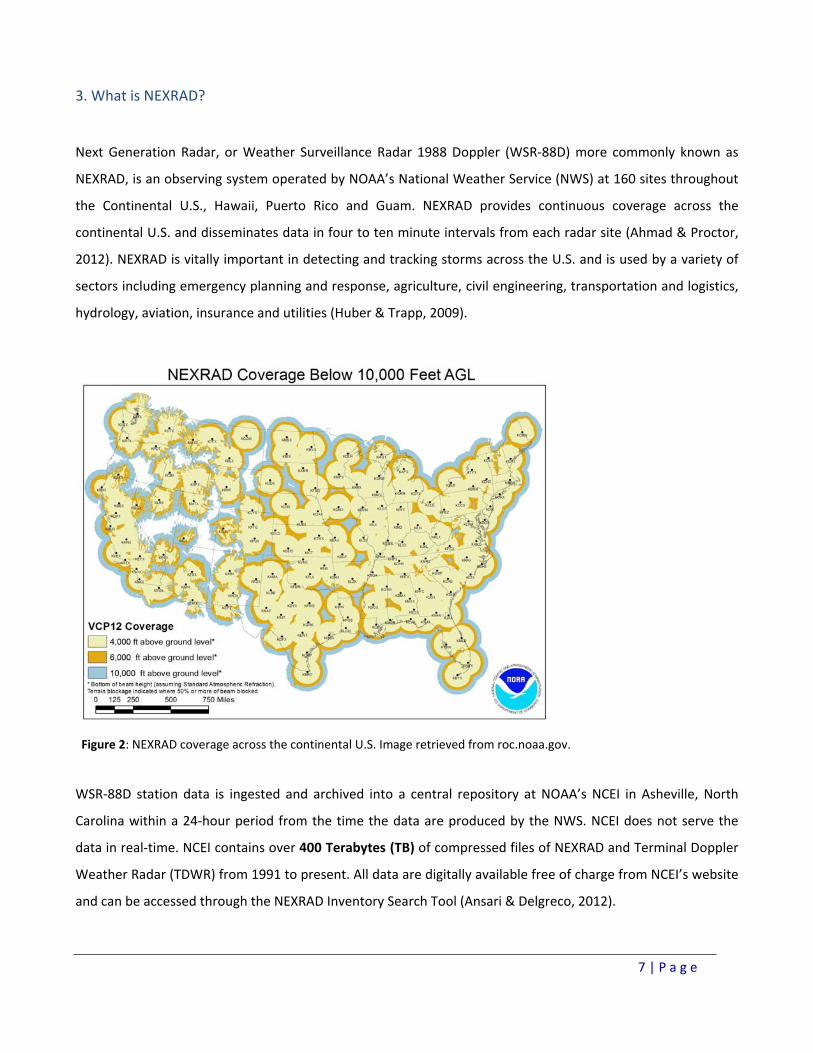
Next Generation Radar, or Weather Surveillance Radar 1988 Doppler (WSR‐88D) more commonly known as
NEXRAD, is an observing system operated by NOAA’s National Weather Service (NWS) at 160 sites throughout
the Continental U.S., Hawaii, Puerto Rico and Guam. NEXRAD provides continuous coverage across the
continental U.S. and disseminates data in four to ten minute intervals from each radar site (Ahmad & Proctor,
2012). NEXRAD is vitally important in detecting and tracking storms across the U.S. and is used by a variety of
sectors including emergency planning and response, agriculture, civil engineering, transportation and logistics,
hydrology, aviation, insurance and utilities (Huber & Trapp, 2009).
Figure 2: NEXRAD coverage across the continental U.S. Image retrieved from roc.noaa.gov.
WSR‐88D station data is ingested and archived into a central repository at NOAA’s NCEI in Asheville, North
Carolina within a 24‐hour period from the time the data are produced by the NWS. NCEI does not serve the
data in real‐time. NCEI contains over 400 Terabytes (TB) of compressed files of NEXRAD and Terminal Doppler
Weather Radar (TDWR) from 1991 to present. All data are digitally available free of charge from NCEI’s website
and can be accessed through the NEXRAD Inventory Search Tool (Ansari & Delgreco, 2012).
8 | P a g e
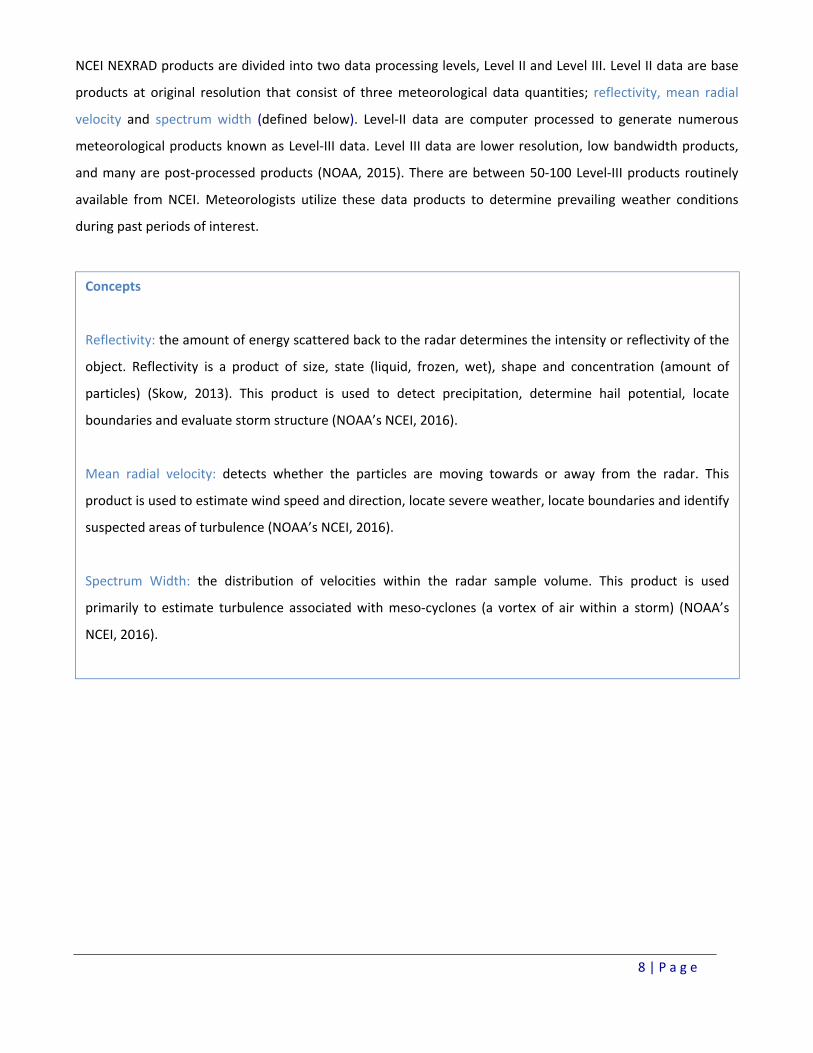
NCEI NEXRAD products are divided into two data processing levels, Level II and Level III. Level II data are base
products at original resolution that consist of three meteorological data quantities; reflectivity, mean radial
velocity and spectrum width (defined below). Level‐II data are computer processed to generate numerous
meteorological products known as Level‐III data. Level III data are lower resolution, low bandwidth products,
and many are post‐processed products (NOAA, 2015). There are between 50‐100 Level‐III products routinely
available from NCEI. Meteorologists utilize these data products to determine prevailing weather conditions
during past periods of interest.
Concepts
Reflectivity: the amount of energy scattered back to the radar determines the intensity or reflectivity of the
object. Reflectivity is a product of size, state (liquid, frozen, wet), shape and concentration (amount of
particles) (Skow, 2013). This product is used to detect precipitation, determine hail potential, locate
boundaries and evaluate storm structure (NOAA’s NCEI, 2016).
Mean radial velocity: detects whether the particles are moving towards or away from the radar. This
product is used to estimate wind speed and direction, locate severe weather, locate boundaries and identify
suspected areas of turbulence (NOAA’s NCEI, 2016).
Spectrum Width: the distribution of velocities within the radar sample volume. This product is used
primarily to estimate turbulence associated with meso‐cyclones (a vortex of air within a storm) (NOAA’s
NCEI, 2016).
9 | P a g e
4. How does NEXRAD work?
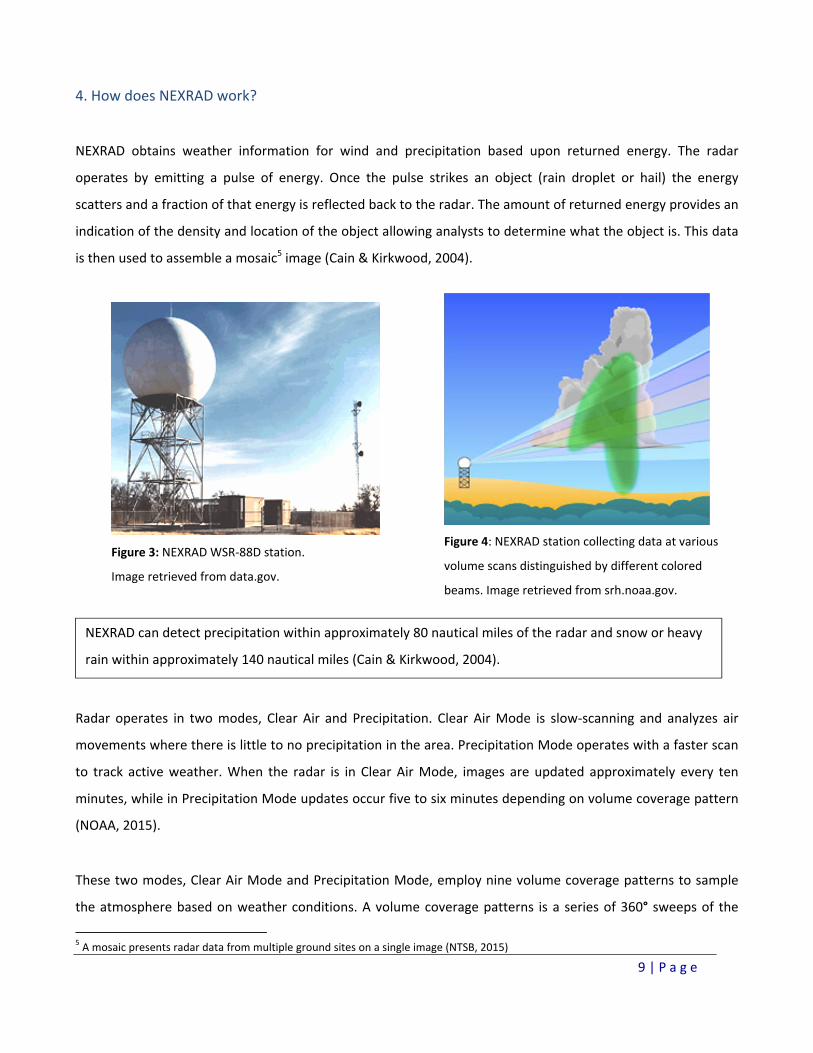
NEXRAD obtains weather information for wind and precipitation based upon returned energy. The radar
operates by emitting a pulse of energy. Once the pulse strikes an object (rain droplet or hail) the energy
scatters and a fraction of that energy is reflected back to the radar. The amount of returned energy provides an
indication of the density and location of the object allowing analysts to determine what the object is. This data
is then used to assemble a mosaic5 image (Cain & Kirkwood, 2004).
Figure 3: NEXRAD WSR‐88D station.
Image retrieved from data.gov.
Radar operates in two modes, Clear Air and Precipitation. Clear Air Mode is slow‐scanning and analyzes air
movements where there is little to no precipitation in the area. Precipitation Mode operates with a faster scan
to track active weather. When the radar is in Clear Air Mode, images are updated approximately every ten
minutes, while in Precipitation Mode updates occur five to six minutes depending on volume coverage pattern
(NOAA, 2015).
These two modes, Clear Air Mode and Precipitation Mode, employ nine volume coverage patterns to sample
the atmosphere based on weather conditions. A volume coverage patterns is a series of 360° sweeps of the
5 A mosaic presents radar data from multiple ground sites on a single image (NTSB, 2015)
Figure 4: NEXRAD station collecting data at various
volume scans distinguished by different colored
beams. Image retrieved from srh.noaa.gov.
NEXRAD can detect precipitation within approximately 80 nautical miles of the radar and snow or heavy
rain within approximately 140 nautical miles (Cain & Kirkwood, 2004).
10 | P a g e
antenna at a select elevation angle and pulse repetition frequencies completed in a specific period of time
(NOAA, 2015).
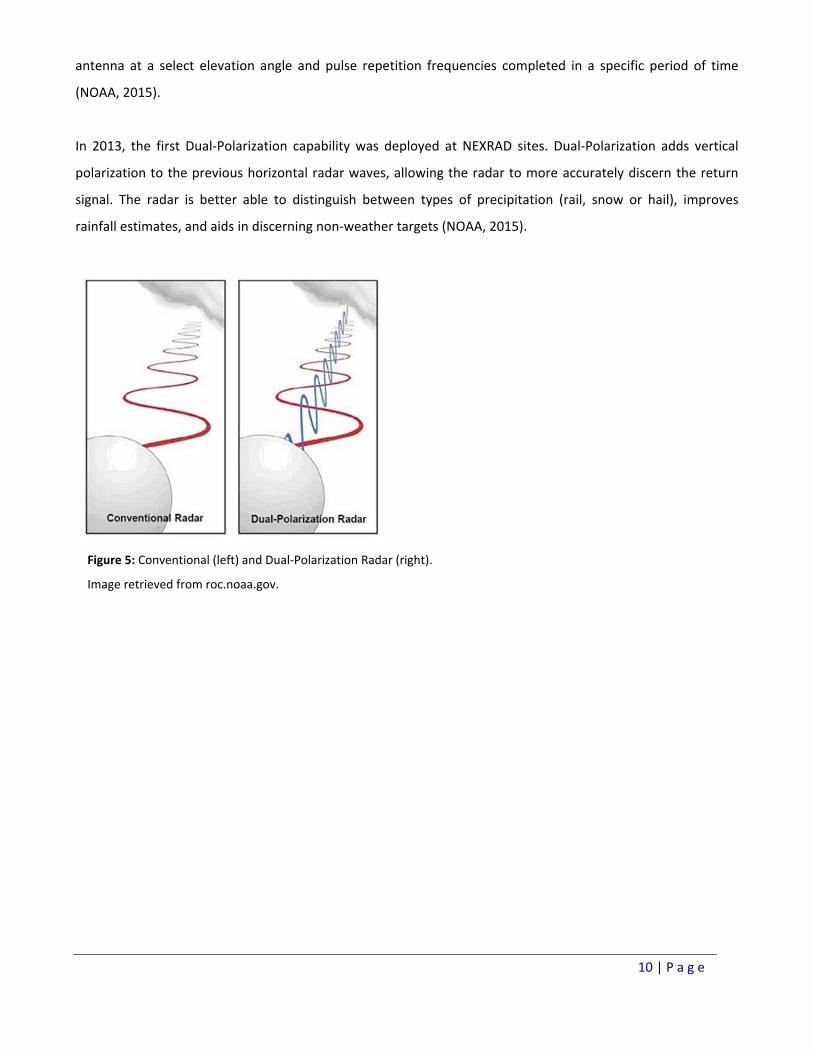
In 2013, the first Dual‐Polarization capability was deployed at NEXRAD sites. Dual‐Polarization adds vertical
polarization to the previous horizontal radar waves, allowing the radar to more accurately discern the return
signal. The radar is better able to distinguish between types of precipitation (rail, snow or hail), improves
rainfall estimates, and aids in discerning non‐weather targets (NOAA, 2015).
Figure 5: Conventional (left) and Dual‐Polarization Radar (right).
Image retrieved from roc.noaa.gov.
11 | P a g e
5. Real‐time and archive
Real‐time and archived NEXRAD data are both fundamentally important to aviation operations, although they
serve different functions. The two will be differentiated in this report by referring to ‘NWS / NEXRAD real‐time’
or ‘real‐time data’ and ‘NCEI NEXRAD archive’ or ‘archived data’.
NWS NEXRAD real‐time data serves an operational function in terms of facilitating the crew and dispatch to
plan the most efficient flight route while managing the aircraft’s proximity to, or avoidance of, convective
weather. The airline dispatch team receives a near‐real‐time mosaic updated every 5 or 6 minutes that shows
convective weather along the flight path. This data is then used to make decisions before take off and en‐route.
NEXRAD real‐time data is invaluable to the safety and efficiency of airline operations and in its absence there
would be far more weather‐related aviation accidents / incidents. Furthermore, the real‐time data can help
airlines save money on their two biggest expenditures, fuel costs and crew time, by helping to plan the most
efficient route with the least amount of detour (Mark Spence, personal communication, 2015).
While the real‐time data is used operationally, the archived data is used forensically. The NCEI NEXRAD archive
allows analysts to retrospectively analyze the convective factors that led to an accident / incident. Analysts can
access the archive via NCEI’s website and collect data from a station of interest, dating back thirty years. The
accident / incident can then be re‐constructed using computer software such as The Weather and Climate
Toolkit, to understand what weather was taking place at the time of the accident / incident, and what decisions
were made in regards to managing proximity to, or avoidance of, convective weather. These re‐constructed
analyses serve two main purposes:
To understand what caused an incident / accident in the interest of future avoidance. Information
gleaned through retrospective analysis has been incorporated into safety and training programs at
airlines, embedded within an airlines operational policy, and used to conduct formal federal safety
investigations and issue recommendations to the aviation community.
To test and validate real‐time models. For example, in cock‐pit radar mosaics (section 5.2).
The next section continues by offering case study examples of how federal agencies and airlines are using the
NCEI NEXRAD archive for forensic analysis:
12 | P a g e
6. Case studies
6.1. National Transportation Safety Board
The National Transportation Safety Board (NTSB) is an independent government agency charged with
determining the probable cause of transportation accidents and incidents and promoting transportation safety.
Since its inception in 1966, the NTSB has investigated over 132,000 aviation accidents and incidents (NTSB,
2004). The NTSB has the authority to conduct an investigation for any civil aviation accident and significant
accidents in other modes of transportation that occur in the U.S. After investigating an aviation accident /
incident, the NTSB releases a factual report and probable cause of the accident / incident which may include
recommendations for aviation operators and or regulatory agencies, and brings awareness to the public of a
critical safety feature. Safety recommendations generally address a specific issue uncovered during the
investigation and advise on how to correct the situation to prevent future accidents / incidents.
Recommendations are sent by letter to the organization best able to address the safety issue including federal,
state or local agencies, airlines and other organizations involved in supporting aviation (NTSB, 2004).
Use of the NEXRAD Archive at NTSB
The NCEI NEXRAD archive has been an effective means for the NTSB to gather the facts needed to determine if
weather played a role in an accident / incident, and if so, aiding the agency in the formation of an appropriate
safety recommendation(s). Over 75 percent of aviation accidents / incidents investigated by the NTSB utilize
data gathered from the NCEI NEXRAD archive (Paul Suffern, personal communication, 2016). Each factual
weather report that utilizes the archive includes the following sentence(s):
‘The National Transportation Safety Board’s (NTSB) Meteorologist … gathered all the weather data for this
investigation from the NTSB’s Washington D.C office and from official National Oceanic and Atmospheric
sources including the National Climatic Data Center6’ (NCDC) (NTSB, 2014, 2014a, 2013 & 2013b).
And,
6 Prior to merging with two other NOAA Centers in the spring of 2015, NCEI was called the National Climatic Data Center
“I have five aviation accidents that landed on my desk this week and I plan to use the NEXRAD archive via
the weather and climate toolkit to analyze all of them” – Paul Suffern, Senior Meteorologist Investigator,
NTSB (personal communication, 2016).
13 | P a g e
Level II and III archived radar data was obtained from the NCDC utilizing the NEXRAD Data Inventory Search and
displayed using the NOAA’s Weather and Climate Toolkit software (NTSB, 2014, 2014a, 2013 & 2013b).
The NTSB relies on the Weather and Climate Toolkit, an open source free platform independent software
available on the NCEI website, that allows the visualization and data export of weather and climate data,
including radar. They like using this software as it allows their staff to import their data from air traffic control
investigations and overlay it onto the Weather and Climate Toolkit. NTSB meteorologists obtain the data from
the station(s) in closest proximity to the accident / incident site and analyze the weather conditions that were
occurring at the time. The toolkit offers a Google Earth viewer, providing a three dimensional view of the
accident / incident.
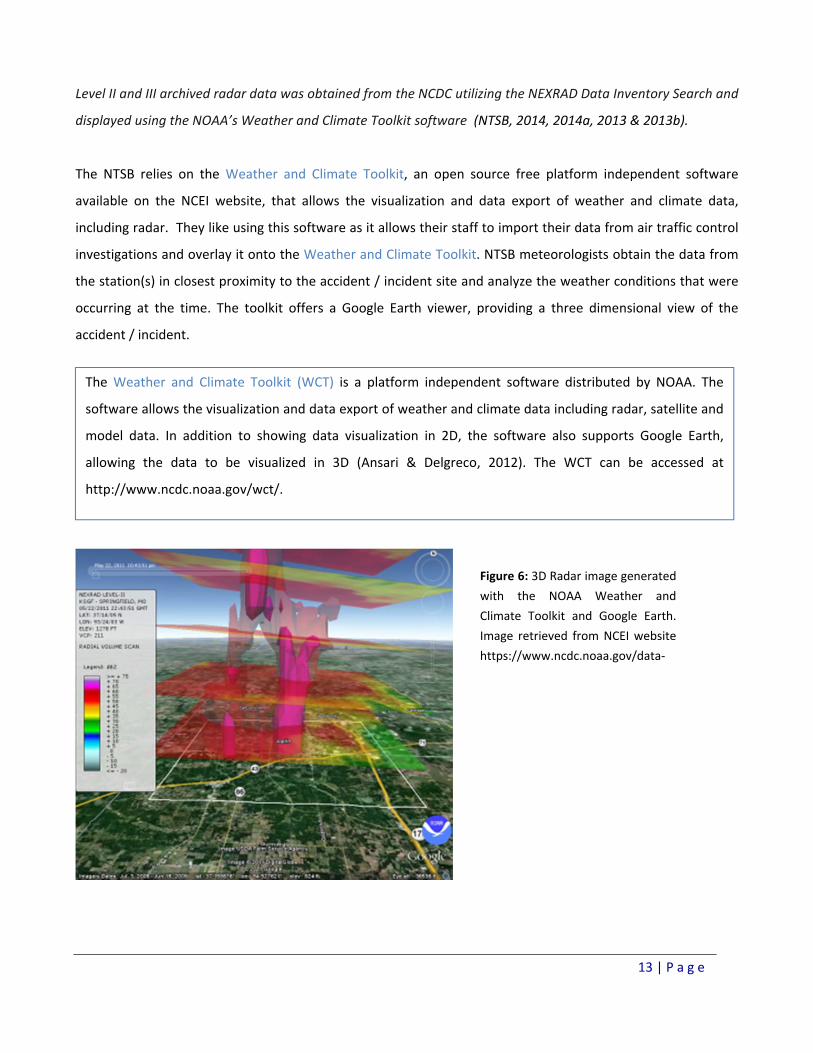
The Weather and Climate Toolkit (WCT) is a platform independent software distributed by NOAA. The
software allows the visualization and data export of weather and climate data including radar, satellite and
model data. In addition to showing data visualization in 2D, the software also supports Google Earth,
allowing the data to be visualized in 3D (Ansari & Delgreco, 2012). The WCT can be accessed at
http://www.ncdc.noaa.gov/wct/.
Figure 6: 3D Radar image generated
with the NOAA Weather and
Climate Toolkit and Google Earth.
Image retrieved from NCEI website
https://www.ncdc.noaa.gov/data‐
14 | P a g e
Retrospective Analysis Alaska Department of Public Safety Helicopter Crash
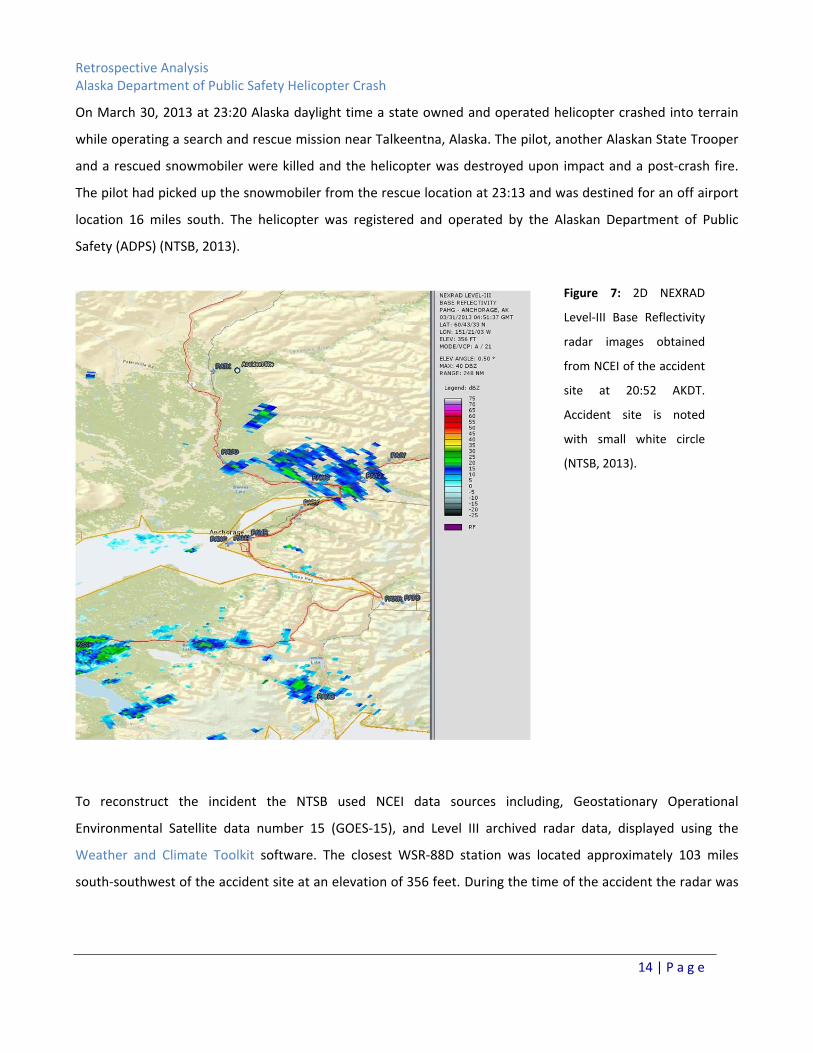
On March 30, 2013 at 23:20 Alaska daylight time a state owned and operated helicopter crashed into terrain
while operating a search and rescue mission near Talkeentna, Alaska. The pilot, another Alaskan State Trooper
and a rescued snowmobiler were killed and the helicopter was destroyed upon impact and a post‐crash fire.
The pilot had picked up the snowmobiler from the rescue location at 23:13 and was destined for an off airport
location 16 miles south. The helicopter was registered and operated by the Alaskan Department of Public
Safety (ADPS) (NTSB, 2013).
To reconstruct the incident the NTSB used NCEI data sources including, Geostationary Operational
Environmental Satellite data number 15 (GOES‐15), and Level III archived radar data, displayed using the
Weather and Climate Toolkit software. The closest WSR‐88D station was located approximately 103 miles
south‐southwest of the accident site at an elevation of 356 feet. During the time of the accident the radar was
Figure 7: 2D NEXRAD
Level‐III Base Reflectivity
radar images obtained
from NCEI of the accident
site at 20:52 AKDT.
Accident site is noted
with small white circle
(NTSB, 2013).

15 | P a g e
operating in precipitation mode. The 0.5° 7 elevation scan of the radar depicted the weather activity that
occurred over and around the accident site. The reflectivity at the 0.5° elevation scan showed that precipitation
activity was moving northwards towards the accident site – a factor that the flight crew could have anticipated
with a proper weather briefing. Further, the radar confirmed that at the time of the accident there were
reflectivity targets (likely a form of frozen precipitation) located above the accident site. This weather radar
information helped give credibility to the witness testimonies that were involved in the investigation, which
recalled the weather events that were taking place at the time of the accident. Through its retrospective
analysis, including witness interviews, the NTSB concluded that there was sufficient information available prior
to the mission for the pilot to determine that the weather and low light presented a high risk to the rescue
mission (NTSB, 2013).
The NTSB determined that the probable cause(s) of the accident was the pilots decision to continue flying in
the midst of deteriorating weather conditions which resulted in the pilot’s spatial disorientation and loss of
control of the helicopter. Compounded by this was the ADPS’s inadequate safety management procedures and
punitive culture, which prevented the organization from identifying and correcting faulty approaches to risk
management and pilot training (NTSB, 2013). While the pilot was deemed culpable in this situation, there was a
series of recommendations directed at the ADPS and those with oversight of the ADPS.
As a result of this investigation the NTSB issued:
Three safety recommendations to the FAA.
Seven safety recommendations to the state of Alaska and additional states that conduct law
enforcement for public aircraft operations.
Asiana Flight 214
As weather is commonly a factor in airline accidents / incidents, it is important for the NTSB to be able to
confirm or deny its role in each case in the interest of providing appropriate safety recommendations. Paul
Suffern, Senior Meteorologist Investigator for the NTSB explains, “even for accidents where we know that
7 In precipitation mode the reflectivity images are available at four angles: 0.5°, 1.45°, 2.40° and 3.35°. An angle, of 0.5° means that the radar’s antenna is tilted 0.5’ above the horizon (Cain & Kirkwood, 2004).
“Public agencies are not learning the lessons from each other’s accidents. The tragic result is that we have
seen far too many accidents in public helicopter operations” – NTSB Acting Chairman Christopher A Hart
quoted in the NTSB press release for the ADPS crash (NTSB Public Affairs, 2014).
16 | P a g e
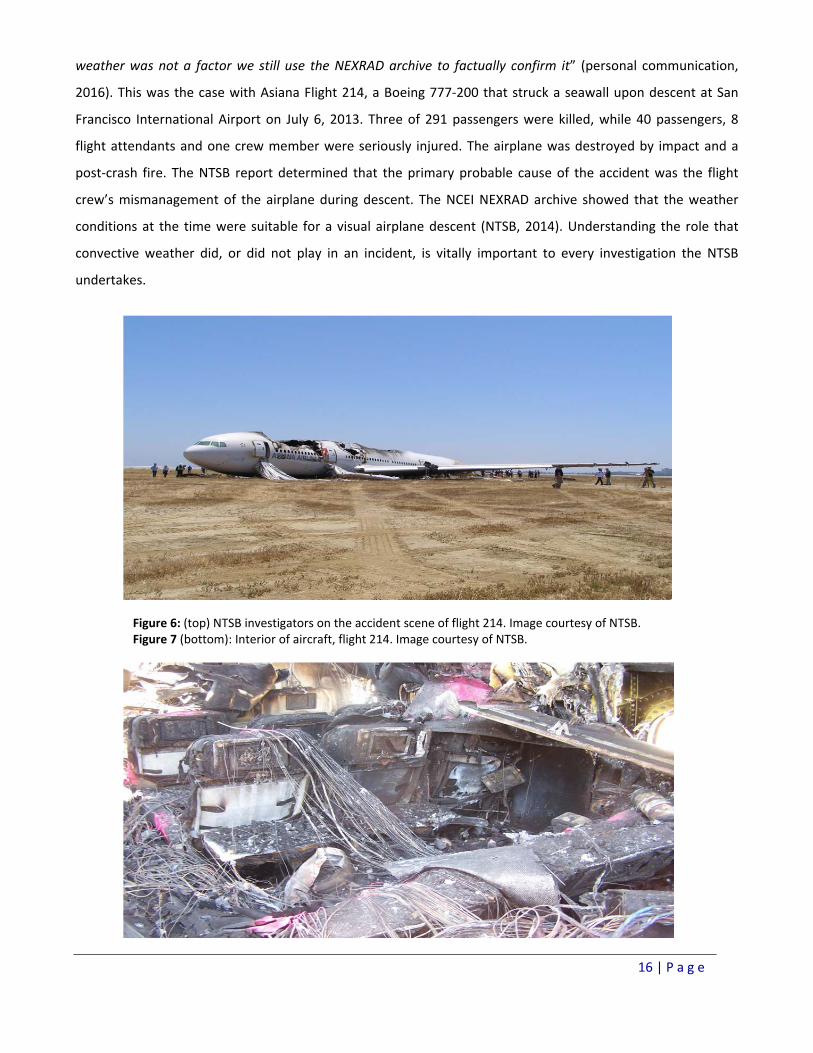
weather was not a factor we still use the NEXRAD archive to factually confirm it” (personal communication,
2016). This was the case with Asiana Flight 214, a Boeing 777‐200 that struck a seawall upon descent at San
Francisco International Airport on July 6, 2013. Three of 291 passengers were killed, while 40 passengers, 8
flight attendants and one crew member were seriously injured. The airplane was destroyed by impact and a
post‐crash fire. The NTSB report determined that the primary probable cause of the accident was the flight
crew’s mismanagement of the airplane during descent. The NCEI NEXRAD archive showed that the weather
conditions at the time were suitable for a visual airplane descent (NTSB, 2014). Understanding the role that
convective weather did, or did not play in an incident, is vitally important to every investigation the NTSB
undertakes.
Figure 6: (top) NTSB investigators on the accident scene of flight 214. Image courtesy of NTSB. Figure 7 (bottom): Interior of aircraft, flight 214. Image courtesy of NTSB.

17 | P a g e
Safety Alert
With the advent of broadband on airplanes, pilots can now obtain a NEXRAD real‐time mosaic in the cockpit
from a private weather service provider (Scott Shipley & Mark Spence, personal communication, 2015). While
this service provides pilots with greater spatial awareness of convective weather occurring on or near the flight
path, the NTSB issued a safety alert that NEXRAD real‐time mosaics8 not be used for navigational purposes due
to the latency of the data and information gaps from ground sites (NTSB, 2015). Using NCEI’s Weather and
Climate Toolkit, the NTSB undertook an analysis where it compared NCEI archived radar data for various
locations with the NEXRAD mosaics that pilots were receiving via their weather service providers in the cockpit.
They found that there was a several minute latency between the time stamp on the mosaics and the prevailing
weather conditions that were occurring at the time. For example, when investigating the crash of a Piper PA‐
32‐260 near Bryan Texas, the NTSB noted that the last three NEXRAD images that the pilot received indicated
that the images were 1 minute old, when in fact the images varied from 6 to 8 minutes old. A several minute
difference between the time stamp indicator and actual conditions is a large discrepancy when considering the
speed of the aircraft, changing weather conditions and rapidly developing weather hazards (NTSB, 2015).
While the general issues of latency with in‐cockpit NEXRAD mosaics is discussed in pilots guides, industry
literature and on websites of service providers, the NTSB has not found this guidance to indicate details about
the potential time difference between the timestamp and the actual conditions. In effect the radar images in
the cockpit depict where the weather was and not where it is.
The archive has served a valuable purpose in testing the products derived from real‐time NEXRAD data. The
NTSB safety alert promoted an awareness of a critical safety feature in the aviation community that is likely to
lead to safer skies and saved lives (NTSB, 2015).
Benefits of the NCEI NEXRAD archive to NTSB
Assurance and security of access to weather information across the continental U.S.
Data spanning the entire life of the WSR‐88D station
Speed of access: quick and timely
Weather and Climate Toolkit: allows NTSB to recreate incidents in Google Earth and view in 3D
Available at no cost
8 When mosaic images are updated, they may omit new information from each ground site. Further, due to inherent latencies in processes used to detect and deliver the data from ground site to weather service providers, the NEXRAD data can age significantly by the time the mosaic image is created (NTSB, 2015).
18 | P a g e
Shortcomings of the NCEI NEXRAD archive to NTSB
Not compatible with older versions of Java at times. As the NTSB does not have the quickest update
rate to Java software, it makes it challenging to access the NCEI NEXRAD archive on some NTSB
systems.
In the absence of the archive
In the absence of the archive the process of conducting safety investigations of aviation accidents / incidents
would be much more cumbersome and costly for certain investigations. The NTSB may have to seek weather
radar support for a significant number of cases either through contracted services or from the Radar
Operations Center in Norman, Oklahoma. Considering the frequency with which the NTSB accesses the archive
in support of safety reports and recommendations, any process that reduces the throughput of weather data
would negatively impact the timelines of aviation cases. Further, a reduction or absence of the archive data
could potentially limit the number of accidents and incidents that the NTSB staff is able to examine and
therefore the number of safety enhancements the agency recommends. The NEXRAD archive is essential in
support of the work that the NTSB does to keep the American flying public safe (Paul Suffern, personal
communication, 2016).
19 | P a g e
6.2. Federal Aviation Administration & Massachusetts Institute of Technology, Lincoln Laboratory The Massachusetts Institute of Technology Lincoln Laboratory (MITLL) is a federally funded research and
development center that provides technological solutions for problems pertaining to national security. Since
1971, the MITLL has supported the FAA in developing new technologies to advance capabilities in air traffic
control (MITLL, 2016). They specialize in radar to improve both safety and efficiency in the National Airspace
System.
MITLL relies on the NCEI NEXRAD radar archive in several capacities, including investigating issues with FAA’s
Corridor Integrated Weather System (CIWS). CIWS is a fully automated weather analysis and forecasting tool
that supports air traffic controllers in avoiding locations of convective weather in a congested air space. When
there are problems with NEXRAD radar in real‐time, analysts can go back to the NCEI NEXRAD archive to
investigate them in detail. Using the NCEI NEXRAD archive to improve the FAA’s presentation of weather to air
traffic users has proven to be a valuable function. The archive provides the MITLL with the assurance that the
data is available and accessible when they need to access it. As Dave Smalley, Technical Staff member at MITLL
comments, “We rely on the NCEI NEXRAD archive as an extension of what we do here data‐wise. We consider it
an extension of our capabilities, and it’s important to have those archives available with a quick turn around”
(personal communication, 2016).
20 | P a g e
6.2. General Aviation
General aviation (GA) aircrafts are significantly more prone to encountering adverse weather and therefore
have significantly more accidents / incidents associated with weather than commercial or transport aviation.
This is largely owing to the fact that GA aircrafts tend to be slower, smaller and flown at lower altitudes than
commercial aircraft, making them more vulnerable to weather hazards. Studies further indicate that GA pilots
may be less likely to have access to good weather information when compared to commercial pilots. As a result
of this discrepancy, federal agencies such as the NTSB, the Federal Aviation Administration (FAA) and the
National Aeronautics and Space Administration (NASA) have dedicated interest to the topic of how to decrease
fatalities (Lanicci et al., 2012).
The FAA, in partnership with Embry‐Riddle Aeronautical University and Clemson University, investigated 24 GA
accidents / incidents involving weather encounters across the continental U.S. The project team included
human factors researchers to understand the pilot’s decision‐making process, and meteorologists to
understand the weather conditions that were occurring at the time (Lanicci et al., 2012).
In addition to analyzing weather flight advisories, the FAA analyzed Level II base reflectivity data from the NCEI.
These data provided meteorologists with weather information that was available before and during the flight,
and illustrated the weather conditions along the route and at the time and location of the hazard encounter
(Lanicci et al., 2012).
The findings of the analysis yielded that general aviation pilots are not sufficiently trained in understanding
weather and its associated hazards. From this research, it was recommended to the FAA that GA pilots be
required to have more standardized training focused on weather hazards as they relate to convective weather,
icing, wind shear, turbulence and visual meteorological conditions into instrument meteorological conditions
(VMC into IMC)9, as an appreciation of these hazards are likely to lead to better decision‐making in flights (John
Lanicci, personal communication, 2016).
9 VMC into IMC occurs when pilots fly into conditions where they can no longer rely on outside visual cues and must fly using only their instruments in order to maintain safety of flight. VMC into IMC is a leading cause of weather‐related accidents and incidents in GA (John Lanicci, personal communication, 2015).

21 | P a g e
6.3. Airline ticket profits
The airplane industry today is vital to the US economy, driving nearly $1.5 trillion in U.S economic activity and
generating of 11 million U.S jobs (Airlines for America, 2014). However, the costs of operating an airline are
extremely expensive and often leave airlines with a narrow profit margin. The following graphic from Airlines
for America illustrates the economic breakdown of a $300 domestic round‐trip airline ticket for a commercial
airline in 2014.
Figure 7: Economic breakdown for a $300 domestic round‐trip ticket (Airlines for America, 2014).
Considering the small profit margin for an economy class airline ticket (3%), any accident, incident, cancellation
or even delay could substantially cut into an airlines profit margin (Airlines for America, 2014). The avoidance
of any one of these scenarios will result in cost savings to a sector that is already subject to economic volatility
through varying fuel prices, macro‐economic factors, and increasingly high taxes and regulations (IATA, 2014).
22 | P a g e
5.4. Hawaiian Airlines & WxOps
WxOps is a weather service provider that serves Hawaiian Airlines. As a part of the greater service that WxOps
offers, the company provides retrospective analysis of airline accidents / incidents that occur across the
country. As Hawaiian flights span the entire continental U.S. and Pacific Ocean from Honolulu to New York City,
the airline has an interest in improving its understanding of convective weather by learning from incidents /
accidents that occur across the country. Further, as the airline has a lot of flight time over open‐ocean where
NEXRAD data is unavailable and convective weather is frequent and intense, the airline has an interest in
increasing its awareness of land‐based convective weather, with the understanding that storms play out
differently over oceans. The following provides an example of an incident that was retrospectively analyzed by
WxOps for Hawaiian Airlines, to improve the airline’s understanding of convective weather. This incident
happened to a non‐Hawaiian air carrier on the U.S. mainland:
Figure 8: Hawaiian Airlines. Image courtesy of Hawaiian Airlines
23 | P a g e
WxOps completed a forensic analysis of this incident for Hawaiian Airlines using the NEXRAD Dual‐polarization
Level‐III data to identify hail streaks. This analysis provided Hawaiian with important information on how to
handle and avoid such scenarios should Hawaiian encounter them in the future. This serves as valuable
information for the airline and informs training and decision‐making for the dispatch and operational crew.
Hawaiian has maintained an accident free, zero fatalities record since it began operations in 1929 and intends
Retrospective Analysis Re‐construction of aviation incident of a major U.S. Carrier
In August 2015 a major U.S. airline made an emergency landing at Denver International Airport in Colorado
after hail cracked the front windshield and punctured the nose cone. The airbus, en route from Boston to
Salt Lake City, flew through a powerful thunderstorm in Nebraska near the Colorado border, where it was
hit by hail and encountered dangerous convective turbulence, requiring a swift emergency landing.
Prior to departing Boston’s Logan Airport in Massachusetts, two areas of convection began to form in
Colorado, one in the northeast of the state and the other in the southeast. As the airbus crossed over the
Mississippi River, at approximately 12:45 am both areas of thunderstorm were designated as severe,
however there was still a gap between the two convective systems, where the flight appeared to be
headed. The archived data from the Goodland, Kansas NEXRAD Doppler Radar Station from the NCEI
NEXRAD archive, showed that the gap between the two convective areas began to close as the plane
approached.
Approximately 20 minutes before the aircraft diverted to Denver, the gap between the two areas
completely disappeared and the two areas of severe convection merged into one meso‐scale convective
system (MCS), a complex of thunderstorms. The airbus flew into the area which had now turned into a
meso‐storm and resulted in the aforementioned damages.
The costs associated with this incident included; an aircraft that must be grounded, repaired and inspected
(potentially a week long), a week of aircraft inoperability (lost revenue), cost of repairing the aircraft
(covered through insurance), re‐routing passengers to final destination, potential liability costs to
passengers (paid through insurance), lawsuits and negative publicity for the airline. While exact figures are
unknown, an incident of this magnitude would cost millions of dollars (Mark Spence, personal
communication, 2015).
24 | P a g e
on maintaining this record through its continued prioritization of safety. Supporting the airlines strong safety
record is knowledge gleaned from accident and incident reports that rely on archived NEXRAD data (Scott
Shipley & Mark Spence, personal communication, 2015).
Turbulence
Another priority area for Hawaiian is developing an improved understanding of convective turbulence, and in
particular a type of clear air turbulence (CAT) called transported turbulence. CAT or ‘invisible’ turbulence
occurs in the absence of clouds and therefore cannot be detected. CAT most often occurs when a cold air mass
travelling at high speed encounters a warm air mass travelling at a slower speed (Ellrod et al, 2015). In extreme
situations turbulence is severe enough to put beverage carts on the ceiling of the airplane and cause injuries or
even death to passengers (Scott Shipley, personal communication, 2015). CAT is the leading cause of
turbulence related injury, mostly owing to the fact that the crew does not have sufficient time to warn
passengers and flight attendants to take their seats and fasten their seat belts.
As a part of a NASA Small Business Innovation Research Grant, and with cooperation from Hawaiian Airlines,
WxOps developed a model to predict Clear Air Transported Turbulence (CATT). As a part of the research
process WxOps analyzed over 3000 records of NTSB air traffic accidents and incidents that occurred between
1990 – 2015 and identified 200 incidents that were caused by turbulence. From 200 turbulence incidents
WxOps utilized the NCEI archive to narrow down the incidents that were the result of CATT (10 total). By
retrospectively analyzing these transported turbulence incidents using the NCEI NEXRAD archive, WxOps
discovered a method to detect CATT. WxOps is going to present the findings of this analysis at the 2017
American Meteorological Society Annual meeting in Seattle, Washington. Meanwhile, Hawaiian Airlines will
brief the findings of this research to the FAA to determine whether this detection approach can be integrated
into their operational policy. If this research is FAA approved then it may be integrated into the Hans Manual,
potentially helping Hawaiian avoid encounters with extreme turbulence on future fights (Scott Shipley,
personal communication, 2015).
The Hans Manual
Hawaiian Airline’s operational policies and procedures are included in a private manual called the Hans
Manual. Many of the insights gleaned from retrospective analysis inform policies and procedures that are
contained in this FAA approved manual. The archive helps to inform policies and procedures that keep the
travelling public safe (Scott Shipley, personal communication, 2015). Hawaiian Airlines ranked in the top ten of
the world’s safest airlines to travel on in 2016, by AirlineRatings.com.

25 | P a g e
Archiving data
Hawaiian Airlines has been maintaining its own archive for four NEXRAD stations on the Hawaiian Islands since
2011, however does so sparingly for stations on the mainland. It is prohibitively expensive for the airline or its
service provider to archive data for all the stations, despite the fact that there are a variety of occurrences on
the mainland that are of interest to the airline. Hawaiian archives its own data on the islands for speed of
access (does not need to request data from NCEI) and self‐reliance, although feels secure knowing that the
NCEI NEXRAD archive is available as a secondary line of defense, and for all mainland stations.
In the absence of the NCEI NEXRAD archive, WxOps would have to conduct retrospective analysis based on
satellite data which would not provide the same accuracy. The archive is foundational in undertaking
retrospective analysis and providing valuable information to the airline.
Benefits of the NCEI NEXRAD archive to WxOps / Hawaiian
Trusted source; carries the emblem of the official NEXRAD archive. If there was an event where the
airlines had to prove the cause of an accident / incident they would be required to use the NCEI archive
as the official source
NCEI archive is the primary and redundant source
Last line of defense: if WxOps Hawaii archives do not properly record data or have glitches they can
rely on the NCEI NEXRAD archive
Available across the continental U.S.
Span of record: 30 years
It fits into WxOps budget because it is free. WxOps is pleased knowing that they do not have to request
that Hawaiian Airlines provide additional money to cover data access fees, making WxOps services
more reasonably priced
Shortcomings of the NCEI NEXRAD archive to WxOps / Hawaiian
Waiting time for data
Archived data did not exist for incident in Alaska:
As there are five active volcanoes on the Hawaiian islands and many other volcanoes on Hawaiian’s flight path,
the airline is particularly cautious of the danger that volcanic aerosol plumes pose to its fleet. Eruptions can
occur any time moment throughout the Pacific region, in particular along the Pacific RIM.
26 | P a g e
An incident that sparked Hawaiian’s interest in volcanic eruptions is KLM fight 867 (December 15, 1989) that
flew into a volcanic ash cloud over Alaska, U.S., the result of a Mount Redoubt eruption the day prior. As a
result of ash ingestion, all four engines lost power and the aircraft fell 14,000 feet (over two miles) in the span
of minutes. The pilot managed to re‐start the engines and land safely in Anchorage with no on‐board fatalities,
however the costs to repair the aircraft exceeded $80 million dollars and included the replacement of all four
engines (USGS, 2004).
Another aviation incident involving ash ingestion was also the result of another Mt. ReDoubt eruption in April
of 2009. As Level II data was unavailable for the Alaskan‐owned FAA NEXRAD sites for several years, data for
Alaska’s PAKC station (King Salmon, Alaska) at the time of this incident was unavailable for archiving by NCEI.
As base reflectivity can detect the presence of volcanic ash, the availability of this data would have offered a
valuable learning opportunity. In the absence of the archived NEXRAD PAKC station data, WxOps was unable
to complete a high quality forensic analysis.
27 | P a g e
5.5. Southwest Airlines
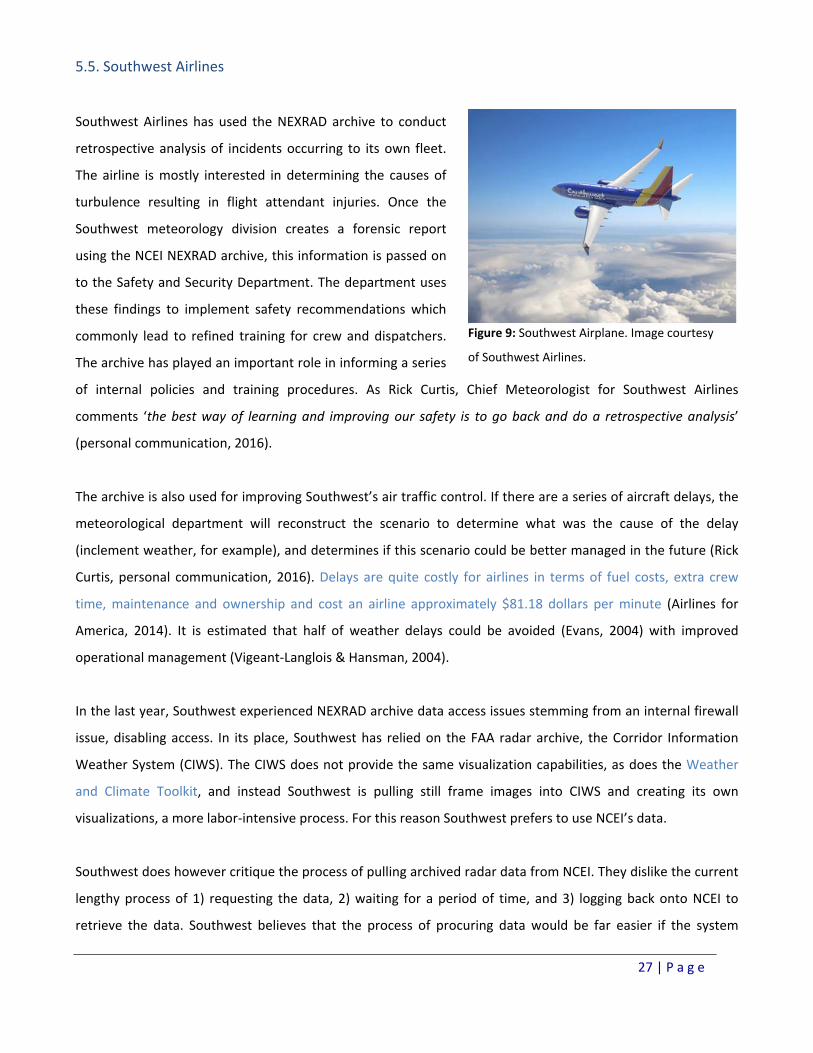
Southwest Airlines has used the NEXRAD archive to conduct
retrospective analysis of incidents occurring to its own fleet.
The airline is mostly interested in determining the causes of
turbulence resulting in flight attendant injuries. Once the
Southwest meteorology division creates a forensic report
using the NCEI NEXRAD archive, this information is passed on
to the Safety and Security Department. The department uses
these findings to implement safety recommendations which
commonly lead to refined training for crew and dispatchers.
The archive has played an important role in informing a series
of internal policies and training procedures. As Rick Curtis, Chief Meteorologist for Southwest Airlines
comments ‘the best way of learning and improving our safety is to go back and do a retrospective analysis’
(personal communication, 2016).
The archive is also used for improving Southwest’s air traffic control. If there are a series of aircraft delays, the
meteorological department will reconstruct the scenario to determine what was the cause of the delay
(inclement weather, for example), and determines if this scenario could be better managed in the future (Rick
Curtis, personal communication, 2016). Delays are quite costly for airlines in terms of fuel costs, extra crew
time, maintenance and ownership and cost an airline approximately $81.18 dollars per minute (Airlines for
America, 2014). It is estimated that half of weather delays could be avoided (Evans, 2004) with improved
operational management (Vigeant‐Langlois & Hansman, 2004).
In the last year, Southwest experienced NEXRAD archive data access issues stemming from an internal firewall
issue, disabling access. In its place, Southwest has relied on the FAA radar archive, the Corridor Information
Weather System (CIWS). The CIWS does not provide the same visualization capabilities, as does the Weather
and Climate Toolkit, and instead Southwest is pulling still frame images into CIWS and creating its own
visualizations, a more labor‐intensive process. For this reason Southwest prefers to use NCEI’s data.
Southwest does however critique the process of pulling archived radar data from NCEI. They dislike the current
lengthy process of 1) requesting the data, 2) waiting for a period of time, and 3) logging back onto NCEI to
retrieve the data. Southwest believes that the process of procuring data would be far easier if the system
Figure 9: Southwest Airplane. Image courtesy
of Southwest Airlines.

28 | P a g e
loaded the data straight away, or if NCEI emailed the data, rather than having to log on a second time to
retrieve the data, once it is ready. The availability of NEXRAD Level II data on the cloud through Amazon Web
Services, will ameliorate the previous technical difficulties that Southwest experienced. At the time of writing
Southwest had not yet accessed NEXRAD data via Amazon Web Services, although was interested in doing so
(Rick Curtis, personal communication, 2016).
29 | P a g e
6. The path forward
NEXRAD on Amazon
As an initiative under the NOAA Big Data Project, Amazon Web Services (AWS) has made NEXRAD data
available online to foster new product development and analysis. The real‐time, and historical archive of Level
II NEXRAD data, from June 1991 to present, was made available on AWS in October of 2015, for public use. The
data is available on demand and on the cloud, reducing latency and the need for individual storing capacity.
Sourcing data directly from the cloud is expected to attract new users in the aviation community, and other
sectors in general (Amazon Web Services, 2015)10.
Aviation insurance
Aviation insurance is a particular area where Hawaiian and WxOps believe that the NCEI NEXRAD archive could
provide additional and substantial cost savings. The archive could be utilized to demonstrate the level of
precautionary measures each airlines exercises to avoid potentially dangerous convective weather. This could
define premium rate structures, ensuring more substantial cost savings to safer airlines. The archive could
prove which airlines are taking a more conservative approach towards convective hazards and could therefore
be eligible for lower premiums as they pose less liability to the insurance provider (Mark Spence & Scott
Shipley, personal communication, 2015).
10 For more information about NCEI’s partnership with Amazon Web Services please visit https://www.ncdc.noaa.gov/news/partnering‐amazon‐web‐services‐big‐data
30 | P a g e
6. Conclusion
NCEI, as the official repository of NEXRAD archived data, provides an important service to airlines and public
agencies undertaking forensic analysis to understand the factors that led to an aviation incident / accident.
Such analysis are invaluable to improving the safety of airlines and protecting the sector’s bottom line through
avoided incidents / accidents. The free provision of NCEI’s data has made forensic analysis accessible and
economical for a range of analysts and has contributed to a greater public good. In the absence of a central
repository of archived weather data, forensic analysis could become prohibitively expensive, which could in
turn decrease the amount of ‘lessons learned’. This data source plays an important role for the continued
safety of air travel, and to insulate the economy’s bottom line from the economic impacts of plane crashes.
31 | P a g e
References
Airlines for America. (2014). The Airline Industry. Airlines for America. Retrieved January 26, 2016 from
<http://airlines.org>.
Amazon Web Services. (2016). NEXRAD on AWS. Retrieved Jan 22 2016, from <https://aws.amazon.com/noaa‐
big‐data/nexrad/>.
Ansari, S., & Delgreco, S. (2012). The Weather and Climate Toolkit. National Climatic Data Center. Retrieved
November 11, from <file:///Users/amandalaurarycerz/Downloads/AMS12ExtendedAbstract‐Ansari.pdf>.
Ahmad, N., & Proctor, F. (2012). Large Eddy Simulations of Severe Convection Induced Turbulence. NASA
Langley Research Center. Retrieved December 20 2015, from
<http://ntrs.nasa.gov/archive/nasa/casi.ntrs.nasa.gov/20120000925.pdf>.
Cain, D.R., & Kirkwood, P. (2004). WSR‐88D Radar FAQ’s. National Weather Service. Retrieved December 4
2015, from <http://www.srh.noaa.gov/radar/radinfo/radinfo.html>.
Ellrod, G. P., Knox, J.A., Lester, P.F., & Ehernberger, L. J. (2015.) Clear Air Turbulence. In: Gerald R. North
(editor‐in‐chief), John Pyle and Fuqing Zhang (editors). Encyclopedia of Atmospheric Science, 2nd Edition,
Academic Press, Elsevier, Inc., Vol 1, pp 177‐186.
Evans, J. (2004). Metrics/benefits for thunderstorm delay mitigation. Presentation at the NEXTOR conference
on Moving Metrics: a Performance‐Oriented View of the Aviation Infrastructure, Pacific Grove, CA.
Federal Aviation Administration (FAA) (2014). Keeping America’s Skies Safe. Retrieved January 26 2016, from
https://www.faa.gov/air_traffic/briefing/>.
Huber, M & Trapp, J. (2009). A review of NEXRAD Level II: Data, Distribution and Applications. Purdue
University. Retrieved December 5 2015, from
<http://docs.lib.purdue.edu/cgi/viewcontent.cgi?article=1042&context=jto>.
International Air Transport Association. (2014). Industry on Track for Second Year of Improving Profits – Rising
Fuel Costs Largely Offset by Increased Demand. Retrieved Feb 1 2016, from
32 | P a g e
<https://www.iata.org/pressroom/pr/Pages/2014‐03‐12‐01.aspx>.
International Civil Aviation Organization (ICAO). (2013). Model Aircraft Accident and Incident Investigation
(AIG) Regulations. Retrieved January 25 2016, from
<http://www.icao.int/safety/implementation/library/aig%20model%20aircraft%20accident%20and%20inciden
t%20investigation%20regulations%20(november%202013).pdf>
Lallanilla, M. (2014). “Air Turbulence: How Dangerous Is It?” Live Science. Retrieved Feb 1 2016, from
<http://www.livescience.com/43448‐air‐turbulence‐dangerous‐injuries.html>.
Lanicci, J., Halperin, D., Shappell, S., Hackworth, C., Holcomb, K., Bazargan, M., Baron, J., & Iden, R. (2012).
‘General Aviation Weather Encounters Case Studies’. Federal Aviation Administration. Retrieved December 8
2015, from <http://libraryonline.erau.edu/online‐full‐text/faa‐aviation‐medicine‐reports/AM12‐11.pdf>.
Massachusetts Institute of Technology Lincoln Laboratory (MITLL). (2016). ‘Air Traffic Control’. Retireved
January 13 2016 from <https://www.ll.mit.edu/mission/aviation/aviationresearch.html>.
National Oceanic and Atmospheric Administration (NOAA). (2015). ‘NOAA Next Generation Radar (NEXRAD)
Level III Products’. Retrieved January 14 2016, from
<https://data.noaa.gov/dataset/noaa‐next‐generation‐radar‐nexrad‐level‐iii‐products>.
National Transportation Safety Board (NTSB). (2015). Safety Alert ‘In‐Cockpit NEXRAD Mosaic Imagery’.
Retrieved January 5 2016, from
<http://www.ntsb.gov/safety/safety‐alerts/Documents/SA_017.pdf>.
National Transportation Safety Board (NTSB). (2014). ‘Crash of Asiana Flight 214 Accident Report Summary.
Retrieved December 15 2015, from <http://www.ntsb.gov/news/events/Pages/2014_Asiana_BMG‐
Abstract.aspx>.
National Transportation Safety Board (NTSB). (2014b). ‘NTSB Identification: DCA15CA035’. Retrieved December
15 2015, from
<http://www.ntsb.gov/_layouts/ntsb.aviation/brief.aspx?ev_id=20141211X62917&key=1>.
33 | P a g e
National Transportation Safety Board (NTSB). (2013). Crash Following Encounter with Instrument
Meteorological Conditions After Departure from Remote Landing Site. Retrieved January 20 2016, from
<http://www.ntsb.gov/investigations/AccidentReports/Reports/AAR1403.pdf>.
National Transportation Safety Board (NTSB). (2013b). Group Chairman’s Factual Report. Meteorology
ANC13GA036. Retrieved January 22 2016, from
<file:///Users/amandalaurarycerz/Downloads/ANC13GA036_weatherfactualSuffernfinal.pdf>.
National Transportation Safety Board (NTSB). (2004). Annual Report to Congress. Retrieved December 12 2015,
from <http://www.ntsb.gov/about/Documents/SPC0901.pdf>.
National Transportation Safety Board Office of Public Affairs (NTSB Public Affairs). (2014). “NTSB Press Release:
Alaska DPS Helicopter Crash Cause by Flight Into Bad Weather and Department’s “Punitive Culture”. Retrieved
January 12 2015, from
<http://www.ntsb.gov/news/press‐releases/Pages/PR20141105.aspx>.
NOAA’s National Centers for Environmental Information (NCEI). (2016). ‘Radar Data.’ Webpage. Retrieved
January 11 2016, from < https://www.ncdc.noaa.gov/data‐access/radar‐data/nexrad‐products>.
NOAA’s National Severe Storms Laboratory (NSSL). (2016). Severe Weather 101: Thunderstorm Basics.
Retrieved December 6 2015, from <http://www.nssl.noaa.gov/education/svrwx101/thunderstorms/>.
NOAA’s National Weather Service (NWS). (2010). JetStream – Online School for Weather. Retrieved Feb 1 2015,
from <http://www.srh.noaa.gov/jetstream/doppler/comprefl.htm>.
NOAA’s National Weather Service (NWS). (2010b). Heat Transfer. Retrieved Feb 23 2015 from,
<http://www.srh.noaa.gov/crp/?n=education‐heattransfer>.
Ropeik, D. (2006). ‘How Risky is Flying’. Public Broadcasting Service. Retrieved January 22 2016, from
<http://www.pbs.org/wgbh/nova/space/how‐risky‐is‐flying.html>.
Skow, K. (2013). NWS WSR‐88 Radar Fundamentals. National Weather Service. Retrieved on January 12 2016,
from <http://www.meteor.iastate.edu/classes/mt432/lectures/ISURadarTalk_NWS_2013.pdf>.
34 | P a g e
U.S Geological Survey (USGS). (2004). ‘Volcanic Ash Danger to Aircraft in the North Pacific’. Retrieved January
26 2016, from <http://pubs.usgs.gov/fs/fs030‐97/>.
Vigeant‐Langlois, L., & Hansman, J.R. (2004). Human Centered Systems Analysis of Aircraft Separation from
Adverse Weather. MIT International Center for Air Transportation. Retrieved January 12, from
<http://hdl.handle.net/1721.1/17833>.
Interviews
Scott Shipley, CIO of WxOps Inc., 12/2015
Mark Spence, CEO of WxOps Inc., & Former Manager of Dispatch at Hawaiian Airlines, 12/2015
Al Peterlin, COO of WxOps Inc., 12/2015
Rick Curtis, Chief Meteorologist for Southwest Airlines, 01/2016
Paul Suffern, Senior Meteorologist Investigator, National Transportation Safety Board, 01/2016
John Lanicci, Professor of Meteorology, Embry‐Riddle Aeronautical University, 01/2016