succeeding in the age of mobile...
TRANSCRIPT
Department of Technology Management and Economics
Division of Science, Technology and Society
CHALMERS UNIVERSITY OF TECHNOLOGY
Gothenburg, Sweden 2016
Report No. E2016:112
Succeeding in the Age of
Mobile Data
A Study of the Indonesian Telecom Industry Master’s Thesis in Management and Economics of Innovation
THERESE BLUM
ROBERT KAJSJÖ

MASTER’S THESIS E2016:112
Succeeding in the Age of Mobile Data
A Study of the Indonesian Telecom Industry
THERESE BLUM
ROBERT KAJSJÖ
Tutor: Erik Bohlin
Department of Technology Management and Economics
Division of Science, Technology and Society
CHALMERS UNIVERSITY OF TECHNOLOGY
Gothenburg, Sweden 2016

Succeeding in the Age of Mobile Data
A Study of the Indonesian Telecom Industry
Master’s Thesis in M.Sc. Management and Economics of Innovation
THERESE BLUM
ROBERT KAJSJÖ
© 2016 THERESE BLUM & ROBERT KAJSJÖ
Master’s Thesis E2016:112
Department of Technology Management and Economics
Division of Science, Technology and Society
Chalmers University of Technology
SE-412 96 Gothenburg, Sweden
Telephone: +46 (0)31-772 1000
Chalmers Reproservice
Gothenburg, Sweden 2016

Abstract Mobile network operators (MNOs) in Indonesia are currently facing some major challenges as
consumer preferences are changing. Revenue streams from legacy services such as mobile
voice and SMS are on a downward trajectory, while the demand for data is soaring. The
Indonesian MNOs have experienced challenges when trying to shift focus to monetize mobile
data instead of legacy services, making data less profitable. This study maps out the
Indonesian telecom industry and explores options for how the MNOs can innovate their
business models to monetize mobile data better.
The competitive situation is different depending on what geographical area you consider.
Outside Java there is mainly one dominant player, while Java is characterized by intense
competition, making the average profitability lower. The lower profitability is explained by
the five forces framework. Three out of five forces are strong on the Indonesian market:
rivalry among incumbent firms, bargaining power of buyers, and threat of substitutes. For the
average profitability to increase, consolidation is necessary. However, the high customer
churn rates and the spectrum policy, lowers the incentives for consolidation.
To monetize mobile data better the MNOs need to circumvent some country specific factors
while elaborating on others. The Indonesian population is very price sensitive, wherewith it is
hard to make them pay a sufficient amount for data. It is therefore necessary for the MNOs to
redefine the customer to include others than the end consumer to collect the potential value on
the market. This can be done by elaborating on the country’s liberate regulations concerning
net neutrality. Moreover, the Indonesian MNOs need to find ways to differentiate; either by
being a provider of connectivity, using the quality of the network as the main selling point, or
by being a provider of a digital ecosystem, where connectivity serves as means to an end
rather than the end itself. The biggest difference between the strategies is that the MNOs
choosing the latter would need to pursue two business models simultaneously, relying on
ambidexterity within the organization.
Keywords: Mobile network operator, Indonesia, Telecom, Business model innovation,
Industry analysis.
Acknowledgements The writing of this thesis had not been possible without the cooperation of the people we had.
First of all, we would like to send our special thanks to professor Erik Bohlin, our supervisor
at Chalmers, who has been an invaluable help during the way and invested a lot of time to
help us set up and guide us through this project. Writing the thesis in Indonesia would not
have happened without his help. Secondly, we would like to send our gratitude to Dedy
Sushandoyo, our supervisor at ITB in Indonesia, as well as Gunnar Borg and Laili Aidi at
Ericsson Indonesia. They have all offered us their time and most valuable advices and
opinions, and it is because of those people we have had the opportunity to meet with the
people we did.
Additionally, the thesis would never have been possible without the sponsors we had.
Therefore, we would like to thank Sida and Sverker Arlänge, who helped us through the
whole application process.
Moreover, we would like to send our thanks to all the people who offered their time and
expertise to help us get an understanding of the Indonesian Telecom market:
Dr. Sigit Haryadi
Dr. Rony Bishry
I Ketut Prihadi
Dr. Huhammad Ridwan Effendi
Jhon Welly
Anthony Houlahan
Hadi Wijaya
Ameet Suri
John M. Thompson
Michael Foo
Lastly, we would like to send a big thank you to all the people who have supported us by any
means during the study. It would have been very hard to manage without you and we are
sincerely thankful!
Gothenburg, September 2016
Therese Blum and Robert Kajsjö
Abbreviations ARPU Average revenue per user
BOP Base of the pyramid, the world’s population living on under $2 per day.
BRTI Badan Regulasi Telekomunikasi Indonesia, Indonesian Telecommunications
Regulatory Body.
BTS Base transceiver station, a fixed-location transceiver that provides the cell in a
cellular network with its network coverage.
ICT Information and communication technology
IoT Internet of Things
ITB Institut Teknologi Bandung, University in Bandung, Indonesia.
MNC Multinational corporation
MNO Mobile network operator
MOCN Multi operator core network
OTT Over-the-top content, the delivery of media, such as audio and video, over the
internet without the involvement of a mobile network operator.
QoE Quality of experience
QoS Quality of service
VAS Value-added services
VoIP Voice over internet protocol

Table of Contents
1. Background .................................................................................................................................... 1
1.2 Purpose and Research Questions ................................................................................................... 1 1.3 Delimitations .......................................................................................................................................... 2 1.4 Report Outline ....................................................................................................................................... 2
2. Theoretical Framework............................................................................................................. 3
2.1 The Five Forces Framework ............................................................................................................. 3 2.1.1 Rivalry Among Existing Competitors ....................................................................................................4 2.1.2 Threat of New Entrants ...............................................................................................................................4 2.1.3 Threat of Substitute Products or Services ...........................................................................................5 2.1.4 Bargaining Power of Suppliers .................................................................................................................5 2.1.5 Bargaining Power of Buyers ......................................................................................................................6
2.1.6 Critic and Implications .................................................................................................................................6 2.2 Macro-environmental Factors and the PEST Framework ..................................................... 6 2.3 The Base of the Pyramid .................................................................................................................... 7 2.4 Business Model Innovation ............................................................................................................. 10
3. Method ........................................................................................................................................... 12
3.1 Research Process ................................................................................................................................ 12 3.2 Data collection ..................................................................................................................................... 13
3.2.1 Literature Review........................................................................................................................................ 13 3.2.2 Semi-structured Interviews .................................................................................................................... 13
3.3 Research Quality ................................................................................................................................. 15
4. Introducing the Telecom Industry ....................................................................................... 18 4.1 The ICT Ecosystem ............................................................................................................................. 18 4.2 Cellular Technology ........................................................................................................................... 19 4.3 The State of the Global Telecom Industry ................................................................................. 21
4.3.1 The Shift to Mobile Data ........................................................................................................................... 21 4.3.2 The Net Neutrality Debate ....................................................................................................................... 22
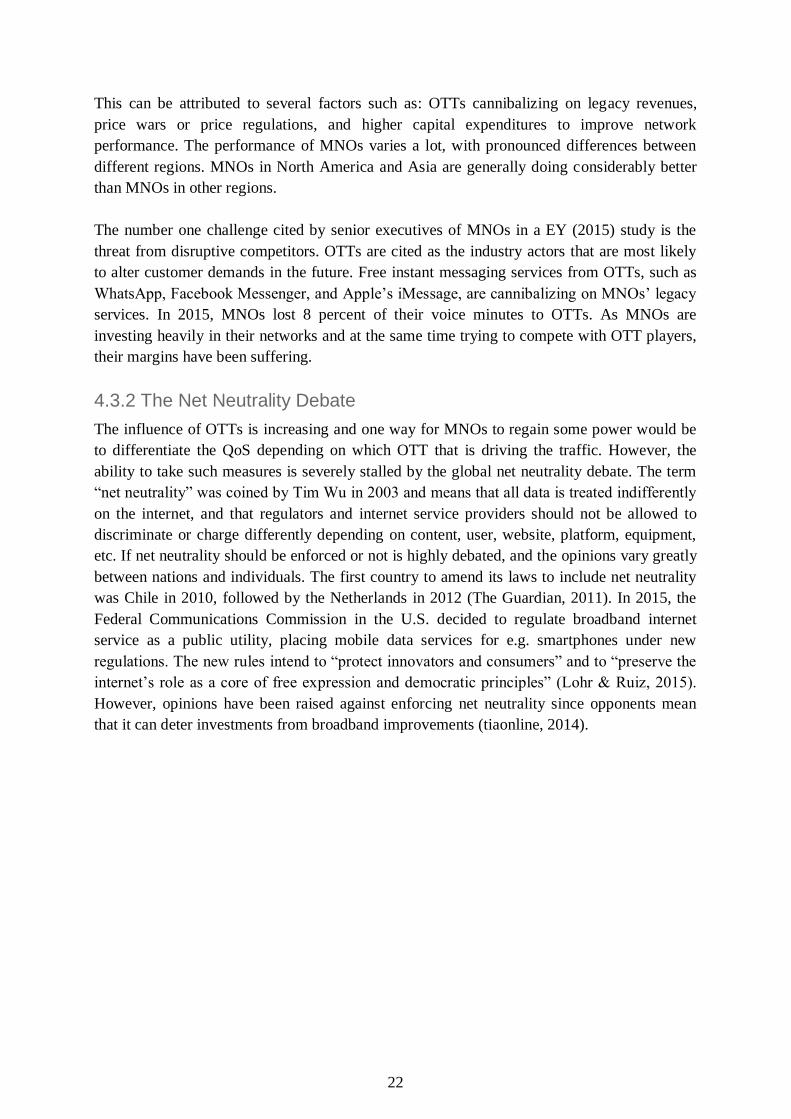
5. The Indonesian Mobile Telecom Landscape .................................................................... 23
5.1 The Indonesian Telecom Industry ............................................................................................... 23 5.1 Macro-environmental Context ...................................................................................................... 26
5.1.1 Political Factors ............................................................................................................................................ 26 5.1.2 Economical Factors .................................................................................................................................... 29 5.1.3 Social Factors ................................................................................................................................................ 30 5.1.4 Technological Factors................................................................................................................................ 32
5.2 Competitive Environment ............................................................................................................... 33 5.2.1 High Rivalry Among Incumbent Firms .............................................................................................. 35 5.2.2 Low Threat of New Entrants .................................................................................................................. 37 5.2.3 Low Bargaining Power of Suppliers .................................................................................................... 37 5.2.4 High Bargaining Power of Buyers ........................................................................................................ 38
5.2.5 High Threat of Substituting Services .................................................................................................. 39 5.3 Current Business Model ................................................................................................................... 40
5.3.1 Key competencies/ Success factors..................................................................................................... 41 5.3.2 Value Creation............................................................................................................................................... 42 5.3.3 Operations Efficiency ................................................................................................................................. 42 5.3.4 Organizational Context ............................................................................................................................. 43
6. Data Monetization Strategies ................................................................................................ 44
6.1 Partnerships ......................................................................................................................................... 44 6.2 Core Services ........................................................................................................................................ 45
6.2.1 Network Investments ................................................................................................................................ 45 6.2.2 Big Data and Analytics............................................................................................................................... 47 6.2.3 Digitization ..................................................................................................................................................... 47
6.3 Pricing Strategies................................................................................................................................ 48 6.3.1 Starter packages & Unlimited Data ..................................................................................................... 48 6.3.2 Differentiation Among Offerings .......................................................................................................... 49 6.3.3 Sponsored Data & Zero-rating ............................................................................................................... 49 6.3.4 Mobile Advertising...................................................................................................................................... 50 6.4 Value-Added Services .................................................................................................................................... 50 6.4.1 Mobile Commerce ....................................................................................................................................... 51 6.4.2 Video and Content ....................................................................................................................................... 51
7. Business Models for Mobile Data ......................................................................................... 53
7.1 Improving the Business Model ...................................................................................................... 53 7.1.1 Value Proposition ........................................................................................................................................ 53 7.1.2 Customers & Revenue ............................................................................................................................... 54 7.1.3 Channels & Customer Relationship ..................................................................................................... 56 7.1.4 Key Partners .................................................................................................................................................. 56 7.1.5 Key Activities & Key Resources ............................................................................................................. 57
7.2 Differentiation ..................................................................................................................................... 59 7.2.1 Differentiating on Network Performance ......................................................................................... 59 7.2.2 Differentiating on Value-added Services .......................................................................................... 61
7.3 Tapping into the BOP Segment ...................................................................................................... 64
8. Conclusion .................................................................................................................................... 66
Bibliography ..................................................................................................................................... 69
Table of Figures
FIGURE 1. THE FIVE FORCES FRAMEWORK PRESENTED BY PORTER (1980). ..........................................................................................3 FIGURE 2. THE PEST FRAMEWORK, ...............................................................................................................................................................7 FIGURE 3. THE MODEL FOR BOP TECHNOLOGY ADOPTION PRESENTED BY NAKATA & WEIDNER (2012). .................................... 10 FIGURE 4. THE BUSINESS MODEL CANVAS AS DESCRIBED BY OSTERWALDER (2004). ...................................................................... 11 FIGURE 5. A SCHEMATIC PICTURE OF THE ICT ECOSYSTEM AS DESCRIBED BY FRANSMAN (2010). ................................................. 18 FIGURE 6. A SCHEMATIC PICTURE SHOWING THE BASICS OF A CELLULAR NETWORK (ITU, 2011). .................................................. 20 FIGURE 7. NUMBER OF SUBSCRIBERS IN INDONESIA DIVIDED ON THE THREE LARGEST MNOS. ........................................................ 23 FIGURE 8. THE PERCENTAGE OF POSTPAID SUBSCRIPTION AT THE THREE LARGEST INDONESIAN MNOS. ...................................... 24 FIGURE 9. THE BLENDED ARPU OF THE THREE LARGEST INDONESIAN MNOS. .................................................................................. 25 FIGURE 10. EBIT OF THE THREE LARGEST INDONESIAN MNOS. ........................................................................................................... 25 FIGURE 11. A SUMMARY OF THE PEST FACTORS INFLUENCING THE INDONESIAN TELECOM MARKET. ............................................ 26 FIGURE 12. THE CURRENT BUSINESS MODEL OF THE INDONESIAN MNOS. .......................................................................................... 40 FIGURE 13. HOW SCALE INFLUENCES THE PERFORMANCE OF MNOS. ................................................................................................... 41 FIGURE 14. AN EXAMPLE OF AN AMBIDEXTROUS DIVISION OF THE ORGANIZATION. ............................................................................ 62
Table of Tables TABLE 1. A SUMMARY OF HOW THE COMPETITIVE FORCES INFLUENCE THE INDONESIAN TELECOM INDUSTRY.............................. 35 TABLE 2. A SUMMARY OF THE INITIATIVES TAKEN BY INDONESIAN MNOS. ......................................................................................... 44 TABLE 3. PICTURE THE SCOPE OF THE DIFFERENT BUSINESS UNITS AS DESCRIBED BY O’REILLY AND TUSHMAN (2004). .......... 63
1
1. Background Mobile network operators (MNOs) are currently facing major challenges around the world as
their legacy revenues from fixed-line telephony, mobile voice, and SMS are on a downward
trajectory. Since the advent of the smartphone, these services are gradually being replaced by
instant messaging and voice over IP (VoIP) services offered by OTT (over-the-top content)
providers. Smartphone adoption has also fueled a massive increase in mobile data. This poses
a significant opportunity for MNOs, as the demand for their networks is higher than ever
before and keeps on growing. Unfortunately, MNO revenues have not seen a corresponding
increase, as mobile data has proved significantly harder to monetize well. At the same time,
investment costs for network upgrades are high to meet demand. Many regard the current
business models of MNOs as outdated; that is has to be adapted to better suit this new data
centric environment.
Indonesia is the fourth biggest telecom market in the world and is an interesting market due to
its special geographical situation with 17,000 islands, which makes investments in
infrastructure challenging (Fife, 2015). It is expensive to provide fixed broadband connections
to great parts of the country. Thus, the fixed broadband infrastructure is highly
underdeveloped and as of 2015, there were only 11 million fixed lines in Indonesia. An
implication of this is that mobile internet has become significantly more important than in
other countries and today the great majority of internet access is achieved through mobile
subscriptions. However, even if mobile internet plays an important role in the Indonesian
society, almost all MNOs in the country are having trouble with their profitability. Without
improved profitability and sustainable business models, it will be hard for MNOs to make the
necessary investments to provide Indonesia’s 250 million inhabitants with connectivity.
The Indonesian MNOs are faced with substantial challenges related to data consumption, of
which one is the average revenue per user (ARPU), which is among the lowest in the world
(Fife, 2015). As a market with many players and low customer loyalty, MNOs have
historically been pushing prices down to attract and retain customers. However, when doing
so, they have at the same time managed to create a problematic situation for themselves,
where they have impaired their opportunities to reach profitability on data. As the legacy
business decreases, Indonesian MNOs will need to change the way they operate and adapt
their business models to make it possible to monetize the increased data usage. How this can
be done will be examined in this study.
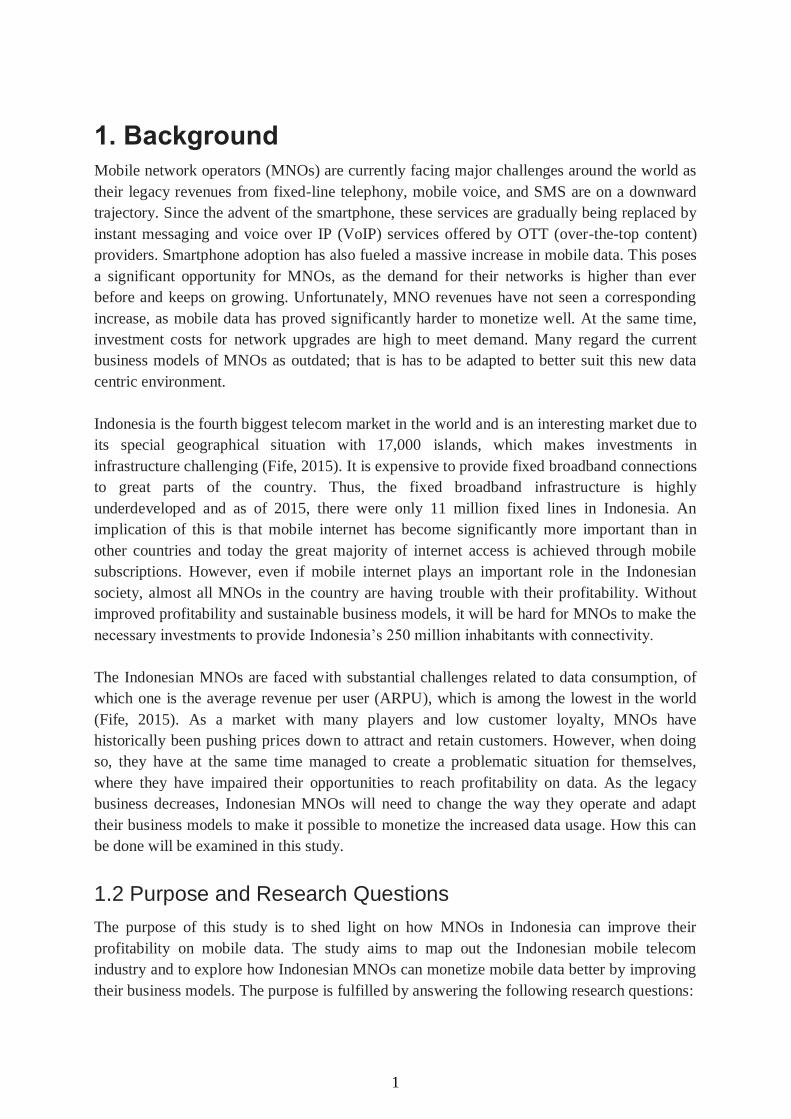
1.2 Purpose and Research Questions
The purpose of this study is to shed light on how MNOs in Indonesia can improve their
profitability on mobile data. The study aims to map out the Indonesian mobile telecom
industry and to explore how Indonesian MNOs can monetize mobile data better by improving
their business models. The purpose is fulfilled by answering the following research questions:

2
RQ1: How is the competitive situation structured in the Indonesian mobile telecom industry?
RQ2: How can the business model of Indonesian MNOs be improved to monetize data better?
RQ3: What are the implications and challenges with those business models?
1.3 Delimitations
Even if the study provides suggestions for how the MNOs can alter their business models, it
does not give advice on how this can be pursued practically.
The study does not aim to find opportunities to increase profitability that do not relate to
mobile internet, even if there exist promising areas in other industries.
The study is not looking into specifics within the different MNOs and the report is therefore
written on a very general level. Thus, the suggestions given are not directed towards one
MNO even though some things might be better suited for specific actors.
1.4 Report Outline
Chapter 2 presents the theoretical framework used to structure the industry analysis. The
chapter presents the five forces framework, macro-environmental factors, the base of the
pyramid, and business model innovation.
Chapter 3 describes the method used to conduct the study. It introduces the research process
and data collection, and evaluates the research quality.
Chapter 4 gives the unacquainted telecom reader an introduction to the telecom industry in
general. The reader gets to know the different actors, the basics of the technology, and
challenges currently present in the industry.
Chapter 5 presents the Indonesian telecom industry. Structured by the framework presented in
Chapter 2, the macro-environmental factors influencing the industry are presented together
with the competitive situation and current business model of the MNOs.
Chapter 6 describes current strategies employed by the Indonesian MNOs to monetize mobile
data. The strategies are divided into core business, pricing strategies, and value-added
services.
Chapter 7 gives alternatives to how the business model of the Indonesian MNOs can be
constructed and discusses challenges and implications with such alterations.
Chapter 8 summarizes the findings by answering the research questions.

3
2. Theoretical Framework This chapter introduces the theoretical frameworks that will be used to analyze the Indonesian
telecom market. It includes the five forces framework, macro-environmental factors, base of
the pyramid, and business model innovation.
2.1 The Five Forces Framework
Introduced by Porter in 1980, the five forces framework is a tool for analyzing the external
environment that a company operates in. More specifically, it describes the prevailing
competitive situation of an industry, by considering how the created economic value in the
industry is appropriated between different actors. The framework claims to explain why the
average profitability varies between different industries. The five forces that make up the
framework are: rivalry among existing competitors, threat of new entrants, threat of
substitutes products or services, bargaining power of suppliers, and bargaining power of
buyers. If one or more of the forces are strong, that will imply that industry profitability is
lower than it would have been otherwise. According to Porter (1998), companies should try to
attain a competitive advantage by finding an optimal market position that considers the five
forces and make them work to their favor. The five forces framework is illustrated in figure 1.
Figure 1. The five forces framework presented by Porter (1980).

4
2.1.1 Rivalry Among Existing Competitors
Porter (1998) argues that the strength of industry rivalry is a result of both the intensity of
competition and the basis of competition. A high intensity of competition occurs when:
There are many companies in the industry, which are equal in size and power.
The industry is mature, which results in companies trying to steal market share from
each other.
There are high barriers to exit the industry. This means that poor performing
companies remain in the competition with the implication that the overall industry has
more capacity than needed.
The competitors have aspirations of becoming industry leaders.
The industry rivalry can also be said to be high if the competition is based mainly on price, or
if the competitive dimension is the same between the actors. If the primary dimension of
competition is based on price, it will make industry profitability suffer the most. A higher
probability of price competition happens when:
The industry companies have similar products and the switching costs between them
are low.
Fixed costs are high relative to variable costs.
Efficiency can only be achieved when the capacity must be increased in big
incremental steps.
The offered products decrease fast in value when not sold.
Competition based on other dimensions than price is not as likely to be harmful to
profitability since it increases the value for customers and allows companies to charge a
higher price. However, if companies do not compete on price, but instead compete on the
same other dimensions, profitability will suffer. Thus, profitability is likely to be highest
when companies compete on different dimensions and serve different markets segments with
different needs.
2.1.2 Threat of New Entrants
If it is easy for new companies to enter an industry, it is likely that incumbent firms will have
to lower their prices to prevent this from happening. They might also have to increase their
investments to make it more difficult to compete. According to Porter (2008), the threat of
new entrants depends on how high the entry barriers are and the expected retaliation from
incumbent firms. He identified seven major entry barriers:
1. Supply-side economies of scale. If a company produces high volumes of their product, they
will be able to spread their fixed costs over a larger number of units, resulting in a lower unit
cost. They might also be able to arrange better terms with their suppliers. In this case, new
5
entrants must either enter with a cost disadvantage or enter the industry with high volumes
immediately.
2. Demand-side benefits of scale. This occurs when a product becomes more valuable to
customers as larger volumes are sold, something also known as network effects. Customers
will thus have a lower willingness to pay for new entrant products compared to those of
incumbent firms.
3. Customer switching costs. These are the costs that customers incur when changing supplier.
4. Capital requirements. In some industries, a lot of capital is necessary to enter.
5. Incumbency advantages independent of size. These advantages can be proprietary
technology, access to the best sources of raw material, best geographic locations, high brand
equity, or experience.
6. Unequal access to distribution channels. If existing distribution channels are limited or
already occupied by incumbents, access will be hard and the new entrant might have to
establish new distribution channels.
7. Restrictive government policy. This can enhance the other entry barriers and also make it
harder for new entrants through industry regulations.
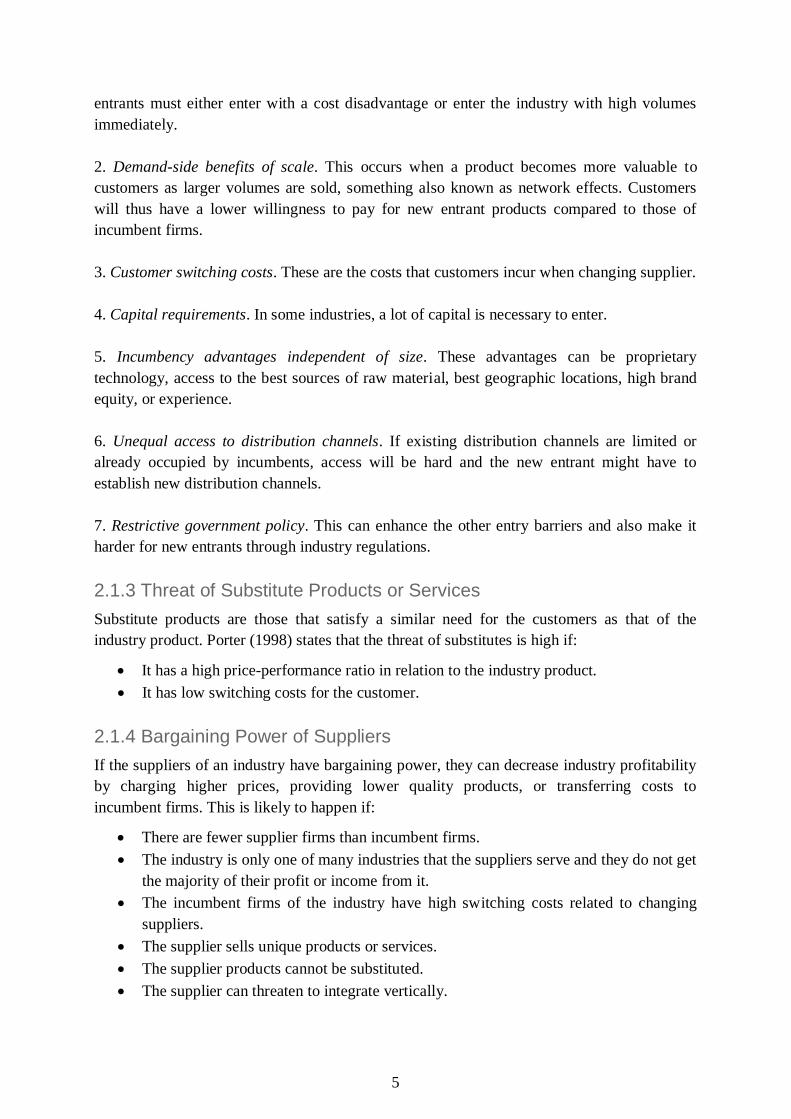
2.1.3 Threat of Substitute Products or Services
Substitute products are those that satisfy a similar need for the customers as that of the
industry product. Porter (1998) states that the threat of substitutes is high if:
It has a high price-performance ratio in relation to the industry product.
It has low switching costs for the customer.
2.1.4 Bargaining Power of Suppliers
If the suppliers of an industry have bargaining power, they can decrease industry profitability
by charging higher prices, providing lower quality products, or transferring costs to
incumbent firms. This is likely to happen if:
There are fewer supplier firms than incumbent firms.
The industry is only one of many industries that the suppliers serve and they do not get
the majority of their profit or income from it.
The incumbent firms of the industry have high switching costs related to changing
suppliers.
The supplier sells unique products or services.
The supplier products cannot be substituted.
The supplier can threaten to integrate vertically.
6
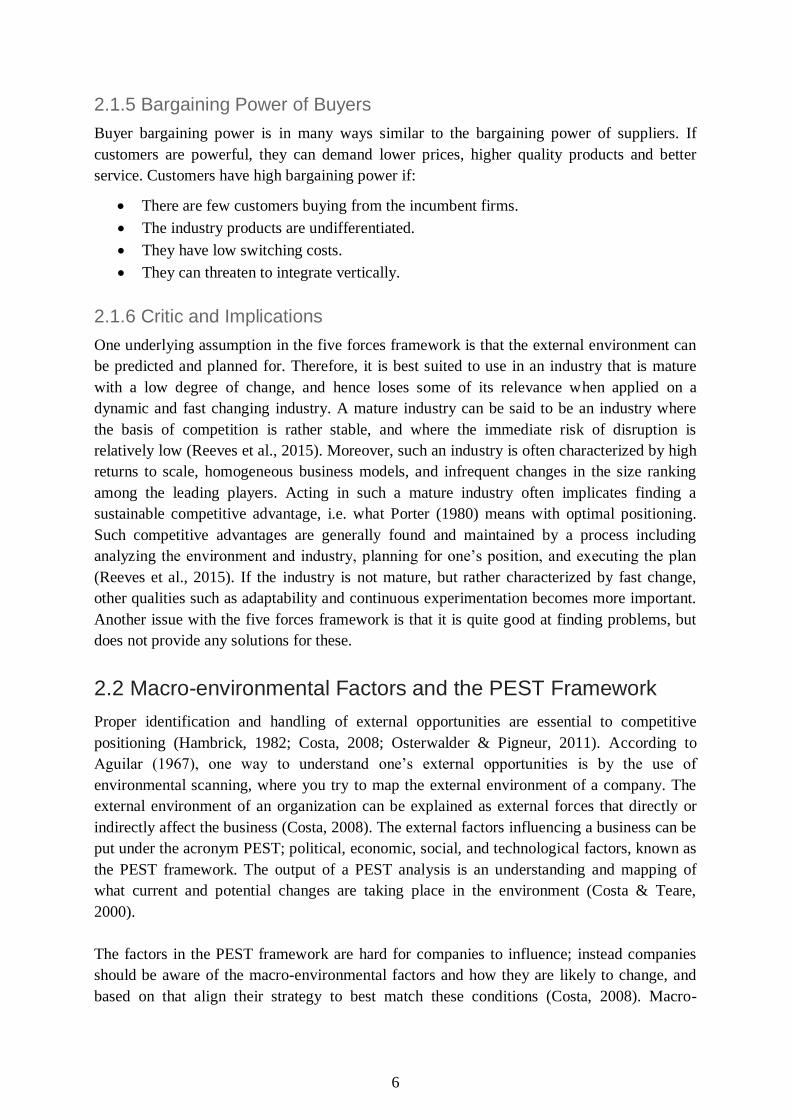
2.1.5 Bargaining Power of Buyers
Buyer bargaining power is in many ways similar to the bargaining power of suppliers. If
customers are powerful, they can demand lower prices, higher quality products and better
service. Customers have high bargaining power if:
There are few customers buying from the incumbent firms.
The industry products are undifferentiated.
They have low switching costs.
They can threaten to integrate vertically.
2.1.6 Critic and Implications
One underlying assumption in the five forces framework is that the external environment can
be predicted and planned for. Therefore, it is best suited to use in an industry that is mature
with a low degree of change, and hence loses some of its relevance when applied on a
dynamic and fast changing industry. A mature industry can be said to be an industry where
the basis of competition is rather stable, and where the immediate risk of disruption is
relatively low (Reeves et al., 2015). Moreover, such an industry is often characterized by high
returns to scale, homogeneous business models, and infrequent changes in the size ranking
among the leading players. Acting in such a mature industry often implicates finding a
sustainable competitive advantage, i.e. what Porter (1980) means with optimal positioning.
Such competitive advantages are generally found and maintained by a process including
analyzing the environment and industry, planning for one’s position, and executing the plan
(Reeves et al., 2015). If the industry is not mature, but rather characterized by fast change,
other qualities such as adaptability and continuous experimentation becomes more important.
Another issue with the five forces framework is that it is quite good at finding problems, but
does not provide any solutions for these.
2.2 Macro-environmental Factors and the PEST Framework
Proper identification and handling of external opportunities are essential to competitive
positioning (Hambrick, 1982; Costa, 2008; Osterwalder & Pigneur, 2011). According to
Aguilar (1967), one way to understand one’s external opportunities is by the use of
environmental scanning, where you try to map the external environment of a company. The
external environment of an organization can be explained as external forces that directly or
indirectly affect the business (Costa, 2008). The external factors influencing a business can be
put under the acronym PEST; political, economic, social, and technological factors, known as
the PEST framework. The output of a PEST analysis is an understanding and mapping of
what current and potential changes are taking place in the environment (Costa & Teare,
2000).
The factors in the PEST framework are hard for companies to influence; instead companies
should be aware of the macro-environmental factors and how they are likely to change, and
based on that align their strategy to best match these conditions (Costa, 2008). Macro-
7
environmental factors usually differ between countries, meaning that a PEST analysis ought
to be conducted on a specific country. As these factors are subject to continuous change, a
PEST analysis is only valid for a given point in time since it might quickly become outdated.
Political factors in the PEST framework include policies and regulations set by the
government, which hinder or enable the companies to act (Arline, 2014). This can include
things like tax, trade, and safety regulations, copyright and property law enforcement, and
employment laws, but also the general political stability in the country. Economic factors are
elements in the economy that can influence how companies operate. Such elements could be
economic growth and GDP, inflation, interest rates, rate of unemployment, number of
consumers, and the general poverty level of the country (Arline, 2014). Social factors are the
demographics and opinions of the population, while technological factors concern
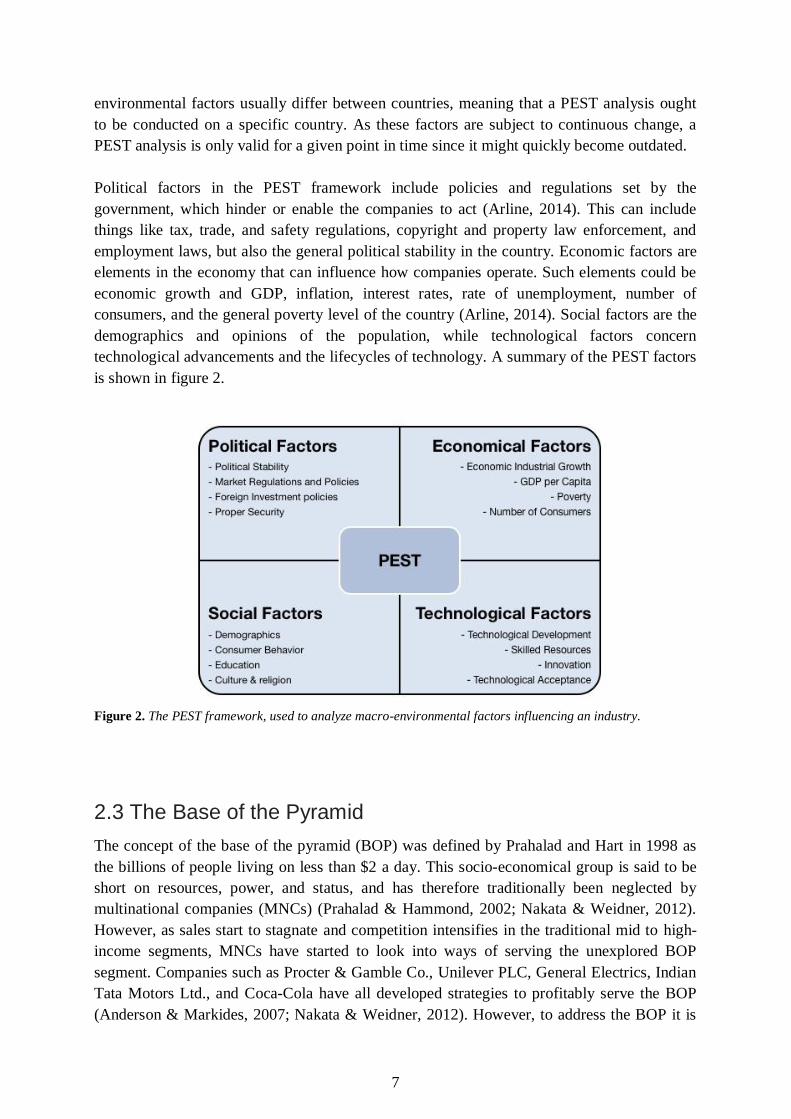
technological advancements and the lifecycles of technology. A summary of the PEST factors
is shown in figure 2.
Figure 2. The PEST framework, used to analyze macro-environmental factors influencing an industry.
2.3 The Base of the Pyramid
The concept of the base of the pyramid (BOP) was defined by Prahalad and Hart in 1998 as
the billions of people living on less than $2 a day. This socio-economical group is said to be
short on resources, power, and status, and has therefore traditionally been neglected by
multinational companies (MNCs) (Prahalad & Hammond, 2002; Nakata & Weidner, 2012).
However, as sales start to stagnate and competition intensifies in the traditional mid to high-
income segments, MNCs have started to look into ways of serving the unexplored BOP
segment. Companies such as Procter & Gamble Co., Unilever PLC, General Electrics, Indian
Tata Motors Ltd., and Coca-Cola have all developed strategies to profitably serve the BOP
(Anderson & Markides, 2007; Nakata & Weidner, 2012). However, to address the BOP it is

8
recognized that companies must adopt strategies that suit this unique segment; offering a
lower quality, cheaper product is not enough to attract buyers and diffuse the technology
(Prahalad & Hammond, 2002; Anderson & Markides, 2007; Nakata & Weidner, 2012).
To develop successful business opportunities and business strategies in the BOP segment,
Nakata and Weidner (2012) mean that managers need to understand the segment and the
unique conditions surrounding it. Building upon Rogers’ diffusion theories from 1962 and
Sen’s theories on poverty from 1999, Nakata and Weidner (2012) developed a conceptual
framework of how the BOP segment accepts new products.
Rogers (2003) theories try to explain why and how innovations are adopted in a social system.
He finds that there is four main elements influencing the adoption of an innovation: the
innovation itself, communication channels, time, and social system. When looking at the
product or innovation itself, there are five characteristics affecting the adoption: if the
innovation has a relative advantage compared to existing solutions; if it is compatible with the
norms and values of the social system; if it has a low degree of complexity; if it is easy to try
before adoption; and if the benefits are observable to potential adopters. Information about the
innovation is spread through communication channels, which can be both mass media and
personal relationships (Rogers, 2003). Mass media communication channels are said to be
more effective when trying to increase the awareness of a product, while personal
relationships are more effective in changing predominant attitudes. Rogers (2003) states that
the majority of actors in a social system will not adopt an innovation based on the information
from experts, but instead based on recommendations from their near peers. The social context
is made up by the norms shared by individuals and can affect the diffusion of an innovation
by either encouraging or dissuading it (Rogers, 2003). In their model, Nakata and Weidner
(2012) choose to look at factors such as the collective need for a product, the social capital in
a community, and the assimilationist culture, as social context variables that influence
adoption behaviors of the poor. Moreover, they alter the characteristics of the product itself to
also include affordability.
Sen (2001) argues that poverty is not necessarily the lack of money, but the lack of any of the
determinants giving human freedom. Examples of such determinants are social and economic
arrangements, such as health care and education, and political and civil rights, such as liberty
to take part in public discussions (Sen, 2001). Nakata and Weidner (2012) develops Sen’s
(2001) theories and characterize poverty as economic, physical, psychosocial, and knowledge
deprivations. Economic deprivation is probably the most obvious poverty parameter and
means the lack of economical means. Physical deprivation can often be derived from the
economic deprivation since the lack of money makes it hard to pay for health care, proper
housing, food, etc. Psychosocial deprivation includes the constant stress and anxiety of poor
people living in a continuous fear of their health or losing a job. Knowledge deprivation
comes from the lack of education, which can influence mindsets and the possibility to take
part in the society (Nakata & Weidner, 2012).
9
Nakata and Weidner (2012) combine the theories by treating Rogers diffusion parameters as
enablers to adoption while seeing the poverty parameters as barriers to adoption (see figure
3). Hence, economic, physical, psychosocial, and knowledge deprivation are all factors that
reduce the likelihood of adoption, slow the diffusion process, and make the individual stop the
adoption process before they actually acquire the product. I.e. the poverty variables put
products outside the reach by making them less important compared to issues such as eating.
The factors put forward by Rogers (2003) are said to weaken or moderate the negative
relationship between poverty and adoption (Nakata & Weidner, 2012). If a product is
affordable the likelihood of adoption goes up (Anderson & Markides, 2007). Affordability
does not necessarily have to be bottom-of-the-barrel pricing as the BOP segment often are
requiring good quality, however it still has to be lower than for mid and high end consumers.
The visual comprehensibility of a product and its packaging assists product identification, the
selection process, and understanding, and gets especially important for the adoption where the
ability to read is low. If a product is adapted and well-functioning in the areas and
environment where the BOP lives, the likelihood of adoption, and thus product diffusion, goes
up. The relative advantage is one of the most important factors to enhance adoption (Rogers,
2003) and in the case of poverty it especially refers to how well the product help the BOP
segment overcome the identified deprivations (Nakata & Weidner, 2012). The compatibility
factor explains, in the context of poverty, that if a product is compatible with existing
consumption behaviors of the BOP, the chance of adoption is increased.
The social context can influence adoption behavior in the way societies organize and interact.
A society with a high social capital, i.e. norms, networks, and trust that can increase
efficiency by facilitating coordinated actions, are more likely to learn from each other and
influence each other’s purchase behaviors (Nakata & Weidner, 2012). Ireland (2008)
observed that poor families in Venezuela chose to subscribe to expensive TV subscription
services as a collective. By sharing one subscription between many families they managed to
afford a service otherwise outside their reach. This is an example of how a collective need can
enhance the adoption among BOP consumers (Nakata & Weidner, 2012).
Closely connected to the social context lies the marketing environment. It has been shown in
research by Shih and Venkatesh (2004), that interpersonal communications and ties affect the
adoption behavior. Moreover, traditional promotional channels such as the web and TV often
have low reach among the BOP segment, thus it gets important with interpersonal promotion
to spur adoption (Nakata & Weidner, 2012). Another issue with the BOP segment is that it is
many times geographically dispersed, reaching over large areas. To physically access the
whole segment, Nakata and Weidner (2012) advocate the use of atomized distribution, which
brings the product close to the customers and is often done by using many small or individual
distributors. The suggested model does not indicate that you have to focus on all enabling
factors to reach adoption among the BOP, but rather suggests ways to go (Nakata & Weidner,
2012).

10
Figure 3. The model presented by Nakata & Weidner (2012). Poverty deprivations hinder the likelihood of
adoption while the factors presented by Rogers (2003) enable adoption of a technology.
2.4 Business Model Innovation
A greater frequency of disruptions within industries and intensified global competition are
shortening business model lifecycles (Lindgardt et al., 2009). Hence a need is created among
companies to re-innovate existing business models in order to stay in business. The business
model canvas is a strategic management tool for developing new, or mapping existing,
business models. It was first developed by Osterwalder (2004) to form a shared language
when talking about business models and business model innovation. The business model
canvas consists of nine blocks, which in turn cover the four main areas of business: customer,
offer, infrastructure, and financial viability (Osterwalder & Pigneur, 2011). The different parts
of the model are described in figure 4.

11
Figure 4. Pictures the different parts of the Business Model Canvas as described by Osterwalder (2004).
Lindgardt et al. (2009) mean that business model innovation is taking place when two or more
blocks are innovated in the business model of a company. How a company develops or
innovate their business model is dependent on both the circumstances and the industry
wherein they operate. However, Lindgardt et al. (2009) came up with a couple of general
approaches to business model innovation. Firstly, to successfully renew a business model it is
of importance to understand the existing one and how that is giving the company competitive
advantages or disadvantages and how it is aligning with industry trends and customer
preferences. When a company understands where it is standing today, it is easier to exploit
new opportunities. Moreover, Osterwalder and Pigneur (2011) mean that scanning the
external environment and understanding your position in it, is more important today than
ever, due to the greater uncertainties and severe market disruptions. Secondly, Lindgardt et al.
(2009) show that companies that are the first to come up with an idea not necessarily have to
be the ones succeeding with the business model innovation. Instead it is the one who first
manage to successfully scale the opportunity who is going to be the winner. Hence, it is the
scaling process that is most critical (Lindgardt et al., 2009). Lastly, business model innovation
requires the organization to acquire the skills to change. Drastically changing a business
model can incur resistance within the organization, making transformation difficult.
Therefore, the company needs capabilities and processes that can help the organization
overcome its short-term focus to instead see the long-term opportunities.
12
3. Method This chapter presents the research process, the research design that has been used, and why
this specific design was chosen. Moreover, the data collection process is presented along with
a discussion about the research quality.
3.1 Research Process
This study was executed in three main phases: (1) preparatory work, (2) field trip to Indonesia
for collection of data, and (3) analysis and conclusion. The goal of the first phase was to
prepare for the data collection by reviewing literature related to the global and Indonesian
telecom industry. In connection to that, a theoretical framework for the industry analysis was
created. The second phase was carried out in Indonesia in collaboration with Ericsson
Indonesia and the Institut Teknologi Bandung (ITB). Data were gathered both through semi-
structured interviews and by reviewing secondary textual material such as annual reports and
consultancy reports. During the third phase the empirical findings were mapped out in
accordance with the theoretical framework and MNO initiatives were categorized after what
part of the business it concerned. Thereafter, the current actions of the MNOs were analyzed
on the basis of the industry analysis. Despite being separated into three sequential phases, the
research process was iterative and the study thus went back and forth between those phases.
The purpose of this study was formulated in collaboration with Ericsson, ITB, and Chalmers.
The research questions have been subject to change during the process to better reflect the
aim of the study. Saunders et al. (2016) describe an inductive approach as a research approach
where you are data driven; you build theories upon gathered data, rather than theory driven;
you test your pre-set theories with collected data, where the latter would be a deductive
research approach. Since the purpose of the study was to explore opportunities for Indonesian
MNOs, rather than test hypotheses, an inductive approach was considered adequate.
A qualitative approach was chosen since the aim of the study was to gain in-depth
understanding about the market rather than just examining relationships between variables,
for which a quantitative approach would have been more appropriate (Saunders et al., 2016).
The study tries to both explore and describe factors influencing the Indonesian telecom
industry, as well as evaluating existing business models. Consequently, the research design
contains elements of what Saunders et al. (2016) call an exploratory, a descriptive and an
evaluative study. In a descriptive study you try to make an accurate profile of the situation. It
requires that you already know what phenomena you would like to explore, wherewith it is
often preceded by exploratory work (Saunders et al., 2016). An evaluative study tries to find
out how well something works and is quite common in business and management research
where you try to find out how efficient a strategy, policy, campaign etc. have been. The first
phase in the conducted study can be said to correspond to the exploratory research design,
where new information is gathered in order to create frameworks that can be used in the
descriptive phase. The second phase would thus correspond to the descriptive phase; data was
collected to try to describe crucial factors in the Indonesian market. However, the second
13
phase also contained elements from an exploratory and evaluative study. Even if some of the
interviews were done strictly to gain descriptive information, others were done to explore
what initiatives were taken. Moreover, some parts of the interviews meant to evaluate the
initiatives. The third phase aimed to evaluate how Indonesian market conditions affect what
kind of initiatives that can be successfully adopted.
3.2 Data collection
Data collection has taken place using interviews to get access to primary data and literature
reviews to complement and extend the primary data with secondary information. According
to Easterby-Smith et al. (2015: 134), interviews enable: “[...] researchers to access
information in context, and to learn about phenomena otherwise difficult or impossible to
observe”. Interviews thus enable a more extensive and correct picture of the situation than by
studying textual data alone. Nevertheless, textual data in the form of company and
consultancy reports have proven to provide useful information about the market situation,
wherewith it has been a good complement to the interviews.
When using interviews as a knowledge base, a great deal of the study relies on the willingness
and collaboration from people with a scarcity of time. As Easterby-Smith et al. (2015: 175)
describe it: “Negotiating access to the field can be one of the biggest challenges of the
research project”. Nevertheless, Saunders et al. (2016) suggest that it is much easier to get
access where you know people or already have some contacts. This has been proven to be
correct during the time of the research; by elaborating on contacts from stakeholders in the
projects, interviewees have been cooperative. However, where the knowledge has been
considered too scarce, the primary data has been complemented with secondary data.
3.2.1 Literature Review
A literature review was conducted for multiple purposes. Firstly, the literature review helped
create a framework to use when analyzing the market situation and business model
innovations (see Chapter 2). Secondly, a review of news articles, web sites, market, analyst,
and consultancy reports, made it possible to map out how the telecom industry works, how
players interact, and what factors influence the industry. Thirdly, a review of annual reports
from Indonesian MNOs complemented the primary data gathered during interviews. The
literature was sampled using Chalmers Library, Google search, and provided by contacts at
ITB, Ericsson, and Chalmers.
3.2.2 Semi-structured Interviews
Semi-structured interviews are guided open interviews, i.e. interviews based on question that
can be addressed in a flexible manner (Easterby-Smith et al., 2015). Semi-structured
interviews allow the interviewer more freedom, compared to highly structured interviews, to
explore other paths if the interviewee provides new interesting information. This means that
the interviewer does not have to follow the topic guide to the letter, but can change order of
the topics, skip or adjust questions, or add new questions that arise during the discussion

14
(Saunders et al., 2016). This study relies exclusively on semi-structured interviews for the
primary data, however the degree of structure varied between interviews. By using semi-
structured interviews, it was possible to get insight in, and follow up on, what the
interviewees thought were most important, rather than just follow an on-beforehand set
questionnaire. Moreover, the use of semi-structured interviews instead of unstructured
interviews, made the interviews stay on track and provided the interviewers with clues on
how to proceed at times when the discussion stalled.
The interviews were mostly conducted face-to-face, however in two cases the interviewees
were traveling or living too far away for a face-to-face interview to be possible. In those cases
the interviews were conducted using Skype and telephone. By interviewing someone using an
intermediate instead of face-to-face can come with complications such as a lack of
engagement or trust (Saunders et al., 2016). Since the interviewees interviewed using an
intermediate were all close contacts to one of the stakeholders to the project, trust had to some
degree already been established. This somewhat compensated for the lack of face-to-face
contact. Nevertheless, it is not possible to judge whether the interviews would have taken a
different direction if made face-to-face. A full list of interviewees, and how they were
interviewed, can be found in Appendix I.
Both of the authors were present during all interviews. This allowed for one to take notes
while the other one was responsible for the proceeding of the interview. However, both were
engaged during the discussions and allowed to ask follow-up questions or for clarifications.
All interviews were recorded and transcribed, and it allowed for comparisons between
interviews and worked as a memory tool when analyzing the interviews afterwards.
Beside the authors, one of the stakeholders were present during a majority of the interviews.
Since the interviewers and the interviewees most of the time were of different nationality and
did not speak the same language, there occasionally arose situations of misunderstandings. In
such situation the third person helped with translation or clarification. One interview was
conducted entirely with the use of a translator. The interviewee did not feel comfortable
answering questions in English even though he understood the language, wherewith the
answers, and partly the questions, had to be translated from Indonesian to English. Since there
is no way to be sure that the questions and answers were correctly interpreted by the translator
or interviewee, the interview could be biased and therefore all the information used have been
backed up with a second source.
Selection of Interviewees
After it had been mapped out what knowledge was needed for the study, the interviewees
were selected using the professional and personal networks of contacts at ITB and Ericsson
Indonesia. Subsequently the sampling strategy took the approach of snowball sampling.
Snowball sampling is described by Saunders et al. (2016) as a sampling method where the
researches take initial contact with a small group of people relevant to the research, and then
let them introduce new contacts, which they think can be valuable to talk to. The use of
snowball sampling made it possible to get in touch with people who could contribute
15
significantly with their knowledge but who would otherwise have been outside the reach of
the study. The complete list of interviewees can be found in Appendix I.
Creation of Topic Guide
A topic guide is an informal list of question and topics that can be addressed in a flexible
manner during an interview (Easterby-Smith et al., 2015). A topic guide should be
constructed with the interviewee in mind, i.e. it is necessary to reflect over how the
interviewee will feel about and understand the different questions. This gets particularly
important in research such as this, since it is located in a different geographical and cultural
setting than our own. To create a topic guide that relates both to the interest of the respondents
as well as the interest of the research is therefore essential to the success of a project
(Easterby-Smith et al., 2015).
In order to get suitable topic guides, both representatives from Ericsson Indonesia and ITB
were consulted. By doing so, the risk of cultural misunderstandings was decreased. Moreover,
such consultation regarding the topic guides helped to create clear and understandable
questions/topics and to avoid abstract theoretical concepts, something Easterby-Smith et al.
(2015) mean is desirable. The topic guides were organized, as recommended by Easterby-
Smith et al. (2015), by three sections: opening questions, key topic questions, and closing
questions. The key topic questions were created by revisiting the research questions, the
purpose, and the theoretical framework. The topic guides can be found in Appendix II.
3.3 Research Quality
When working with semi-structured interviews it is, according to Saunders et al. (2016),
important to consider the reliability of the study, i.e. if other research would reveal the same
information. Semi-structured interviews are not always easily repeatable since they often
reveal time-specific opinions or information. However, since semi-structured interviews are
used to gain in-depth insight in complex and dynamic issues, it would not be realistic to
sacrifice parts of the benefit with this type of data collection method just to ensure that the
research could be replicated. This would just weaken the method used for this kind of
study. By instead being transparent with what has been done during the interviews, how they
have been set up, and what topics have been covered, we aim to provide the reader with the
motivation to why this less replicable kind of approach has been chosen.
The use of interviews as the main source of data is related to multiple risks of bias and thus
influences the reliability of the study. One such bias is the participation bias. The participation
bias is described by Saunders et al. (2016) as any factor that induces a false response from the
interviewee. Such factors can relate to who is listening, if the interviewee believes that certain
responses are expected of him, or if the interviewee feels that he will be judged by his
answers. By starting the interviews off by explaining the background to the project, the
background of the authors, and how the data would be used, we have tried to create an
atmosphere of trust and minimize participation bias.
16
A bias closely related to how the interviews are conducted is the interviewer bias. The
interviewer bias is any behavior, verbal or nonverbal, that can influence how the interviewee
responds to or understands the asked questions (Saunders et al., 2016). In the case of this
study, the interviewer bias is also influenced by the cultural differences between the
interviewer and the interviewee. One such factor might be that the interviewers and the
interviewee think differently about what topics that are suitable to discuss during an
interview. A wrongly done interpretations about this from the interviewer’s side, can lead to
the interviewee feeling uncomfortable (Saunders et al., 2016). By letting both Ericsson
Indonesia and ITB go through the topic guides before the interviews, the risk of this kind of
bias was reduced. However, since the authors became more experienced along the way, it is
realistic to assume that the interviews done in the beginning of the study was under a greater
interviewer bias than the ones done towards the end.
The difference in culture and language might be the biggest concern with this type of
research. Not only can it lead to issues as the one discussed above, it can also contribute to
how the interviewers understand the meaning of what is being said, it can affect what
questions are asked, and influence what the interviewee is willing to respond to (Saunders et
al., 2016). This kind of bias can sincerely affect the reliability and thus the quality of the
research. To reduce the influence of the cultural and linguistic differences, reflection is
needed. Court and Abbas (2013) explain cultural reflexivity as the action when you reflect
upon the relationship between you and the intended interviewee and how differences and
similarities in customs and cultures might influence the interaction between you. Since the
study has taken place in collaboration with Indonesian stakeholders, we have had the
opportunity to engage with them before the interviews took place. This allowed us to get
familiar with how things are done in Indonesia, but it also provided us with valid feedback on
how we could change our behavior as interviewers to suit the cultural setting better.
Moreover, a main issue with cultural differences lies in the trust between the different parties.
As mentioned above the interviews were organized with close contacts to the different
stakeholders of the project. Thus, some trust was already established before the conduction of
the interviews. However, the reader should bear in mind that even if we worked to minimize
the disturbance of the cultural differences it is not possible to completely erase them,
wherewith they might have influenced the result.
Another kind of bias that might be present is the researcher bias. The researcher bias is
anything that causes a bias in the researcher's recording of the responses (Saunders et al.,
2016). An example of such a factor is letting one’s subjective view influence how the
responses are interpreted. By first individually doing the interpretations and then discuss it
with each other, we have tried to reduce this kind of error. Moreover, when we have been of
different opinions or where we have been unsure about the meaning of a response, they have
been double-checked with the interviewee.
Parts of the study rely on material coming from different kind of consultancy reports. There is
an imminent risk that this material is biased to promote the respective consultancy firm
(Saunders et al., 2016). To minimize the risk that this kind of bias would influence the study,
17
all such information was cross-checked between firms or with more firm-independent
sources.
When discussing research quality one should consider the generalizability of the research, i.e.
to what degree are the findings of the research applicable to another setting or time (Saunders
et al., 2016). Generalizability in qualitative research differs from the one commonly used in
quantitative research, since the conducted study often is done with few participants. Guba and
Lincoln (1985) meant that the researcher should provide complete descriptions of what has
been done, research questions used, findings, in what setting the study took place,
interpretation etc. Then the reader can judge by herself if the study is transferable to the
setting she would like to study (Saunders et al., 2016). This would mean that it partly lies
upon the reader to assess what changes would be necessary in order to transfer the study to
another setting. One could argue that the results coming from this study could be applicable in
geographical markets with similar conditions; nevertheless it would still have to be adapted to
market-specific conditions. Finally, one should remember that this kind of study, based on a
few in-depth interviews, chosen with a non-probability sampling method, never can be
enough to draw statistically significant conclusions about a whole population.
18
4. Introducing the Telecom Industry
To give the unacquainted telecom reader an introduction to the industry, this chapter provides
the basics. The ICT ecosystem will be introduced, together with its actors, and the
relationships between them. Moreover, the very basics of a cellular network are explained, as
well as the challenge around the scarcity of spectrum, transition to data, and the concept of net
neutrality.
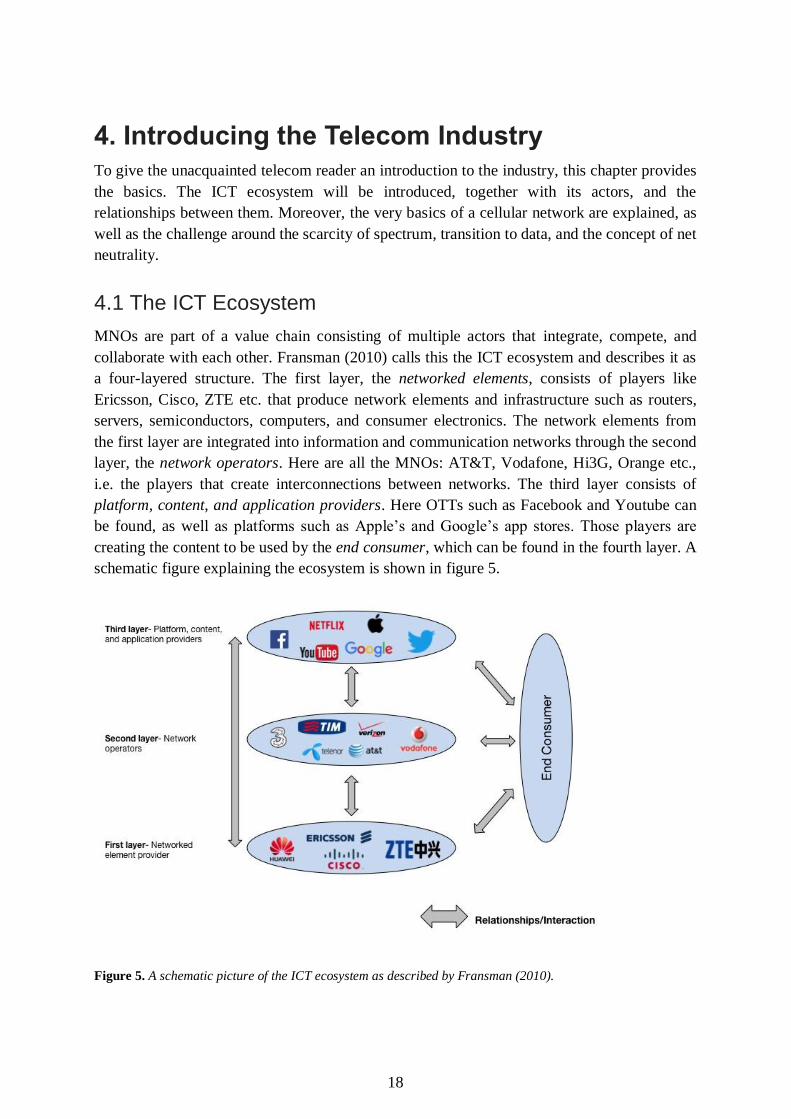
4.1 The ICT Ecosystem
MNOs are part of a value chain consisting of multiple actors that integrate, compete, and
collaborate with each other. Fransman (2010) calls this the ICT ecosystem and describes it as
a four-layered structure. The first layer, the networked elements, consists of players like
Ericsson, Cisco, ZTE etc. that produce network elements and infrastructure such as routers,
servers, semiconductors, computers, and consumer electronics. The network elements from
the first layer are integrated into information and communication networks through the second
layer, the network operators. Here are all the MNOs: AT&T, Vodafone, Hi3G, Orange etc.,
i.e. the players that create interconnections between networks. The third layer consists of
platform, content, and application providers. Here OTTs such as Facebook and Youtube can
be found, as well as platforms such as Apple’s and Google’s app stores. Those players are
creating the content to be used by the end consumer, which can be found in the fourth layer. A
schematic figure explaining the ecosystem is shown in figure 5.
Figure 5. A schematic picture of the ICT ecosystem as described by Fransman (2010).
19
There exists intermediate demand and supply both between layers and within layers
(Fransman, 2010). For instance, system manufacturers (computers, consumer electronics etc.)
are demanding semiconductors from component producers, which are in the same layer
(within). Network operators in layer two are in turn demanding network elements from
players in layer one (between). According to Fransman (2010) there are six different
relationships and interactions between the different layers (see figure 5). The interactions that
take place indicate different flows: financial flows (purchase-sale), material flows (input-
output), information flows, and/or input flows to the innovation process. Such interactions
would e.g. be the one between MNOs and end consumers; MNOs sell mobile services and
access to internet to the end consumers, the one between platform, content, and application
providers and the end consumer; end consumers act as co-innovators with the players in the
second layer. Moreover, network operators have interactions both with the first and third
layer; network operators are dependent on the products and services supplied by the first layer
- the networked element players provide the network operators with the means to reach their
customer. The network operators in turn provide the platform, content, and application
players with a platform for innovation and means to reach their customers (Fransman, 2010).
Hence, the players in the ICT ecosystem are all dependent on each other for their own
existence.
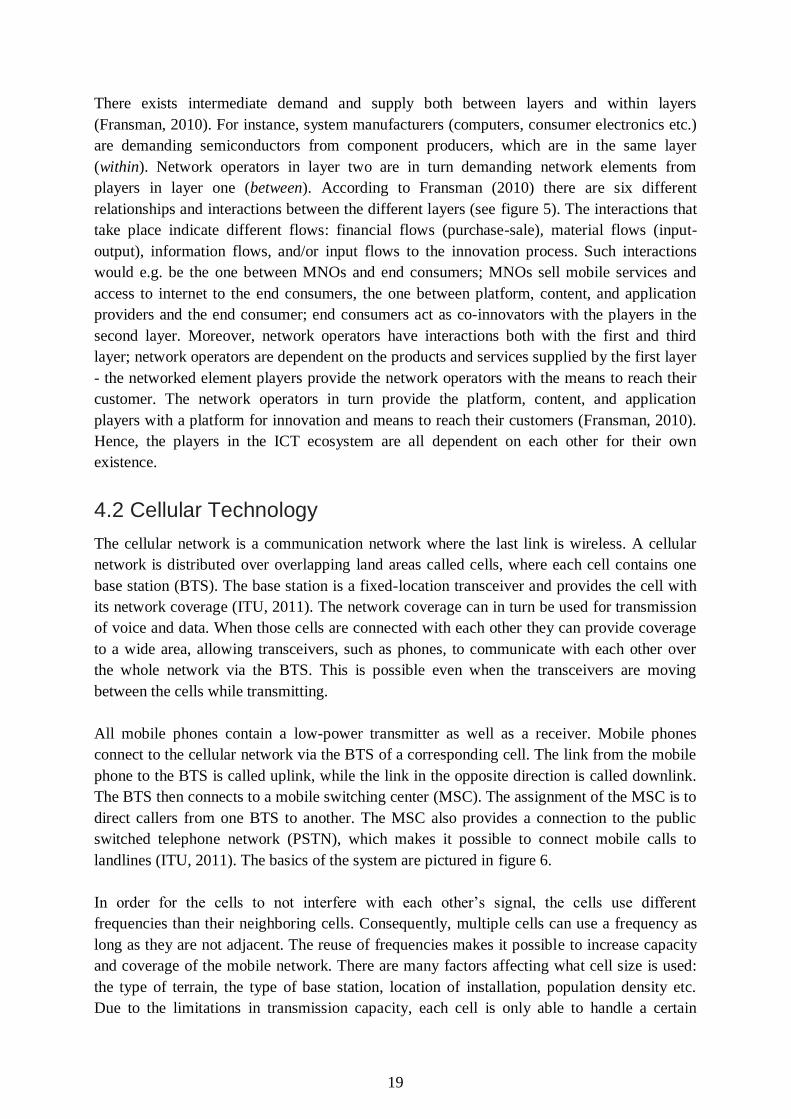
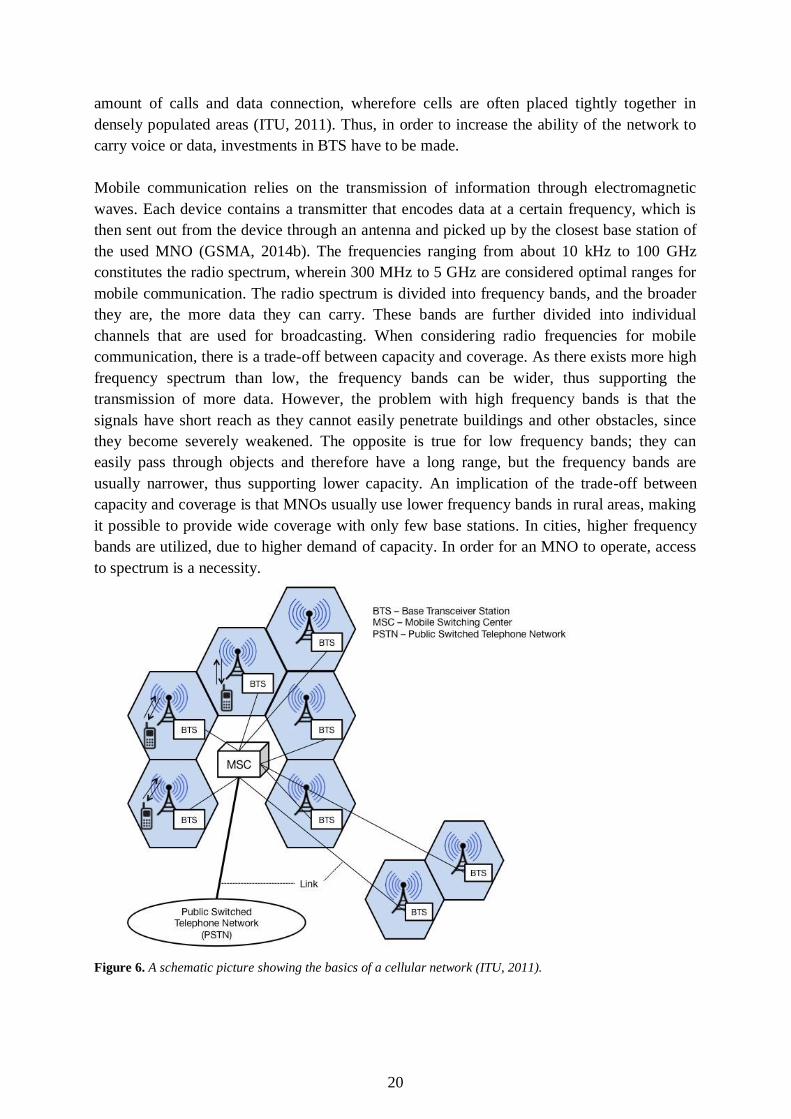
4.2 Cellular Technology
The cellular network is a communication network where the last link is wireless. A cellular
network is distributed over overlapping land areas called cells, where each cell contains one
base station (BTS). The base station is a fixed-location transceiver and provides the cell with
its network coverage (ITU, 2011). The network coverage can in turn be used for transmission
of voice and data. When those cells are connected with each other they can provide coverage
to a wide area, allowing transceivers, such as phones, to communicate with each other over
the whole network via the BTS. This is possible even when the transceivers are moving
between the cells while transmitting.
All mobile phones contain a low-power transmitter as well as a receiver. Mobile phones
connect to the cellular network via the BTS of a corresponding cell. The link from the mobile
phone to the BTS is called uplink, while the link in the opposite direction is called downlink.
The BTS then connects to a mobile switching center (MSC). The assignment of the MSC is to
direct callers from one BTS to another. The MSC also provides a connection to the public
switched telephone network (PSTN), which makes it possible to connect mobile calls to
landlines (ITU, 2011). The basics of the system are pictured in figure 6.
In order for the cells to not interfere with each other’s signal, the cells use different
frequencies than their neighboring cells. Consequently, multiple cells can use a frequency as
long as they are not adjacent. The reuse of frequencies makes it possible to increase capacity
and coverage of the mobile network. There are many factors affecting what cell size is used:
the type of terrain, the type of base station, location of installation, population density etc.
Due to the limitations in transmission capacity, each cell is only able to handle a certain
20
amount of calls and data connection, wherefore cells are often placed tightly together in
densely populated areas (ITU, 2011). Thus, in order to increase the ability of the network to
carry voice or data, investments in BTS have to be made.
Mobile communication relies on the transmission of information through electromagnetic
waves. Each device contains a transmitter that encodes data at a certain frequency, which is
then sent out from the device through an antenna and picked up by the closest base station of
the used MNO (GSMA, 2014b). The frequencies ranging from about 10 kHz to 100 GHz
constitutes the radio spectrum, wherein 300 MHz to 5 GHz are considered optimal ranges for
mobile communication. The radio spectrum is divided into frequency bands, and the broader
they are, the more data they can carry. These bands are further divided into individual
channels that are used for broadcasting. When considering radio frequencies for mobile
communication, there is a trade-off between capacity and coverage. As there exists more high
frequency spectrum than low, the frequency bands can be wider, thus supporting the
transmission of more data. However, the problem with high frequency bands is that the
signals have short reach as they cannot easily penetrate buildings and other obstacles, since
they become severely weakened. The opposite is true for low frequency bands; they can
easily pass through objects and therefore have a long range, but the frequency bands are
usually narrower, thus supporting lower capacity. An implication of the trade-off between
capacity and coverage is that MNOs usually use lower frequency bands in rural areas, making
it possible to provide wide coverage with only few base stations. In cities, higher frequency
bands are utilized, due to higher demand of capacity. In order for an MNO to operate, access
to spectrum is a necessity.
Figure 6. A schematic picture showing the basics of a cellular network (ITU, 2011).
21
4.3 The State of the Global Telecom Industry
The size of the global MNO industry was $1.1 trillion in 2015 (GSMA, 2016a). In the last
five to ten years, there have been significant differences in revenue growth between the
developed and developing world. Since the financial crisis in 2008-2009, the developed world
has experienced consistent slow growth, whereas the developing world has gone from double
to single digit growth, thus experiencing a substantial decline in growth. Hence, the
differences in growth between developed and developing countries are now far less
pronounced than previously. The European market has been subject to increasing
consolidation, something that is expected to happen in the most competitive developing
markets. Looking ahead, the growth of the global market is expected to continue to be low,
growing 1.9 percent annually until 2020 (GSMA, 2016a). Developing markets are expected to
outperform developed markets, with annual growth rates of 2.8 percent compared to 1.2
percent.
In 2015, 63 percent of the global population had a mobile subscription (GSMA, 2016a).
Subscriber growth rates has been 7.7 percent annually in the last five years, but are expected
to decline to 3.9 percent annually in the upcoming five years. Especially in the developed
world the subscriber growth will be slow, due to the high maturity of the market. The market
is predicted to grow with 1 billion subscribers until 2020, and of these, over 90 percent will be
in developing countries. In contrast to the slow growth in subscribers, the number of
smartphones is increasing rapidly in the world, predicted to almost double by 2020 (GSMA,
2016a). Of this increase, people living in developing countries are expected to account for
over 90 percent.
4.3.1 The Shift to Mobile Data
Mobile data consumption is growing massively, and in 2009, the volume of data traffic
overtook the volume of voice traffic carried over the world’s mobile network for the first
time, marking a significant milestone for global mobile communications (Ericsson, 2014).
GSMA (2016a) expects a 49 percent annual growth in data traffic between 2015-2020, while
Ericsson (2015) predicts this number to be 45 percent between 2015-2021. The growth is
fueled by the increasing number of smartphone users, high-speed connections, extended
coverage, and consumers using higher volumes of data. People are watching more videos on
their devices, and that alone will contribute substantially to the growth in data (McKinsey,
2016). According to estimates, 70 percent of all mobile data will come from video in 2021
(Ericsson, 2015).
During the last 10 years, the telecom industry has been subject to massive changes, and the
speed of transformation is continuing at high pace. It is not all players that have managed to
successfully turn the transfer toward data into a valid business opportunity. Price wars have
occurred between MNOs and have come to be an expensive consequence of competing for
market shares only by price. The price wars have resulted in compromises when it comes to
user experience and profitability among MNOs (Ericsson, 2014). MNOs are facing significant
pressure and overall return on invested capital has been declining in recent years (EY, 2015).
22
This can be attributed to several factors such as: OTTs cannibalizing on legacy revenues,
price wars or price regulations, and higher capital expenditures to improve network
performance. The performance of MNOs varies a lot, with pronounced differences between
different regions. MNOs in North America and Asia are generally doing considerably better
than MNOs in other regions.
The number one challenge cited by senior executives of MNOs in a EY (2015) study is the
threat from disruptive competitors. OTTs are cited as the industry actors that are most likely
to alter customer demands in the future. Free instant messaging services from OTTs, such as
WhatsApp, Facebook Messenger, and Apple’s iMessage, are cannibalizing on MNOs’ legacy
services. In 2015, MNOs lost 8 percent of their voice minutes to OTTs. As MNOs are
investing heavily in their networks and at the same time trying to compete with OTT players,
their margins have been suffering.
4.3.2 The Net Neutrality Debate
The influence of OTTs is increasing and one way for MNOs to regain some power would be
to differentiate the QoS depending on which OTT that is driving the traffic. However, the
ability to take such measures is severely stalled by the global net neutrality debate. The term
“net neutrality” was coined by Tim Wu in 2003 and means that all data is treated indifferently
on the internet, and that regulators and internet service providers should not be allowed to
discriminate or charge differently depending on content, user, website, platform, equipment,
etc. If net neutrality should be enforced or not is highly debated, and the opinions vary greatly
between nations and individuals. The first country to amend its laws to include net neutrality
was Chile in 2010, followed by the Netherlands in 2012 (The Guardian, 2011). In 2015, the
Federal Communications Commission in the U.S. decided to regulate broadband internet
service as a public utility, placing mobile data services for e.g. smartphones under new
regulations. The new rules intend to “protect innovators and consumers” and to “preserve the
internet’s role as a core of free expression and democratic principles” (Lohr & Ruiz, 2015).
However, opinions have been raised against enforcing net neutrality since opponents mean
that it can deter investments from broadband improvements (tiaonline, 2014).
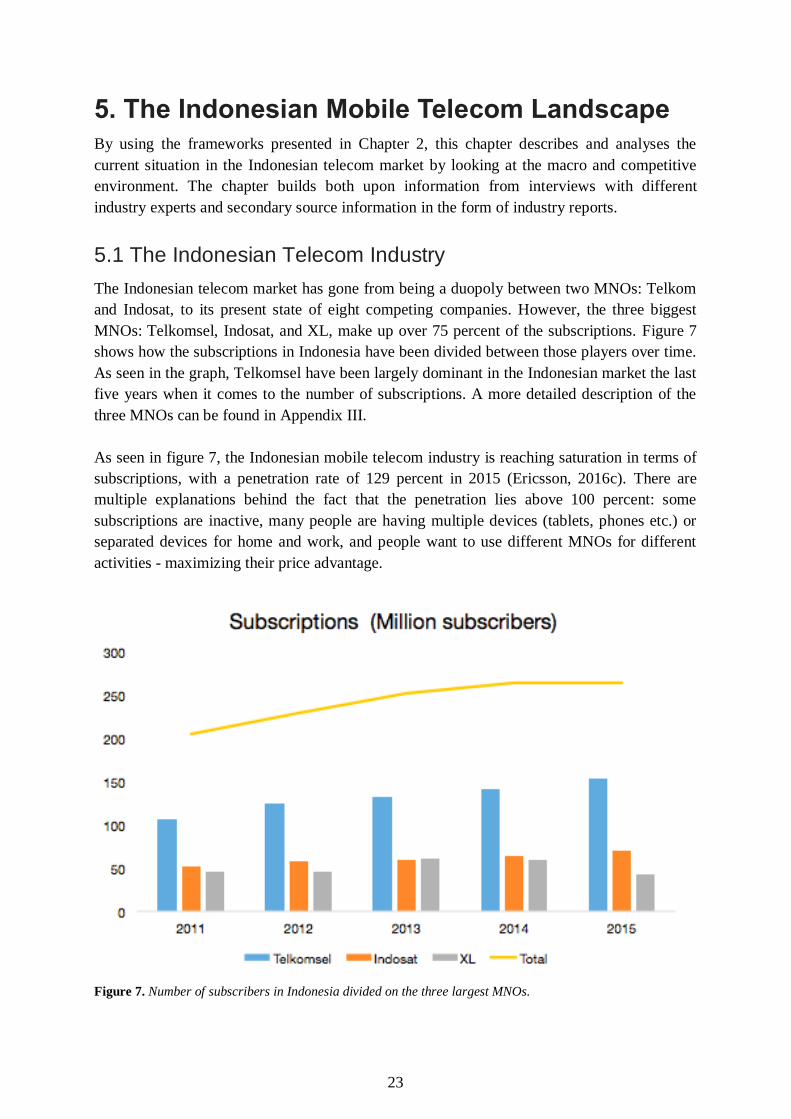
23
5. The Indonesian Mobile Telecom Landscape By using the frameworks presented in Chapter 2, this chapter describes and analyses the
current situation in the Indonesian telecom market by looking at the macro and competitive
environment. The chapter builds both upon information from interviews with different
industry experts and secondary source information in the form of industry reports.
5.1 The Indonesian Telecom Industry
The Indonesian telecom market has gone from being a duopoly between two MNOs: Telkom
and Indosat, to its present state of eight competing companies. However, the three biggest
MNOs: Telkomsel, Indosat, and XL, make up over 75 percent of the subscriptions. Figure 7
shows how the subscriptions in Indonesia have been divided between those players over time.
As seen in the graph, Telkomsel have been largely dominant in the Indonesian market the last
five years when it comes to the number of subscriptions. A more detailed description of the
three MNOs can be found in Appendix III.
As seen in figure 7, the Indonesian mobile telecom industry is reaching saturation in terms of
subscriptions, with a penetration rate of 129 percent in 2015 (Ericsson, 2016c). There are
multiple explanations behind the fact that the penetration lies above 100 percent: some
subscriptions are inactive, many people are having multiple devices (tablets, phones etc.) or
separated devices for home and work, and people want to use different MNOs for different
activities - maximizing their price advantage.
Figure 7. Number of subscribers in Indonesia divided on the three largest MNOs.
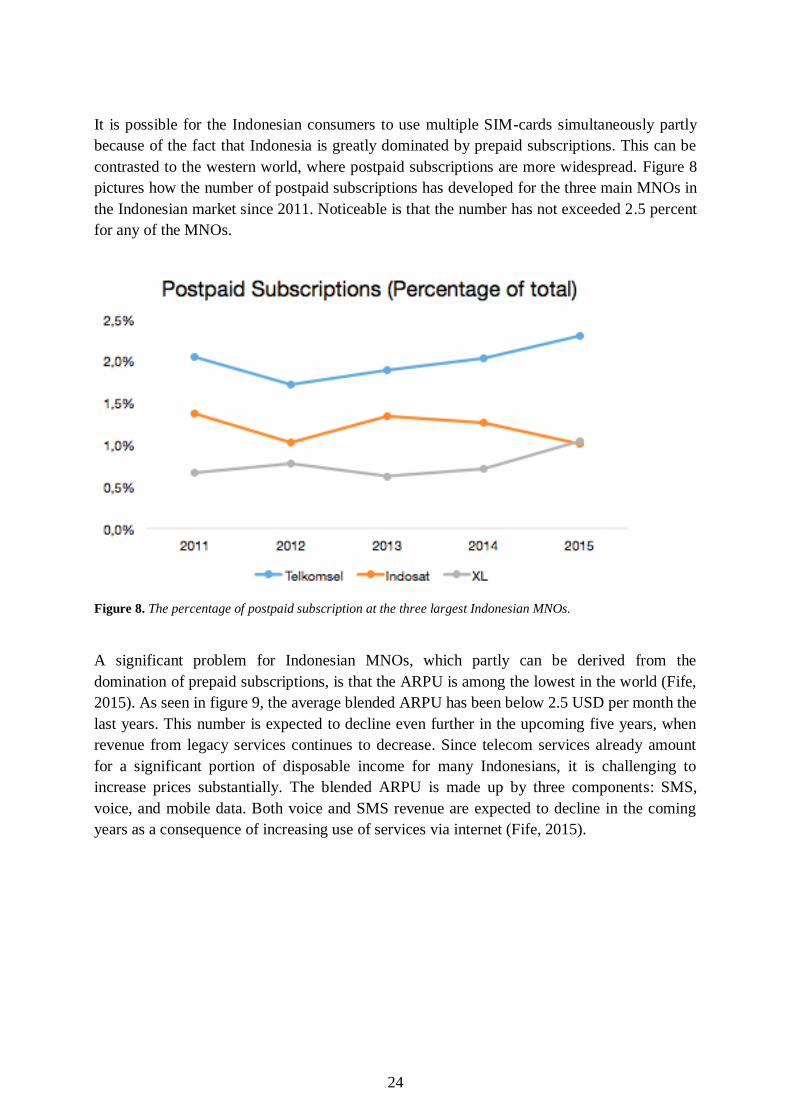
24
It is possible for the Indonesian consumers to use multiple SIM-cards simultaneously partly
because of the fact that Indonesia is greatly dominated by prepaid subscriptions. This can be
contrasted to the western world, where postpaid subscriptions are more widespread. Figure 8
pictures how the number of postpaid subscriptions has developed for the three main MNOs in
the Indonesian market since 2011. Noticeable is that the number has not exceeded 2.5 percent
for any of the MNOs.
Figure 8. The percentage of postpaid subscription at the three largest Indonesian MNOs.
A significant problem for Indonesian MNOs, which partly can be derived from the
domination of prepaid subscriptions, is that the ARPU is among the lowest in the world (Fife,
2015). As seen in figure 9, the average blended ARPU has been below 2.5 USD per month the
last years. This number is expected to decline even further in the upcoming five years, when
revenue from legacy services continues to decrease. Since telecom services already amount
for a significant portion of disposable income for many Indonesians, it is challenging to
increase prices substantially. The blended ARPU is made up by three components: SMS,
voice, and mobile data. Both voice and SMS revenue are expected to decline in the coming
years as a consequence of increasing use of services via internet (Fife, 2015).
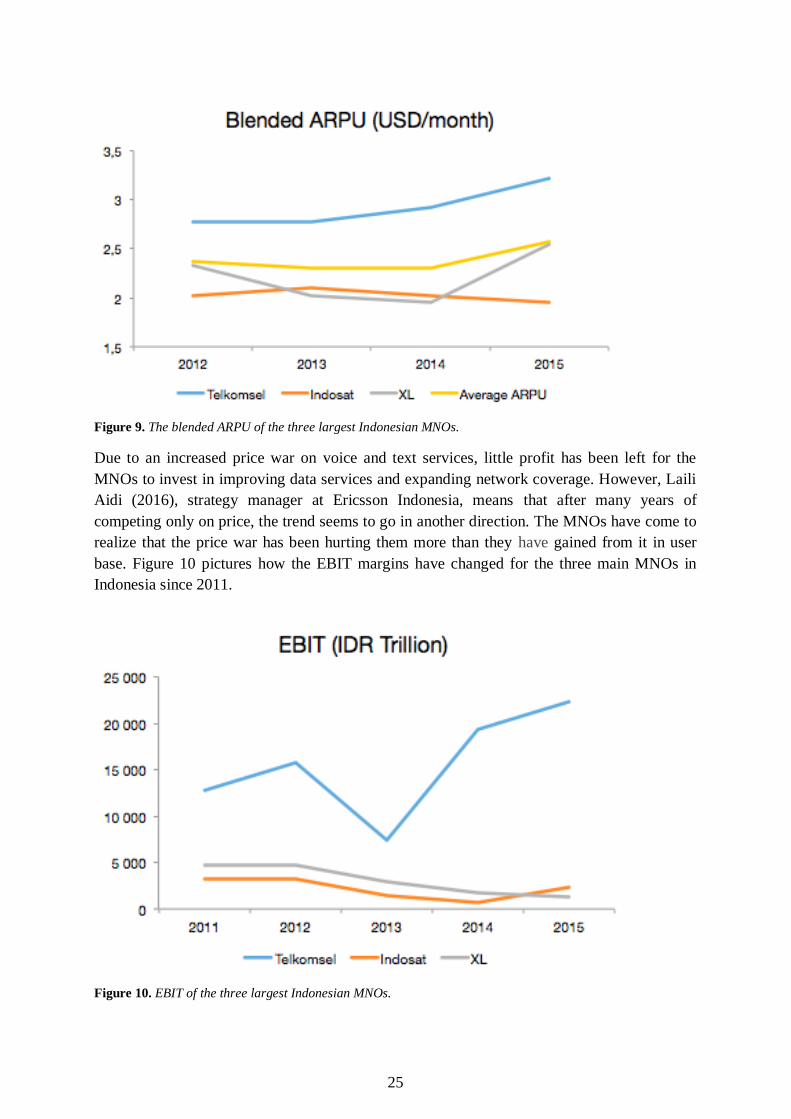
25
Figure 9. The blended ARPU of the three largest Indonesian MNOs.
Due to an increased price war on voice and text services, little profit has been left for the
MNOs to invest in improving data services and expanding network coverage. However, Laili
Aidi (2016), strategy manager at Ericsson Indonesia, means that after many years of
competing only on price, the trend seems to go in another direction. The MNOs have come to
realize that the price war has been hurting them more than they have gained from it in user
base. Figure 10 pictures how the EBIT margins have changed for the three main MNOs in
Indonesia since 2011.
Figure 10. EBIT of the three largest Indonesian MNOs.
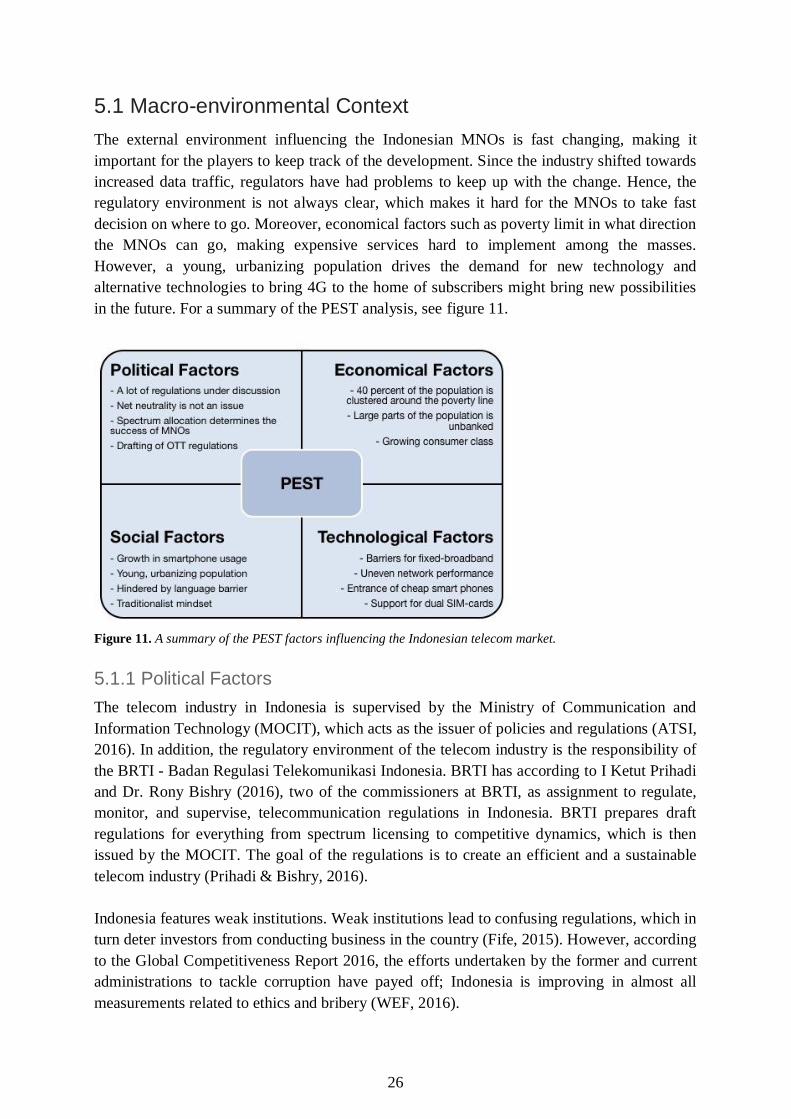
26
5.1 Macro-environmental Context
The external environment influencing the Indonesian MNOs is fast changing, making it
important for the players to keep track of the development. Since the industry shifted towards
increased data traffic, regulators have had problems to keep up with the change. Hence, the
regulatory environment is not always clear, which makes it hard for the MNOs to take fast
decision on where to go. Moreover, economical factors such as poverty limit in what direction
the MNOs can go, making expensive services hard to implement among the masses.
However, a young, urbanizing population drives the demand for new technology and
alternative technologies to bring 4G to the home of subscribers might bring new possibilities
in the future. For a summary of the PEST analysis, see figure 11.
Figure 11. A summary of the PEST factors influencing the Indonesian telecom market.
5.1.1 Political Factors
The telecom industry in Indonesia is supervised by the Ministry of Communication and
Information Technology (MOCIT), which acts as the issuer of policies and regulations (ATSI,
2016). In addition, the regulatory environment of the telecom industry is the responsibility of
the BRTI - Badan Regulasi Telekomunikasi Indonesia. BRTI has according to I Ketut Prihadi
and Dr. Rony Bishry (2016), two of the commissioners at BRTI, as assignment to regulate,
monitor, and supervise, telecommunication regulations in Indonesia. BRTI prepares draft
regulations for everything from spectrum licensing to competitive dynamics, which is then
issued by the MOCIT. The goal of the regulations is to create an efficient and a sustainable
telecom industry (Prihadi & Bishry, 2016).
Indonesia features weak institutions. Weak institutions lead to confusing regulations, which in
turn deter investors from conducting business in the country (Fife, 2015). However, according
to the Global Competitiveness Report 2016, the efforts undertaken by the former and current
administrations to tackle corruption have payed off; Indonesia is improving in almost all
measurements related to ethics and bribery (WEF, 2016).
27
Dr. Huhammad Ridwan Effendi (2016), former commissioner at BRTI, means that the fast
changing pace of the telecom industry has caused a problematic situation for the regulators,
where the regulations do not manage to keep up with the change in the technology and
market. According to an interview with Dr. Sigit Haryadi, who has more than 20 years of
experience within the field of telecom policies, regulations, and economics, the regulatory
environment for telecom in Indonesia can be described as unpredictable. Contrary to many
developed countries there are seldom regulations controlling the actions of the MNOs on
beforehand. Regulations are rather set after the actions of the MNOs have taken place, i.e.
post-practice (Haryadi, 2016). This can create action barriers for the MNOs since they do not
know what upcoming regulations will look like. Consequently, initiatives can be abandoned
or postponed (Effendi, 2016).
It seems like the regulatory environment in Indonesia has lagged behind the transition to data,
resulting in a rather unpredictable situation. The fact that the government seems to have
economic incentives in the development of the industry has made them draft and discuss a
variety of regulation concerning the MNOs and other actors in the industry. However, it is
difficult to know which ones are going to be ratified and implemented, and which ones are
going to be stopped along the way. Consequently, it creates a difficult situation for the MNOs,
where it is not obvious what actions will be allowed in the future, thereby making investment
decisions more difficult.
The fact that international OTTs are getting an increased amount of power in the Indonesian
telecom market has led the BRTI to start to draft OTT regulations. However, the discussions
circulating the regulation are timely and interfered by the international community, such as
the U.S. and European council, who oppose the regulations (Prihadi & Bishry, 2016). The
Indonesian government sees a problem in that the OTTs are active in Indonesia and use the
Indonesian telecom infrastructure without being obligated to pay for it. Initiatives have
already been taken to force the larger OTTs to put at least one of their servers in Indonesia,
which would make it possible for the government to tax them based on their income (Prihadi
& Bishry, 2016; Effendi, 2016). However, this has also met a lot of resistance, especially
from the international OTTs themselves who try to find different ways to circumvent the
regulation. Moreover, the regulatory authority of Indonesia advocates cooperation between
the local MNOs and the larger OTTs. This would mean that if e.g. Netflix would like to
conduct business in Indonesia they would need to have cooperation with at least one of the
MNOs (Prihadi & Bishry, 2016). This would allow the MNOs to charge the OTTs for the use
of their bandwidth. However, this is not yet enforced but rather an alternative discussed.
The use of smartphones and internet has given significant contributions to the Indonesian
economy (Fife, 2015). Thus the Indonesian government has incentives to enhance the use
even further. Since the 4G smartphones currently on the market in Indonesia are expensive,
the government wants to take measure to push the prices down (Effendi, 2016). Right now,
there are discussions going on about whether or not it would be possible to force smartphone
vendors to produce low-cost smartphones for the Indonesian market. However, as with the

28
OTT regulations, international vendors are opposing such a regulation, which have brought
the issue to WTO (Effendi, 2016).
It is uncertain how much influence international society can have over the regulatory
environment in Indonesia. The International Telecommunication Union (ITU) is an agency
under the UN responsible for issues associated with information and communication
technology (ITU, 2016), and the main global association influencing regulations in Indonesia
(Effendi, 2016). ITU is among other things involved in the development and coordination of
worldwide technical standards. Such standards are not enforced upon the ITU member
countries, however Dr. Effendi (2016) means that it would be too expensive not to follow the
technical standards set. For a country to develop its own technical standard it requires that it
has vendors that are ready to develop devices for that standard, something Indonesia does not
have (Effendi, 2016). However, each and every country does always have the choice not to
follow. This gets important since discussions concerning net neutrality are currently taking
place on an ITU level. Net neutrality is defined by ITU (2015) as: “the principle that all data
traffic should be treated equally, without discrimination, restriction or interference,
independent of the sender, receiver, type, content, device, service or application”. This would
have implications for MNOs since they would not be allowed to differentiate the quality of
service (QoS) of their network depending on what content provider is using it. Indonesia,
together with many other countries in Asia and Europe, is an opponent of net neutrality
(Effendi, 2016; Prihadi & Bishry, 2016; Haryadi, 2016). Even if the ITU community finally
arrives to a decision in favor of net neutrality, Indonesia would not have to follow it.
Another regulation under discussion in Indonesia is the one regarding network sharing
between MNOs. Anthony Houlahan (2016), the Ericsson VP of strategy for Southeast Asia,
means that one of the main barriers for an increased coverage of the networks is the huge
investment cost associated with the expansion. Today, if the MNOs want to increase their area
of operations, they have to build the active part of the infrastructure themselves, i.e. the BTS
(Effendi, 2016). However, it is now under discussion whether it should be allowed for the
MNOs to collaborate, i.e. to build a multi operator core network (MOCN), which would allow
them to share not only the passive part of the network but also the active parts. This would
make the investment necessary smaller for the collaborating MNOs than if the MNOs had to
do it each by themselves, allowing them to reach outside of Java (Prihadi & Bishry, 2016).
However, such a regulation is not without obstacles since it can be considered as unjust for
Telkomsel, who has already expanded their network by themselves (Effendi, 2016; Prihadi &
Bishry, 2016), or for smaller players who would have no one to collaborate with. Right now
there are two opposing sides in the discussion; XL and Indosat who see network sharing as
their best opportunity to be competitive with Telkomsel outside of the main cities, and
Telkomsel who oppose since they want to stay the sole MNO in those areas.
One of the most important assignments of BRTI is considered to be the allocation of the
spectrum. The spectrum is allocated to the MNOs by auction. If an MNO is allocated
spectrum, they do not own the spectrum themselves, but have the right to use it. Thus they are
not allowed to trade the spectrum rights with others. If the spectrum is not utilized, the
29
government takes it back and allocates the right to use it to someone else (Prihadi & Bishry,
2016). During the spectrum allocation auction the regulators consider both the price the MNO
is willing to pay and the past performance of the MNO (Haryadi, 2016). Additionally, the
MNOs who get the spectrum have to obey with certain criteria set by the government. Such a
criterion could for example be that the MNO becomes obligated to build their network in
specified areas (Prihadi & Bishry, 2016). The spectrum is allocated on a national basis, i.e. the
MNOs get the right for the spectrum throughout the whole of Indonesia. This has the
implication that the spectrum is not used in the areas where the MNO with the spectrum rights
does not operate.
ICT development is seen as important by the Indonesian government and it is an essential part
of the National Development Plan 2015-2019 (Fife, 2015). In 2014, the 2014-2019 Indonesia
Broadband Plan (IBP) was released, which contains some specific goals related to mobile
broadband (Rohman, 2013). It aims to increase overall connection speeds and penetration
levels, targeting a mobile broadband penetration rate of 100 percent in urban areas and 52
percent in rural areas at 1Mbps to be reached by 2019. However, the IBP does not state how
these goals should be achieved.
5.1.2 Economical Factors
With its 250 million people, Indonesia is the fourth largest country in the world (Fife, 2015).
The country is characterized by a young population; nearly 60 percent of the population is
under 30 years old, a fast urbanization rate; over half the population lives in cities (Oberman
et al., 2012), and a high domestic consumption; about 60 percent of GDP is coming from
Indonesian consumer spending (Rohit et al., 2013).
Since overcoming the Asian financial crisis in late 1990s, the Indonesian economy has been
growing quickly (The World Bank, 2016a), averaging a growth rate of 6.3 percent annually
2011-2014. As of 2015, Indonesia was one of the fastest growing developing economies in
the world (Fife, 2015). A large extent of the economic growth taking place can be derived
from the size of the population; Indonesia has a large labor pool and consumer population to
continuously fuel growth in diversified sectors (Fife, 2015).
Despite the growing economy, Indonesia still have problems connected to inequality and
poverty (Fife, 2015). According to The World Bank (2016a), Indonesia had a poverty rate of
11.2 percent in 2015, a cut of more than 50 percent since 1999. However, since 2012 the
poverty rate has fallen by less than 0.3 percentage points annually. Moreover, The World
Bank (2016a) estimates that about 40 percent of the population remains clustered around the
national poverty line of $22.60 a month, well under the BOP limit defined by Prahalad and
Hart (1998). This has an impact on the relative cost and thus the affordability of mobile
internet. In spite of the fact that Indonesia has one of the lowest rates for mobile internet
airtime in the world, 46 percent of the respondents in a survey conducted by GSMA (2016)
considered the affordability to be the largest barrier to accessing the internet. This number can
be compared to 25 percent on average in Asia (GSMA, 2016c).
30
The fact that large part of the Indonesian population is living close to the poverty line also
influences how many people are banked. According to The World Bank’s Global Financial
Inclusion database of 2014, 35.9 percent of the Indonesian population over 15 years has an
account at a financial institution, whilst among the poor this number reaches only 21.9
percent. The amount of the total population having debit cards during the same year was 25.9
percent, the same number amongst the poor was 10.4 percent (The World Bank, 2016b).
Many people live on a day-to-day basis and do not have savings to put on a bank account
(Houlahan 2016). According to John M. Thompson, CTO at Indosat, this makes Indonesia a
cash market; a great majority of all purchases made are done using cash.
While poverty can be seen as one of the bottlenecks for the MNOs operating in Indonesia, the
rising middle class is one of the enablers. The Indonesian middle-class has been rising ever
since the economic boom in the country during the 80s and 90s (Ansori, 2009). However, the
estimation of the size of the current middle-class varies between analysts. According to
estimates by Oberman et al. (2012) the Indonesian consumer class will reach 135 millions in
2030, an increase from about 45 millions in 2012. The Boston Consulting group on the other
hand, estimated that Indonesia was home to 74 million middle-class consumers in 2013,
reaching 141 million people in 2020 (Rastogi et al., 2013). Despite the differences in
estimations, it seems to be an agreement on a rise in the middle-class spending, giving
companies opportunities to explore.
In 2014 the telecom industry contributed with approximately 3.17 percent of the Indonesian
GDP, which is quite far below the number of the manufacturing sector at 26 percent and the
mining sector at 10 percent. However, the growth of the telecom industry the same year was
10.36 percent, which was well above the national GDP growth of 5.06 percent (ASTI, 2016).
The telecom industry can be seen as an important contributor to the future growth of the
Indonesian economy (Effendi, 2016).
5.1.3 Social Factors
Indonesia is facing a growth in smartphone ownership driven by its young, urbanizing
population (Fife, 2015) and falling smartphone prices (Ericsson, 2016b). Dr. Effendi (2016)
means that the smartphone has become a lifestyle for many people; the high segment users
have come to change their phones close to every eighth month. The increase in smartphone
ownership has led to an increased demand for social media services such as Facebook and
Twitter; Indonesia has the world’s fourth largest Facebook user base (Fife, 2015). According
to a survey conducted by Rohit et al. (2013), social media is the main usage area for internet
among Indonesian consumers - about 70 percent of the internet users engage in some kind of
social media. Moreover, with its 29 million Twitter accounts, Jakarta was in 2013 the most
active Twitter city in the world. Online shopping and online banking are on the other hand
activities that are not as common; in the same survey, only 7 percent stated that they were
shopping online in Indonesia, compared to 32 percent in China. The reason seemed to be that
Indonesian consumers do not trust online shopping and online payment systems.
31
When trying to segment the Indonesian population, Telkomsel found that there is a large
customer segment that opposes the use of any technology coming from the west. Foo (2016),
general manager for strategy and market insights at Telkomsel, means that about 50 percent
of the Indonesian population can be classified as traditionalists, meaning that they are
skeptical or hateful towards new technology and social media. This group can further be
divided into people that are open-minded; they are open to technology but do not see the
benefit of using it and do not know how to acquire it, and people that are hard-core
traditionalists; they believe technology has a bad influence and will ruin traditions, religion,
and culture. The first segment is slowly converted into data users, as they see the relative
advantage rise. However, the latter segment is not easily converted and has during the last 18
months remained the same in number (Foo, 2016). The traditionalists are predominantly
found in rural areas, nevertheless there are still clusters of traditionalists within all main cities.
The Indonesian population is described by Shafi (2015) to be content-hungry when it comes
to internet, however somewhat hindered by a language barrier. Even though almost all
education and national communication in Indonesia is done in the official language “Bahasa”,
only one percent of the content on Google was available in Bahasa in 2013 (Grazella, 2014).
This number has increased since (Shafi, 2015) but it is still low. The language barrier lowers
the relative advantage of the internet for many people, and thus stalling the adoption. The
barrier gets even higher where the educational level is low, as is the case within the rural
population. As put forward in the model by Nakata & Weidner (2012), the relative advantage
is one of the most important factors for enhancing adoption where poverty barriers, such as
economic or knowledge deprivation, are present. If the need for content in Bahasa was
addressed, the relative advantage of using internet would increase. Hence, more people would
feel that access to internet is worth paying for, increasing the demand. To cater for the need of
content in Bahasa would be beneficial for the Indonesian MNOs. However, they cannot take
care of it alone as it requires the involvement of many parts of the ecosystem.
Contrary to many of the developed countries, Indonesian MNOs face the challenge of prepaid
mobile plans. As about 99 percent of the Indonesian consumers with a mobile devices use
prepaid, non-contract phone plans, MNOs are subject to a lower ARPU compared to MNOs
that can sign their customers up to contract plans, i.e. postpaid subscriptions (Dobberstein et
al., 2013). Jhon Welly (2016), former director at Telkom, means that the preference of
prepaid mobile plans is highly associated with the uncertainty of affordability; the amount of
money you can spend on mobile services each month might vary quite a bit. People normally
have SIM-cards from multiple MNOs. According to Dr. Bishry (2016) people experience that
the rates differ significantly if you call across the MNOs’ networks, wherewith it is beneficial
to use the same MNO as the receiver of the call. Hence, people change SIM-card depending
on whom they are calling or what offers are in place at a given time. Moreover, Foo (2016)
means that since MNOs in Indonesia do not offer subsidies for phones in postpaid offers, the
customers do not really see the value of having a postpaid plan over having a prepaid
subscription. Consequently, even if the customers are high-value customers and would afford
a postpaid subscription, they choose to stay with a prepaid subscription anyway.

32
The transit to data usage over voice and SMS has decreased customer loyalty; people are no
longer bound to a certain phone number and can thus change SIM-card even more freely than
before (Thompson, 2016). According to Gunnar Borg (2016), Ericsson’s technical responsible
towards Indosat, and Thompson (2016), the low degree of loyalty among the end-users results
in that people buy new SIM-cards instead of topping up their existing ones. Additionally, the
end-users have high knowledge about the offers coming from different MNOs and they are
continuously comparing them between each other to find the best suited for their momentary
needs (Borg, 2016). This makes the end-users even more unlikely to reload or recharge their
SIM-cards.
The educational situation of Indonesia has improved a lot since the financial crisis in the 90’s
(World Bank, 2014). As of 2014, the enrollment in primary schools was below 60 percent in
poorer district, while reaching 100 percent in the wealthier districts. The enrollment rate in
secondary education has steadily increased, reaching 66 percent as of 2014. However, it is
still below the levels in countries nearby (World Bank, 2014). Education has been one of the
main issues in the Indonesian development plan and is continuing to be one of the main focus
areas of the government (Fife, 2015). A rise in education level would lower what Nakata and
Weidner (2012) explained as knowledge deprivation among the BOP segment, which would
increase the ability to use new technology (Fife, 2015), including telecom equipment such as
smartphones (Dobberstein et al., 2013). This would in turn drive an increased adoption of
mobile data. According to Ameet Suri (2016), former partnership manager at Facebook and
internet.org, internet and technology can play an important role in bringing education to the
more rural areas, which are too far away to have teachers travel there. However, in what form
such services could be delivered is not clear.
5.1.4 Technological Factors
Indonesia is a country with geographical difficulties. It is an archipelago nation with
approximately 17.000 islands, of which 6.000 are inhabited, scattered over an area of 9.8
million sq. km, of which 80 percent is sea. The dispersed geographic of the country has
contributed to poor infrastructure (Fife, 2015). The poor infrastructure was rated by
executives as one of the most cumbersome aspects of doing business in Indonesia (WEF,
2016). According to Fife (2015) and WEF (2016), there are needs that are not met both when
it comes to roads, electricity, and telephony.
Mobile internet is largely dominating in Indonesia due to the geographical situation (Fife,
2015). The highest levels of internet penetration can be found in the western islands such as
Java, Bali, and Sumatra, where the internet backbone has been developed to a higher degree
compared to the eastern parts of the country, where the access to the backbone is very limited.
Today, most of the existing cable network in Indonesia is owned by Telkom, who tries to
push the ownership further through investments in the Palapa Ring Project (Fife, 2015). The
Palapa Ring Project is an initiative to extend the existing cable infrastructure to cover the
eastern parts of the country, which is executed by the government together with the MNOs.
33
According to Statistics Indonesia, 68 percent of the Indonesian population had access to a
cellular signal in 2014, while 23 percent had access to a weak signal (ATSI, 2016). The
remaining 9 percent do not yet have coverage since there is no BTS infrastructure where they
live. There are significant differences in average mobile download speed between the
different parts of Indonesia. The best network performance is found in Java, with average
download speeds at 7.0 Mbps in Jakarta and 3.5 Mbps in the rest of the island. All parts of
Indonesia have an average download speed above 1 Mbps apart from Maluku and Papua.
The number of mobile subscriptions is very high in Indonesia, exceeding the number of
inhabitants. The mobile penetration is expected to be 134 percent in 2016, thus making it very
saturated, and only slow growth in this area is expected in the future (Ericsson, 2016c). While
the number of subscription is becoming saturated, the proportion that is subscriptions utilizing
a smartphone is increasing rapidly. In 2013, both Samsung and Chinese manufacturers of
smartphones entered the Indonesian market, which made cheaper smartphones more available
and triggered a massive expansion of smartphone ownership in the country (Fife, 2015).
Ericsson (2016c) forecasts that the smartphone penetration rate will pass 50 percent in 2016
and reach 88 percent by 2020. A key feature of low to mid end smartphones in Indonesia is
the support of more than one SIM-card simultaneously, allowing the user to carry SIM-cards
from multiple MNOs in their phones (Borg, 2016).
The Indonesian market has long been dominated by 2G technologies in the form of GSM-
EDGE, which accounted for around 75 percent in 2015 (Fife, 2015). However, 3G
technologies is expected to surpass in popularity in 2016 and stay rather constant until 2020.
The big growth is seen in 4G subscriptions, which is forecasted to grow from a 10 percent
penetration rate in 2016 to 58 percent in 2020 (Ericsson, 2016c).
Because of the geographical situation of the country, it is expensive and difficult to install
fiber optics for fixed broadband (Fife, 2015). Consequently, mobile internet seems to be the
dominant way to access the internet also in the future. Thus, in order to get internet into the
homes, technological solutions building on mobile technologies have to be used (Houlahan,
2016; Wijaya, 2016). However, Borg means that to reach the same performance with LTE
that you can get from cable or fiber, huge bandwidth consumption is needed. Consequently,
such solutions do not have much potential in city areas but can be utilized among the rural
population where cable solutions are not possible.
5.2 Competitive Environment
It seems like the unique geographical situation of Indonesia has given rise to a quite
challenging situation for the MNOs, where there is a significant difference in profitability
between Java and the rest of Indonesia (Aidi, 2016). Since Telkomsel is the only player that
has had the ability to make the necessary infrastructure investments outside the island of Java,
they have managed to build a monopoly situation for themselves. In these areas, Telkomsel
has created a wide range of micro zones that allow them to uses cluster-based pricing and thus
34
charge differently depending on the situation (Telkomsel, 2015). As other MNOs are barely
present, it has provided Telkomsel with an opportunity to charge 2-3 times higher prices
(Ericsson, 2016c), contributing to a higher profitability.
Since Telkomsel is the only player in many areas, the industry rivalry there is low.
Consequently, the customers living in these parts of the country do not have the possibility to
choose between multiple MNOs and the distributors do not have the possibility to play MNOs
against each other, wherewith the bargaining power of buyers can be seen as low as well. The
only one of Porter’s five forces that still might have an influence outside of Java would thus
be the threat of substitutes. However, many of the people living there still use 2G phones and
are unlikely to change in the near future due to a traditionalist type of mindset (Foo, 2016).
The ones using data enabled handsets are still bound to use data from Telkomsel.
Consequently, the threat of substitutes is not yet a major issue here. In accordance with Porter
(1998), Telkomsel seems to have found an optimal market position where they have managed
to minimize the influence of competitive forces.
Regulations that make it possible for other MNOs to invest in network infrastructure jointly,
may come in place in a not so distant future. If such regulations went through, it would
threaten the monopoly situation of Telkomsel since Indosat and XL are currently expressing
intentions to extend their presence outside of Java. However, speculating about whether or not
this will happen lies outside the scope of this report, wherewith the analysis from now on will
come to focus to a greater extent on the currently more competitive situation of Java.
The situation on Java is somewhat the opposite of the situation outside of Java. Even if the
industry is, to a great extent, dominated by three large MNOs, there are multiple MNOs
beside these. This has contributed to an average industry profitability that is much lower. The
low profitability can be explained by looking at the five forces framework. As Porter (1998)
argued: if one of the five forces is strong, the profitability of an industry will go down. The
forces on the Indonesian telecom market are summarized in table 1.
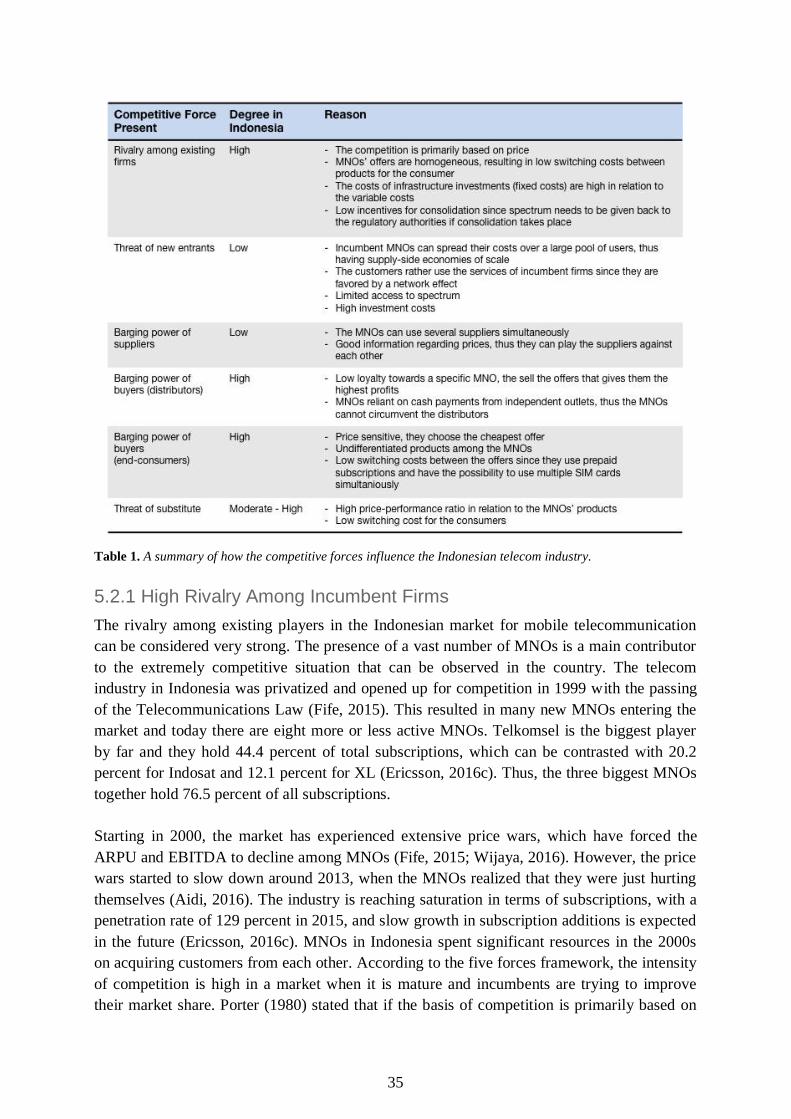
35
Table 1. A summary of how the competitive forces influence the Indonesian telecom industry.
5.2.1 High Rivalry Among Incumbent Firms
The rivalry among existing players in the Indonesian market for mobile telecommunication
can be considered very strong. The presence of a vast number of MNOs is a main contributor
to the extremely competitive situation that can be observed in the country. The telecom
industry in Indonesia was privatized and opened up for competition in 1999 with the passing
of the Telecommunications Law (Fife, 2015). This resulted in many new MNOs entering the
market and today there are eight more or less active MNOs. Telkomsel is the biggest player
by far and they hold 44.4 percent of total subscriptions, which can be contrasted with 20.2
percent for Indosat and 12.1 percent for XL (Ericsson, 2016c). Thus, the three biggest MNOs
together hold 76.5 percent of all subscriptions.
Starting in 2000, the market has experienced extensive price wars, which have forced the
ARPU and EBITDA to decline among MNOs (Fife, 2015; Wijaya, 2016). However, the price
wars started to slow down around 2013, when the MNOs realized that they were just hurting
themselves (Aidi, 2016). The industry is reaching saturation in terms of subscriptions, with a
penetration rate of 129 percent in 2015, and slow growth in subscription additions is expected
in the future (Ericsson, 2016c). MNOs in Indonesia spent significant resources in the 2000s
on acquiring customers from each other. According to the five forces framework, the intensity
of competition is high in a market when it is mature and incumbents are trying to improve
their market share. Porter (1980) stated that if the basis of competition is primarily based on

36
price, it will likely have the most detrimental effect on industry profitability. Further, he
identified some factors that usually result in price competition, and of those, two can be said
to be present in the Indonesian market.
Firstly, the MNOs have similar products and the switching costs between them are low. To a
large extent, the MNOs are basically offering the same service, connectivity, which makes it
hard to differentiate (Thompson, 2016). Since prepaid subscriptions dominate the market,
accounting for 97-98 percent, many Indonesian customers hold subscriptions from several
MNOs, hence they can easily switch between offerings depending on the situation (Effendi,
2016). This is the major reason behind why the subscriber penetration rate is far above 100
percent.
Secondly, fixed costs are high in relation to variable costs. Mobile telecom is a capital-
intensive industry; MNOs must invest in their networks to increase their capacity and
coverage. Exploding demands for data and new technologies make the capital expenditures
remain relatively constant at high levels. However, once the network is built, the marginal
cost of new subscribes is very low (Houlahan, 2016). This has been a main contributor to why
there, historically, have been extensive price wars on the Indonesian market; the MNOs have
tried to lower their prices to steal customers from each other. Thus, revenues could grow with
low additional costs. Today, MNOs are making efforts to differentiate themselves on other
dimensions than price, realizing the destructiveness of the price competition. Telkomsel is
practically the only player that is profitable, as the others have been operating with losses, so
the question is: why are there so few players exiting the industry? It seems like there are two
important factors to why this have not occurred to a greater extent than what is the case right
now.
Firstly, many of the small MNOs have foreign owners that possess personal commitment to
their companies (Houlahan, 2016); they do not necessarily care about the rationality of
remaining in business even if their companies are subject to poor performance. Many foreign
owners have plenty of cash from other successful businesses and can afford to put it into not
so successful projects to keep them alive.
Secondly, the prevailing spectrum policy does not allow MNOs to buy or trade spectrum, as
they do not possess the ownership rights to it but merely holds the right to use it. In the case
of a merger or acquisition between MNOs, additional spectrum gained from this endeavor
would have to be released and given back to the government that in turn would redistribute it
to another MNO that they consider being worthy of it. As spectrum ought to be considered as
one of the most valuable assets held by an MNO, an implication of a merger or acquisition
could be a substantial destruction of value. Thus, the incentives for consolidation have been
lowered through the functioning of the Indonesian spectrum policy.
Another factor that makes consolidation less attractive is the anomalous churn rates seen in
the Indonesian market. Usually a merger or acquisition would be advantageous, as it would
imply a number of additional subscribers. This might also be true to some extent in the
37
Indonesian market, but due to the disloyalty of consumers, and the vast number of
reacquisitions of customers that MNOs have to do each month, the value of gaining access to
another MNOs customer base might be of limited value. Taking these factors into
consideration, it seems like the low incentives for consolidation can help explain why the high
intensity of rivalry has sustained over a long period of time. However, since the main basis of
competition in the industry is scale, future consolidations seem probable.
5.2.2 Low Threat of New Entrants
The threat of new entrants in the Indonesian market should be considered low, as there are
significant entry barriers present. The industry is subject to high supply-side economies of
scale. Building a network is expensive, and the more customers that a MNO have, the lower
the fixed cost per user will be. This presents incumbent firms with a cost advantage compared
to new firms. Also demand-side economies of scale are present. Due to interconnection fees,
it is cheaper to make calls within the network of a single MNO. If more consumers have a
specific MNO, a higher percentage of their calls will be to that MNO, reducing their costs.
Thus, the service becomes more valuable, and a new entrant has a disadvantage. However,
this network effect is somewhat lowered when using voice over the internet instead of the
legacy services.
There is one very important incumbency advantage that is independent of size; access to radio
spectrum. Spectrum is a scarce resource that is necessary to possess for MNOs in order to
operate. The frequency bands are owned by the government in Indonesia, who sells the right
to use them to the MNOs for a specific time (Prihadi & Bishry, 2016). To obtain spectrum,
the right to use it must be bought in a spectrum auction held by the government. How the
government chooses to allocate the spectrum thus becomes important for the market
dynamics. This is especially relevant in Indonesia since there is an allocation coming up in
2018 with only two spectrum slots. Past performance, together with price and the possibility
to meet the set requirements, will decide which MNOs get the bandwidth. Hence, good
performance today will positively influence the future possibilities for an MNO. The
governmental broadband plan in Indonesia requires that specific areas are provided with
broadband. Upcoming spectrum allocation auctions will require the winner of spectrum to
provide their services in those areas of the country (Prihadi & Bishry, 2016). An implication
of this is that higher capital expenditures will become necessary to obtain spectrum than what
is currently needed. Apart from acquiring spectrum, a new firm would also have to invest
extensively to build a network or buy a company that already has one.
5.2.3 Low Bargaining Power of Suppliers
The bargaining power of suppliers is low. The main suppliers of MNOs are the providers of
base transmission stations (BTS) and SIM-cards. In Indonesia, there are three big vendors that
together have over 95 percent of the BTS market: Ericsson, Huawei, and Nokia (Aidi, 2016).
The MNOs are using several BTS providers simultaneously, choosing different vendors for
different geographical regions. The uniqueness of the products from the BTS providers is not
significant, the benefit of buying more expensive high quality BTSs is that they can handle
38
more users in each cell before the network gets overloaded (Borg, 2016). Borg (2016)
considers the MNOs to be in a more powerful position in terms of bargaining power, since
they are very informed and can play the BTS suppliers against each other. Moreover, BTS
suppliers are reliant on the MNOs as their customers, meaning that they cannot afford to
ignore them as a customer group. Thus the suppliers cannot be seen to have a beneficial
position even though they are fewer in to the number in comparison to the MNOs, wherewith
their bargaining power becomes low. Additionally, the BTS suppliers cannot credibly threaten
to integrate vertically, since there is no available spectrum for them.
Regarding the supplier of SIM-cards, they have low bargaining power. Even if the Indonesian
market is extreme in the sense that it consumes half of the produced SIM-cards in the world,
the SIM-card is a commodity, there are multiple vendors, and the cost of it is relatively low
(Thompson, 2016).
5.2.4 High Bargaining Power of Buyers
The bargaining power of buyers can be divided into the bargaining power of the distributors
and the bargaining power of the end consumer. The bargaining power of both these groups is
considered to be strong. For the distributors, the main problem for the Indonesian MNOs is
that they are highly dependent upon a great number of small independent outlets that sell their
offerings. These have no loyalty toward the MNOs and are playing them against each other
(Thompson, 2016). The individual distributors are not exclusive and have substantial
bargaining power since they will try to sell the packages that provide them with the highest
margins.
This situation can to a great extent be attributed to one important characteristics of the
Indonesian market: people are extremely price-sensitive. The price sensitivity manifests itself
in churn rates that are far higher than what is normal in more developed countries. Prepaid
plans dominate the Indonesian market, which makes the switching costs between MNOs low.
Customers are well aware of different offerings and are switching all the time to get better
deals (Thompson, 2016). A high prevalence of mobile phones that support dual SIM-cards
makes switching costs almost nonexistent. As data consumption increases, consumer loyalty
decreases even more; many young consumers are not using legacy services anymore as they
mainly use OTT services. Thus they are not bound to a specific phone number, and can use
their profile on OTT services irrespective of the MNO used for the provision of data.
The constant buying of new starter packages means that few people reload their SIM-cards;
instead they are disposed after usage. Thus, there is a constant demand for new SIM-cards
benefitting the distributors (Thompson, 2016). The small outlets selling the offerings are not
exclusive to a specific MNO, which is providing them with high bargaining power when
selling the SIM-cards. Since there is a low degree of differentiation between the offerings
from different MNOs, it becomes easy for the outlets to sell more of the offerings they prefer,
and they are thus incentivized to sell the ones providing them with the highest margins.
Hence, MNOs have competed with each other to give the most favorable conditions to the
39
outlets so that their offerings will be promoted over other players’. However, the problem is
that everyone has been doing the same, resulting in a big share of the sold goods going to the
distributors.
The bargaining power of the end consumers has to a great extent to do with the issues of
affordability and the low switching costs between the MNOs. Since a large proportion of the
Indonesian population lives close to the national poverty line, people are not eager to spend
money on mobile data. Consequently, people are incentivized to constantly look for the
cheapest offer. As cheap offers often come in the form of starter packages, people tend to
throw the old SIM-card away, buying a new starter package instead. This, together with the
fact that there are no barriers to switch between MNOs, makes the loyalty towards the MNOs
very low. Hence, customers buy the offer they find cheapest or best suited for their
momentary needs, pushing the prices of mobile data down.
5.2.5 High Threat of Substituting Services
The total threat of substituting services for MNOs should be considered significant. Porter
(1998) argued that the threat of substitutes is strong if the price-performance ratio of the
substitute is high and there is a low switching cost for the consumer. As of today, the
Indonesian MNOs derive their revenues mainly from voice, SMS, and data. With this in mind,
there are two major substitutes for those revenues: fixed broadband and OTT services.
The threat coming from fixed broadband is rather low in Indonesia. Fixed broadband services
should be considered a substitute, since it also provides the consumers with internet access. If
more consumers used fixed broadband services, parts of the consumed mobile data would be
on these services instead. However, fixed broadband have very low penetration in Indonesia,
and the infrastructure is severely underdeveloped (Fife, 2015). When considering the price-
performance ratio of fixed versus mobile broadband, it is clear that they are competing on
different performance parameters. Fixed broadband can never hope to fully substitute mobile
broadband, since it can never compete on the mobility parameter. This also means that the
switching costs for consumers would be high. Therefore, the best providers of fixed
broadband can hope for is that a higher share of the total consumed data would be provided
through fixed lines.
The threat stemming from competing OTT services is very high. The emergence of instant
messaging and voice over IP (VoIP) services offered by various OTTs are cannibalizing the
legacy revenues of MNOs. This problem is not specifically tied to the Indonesian market, but
is affecting MNOs worldwide. However, it may become even more pronounced in the
Indonesian market compared to other developing countries due to the very young
demographic, which is likely to adopt new technologies faster. This force has been set in
motion by the increasing adoption rate of smartphones, allowing consumers to circumvent the
traditional voice and SMS services offered by MNOs. Looking at the price-performance ratio,
these OTT services often have the same features and quality, but they are free to use, apart
from the small amounts of data that they consume. Moreover, the switching costs for
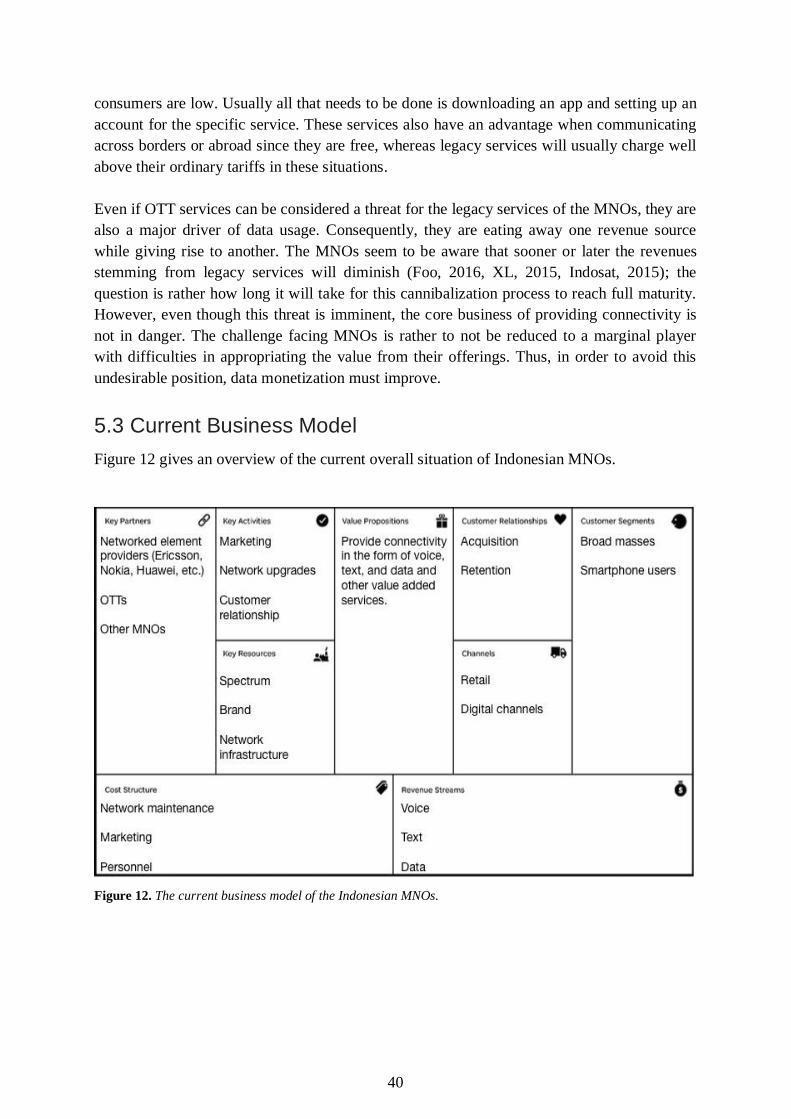
40
consumers are low. Usually all that needs to be done is downloading an app and setting up an
account for the specific service. These services also have an advantage when communicating
across borders or abroad since they are free, whereas legacy services will usually charge well
above their ordinary tariffs in these situations.
Even if OTT services can be considered a threat for the legacy services of the MNOs, they are
also a major driver of data usage. Consequently, they are eating away one revenue source
while giving rise to another. The MNOs seem to be aware that sooner or later the revenues
stemming from legacy services will diminish (Foo, 2016, XL, 2015, Indosat, 2015); the
question is rather how long it will take for this cannibalization process to reach full maturity.
However, even though this threat is imminent, the core business of providing connectivity is
not in danger. The challenge facing MNOs is rather to not be reduced to a marginal player
with difficulties in appropriating the value from their offerings. Thus, in order to avoid this
undesirable position, data monetization must improve.
5.3 Current Business Model
Figure 12 gives an overview of the current overall situation of Indonesian MNOs.
Figure 12. The current business model of the Indonesian MNOs.

41
5.3.1 Key competencies/ Success factors
Historically, the Indonesian MNOs have seen as their assignment to deliver the infrastructure
and network over which their end-users can connect to each other as well as third party
services. The network has been able to carry both legacy services, such as voice and SMS, but
in later years also data traffic. As the amount of data traffic has grown, the MNOs have
increased the emphasis on not only provide customers with connectivity but also enable a
mobile digital lifestyle (Telkomsel, 2015; Indosat, 2015; XL, 2015; Wijaya, 2016).
To have good network coverage and strong network performance have traditionally been
factors crucial for the success of MNOs (Houlahan, 2016). The network performance is often
valued way above price, making it the most important factor for end-user (Ericsson, 2013;
Houlahan, 2016). A good network performance and coverage require the MNOs to invest
capital in the infrastructure, making the industry capital heavy and thus reliant on the scale of
the MNOs (Welly, 2016; Bishry & Prihadi, 2016; Houlahan, 2016). As end-users are attracted
by a good network performance, investments in the infrastructure give rise to new customers,
which in turn give rise to increased scale. Thus the process can be seen as a continuous circle,
beneficial for the MNOs who manage to get into it (see figure 13).
Figure 13. How scale influences the performance of MNOs.
However, even though customers are attracted to the MNO with the best network
performance, the price is more or less set by the market. Since affordability is still a big issue
in Indonesia, customers are good at comparing offers of different MNOs, resulting in people
having multiple SIM-cards and choosing to use the one that has the best offer at every
moment (Bishry & Prihadi, 2016). Hence, in order for the MNOs to be profitable it has
traditionally been important to keep costs down and make efficient investments (Houlahan,
2016). The importance of cost efficiency has increased further with the entrance of data
42
traffic, since the price for each gigabyte is decreasing (Ericsson, 2016a). Thus, when a shift in
technology generation has taken place, it has been important to attract users to the new
technology in the cities it has been employed. E.g. more users on 4G without exceeding the
capacity would mean that the investment and maintenance costs get spread out over more
users that still pays the same price, resulting in a lower cost per user and hence increased
profitability (Houlahan, 2016).
5.3.2 Value Creation
The revenue streams of the Indonesian MNOs come mainly from the retail of voice, text, and
data to the end-users. Such mobile service revenue account for over 90 percent of the total
revenue of the MNOs. In the first quarter of 2016, the revenue coming from voice ranged
between 33-44 percent for the three largest Indonesian MNOs (Ericsson, 2016a).
The value proposition provided by the Indonesian MNOs today is very much directed towards
the broad masses of end-users, even though smartphone users gain more attention due to their
possibility to drive the data revenue. Beside smartphone users and non-smartphone users, the
customers can be divided into different technology groups: 2G-users, 3G-users, and 4G-users.
The 2G-users still amount for the largest installed base today even though the adoption of
smartphones has increased the number of 3G and 4G users significantly (Ericsson, 2016a). 2G
users are especially common outside of Java, where the telecom infrastructure is less
developed (Aidi, 2016), however they can be found throughout the whole country.
Since mobile subscriptions in Indonesia almost exclusively are prepaid, it is important with
marketing in order to reach customer retention. Special offerings to attract new customers and
retain old ones are therefore common.
5.3.3 Operations Efficiency
The main cost of the MNOs is by far the network maintenance, followed by the costs of
distribution, personnel, and marketing (Ericsson, 2016a). As stated earlier, it is necessary for
the MNOs to make large investments in the infrastructure in order to stay competitive.
Moreover, the situation with the distribution outlets makes the cost associated with
distribution high.
Traditionally the Indonesian MNOs have been partnering with networked element providers
such as Ericsson, Huawei, and Nokia. However, during the last years collaborations and
partnerships with OTTs and other MNOs have come to play a more crucial role for the
MNOs’ operations (Aidi, 2016). Bundling offerings together with OTTs have helped the
MNOs to offer more attractive services to the end-users, which have been important when
attracting new data customers (Wijaya, 2016). To collaborate with other MNOs have been of
importance for the smaller players in order to reach a better operational efficiency (XL, 2015).
The key resources of the Indonesian MNOs include their allocated spectrum. The spectrum is
a scarce resource and one thing limiting the operations of the MNOs. To be regranted the
43
spectrum by the government and gain access to new spectrum in the allocation procedure are
thus crucial for the MNOs continued operation (Effendi, 2016). Beside the spectrum, trust is
important for the MNOs. It is upon trust they can build the customer relationship, which in
turn is the basis of customer retention. Trust is built upon the brand name and the brand of
each of the MNOs can therefore be regarded as a key resource. To keep the brand name and
trust with the help of marketing and customer relationship is thus a key activity. Moreover,
the network infrastructure can be regarded as a key resource since it is through the network
the MNOs can provide their services.
5.3.4 Organizational Context
Houlahan (2016) states that in order to run a successful network, MNOs need high
engineering capabilities and capital, something that they possess today. The organizations are
built up in divisions, allowing the employees to gather expertise within specific fields.
However, even if a clear organizational structure has helped the MNOs to aggregate the
knowledge needed, it has also made it possible for internal division barriers to occur.
Houlahan (2016) means that the Indonesian MNOs have the knowledge within
their respective organization to take better investment decisions than they do today. However,
the necessary knowledge is divided between different departments and flaws in the
communication and collaboration between those departments make it hard to access the full
spectrum.
MNOs base their investment decisions on careful analysis and planning in order to optimize
the allocation of capital. These big capital investments that have to be successful have
resulted in a culture that is not tolerant with failure. Houlahan (2016) says that if you study
the most successful providers of digital services, they are constantly experimenting and do not
mind that many of the initiatives fail. Further, he thinks that many senior executives in MNOs
regard their culture as their biggest problem, as it is not suited for providing new innovative
digital solutions.
Another problem faced by MNOs is that they have a hard time attracting young talents. Many
new graduates have the desire to work in a company with a culture where experimentation
and taking own initiatives are encouraged, and where things proceed quickly. As of today, the
situation does not look like that within the Indonesian MNOs.

44
6. Data Monetization Strategies Several strategies are currently being employed by Indonesian MNOs to adapt their business
models to become more relevant in a data centric world. The MNOs have launched initiatives
that focus on different aspects of their operations, and a single winning strategy cannot yet be
seen. After going through written material from MNOs and stakeholders, and conducting
interviews with a number of them, it could be concluded that the initiatives taken so far can be
categorized into three main areas: core services, pricing strategies, and value-added services.
Under the category of core services initiatives related to the core business of connectivity are
found. The category of pricing strategies includes things like customer segmentation and
alternative customer definitions. Those initiatives were found to somehow change the way the
MNOs charge for their products or services. All the big Indonesian MNOs are today trying to
extend outside their core business of connectivity to be what they call “digicos” (Indosat,
2015; Telkomsel, 2015). Initiatives taken to support this shift were categorized under value-
added services. Partnerships were thought to be important for all of the categorized initiatives,
wherewith it was put above all of them. The initiatives taken by Indonesian MNOs are
summarized in table 2.
Even though Indonesian MNOs have undertaken a lot of initiatives to try to find ways to
monetize on mobile data, there are still many more to explore. By drawing from the
knowledge about the Indonesian market compiled in Chapter 5, some of those initiatives are
discussed below together with the ones already taken.
Table 2. A summary of the initiatives taken by Indonesian MNOs.
6.1 Partnerships
The Indonesian MNOs are seeing a value in engaging in collaborations and partnerships with
third party players such as OTTs, other MNOs, device manufacturers, and infrastructure
providers (Foo, 2016; Indosat, 2015; XL, 2015). Partnerships with key players are identified
by Ericsson (2014) as an important aspect of MNOs’ strategies. MNOs who have a short-term
45
approach to their relationships, focusing on getting the best price and playing suppliers
against each other, run the risk of steering away from the creation of new solutions and
instead spend unnecessary efforts on negotiations. Top performing MNOs develop and
maintain intelligent collaborations with relevant partners (Ericsson, 2014).
Today, many of the Indonesian MNOs partner with OTTs around offer bundling; they see a
value in offering the services of chosen OTTs together with their own connectivity to end
consumers (Foo, 2016; Indosat, 2015; XL, 2015). As an example, Telkomsel is bundling with
HOOQ to allow its subscribers to access HOOQ TV content without the use of a credit card
(Ericsson, 2016d). But OTTs are not the only type of collaboration partner for the Indonesian
MNOs; device manufacturers, other MNOs, and infrastructure providers are also seen as
valuable partners. Some examples of this is the Indosat-IBM partnership to develop cloud
solutions (Ericsson, 2016c), the XL-Indosat collaboration to do active network sharing
outside of Java (Indosat, 2015), the Smartfren-LG Innotek Indonesia collaboration to launch
Mifi devices (Smartfren, 2105), and the Telkomsel-Xiomi partnership to offer high
specification smartphones to affordable prices (Telkomsel, 2015).
Thus, Indonesian MNOs are in the phase of building and engaging in ecosystems by
collaborating, investing in joint ventures, and undertaking acquisitions. This kind of
ecosystem building can give the MNOs the possibility to exploit new revenue sources as well
as give them the opportunity to become more effective in network investments. Nevertheless,
Thompson (2016) means that the big OTTs do not stand knocking on the doors of the MNOs;
it is still a fight to drive those potential high-value collaborations for the MNOs.
6.2 Core Services
The initiatives below have to do with the core business of the MNOs: providing connectivity.
By using their network assets and capabilities, the Indonesian MNOs are looking into how
they can improve the user experience. Today, end-users are the main source of revenue
for MNOs, wherewith it is of high importance how they perceive the quality of the network.
6.2.1 Network Investments
Houlahan (2016) stresses the importance of MNOs’ network performance as an important
determinant for success. Those MNOs that provide the best application performance, which is
driven by the underlying network performance, have been the winners on today’s market. He
further states that in consumer surveys, they consistently see that consumers value network
performance above everything else.
The network has traditionally been the most valuable asset for all MNOs and will continue to
be so when data drives growth. Foo (2016) means that network performance will probably
become even more important as people get less tolerant with network failure when using data
compared to e.g. SMS. At the same time as investments in the network become more
important than ever in order to keep customers, the money is not always easily accessible. To
46
build a good quality network over large areas is costly and the investments therefore require
planning to be done as accurate and effective as possible.
Thompson (2016) means that the big difference when trying to optimize the network
performance for data instead of voice is the difference in congestion. When people use voice,
the network reaches a point where it very rapidly gets congested. However, with data this is
not the case. Instead the available bandwidth is divided between all the users on a BTS; the
more users there are in an area, the less bandwidth they get. As the number of users on the
same BTS increases, the performance gets worse. The difficult question then becomes to
decide when the performance is too bad, i.e. when do they need to upgrade that cell. To
handle this, Thomson (2016) explains that Indosat has started to set targets for the capacity
users should get in the different cells. In the past the investments in the network were made
more reactively; when the network was overloaded someone tried to do something about it.
However, Borg (2016) means that it is easier to motivate the reactive investment than the
proactive ones; when customer care gets complains it is very direct feedback, but to base the
investments on logical forecasts is probably a better use of the money.
Another way to optimize investments in the network is by trying to identify the high-value
customers and optimize the network after them. Houlahan (2016) means that since MNOs
often get the majority of their revenues from a small customer base, an effective way to invest
would be to make the network experience superior for the high-value customers while only
making it decent for the rest. One Indonesian MNO employing such a strategy is Telkomsel.
Telkomsel has launched an initiative that gives their postpaid, high-value customers, priority
in their network. However, Foo (2016) explains that even if this was a differentiator in the
beginning, the postpaid customers have during the last 18 months started to take this for
granted. So instead of making customers happier, it has actually increased the customers’
expectations on the network quality, making them more difficult to meet. Indosat are also
trying to look at those kind of value-based investments. Their marketing team has created
subgroups of customers, trying to find out where they use their phones and from that create
suggestions for investments (Thompson, 2016). To optimize the network for high-value
customers, Houlahan (2016) further means that it requires close collaboration between the
marketing team; who has the customer insights, and the network planning team; who makes
the actual investments, something he means is not always the case.
According to Thompson (2016) they also see a problem that when they increase the capacity
in the network they almost immediately get higher volumes of data traffic. However, the
increase in revenue is not proportional; if the traffic goes up with 33 percent, the revenue
might only increase with 5 percent. He further means that this probably has to do with the
investments being made in areas where people do not fully utilize their existing data
packages, i.e. if they use 5 out of 10 GB before the investments in the network; they start
using 8 GB afterwards instead. This means that the revenue is not increasing. Instead MNOs
need to find out where the utilization of the data packages is high so when they add capacity
the users buy an additional package. To do so might mean further collaborations between
marketing department and network planning team.

47
Another challenge with network investments for dealing with increased data volumes is the
accuracy of the forecasts. The investments in BTS and other network components are
commonly done based on forecasts done one year in advance. However, as the data usage in
Indonesia is rising very quickly, and the MNOs are engaged in large promotion campaigns
where they are giving away data cheaply to increase usage even further, the forecasts are
often wrong (Thompson, 2016). An additional implication of the quick and unpredictable rise
in data traffic is that the MNOs somehow lose control over the network performance.
According to Thompson (2016) this has the effect that it gets hard to do very precise things
like optimizing QoS to certain applications or high-value groups; to do so would mean to
claim to be more precise and organized in terms of network than what they actually are.
Consequently, when the market growth stabilized it will be easier to make such
prioritizations.
6.2.2 Big Data and Analytics
One tool that can help MNOs is analytics of big data. Today, the massive amount of existing
data combined with cheap computing power and new algorithms make it possible for MNOs
to use analytics to improve their businesses (McKinsey, 2016). According to McKinsey
(2016), advanced analytics will provide a big change in the organizations of MNOs, and can
be utilized to improve the entire value chain. By gathering data about the customer
experience, the MNOs know when and where they need to improve the network (Ericsson,
2014). If MNOs manage to use advanced analytics on their continuously collected data it
would be possible to predict customer behaviors and enable a more accurate prediction of
churn, facilitating a decrease of capital expenditures (McKinsey, 2016). Customer churn is
problematic for MNOs and their efforts are often expensive and inefficient. Through the use
of analytics, the costs for customer retention efforts can be reduced. An MNO can find those
customers that show the highest likelihood to churn and target their efforts on them, instead of
using retention resources proactively on all their customers.
However, according to Houlahan (2016) the Indonesian market do not necessarily need to
analyze big data per se to improve the performance and customer experience. He means that
big data is more a tool for fine-tuning. But even if big data might be a tool for fine tuning
when it comes to network performance, it can be used as a knowledge base in other situations.
Telkomsel is right now looking into how the can further monetize on their tremendous
amount of customer data (Foo, 2016).
6.2.3 Digitization
Customer relationships are one of the key assets of the MNOs (Osterwalder & Pigneur, 2011),
and something they have learned to master for years. However, with the digital age comes the
opportunity to fully digitize their approach to customer relationships in order to meet the
demands on customer service and to reduce operating expenditures (McKinsey, 2016). The
big challenge is to actually get people to use the digital channels rather than continue to rely
on traditional call centers and in-store help desks. MNOs often lag behind top performing

48
brands when it comes to the digital experience and digital customer service (Ericsson, 2016a).
According to research conducted by McKinsey (2016), customers often think that the MNOs’
digital customer service channels are too complicated and complex, leading to customers
getting stuck in the process and eventually turning to call centers or in-store services anyway.
Ericsson (2016a) found that in order for MNOs to be able to monetize the benefits derived
from digital customer service, the digital experience needs to be intuitive for the customers.
Telkomsel is one of the Indonesian MNOs that have taken a leap forward in digitizing the
customer experience. In early 2016 they launched their customer relationship application
myTelkomsel, something Foo (2016) means will help them improve the entire customer
journey. Since launching the app, Telkomsel has seen an increase both in transactions done
using the phone, but also customer engagement in general. They further see myTelkomsel as
an important part in customer experience, something they mean can help both overcome
customer disloyalty and to increase the ARPU.
6.3 Pricing Strategies
Pricing strategies are among the most powerful tools MNOs have to regulate the revenue
(Cisco, 2014). How MNOs choose to price a service will decide what function that service
will have for the MNOs’ business models. Pricing strategies can differ depending on what
service it concerns or to what customer segment they are directed towards.
Traditionally, MNOs have utilized a strategy where they have been charging customers for
voice while selling data cheaply. However, ever since the data consumption started to
increase rapidly, many MNOs are undergoing a transition to instead charge for data, selling
voice more cheaply to the customers buying data. This transition has already taken place in
the Western world, but Indonesian MNOs are just starting to feel the necessity to change
(Thompson, 2016; Borg, 2016). However, as long as customers are not bound to a specific
MNO, it is hard for a single MNO to alone drive such a change.
6.3.1 Starter packages & Unlimited Data
The change in pricing strategy is partly stalled by the historical price war between the MNOs
and the resulting tradition of marketing very cheap starter packages (Thompson, 2016). Since
the churn rate of customers is very high in Indonesia, customer acquisition takes up a lot of
the MNOs resources. Starter packages have been one way to attract customers (Telkomsel,
2015). However, as the customers are not guaranteed to continue with the same MNO after
the starter packages have run out, they are never turned into more valuable customers. Instead
of topping up their data package when it is used up, customers just switch to their second or
third SIM-card (Borg, 2016).
Moreover, to attract users to their 4G network some MNOs have launched offers of unlimited
data plans (Indosat, 2015; Smartfren, 2015). With unlimited data people are allowed to buy a
package that allows them to download an unlimited amount of data. However, since this has
49
led to congestion in the networks of many MNOs and low monetization on the data traffic
(Borg, 2016; Thompson, 2016), it is today not widely implemented.
6.3.2 Differentiation Among Offerings
A strategy pursued by Indonesian MNOs is the provision of different brands targeted to
different customer segments (Telkomsel, 2015; Indosat, 2015; XL, 2015). Each brand
package tries to adapt to the way of life of the targeted segment. Factors such as data
allowance, speed of connection, number of devices, and extra services, are combined
differently in offerings, thus ensuring a more tailored alternative for specific customer
segments. By trying to optimize revenues from different customer segments, instead of
relying on “one-size-fits-all”, the MNOs can earn more revenue from those segments less
price sensitive, willing to pay for great service and customer experience (Strategy&, 2015).
Shared data plans are one way in which additional value is provided through differentiation of
offerings. One example of such a plan is Telkomsel’s LOOP Sharing-an that allows users of
the Telkomsel brand Loop to buy mobile data that they can share with 3-5 friends (Telkomsel,
2015).
6.3.3 Sponsored Data & Zero-rating
Other pricing strategies that are appearing in Indonesia are the ones of zero-rating and
sponsored data. The former is when MNOs do not charge for data used in specific
applications. This means that the MNOs bear this cost, but can benefit from attracting new
subscribers or improving the loyalty among existing customers (GSMA, 2016). Zero-rating is
employed by e.g. Telkomsel in their product Halo Fit for the postpaid brand kartuHalo where
they allow users to get free access to certain OTT apps (Telkomsel, 2016a). Sponsored data is
when a third party, i.e. a sponsor, pays for the data traffic to e.g. certain sites or when
watching a specific video. Hence, sponsored data would allow developers, OTTs, and other
content providers, to subsidize data usage of subscribers. The difference in this case,
compared to zero-rating, is that the MNOs are not giving away anything for free, they just let
a third party pay for it. According to Thompson (2016) discussions are taking place between
the MNOs and suppliers to solve the issue of sponsored data technically. However, the
problem of implementation does not lie in the technical aspect but in the interest from the
OTTs. Thompson (2016) further means that the OTTs are not eager to pay for an increased
QoS to their sites or apps. He means that it partly lies in the interest of the OTTs to reduce
MNOs to marginal players, giving a larger share of the pie to the OTTs themselves.
A large part of the Indonesian population lives in, or close to, poverty. This has led to that the
Indonesian MNOs have had to rethink how to access this part of the market. Indonesian
MNOs are today offering micro packages of data and voice to cater for this segment
(Houlahan, 2016). However, according to Suri (2016), it is not enough that the MNOs offers
data packages in smaller sizes to engage the poorer segment of the market in data usage. Even
if data is sold in smaller and thus cheaper packages, the applications will still require the same
amount of data, hindering people to use them. Instead the whole ecosystem has to be
50
rethought. Indosat-Ooredoo has started to work together with Facebook with their initiative
Free Basics (Indosat, 2015), a platform which offers very basic versions of applications or
sites (internet.org, 2016). By offering lightweight versions of applications such as Facebook,
users can visit the site without using any of their data. Thus, consumers without a data plan
can access it. However, Suri (2016) means that even though this kind of service is a good
start, for it to be sustainable it has to be profitable for the MNOs; they have to find a business
model that helps them grow.
6.3.4 Mobile Advertising
With an increased amount of time spent on mobile devices instead of traditional devices such
as TVs, the mobile advertising market is facing continuous growth (GSMA, 2016b). The
broadcasting and media industry have successfully managed to incorporate, if not fully build,
their business models on advertising; tapping into other revenue streams than subscriptions by
searching for new ecosystem opportunities (KPMG, 2011). MNOs have multiple assets that
can help them monetize the mobile advertising opportunity. As discussed earlier, MNOs have
access to vast amounts of customer data, both primary data given away when the customers
sign up to the MNOs as well as location data, whenever the device is connected to the
network. However, Foo (2016) means that the primary data received when the customers buy
a SIM-card is not necessarily correct, since it is never double-checked against any database. If
the MNOs could get access to correct data they would be able to, by combining location,
direction, and demographical data, send out targeted coupons to customers that meet specific
criteria (GSMA, 2014a). By selling their knowledge about the customers to third party
companies, the MNOs can gain complementary sources of revenue (Cisco, 2014).
Houlahan (2016) states that today, MNOs get almost none of their revenues from advertising.
Although he sees potential for improvement in this area, he also stresses that they have a
disadvantage compared to OTTs such as Google and Apple. The OTTs will have access to
most of the information that the MNO have plus additional information stemming from the
usage of their services. Moreover, Foo (2016) points out that the OTTs often require the users
to sign up using confirmed personal information, which the MNOs do not have access to.
Thus, they can offer a more accurate picture of consumer preferences to advertiser than
MNOs possibly could. Another problem is that the total spend on advertising in Indonesia is
only a fraction of the total spend on mobile data. According to estimates by Google the
Indonesian digital advertising market was $300 million in 2015 (Reuters, 2016).
6.4 Value-Added Services
Value add-ons are another thing that is used by the Indonesian MNOs to try to increase the
value of their offerings (Telkomsel, 2015; Indosat, 2015). These value add-ons come in many
forms, and could be e.g. media services, mobile commerce, or cloud storage.
51
6.4.1 Mobile Commerce
Services related to mobile commerce have been launched by many MNOs in the world
(GSMA, 2014), and provide a way for them to create a focal role in a new ecosystem and
leverage their key capabilities (KPMG, 2011). MNOs can use their status as a trusted party to
provide security in transactions through the phone or other devices. The MNOs can provide
authentication and a secure connectivity between a customer and a merchant, ensuring that all
personal information is encrypted (GSMA, 2014). MNOs can also facilitate effective loyalty
schemes and couponing for merchants.
Houlahan (2016) sees a major problem in Indonesia today when consumers want to make
purchases online. Since only a small proportion of the population owns a credit card, people
have no means to pay for their goods. Buying something online without a credit card today is
very complicated, where the consumer must first buy a code and then go to a bank to make it
happen.
Houlahan (2016) believes that the process of buying something online could be simplified
considerably and identifies payments as one of few areas where MNOs could actually have an
advantage compared to OTTs. According to Foo (2016), MNOs have the advantage of their
billing relationship with the end customer, something the OTTs lack. The payment solutions
provided by Apple and Google are based on credit cards, which means that they could only be
used by a small percentage of the Indonesian population. If MNOs find a good solution, they
could possibly charge a few cents per transaction, and as the volume increases over time, this
could result in a new source of revenue. However, even though Houlahan (2016) thinks there
is potential to get additional revenue from this area, he do not believe that payments are the
future of Indonesian MNOs, but rather that it could increase their revenues by 2-3 percent.
On the issue of MNOs offering mobile banking services, Houlahan (2016) says that it has
been done successfully in certain markets, with Bangladesh being most prominent. The
MNOs in Indonesia started a collaboration with Bank Indonesia, the central bank of the
country, a few years ago. However, the MNOs have been very quiet about this initiative
recently so little is known about how it is proceeding. Houlahan (2016) also questions the
potential for mobile banking, since the assumption that unbanked people want to become
banked is not necessarily true; a large portion of the population is living on their daily
salaries, meaning that they have no need for storage of their money.
6.4.2 Video and Content
Historically, MNOs have made several efforts to monetize different types of content, by
selling ringtones, games, and music. With video accounting for 54 percent of global data
traffic in 2015, it is becoming an increasingly important source of revenue (GSMA, 2016).
There are two major pathways that can be followed by an MNO that wishes to monetize on
this growing trend (GSMA, 2016b). The first one would be to bundle their offerings with
various kinds of content, where the MNO only serves as the provider of connectivity. This
approach has the potential to increase the data consumed by customers, while also improving
52
brand and attracting new subscribers through new competitive offerings. At the same time
OTT players can leverage the close customer relationship and billing services of operators to
reach new customers or enter new markets. The benefits of this approach are that it is a
relatively low risk associated with it and it does not require any substantial additional
investments. As discussed earlier in the chapter, Indonesian MNOs are already bundling
offers together with OTTs.
The second path would be to integrate vertically by creating a proprietary platform for content
delivery (GSMA, 2016). A platform that manages to attract users would provide the MNO
with the benefit of increased data consumptions, just as the bundling strategy, but also enable
it to monetize on the actual usage of the platform by their customers. These cash flows could
stem from subscriptions, pay-per-view fees, or from advertisers.
53
7. Business Models for Mobile Data This chapter analyzes the MNO business model and offers suggestions for how different parts
can be improved. Further, it discusses two possible ways forward with different implications;
should MNOs remain a provider of connectivity or become a provider of a digital ecosystem?
7.1 Improving the Business Model
Realizing that the shift from voice to data is inevitable, the Indonesian MNOs are facing the
question of who they should become in the new data centric world. A major decision that
needs to be made is if the MNOs should be only a provider of connectivity, or if they should
alter their business model and also become a provider of a digital ecosystem. It seems like
Indonesian MNOs, in their communication to stakeholders, have intentions to become leading
“digicos”, even if it is unclear what that they actually mean with that. Today, all the big
MNOs have launched various VAS, but they still only account for an insignificant part of
their revenues.
Irrespective of if Indonesian MNOs choose to become a sole provider of connectivity or
providing additional VAS, it seems like there are areas in the business models that can be
changed or improved. As discussed in Chapter 2, Lindgardt et al. (2009) mean that an
innovation of the business model takes place when two or more blocks of the business model
are innovated. To focus on the core business, abandon VAS, and become a provider of
connectivity would not imply a business model innovation for the Indonesian MNOs. They
would withdraw from some of their initiatives and instead focus on their core: connectivity.
Instead of a total business model innovation, the suggestion is that the Indonesian MNOs act
even more effective and efficient in their doings, trying to streamline the planning and actions
taken. However, engaging in VAS in addition to connectivity would require the MNOs to
reinvent some parts of their business models to fit the additional services. Moreover, it
implies the persuasion of multiple business models simultaneously.
What the choice really means for the Indonesian MNOs is to decide what to differentiate on.
As of today, the low degree of differentiation among their offerings is leading to disloyal
customers and consequently hurting their profitability. In the next section, suggestions for
how different parts of the business models could be changed are presented. Further down the
chapter, implications and challenges with the different choices are presented.
7.1.1 Value Proposition
Instead of providing voice, SMS, and data, as MNOs do today; the future will most certainly
be centered on the provision of data. Even though the decline of voice and SMS revenues is
painful to the MNOs, it is in the long run inevitable. Monetizing data better could mean
smarter offerings that differentiate the service in various ways, e.g. data allowance, speed,
QoS, support for multiple devices, etc. If an MNO choose to be a provider of a digital
ecosystem, there is also potential for MNOs to provide VAS of different kinds and thus create
54
new revenue sources. When considering the Indonesian context, two areas look particularly
promising: mobile payments and content platforms.
The current situation in Indonesia makes mobile payments an attractive opportunity for
MNOs. When considering mobile payments for physical stores, there is likely few benefits
compared to paying with cash or credit cards. Instead, the opportunity lies in mobile payments
for digital and physical goods online. The big problem in Indonesia is that it is very difficult
for people to buy things online, as the majority does not have a credit card (Houlahan, 2016).
So even if there is a demand to buy things online, the process is complex and involves many
steps, where customers would have to visit a bank each time they want to make a purchase.
Thus, there is considerable potential to simplify this process. There are already mobile
payment solutions offered by some of the big OTTs. However, these have a great
disadvantage since they are all card based, meaning that without a credit card they become
useless. Therefore, there is a potential for MNOs to provide their own payment service. This
has already been done by some of the MNOs, and they have the advantage that people can
load their SIM-card with credits, which can further be used to purchase goods online. A
problem with MNOs providing mobile payments would be the local scale of it; it might only
be compatible in Indonesia and might only be used to buy goods from local companies. A
possible solution to this problem would be for MNOs to collaborate with selected OTTs and
allow the MNOs customers to pay for OTT services with their mobile credits.
Another possible VAS is to provide some kind of content platform. As there is intense
competition in this domain, MNOs would likely have to differentiate their own platform in a
meaningful way to be able to compete with other solutions successfully. As net neutrality is
not enforced in Indonesia, it could be possible for MNOs to provide their own platform with
better QoS. This would give them an advantage compared to OTTs. It would also be possible
to apply zero-rating for their own platform. This would allow their customers to use their
platform without consuming their data, and revenue could be derived from subscription fees
or more likely advertising. Since most consumers in the market are very price sensitive, this
could help to increase the adoption of the platform. There is probably higher potential for
MNOs to offer a platform with content that is not user generated since it would be hard to
compete with global platforms that have a larger user base. Thus, it would be a significant
disadvantage since less content would be available. One possible focus and differentiator
could be for the MNOs to offer content in Indonesian; something that would address the
current problem that little material on the internet is available in Indonesian languages.
7.1.2 Customers & Revenue
A problem seen in the Indonesian market today is that MNOs are monetizing voice and SMS
rather well, but have not yet managed to do the same with data. Instead data has been given
away very cheaply to attract customers to the new networks, helping to decrease the high
fixed costs associated with network upgrades. Converting customers to modern networks is
good business for the MNOs, since the cost per megabyte is lower on these (Houlahan, 2016).
However, many MNOs have been too eager converting their customers to these networks,
55
offering packages with unlimited or close to unlimited amounts of data. As a result, their next
generation networks have already become congested, while additional revenues remain low
(Thompson, 2016). Thus, more rational pricing strategies seem like an important solution to
mitigate this problem.
Traditionally, the MNOs have been very focused on the end-users for revenue. As long as the
number of people using data is increasing, revenues from end-users will continue to increase.
However, as large parts of the end-users are very price sensitive it can be cumbersome to
increase the revenues substantially from this group when the market saturates. Consequently,
the Indonesian MNOs need to abandon the view that the end-user is the sole customer and
look beyond them to find new sources of revenue. If the MNOs choose to only be a provider
of connectivity, OTTs could become valuable partners, since they will be the ones providing
large parts of the value of the connectivity. Additionally, OTTs could become paying
customers. From a technical perspective it is possible to differentiate the QoS dependent on
the application or website used (Thompson, 2016; Borg, 2016). Since Indonesia is a country
where net neutrality is not enforced, and it does not seem to change in the near future, there
are no regulatory issues of doing so. The challenge would be to convince the OTTs that
differentiation based on network quality is a good idea, as they do not seem too eager to
collaborate on that right now.
An alternative would be that the MNOs take parts of the increased advertising revenue from
the OTTs as payment for improving the QoS to their sites, something Indonesian MNOs are
already discussing. Another way to engage OTTs as customer would be through sponsored
data. As sponsored data is not a new phenomenon it might be easier to start with. By letting
the OTTs pay for the data carried to their sites it would allow the end-users, which are the
customers of both the OTTs and the MNOs, to use the OTTs’ sites more frequently,
increasing the revenue for the OTTs. This would be especially applicable in Indonesia as the
end-users are very concerned with the affordability of data.
As the consumer class in Indonesia is growing rapidly, the market for advertising is likely to
also expand. Potential customers would be companies that want to buy advertising or
consumer data. The MNOs have access to information about what kind of phone, location,
and apps are used by their customers, which can be valuable information. By selling
consumer data, MNOs will compete directly with OTTs such as Google and Facebook. Even
though the MNOs have valuable information, the problem is that the OTTs usually have
access to the same data plus even more; data obtained from the usage of their apps. This
provides them with a more comprehensive picture of consumer behavior and preferences, and
their offers then become more valuable to advertisers. Another problem that is tied more
specifically to the Indonesian market is that the MNOs do not have personal details about
their customers, since this is not given as the customer buys a new SIM-card. However, there
is an upcoming regulation that will make it necessary to provide accurate personal
information in order for the SIM-card to work (Bishry & Prihadi, 2016). One advantage that
MNOs have compared to OTTs is that they can send promotions to all their customers by
SMS, there is no need to have a specific app installed as is the case for the OTTs.
56
One way to increase the revenue coming from the existing user base is by transferring the
ones categorized as high-end customers from prepaid to postpaid data plans. As shown in
previous chapters, postpaid customers are often more loyal and have a higher willingness to
pay. However, the mindset among the people makes it hard to convert prepaid, disloyal,
customers to postpaid, loyal, ones. Thus, the relative advantage of changing to postpaid needs
to be very high in order for the MNOs to persuade customers to change. As of today MNOs
fail to do so, resulting in that potential high-value customers stay with prepaid solutions. To
offer discounts on smartphones when signing up for a postpaid contract is one way this has
been handled in the U.S. and Europe (Foo, 2016). Looking into the possibilities of offering
Indonesian customers similar incentives could be an alternative way to go. A shift to postpaid
would mean a reduced bargaining power among the end-users, since they become more loyal.
However, it would also mean a reduced bargaining power of distributors, as the number of
disposable SIM-cards would decrease.
7.1.3 Channels & Customer Relationship
As seen in Chapter 5, the customer churn rate and distribution of SIM-cards are big costs for
the Indonesian MNOs. To enhance the user interaction is one way to make customer more
loyal, and thus bring down costs of distribution. This is something that the MNOs have
already started doing by improving their digital channels, as seen in Chapter 6. Bringing
customers from the traditional behavior of buying new SIM-cards whenever they expire, to
actually filling them up or extending their packages, have the possibility to both decrease the
distribution costs and increase the ARPU. In order to make people use the digital channels,
these have to be seamless, interactive, and intuitive. Continuing the improvement of digital
channels and being reactive to the thoughts of customers will be important for the future.
However, many people in Indonesia are unbanked, which raises questions about how to pay
for services bought on digital channels. In contrast to international OTTs, Indonesian MNOs
have a system for customer billing to elaborate on, which they can use to allow customers to
increase their balances also on the digital channels.
Even though end-users seem to have good knowledge about existing offers, the competition
among Indonesian MNOs is fierce and it is therefore important to be clear in the
communication to the customers. One way to make sure customers are only getting those
offers that are most relevant to them is to use the customer data already available to the
MNOs. This is not something that is new to Indonesian MNOs; initiatives in those areas are
already taken. However, as data has lowered the switching costs of consumers even further
compared to legacy services, it is important that the MNOs make it as easy as possible for the
end-users to choose their particular offer.
7.1.4 Key Partners
There are several types of partnerships that MNOs could benefit from. One of the most
discussed and debated issues in Indonesia today is if the government will allow MNOs to
share the active part of the BTS, which would lower the cost of expanding the network, thus
57
also lowering the entry barriers for areas outside of Java. Moreover, there are potential
partnerships that could help increase MNO revenue. By collaborating with device
manufacturers, MNOs could lower the barriers for their consumers to buy a smartphone or a
more modern smartphone, something that is likely to increase data consumption. As MNOs
currently do not offer postpaid subscriptions with discounted smartphones, there is room for
improvement. A major problem today is that there are few benefits associated with buying a
postpaid subscription, which can be observed since even many high value subscribers that can
afford postpaid subscriptions still choose to use prepaid subscriptions. Collaborations with
OTTs have the potential to improve the value proposition of MNOs, and bundles can be
created to increase data consumption and decrease administrative costs.
There is also an opportunity for collaboration with OTTs to provide better QoS. Net neutrality
is not enforced in Indonesia today, and since regulations have a history of succeeding the
actual business practice, there is potential for MNOs to experiment with this. If an OTT is
given better quality of service than other OTTs, and they increase their revenues from this, the
MNO could either charge the OTT directly for prioritizing their data or they could share the
increased revenues that stem from the collaboration. For instance, additional advertising
revenues could be shared between the partners. Moreover, MNOs have an asset that is
valuable to the OTTs, namely their distribution channels. A collaboration that allows OTTs to
use the existing distribution channels would provide a way for OTTs to charge for their
services; something that is very hard for them today. As the regulatory authority in Indonesia
is drafting suggestions for regulations forcing the international OTTs in to collaborations with
the Indonesian MNOs, this kind of collaboration can be considered timely.
If Indonesian MNOs choose to provide VAS in addition to connectivity they are faced with
the challenge of deciding which services should be done in-house, which should be
outsourced, and what can be acquired. As some services might be best provided by third
parties while others could be supplied by the MNOs themselves, the MNOs will end up in a
situation where they need to collaborate and compete with OTTs simultaneously. This
situation can even arise with the same OTT, as partnerships in some areas do not exclude that
they can be competitors in other. Such relationships are however not exclusive for the telecom
sector but rather something that exists within all ecosystems. However, to be aware of the
situation and have strategies for how it should be managed is essential for engaging in
successful partnerships.
7.1.5 Key Activities & Key Resources
The network will continue to be the main asset of the Indonesian MNOs, and having a good
network coverage and strong network performance will be factors crucial for success. As the
volume of data traffic is increasing rapidly, investments in the network will be a key activity
in order to meet customer expectations and remain competitive. Continuing the search for
ways to optimize network investments will therefore be a key activity in times to come. To
monetize on the increased data consumption, it is most likely going to be necessary to
optimize the network after the high-value consumers. It might be required to allow network
58
performance KPIs in certain areas to be poor while improving already good ones to become
great. In order to do so, the Indonesian MNOs need to build a culture of strong collaboration
between the marketing and the network planning departments of the business. Such a
collaboration would not only provide the ones making the network planning with valuable
information of where the paying customers are, but also make it possible to coordinate the
actions of the marketing team with the actual capacity of the network, avoiding congestions
caused by marketing initiatives.
Trust will continue to be a key resource to Indonesian MNOs because of the same reasons as
it is today; it creates loyal customers. Likewise, the brand will be an important asset to attract
and retain customers. However, many initiatives created to attract customers and build the
brand have centered around cheap starter packages which have led to price wars to various
degrees. To monetize the increased data volumes, MNOs need to be smart about their
marketing campaigns so that they can avoid the current situation where they are adding more
data traffic without seeing the same increase in revenue. Conducting smart marketing further
implicates that the marketing team needs to run close collaborations with the network
planning function. Both to ensure that the investments are made where the data packages are
already fully utilized, as discussed in Chapter 6, but also to make sure that they are not adding
customers where the network cannot handle it.
Since there are still a lot of uncertainties surrounding VAS, the development of VAS requires
MNOs to be adaptive in their approach. As it does not seem to be one VAS that will make up
a majority of the MNOs revenue, but rather many smaller initiatives, MNOs are forced to be
sensitive to what is happening around them: what competitors are doing, what technical
possibilities there are, and customer preferences. I.e. they have to continuously adjust
themselves to new opportunities and conditions. Hence, in order to be successful with VAS
the Indonesian MNOs cannot be afraid of experimenting and exploring new services and
ideas, wherewith these become key activities.
However, as Lindgardt et al. (2009) point out; it is not the companies that are the first to come
up with an idea that necessarily have to be the ones succeeding with it. In order to be
successful with VAS the Indonesian MNOs have to find effective processes of scaling
lucrative initiatives. This includes to be able to, in a flexible manner, reallocate resources to
the projects needing them at the moment. The fact that the MNOs are not going to be
successful with every launched initiative does also implicate that they have to be good at
sensing when it is time to abandon an initiative. To linger with an unfruitful VAS can mean
that a lot of money is being lost without the initiative ever taking off. Thus, the MNOs must
create a culture where experimentation is encouraged and failure is not punished.
As the MNOs try to monitor the external environment to capture industry trends, the customer
relationship gets even more important. The customer preferences will be the one thing
deciding if a VAS initiative is going to be successful or not, hence to incorporate the
customers into the innovation and evaluation process will be important.
59
7.2 Differentiation
Porter (2008) meant that profitability is likely to be highest when companies compete on
different dimensions and serve different markets segments with different needs. One
challenge the Indonesian MNOs are faced with today is the low degree of differentiation
among their offerings. As seen, this has led to disloyal customers and succeeding price wars.
The shift to data offers the MNOs two fundamental ways to differentiate; either they can work
on their network performance and use this as a differentiator, or they can alter their digital
service offering to provide customer with outstanding VAS and become a digital ecosystem
provider. Even if both scenarios would require the MNOs to engage in the building of
networks, the approaches require different views on what the network actually means. If
differentiating on network performance the network will be the end in itself, while
differentiating on VAS would imply that the network would serve as a means to an end rather
than be the end itself. Hence, depending on what the MNOs choose to do, they will face
different implications and challenges.
7.2.1 Differentiating on Network Performance
An MNO deciding to put their main focus on network performance would primarily become a
provider of connectivity. Connectivity should not be regarded as a commodity today in
Indonesia, as there is a high variance in QoS between MNOs, and consumers currently seem
to value network performance above much else. In the Western world, connectivity and
network performance are less powerful differentiators and it is likely that this will eventually
become the case in Indonesia as well. The implication is that in order to be profitable, the
MNO must leverage the five forces to their favor or differentiate their offering in a
meaningful way. The forces identified as strong in the Indonesian market are the rivalry of
incumbent firms, the bargaining power of buyers, and the threat of substitutes. If considering
only the provision of data, the latter becomes irrelevant. The key to superior performance
would then, as is the case today, be closely tied to scale. The bigger an MNO is, the easier it
becomes to tackle the rivalry among incumbents and obtain higher bargaining power toward
distributors. However, only one MNO can be the biggest. If considering the mobile telecom
industry in general, to improve average profitability, consolidations must happen since there
are too many active MNOs for the industry to experience healthy profits. Also, in order to
reduce the bargaining power of the distributors, it is essential that people get access to digital
money, which would make it possible to circumvent to the highly inefficient distribution
through outlets that is the reality today.
Being a provider of connectivity would thus mean taking a very classical approach to
strategy, where you position yourself in the industry and try to find a sustainable competitive
advantage. Being big and leveraging on the scale would then be the big competitive
advantage. Since scale issues more scale, as seen in Chapter 5, it can somewhat be seen as a
sustainable competitive advantage as long as the industry stays the same. Reeves et al. (2015)
mean that this kind of strategy is best conducted by analyzing the industry, plan how to go
forward, and then execute the plan. By analyzing the current situation of the firm, the MNOs
can get a picture of what is their current competitive advantage - why do customers choose
60
them? - and by that understand where they have to put effort in the future to sustain that
advantage. The analysis is then the basis for the plan, which tells the MNOs what has to be
done. It is important to have a long term plan to work on since the classical approach is a lot
about optimization of activities. If the plan changes too frequently, the MNO might lose some
of the advantages they have already built up. This thus leads up to the execution of the plan,
where every part of the organization should be focused on achieving the set goals efficiently.
As this type of strategy very much builds on the five forces framework it is adapted to an
environment and an industry that is relatively stable and predictive. The big challenge when
trying to apply such a strategy in the Indonesian telecom industry is that the usage of data is
increasing substantially, as more and more people get access to a smartphone. As Thompson
(2016) mentioned in Chapter 6, it is very hard to plan the network in beforehand when you do
not really know what the demand will look like in the future. However, even if the industry
faces a change in required data volumes, the demanded “service” is still the same:
connectivity. As the Indonesian market is characterized by low penetration of fixed
broadband, the MNOs will still be the main provider of connectivity in the future, meaning
that the competitive dynamics around connectivity will not change considerably. I.e. there
will not come any disruptive players offering ways for the users to circumvent the MNOs,
there will continue to be a demand for the Indonesian MNOs to provide connectivity. Hence,
even if it is difficult for the MNOs to make accurate predictions about future demands, the
environment and industry itself is relatively stable and predictable.
Since the presented business model is very similar to the ones traditionally employed by the
Indonesian MNOs the culture and processes are to a large degree already there. As this kind
of strategic approach relies on quite a static source of advantage, it is possible to build up very
specialized capabilities; if you do the same thing over and over you are going to build your
capabilities within that field. Hence, Reeves et al. (2015) mean that organizations taking the
five forces approach to strategy often have a high degree of specialization so that employees
have the possibility to accumulate expertise over time. This is a tradition that has been
employed among the MNOs as well, as different divisions have been able to acquire expertise
within their respective field. The challenge when doing so is that it sometimes creates barriers
for collaboration between the departments, as everyone is very focused on what they are
doing. Such barriers can make the MNOs miss out on opportunities to make the business run
even better, which can somehow be seen among the Indonesian MNOs today.
Another challenge with this approach is that it is hard to differentiate between actors. The
player that manages to accumulate the most scale will probably be the one that can offer the
best network nationwide. If smaller players want to compete on the same premises their only
option is to focus their efforts to a specific geographical area or a specific customer segment.
However, since this kind of business very much depends on scale to accumulate capital for
investments, the biggest player might be able to react and outcompete smaller players even if
the attempts are made regionally instead of nationwide. Thus, the market might only have few
spots for MNOs to compete only as a provider of connectivity.
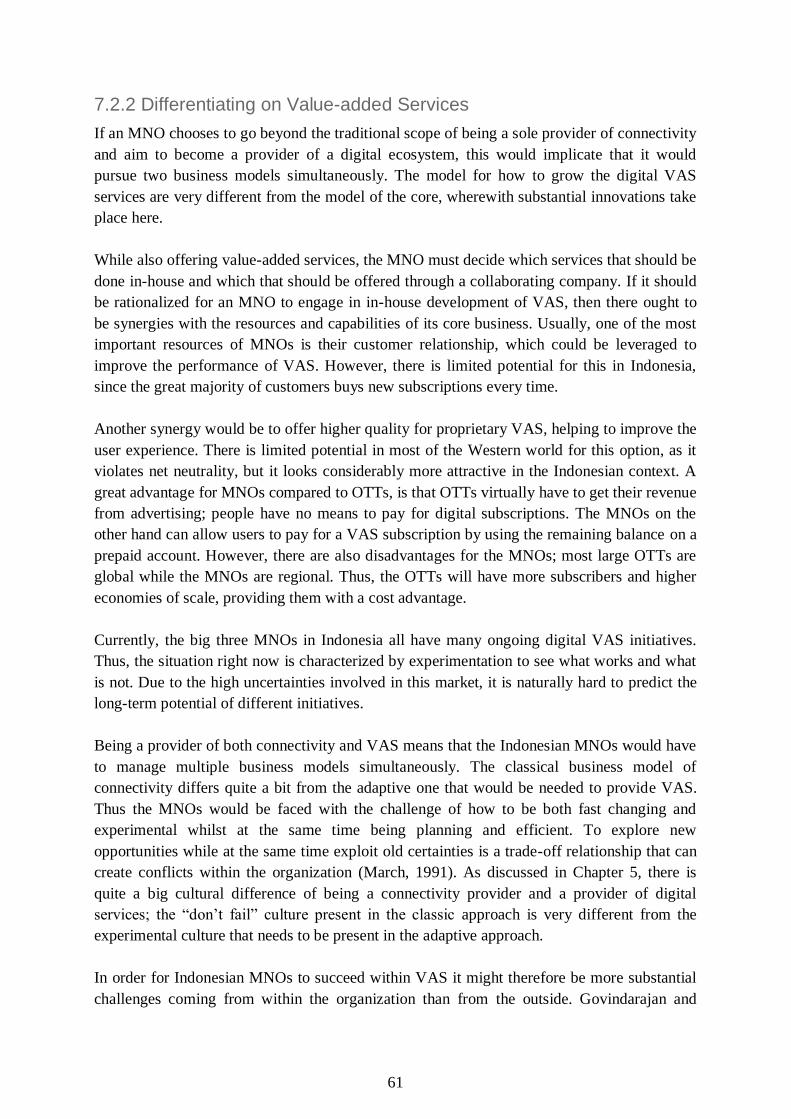
61
7.2.2 Differentiating on Value-added Services
If an MNO chooses to go beyond the traditional scope of being a sole provider of connectivity
and aim to become a provider of a digital ecosystem, this would implicate that it would
pursue two business models simultaneously. The model for how to grow the digital VAS
services are very different from the model of the core, wherewith substantial innovations take
place here.
While also offering value-added services, the MNO must decide which services that should be
done in-house and which that should be offered through a collaborating company. If it should
be rationalized for an MNO to engage in in-house development of VAS, then there ought to
be synergies with the resources and capabilities of its core business. Usually, one of the most
important resources of MNOs is their customer relationship, which could be leveraged to
improve the performance of VAS. However, there is limited potential for this in Indonesia,
since the great majority of customers buys new subscriptions every time.
Another synergy would be to offer higher quality for proprietary VAS, helping to improve the
user experience. There is limited potential in most of the Western world for this option, as it
violates net neutrality, but it looks considerably more attractive in the Indonesian context. A
great advantage for MNOs compared to OTTs, is that OTTs virtually have to get their revenue
from advertising; people have no means to pay for digital subscriptions. The MNOs on the
other hand can allow users to pay for a VAS subscription by using the remaining balance on a
prepaid account. However, there are also disadvantages for the MNOs; most large OTTs are
global while the MNOs are regional. Thus, the OTTs will have more subscribers and higher
economies of scale, providing them with a cost advantage.
Currently, the big three MNOs in Indonesia all have many ongoing digital VAS initiatives.
Thus, the situation right now is characterized by experimentation to see what works and what
is not. Due to the high uncertainties involved in this market, it is naturally hard to predict the
long-term potential of different initiatives.
Being a provider of both connectivity and VAS means that the Indonesian MNOs would have
to manage multiple business models simultaneously. The classical business model of
connectivity differs quite a bit from the adaptive one that would be needed to provide VAS.
Thus the MNOs would be faced with the challenge of how to be both fast changing and
experimental whilst at the same time being planning and efficient. To explore new
opportunities while at the same time exploit old certainties is a trade-off relationship that can
create conflicts within the organization (March, 1991). As discussed in Chapter 5, there is
quite a big cultural difference of being a connectivity provider and a provider of digital
services; the “don’t fail” culture present in the classic approach is very different from the
experimental culture that needs to be present in the adaptive approach.
In order for Indonesian MNOs to succeed within VAS it might therefore be more substantial
challenges coming from within the organization than from the outside. Govindarajan and

62
Trimble (2005) mean that in order for a firm to go into new areas they have to manage three
things: to forget about the things hindering them, to borrow the things that will enable them,
and to learn quickly. For the Indonesian MNOs this can be translated into forgetting about old
cultural habits such as the “don’t fail” attitude and the segregated organization. To borrow
things like brand name, customer relationship, and billing possibilities. And to learn from
failed and successful initiatives quickly, as it will enable the MNOs to improve their
processes. However, the big challenge of engaging in such a behavior is how to do it within
the same organization that will continue with the business model of connectivity. According
to O'Reilly and Tushman (2004) this is best done by being ambidextrous.
O’Reilly and Tushman (2004) showed in their research that firms most successful at
exploiting the old business while exploring the new, share some characteristics. Those firms
manage to separate their traditional business units from the new experimenting ones, allowing
the new units to have their own processes, culture, and structures. However, they still
maintain strong links with the traditional business at a senior executive level. They called this
the ambidextrous organization, i.e. where you manage organizational separation through a
deeply integrated senior team (see figure 14).
Figure 14. An example of an ambidextrous division of the organization.
For the Indonesian MNOs this would imply that the VAS business units are allowed to create
the necessary change in culture and processes, but still have the so important support from the
senior executives. Since the role of the management team becomes very important in this
approach, it is important to have the full support of those, even if they are not all operating
ambidextrous (O’Reilly & Tushman, 2004). Table 3 pictures the scope of the different
business units as described by O’Reilly and Tushman (2004).
63
Table 3. Picture the scope of the different business units as described by O’Reilly and Tushman (2004).
To make a change in the organization is probably easier said than done. In times of market
stability, Hannan and Freeman (1984) argued that organizations are generally favored if they
are building structures that is difficult to change. Incumbent firms consequently tend to have a
high structural inertia, which makes it more cumbersome to alter the organizational structure
in time of change. Hannan and Freeman (1984) further mean that such structural inertia can
be derived from internal politics, sunk cost in personnel, legal issues, or information barriers,
which all make it hard to exit or enter certain behaviors. Even if it might be an exaggeration
to say that the Indonesian telecom market has ever been stable, it has still been favorably for
the MNOs to act in certain ways, leading them to build inertia within the companies. As
discussed above, in order for the MNOs to be successful in their attempts to launch VAS it
would require them to break charted behaviors and reorganize some parts of the business.
However, as the change would not imply destruction of the existing business of connectivity,
but rather provide complements to it, it does not seem impossible to do.
As of today, Indonesian MNOs are trying to manage both business models simultaneously,
however the smaller business of VAS seems to often be marginalized compared to the main
business of connectivity. VAS are only contributing with very small parts of the total revenue
of the MNOs, which have made it more difficult to motivate investments in front of
shareholders. When going into VAS, the MNOs must engage in experimentation despite the
risk of failure, making investments riskier compared to the traditional connectivity.
Predictions of return for new investments will be subject to high uncertainties, in contrast to
when investing in the traditional business. As shareholders traditionally invest in MNOs as a
low-risk, steady return business, the uncertainty associated with investments in VAS is not
easily motivated. The fundamental question thus becomes if the endeavors in VAS are a
productive use of invested capital? Thus, it can be speculated that the MNOs are somewhat
hindered by their shareholders from going fully in this direction.

64
Even if the internal barriers are fierce to overcome when going into VAS, there is one very
important external factor to consider as well: poverty. As mentioned so many times before,
great parts of the Indonesian population are hindered by lack of means to pay. A big question
then arises: how can you make people who have a hard time affording data, pay for additional
services?
7.3 Tapping into the BOP Segment
The factor influencing the Indonesian telecom industry by far the most is the poverty of the
people living there. The poverty is the underlying reason to the low customer loyalty, the low
penetration of bank accounts, the expensive distribution, the somewhat negative mindset
towards technology, and thus to a large extent responsible for the difficulties of monetizing
mobile data. As mentioned in the theory chapter, poverty does not exclusively mean the lack
of money, but rather the lack of any determinants giving human freedom (Sen, 2001). The
economic deprivation is noticeable as about 40 percent of the Indonesian population lives
close to the nationally set poverty line, well under the BOP classification defined by Prahalad
and Hart (1999). The economic difficulties influence the standard of living of many people in
Indonesia and therewith also the financial means possible to put on mobile data consumption.
Besides the economic deprivation, the traditionalist mindset of many people can be seen as
one major disturbance to mobile data adoption. This mindset might be derived from a poorer
educational situation in rural areas. Thus, the educational deprivation mentioned by Nakata
and Weidner (2012) can also be seen as a poverty variable stalling the diffusion.
Right now the Indonesian MNOs seem to accept that this segment is outside their reach,
wherewith not much attention is directed here. As of today, the solution put forward by the
MNOs to address this segment is just to offer smaller packages of data. Such a solution might
appear enough from the outside, however the cost of using each application still remains the
same independent of how much data one have access to. Hence, the result of selling smaller
packages of data is not to enable the BOP segment; that data will not cover more for them
than for anybody else. I.e. the product offered by the MNOs today is not adapted at all to the
BOP segment. Many large MNCs have shown that it is possible to address this segment
profitable if only the company manage to adapt its strategy to the unique circumstances
surrounding the segment (Prahalad & Hammond, 2002).
In order to successfully cater to the need of the BOP segment the Indonesian MNOs need to
pay attention to at least some of the enablers defined by Rogers (2003) and put forward in a
BOP context by Nakata and Weidner (2012): product attribute, market environment, and
social context. As brought up in Chapter 5, Telkomsel has found that about 50 percent of the
Indonesian population can be categorized as traditionalists, having trouble to see the benefits
of new technology. To reach this part of the population the relative advantage of the product
presented by the MNOs needs to be very high compared to existing solutions. Since the
relative advantage of small data packages is very low this part of the population does not see a
need to buy the product. According to an interview with Suri (2016) the MNOs alone cannot
provide the BOP with a relative advantage big enough for adoption. Instead he means that the

65
whole ecosystem has to change in order to cater for this customer group. Application
developers need to change the way apps are constructed in order for them to require less data,
MNOs need to change how they charge for data for this segment, and the network suppliers
need to find technical solutions to how data can be classified and filtered.
Something that is already in place for the Indonesian MNOs is the atomized distribution
networks. As mentioned before, the distribution of SIM-cards is done through many small
outlets run by third parties. This enables the MNOs to get closer to the BOP customers.
Another enabler brought up by Nakata and Weidner (2012) under market environment is
flexible payment methods. As discussed earlier, the Indonesian MNOs have quite good
possibilities to bring alternative payment solutions to people who lack bank accounts. To
elaborate on this would be one way to get easier access to the BOP segment. Moreover, the
MNOs might need to change how they charge for the services totally. One possibility would
be to allow free access to low-data consuming apps if agreeing to receive advertisement. This
would correspond to a form of sponsored data, as brought up earlier in this report.
One could argue that since the Indonesian MNOs are still experiencing a healthy growth in
subscriber additions in the higher value segment they do not need to turn to the less profitable
BOP segment yet. However, if the creation of a new ecosystem is what is needed in order to
address this segment, the creation of such an ecosystem will take time. Some initiatives, such
as collaboration around the Free Basics, is done today to help this segment get access to
internet for free. However, for the Indonesian MNOs to build a sustainable business here they
need to find a way to be profitable, to do it out of goodwill and social responsibility is not
enough. When the growth in the high-value segments slow it might take too long time to start
thinking about how to attract the BOP customers, wherewith the MNOs should bear those
thoughts in mind already now.

66
8. Conclusion The purpose of this study was to map out the Indonesian mobile telecom industry and to
explore how Indonesian MNOs can better monetize mobile data by improving their business
models. Each of the research questions will be answered below.
RQ1: How is the competitive situation structured in the Indonesian mobile telecom industry?
The competitive situation differs significantly within Indonesia. Outside of Java, the biggest
MNO Telkomsel has a monopoly in most areas, providing them with the ability to charge
higher prices. Thus, they are highly profitable here. On Java, the competitive situation is
intense and the average profitability is low. This can be explained by the presence of three
strong competitive forces: the rivalry among incumbent firms, the bargaining power of
buyers, and the threat of substituting services.
The rivalry among incumbent firms is strong due to a mature market with many active MNOs,
where the MNOs have been trying to steal market share from each other through extensive
price wars. Industry profitability would benefit from an increased degree of consolidation,
something that has happened to a limited extent until today. A likely reason for this is that the
incentives for consolidation are low, since the prevailing spectrum policy requires MNOs to
give back extra spectrum to the government when consolidating. Thus, this valuable asset
would not only lose its value but would also be given to a competing MNO.
The bargaining power of buyers is high as the MNO offers are undifferentiated and both
distributors and end-users have low switching costs. This has resulted in disloyal distributors
playing MNOs against each other, only promoting those providing them with the highest
margins. Most end-users do not have access to digital money, which means that they cannot
refill their SIM-cards digitally and have to buy new ones through the expensive distribution
channels. End-users are very price sensitive and use multiple SIM cards simultaneously to
push down their expenses.
The threat of substituting services in the form of voice and messaging services from OTTs is
high. These services have a high performance-price ratio compared to the MNO legacy
services, as they do not cost anything apart from the data they consume. They have made the
switching costs for end-users lower, as the same account on an OTT service can be used
irrespective of the MNO providing the data.
RQ2: How can the business model of Indonesian MNOs be improved to monetize data better?
Indonesian MNOs ought to redefine whom they see as a customer. Today, the majority of the
revenue is derived from end-users. In addition to see the end-user as the customer, there is
potential to offer services to OTTs, retailers, and other businesses. OTTs could either be
charged to improve the QoS in their apps, or MNOs and OTTs could partner and share
67
additional revenues that could be derived from improved QoS; consumer data could be sold to
companies or used for targeted advertising.
Indonesian MNOs should focus on increasing the currently low loyalty among their high-end
customers. One way of doing so would be to convert more customers to postpaid
subscriptions. As there are few benefits associated with using them today, these must be
improved to provide additional value.
Indonesian MNOs should alter how they work with network planning and investments. They
need to find ways to adapt the network to high-value customers. There seems to be potential
to improve the collaboration between the marketing and network planning functions to make
network investments that results in the most extra revenue.
Indonesian MNOs should improve their digital distribution channel experience. It is important
to convert the part of the population that have access to digital money to actually start using
the digital channels instead of the inefficient and expensive physical distribution channels.
Lastly, Indonesian MNOs should find a way to differentiate their offers to avoid having price
as the main dimension of competition. There are two fundamentally different approaches for
how this can be achieved; either the MNO could define itself as a provider of connectivity or
it could define itself as provider of a digital ecosystem. The main difference becomes the
perspective on connectivity; should it serve as a means to an end, or as an end in itself?
RQ3: What are the challenges and implications with those business models?
Today, Indonesian MNOs give away data very cheaply compared to legacy services, so a
major challenge will be to successfully change the revenue streams to monetize data better,
while at the same time exploiting legacy revenues as long as possible.
An MNO deciding to put their main focus on network performance would primarily become a
provider of connectivity. Connectivity should not be regarded as a commodity today in
Indonesia, as there is a high variance in QoS between MNOs, and consumers currently seem
to value network performance above everything else. In the Western world, connectivity and
network performance is a less powerful differentiator and it is likely that this will eventually
become the case in Indonesia. When this happens, a provider of connectivity will have to
leverage the competitive forces to their favor to be successful. This is closely tied to scale, as
this will provide a cost advantage and higher bargaining power. To improve profitability, it is
also important that people get access to digital money so that the high margin individual
outlets can be circumvented. This is probably hard in the short run, so the primary focus ought
to be to make customers who already have digital money to actually use the digital
distribution channels.
For an MNO deciding to put their main focus on value-added services, they would essentially
hope to become a provider of a digital ecosystem. It needs to decide if it should do the value-
68
added services in-house or rely on third parties to supply them. A significant challenge facing
the MNOs choosing to offer in-house VAS is that they would have to pursue two business
models simultaneously. The one that is needed to bring forth successful VAS is very different
from the one that is needed to provide connectivity. The latter usually needs operational
efficiency and a hierarchical organization while the former needs risk taking, speed,
experimentation, and flexibility. Thus, there is likely a mismatch between the optimal cultures
and mindsets for the two business models. MNOs might also have a hard time with talent
acquisitions, since they are not highly regarded by many who want to work in innovative and
experimental environments.
With the digital ecosystem approach important decisions need to be made about resource
allocation: how much of the capital should be invested in exploiting the core business and
how much should be assigned to exploring new revenue streams? The ultimate question
MNOs must ask themselves is if endeavors in VAS are a productive use of invested capital.
MNOs typically pay a steady stream of dividends to their shareholders; investing the capital
in high-risk projects might not be appreciated by investors who could have invested the
capital themselves.
Another challenge facing the Indonesian MNOs independent on the chosen business model is
the one of the poverty of the people. When the growth in the high-value segments stall, the
MNOs need to have a plan for how to build sustainable business opportunities among the
BOP segment. This would possibly require the MNOs to rebuild the whole ecosystem
surrounding them, providing the people with a greater value of adoption.

69
Bibliography Aguilar D. A. (1967). Scanning the business environment. New York: Macmillan.
Anderson J., Markides C. (2007). Strategic innovation at the base of the pyramid. MIT Sloan Management
Review. Vol. 48, No. 1, pp. 83-88.
Ansori M. H. (2009). Consumerism and the emergence of a new middle class in globalizing Indonesia.
University of Hawaii.
Arline K. (2014). PEST analysis: Definition, examples, and templates. Business news daily. Available at:
http://www.businessnewsdaily.com [2016-07-20]
Cisco (2014). Digging for the new mobile gold. White paper, May 2014.
Costa J., Teare R. (2000). Developing an environmental scanning process in the hotel sector. International
Journal of Contemporary Hospitality Management. Vol. 12, No. 3, pp. 156-169.
Costa J. (2008). Handbook of hospitality strategic management, red Michael Olsen & Jilin Zhao, 15-36. Oxford:
Elsevier.
Court D., Abbas R. (2013). Whose interview is it, anyway? Methodological and ethical challenges of insider-
outsider research, multiple language, and dual-researcher cooperation. Qualitative Inquiry. Vol. 19, No. 6, pp.
480-488.
Dobberstein N., Narasimhan S., Aggarwal S. (2013). Boosting telcos’ smartphone sales in developing markets.
AT Kearney Inc.
Easterby-Smith M., Thorpe R., Jackson P. R. (2015). Management & business research. 5th edition. London:
SAGE edge.
Ericsson (2013). Keeping smartphone users loyal. Ericsson consumer insight summary report.
Ericsson (2014). Growth codes - How operators drive profitability revenue growth in a data centric world.
Ericsson (2015). Ericsson mobility report. November 2015.
Ericsson (2016a). The one-click ideal. Ericsson consumer labs and industry insights. May 2016.
Ericsson (2016b). Market update - RASO steering group meeting 18th February, 2016. PPT.
Ericsson (2016c). Indonesia market dynamics and forecast – 1Q 2016 Release.
Ericsson (2016d). Telkomsel - Performance and strategies 1Q 2016 results. RASO Business intelligence PPT.
EY (2015). Global telecommunications study: Navigating the road to 2020.
Fife, E. (2015). Indonesia: Connecting diversity. Pacific Telecommunications Council Broadband Reports, No.
3. Honolulu, HI: Pacific Telecommunications Council.
Fransman M. (2010). The new ICT ecosystem: Implications for policy and regulations. Cambridge: Cambridge
University Press.
Govindarajan V., Trimble C. (2005). Building breakthrough business within established organizations. Harvard
Business Review. May 2005.
70
Grazella M. (2014). Offering Google a much-needed bahasa boost. The Jakarta Post. Sept. 22th. Available at:
http://www.thejakartapost.com [2016-07-18]
GSMA (2014a). Emerging best practice in digital commerce for mobile network operators. May 2014.
GSMA (2014b). The GSMA spectrum primer series: Introducing radio spectrum.
GSMA (2016a). The mobile economy 2016.
GSMA (2016b). Mobile operators: The digital transformation opportunity. GSMA Intelligence & CAICT, June
2016.
GSMA (2016c). Connected society - Consumer barriers to mobile internet adoption in Indonesia. GSMA Insight.
The Guardian (2011). Net neutrality enshrined in Dutch law. Available at: https://www.theguardian.com [2016-
09-27]
Hannan M. & Freeman J. (1984). Structural inertia and organizational change. American Sociological Review,
Vol. 49, No. 2, pp. 149-164.
Internet.org (2016). Free basics platform. Available at: https://info.internet.org/en/story/platform/ [2016-09-04]
Ireland J. (2008). Lessons for successful BOP marketing from Caracas’ slum. Journal of Consumer Marketing.
Vol. 25, No. 7. Pp. 430-438.
ITU (2011). All about the technology. Available at: http://www.itu.int/osg/spu/ni/3G/technology/ [2016-09-27]
ITU (2015). Net neutrality: developments and challenges in EU and US. Available at: http://www.itu.int/en/ITU-
D/Regional-Presence/ArabStates/Documents/events/2015/FN/pres/Net%20NeutralityINs3.pdf [2016-08-12]
ITU (2016). About ITU. Available at: http://www.itu.int/en/about/Pages/default.aspx [2016-08-12]
KPMG (2011). The new business models for operators. KPMG LLP.
Lindgardt Z., Reeves M., Stalk G., Deimler M. S., (2009). Business model innovation. The Boston Consulting
Group.
Lohr S., Ruiz R. (2015). F.C.C. approves net neutrality rules, classifying broadband internet service as a utility.
The New York Times 26 of February 2016. Available at: http://www.nytimes.com [21-10-2016]
March J. (1991). Exploration and exploitation in organizational learning. Organization Science. Vol. 2, No. 1,
pp. 71-87.
McKinsey (2016). Telecommunications industry at cliff’s edge. TMT Practice. Vol 1 2016.
Nakata C., Weidner K. (2012). Enhancing new product adoption at the base of the pyramid: A contextualized
model. Product Innovation Management. Vol. 29, No. 1, pp. 21-32.
Oberman R., Dobbs R., Budiman A., Thompson F., Rossé M., (2012). The archipelago economy: Unleashing
Indonesia's potential. McKinsey Global Institute. September 2012.
O’Reilly C. A., Tushman M. L. (2004). The ambidextrous organization. Harvard Business Review. April 2004.
Osterwalder A., Pigneur Y. (2011). Business model generation. New Jersey: John Wiley & Sons, Inc.
Porter, M.E. (1980). Competitive strategy: Techniques for analyzing industry and competitors. New York: Free
Press.

71
Porter M.E. (2008). The five forces that shape strategy. Harvard Business Review. pp.79-94.
Prahalad C.K., Hammond A. (2002). Serving the world’s poor profitably. Harvard Business Review. September,
pp. 48-57.
Rastogi V., Tamboto E., Tong D. (2013). Indonesia's rising middle-class and affluent consumers. BCG Insights.
Available at: https://www.bcgperspectives.com [2016-07-20]
Reeves M., Haanaes K., Sinha J. (2015). Your strategy needs a strategy. Boston: Harvard Business Review
Press.
Reuters (2016). Exclusive: Google may face over $400 million Indonesian tax bill for 2015 - government
official. 19th of September 2016. Available at: http://www.reuters.com [2016-09-27]
Rogers E. (2003). Diffusion of innovations. 5th ed. New York: Free Press, pp. 2-37.
Rohit R., Das M., Sohoni A. (2013). The evolving Indonesian consumer. McKinsey & Co: Asia consumer
insight center.
Saunders M., Lewis P., Thornhill A. (2016). Research methods for business students. 7th edition. London:
Pearson Education Limited.
Sen Amartya (2001). Development as freedom. 2nd edition. New York: Oxford University Press.
Shafi R. (2015). Overview of the Indonesian broadband landscape. In Indonesia: Connecting Diversity. Pacific
Telecommunications Council Broadband Reports, Red. Fife E. 30-37. Honolulu, HI: Pacific
Telecommunications Council
Shih C.F., Venkatesh A. (2004). Beyond adoption: development and application of a use-diffusion model.
Journal of Marketing. Vol. 68, pp. 59–72.
Strategy& (2015). 2015 telecommunications trends. Available at: http://www.strategyand.pwc.com [2016-07-20]
Telkomsel (2016a). Halo fit. http://www.telkomsel.com/halofit [2016-08-31]
Tiaonline (2014). Letter expressing strong opposition to proposals to classify broadband as a 'Title II' service", to
U.S. congressional leaders and members of the FCC. Available at:
http://www.tiaonline.org/sites/default/files/pages/Internet_ecosystem_letter_FINAL_12.10.14.pdf [2016-09-27]
WEF (2016). Global competitiveness report 2015-2016. World Economic Forum. Available at:
http://reports.weforum.org/global-competitiveness-report-2015-2016/economies/#economy=IDN [2016-06-28]
The World Bank (2014). World Bank and education in Indonesia. Available at: http://www.worldbank.org
[2016-07-16]
The World Bank (2016a). Indonesia overview. Available at: http://www.worldbank.org [2016-06-28]
The World Bank (2016b). Global findex (Global financial inclusion database). Available at:
http://databank.worldbank.org/data/reports.aspx?source=1228 [2016-08-20]
Wu, T., 2003. Network neutrality, broadband discrimination. Journal of Telecommunications and High
Technology Law, 2, p.141.
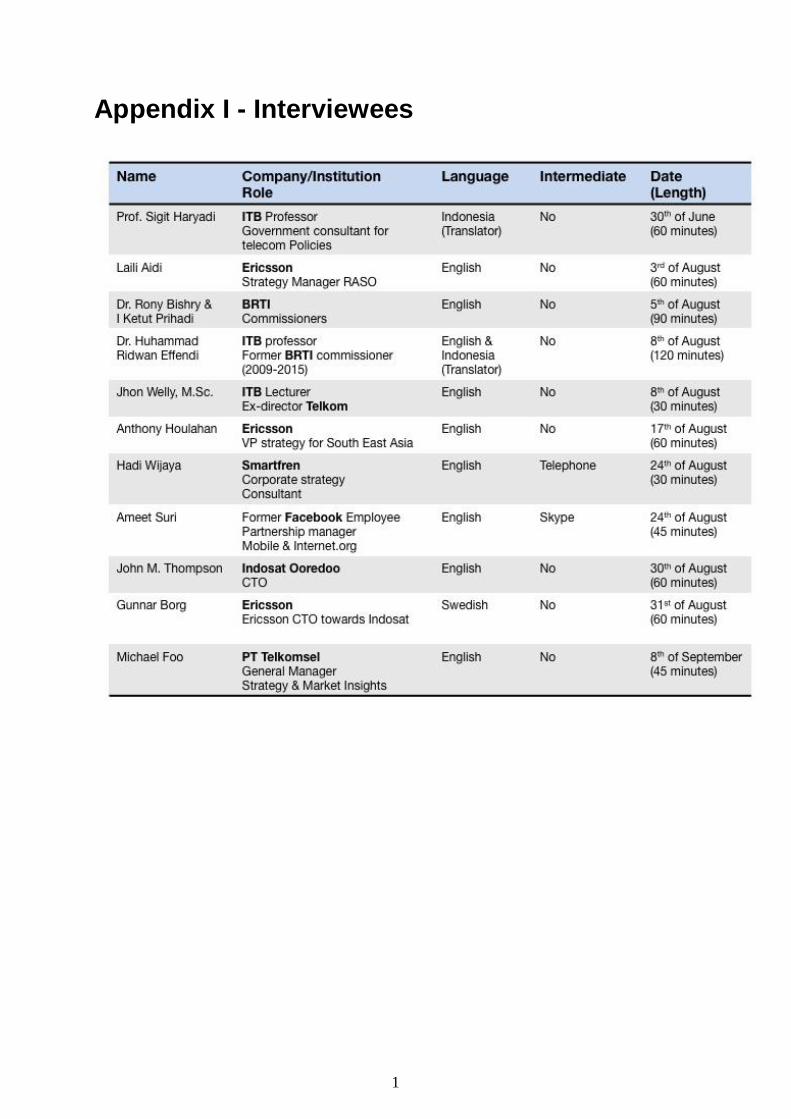
1
Appendix I - Interviewees
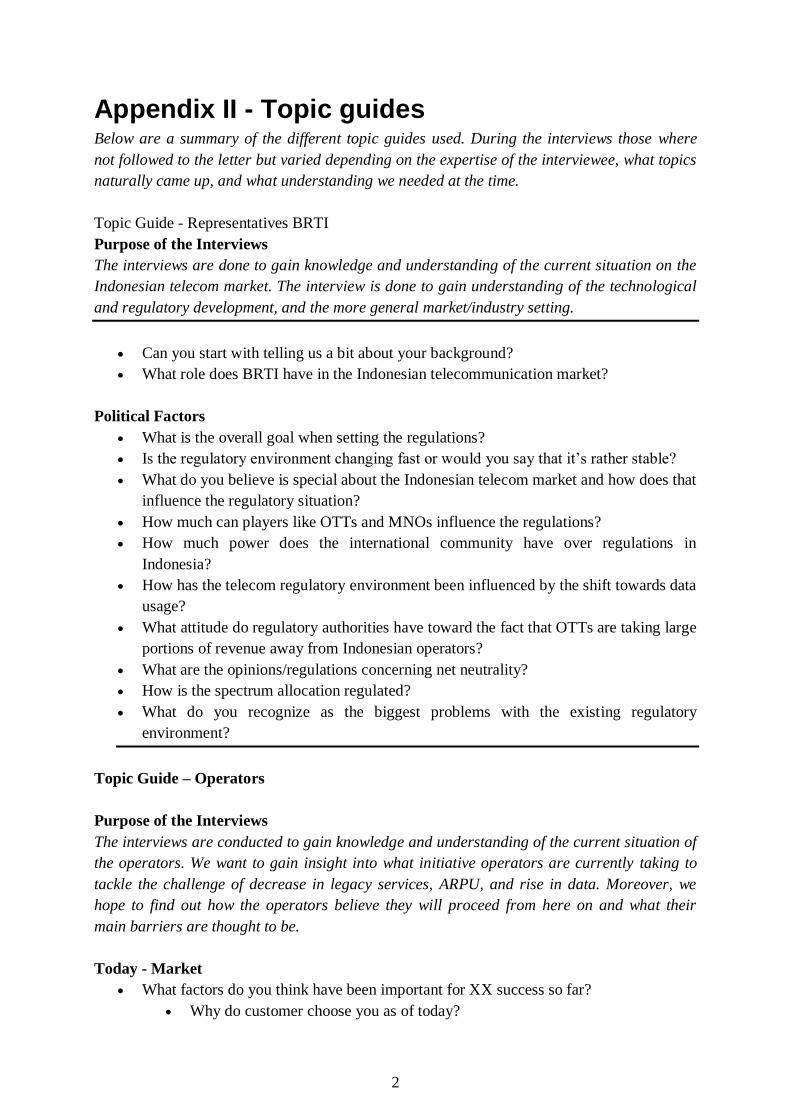
2
Appendix II - Topic guides Below are a summary of the different topic guides used. During the interviews those where
not followed to the letter but varied depending on the expertise of the interviewee, what topics
naturally came up, and what understanding we needed at the time.
Topic Guide - Representatives BRTI
Purpose of the Interviews
The interviews are done to gain knowledge and understanding of the current situation on the
Indonesian telecom market. The interview is done to gain understanding of the technological
and regulatory development, and the more general market/industry setting.
Can you start with telling us a bit about your background?
What role does BRTI have in the Indonesian telecommunication market?
Political Factors
What is the overall goal when setting the regulations?
Is the regulatory environment changing fast or would you say that it’s rather stable?
What do you believe is special about the Indonesian telecom market and how does that
influence the regulatory situation?
How much can players like OTTs and MNOs influence the regulations?
How much power does the international community have over regulations in
Indonesia?
How has the telecom regulatory environment been influenced by the shift towards data
usage?
What attitude do regulatory authorities have toward the fact that OTTs are taking large
portions of revenue away from Indonesian operators?
What are the opinions/regulations concerning net neutrality?
How is the spectrum allocation regulated?
What do you recognize as the biggest problems with the existing regulatory
environment?
Topic Guide – Operators
Purpose of the Interviews
The interviews are conducted to gain knowledge and understanding of the current situation of
the operators. We want to gain insight into what initiative operators are currently taking to
tackle the challenge of decrease in legacy services, ARPU, and rise in data. Moreover, we
hope to find out how the operators believe they will proceed from here on and what their
main barriers are thought to be.
Today - Market
What factors do you think have been important for XX success so far?
Why do customer choose you as of today?

3
What have been the main obstacles?
Digital business
What synergies do you see between your core business of providing connectivity and
the business of providing digital services?
Do you believe that you’re taking advantage of such synergies optimally?
Do you see a trade-off between exploiting your core business with providing
connectivity and exploring new alternative revenue streams such as digital solutions?
Future
What do you consider the main challenges today when operating in the Indonesian
telecom market?
Do you believe that the future will require different competencies/success factors?
If yes, what will be more/less important?
Are you spending much effort on converting prepaid customers into postpaid, or do
you believe that there is too little potential?
What role do you think that digital services will play in the future?
Network Performance
How do you go about investments in the network? What are the most important
factors you consider when deciding where to extend it? How to make sure the
investments are efficient?
Collaborations with OTTs to differentiate on QoS/QoE among the users of different
sites?
When considering network performance, where do you the highest potential of
improvement?
Topic guide - OTTs
Purpose of the Interviews
The interview is conducted to gain understanding about OTTs attitude towards MNOs and
collaborations as well as how international players look at the Indonesian market.
Collaborations with MNOs
Are you collaborating much with MNOs? What is the main purpose?
What did Facebook have to gain on such collaborations/involvement?
What is the main contribution from the MNOs in such collaborations?
What is the main contribution from the OTT?
What role will such collaborations have in the future?
Do you think they will be more important?
What are your thought on the future of MNOs?

4
Do you believe that they will be able to grow in new areas or will they just
become a provider of connectivity?
Do you see any difficulties in both competing and collaborating at the same time with
the MNOs?
The Indonesian market
What do you think is special about the Indonesian market?
Are there difficulties acting on emerging market?
How can that be handled?
What kind of initiatives are you taking?
Finishing Questions
Do you have anything to add that you believe would be valuable for us to know?
Do you know anyone you believe we should contact in order to learn more?
Would it be ok to contact you if we have any further considerations?
Do you want us to email you the finished report/ a summary?
5
Appendix III - Indonesian Mobile Operators
Telkomsel
Telkomsel is owned to 65 percent of Telkom Indonesia, majority owned by the Indonesian
government, and to 35 percent by SingTel Mobile of Singapore Telecommunication. With its
market share of about 44.2 percent as of March 2016, Telkomsel is the dominant player in the
cellular market. To enhance growth, Telkomsel has made a transition of focus into digital
business and increased number of data users. Data was, in 2015, contributing to about 34
percent of Telkomsel’s revenue, making it one of the priorities of the company. This has lead
the company to invest in 3G and 4G expansions, as well as launching initiatives related to
digital services. As of march 2016, Telkomsel had 3.1 million 4G subscribers (Ericsson,
2016c). During the first quarter of 2016, XL had a revenue of IDR 20.2 tr.
XL Axiata
XL Axiata is with its 12.1 percent market share one of the largest cellular service provider in
Indonesia in terms of subscriptions (Ericsson, 2016c). The company is to 66.5 percent owned
by the Malaysian telecommunication company Axiata Group. The company are focusing on
urban areas such as Jakarta, Bali, Lombok, and Java. As for many others, data is seen as the
major growth opportunity by XL Axiata. The company tries to boost data usage by offering
special bundled options for data users, e.g. starter packages. Moreover, XL Axiata is making
investments in fiber optic cables and base transceiver stations (BTS), to increase quality and
speed of data services. Moreover, XL Axiata are focusing on customers that are able to pay
more for data usage, and offer solutions that encourage consumption in this customer group.
During the first quarter of 2016, XL had a revenue of IDR 5.6 tr.
Indosat-Ooredoo
With a market share of 20.2 percent Indosat counts as the second largest cellular provider in
Indonesia (Ericsson, 2016c). Indosat is owned to 65 percent of Qatar’s Ooredoo and to 15
percent of the Indonesian government. In order to increase the capacity and speed of their
network Indosat has been making investments to modernize the network infrastructure.
During the first quarter of 2016, Indosat had a revenue of IDR 6.8 tr.