substation draft wetland report - zitholele … - pongola/impact phase/final... · substation draft...
TRANSCRIPT

Jones & WagenerC o n s u l t i n g C i v i l E n g i n e e r s59 Bevan Road PO Box 1434 Rivonia 2128 South Africa
Tel: 00 27 (0)11 519 0200 Fax: 00 27 (0)11 519 0201 email: [email protected]
ZITHOLELE CONSULTING
PONGOLA - CANDOVER 132 KV POWER LINE AND GOLELA SUBSTATION
DRAFT WETLAND REPORT
Report No.: JW013/13/D764
July 2013

i
DOCUMENT APPROVAL RECORD
Report No.: JW013/13/D764
ACTION FUNCTION NAME DATE SIGNATURE
Prepared Env Scientist Konrad Krüger 11/01/2013
Reviewed
Approved
RECORD OF REVISIONS AND ISSUES REGISTER
Date Revision Description Issued to Issue Format No. Copies
Jan 2013 Rev 0 Draft report for client review
Zitholele Electronic 1
July 2013 Rev 1 Draft report to client Zitholele Electronic 1

ii
ZITHOLELE CONSULTING
PONGOLA - CANDOVER 132 KV POWER LINE AND GOLELA SUBSTATION DRAFT WETLAND REPORT REPORT NO: JW013/13/D764 CONTENTS PAGE
1. INTRODUCTION............................................................................................................... 1
1.1 Background Information.................................................................................................... 1
1.2 Description of the Project.................................................................................................. 1
1.2.1 Project Details ..................................................................................................................... 1
1.2.2 Technical Details ................................................................................................................. 2
1.2.3 Client request ...................................................................................................................... 2
1.3 Study Approach................................................................................................................. 2
1.4 Project Team Details......................................................................................................... 3
1.5 Assumptions and Limitations ............................................................................................ 3
1.6 Site Locality ....................................................................................................................... 3
2. SURFACE WATER AND WETLANDS............................................................................ 5
2.1 Data Collection and Methodology..................................................................................... 5
2.1.1 Riparian Zones vs. Wetlands ................................................................................................ 5
2.2 Delineation ........................................................................................................................ 6
2.2.1 Terrain Unit Indicator ........................................................................................................... 6
2.2.2 Soil Form Indicator............................................................................................................... 6
2.2.3 Soil Wetness Indicator ......................................................................................................... 9
2.2.4 Vegetation Indicator ........................................................................................................... 10
2.2.5 Delineated Wetlands and Buffer Zones ............................................................................... 11
2.3 Classification of Wetlands............................................................................................... 13
3. IMPACT ASSESSMENT ................................................................................................ 17
3.1 Methodology.................................................................................................................... 17
3.2 Impact Assessment......................................................................................................... 18
3.2.1 Initial Impact ...................................................................................................................... 18
3.2.2 Additional Impact ............................................................................................................... 18
3.2.3 Cumulative Impact ............................................................................................................. 20
3.2.4 Mitigation Measures ........................................................................................................... 20

iii
3.2.5 Residual Impact ................................................................................................................. 22
4. CONCLUSION AND RECOMMENDATIONS................................................................ 22
5. REFERENCES................................................................................................................ 22

iv
LIST OF FIGURES
Figure 1: Regional locality of the proposed study area showing the various project alternatives. 4 Figure 2: Site Topography and Drainage ....................................................................................... 7 Figure 3: Study Area Soils .............................................................................................................. 8 Figure 4: Vegetation found in the non-perennial streams on site ................................................ 10 Figure 5: The Pongola River and the associated vegetation ....................................................... 11 Figure 6: Wetlands, Streams and Rivers on site .......................................................................... 12 Figure 7: National Wetland classification system (SANBI, 2009) ................................................ 13 Figure 8: Crossing the Pongola River (Google Earth) .................................................................. 14 Figure 9: Wetland Crossing by Southern and Central Corridor ................................................... 15 Figure 10: Buffered Water Features on site ................................................................................. 16 Figure 11: Impact assessment methodology................................................................................ 17 Figure 12: Erosion scars on site ................................................................................................... 18

v
TERMS AND ABBREVIATIONS
BA ........................................................................................................................... Basic Assessment
DEA ...............................................................................................Department of Environmental Affairs
DWEA ........................................................................... Department of Water and Environmental Affairs
DWA .......................................................................................................... Department of Water Affairs
DWAF .................................................................................... Department of Water Affairs and Forestry
EA .............................................................................................................Environmental Authorisation
EMP................................................................................................... Environmental Management Plan
GN ..........................................................................................................................Government Notice
J&W .......................................................................................................................Jones and Wagener
km ....................................................................................................................................... kilometres
kV ............................................................................................................................................. kilovolt
m .............................................................................................................................................. metres
m3 .................................................................................................................................... cubic metres
mamsl ...................................................................................................... metres above mean sea level
NEMA ..................................................................................... National Environmental Management Act
NWA ........................................................................................................................National Water Act
R ........................................................................................................................................ Regulation
SANBI ..................................................................................South African National Biodiversity Institute
ToR........................................................................................................................ Terms of Reference
WUL ....................................................................................................................... Water Use Licence
WULA .................................................................................................... Water Use Licence Application

Jones & WagenerC o n s u l t i n g C i v i l E n g i n e e r s59 Bevan Road PO Box 1434 Rivonia 2128 South Africa
Tel: 00 27 (0)11 519 0200 Fax: 00 27 (0)11 519 0201 email: [email protected]
JON ES & W AGEN ER (PT Y) LT D REG NO. 1993/02655/07 VAT No. 4410136685
DIRECTORS: PW Day (Chairman) PrEng MSc(Eng) HonFSAICE D Brink (CEO) PrEng BEng(Hons) FSAICE PG Gage PrEng CEng BSc(Eng) GDE MSAICE AIStructE JP van der Berg PrEng PhD MEng FSAICE
TT Goba PrEng MEng FSAICE GR Wardle (Alternate) PrEng MSc(Eng) FSAICE
TECHNICAL DIRECTORS: JR Shamrock PrEngMSc(Eng) MSAICE MIWMSA JE Glendinning PrSciNat MSc(Env Geochem) NJ Vermeulen PrEng PhD MEng MSAICE A Oosthuizen PrEng BEng(Hons) MSAICE
HR Aschenborn PrEng BEng(Hons) MSAICE M van Zyl PrSciNat BSc(Hons) MIWMSA MW Palmer PrEng MSc(Eng) AMSAICE TG le Roux PrEng MEng MSAICE
ASSOCIATES: BR Antrobus PrSciNat BSc(Hons) MSAIEG AJ Bain BEng AMSAICE PJJ Smit BEng(Hons) AMSAICE R Puchner PrSciNat MSc(Geol) IMSAIEG MAEG M van Biljon MSc(Hydrogeology)
JS Msiza PrEng BEng(Hons) MSAICE MIWMSA RA Nortjé PrEng MScEng MSAICE MIWMSA GB Simpson PrEng MEng MSAIAE
CONSULTANT: JA Kempe PrEng BSc(Eng) GDE MSAICE AIStructE
FINANCIAL MANAGER: HC Neveling BCom MBL
ZITHOLELE CONSULTING PONGOLA - CANDOVER 132 KV POWER LINE AND GOLELA SUBSTATION DRAFT WETLAND REPORT REPORT NO: JW013/13/D764
1. INTRODUCTION
1.1 Background Information
Eskom Holdings State Owned Company Limited (Eskom) is the South African utility that generates, transmits and distributes electricity. Eskom supplies about 95% of the country's electricity and about 60% of the total electricity consumed in Africa. Eskom plays a major role in accelerating growth in the South African economy by providing a high-quality supply of electricity.
With the construction of three proposed new 132 kV substations (Ndumo, Gezisa and Mbazwana) for the supply of the greater Makhathini area in northern KwaZulu-Natal, the existing Pongola-Candover 132kV line will be overloaded by 2013.
Should this line be out of service for whatever reason, then the Makhathini, Gezisa, Ndumo and Nondabuya loads will be shed resulting in an inevitable loss of power supply in the greater Makhatini area and an unacceptable service to customers.
A second 132kV line from Pongola to Candover therefore needs to be constructed to enhance security of supply for the Makhatini substations of Ndumo, Gezisa and Mbazwana in northern KwaZulu-Natal. In order to accommodate a second Pongola-Candover 132kV line, modifications to the existing Pongola 132/22kV substation and the end point, the existing Candover switching station, will have to be undertaken. A second 132kV power line and substation is also required to tee-off the existing Mkuze-Pongola 132kV power line (also called Mkuze-Pongola line 1). This proposed substation will be constructed close to the turn-off from the N2 to the road leading to Golela and Swaziland. This substation will accommodate the electrical load for developments within the vicinity of the border post. As the two projects are in close proximity their environmental impact assessment is being dealt with simultaneously. The area is very hilly and mountainous with bushveld which imposes access constraints and difficulties associated with identifying alternative power line corridors. Game farms, a game reserve and some sugar cane are the predominant land uses.
1.2 Description of the Project
1.2.1 Project Details
The first assessment is for the proposed second Pongola-Candover 132kv power line and associated modifications to the existing Pongola substation and Candover switching station. A 36 metre wide power line corridor for this second 132kV power line from the existing Pongola substation to the existing Candover Switching Station must

2
Report JW013/13/D764
be located. The estimated length of the power line will be approximately 50km long. Eskom has a vacant power line servitude parallel to the existing 132kV power line between Candover Switching Station and Pongola Substation which will constitute one of the corridor alternatives for assessment. Modifications to the existing Pongola Substation and Candover Switching Station must be done to accommodate the second Pongola-Candover 132kV line.
The second assessment is for the loop-in and loop-out 132kv power lines from the existing Pongola-Candover 132kv (also called Mkuze-Pongola line 1) power line to the proposed Golela substation and finding the best location for this substation.
This proposed new 132/22kV substation will be located about 1 km north-east of the intersection of the N2 and the secondary road to the Golela border post. Corridors of about 500 metre wide will be investigated in which to locate the 36m wide servitudes for the two approximately 15 km long loop-in and loop-out lines to run from the existing Mkuze-Pongola 132kV line (Mkuze-Pongola Line 1) at two points to the proposed Golela Substation.
1.2.2 Technical Details
The proposed Golela 132/22kV stepdown substation will have a footprint of roughly 100 x 100m. The associated infrastructure to be constructed will include:
Perimeter Fence: The perimeter of the site will be fenced to ensure the safety of the site and the surrounding people and animals.
Terracing and foundations: The site will be terraced if needed and foundations will be constructed in line with substation foundation requirements.
Circuit breakers: For disconnection under no-load condition for safety, isolation and maintenance.
5 feeder bays for a potential 5 X 22kV woodpole power lines to exit the substation will be constructed
The proposed 132kV power line will have self-supporting and guyed suspension and strain towers which require a 36m wide servitude - 18 metres either side of the centre line. The towers will be on average 20m high.
1.2.3 Client request
Zitholele Consulting requested Jones and Wagener to submit a quotation to assist with the compilation of a Surface Water as well as a Visual Assessment of the proposed project and its alternatives.
1.3 Study Approach
After the discussions mentioned above, J&W proposed the following scope of work and way forward:
Delineation of the wetlands according to the DWA methodology (A practical field procedure for the identification and delineation of wetlands and riparian areas, Edition 1, September 2005);
Comment on the type, size and existing impacts on any potential wetlands; and
3
Report JW013/13/D764
Assess the potential impact from the various alternatives, propose mitigation measures and identify the most suitable alternative.
The above scope was accepted on the 28th August 2012 and the work commenced with site visits on the 29th and 31st August 2012, later on in the project, several changes were made to the route alternatives, after which the site was visited again in October 2012 to include the new areas. This report documents the findings of the assessments.
1.4 Project Team Details
The following project personnel were involved in the compilation of this report.
Konrad Kruger, BSc Hons (Geog)
Mr. Konrad Kruger graduated from the University of Pretoria with a BSc in
Environmental Science in 2002 and BSc Honours in Geography in 2003. He has been involved in a variety of environmental projects in the last eight years and has undertaken a variety of specialist studies, mapping and environmental consulting. The specialist studies included vegetation assessments, soil mapping and agricultural assessments, wetland delineations, visual assessments and terrestrial ecological assessments. In terms of similar work, he has undertaken surface water and visual assessments for the Duvha-Minerva 400 kV power line deviation, the Bravo 400 kV Integration Project and the Camden-Mbewu 765 kV power line project.
1.5 Assumptions and Limitations
The following assumptions/limitations were relevant during the assessment:
The information regarding the position of the route alternatives was received from the client and J&W is not responsible for the accuracy of the route positions;
Access to the study area was restricted and not all the farms could be visited.
1.6 Site Locality
The study area is located between the towns of Pongola and Mkuze in the northern parts of the KwaZulu-Natal Province. The main roads in the region are the N2 highway, the R69 and the R66. Figure 1 below illustrates the regional location of the site.

4
Report JW013/13/D764
Figure 1: Regional locality of the proposed study area showing the various project alternatives. .

5
Report JW013/13/D764
2. SURFACE WATER AND WETLANDS
2.1 Data Collection and Methodology
The surface water data was obtained from the National Freshwater Ecosystem Priority Area’s (NFEPA) database from SANBI (2011). The data used included catchments, river alignments and river names. This information will be ground truthed during the specialist investigation.
2.1.1 Riparian Zones vs. Wetlands
Wetlands
The riparian zone and wetlands were delineated according to the Department of Water Affairs (DWA, previously known as the Department of Water Affairs and Forestry -DWAF) guideline, 2005: A practical guideline procedure for the identification and delineation of wetlands and riparian zones. According to the DWA guidelines a wetland is defined by the National Water Act as:
“land which is transitional between terrestrial and aquatic systems where the water table is usually at or near surface, or the land is periodically covered with shallow water, and which land in normal circumstances supports or would support vegetation typically adapted to life in saturated soil.”
In addition the guidelines indicate that wetlands must have one or more of the following attributes:
Wetland (hydromorphic) soils that display characteristics resulting from prolonged saturation;
The presence, at least occasionally, of water loving plants (hydrophytes); and
A high water table that results in saturation at or near surface, leading to anaerobic conditions developing in the top 50 centimetres of the soil.
During the site investigation the following indicators of potential wetlands were identified:
Terrain unit indicator;
Soil form indicator;
Soil wetness indicator; and
Vegetation indicator.
Riparian Areas
According to the DWA guidelines a riparian area is defined by the National Water Act as:
“Riparian habitat includes the physical structure and associated vegetation of the areas associated with a watercourse which are commonly characterised by alluvial soils, and which are inundated or flooded to an extent and with a frequency sufficient to support vegetation of species with a composition and physical structure distinct from those of adjacent land areas”
6
Report JW013/13/D764
The difference between Riparian Areas and Wetlands
According to the DWA guidelines the difference between a wetland and a riparian area is:
“Many riparian areas display wetland indicators and should be classified as wetlands. However, other riparian areas are not saturated long enough or often enough to develop wetland characteristics, but also perform a number of important functions, which need to be safeguarded. Riparian areas commonly reflect the high-energy conditions associated with the water flowing in a water channel, whereas wetlands display more diffuse flow and are lower energy environments.”
2.2 Delineation
The site was investigated for the occurrence / presence of wetlands and riparian areas, using the methodology described above and described in more detail in the DWA guidelines.
2.2.1 Terrain Unit Indicator
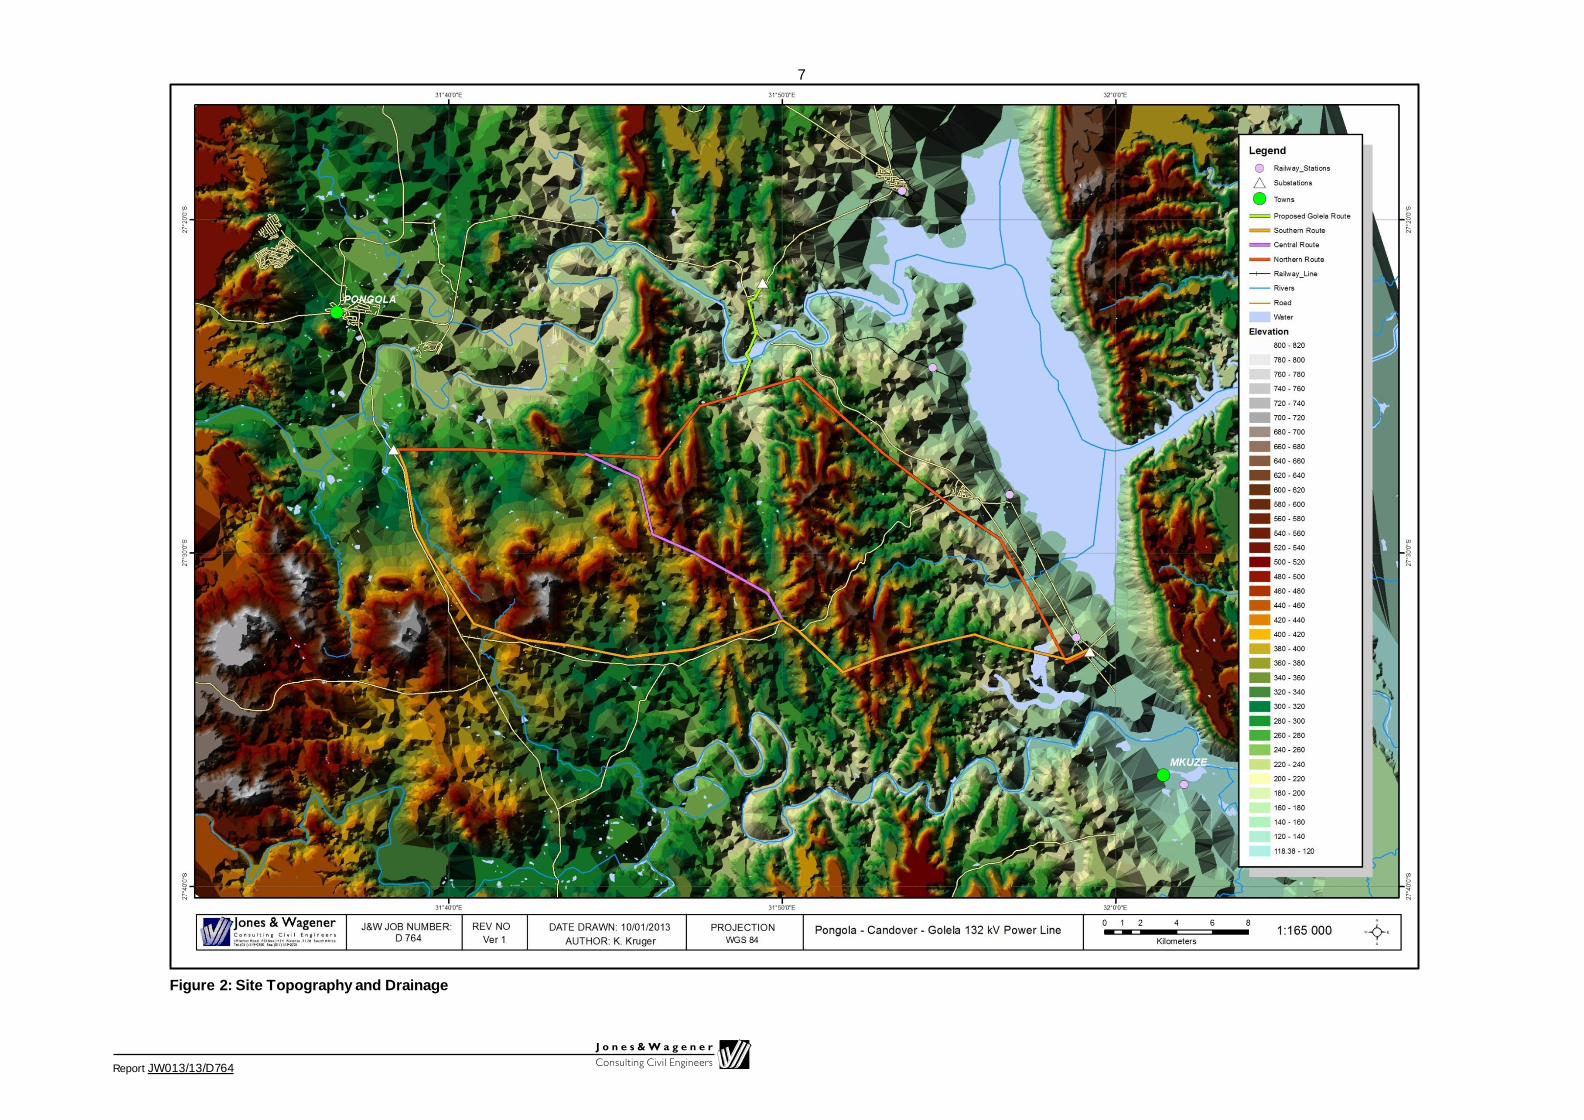
The terrain on site varies from 118 metres above mean sea level (mamsl) to 820 mamsl. From the topo map (Figure 2) it can be seen that the study area is intersected by three main ridge lines through the centre of the site, with most of the study area draining towards the Pongolapoort / Jozini Dam in the east. The ridges create steep slopes, so steep in fact that any precipitation that fall upon the site is immediately drained towards either of the two main rivers in the area, namely the Pongola and the Mkuze, or swept down a non-perennial gully towards Jozini Dam. With the exception of the rivers mentioned above, none of the streams of site are perennial.
The terrain units present in the study area include the crest, scarp, midslope, footslope and valley bottom units. According to the DWA guidelines the valley bottom is the terrain unit where wetlands are most likely to occur, but the occurrence of wetlands is not excluded from any of the other terrain units.
2.2.2 Soil Form Indicator
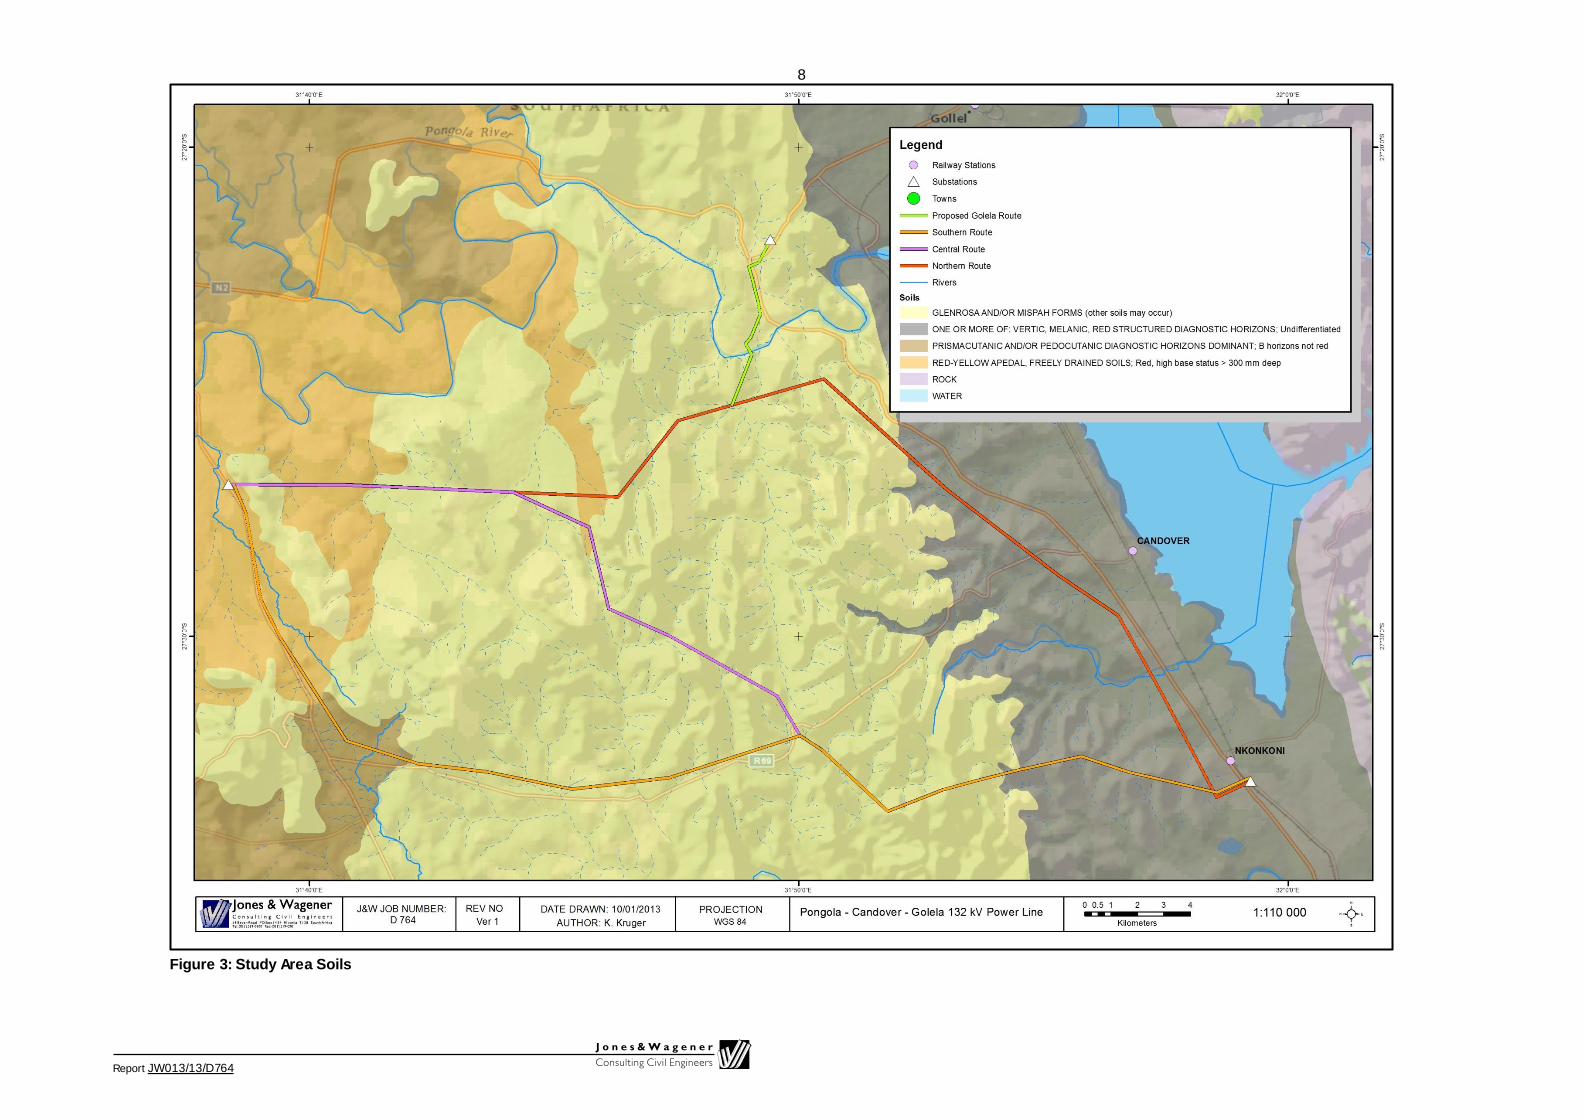
The study area is dominated by the numerous ridges that traverse through the area, as well as the fertile valleys on the edges of the study area and the steady drainage towards the Jozini Dam. Most of the study area is dominated by hard rocky soils and water enters the soil profile and then flows through the profile down-slope to the valleys. As the water moves through the profile, particles are entrained and over time clay is washed down the slopes and accumulates in the valleys.
As a result the soil forms found in and around the ridges are very shallow, stoney and not conducive to the formation of wetlands. Once the slopes decrease and the rock outcrops reduce, the clay particles are deposited. In the valley bottoms of the non-perennial streams as well as the area surrounding the Jozini Dam there are significant amounts of soils that are dominated by high clay contents and these in turn are ideal soils for the location of wetlands. The overarching soil types are shown in Figure 3 below and the wide band of clay soils can be noted on the eastern side of the study area. A more detailed description of the soil types found on site is given below.
7
Report JW013/13/D764
Figure 2: Site Topography and Drainage
8
Report JW013/13/D764
Figure 3: Study Area Soils
9
Report JW013/13/D764
2.2.2.1. Soil Forms Identified
Rocky Soils
The rocky soils in the central parts of the site (yellow area on the map) are dominated by Glenrosa and Mispah soils forms. These forms are both characterised by very shallow depth, a rocky substrate and very little to no clay accumulation.
Apedal Soil
The area adjacent to the Pongola River, in the northern and western parts of the study area is typified by apedal soils. These are deep, well-drained soils without any strong structure formation. These are good agricultural soils and are also the main area of crop and cane production within the study area. The soil types associated with this area include Hutton, Bainsvlei and Bloemdal (red colour), Clovelly, Avalon and Pinedene (yellow-brown colour). Although these soils can have some clay accumulation in the lower horizons, it is usually too deep to be seen as wetland soils.
Vertic, Melanic, Pedocutanic or Red Structured Soils
The area surrounding the Jozini dam (dark grey area on the map) is characterised by a wide variety of soils with high clay contents. This is due to the clay particles being transported down slope towards the local low point, which is the dam. Here clays have accumulated over time and hence the soils are typified by their clay contents.
The soils include Shortlands (Red structured), Bonheim and Wilowbrook (Melanic), and Rensburg and Arcadia (Vertic). The clay soils here is such an outstanding trait of the region that two soil families (sub groups to soil forms) are named after the region. The Golela and Mkuze soil families are subgroups of the Bonheim soil form and that generally indicates that this area was were the soil classification working group first identified these types of soils.
In addition to the soil found around the Jozini Dam, there is also an area of clay accumulation to the south west of the study area. These soil forms include Sterkspruit, Sepane and again Bonheim.
All the soils mentioned above have high clay contents, some like the vertic soils; have swelling and shrinking properties that make building on these soils quite a challenge. In terms of the wetland delineation, all these soils have the potential to be seen as wetland soils if there is sufficient signs of wetness in the top 50cm of the soil.
2.2.3 Soil Wetness Indicator
The soils on site were subjected to a soil wetness assessment. If soils showed signs of wetness within 50 cm of the soil surface, it was classified as a hydromorphic soil and divided into the following groups:
Temporary Zone
Minimal grey matrix (<10%);
Few high chroma mottles; and
Short periods of saturation.
10
Report JW013/13/D764
Seasonal Zone
Grey matrix (>10%);
Many low chroma mottles present; and
Significant periods of wetness (>3 months / annum).
Permanent Zone
Prominent grey matrix;
Few to no high chroma mottles;
Wetness all year round; and
Sulphuric odour.
On site the bulk of the clay soils do not show any signs of wetness in the top 50cm of the soil. Although the soils have high clay contents the soil profiles in this area are very deep, allowing water to infiltrate. In most of the non-perennial streams you do find signs of the seasonal wetness zone, while the permanent wetness zone was only really identified in an area to the south-east of the study area and in along the Pongola River. Here the Rensburg and Willowbrook soil forms had signs of wetness within the top 50 cm of the soil profile.
2.2.4 Vegetation Indicator
The vegetation on site can be subdivided into three main vegetation types i.e. Zululand Lowveld, Northern Zululand Sourveld and Shokwane-Hlane Basalt Lowveld. These main vegetation units are all typified by either Savanna or grassland characteristics. No large scale riparian or wetland vegetation is found on a regional level.
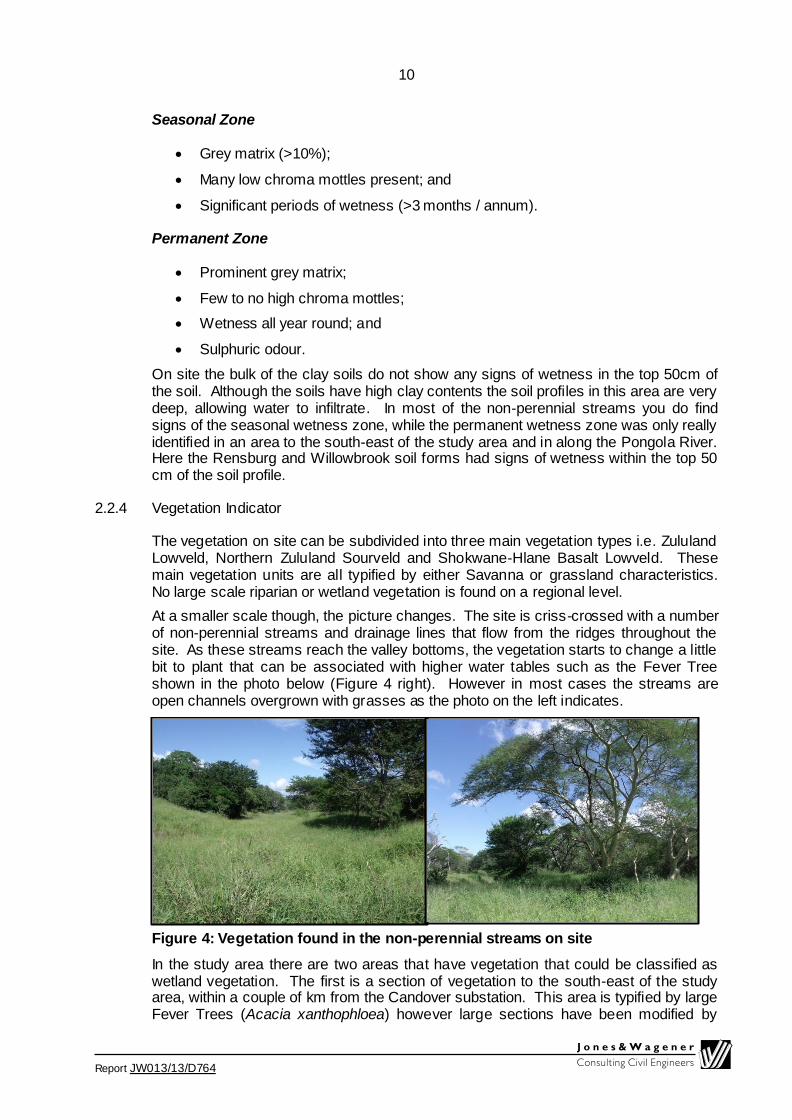
At a smaller scale though, the picture changes. The site is criss-crossed with a number of non-perennial streams and drainage lines that flow from the ridges throughout the site. As these streams reach the valley bottoms, the vegetation starts to change a little bit to plant that can be associated with higher water tables such as the Fever Tree shown in the photo below (Figure 4 right). However in most cases the streams are open channels overgrown with grasses as the photo on the left indicates.
Figure 4: Vegetation found in the non-perennial streams on site
In the study area there are two areas that have vegetation that could be classified as wetland vegetation. The first is a section of vegetation to the south-east of the study area, within a couple of km from the Candover substation. This area is typified by large Fever Trees (Acacia xanthophloea) however large sections have been modified by

11
Report JW013/13/D764
humans for use as agricultural land as can be seen in Figure 9. This area is crossed by both the Southern and Central Corridor.
In terms of proper wetland obligate species the area that stands out is the river banks and floodplains of the Pongola River (shown below). Here a number of large riparian trees (Ficus and Combretum) and stands of reeds (Phragmites and Arundo).
Figure 5: The Pongola River and the associated vegetation
2.2.5 Delineated Wetlands and Buffer Zones
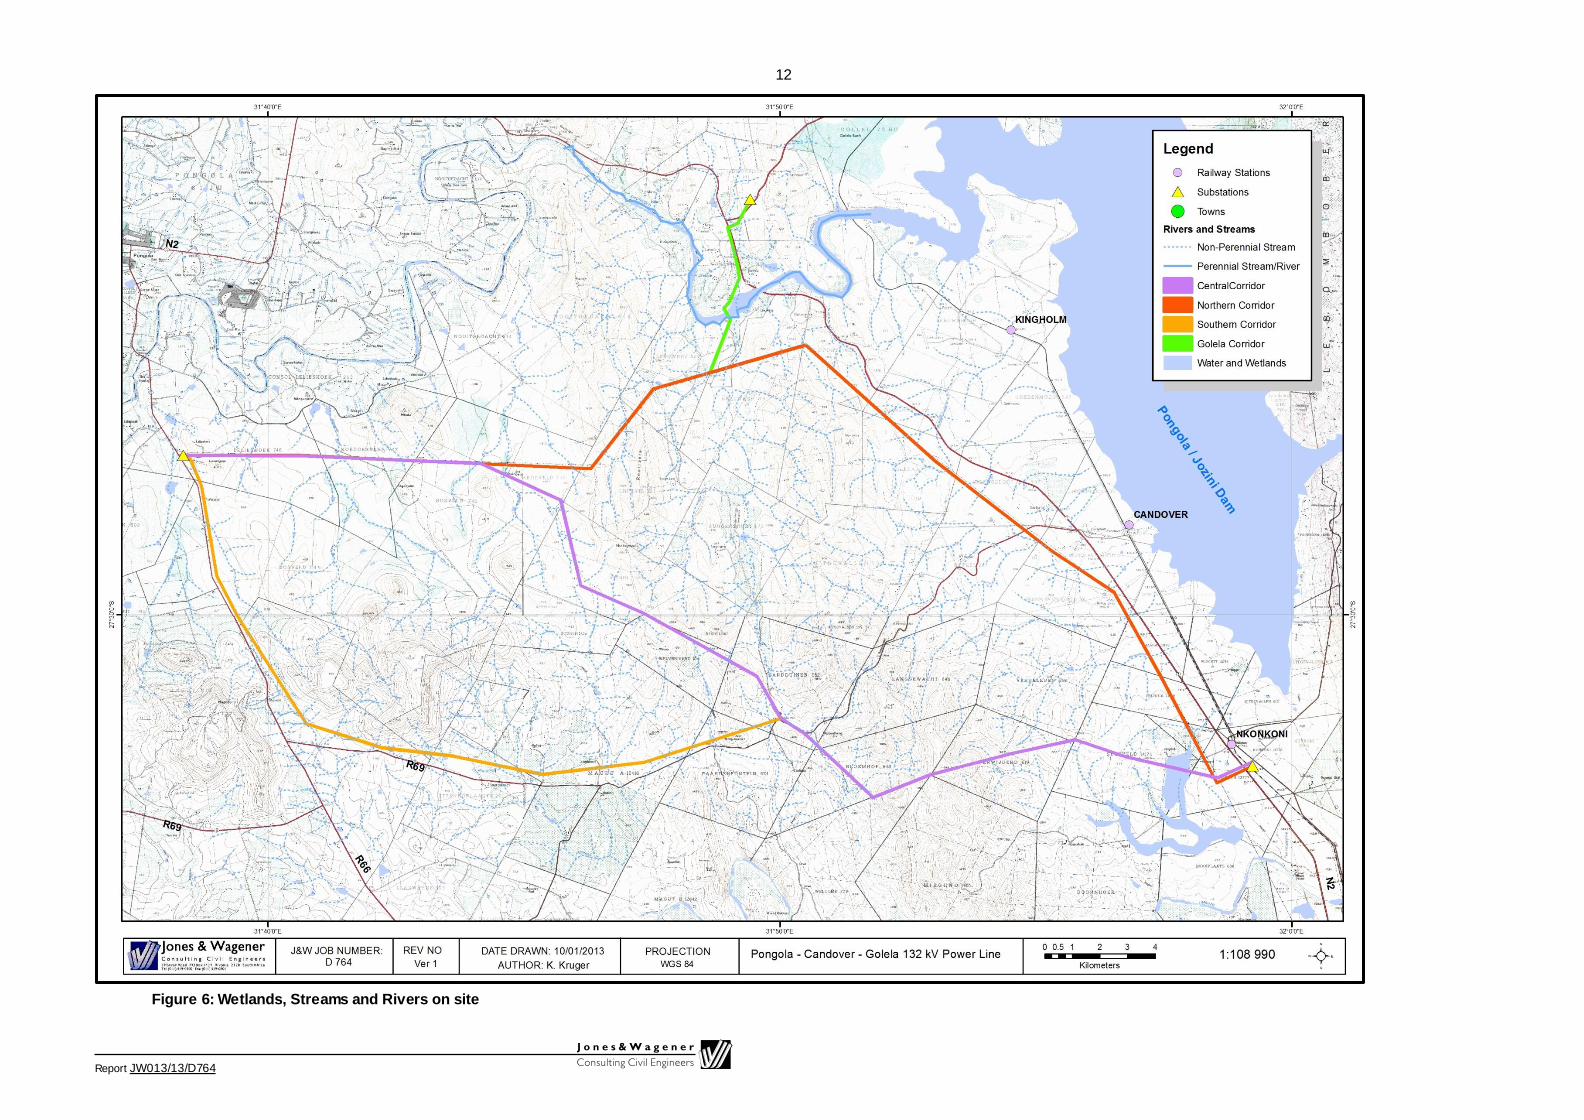
According to the methodology that was followed for delineation of wetlands by DWA, there are wetlands present on site. It should, however, be noted that several of the wetlands could also be classified as riparian zones as they form non-perennial preferential drainage paths on site. Figure 6 illustrates the wetlands identified.
12
Report JW013/13/D764
Figure 6: Wetlands, Streams and Rivers on site

13
Report JW013/13/D764
2.3 Classification of Wetlands
The classification of the wetlands in the study area into different wetland types was based on the method as defined in the National Wetland Classification System for South Africa (Figure 7), developed by the Freshwater Consulting Group for South African National Biodiversity Institute and the Working for Water Group.
This classification system has 6 levels of classification that in the end of level 5 described the functional wetland unit. This identification of the functional unit was the aim of this assessment. The classification of the wetlands on site proceeded as follows:
Level 1 – System – Inland Ecosystem;
Level 2 – Bioregion – Lowveld;
Level 3 – Landscape Setting
a) Valley floor.
Level 4 – Hydrogeomorphic unit
a) Channel (Pongola River); and
b) Channelled valley bottom wetland.
Level 5 – Level of inundation
a) Perennial (Pongola River); and
b) Non-perennial – Intermittently inundated, seasonally saturated.
Figure 7: National Wetland classification system (SANBI, 2009)
Using the methodology above the following wetland types were identified on site as shown below in Figure 10:
Perennial Channel (Pongola River); and

14
Report JW013/13/D764
Non-perennial, intermittently inundated, seasonally saturated Channelled Valley-bottom wetland.
Refer to Figure 6 above for a map of the study area showing the wetlands and drainage channels as well as the position of the corridors.
The corridor planned for the Golela 132 kV route crosses over the Pongola River just west of the N2 Highway bridge crossing over the river. The crossing and the corridor is shown below in Figure 8. The corridor is shown in white, the Pongola River and floodplain in blue and the N2 highway in yellow.
Figure 8: Crossing the Pongola River (Google Earth)
The second wetland is crossed by both the Southern and Central Corridors just after they cross the N2 highway as shown below. The orange line indicates the proposed crossing, however this section may be too wide to be spanned depending on the type of tower utilised by Eskom (>700m). If the wetland cannot be spanned it could result in the placement of pylons inside the wetland area.

15
Report JW013/13/D764
Figure 9: Wetland Crossing by Southern and Central Corridor
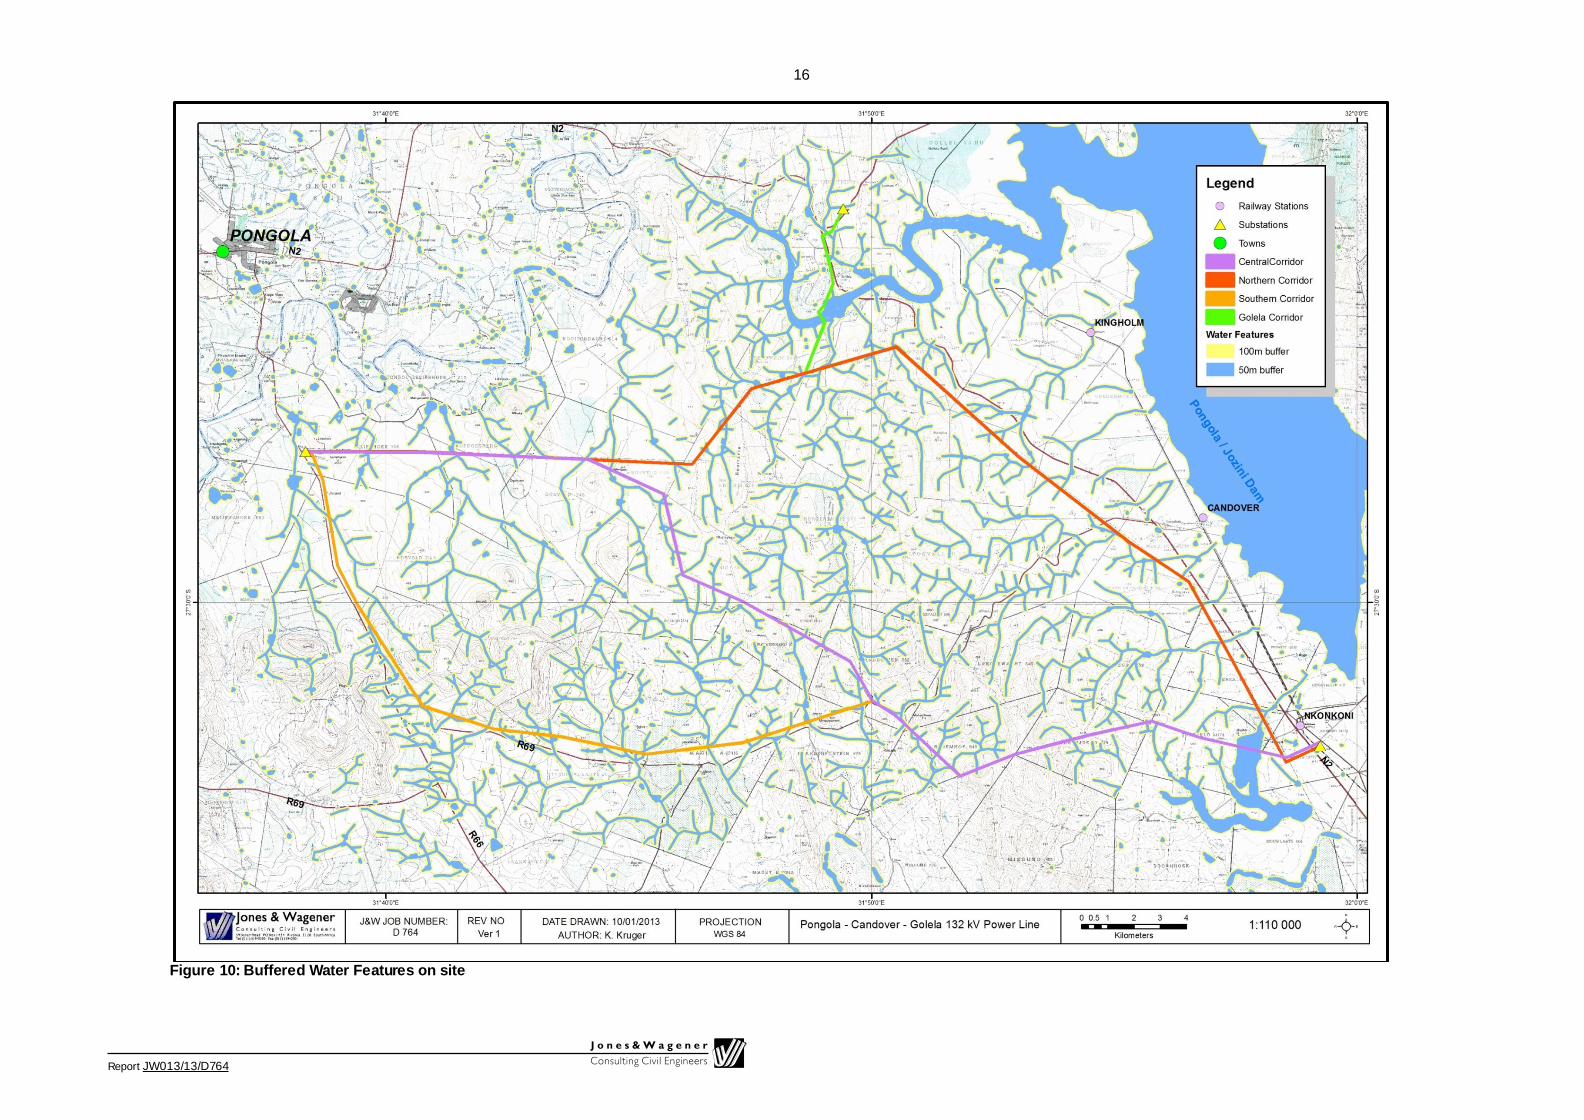
Most government departments require a buffer zone around any delineated surface water features, and hence, for this report a buffer of 50m and 100m was utilised as shown in the map below. These buffer zones are established to protect the surface water features from impact.
16
Report JW013/13/D764
Figure 10: Buffered Water Features on site

17
Report JW013/13/D764
3. IMPACT ASSESSMENT
3.1 Methodology
The following methodology was provided by Zitholele to be used for the assessment of impacts on this project.
Figure 11: Impact assessment methodology
To ensure uniformity, the assessment of impacts is addressed in a standard manner so that a wide range of impacts can be compared with each other. For this reason a clearly defined significance rating scale is provided to assess the significance (importance) of the associated impacts. The scale embraces the notion of extent and magnitude, but does not always clearly define these since their importance in the rating scale is very relative. For example, the magnitude (i.e. the size) of are affected by atmospheric pollution may be extremely large (1000 km²) but the significance of this effect is dependent on the concentration or level of pollution. If the concentration were great, the significance of the impact would be HIGH or VERY HIGH, but if it were dilute it would be LOW or VERY LOW. Similarly, if 60 ha of a grassland type are destroyed the impact would be VERY HIGH if only 100 ha of that grassland type was known. The impact would be VERY LOW if the grassland type were common. The potential significance of every environmental impact identified is determined by using a ranking scale, based on the following (the terminology is extracted from the DEAT guideline document on EIA Regulations, April 1998): Occurrence
Probability of occurrence (how likely is it that the impact may occur?), and
Duration of occurrence (how long may it last?) Severity
Magnitude (severity) of impact (will the impact be of high, moderate or low severity?), and
Scale/extent of impact (will the impact affect the national, regional or local environment, or only that of the site?) In order to assess each of these factors for each impact, the following ranking scales were used: Probability: 5 – Definite/don’t know 4 – Highly probable 3 – Medium probability 2 – Low probability 1 – Improbable 0 – None
Duration: 5 – Permanent 4 - Long-term (ceases with the operational life) 3 - Medium-term (5-15 years) 2 - Short-term (0-5 years) 1 – Immediate
Scale: 5 – International 4 – National 3 – Regional (>5km) 2 – Local (<5km) 1 – Site only 0 – None
Magnitude: 10 - Very high/don’t know 8 – High 6 – Moderate 4 – Low 2 – Minor
Once the above factors had been ranked for each impact, the environmental significance of each was assessed using the following formula:
SP = (magnitude + duration + scale) x probability The maximum value is 100 significance points (SP). Environmental effects were rated as either of high, moderate or low significance on the following basis:
More than 60 significance points indicated high environmental significance.
Between 30 and 60 significance points indicated moderate environmental significance.
Less than 30 significance points indicated low environmental significance.
High = H Moderate = M Low = L
Please note that only negative impact will be ranked
The degree of certainty of the assessment was judged on the following criteria:
Definite: More than 90% sure of a particular fact. Probable: Between 70 and 90% sure of a particular fact, or of the likelihood of that impact occurring. Possible: Between 40 and 70% sure of a particular fact or of the likelihood of an impact occurring.
Unsure: Less than 40% sure of a particular fact or the likelihood of an impact occurring.
18
Report JW013/13/D764
3.2 Impact Assessment
3.2.1 Initial Impact
The initial impacts on surface water and wetlands are mostly located around the Pongola River. Agriculture has encroached right up to the edge of the river to the point were very little riparian vegetation remains in most places where the soil is deep enough to support agriculture. Water is abstracted from the rivers for irrigation of crops, especially the sugarcane. The construction of the Jozini Dam in 1974 (then Pongolapoort Dam) in changed surface water regime of the entire region by damming up the Pongola River in a narrow gorge between the Lebombo and Ubombo mountain ranges.
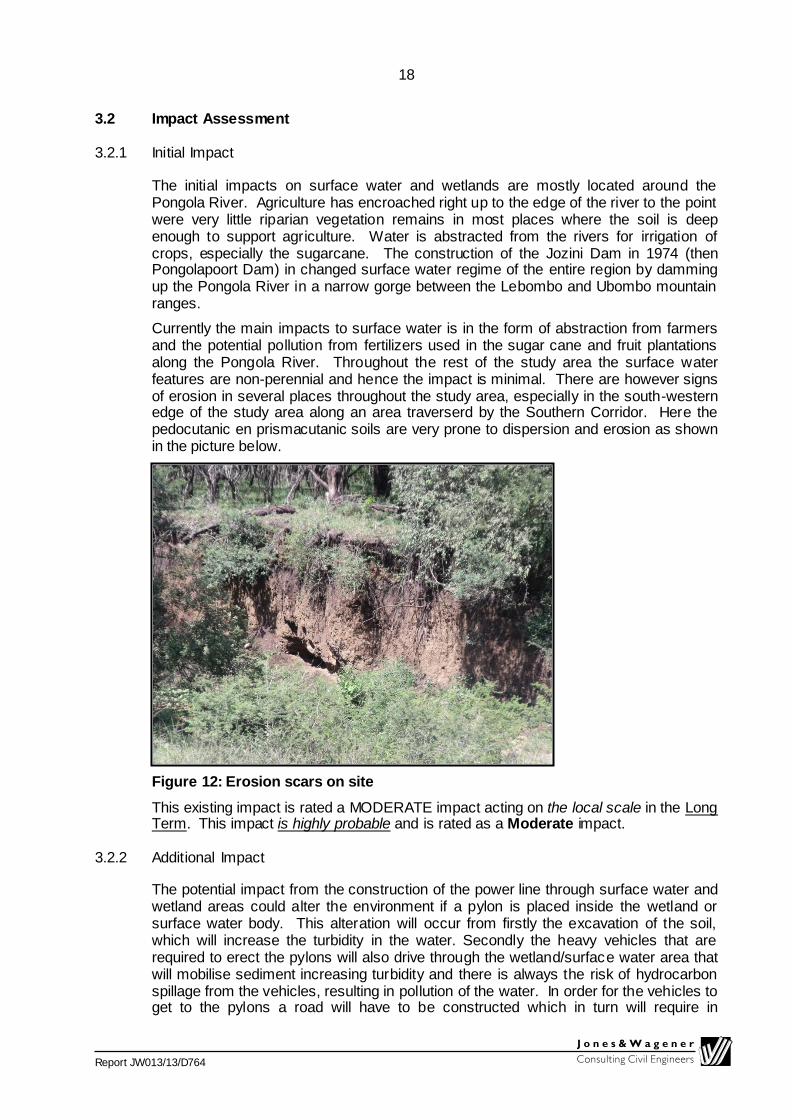
Currently the main impacts to surface water is in the form of abstraction from farmers and the potential pollution from fertilizers used in the sugar cane and fruit plantations along the Pongola River. Throughout the rest of the study area the surface water features are non-perennial and hence the impact is minimal. There are however signs of erosion in several places throughout the study area, especially in the south-western edge of the study area along an area traverserd by the Southern Corridor. Here the pedocutanic en prismacutanic soils are very prone to dispersion and erosion as shown in the picture below.
Figure 12: Erosion scars on site
This existing impact is rated a MODERATE impact acting on the local scale in the Long Term. This impact is highly probable and is rated as a Moderate impact.
3.2.2 Additional Impact
The potential impact from the construction of the power line through surface water and wetland areas could alter the environment if a pylon is placed inside the wetland or surface water body. This alteration will occur from firstly the excavation of the soil, which will increase the turbidity in the water. Secondly the heavy vehicles that are required to erect the pylons will also drive through the wetland/surface water area that will mobilise sediment increasing turbidity and there is always the risk of hydrocarbon spillage from the vehicles, resulting in pollution of the water. In order for the vehicles to get to the pylons a road will have to be constructed which in turn will require in

19
Report JW013/13/D764
importation of gravel and the compaction thereof. This will alter the stream flow environment and impact on the vegetation in the wetland.
In order to quantify the potential impacts of each of the proposed corridors, the GIS was utilised to overlay the corridors with the delineated water features as well as their buffer zones. This allows a quantitative comparison between the various corridors in terms of hectares of potential impact as shown in the table below.
Table 1: Potential Impact to Surface Water Features Corridor Within 50m
buffer (ha) Within 100m buffer (ha)
Number of Crossings
Northern 22.57 20.27 23 non perennial streams
Central 25.25 17.37 1 large wetland and 25 non perennial streams Southern 34.08 20.65 1 large wetland and 29 non perennial streams
Golela 3.46 4.37 Pongola River and 3 non perennial streams
Due to the fact that the alternatives do not all cross the same rivers, wetlands and drainage features, there is a discernible difference in the impact of the various alternatives and therefore the impacts are rated separately.
Northern Corridor
o No perennial stream crossings;
o No major wetland crossings;
o 23 non perennial stream crossings
o Medium probability a LOW impact on the site only in the long term.
o Rated a Low Impact [(4+4+1)*3=27]
Central Corridor
o 1 large wetland crossing;
o 25 non perennial stream crossings;
o Highly probable a HIGH impact on the site only in the long term.
o Rated a Moderate Impact [(8+4+1)*4=52]
Southern Corridor
o 1 large wetland crossing;
o 29 non perennial stream crossings;
o Highly probable a HIGH impact on the site only in the long term.
o Rated a Moderate Impact [(8+4+1)*4=52]
Golela Corridor
o Crosses the Pongola River;
o Crosses 3 non perennial streams;
o Highly probable a HIGH impact on the site only in the long term.
o Rated a Moderate Impact [(8+4+1)*4=52]
During the operational phase the structures constructed will remain on site and have the potential to continue impacting on the water resource. During operations the potential impacts are the reduction or altering of the stream flow by the physical structure in the water. However the ratings as shown above remains the same, with

20
Report JW013/13/D764
the Northern Corridor rated a Low impact and the rest of the Corridors rated a Moderate impact.
3.2.3 Cumulative Impact
Cumulatively the impact of the proposed power line has to be measured along with the existing impacts already occurring in the area. This is split into the two main wet areas:
Pongola River – Golela Corridor;
o Agriculture already encroached right up to the edge of the Pongola River;
o Potential pollution from sediment during harvesting/planting of crops as well as potential fertilizer spillages or overuse;
o Additional impact of the power line crossing the river;
o Highly probable a HIGH impact on the local area in the long term.
o Rated a Moderate Impact [(8+4+2)*4=56]
Candover wetland – Southern and Central Corridors
o Large sections of the wetland transformed by agriculture;
o Potential pollution from sediment during harvesting/planting of crops as well as potential fertilizer spillages or overuse;
o Additional impact of the power line crossing the wetland;
o Highly probable a HIGH impact on the local area in the long term.
o Rated a Moderate Impact [(8+4+2)*4=56]
As the Northern Corridor follows an existing line and does not have any major surface water features to cross, the cumulative impact remains as assessed for the Additional Impact i.e. a Low impact.
3.2.4 Mitigation Measures
Avoid impacts to wetlands and perennial rivers by utilising the Northern Corridor rather than the Southern or Central Corridor;
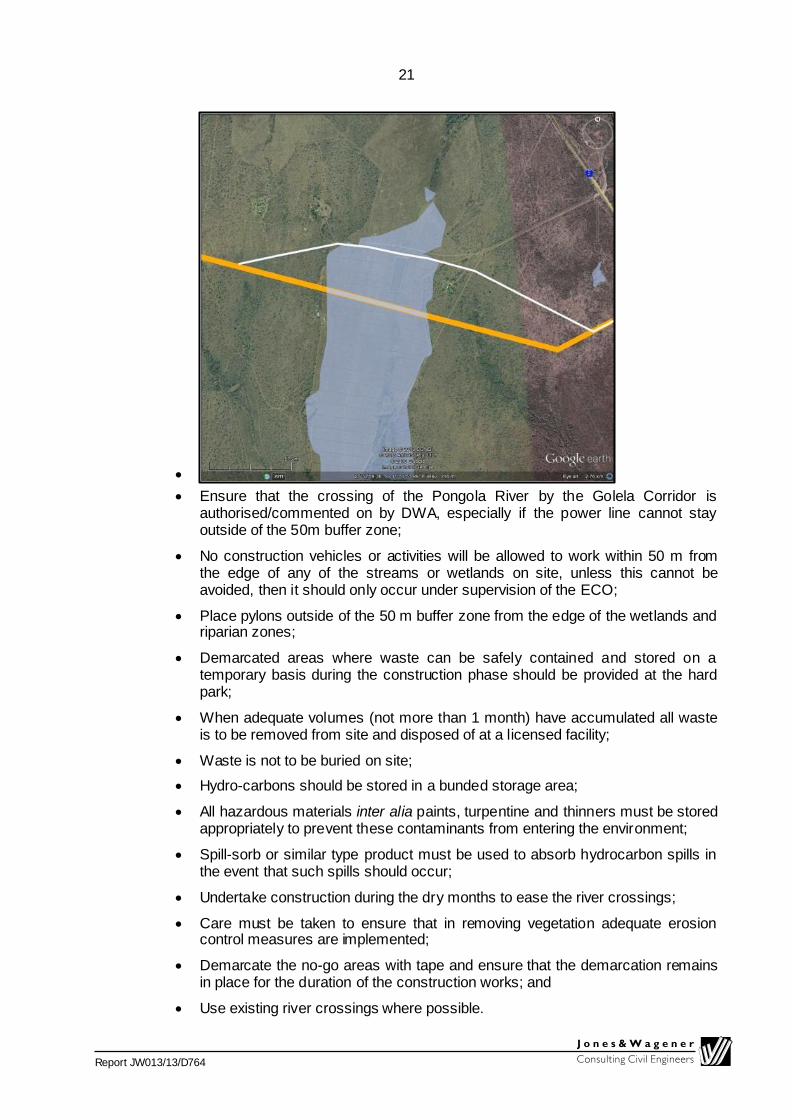
If the Southern or Central Corridor cannot span the wetland identified, re-align the wetland crossing as shown below. The orange route indicates the current corridor, while the white route crosses the wetland at an existing dam wall and road crossing;
21
Report JW013/13/D764
Ensure that the crossing of the Pongola River by the Golela Corridor is authorised/commented on by DWA, especially if the power line cannot stay outside of the 50m buffer zone;
No construction vehicles or activities will be allowed to work within 50 m from the edge of any of the streams or wetlands on site, unless this cannot be avoided, then it should only occur under supervision of the ECO;
Place pylons outside of the 50 m buffer zone from the edge of the wetlands and riparian zones;
Demarcated areas where waste can be safely contained and stored on a temporary basis during the construction phase should be provided at the hard park;
When adequate volumes (not more than 1 month) have accumulated all waste is to be removed from site and disposed of at a licensed facility;
Waste is not to be buried on site;
Hydro-carbons should be stored in a bunded storage area;
All hazardous materials inter alia paints, turpentine and thinners must be stored appropriately to prevent these contaminants from entering the environment;
Spill-sorb or similar type product must be used to absorb hydrocarbon spills in the event that such spills should occur;
Undertake construction during the dry months to ease the river crossings;
Care must be taken to ensure that in removing vegetation adequate erosion control measures are implemented;
Demarcate the no-go areas with tape and ensure that the demarcation remains in place for the duration of the construction works; and
Use existing river crossings where possible.

22
Report JW013/13/D764
3.2.5 Residual Impact
The residual impact if the above mitigation measures are implemented, especially the adherence to the recommendation in terms of the preferred route and the buffer zones, could reduce the impact significance and also the probability of the impact.
If successfully implemented the impact could be reduced to a LOW impact acting on the site only in the short term. The medium probability results in a Low impact rating
during the construction and operational phases.
4. CONCLUSION AND RECOMMENDATIONS
In conclusion Eskom proposes the construction of the Pongola-Candover and Golela 132 kV power line and substation. This report evaluated the baseline conditions and potential impacts to surface water environment of the four corridors given by the client.
The Northern Corridor provided a suitable corridor with the minimum additional impact due to the close proximity of the existing Pongola-Candover power line. This not only is an existing impact, but also does not require the construction of an entirely new access road through the study area.
The Golela Corridor provides a suitable crossing over the Pongola River and is located adjacent to the highway and the main turnoff to Swaziland and Golela.
It is the recommendation of this report that the Northern and Golela Corridors be selected for the proposed project and that the mitigation measures contained in this report be included in the Environmental Management Plan (EMP) to be compiled for the project.
5. REFERENCES
Department of Water Affairs and Forestry (DWAF), 2005. A practical field procedure for
identification and delineation of wetlands and riparian areas. Department of
Water Affairs and Forestry, Pretoria
Eijkelkamp Agrisearch Equipment, 2004. Revised Standard Soil Colour Charts,
Eijkelkamp, Giesbeek.
Kotze et al, 2008. Wetland Management Series, WET-EcoServices, A technique for
rapidly assessing ecosystem services supplied by wetlands , Water Research
Commission, WRC Report TT 339/08,
Nel, J.L., Murray, K.M., Maherry, A.M., Petersen, C.P., Roux, D.J., Driver, A., Hill, L.,
Van Deventer, H., Funke, N., Swartz, E.R., Smith-Adao, L.B., Mbona, N.,
Downsborough, L. and Nienaber, S. (2011). Technical Report for the National
Freshwater Ecosystem Priority Areas project. WRC Report No. K5/1801.
http://bgis.sanbi.org/
SANBI, 2009. Further Development of a Proposed National Wetland Classification
System for South Africa. Primary Project Report. Prepared by the Freshwater

23
Report JW013/13/D764
Consulting Group (FCG) for the South African National Biodiversity Institute
(SANBI).
Soil Classification Workgroup, 1991. Soil Classification; a taxonomic system for South
Africa, Memoirs on the Natural Resources of South Africa, no. 15, Department
of Agricultural Development, Pretoria.
South Africa, Republic, 1998. National Water Act, Act No. 36 of 1998. Government
Gazette 19182, Government Printer, Pretoria.
South Africa, Republic, 1998. National Environmental Management Act, Act No. 107 of
1998. Government Gazette 19519, Government Printer, Pretoria.
South Africa, Republic, 1998. National Environmental Management Act: Waste Act, Act
No. 107 of 1998. Government Gazette 32000, Government Printer, Pretoria.
Project Manager Reviewer
for Jones & Wagener 30 July 2013 Document source: M:\D764 - Pongola Specialist Studies (ENV)\Report\D764_00_Rep_kk_RevB_SpesWetland_30Jul2013.docx Document template: Scoping Report Template10.dotx