subsistence harvests of pacific halibut in alaska, draft 388-draft-web.pdf · the division of...
TRANSCRIPT

Technical Paper No. 388
Subsistence Harvests of Pacific Halibut in Alaska, 2012 Publc Review Draft—Nov. 27, 2013
by
James A. Fall
and
David S. Koster
January 2014
Alaska Department of Fish and Game Division of Subsistence
Please send comments by 5:00 p.m., Friday, Dec. 20, 2013. Send comments to: ADF&G Division of Subsistence 333 Raspberry Road Anchorage, AK 66518 Fax (907) 267-2450 Email [email protected] For general questions, please call (907) 267-2353
DRAFT
Symbols and Abbreviations The following symbols and abbreviations, and others approved for the Système International d'Unités (SI), are used without definition in the reports by the Division of Subsistence. All others, including deviations from definitions listed below, are noted in the text at first mention, as well as in the titles or footnotes of tables, and in figure or figure captions. Weights and measures (metric) centimeter cm deciliter dL gram g hectare ha kilogram kg kilometer km liter L meter m milliliter mL millimeter mm Weights and measures (English) cubic feet per second ft3/s foot ft gallon gal inch in mile mi nautical mile nmi ounce oz pound lb quart qt yard yd Time and temperature day d degrees Celsius °C degrees Fahrenheit °F degrees kelvin K hour h minute min second s Physics and chemistry all atomic symbols alternating current AC ampere A calorie cal direct current DC hertz Hz horsepower hp hydrogen ion activity (negative log of) pH parts per million ppm parts per thousand ppt, ‰ volts V watts W
General all commonly-accepted abbreviations;
e.g., Mr., Mrs., AM, PM, etc. all commonly-accepted professional
titles; e.g., Dr., Ph.D., R.N., etc. Alaska Administrative Code AAC Alaska Department of Fish and Game ADF&G at @ compass directions: east E north N south S west W copyright corporate suffixes: Company Co. Corporation Corp. Incorporated Inc. Limited Ltd. District of Columbia D.C. et alii (and others) et al. et cetera (and so forth) etc. exempli gratia (for example) e.g. Federal Information Code FIC id est (that is) i.e. latitude or longitude lat. or long. monetary symbols (U.S.) $, ¢ months (tables and figures): first three
letters (Jan,...,Dec) registered trademark trademark United States (adjective) U.S. United States of America (noun) USA U.S.C. United States Code U.S. state use two-letter abbreviations (e.g., AK, WA)
Measures (fisheries) fork length FL mideye-to-fork MEF mideye-to-tail-fork METF standard length SL total length TL Mathematics, statistics all standard mathematical signs, symbols
and abbreviations alternate hypothesis HA approximately ~ base of natural logarithm e catch per unit effort CPUE coefficient of variation CV common test statistics (F, t, χ2, etc.) confidence interval CI correlation coefficient (multiple) R correlation coefficient (simple) r covariance cov degree (angular) ° degrees of freedom df expected value E greater than > greater than or equal to ≥ harvest per unit effort HPUE less than < less than or equal to ≤ logarithm (natural) ln logarithm (base 10) log logarithm (specify base) log2, etc. mean x minute (angular) ' not significant NS null hypothesis HO percent % plus or minus ± population size N probability P sample size n second (angular) " standard deviation σ or s standard error (of the mean) s x type I error probability Pa type II error probability Pb variance σ2 or s2
DRAFT

TECHNICAL PAPER NO. 388
SUBSISTENCE HARVESTS OF PACIFIC HALIBUT IN ALASKA, 2012
by
James A. Fall, Alaska Department of Fish and Game, Division of Subsistence, Anchorage
and
David S. Koster
Alaska Department of Fish and Game, Division of Subsistence, Anchorage
Alaska Department of Fish and Game Division of Subsistence
333 Raspberry Road, Anchorage, Alaska, 99518, USA
January 2014
Development and publication of this manuscript were partially financed by the U.S. Department of Commerce, National Oceanic and Atmospheric Administration, National Marine Fisheries Service, under award number NA11NMF4370059.
DRAFT
The Division of Subsistence Technical Paper series was established in 1979 and represents the most complete collection of information about customary and traditional uses of fish and wildlife resources in Alaska. The papers cover all regions of the state. Some papers were written in response to specific fish and game management issues. Others provide detailed, basic information on the subsistence uses of particular communities which pertain to a large number of scientific and policy questions.
Technical Paper series reports are available through the Alaska Resources Library and Information Services (ARLIS), the Alaska State Library and on the Internet: http://www.adfg.alaska.gov/sf/publications/. This publication has undergone editorial and professional review.
The Alaska Department of Fish and Game (ADF&G) administers all programs and activities free from discrimination based on race, color, national origin, age, sex, religion, marital status, pregnancy, parenthood, or
disability. The department administers all programs and activities in compliance with Title VI of the Civil Rights Act of 1964, Section 504 of the Rehabilitation Act of 1973, Title II of the Americans with Disabilities Act (ADA) of
1990, the Age Discrimination Act of 1975, and Title IX of the Education Amendments of 1972.
If you believe you have been discriminated against in any program, activity, or facility please write: ADF&G ADA Coordinator, P.O. Box 115526, Juneau AK 99811-5526
U.S. Fish and Wildlife Service, 4040 N. Fairfax Drive, Suite 300 Webb, Arlington VA 22203 Office of Equal Opportunity, U.S. Department of the Interior, Washington DC 20240
The department’s ADA Coordinator can be reached via phone at the following numbers: (VOICE) 907-465-6077, (Statewide Telecommunication Device for the Deaf) 1-800-478-3648, (Juneau TDD)
907-465-3646, or (FAX) 907-465-6078
For information on alternative formats and questions on this publication, please contact: ADF&G, Division of Subsistence, Website: http://www.adfg.alaska.gov/index.cfm?adfg=contacts.anchorage
James A. Fall and David S. Koster, Alaska Department of Fish and Game, Division of Subsistence,
333 Raspberry Road, Anchorage, Alaska, 99518, USA
This document should be cited as: Fall, J.A. and D. S. Koster. 2014. Subsistence harvests of Pacific halibut in Alaska, 2012. Alaska Department of
Fish and Game Division of Subsistence, Technical Paper No. 388, Anchorage.
DRAFT

TABLE OF CONTENTS Page
TABLE OF CONTENTS ............................................................................................................................................... i
LIST OF TABLES......................................................................................................................................................... ii
LIST OF FIGURES ......................................................................................................................................................iii
LIST OF APPENDICES .............................................................................................................................................. iv
ACKNOWLEDGEMENTS ........................................................................................................................................... v
ABSTRACT ................................................................................................................................................................. vi
EXECUTIVE SUMMARY ......................................................................................................................................... vii
CHAPTER 1: BACKGROUND AND METHODS ...................................................................................................... 1
Background .................................................................................................................................................................... 1 Project Objectives .......................................................................................................................................................... 2 Data Collection Methods ............................................................................................................................................... 2
Public Outreach......................................................................................................................................................... 2
Postal Household Survey .......................................................................................................................................... 2
Community Visits and In-Person Surveys ................................................................................................................ 4
Sample Achievement ..................................................................................................................................................... 4 Data Analysis ................................................................................................................................................................. 5
Data Entry ................................................................................................................................................................. 5
Analysis: Development of Harvest Estimates ........................................................................................................... 5
Products .................................................................................................................................................................... 7
CHAPTER 2: FINDINGS ............................................................................................................................................. 9
Subsistence Halibut Harvests In 2012 ........................................................................................................................... 9 Estimated Number of Subsistence Halibut Fishers ................................................................................................... 9
Estimated Alaska Subsistence Halibut Harvests in 2012 by SHARC Type and IPHC Regulatory Area ............... 10
Estimated Alaska Subsistence Halibut Harvests in 2012 by Harvest Location ...................................................... 11
Subsistence Halibut Harvests by Place of Residence.............................................................................................. 14
Subsistence Harvests by Gear Type ........................................................................................................................ 14
Number of Hooks Fished with Setline Gear ........................................................................................................... 15 Number of Subsistence Halibut Fishing Trips ........................................................................................................ 15
Sport Harvests of Halibut by SHARC Holders ....................................................................................................... 15
Estimated Average Net Weights of Subsistence- and Sport-Caught Halibut .......................................................... 16
Rockfish Harvests ........................................................................................................................................................ 16 Lingcod Harvests ......................................................................................................................................................... 17
CHAPTER 3: DISCUSSION ...................................................................................................................................... 19
i
DRAFT
Comparisons With Other Harvest Estimates ............................................................................................................... 19 Community Case Studies ............................................................................................................................................. 20
Sitka (Regulatory Area 2C) .................................................................................................................................... 20
Petersburg (Regulatory Area 2C) ............................................................................................................................ 21
Cordova (Regulatory Area 3A) ............................................................................................................................... 22 Port Graham (Regulatory Area 3A) ........................................................................................................................ 23
Kodiak City and Road System (Regulatory Area 3A) ............................................................................................ 24
Sand Point (Regulatory Area 3B) ........................................................................................................................... 25
Unalaska–Dutch Harbor (Regulatory Area 4A) ...................................................................................................... 26
Toksook Bay (Regulatory Area 4E) ........................................................................................................................ 27
Tununak (Regulatory Area 4E) ............................................................................................................................... 28
Comparisons With Nonsubsistence Removals In 2012 ............................................................................................... 29
CHAPTER 4: CONCLUSIONS AND RECOMMENDATIONS ............................................................................... 31
Summary And Conclusions ......................................................................................................................................... 31 SHARC Expiration and Renewal Patterns, 2003–2012 ............................................................................................... 33 Patterns of change in halibut removals, 2003-2012 ..................................................................................................... 34 Recommendations ....................................................................................................................................................... 35
REFERENCES CITED ............................................................................................................................................... 37
APPENDICES ........................................................................................................................................................... 114
Appendix A.–List of eligible tribes and rural communities, 2003 (from Federal Register). ..................................... 115 Appendix B.–Letter sent to tribes about the project. ................................................................................................. 118 Appendix C.–Survey instrument. .............................................................................................................................. 120 Appendix D.–Set of frequently asked questions and responses. ................................................................................ 124 Appendix E.–Appendix Tables. ................................................................................................................................. 126 Appendix F.–Comparison of mean harvests per respondent and participation rates by response category, 2005–2012. ................................................................................................................................................................ 167 Appendix G.–Project findings summary. .................................................................................................................. 171
LIST OF TABLES
Table Page Table 1.–Population of rural communities eligible to participate in the Alaska subsistence halibut fishery, 2000,
2010, and 2012. ............................................................................................................................................. 40 Table 2.–Project chronology, 2012 study year. ........................................................................................................... 43 Table 3.–Sample achievement, 2012. .......................................................................................................................... 44 Table 4.–Estimated subsistence harvests of halibut, 2012, by SHARC type and regulatory area. .............................. 53 Table 5.–Age of Subsistence Halibut Registration Certificate holders by SHARC type, 2012. .................................. 60 Table 6.–Estimated harvests of halibut in numbers of fish and pounds net (dressed, head-off) weight by
regulatory area and subarea, 2012. ................................................................................................................ 61 Table 7.–Alaska subsistence halibut harvests from 2003–2012 by geographic area fished. ....................................... 62 Table 8.–Number of hooks usually fished, setline (stationary) gear, Alaska halibut subsistence fishery, 2012. ......... 63 Table 9.–Average net weight of subsistence and sport harvested halibut by regulatory area fished, 2012. ................ 64 Table 10.–Estimated harvests of lingcod and rockfish by regulatory area and subarea, 2012. .................................... 64 Table 11.–Estimated harvests of halibut by gear type and participation subsistence and sport fisheries, selected
Alaska communities, 2003–2012. ................................................................................................................. 65
ii
DRAFT
Table 12.–Estimated harvests of halibut for home use, Sitka, 1987 and 1996. ........................................................... 69 Table 13.–Number of SHARCs issued, estimated number of subsistence halibut fishers, and estimated harvests
by SHARC category, Sitka, 2003–2012. ....................................................................................................... 69 Table 14.–Estimated harvests of halibut for home use, Petersburg, 1987 and 2000. ................................................... 69 Table 15.–Estimated harvests of halibut for home use, Cordova, 1985, 1988, 1991–1993, and 1997. ....................... 70 Table 16.–Estimated harvests of halibut for home use, Port Graham, 1987, 1989, 1990–1993, and 1997. ................ 70 Table 17.–Estimated harvests of halibut for home use, Kodiak road system, 1982, and 1991–1993.a ........................ 70 Table 18.–Halibut removals in Alaska by regulatory area, 2012. ................................................................................ 71 Table 19.–Comparison of selected SHARC survey results, 2003–2012. ..................................................................... 72 Table 20.–Percentage of SHARCs that expired or were valid in 2012, by SHARC type. ........................................... 73 Table 21.–Removals of Pacific halibut in Alaska, 1993–2012. ................................................................................... 73 Table 22.–Population estimates of Pacific halibut, 1996–2013. .................................................................................. 74 Table 23.– Changes in estimated harvests, valid SHARCs, estimated number of fishers, and average harvest per
fisher in the Alaska subsistence halibut fishery, in regulatory areas 2C and 4 and all Alaska, 2003–2012. .............................................................................................................................................................. 75
LIST OF FIGURES Figure Page Figure 1.–Regulatory areas for the Pacific halibut fishery. ......................................................................................... 76 Figure 2.–Number of surveys returned and return rates for subsistence halibut surveys, by SHARC type, 2012. ...... 77 Figure 3.–SHARC survey return rates, communities with more than 100 SHARCs issued and tribes with more
than 70 SHARCs issued, 2012. ..................................................................................................................... 78 Figure 4.–Return rate by place of residence, 2012. ..................................................................................................... 79 Figure 5.–Number of survey responses by response category, 2012. .......................................................................... 80 Figure 6.–Number of SHARCs issued and estimated number of subsistence halibut fishers by SHARC type,
2003–2012. .................................................................................................................................................... 81 Figure 7.–Age of subsistence halibut registration certificate holders by SHARC type, 2012. .................................... 82 Figure 8.–Estimated number of subsistence halibut fishers by place of residence, 2003–2012, communities with
50 or more fishers in 2012. ............................................................................................................................ 83 Figure 9.–Estimated number of Alaska subsistence halibut fishers, 2003–2012 by regulatory area fished. ............... 84 Figure 10.–Estimated subsistence halibut harvests, pounds net weight, by regulatory area of tribe and rural
community, 2003–2012. ................................................................................................................................ 85 Figure 11.–Estimated Alaska subsistence halibut harvests in pounds net weight by SHARC type, 2003–2012. ........ 86 Figure 12.–Percentage of tribal subsistence halibut harvest by tribe, 2012. ................................................................ 87 Figure 13.–Percentage of rural community subsistence halibut harvest by community, 2012. ................................... 88 Figure 14.–Percentage of subsistence halibut harvest by regulatory area fished, 2012. .............................................. 89 Figure 15.–Alaska subsistence halibut harvests by geographic area, 2012. ................................................................ 90 Figure 16.–Percentage of Alaska subsistence halibut harvest by geographic area, 2012. ........................................... 91 Figure 17.–Estimated subsistence halibut harvests, pounds net weight, by regulatory area fished, 2003–2012. ........ 92 Figure 18.–Change in Alaska subsistence halibut harvests from 2011 through 2012 by regulatory area fished. ........ 93 Figure 19.–Change in Alaska subsistence halibut harvests in 2012 compared to recent 9-year average (2003–
2011) by regulatory area fished. .................................................................................................................... 94 Figure 20.–Average subsistence harvest of halibut per fisher in Alaska by regulatory area, in pounds net weight,
2012. .............................................................................................................................................................. 95 Figure 21.–Average subsistence harvest of halibut per fisher in Alaska by regulatory area, in number of fish,
2012. .............................................................................................................................................................. 96 Figure 22.–Alaska subsistence halibut harvests by place of residence, 2012. ............................................................. 97 Figure 23.–Percentage of subsistence halibut harvest by gear type by regulatory area, 2012. .................................... 98 Figure 24.–Number of hooks usually fished, percentage of fishers using setline (stationary) gear, Alaska
subsistence halibut fishery, 2012. .................................................................................................................. 99 Figure 25.–Average number of subsistence fishing trips for halibut by regulatory area and SHARC type, 2012..... 100 Figure 26.–Number of subsistence fishing trips for halibut, by percentage of total reported trips, 2012. ................. 101
iii
DRAFT

Figure 27.–Average number of halibut harvested per subsistence fishing trip by regulatory area and SHARC type, 2012. ................................................................................................................................................... 102
Figure 28.–Estimated incidental harvests of rockfish in the Alaska subsistence halibut fishery, number of fish, by regulatory area fished, 2003–2012. ........................................................................................................ 103
Figure 29.–Percentage of incidental harvest of rockfish by regulatory area fished, 2012. ........................................ 104 Figure 30.–Estimated incidental harvests of lingcod in the Alaska subsistence halibut fishery, number of fish, by
regulatory area fished, 2003–2012. ............................................................................................................. 105 Figure 31.–Percentage of incidental harvest of lingcod by regulatory area fished, 2012. ......................................... 106 Figure 32.–Estimated harvests of halibut for home use, Port Graham. ..................................................................... 107 Figure 33.–Halibut removals, Alaska, 2012. ............................................................................................................. 108 Figure 34.–Halibut removals in Alaska by regulatory area and removal category, 2012. ......................................... 109 Figure 35.–Percentage of SHARC holders, and SHARC holders who fished for halibut, who did not renew their
SHARC, by SHARC type, 2003–2012. ....................................................................................................... 110 Figure 36.–Percentage of SHARCs that were not renewed by survey response type and SHARC type, 2003–
2012. ............................................................................................................................................................ 111 Figure 37.–Halibut removals in Alaska, 1993–2012. ................................................................................................ 112 Figure 38.–Comparison of SHARC renewal patterns, Regulatory Area 2C, Area 4, and total Alaska. .................... 113
LIST OF APPENDICES Appendix Page
Appendix A.–List of eligible tribes and rural communities, 2003 (from Federal Register). ..................................... 115 Appendix B.–Letter sent to tribes about the project. ................................................................................................. 118 Appendix C.–Survey instrument. .............................................................................................................................. 120 Appendix D.–Set of frequently asked questions and responses. ................................................................................ 124 Appendix E.–Appendix Tables. ................................................................................................................................. 126 Appendix F.–Comparison of mean harvests per respondent and participation rates by response category, 2005–
2012. ............................................................................................................................................................ 167 Appendix G.–Project findings summary. .................................................................................................................. 171
iv
DRAFT

ACKNOWLEDGEMENTS First and foremost, we thank the thousands of individuals who took the time to voluntarily respond to the mailed survey form or to be interviewed. This report would not be possible without their cooperation.
Thank you to Sally Bibb of the National Marine Fisheries Service (NMFS), who facilitated the grant that funded this project and also provided other project support. We also thank the staffs of the NMFS Restricted Access Management (RAM) Program and the Information Services Division, who initially implemented and currently administer the Subsistence Halibut Registration Certificate (SHARC) program and helped provide information to the public about the research.
We also thank the many tribal governments that granted approvals for the survey projects, and the local research assistants who helped with these projects. We especially thank the Sitka Tribe of Alaska (Jeff Feldpausch, Dan Williams, Jessica Gill, Catherine Wilson, and Heather Riggs), the Hydaburg Cooperative Association (Anthony Christianson, Christine Tolson, Joey Adams, Mona Peratrovich, and Jodi Sanderson), and Metlakatla Indian Community (Jeff Moran and Priscilla Berkeley) for assisting with survey administration in their communities. Matt Kookesh (Southeast Rural Consulting) organized the survey administration in Angoon and Ketchikan; Christel Silva in Angoon and Rose Johnson in Ketchikan helped complete the surveys.
In addition to the coauthor of this report, other Alaska Department of Fish and Game (ADF&G) Division of Subsistence staff who assisted with research, data management, and report preparation included Garrett Zimpelman, Margaret Cunningham, Theresa Quiner, Barbara Dodson, John Dwyer, Zayleen Kalalo, Maegan Smith, Lauren Sill, Meredith Marchioni, Rosalie Grant, Adam Knight, and Mary Lamb. Ana Lewis, Alejandra Rico, Michaela Silva, and Jennifer Bond provided project administrative support.
Heather Gilroy and Gregg Williams (staff to the International Pacific Halibut Commission) provided background information for this report. Several of the above-mentioned ADF&G staff also offered comments and suggestions on the preliminary draft.
v
DRAFT
ABSTRACT This report describes the results of the tenth annual project to estimate the subsistence harvest of Pacific halibut Hippoglossus stenolepis in Alaska since the National Marine Fisheries Service adopted rules governing subsistence halibut fishing in 2003. Data were collected through a voluntary survey mailed to all holders of Subsistence Halibut Registration Certificates (SHARCs). The survey response rate was 71% (7,054 surveyed of 9,944 SHARC holders). An estimated 4,394 individuals participated in the subsistence fishery for halibut in 2012, the lowest total over the 10 study years; the previous low was 4,705 fishers in 2011 and the highest estimate was 5,984 fishers in 2004. The estimated harvest in 2012 was 37,093 halibut, comprising 686,991 lb (net weight; ±2.9%), the lowest totals for the 10 years of the project. This compares to a high of 55,875 fish and 1,178,222 lb (± 3.0%) in 2005 and a previous low of 38,162 fish and 697,656 lb (±2.7%) in 2011. Of the total subsistence halibut harvested in 2012, 78% were harvested with setline gear and 22% with hand-operated gear. As in 2003–2011, the largest portion of the Alaska subsistence halibut harvest in 2012 occurred in Regulatory Area 2C (Southeast Alaska), 58%, followed by Area 3A (Southcentral Alaska), 37%. Subsistence harvests represented about 1.7% of the total halibut removals in Alaska in 2012. The harvest estimates based on the surveys for 2003–2012 serve as a basis for understanding the overall harvest, annual variability in catch, and trends in harvests since implementation of the 2003 regulations. Due to budget constraints, a survey to estimate subsistence halibut harvests in Alaska in 2013 will not take place. The report recommends that monitoring of the subsistence harvest of halibut in Alaska be resumed in the future.
Key words: Pacific halibut, Hippoglossus stenolepis, subsistence harvests, Alaska, rockfish, Sebastes, lingcod, Ophiodon elongatus.
vi
DRAFT

EXECUTIVE SUMMARY This report presents findings of a project designed to estimate the subsistence harvest of Pacific halibut Hippoglossus stenolepis in Alaska in 2012. The Alaska Department of Fish and Game (ADF&G) Division of Subsistence conducted the project under National Oceanic and Atmospheric Administration (NOAA) award number NA11NMF4370059 from the U.S. Department of Commerce, NOAA National Marine Fisheries Service (NMFS). In May 2003, NMFS published federal regulations implementing a subsistence halibut fishery in Alaska for qualified individuals who are residents of 118 rural communities or members of 123 Alaska Native tribes with traditional uses of halibut. The year 2012 was the tenth in which subsistence halibut fishing took place under these regulations. Subsistence fishers are required to obtain a Subsistence Halibut Registration Certificate (SHARC) from NMFS before fishing. During 2012, 9,944 individuals held SHARCs, compared to a high of 15,047 at the end of 2007 and a previous low of 10,953 at the end of 2010. The number of valid SHARCs in 2012 was 22% below the previous 9-year average.
Harvest information was collected by means of a postal (mailed) survey. The 1-page survey form was mailed to all SHARC holders in early 2013, with 2 follow-up mailings. Household visits supplemented the mailings in 5 communities in Southeast Alaska. In total, 7,054 surveys were returned, a response rate of 71%, the highest of any study year. Participation in the survey was voluntary.
According to the project findings, an estimated 4,394 individuals participated in the subsistence halibut fishery in 2012. This was the lowest number of participants since the SHARC program began. The previous low was 4,705 subsistence halibut fishers in 2011, and the highest estimate was 5,984 in 2004.
The estimated harvest in 2012 was 37,093 halibut (±2.9%) comprising 686,991 lb (net weight; ±2.9%), the lowest totals for the 10 years of the project. (“Net weight” is 75% of “round” or live weight; the estimated harvest was 915,988 lb round weight.) This compares to an estimated high of 55,875 fish (±3.0%) comprising 1,178,222 lb (±3.0%) in 2005 and a previous low of 38,162 halibut (±2.8%) comprising 697,656 lb (±2.7%) in 2011. As measured in pounds, the 2012 harvest was about 2% lower than the estimated harvest in 2011, and 30% lower than the previous 9-year average from 2003–2011.
Of the total subsistence halibut harvested in 2012, 532,623 lb (78%) were harvested with setline (stationary) gear (i.e., longlines, or “skates”) and 154,368 lb (22%) were harvested with hand-operated gear (i.e., rod and reel or handline). This was similar to the harvest by gear type in 2003–2011. Of those subsistence fishers using setline gear in 2012, the most (41%) usually fished with 30 hooks, the maximum number allowed by regulation in all areas except areas 4C, 4D, and 4E, where regulations establish no hook limit.
Subsistence fishers also harvested an estimated 9,568 rockfish Sebastes spp. and 2,247 lingcod Ophiodon elongatus in 2012 while fishing for halibut. These were the lowest estimates for any year of the study. The highest estimated harvests were 19,001 rockfish and 4,407 lingcod in 2004 and previous low harvests were 10,853 rockfish and 2,305lingcod in 2011.
Based upon fishing locations, the largest portion of the Alaska subsistence halibut harvest in 2012 occurred in Regulatory Area 2C (Southeast Alaska), with areas ranking as follows:
• Area 2C (Southeast Alaska), 58% (396,043 lb);
• Area 3A (Southcentral Alaska), 37% (253,516 lb);
• Area 3B (Alaska Peninsula), 2% (15,959 lb);
• Area 4A (Eastern Aleutian Islands), 1% (9,543 lb);
• Area 4E (East Bering Sea Coast), 1% (8,384 lb);
• Area 4B (Western Aleutian Islands), less than 1% (1,698 lb);
vii
DRAFT

• Area 4C (Pribilof Islands), less than 1% (1,176 lb); and
• Area 4D (Central Bering Sea), less than 1% (672 lb).
In 2003–2011 as well, Area 2C and Area 3A accounted for over 85% of the subsistence halibut harvests. The proportion of the statewide subsistence halibut harvest occurring in Area 2C has ranged from an estimated high of 60% in 2003 to an estimated low of 51% in 2005 and 2007. Correspondingly, the portion occurring in Area 3A has ranged from an estimated high of 39% in 2010 to an estimated low of 27% in 2003.
Preliminary data from the International Pacific Halibut Commission (IPHC) combined with the findings of this project indicate that 42.491 million pounds (net weight) of halibut were removed from Alaska waters in 2012. Of this total, the subsistence harvest accounted for 1.7%. Commercial harvests took 59.9% of the halibut, followed by bycatch in other commercial fisheries (22.5%), sport harvests (12.6%), and wastage in the commercial fishery (3.3%).
This report describes the results of the tenth annual project to estimate the subsistence halibut harvest in Alaska since NMFS adopted rules governing subsistence halibut fishing in May 2003. The harvest estimates based on the SHARC surveys for the 2003–2012 fishing seasons serve as a basis for understanding the overall harvest, annual variability in catch, and trends in harvest since implementation of the new regulations. Demonstrating changes in the magnitude of the Alaska subsistence halibut harvest resulting from the new regulations using the results of the SHARC surveys for 2003–2012 is problematic, however, because of the limitations of earlier harvest estimates at the statewide level. The subsistence harvest estimates for 2003–2012 for some of the larger communities—such as Sitka, Petersburg, and Kodiak, which account for the majority of the harvest—are not markedly different from the range of harvest estimates based on household surveys prior to the new regulations. The higher overall harvest estimates for 2004–2006 compared to 2003 may be due to more thorough registration of subsistence fishers, hence better harvest documentation. The lower total Alaska harvest in net pounds in 2008–2012 compared to the previous 5 years appears to be the result of fewer registered SHARC holders, fewer estimated participants in the fishery, lower average harvests per fisher, and a decline in the average size of the harvested halibut over the 10 years of the study (i.e., from 23.7 lb per fish in 2003 to 18.5 lb per fish in 2012). In Area 4, substantial drops in SHARC registrations and survey responses may be resulting in an underestimate of subsistence halibut harvests in that area.
The report concludes that 686,991 net pounds is a sound estimate of the Alaska subsistence halibut harvest in 2012. The estimate is based upon a scientific sampling of SHARC holders and a relatively high response rate. The total estimated harvest falls below the 1.5 million net pounds estimated for the subsistence harvest when the current regulations were developed by the North Pacific Fishery Management Council (see http://www.fakr.noaa.gov/frules/70fr16742.pdf, page 16,748). The 2012 harvest estimate was 30% below the average for the previous 9 project years and continued a trend of lower statewide harvests that began in 2005. The causes of this decline in estimated harvests are complex, and there is no certainty that the trend will persist.
Due to budget constraints, a survey to estimate subsistence halibut harvests in Alaska will not occur for harvest year 2013. The report recommends that monitoring of the subsistence halibut harvest in Alaska resume in the future, based on an analysis of the data collected for 2003–2012 and an ethnographic study of subsistence halibut fishing in selected communities, so that trends in the fishery in terms of participation, location of harvests, and harvest quantities can be better understood.
viii
DRAFT

CHAPTER 1: BACKGROUND AND METHODS BACKGROUND The primary goal of this project was to estimate the subsistence harvests of Pacific halibut Hippoglossus stenolepis in Alaska in 2012 through a survey mailed to registered subsistence halibut fishers; the survey was supplemented by interviews in selected communities. This was the tenth year for which this research was conducted. (See Fall et al. 2004 for the results for 2003, Fall, George, and Easley 2005 for the results for 2004, Fall, Koster, and Davis 2006 for the results for 2005, Fall, Koster, and Turek 2007 for the results for 2006, Fall and Koster 2008 for the results for 2007, Fall and Koster 2010 for the results for 2008, Fall and Koster 2011 for the results for 2009, Fall and Koster 2012 for the results for 2010, Fall and Koster 2013 for the results for 2011.) The Division of Subsistence administered the project through a grant from the National Oceanic and Atmospheric Administration (NOAA) (award number NA11NMF4370059). In June 2013, NOAA notified the division that due to budget constraints, funding was not available to continue the project for the 2013 harvest year.
In Alaska’s coastal areas, subsistence halibut fisheries are local, noncommercial, customary and traditional food fisheries, as noted by Wolfe (2002) and described in Environmental Assessment/Regulatory Impact Review/Initial Regulatory Flexibility Analysis for a Regulatory Amendment for Defining a Halibut Subsistence Fishery Category (an “EA/RIR/IRFA”) by the North Pacific Fishery Management Council (NPFMC), ADF&G, IPHC, and the National Marine Fisheries Service (NMFS), August 11, 2000 (National Marine Fisheries Service 2000; see also North Pacific Fishery Management Council 2003). The EA/RIR/IRFA summarizes information about the subsistence halibut fishery in Alaska. This background information is not repeated here but provided the basis for the NPFMC’s recommendation for subsistence halibut fishing regulations in Alaska. Figure 1 illustrates IPHC halibut regulatory areas in Alaska.
In April 2003, the NMFS, Alaska Region, published federal regulations implementing a subsistence halibut fishery for qualified individuals in the waters in and off Alaska (68 FR 18145, April 15, 2003; see http://www.fakr.noaa.gov/frules/fr18145.pdf). Current regulations state that persons eligible to subsistence halibut fish include: 1) residents of rural communities with customary and traditional uses of halibut (rural); and 2) members of federally recognized Alaska Native tribes with customary and traditional uses of halibut (tribal). In total, residents of 118 rural communities and members of 123 Alaska Native tribes are eligible to participate in the fishery.1 (See Appendix A for a list of eligible tribes and communities as they appeared in the Federal Register in 2003.) On November 4, 2009, the U.S. Department of Commerce published a final rule (74 FR 57105, November 4, 2009), effective December 4, 2009, modifying eligibility requirements for participation in the Alaska subsistence halibut fishery. The action allowed rural residents who live outside the boundaries of the specified 118 communities to participate if they live within the boundaries of rural areas defined in §300.65(g)(3).
Subsistence halibut fishers are required to obtain a SHARC from the Restricted Access Management (RAM) Program office of NMFS prior to fishing.2 Federal regulations (50 CFR Part 300.65(h)(4)) also authorize periodic surveys of SHARC holders in order to estimate annual subsistence harvests and related
1 In December 2004, the NPFMC adopted a recommendation to the Secretary of Commerce to add Naukati Bay to the original list of 117 eligible rural communities. Regulations implementing this change went into effect in 2008, resulting in 118 rural communities eligible for a portion of 2008 and all of 2009. Also, note that the Northern Pacific Halibut Act of 1982, under which the Alaska subsistence halibut fishery regulations are authorized, provides for fair and equitable allocations of halibut among U.S. fishers, but does not establish priorities for those allocations (see http://www.fakr.noaa.gov/frules/70fr16742.pdf, page 16,747).
2 The subsistence rules were amended in 2005 by regulations published in the Federal Register at 70 FR 16742, April 1, 2005. Among other things, this amendment provides for obtaining Community Harvest Permits, Ceremonial Permits, and Educational Permits.
1
DRAFT
catch and effort information. The regulation states that, “Responding to a subsistence halibut harvest survey will be voluntary.”
Table 1 provides population estimates for the eligible rural communities for 2000 and 2010 based on the federal decennial censuses. The total population of these communities in 2000 was 82,707, of which 38,990 were Alaska Natives (47%). For 2010, the federal census reported a total population of 84,353 for eligible rural communities and areas, including 39,164 Alaska Natives (46%) (U.S. Census Bureau 2011). In addition, the nonrural communities of Juneau and Ketchikan (excluding Saxman, whose residents are eligible) in 2010 had Alaska Native populations of 6,005 and 2,625, respectively (Alaska Department of Labor and Workforce Development 2011), most of whom were eligible to participate in the federal subsistence halibut fishery through their tribal membership. Also, an unknown number of eligible tribal members lived in other nonrural communities, such as Anchorage and places within the Kenai Peninsula Borough. Table 1 shows that Alaska Department of Labor and Workforce Development estimates for eligible communities and areas for 2012 total 87,171. Estimates of the Alaska Native population of these areas for 2012 are not available.
PROJECT OBJECTIVES The primary goal of the project was to estimate the subsistence harvest of halibut in Alaska in the calendar year 2012. Funding for 2012 totaled $129,000, the same as study year 2011. In addition to 3 rounds of survey mailings, outreach and supplemental interviewing occurred in 5 communities in Area 2C. The project objectives for 2012, listed below, were identical to the first 9 years of the project:
1. Produce an estimate of the subsistence harvest of halibut in Alaska in 2012 by community, tribe, gear type, and IPHC regulatory area, along with an estimate of the number of individuals who subsistence fished for halibut in 2012.
2. Produce an estimate of the harvest of halibut by SHARC holders while sport fishing in 2012.
3. Produce an estimate of the number of lingcod and rockfish taken by subsistence fishers while subsistence fishing for halibut in 2012.
DATA COLLECTION METHODS Public Outreach In January 2013, the Division of Subsistence sent a short summary of the findings for 2011 to all eligible tribes and a letter informing them that the research would continue for the 2012 harvest year (Appendix B). Information about the project was available on the NMFS website for subsistence halibut fishing in Alaska (see http://www.fakr.noaa.gov/ram/subsistence/halibut.htm).
For additional outreach, division staff traveled to 5 Southeast Alaska (Area 2C) communities: Angoon, Hydaburg, Ketchikan, Metlakatla, and Sitka. Meetings took place with tribal officials about the importance of the survey as well as the SHARC program. In addition, staff produced a 2-page overview about the project and the SHARC program that was distributed during the household surveys.
Postal Household Survey As noted, this was the tenth year of a harvest assessment program for the subsistence halibut fishery in Alaska. Because the subsistence halibut regulations came into effect in 2003, the first years of collecting harvest data were exploratory. Subsequent project years have built upon the lessons learned in the first years of the project and have benefited from outreach efforts to improve response rates.
As recommended by Wolfe (2002) survey methodology was based upon a registration system for subsistence halibut fishers, which requires fishers to obtain a SHARC before fishing under federal subsistence halibut regulations. In total, 9,943 individual SHARCs and 1 community permit were issued for 2012 (see section “Sample Achievement” below), for a total of 9,944 individuals or groups authorized
2
DRAFT

to participate in the subsistence halibut fishery. All 9,943 individuals who held a SHARC for any portion of 2012, as of December 31, 2012, were mailed a retrospective recall survey covering a 12-month harvest period: calendar year 2012. Data from the community permit were returned directly to the RAM Program, and are included in these study findings.
With one exception, the 2012 survey instrument was virtually identical to the form used for the 2003–2008 project years. It is based on recommendations by Wolfe (2002:Appendix A), with slight modifications, such as project year and return address. (See Appendix C in this report for a copy of the 2012 survey instrument.) Wolfe (2002:15–18) provided justification for the kinds of data to be collected, which include name and address of the fisher; halibut harvests in numbers and pounds round (whole); weight by gear type in 2012; number of hooks usually set; and harvests of lingcod and rockfish taken while subsistence fishing for halibut. In 2003, a question addressing the water body fished (primary location) while subsistence fishing was added at the recommendation of NMFS staff. This question was retained for 2004–2012. Another survey question was added in 2004 to record the location of sport halibut fishing by SHARC holders. The survey was designed to reduce the potential double counting of halibut taken with rod and reel gear, which could be reported in both the subsistence survey and in the ADF&G Division of Sport Fish Statewide Harvest Survey (Wolfe 2002:19). For 2009, a new question was added about the number of trips taken for subsistence halibut fishing in the study year. This question was retained for 2010–2012.
A short explanatory letter with instructions on the back for completing the survey was included in the mailings (Appendix C). The survey was designed so that it could be directly returned to the Division of Subsistence, postage paid.
Presently under IPHC regulations, Community Development Quota (CDQ) fishers may retain halibut under 32 inches (U32; formerly called “sublegal” or “shorts”) while commercial CDQ fishing in areas 4D and 4E only. These regulations require the CDQ organization to report this harvest to the IPHC. To avoid double counting, subsistence fishers were instructed not to include these fish on their subsistence halibut survey.
During an October 2003 meeting of the Alaska Native Subsistence Halibut Working Group (ANSHWG), held before the mailed survey for the first project year, community representatives expressed concern that not all fishers would know which fish were to be included under the category “rockfish” for the incidental harvest question on the survey. This would have led to an overestimation of this harvest if fishers reported fish such as Pacific cod Gadus macrocephalus or various species of sculpins in response to this question. The instructions mailed with the survey provided guidance on this question.3
Table 2 provides a chronology of key activities during the project. Table 3 provides a summary of response rates by mailing, SHARC type (rural or tribal), and place of residence. The first mailing to 9,943 SHARC holders occurred on January 7, 2013. The second mailing to 5,552 SHARC holders occurred on February 15, 2013, and a third mailing to 3,744 SHARC holders occurred on March 27, 2013.
The Division of Subsistence created a dedicated e-mail address that recipients of the postal survey could use if they had questions about how to respond. Also, the RAM Program set up a toll-free telephone number (1-800-304-4846) to provide information about the subsistence halibut program, including the harvest assessment program. Both the e-mail address and toll-free telephone number appeared on the survey. A set of “frequently asked questions” and responses was developed by ADF&G and NMFS staff
3 The principal investigators for this project are aware that more than 30 species of rockfish inhabit Alaska waters. (See Alaska Administrative Code 5 AAC 39.975 for definitions of management assemblages of rockfishes.) The goal of this project was to keep the questions about incidental harvests simple. As discussed in the recommendations section (see Chapter 4), if more precise harvest data for various rockfish are needed for particular areas, future research should be designed and funded to address these data needs.
3
DRAFT

members to guide staff responses to telephone calls and e-mail inquiries about how to fill out the survey form (Appendix D [FAQ]; Appendix C [survey]).
Community Visits and In-Person Surveys Because the response rates to the postal survey vary by community and tribe, the mailings were again supplemented in selected communities with household surveys conducted by local research assistants hired through subcontracts with Alaska Native tribes. Because of the large number of eligible communities and tribes, it was not possible to conduct surveys in most communities.
In the 2012 project year, the interviews were administered in Metlakatla, Sitka, Hydaburg, Angoon, and Ketchikan. Cooperative agreements with the Metlakatla Indian Community, the Sitka Tribe of Alaska, and the Hydaburg Cooperative Association supported interviewing in those communities. A contract with the firm Admiralty Island Adventures supported interviewing in Angoon and Ketchikan (including Saxman). In each community, the surveys were administered face-to-face or by telephone. In addition, while engaged in other projects, division staff conducted interviews with SHARC holders from the southeast Alaska communities of Haines and Hoonah who had not returned the surveys by mail.
SAMPLE ACHIEVEMENT Table 3 reports sample achievement by tribe, rural community, and community of residence. Overall, 7,054 surveys were returned by 9,944 SHARC holders (including the 1 special permit),4 a response rate of 71% (Figure 2). For residents of the 118 eligible rural communities and eligible rural areas who did not register as tribal members, 5,011 of 6,519 surveys were returned (77%) (tables 3 and 4). As shown in Figure 3, in 2012 there were 11 communities with more than 100 nontribal SHARC holders, accounting in total for 85% of all nontribal SHARCs issued in rural communities. Return rates were 72% or more in all 11 of these communities.
Of the 3,425 tribal members who held SHARCs in 2012, 2,043 (60%) returned surveys. As shown in Figure 3, there were 16 tribes with more than 70 members who obtained SHARCs. Return rates for these 16 tribes varied widely, from 97% in Angoon (where household surveys were conducted to supplement the return of surveys by mail) to 25% for Pauloff Harbor (for which no directed outreach occurred). In total, these 16 tribes accounted for 70% of all tribal SHARCs.
Figure 4 illustrates survey response rates by place of residence of SHARC holders for the 21 communities with 100 or more SHARC holders in 2012. These communities accounted for 84% of all SHARCs and 85% of all returned surveys. Response rates were 50% or higher in all but 3 of these communities, and equaled or exceeded 60% in all but 5.
Figure 5 shows the survey return rate by response category (see also Table 3). After the first mailing, 5,050 surveys were returned—a response rate of 51%. Responses to the second mailing added 1,130 surveys, and the third mailing produced 440 responses, for a total response to the postal survey of 6,620 surveys, or 67% of the 9,944 SHARC holders. In addition, surveys administered by representatives of tribal and other organizations working with ADF&G (plus information from the 1 special permit returned directly to RAM Program), added 434 surveys. Most of these were in Metlakatla, Hydaburg, Sitka, Angoon, and Ketchikan. This brought the total response to 7,054 surveys, 71% of all SHARC holders in 2012.
The overall response rate for the survey for 2012 increased compared to 2011, from 68% to 71%. The return rate in 2012 was the highest for any year of the survey.5 Several factors likely account for the high response rates in 2011 and 2012. These include restoration of the third survey mailing (only 2 mailings
4 In this report, we use 9,944 as the number of SHARCs or “SHARC holders,” a total that includes 9,943 individual SHARC holders and 1 community permit.
5 See Table 19 for sample sizes and fractions and selected project findings for the 10 project years.
4
DRAFT
occurred for 2009 and 2010), outreach efforts, and adding Metlakatla to the set of communities in which face-to-face surveys took place.
The number of surveys returned as “undeliverable” was 552 in 2012 (Table 3). Subtracting “undeliverables” from the postal survey target gives a response rate by mail of 70% in 2012, the highest for any survey year; the previous high was 68% in 2011.
DATA ANALYSIS Data Entry All returned surveys were reviewed for completeness prior to data entry. Responses were coded following standardized conventions used by the Division of Subsistence. Staff within the Information Management Section of the division set up database structures within Microsoft SQL Server6 at ADF&G in Anchorage to hold the survey data. The database structures included rules, constraints, and referential integrity to ensure that data were entered completely and accurately. Data entry screens were available on a secure Internet website. Daily incremental backups of the database occurred, and transaction logs were backed up hourly. Full backups of the database occurred twice weekly. This ensured that no more than 1 hour of data entry would be lost in the unlikely event of a catastrophic failure.
Survey responses were manually entered twice, and survey forms were electronically scanned. All data were compared programmatically for inconsistent data entry. Double data entry ensured a more accurate transfer of information from the coded survey forms into the database, and is a standard Division of Subsistence practice. Data did not pass to the processing phase until inconsistencies within the twice-entered data set were eliminated. The scanned survey forms also facilitated efficient data correction and editing.
Information was processed and analyzed using MS SQL programming. Initial processing included the performance of standardized logic checks of the data. Logic checks are often needed in complex data sets where rules, constraints, and referential integrity do not capture all of the possible inconsistencies that may appear.
Analysis: Development of Harvest Estimates Analysis included review of raw data frequencies, cross tabulations, table generation, and estimates of population parameters. Missing information was dealt with on a case-by-case basis. The Division of Subsistence has standard practices for dealing with missing information, such as minimal value substitution or use of an average response for similarly characterized households or communities. Typically, missing data are an uncommon, randomly occurring phenomenon in household surveys conducted by the division, as was the case in this project.
In general, estimates of harvests, levels of participation, and other findings were calculated based upon the application of weighted means (Cochran 1977). These calculations are standard methods for extrapolating sampled data. In this project, each tribe and rural community was a separate stratum for purposes of estimating total harvests. In most cases, the mean for returned SHARC surveys was applied to the total number of SHARCs issued for the tribe or community to calculate the estimated harvest. (See Appendix Table E-1 for the reported harvests for each tribe and community.) The formula for standard expansion of community harvests is
∑= it HH (1)
where iii WhH = (2)
6 Product names are included for scientific completeness and do not constitute an endorsement.
5
DRAFT
and i
ii n
NW = (Harvest weight factor per strata i)
(3)
Ht = the total harvest (numbers of fish or pounds),
Hi = the total harvest, numbers or pounds, for tribe or community i
Wi = the weight factor for tribe or community i,
hi = the total harvest, numbers or pounds, reported in returned surveys for tribe or community,
ni = the number of returned surveys in each tribe or community, and
Ni = the number of SHARCs issued for tribe or community.
The following instances are exceptions. First, 97 SHARCs were held by eligible tribal members living outside of Alaska. Of these, 49 postal surveys were returned from this group, and only 4 of these returned surveys indicated any subsistence fishing activity. Rather than assign the mean value for their tribe (which would likely result in an overestimate of the harvest), all nonreturned surveys for SHARC holders with out-of-state addresses were coded as “did not fish.”
Second, all SHARC holders were divided into 2 categories based upon the expiration date of their SHARC. SHARCs having an expiration date falling within the project period and that were not renewed were treated as separate strata from other SHARCs for the purpose of generating harvest estimates. This was done to account for potential bias and resulting overestimation of harvests for SHARCs that were fished for only part of the year. During 2012, 905 rural and 529 tribal SHARCs expired and were not renewed; of those, 514 (57%) rural SHARCs and 202 (38%) tribal SHARCs participated in the survey. Of those survey respondents with rural SHARCs that expired, 24% participated in the subsistence fishery, as did 25% of survey respondents with expired tribal SHARCs.
Third, as in 2009–2011, for tribal and rural SHARC holders from Nanwalek, comparisons of reported harvests with estimates from previous years, plus relatively low response rates, suggested that survey responses included all harvesters. Therefore, reported harvests were used as total harvest estimates for both the Nanwalek tribe and for Nanwalek rural SHARC holders.
The RAM Program issued 1 community permit for 2012. Harvests from this permit were added to the estimates for the tribe of the permit holder because they are not reported by individuals in their response to the SHARC postal survey. Data from this permit were returned directly to RAM Program, and RAM Program provided the data to ADF&G for the analysis.
It should also be noted that not every individual who obtained a SHARC as a tribal member resided in the community where his or her tribe’s headquarters is located. Therefore, the sum of harvest estimates for tribal SHARC holders and rural resident SHARC holders does not necessarily equal the halibut harvest for particular communities of residence. Rather, an additional analysis was necessary to estimate harvests by community of residence that assigned tribal SHARC holders to a community based on their mailing addresses. Appendix tables E-4, E-5, and E-6 report project results by place of residence of the SHARC holders.
The standard deviation (SD; or Variance [V], which is the SD squared) of the harvest was calculated with the raw, unexpanded data. The standard error (SE), or SD of the mean, was also calculated for each community or tribe. This was used to calculate the relative precision of the mean, or the likelihood an unknown value falls within a certain distance from the mean. In this project, the relative precision of the mean is shown in the tables as a confidence interval (CI), expressed as a percentage. Once the standard error was calculated, the CI was determined by multiplying the SE by a constant that reflected the level of significance desired, based on a normal distribution. The constant for 95% confidence intervals is 1.96.
6
DRAFT

Though there are numerous ways to express the formula below, it contains the components of a SD, V, and SE.
Relative precision of the mean (CI%):
𝐶𝐼%(±) =𝑡𝛼 2⁄ × 𝑠
√𝑛× �𝑁 − 𝑛
𝑁 − 1𝑥
(4)
𝑠 = ��∑(𝑥𝑖 − 𝑥)2
𝑛𝑖 − 1𝑖=1
(5)
Where
=s sample standard deviation
x = reported amount harvested by individual SHARC holders
x = mean harvest =n total sample size
=N total population size
=in tribal or community sample size
=t 2αStudent’s t-statistic for alpha level (α=0.95) with n–1 degrees of freedom.
Project staff explored the possibility of nonresponse bias for returned mail-out surveys and its effect on harvest estimates (see Appendix F for further discussion). However, it was determined that responses to the survey, including harvest levels and involvement in the fishery, were not notably different between any of the response categories (responses to the first mailing, the second mailing, the third mailing, and staff-administered surveys; see Appendix Table E-2).
As noted above, survey respondents provided harvest estimates in pounds round (whole) weight. For ease of comparison with estimates of halibut removals in other fisheries, we have converted these estimates to pounds net (dressed, head off) weight, where 0.75 × round weight = net weight.7
Products The public review draft of this final report was completed in November 2013 and circulated for review and comments. The draft report was also posted at the Division of Subsistence website. A presentation of the project findings and recommendations occurred at the December 2013 meeting of the NPFMC in
7 The factor of 0.75 for converting halibut round weight to net weight is the standard used by the IPHC and ADF&G Division of Sport Fish. Division of Subsistence studies, as reported in the Technical Paper series and in the Community Subsistence Information System (CSIS)a, generally use a factor of 0.72 for converting halibut round weights to net weights, based on Crapo et al. (1993:7), who reported that, on average, the weight of a dressed halibut with the head removed is 72% of the round weight, with a range of 68% to 80%. In Division of Subsistence Technical Papers, “net” weight (dressed, head off) is usually referred to as “usable weight.”
a. CSIS: http://www.subsistence.adfg.state.ak.us/CSIS/. The CSIS was formerly the Community Profile Database (referred to as CPDB) (Scott et al. Unpublished).
7
DRAFT

Anchorage, Alaska. In study years 2003–2008, draft results were also reviewed during a December meeting of the ANSHWG, but a meeting of this advisory group did not take place in December 2013. The final report was revised in consideration of comments and suggestions received from reviewers of the public review draft. In addition to the final report, a short findings summary was prepared (Appendix G). The summary was sent to tribal government representatives and other interested individuals and groups. This report was posted on the Division of Subsistence website and the RAM Program website in PDF format for downloading and printing by the public. Printed copies of this report were sent to the Alaska Resources Library and Information Services as well as the Alaska State Library.
8
DRAFT
CHAPTER 2: FINDINGS SUBSISTENCE HALIBUT HARVESTS IN 2012 Estimated Number of Subsistence Halibut Fishers Of the 9,944 individuals who held valid SHARCs for any portion of 2012, an estimated 4,394 (44%) participated in the subsistence halibut fishery in 2012 (Table 4; Figure 6). Of the 3,425 individuals who held SHARCs as members of an eligible tribe, an estimated 1,232 participated in the fishery (36%). Of the 6,519 individuals who held SHARCs as residents of qualifying rural communities, an estimated 3,162 (49%) participated in the subsistence fishery for halibut in 2012. The estimated total of 4,394 subsistence halibut fishers in 2012 is the lowest estimate since the SHARC program began in 2003 (Figure 6).
In 2003–2007, differences in the demography of tribal SHARC holders and rural SHARC holders probably accounted for some of the differences in the rate of participation in the subsistence halibut fishery between these 2 groups. As a proportion of total SHARC holders, about twice as many tribal SHARC holders were under 20 years of age compared to rural SHARC holders. This may reflect a policy on the part of some eligible tribes in the first years after the regulations were adopted to register all or most tribal members, including younger people who were less likely to participate in the subsistence fishery than adults. Despite the substantial drop in the number of tribal SHARC holders in 2008–2012 (Figure 6), differences in the age structure of this group compared to rural SHARC holders remained. For example, in 2012, 23% of tribal SHARC holders were less than 30 years old, compared to 12% of rural SHARC holders (Table 5; Figure 7).
Alaska Native tribes with the most subsistence halibut fishers in 2012 included the Central Council of Tlingit and Haida Indians (147 subsistence halibut fishers), the Ketchikan Indian Corporation (115), the Sitka Tribe of Alaska (98), the Hydaburg Cooperative Association (65), the Sun’aq Tribe of Kodiak (62), the Hoonah Indian Association (53), Pauloff Harbor Village (38), the Angoon Community Association (36), the Seldovia Village Tribe (35), the Wrangell Cooperative Association (32), the Yakutat Tlingit Tribe (29), the Native Village of Nanwalek (29), Craig Community Association (27), the Metlakatla Indian Community (26), and the Qagan Toyagungin Tribe of Sand Point (26). Of the SHARC holders who registered as residents of eligible rural communities, the most subsistence fishers lived in Kodiak (696), followed by Sitka (596), Petersburg (357), Haines (226), Wrangell (210), Cordova (188), and Craig (141). Appendix Table E-3 provides details for each tribe and community regarding participation in the subsistence fishery and subsistence halibut harvests in 2012.
As noted above, not every tribal SHARC holder lives in his or her tribe’s headquarters community. After assigning tribal members to a community based on their place of residence, an estimate of participation in the subsistence halibut fishery in 2012 by community can be obtained. Appendix Table E-4 provides project findings based on place of residence. Communities with 100 or more resident SHARC holders who participated in the subsistence halibut fishery in 2012 were Kodiak (769), Sitka (697), Petersburg (383), Wrangell (249), Haines (237), Craig (216), Cordova (202), Ketchikan (158), and Hoonah (111). Of the 9 Alaska communities with 100 or more subsistence halibut fishers in 2012, 6 had about the same or slightly more fishers than in 2011 (+1% to +8%) (Figure 8). The estimated number of subsistence halibut fishers in Kodiak, Sitka, and Haines decreased by 8%, 11%, and 12%, respectively (Figure 8) (see Chapter 3 for further discussion of Kodiak, Petersburg, Cordova, and Sand Point as case study communities.) Four non-Alaska-resident tribal SHARC holders subsistence fished for halibut in Alaska in 2011, compared to a high of 24 in 2005 and low of zero in 2004 and 2007.
As illustrated in Figure 98 (see also Table 6), the largest number of Alaska subsistence halibut fishers in 2012 fished in waters of Regulatory Area 2C (Southeast Alaska)—2,715 (62%).9 There were 1,474
8 In reports for study years prior to 2011, data in Figure 9 were based on the location of the tribe or place of residence of the SHARC holder. For reports for the 2011 and 2012 study years, we have revised Figure 9 to report fishers by location in which
9
DRAFT

subsistence halibut fishers (34%) who fished in Regulatory Area 3A (Southcentral Alaska); 137 (3%) in Regulatory Area 3B (Alaska Peninsula); 61 (1%) in Regulatory Area 4A (Eastern Aleutians); and 55 (1%) in Area 4E (East Bering Sea Coast). Additionally, there were 24 (1%) subsistence halibut fishers in the 3 other regulatory areas. As also shown in Figure 9, the distribution of subsistence fishers by regulatory area in 2012 was similar to that of 2003–2011, except, continuing the pattern established in 2008, there was a sharp decrease in the number of halibut fishers in Area 4E (from 393 in 2007 to 152 in 2008, 128 in 2009, 70 in 2010, 91 in 2011, and 55 in 2012). The estimated number of subsistence halibut fishers in Area 4C (Pribilof Islands) has dropped as well from 105 in 2003 to 9 in 2012. As discussed in Chapter 3, for the case study communities of Toksook Bay and Tununak these changes are more likely caused by subsistence fishers failing to renew SHARCs rather than a drop in subsistence halibut fishing.
Estimated Alaska Subsistence Halibut Harvests in 2012 by SHARC Type and IPHC Regulatory Area Table 4 reports estimated Alaska subsistence halibut harvests for 2012 by SHARC type, IPHC regulatory area, and gear type. The total estimated subsistence halibut harvest in Alaska in 2012 was 37,093 fish (±3%) for 686,991 lb (net weight; ±3%).10 As estimated in pounds net weight, 59% of the subsistence halibut harvest (405,596 lb [±3%]) was taken by fishers registered with tribes or rural communities in Regulatory Area 2C (Figure 10). (Note that because some SHARC holders may fish in a regulatory area different from the location of their tribal headquarters or rural community of registration, the area totals in Table 4 do not precisely represent harvest locations. See the section on harvests by location, below.) Fishers from Area 3A tribes and rural communities harvested 245,288 lb (±6%; 36% of the state total). Harvests totaled 18,357 lb (±19%; 3%) for communities and tribes of Regulatory Area 3B. For tribal and rural SHARC holders in Area 4A, the estimated harvest was 8,671 lb (±25%; 1% of the net harvest weight). For Regulatory Area 4E,11 the estimated harvest for tribal and rural SHARC holders was 5,556 lb (±48%; 1% of the net harvest weight). For Regulatory Area 4C, the estimated harvest for tribal and rural SHARC holders was 2,009 lb (±110%; 0.3% of the net harvest weight). Tribes and communities in 4D harvested 791 lb (±46%; 0.1% of the net harvest weight) and those in 4B harvested 722 lb (±84%; 0.1%).
The estimated subsistence harvest of 686,991 lb of halibut in 2012 represents a decrease of 1.5% compared to the estimated harvest of 697,656 lb in 2011 (Figure 11). Harvests by tribal SHARC holders increased by 4.7% from 248,446 lb in 2011 to 260,118 lb in 2012. Tribal SHARC holders harvested 38% of the Alaska subsistence halibut harvest in 2012, compared to 36% in 2011. Subsistence halibut harvests by nontribal, rural resident SHARC holders decreased by 5.0%, from 449,210 lb in 2011 to 426,873 lb in 2012. This group accounted for 62% of the statewide subsistence halibut harvests in 2012, compared to 64% in 2011.
Members of 55 Alaska tribes harvested subsistence halibut in 2012. In 2 others, SHARC holders fished but had no harvest. In 24 others, tribal members obtained SHARCs and returned surveys, but no one fished. Members of 10 other tribes held SHARCS, but no one returned a survey form. No one in the remaining 32 eligible tribes held a valid SHARC in 2012. As shown in Figure 12, members of the 15
the fishing took place. Estimates of the number of subsistence halibut fishers fishing within each regulatory area are not available for 2003 or 2004. The data in Figure 9 for those years remain based on the location of the tribe or place of residence of the SHARC holder.
9 Because some SHARC holders fished in more than one regulatory area, the sum of fishers for each area exceeds the state total. 10 This approximates 915,988 lb round (live or whole) weight. See footnote 7 in Chapter 1 for an explanation of the factor used to
convert round weight to net weight. 11 Community Development Quota (CDQ) organizations operating exclusively in areas 4D and 4E may retain U32 halibut (under
32 inches in length) from their commercial catches for home use. In 2012, a total of 20,187 lb net weight of halibut was retained by 3 organizations: Coastal Villages Regional Fund (10,424 lb), Bristol Bay Economic Development Corporation (5,095 lb), and Norton Sound Economic Development Corporation (4,668 lb) (Williams 2011). The IPHC includes these fish within the “personal use” removal category, a category that also includes subsistence harvests (Gilroy 2005:64). See also the section in Chapter 3, “Comparisons with Nonsubsistence Harvests.”
10
DRAFT
tribes with harvests of 6,000 lb or more accounted for 76% of the total subsistence halibut harvest by tribal SHARC holders in 2012. These 15 tribes accounted for 63% of the tribal SHARCs (2,158 of 3,425) (Table 3). Members of the other 40 tribes with harvests accounted for about 24% of the total harvest by tribal members (Figure 12).
Residents of 52 eligible rural communities harvested subsistence halibut in 2012.12 In 1 other, a SHARC holder fished without success. In 6 others, individuals obtained SHARCs but no one fished. Residents of 6 other eligible rural communities obtained SHARCs, but no one returned a survey form. No one in the remaining 53 eligible rural communities held a valid SHARC as a nontribal member in 2012.13 As shown in Figure 13, 9 rural communities with harvests of over 10,000 lb accounted for 78% of the subsistence halibut harvest by the holders of rural (nontribal) SHARCs in 2012. Residents of the other 43 communities with harvests accounted for 22% of the total harvest by rural SHARC holders.
As also shown in Figure 13, rural SHARC holders from 2 communities accounted for 41% of the total harvest by this group in 2012: Kodiak (26%) and Sitka (15%). Adding Petersburg, the next highest rural community harvest at 10%, the top 3 rural communities accounted for 51% of the rural community (nontribal) subsistence halibut harvest in Alaska in 2012.
Estimated Alaska Subsistence Halibut Harvests in 2012 by Harvest Location Survey respondents were asked to report the “water body, bay, or sound [that they] usually fished” for subsistence halibut in 2012. Multiple responses were permitted. In Table 6, estimated subsistence halibut harvests are reported for the 8 Alaska halibut regulatory areas and 22 subdivisions within these areas. It should be noted that regulatory area totals in Table 6 differ slightly from those reported in Table 4 because not all SHARC holders fished within the regulatory area in which their tribal headquarters or residence is located.
Subsistence halibut harvests in Regulatory Area 2C (Southeast Alaska) accounted for 58% of the Alaska subsistence halibut harvest in 2012 (396,043 lb [net weight]) (Figure 14; Table 6). Also, as shown in figures 15 and 16, the 3 geographic subareas with the largest subsistence halibut harvests in 2012 were in Area 2C: southern Southeast Alaska (237,905 lb [net weight]; 35% of the state total); the northern Southeast Alaska area other than the Sitka Local Area Management Plan (LAMP) area (83,624 lb; 12%), and the Sitka LAMP area (74,514 lb; 11%).14 Regulatory Area 3A (Southcentral Alaska) ranked second, with 37% of the state’s total subsistence halibut harvest (253,516 lb [net weight]). Waters bordering the Kodiak Island road system (including Chiniak Bay) ranked fourth among subareas, with a subsistence halibut harvest of 72,516 lb (11% of the state total), and other Kodiak Island waters not along the road system area (“Kodiak Island–Other”) ranked fifth (67,914 lb; 10%). Harvests within Cook Inlet waters of Area 3A accounted for 9% of the state total (65,100 lb; ranking sixth), those within Prince William Sound added 27,873 lb (4% of the statewide total; ranking seventh), and the Yakutat Area added 20,113 lb (3%). Among regulatory areas, Area 3B (Alaska Peninsula, including the Chignik Area) ranked third with 2% of the Alaska total (15,959 lb). Area 4A (eastern Aleutian Islands) ranked fourth with 9,543 lb (1%), and Area 4E (East Bering Sea Coast) ranked fifth with 8,384 lb (1%). Most of the harvest in Area 4E came from the Yukon–Kuskokwim Delta area, with a smaller amount from Norton Sound and Bristol Bay.
12 In this tally, Chiniak, listed separately in tables in this report, is counted as part of Kodiak, as it is for eligibility. Because some residents of eligible rural areas had mailing addresses in non-eligible communities, 3 non-eligible communities are listed as “rural communities” in Table 3. These were Juneau (6 SHARCs), Ketchikan (7 SHARCs), and Ward Cove (1 SHARC). These 3 places are not included in this count of participating communities.
13 Note that residents of these communities may have obtained SHARCs as tribal members. 14 For this project, “northern Southeast Alaska” includes those waters of Regulatory Area 2C north of Frederick Sound, including
waters surrounding Baranof Island and excluding the Sitka LAMP area. For a description of the Sitka LAMP area, see FR 68 18156, April 15, 2003, § 300.65(d)(1). The remaining waters of Area 2C are referred to as “southern Southeast Alaska” in this report.
11
DRAFT
Area 4B (western Aleutian Islands) ranked sixth with 1,698 lb (less than 1%). Area 4C (Pribilof Islands) added 1,176 lb (less than 1%); and Area 4D (central Bering Sea) added 672 lb (less than 1%).
Figure 17 reports estimated harvests in pounds net weight by location fished at the regulatory area level in 2003–2012. Table 7 compares estimated subsistence halibut harvests by regulatory area and geographic area in 2012 with those estimated for 2003–2011 and for the 9-year average from 2003–2011. As noted previously, for the state overall, the estimated harvest in pounds decreased by about 1.5% in 2012 from 2011 (Figure 18; Table 7). The estimated harvest in 2012 was 30% lower than average for the first 9 years (2003–2011) of the subsistence halibut harvest monitoring program (Figure 19).
Estimated subsistence halibut harvests increased in 4 of the 8 regulatory areas in 2012 compared to 2011, and decreased in the other 4 (Figure 17; Figure 18; Table 7). As in the first 9 years of the project, Area 2C (Southeast Alaska) accounted for the most subsistence halibut harvests in 2012 (396,043 lb; 58% of the state total); this harvest represents an increase of 2% compared to 2011 (Table 7; Figure 17; Figure 18), but a 25% decrease compared to the 9-year average from 2003–2011 (Figure 19). Harvests decreased in 2 of the subareas within Area 2C in 2012 compared to 2011: the Sitka LAMP Area, down 11%; and the remainder of northern Southeast, down 16%. In contrast, harvests in the southern Southeast Alaska subarea increased 17%. Harvests were down in all 3 Southeast subareas compared to recent 9-year averages: 16% in southern Southeast Alaska, 38% in the Sitka LAMP area, and 31% in the remainder of northern Southeast Alaska. The reasons for these changes in Area 2C are likely complex and beyond the scope of this report.15
Estimated harvests in Area 3A (Southcentral Alaska) decreased for the seventh straight year. The 2012 harvest of 253,516 lb was a decline of 5% from the 2011 harvest of 266,104 lb. The estimated subsistence halibut harvest in Area 3A in 2012 was 27% lower than the previous 9-year average, and was the lowest estimate of any study year (Figure 19; Table 7). Area 3A accounted for 37% of the statewide subsistence halibut harvest in 2012, similar to other recent study years (Table 7). In Area 3A in 2012 compared to 2011, subsistence halibut harvests increased in 2 subareas: Yakutat, up 28%; and Cook Inlet, up 8%. Harvests dropped in the other 3 subareas; Prince William Sound, down 15%; the waters of Kodiak Island along the road system, down 9%; and the remainder of the Kodiak Island area, down 12%. Harvests in 2012 were lower than the previous 9-year averages in all Area 3A subareas except Yakutat, which showed a 7% increase.
In Area 3B (Alaska Peninsula), harvests declined from 22,011 lb in 2011 to 15,959 in 2012 (down 27%) (Figure 17; Figure 18; Table 7). In Area 3B, the 2012 estimated harvest was the lowest of the 10 years of the project, 55% below the previous 9-year average, and notably below the estimates for 2005 (46,225 lb), 2006 (48,547 lb), and 2007 (47,748 lb) (Table 7; Figure 17; Figure 19). Earlier reports (e.g., Fall and Koster 2010:12) suggested that improved participation in the SHARC program in 2005–2008 accounted for some of the increase in the estimated harvests in Area 3B in those years, compared to 2003 and 2004, the first 2 years of the harvest monitoring program. However, the number of SHARC holders for Area 3B tribes and rural communities decreased from 606 in 2008 to 309 in 2009, 369 in 2010, 358 in 2011, and 338 in 2012; this is a decline in program participation that may partially explain the lower harvest estimates for 2009–2012 (see discussion of Sand Point in Chapter 3) (Table 7).
Estimated subsistence halibut harvests in Area 4A (Eastern Aleutians) dropped 30% from 2011 (13,606 lb) to 2012 (9,543 lb). The harvest in Area 4A in 2012 was 59% lower than the previous 9-year average (Figure 19). There are only 3 communities in Area 4A: Akutan, Nikolski, and Unalaska–Dutch Harbor. Therefore, harvest estimates for individual communities strongly shape the area estimate. For example, previous reports have discussed how sampling achievement in Akutan evidently affected the area’s harvest estimate (Fall and Koster 2010:13). No Akutan residents returned SHARC surveys for 2012; therefore, there is no estimated subsistence halibut harvest for this community. For 2009, an increased
15 Further discussion of differences between harvest estimates for 2003–2012 appears in Chapter 3 and Chapter 4.
12
DRAFT

harvest by SHARC holders living in Unalaska–Dutch Harbor, from 13,710 lb in 2008 to 29,306 lb in 2009, accounted for most of the change in the regulatory area’s estimate between those 2 years, but estimated harvests in that community dropped to 13,081 lb for 2010, 12,257 lb for 2011, and 10,059 for 2012 (Table 7). (See below for more discussion of harvest estimates for Unalaska–Dutch Harbor.)
In Area 4B (Western Aleutians) there was a large increase of 216% in the estimated subsistence harvest of halibut in 2012 (1,698 lb) compared to 2011 (537 lb) (Table 7; Figure 17; Figure 18). Estimated harvests in this area dropped after 2008, when the estimate of 4,737 lb was 147% higher than the previous 5-year average (Fall and Koster 2010:92). This increase in 2008 was likely due in part to the larger reported average size of halibut harvested in this area in that year (30.5 lb [net weight] per fish; see Table 9 in Fall and Koster 2010:66) compared to earlier years (19.5 lb [net weight] per fish in 2007 [Fall and Koster 2008:71]). The average weight of subsistence harvested halibut in Area 4B in 2009 was only 15.4 lb (see Table 9 in Fall and Koster 2011) and 12.6 lb in 2010 (see Table 9 in Fall and Koster 2012), but rose to 20.1 lb in both 2011 and 2012 (see Table 9 below). The estimated harvest for Area 4B was 7% below the previous 9-year average (Figure 19), but higher than any other year since 2008 (Table 7).
Estimated subsistence harvests of halibut in Area 4C (Pribilof Islands) dropped 29% in 2012, to 1,176 lb, from 1,648 lb in 2011 (Figure 17; Figure 18; Table 7). The 2012 estimate was 88% below the previous 9-year average and the lowest since the SHARC program began in 2003 (Figure 19; Table 7). As noted in reports for previous project years (Fall, George, and Easley 2005:15; Fall and Koster 2008:15), a high response rate to the survey, based upon follow-up household surveys and in-season data collection by the Central Bering Sea Fishermen’s Association, likely produced very reliable harvest estimates for St. Paul, the largest community in Area 4C, after the first project year of 2003. However, due to funding reductions, this work did not take place for 2008–2012. The number of valid SHARCs held by St. Paul residents dropped from 246 in 2007 to an average of 43 for 2008–2011 and just 12 in 2012, and the response rate to the survey declined from 83% in 2007 to 45% in 2008, 34% in 2009, 29% in 2010, 35% in 2011, and 25% in 2012. The estimated number of subsistence halibut fishers in the community was 12 in 2012,16 compared to a range of 14–19 in 2007–2010 that then dropped to 11 in 2011. In addition, only 2 residents of St. George held SHARCs in 2012, and no surveys were returned from this community. The extent to which the decline in the survey response rate has affected harvest estimates for Area 4C is uncertain.
In Area 4D (Central Bering Sea), the subsistence halibut harvest estimate for 2012 of 672 lb was 9% higher than the estimate of 615 lb for 2011. The 2012 estimate was 84% lower than the previous 9-year average for Area 4D, and the second-lowest annual estimate for the area since the SHARC program began in 2003 (Figure 17; Figure 18; Figure 19; Table 7). It is likely that this sharp drop in the harvest estimate for Area 4D since 2008 is the result of nonrenewal of SHARCs by subsistence fishers. The number of SHARCs held by residents of Savoonga, the principal halibut harvesting community in Area 4D, dropped from 43 in 2007, with an estimated 15 subsistence halibut fishers, to 17 SHARC holders in 2009, with an estimated 7 subsistence halibut fishers, 17 SHARC holders in 2010 with 6 fishers, 17 SHARC holders and 9 fishers in 2011, and 6 SHARC holders and 5 fishers in 2012.
For Area 4E (East Bering Sea Coast), the estimated subsistence harvest of halibut of 8,384 lb in 2012 was a 36% increase from the 6,168 lb estimated for 2011, but was 75% lower than the 9-year average from 2003–2011 (Figure 17; Figure 18; Figure 19; Table 7). The 2012 estimated harvest was the second-lowest for this area since the survey began in 2003. As in Area 4D, lower harvest estimates for Area 4E are likely in part attributable to the substantial drop in valid SHARCs held by tribal members and rural community residents of Area 4E over the last 5 years, from 1,191 in 2007 to 421 in 2008, 374 in 2009, 286 in 2010,
16 All 3 of the survey respondents living in St. Paul (100%) reported that they fished, giving an estimate of 12 fishers for the community (100% of the 12 SHARC holders who lived in St. Paul). Because of the weighting factor assigned to survey responses from St. Paul tribal SHARC holders, the estimate of 12 subsistence halibut fishers living in St. Paul differs slightly from that reported in Appendix Table E-4.
13
DRAFT

291 in 2011, and 185 in 2012. Also, unlike 2003–2007, no outreach, face-to-face interviewing, or telephone calls took place in Area 4E communities in 2008–2012, resulting in lower response rates compared to previous years. For example, response rates dropped in Toksook Bay from 41% (218 of 533 SHARCs) in 2007 to 32% (11 of 34 SHARCs) in 2008, 39% in 2009 (13 of 33), 38% in 2010 (12 of 32), and 41% in 2011 (13 of 32). Only 7 Toksook Bay residents held SHARCs in 2012; 6 were returned. In in Tununak, response rates dropped from 64% (44 of 69 SHARCs) in 2007, to 10% (7 of 68) in 2008, 55% (6 of 11) in 2009, 17% (3 of 11) in 2010, 27% (3 of 11) in 2011, and 36% (4 of 11) in 2012. With the drop in SHARC renewals and survey response rates, subsistence halibut harvests in Area 4E have likely been underestimated since 2008.
Figure 20 illustrates the average subsistence halibut harvest in pounds net weight for those SHARC holders who subsistence fished in 2012. Figure 21 illustrates the average harvest per fisher in numbers of halibut. For the state overall, the average subsistence halibut fisher harvested 156 lb (net weight) or about 8.4 halibut in 2012. Average harvests per fisher at the regulatory area level ranged from 116 lb (net weight) in Area 3B to 172 lb per fisher in Area 3A and Area 4B. Average subsistence halibut harvests have ranged from 8.1halibut per fisher in 2011 to 9.9 halibut per fisher in 2005, and from 148 lb per fisher in 2011 to 211 lb per fisher in 2003 (Fall and Koster 2012:14; Fall and Koster 2013:14; see also Table 19).
Subsistence Halibut Harvests by Place of Residence As shown in Figure 22, there were 22 Alaska communities whose residents had combined estimated subsistence halibut harvests of approximately 5,000 lb or more (net weight) in 2012. In this figure, community totals include harvests of all SHARC holders living in the community, regardless of type of SHARC (tribal or rural) or tribal affiliation.17 Residents of these communities accounted for 87% of the total Alaska subsistence halibut harvest in 2012. Residents of Kodiak (Kodiak includes the city of Kodiak and other portions of the Kodiak Island Borough connected to it by roads) ranked first with 18% of the total Alaska harvest, and Sitka ranked second with about 11%. With 13,235 and 9,084 residents, respectively, these 2 communities included about 26% of the population of rural communities eligible to participate in the subsistence fishery. There were 84 other Alaska communities with at least 1 resident who participated in the subsistence halibut fishery in 2012. The total harvest for these other communities represented about 13% of the state total.
For 2012, 97 SHARC holders provided out-of-state addresses from 77 communities in 22 states, provinces, and territories.18 Nine non-Alaska-resident SHARC holders subsistence fished for halibut in 2012, with a harvest of 128 fish and 1,657 lb (0.24% of the state total) (Appendix Table E-4). This level of involvement by non-Alaska residents in the subsistence halibut fishery in 2012 is similar to that of other study years (Fall and Koster 2012:14).
Subsistence Harvests by Gear Type Table 6 and Figure 23 report the estimated subsistence harvests of halibut in Alaska in 2012 by gear type and regulatory area fished. In total, 532,623 lb (78%) of halibut (net weight) were harvested using setline (stationary) gear (i.e., longlines, or “skates,” sometimes set with a power winch attached to a vessel; the highest percentage of any of the 10 study years [Fall and Koster 2012:15]) and 154,368 lb (22%) were harvested using hand-operated gear (i.e., handlines or lines attached to a rod or pole). As in past years, there were notable differences between regulatory areas (Table 6; Figure 23). Harvests using setline gear predominated in Area 2C (Southeast Alaska; 82% of the area’s total subsistence harvest), 3A (Southcentral Alaska; 72%), 3B (Alaska Peninsula; 65%), 4B (Western Aleutian Islands; 92%) and Area
17 Note that nonrural places, such as Anchorage, Juneau, Ketchikan, and Valdez, appear in Figure 22 and in Appendix tables E-4, E-5, and E-6, because members of eligible Alaska Native tribes may participate in the fishery regardless of where they live, and because some eligible residents of rural areas have mailing addresses in nonrural places.
18 Note that members of eligible tribes may obtain SHARCs regardless of their place of residence.
14
DRAFT
4D (Central Bering Sea; 100%). Unusually, most halibut in Area 4E (East Bering Sea Coast; 72%) were harvested with setlines, unlike past years when handlines accounted for most of the harvest. Harvests were about evenly split between the 2 gear types in the remaining 2 regulatory areas (4A [Eastern Aleutian Islands] and 4C [Pribilof Islands]).
Number of Hooks Fished with Setline Gear Respondents who fished with setline (stationary) gear (longline or skate) were asked to report how many hooks they “usually set.” The findings by regulatory area are reported in Table 8. For the fishery overall, most setline fishers (41%) used 30 hooks, the maximum number allowed by regulation in areas 2C, 3A, 3B, 4A, and 4B (there is no hook limit in areas 4C, 4D, and 4E) (Figure 24). The next most frequently reported number was 20 hooks, usually used by 16% of the fishers who used setline gear. Fifteen hooks (13%) ranked third, followed by 25 hooks (7%) and 10 hooks (5%). This pattern is similar to that of all previous study years (Fall and Koster 2012:15; Fall and Koster 2013:15).
Thirty was the most frequently used number of hooks with setline gear in 7 regulatory areas (Table 8): 2C (Southeast Alaska), 38%; 3A (Southcentral Alaska), 46%; 3B (Alaska Peninsula), 54%; 4A (Eastern Aleutian Islands), 46%; 4C (Pribilof Islands), 50%; 4D (Central Bering Sea), 57%; and 4E (East Bering Sea Coast), 47%. In Area 4B (Western Aleutian Islands), 53% used 10 hooks, 24% used 20 hooks and 24% used 30 hooks.
Number of Subsistence Halibut Fishing Trips For 2012, for the fourth time in the harvest survey program, respondents were asked to report the number of subsistence fishing trips they took for halibut in the study year. The average number of trips for subsistence halibut fishers was 4.3 (compared to 4.7 in both 2009 and 2010, and 4.4 for 2011 [Fall and Koster 2013:15]), with those holding tribal SHARCs averaging 4.6 trips (compared to 5.5 in 2009, 5.1 in 2010, and 4.8 trips in 2011) and those holding rural SHARCs averaging 4.2 trips (compared to 4.5 trips in 2009, 4.6 in 2010, and 4.3 in 2011). In most regulatory areas, the average subsistence fisher took between 4 and 5 trips, with a higher average in Area 4D (average of 15 trips by just 5 fishers; average of 6.3 trips in 2011) and a lower average Area 4E (average of 2.9 trips) (Figure 25). As shown in Figure 26, about 78% of fishers took 5 or fewer trips, and about 15% took between 6 and 10 trips. Six percent took between 11–20 trips, and about 1% took more than 20 trips.
The average number of subsistence halibut harvested per fishing trip in 2012 was 1.9 (compared to 1.8 in 2009, 2010, and 2011), with tribal SHARC holders averaging 2.5 fish and rural SHARC holders averaging 1.7 fish. The highest average harvests per trip occurred in Area 4E (2.8 fish per trip) and Area 4C (2.5 halibut per trip) (Figure 27).
Sport Harvests of Halibut by SHARC Holders Survey respondents were asked to report the number of halibut and pounds of halibut they harvested “while sport fishing during 2012.” They were instructed not to include fish they considered sport caught as part of their subsistence halibut harvest. The goal of this question was to avoid double counting harvested halibut in this survey and in the statewide survey of sport fishers administered by the Division of Sport Fish of ADF&G. Answering this question required respondents to classify their hand-operated gear (i.e., hook and line and rod and reel) harvests as either subsistence or sport; these gear types are legal gear for both sport fishing and subsistence fishing. Fish reported in the survey as “sport harvests” are not included in the estimated subsistence harvests discussed above. If SHARC holders also received the sport fish survey for 2012, they would be expected to report only their sport caught halibut and not include any halibut they reported as subsistence harvests, even if taken with rod and reel or handheld line with 2 or fewer hooks. Note that the project findings do not represent the total recreational halibut harvest by residents of eligible communities and tribes in 2012 because individuals from these tribes and communities who did not obtain SHARCs could have sport fished.
15
DRAFT

As shown in Table 4 and Table 6, the estimated total sport halibut harvest by holders of SHARCs in 2012 was 8,727 fish and 146,174 lb (net weight). By area fished, most of the sport halibut harvest by SHARC holders occurred in Area 2C (Southeast Alaska) (75,394 lb; 52%) and Area 3A (Southcentral Alaska) (63,565 lb; 43%) (Table 6). In total, an estimated 2,231 SHARC holders (22%) reported that they sport fished for halibut in 2012 (Table 4). A large proportion of these fishers fished in either Area 2C (1,312; 59%) or Area 3A (845; 38%) (Table 6). (See Appendix Table E-7 for estimated sport halibut harvests by tribe and nontribal rural community SHARC holders.)19
Estimated Average Net Weights of Subsistence- and Sport-Caught Halibut Table 9 reports the average net weight of subsistence- and sport-caught halibut by SHARC holders in 2012, based upon estimates provided by survey respondents. For the state, the estimated average net weight of subsistence-caught halibut was 18.5 lb and the average net weight of sport-harvested halibut by SHARC holders was 16.7 lb. For the halibut reported as harvested in the SHARC program by SHARC holders in 2012, the average net weight per harvested halibut was 18.2 lb. Between regulatory areas, there was a range of average weights per halibut. The halibut harvested by the communities of Area 4D (Central Bering Sea), averaged 30.9 lb (net weight) per fish. Halibut harvested in the subsistence fishery in Area 4B were also larger than the state average, at 20.1 lb per fish, as were the halibut harvested in the subsistence fishery in 2C, at 20.0 lb per fish. In 2011 in Area 4E (East Bering Sea Coast), halibut harvested in the subsistence fishery averaged 8.2 lb (net weight), 45% of the statewide average (Fall and Koster 2013:16); however, in 2012, halibut harvested in Area 4E averaged 19.1 lb, which is above the state average. Subsistence-harvested halibut in Area 3A (Southcentral Alaska) at 16.8 lb per fish were below the state average, as were the halibut harvested in Area 3B (14.7 lb), Area 4A (16.6 lb), and Area 4C (14.0 lb).
The average weight of halibut harvested in the Alaska subsistence fishery declined steadily over the first 6 years of this project, from 23.7 lb per fish in 2003 to 18.2 lb per fish in 2008. This decline leveled off in 2009 when the average subsistence-harvested halibut weighed 19.0 lb, then in 2010 averaged 18.4 lb per fish, and in 2011 averaged 18.3 lb per halibut (Fall and Koster 2013:16). Thus the average of 18.5 lb per halibut in the subsistence fishery in 2012 suggests that, statewide, there has been little change in the average size since 2008.
ROCKFISH HARVESTS Survey respondents were asked to estimate the number of rockfish they harvested while subsistence fishing for halibut in 2012. Harvest data at the species level were not collected as part of this survey.
Note that these survey results do not represent an estimate for the total subsistence rockfish harvest by SHARC holders in 2012 because they might have harvested rockfish while fishing for species other than halibut, and other fishers in the communities who did not obtain SHARCs might have harvested rockfish. The Division of Subsistence Community Subsistence Information System (CSIS)20 includes estimates of rockfish harvests for communities in which comprehensive household surveys have been administered.
19 The ADF&G postal survey did not investigate the criteria by which survey respondents classified their rod and reel (hook and line attached to a rod or pole) halibut harvests as subsistence or sport. However, a supplemental mailing to 1,098 SHARC holders from Kodiak and Sitka who fished for halibut in 2004 asked respondents to provide reasons for classifying their halibut harvests as sport or subsistence. For a discussion of the findings, see Fall, Koster, and Davis (2006:19, 20, 123–138). In short, the primary factor (for 69% of respondents) was the gear used to harvest the fish: respondents viewed rod and reel as “sport gear” and setline gear as “subsistence gear.” Another factor, reported by 12%, concerned the composition of the fishing group. If the SHARC holders had fished with relatives or friends who did not possess a SHARC, they classified their fishing as recreational. Harvest amounts were also a consideration: harvests of 1 or 2 halibut with a rod and reel were considered “sport” by some respondents, but if they harvested more than 2 fish with rod and reel in 1 day, they classified the harvest as subsistence. Finally, about 19% of the respondents gave reasons related to the uses of the fish or other cultural and lifestyle explanations.
20 Available online: http://www.subsistence.adfg.state.ak.us/CSIS. Hereinafter cited as CSIS; see footnote 7.
16
DRAFT
It should also be noted that the label “bycatch” for these harvests is misleading.21 Rockfish are used for subsistence purposes in rural communities throughout their range in Alaska (CSIS). It is highly likely that most rockfish harvested incidentally in the subsistence halibut fishery are utilized as a subsistence food. It is highly unlikely that many incidentally caught rockfish are discarded in this subsistence fishery.
As shown in Table 10, the statewide estimated rockfish incidental harvest in the subsistence halibut fishery in 2012 was 9,568 fish by 1,161 fishers (12% of all SHARC holders, and 26% of all SHARC holders who subsistence fished for halibut in 2012). This is an average of about 2.2 rockfish per fisher for all subsistence halibut fishers in the SHARC program, and about 8.2 rockfish per fisher for those who had a rockfish harvest. Most of the subsistence halibut fishers who caught rockfish fished in Area 2C (Southeast Alaska) (874 fishers; 75%) and Area 3A (272 fishers; 23%). In Area 2C, about 32% of subsistence halibut fishers incidentally harvested rockfish, as did 18% in Area 3A (Southcentral Alaska). (See Appendix Table E-7 for estimated rockfish harvests by tribe and by nontribal rural community SHARC holders.)
As illustrated in figures 28 and 29, most of the incidental rockfish harvest in 2012 was harvested in Area 2C: 7,013 rockfish, 73% of the statewide total. Area 3A accounted for the second highest total: 2,316 rockfish, 24% of the total. Harvests were very small by SHARC holders fishing in other regulatory areas; their combined harvest of 239 rockfish was about 2% of the statewide total. The estimated incidental harvest of 9,568 rockfish in the subsistence halibut fishery in 2012 was the lowest total over the 10 years of the SHARC harvest survey; previous estimates ranged from a low of 10,853 rockfish in 2011 to a high of 19,001 rockfish in 2004.
Table 10 also reports location of incidental rockfish harvests in 2012 within geographic subareas. Most of the harvest occurred in southern Southeast Alaska (3,587 rockfish), the Sitka LAMP area (2,663 rockfish), the Kodiak Island road system (784 rockfish), the remainder of northern Southeast Alaska (764 rockfish), other Kodiak Island locations (583 rockfish), Cook Inlet (470 rockfish), and Prince William Sound (333 rockfish).
LINGCOD HARVESTS Survey respondents were asked to estimate the number of lingcod they harvested while subsistence fishing for halibut in 2012. Note that these survey results do not provide an estimate of the total subsistence lingcod harvest by SHARC holders in 2012 because they might have harvested lingcod while fishing for species other than halibut. Also, other fishers in the communities who did not hold SHARCs might have fished for or harvested lingcod, so that these incidental harvests represent only a portion of the total 2012 subsistence harvest. The Division of Subsistence CSIS includes estimates of lingcod harvests for communities in which comprehensive household surveys have been administered.
It should also be noted that the label “bycatch” for these harvests might be misleading.22 Lingcod are used for subsistence purposes throughout their range (CSIS). It is highly likely that most lingcod harvested incidentally in the subsistence halibut fishery are utilized as a subsistence food. It is very unlikely that many lingcod caught in this subsistence fishery are discarded.
21 The Magnuson-Stevens Fishery Conservation and Management Act (Section 3) defines “bycatch” as “fish harvested in a fishery, but which are not sold or kept for personal use, and includes economic discards and regulatory discards. Such term does not include fish released alive under a recreational catch and release fishery management program.” Federal regulations (50 CFR 679.2) define “bycatch” or “bycatch species” as fish caught and released while targeting another species or caught and released while targeting the same species; under 50 CFR 600.10 “discard” means to release or return fish to the sea, whether or not such fish are brought fully on board a fishing vessel. In all cases, “bycatch” means to discard fish and excludes retaining fish for use. The federal definition of “incidental catch” or “incidental species” is “fish caught and retained while targeting some other species, but does not include discard of fish that were returned to the sea” (50 CFR 679.2).
22 See footnote 21 for definitions of “bycatch” and “incidental catch.”
17
DRAFT

The statewide estimated incidental lingcod harvest in the subsistence halibut fishery in 2012 was 2,247 fish by 696 fishers (Table 10). This is an average of about 0.5 lingcod per fisher for all subsistence halibut fishers who participated in the SHARC program, and 3.2 lingcod per fisher for those who had a lingcod harvest. Of SHARC holders who subsistence fished for halibut in 2012, 16% harvested at least one lingcod while halibut fishing. Almost all of the subsistence halibut fishers who harvested lingcod fished in Area 2C (Southeast Alaska) (521; 75%) and Area 3A (Southcentral Alaska) (171; 25%). (See Appendix Table E-7 for estimated lingcod harvests by tribe and by nontribal rural community SHARC holders.)
As illustrated in figures 30 and 31, most of the incidental lingcod were harvested in Area 2C: 1,531 lingcod, 68%. Area 3A fishing locations accounted for the second highest total: 620 lingcod, 28%. The estimated incidental harvest of 2,247 lingcod in the subsistence halibut fishery in 2012 was the lowest total since the SHARC survey began in 2003; the previous lowest total was 2,305 lingcod in 2011 and the highest was 4,407 lingcod in 2004.
Table 10 also reports the location of incidental lingcod harvests by geographic subarea in 2012. Most of this harvest occurred in Area 2C (Southeast Alaska): the Sitka LAMP area (812 lingcod), southern Southeast Alaska (552 lingcod), and along the Kodiak Island road system (220) in Area 3A. The remainder of Kodiak Island, the non-LAMP portion of northern Southeast Alaska, the Yakutat area, and Cook Inlet all had an estimated incidental harvest of lingcod ranging between 90 and 167 fish.
18
DRAFT

CHAPTER 3: DISCUSSION COMPARISONS WITH OTHER HARVEST ESTIMATES As discussed in the first report for the SHARC survey project (Fall et al. 2004:19–22), comparing the statewide subsistence halibut harvest estimates generated by the SHARC survey with subsistence halibut harvest estimates from projects conducted before 2003 is difficult. The primary reason, as noted in Chapter 1, is that the regulations that allow subsistence halibut fishing in Alaska waters using traditional gear, such as longlines with more than 2 hooks, and that removed the restrictive daily harvest limit of 2 fish, have only been in place since May 2003.
Although the ADF&G Division of Subsistence has conducted systematic household surveys in many rural Alaska communities that have traditional uses of halibut, these studies pertain to different harvest years. In addition, there are many communities, especially in Western Alaska, where such surveys have not been conducted. Also, these Division of Subsistence studies have attempted to estimate the total halibut harvest for home use by including harvests conducted under sport fishing rules and harvests removed from commercial fisheries for home use. Typically, these studies have also collected harvests by gear type, such as rod and reel or “other gear.” When using these data sets, therefore, it is not possible to separate the “sport” harvest from the “subsistence” harvest for past harvest years, especially in larger rural communities with a diverse population where at least a segment of the population perceives some of their halibut fishing effort as recreational (see, for example, the discussions about Sitka and Kodiak, below).
Furthermore, the statewide subsistence halibut harvest estimates from the SHARC postal survey include only those subsistence harvests by individuals who obtained SHARCs. The estimates do not include total noncommercial harvests, such as those accomplished under sport fishing regulations, or halibut removed by commercial fishers for use by their households or for noncommercial sharing.23 Thus they can be only partial estimates of the total harvest of halibut for home use by rural Alaska residents and cannot be compared to estimates from previous Division of Subsistence studies without caution.
The report for the first year of this project included a detailed discussion of previous efforts to develop an estimate of subsistence halibut harvests at the regional and statewide levels. The report suggested that the 2003 SHARC survey estimates were not markedly different from estimates based on Division of Subsistence household survey data as reported in the CSIS. We will not repeat that full discussion here.24 However, the report also concluded that because of the limitations associated with the previous subsistence harvest estimates at the statewide level, until a time series was developed based upon the SHARC survey results, a discussion of harvest trends in the subsistence halibut fishery was speculative. Ten years of comprehensive data for the subsistence halibut fishery area are now available, and a discussion comparing the project findings for 2012 with those for 2003–2011 appears in Chapter 4.
23 Since 1995, halibut removed for personal use by commercial fishers from their commercial harvests must be weighed and accounted for within the commercial quota share program (Gregg Williams, IPHC, personal communication).
24 For example for 2000, the IPHC estimated 439,000 lb net weight for Alaska “personal use” (noncommercial, nonrecreational) harvests (in Wolfe 2001). The IPHC estimate is based upon a methodology described by Trumble (n.d.). The IPHC method assumed that 50% of Alaska Native rod and reel halibut harvests, as reported in ADF&G household surveys, are “sport” and 50% “personal use,” and that 75% of the non-Native rod and reel harvests are “sport” and 25% “personal use” (Trumble n.d.:62). No justification for these assumptions is provided, and changing these sport-to-personal-use ratios can result in a very different estimate for the “personal use” halibut harvest. In a report to the Alaska Board of Fisheries in May 2001, using the same data source as the IPHC, Wolfe (2001) estimated that the subsistence halibut harvest in Alaska “probably ranges between 400,000 and 1,000,000 pounds (round weight) annually,” based on harvest data in the CSIS/CPDB. This is an estimated harvest of 300,000 to 750,000 lb net weight. See Fall et al. (2004:19–21) for discussion of Wolfe’s methods. In the original analysis for the subsistence halibut program, the NPFMC estimated the Alaska subsistence halibut harvest at 1.5 million pounds net weight (68 FR 18145, April 15, 2003, EA/RIR [North Pacific Fishery Management Council 2003]).
19
DRAFT

COMMUNITY CASE STUDIES Despite the limitations discussed above, it is possible to compare some communities’ previous noncommercial halibut harvest estimates with estimates generated from the SHARC survey, keeping in mind the different sampling methods, uncertainty in the separation of subsistence and recreational harvests, and the relative newness of the regulatory changes enacted in 2003. Prior Division of Subsistence research has suggested that such communities, presented here as case studies, can also be seen as representative of other communities of similar size and geographic location. In the following evaluation, emphasis is placed on larger communities, since, as discussed in Chapter 2, a small number of large communities have accounted for most of the statewide subsistence halibut harvest, according to the SHARC surveys. A comparison of the harvest estimates for these communities helps to determine the reliability of the statewide estimate generated by the SHARC survey, as well as survey performance. Because, as noted in Chapter 1, not all tribal SHARC holders live in the community where their tribal headquarters is located, the following comparisons are based upon place of residence of the SHARC holder in order to be consistent with earlier division studies. Table 11 reports selected project findings for 2003–2012 in the case study communities discussed below. Appendix tables E-4, E-5, and E-6 report project results for 2012 for all communities, based upon residence of SHARC holders.
Sitka (Regulatory Area 2C) In 2010, Sitka’s population was 8,881, including 2,184 Alaska Natives; the estimated population in 2012 was 9,084 (Table 1). Sitka was the second largest rural community eligible to participate in the SHARC halibut fishery in 2012, and had the highest number of SHARCs issued, at 1,570 (Table 11; about 16% of the Alaska total). Of these, 1,330 were issued to nontribal residents of Sitka, and 240 to tribal members living in Sitka; the latter total was down from 470 in 2007 (Fall and Koster 2010:22). Members of the Sitka Tribe of Alaska (STA) held 264 SHARCs in 2012, compared to 485 in 2007. It is important to remember that some STA members live in communities other than Sitka and that members of other Alaska tribes live in Sitka. Because of the relatively large number of SHARC holders who live there, developing a reliable subsistence halibut harvest estimate for Sitka is essential for the success of this subsistence harvest assessment program. Sitka residents’ response rates to the survey have also been substantial during the 10 years of the project, ranging from a low of 62% in 2010 to 75% in 2003 and 2012.
The Division of Subsistence has generated 2 estimates of noncommercial halibut harvests in Sitka for years prior to the 2003 authorization of subsistence halibut fishing (Table 12). One is for the 1987 study year, in which the estimated total noncommercial halibut harvest was 193,335 lb (net weight; ±22%), or 180,982 lb if fish removed from commercial harvests are excluded. This noncommercial total includes only harvests reported by surveyed persons as taken with rod and reel; data on harvests using “other methods” such as longlines, which were not allowed at that time in the subsistence fishery, were not collected. An estimated 1,252 Sitka households had at least one member who fished noncommercially for halibut in 1987. For 1996, the total estimated noncommercial harvest was 165,772 lb (net weight; ±28%), and 149,244 lb with commercial removals excluded. In 1996, an estimated 943 Sitka households had at least one member who fished noncommercially for halibut.
For 2012, the estimated subsistence harvest of halibut, by both tribal SHARC holders who live in Sitka (most, but not all, of whom are members of the STA) and by other residents of Sitka (1,570 SHARC holders), was 78,706 lb (net weight; 3,450 fish). This was the second highest of any community (behind Kodiak), and accounted for 11% of the statewide total subsistence halibut harvest. Of Sitka’s total subsistence halibut harvest, 71,261 lb (91%) was taken with setline gear, and 7,445 lb (9%) was taken with hand-operated gear. Adding sport harvests by Sitka SHARC holders (9,096 lb) produces a noncommercial estimate of 87,802 lb (net weight). Of all SHARC holders from Sitka, an estimated 697 subsistence fished for halibut in 2012. Of these, 659 used setline gear and 168 used hand-operated gear. Also, an estimated 237 SHARC holders from Sitka sport fished for halibut in 2012. The estimated total
20
DRAFT

number of SHARC holders living in Sitka who fished for halibut in either the subsistence or recreational fishery in 2012 was 799 (Table 11).
The combined estimated subsistence and sport halibut harvest by Sitka SHARC holders in 2012 was down 13% from the estimate for 2011 (101,366 lb), and was lower than any other study year, which ranged from 91,985 lb in 2010 to 207,288 lb in 2003 (Table 11). A total of 1,570 Sitka residents had SHARCs in 2012, with the range from previous years from 1,635 in 2010 to 1,974 in 2005. According to the SHARC survey, fewer Sitka residents participated in the subsistence halibut fishery in 2012 (697) than any other study year (2010 with 755 fishers was the previous low), but this decline in participation has not matched the decline in harvests. There were 799 Sitka SHARC holders who participated in either the subsistence or sport fisheries for halibut in 2012, compared to the previous range of 849 in 2010 to 1,036 in 2006.25
In summary, subsistence halibut harvest estimates for Sitka, based on the SHARC survey for 2003–2007 were generally similar to those generated from previous face-to-face household surveys conducted in 1987 and 1996. However, the SHARC survey data for 2008– 2012 show a decline in halibut harvests in Sitka compared to previous project years. A decline in the number of SHARCs held by tribal members in Sitka may account, at least in part, for lower estimated harvests, although average harvests by nontribal SHARC holders in Sitka were also lower in 2008–2012 compared to 2003–2007 (Table 13). For example, nontribal SHARC holders from Sitka who fished for halibut in 2012 had an average harvest of 108 lb per fisher, the lowest of the 10 project years and 26% below the previous 9-year average of 145 lb per fisher. Tribal SHARC holders from Sitka who fished in 2012 also had lower harvests than most previous years (except 2009–2011): 145 lb per fisher, which is 30% below the previous 9-year average of 205 lb. These findings suggest that the estimates of declining harvests in Sitka are not a result of inadequate sampling or less participation in the SHARC program. Rather, the study findings show that subsistence halibut harvests in Sitka have declined from 2005 through 2012. The causes of this decline require further investigation.
Petersburg (Regulatory Area 2C)
In 2010, Petersburg had a population of 2,948, including 390 Alaska Natives (Table 1); the estimated population in 2012 was 2,972. Prior to the 2003 authorization of federal subsistence halibut fishing, the Division of Subsistence produced 2 estimates of noncommercial halibut harvests by Petersburg residents based on household surveys in 1987 and 2000 (Table 14). In the 1987 project, a random sample of 49 of the 1,123 households in Petersburg was interviewed (4%), which generated a subsistence harvest estimate of 119,176 lb of halibut (net weight; ±51%); of this, 11,728 lb were estimated to have been removed from commercial harvests, resulting in a total noncommercial harvest estimate of 107,448 lb. As with Sitka, the 1987 project in Petersburg collected noncommercial harvest data only for halibut taken with rod and reel. Of the 1,123 households in Petersburg, 54% were estimated to have at least one member who fished for halibut noncommercially in 1987, which was an estimated 604 halibut fishers (CSIS/CPDB). In 2000, Petersburg residents were estimated to have harvested 55,974 lb (net weight) of noncommercial halibut (±39%). Of this, 6,951 lb were estimated to have been removed from commercial harvests, for a subsistence harvest of 49,023 lb, all of which was taken with rod and reel. In 2000, it was estimated that 468 Petersburg households had at least one member who fished for halibut for home use.
For 2012, the estimated subsistence harvest of halibut by Petersburg residents with SHARCs (917 SHARC holders) was 44,912 lb (net weight), up 12% from the 2011 estimate of 40,087 lb, but the second-lowest estimate of any study year since the project began in 2003 (Table 11). The number of
25 Following a recommendation from the first project year (Fall et al. 2004:31), data from the ADF&G Division of Sport Fish Statewide Harvest Survey (SWHS) about sport halibut harvests by Sitka residents were analyzed for additional background on halibut fishing in the community and discussed in the report for the 2004 project year (Fall, George, and Easley 2005:23–24). An updated analysis has not been prepared for this report.
21
DRAFT

SHARC holders from Petersburg has ranged from 917 in 2012 to 1,197 in 2005. Of the total 2012 subsistence halibut harvest, 34,066 lb (76%) was harvested with setline gear and 10,845 lb (24%) with hand-operated gear. This pattern was generally similar to other study years, in which between 64% (in 2009) and 75% (in 2003 and 2004) of the subsistence halibut was harvested with set line gear (Fall and Koster 2012:24).
In 2012, Petersburg SHARC holders also harvested 14,936 lb of halibut that they classified as sport harvested, compared to 13,096 lb in 2011. This gives a total noncommercial halibut harvest estimate for Petersburg SHARC holders of 59,848 lb, the second-lowest total of the 10 years of the project; previous estimates ranged from 53,183 lb in 2011 to 98,192 lb in 2004 (Table 11).
In 2012, an estimated 383 Petersburg SHARC holders harvested halibut in the subsistence fishery (315 with setline gear and 175 with hand-operated gear). This was the second-lowest level of participation for the 10 years of the project; the lowest estimate was 370 subsistence halibut fishers in 2011 and the highest estimate was 482 fishers in 2004 (Table 11).
Because some Petersburg residents without SHARCs likely sport fished for and harvested halibut, the 2003–2012 estimates of noncommercial halibut harvests by Petersburg residents generated by the SHARC survey appear consistent with, although somewhat lower than, the 1987 estimate based on household interviews. SHARC survey estimates for all study years except 2011 were higher than the in-person estimate for 2000, the year that state regulations restricted subsistence fishing to handlines or rods and reels with no more than 2 hooks. In that year, no Petersburg households reported taking halibut for home use with any gear other than rod and reel. In contrast, between 271 (in 2011) and 338 (in 2005) Petersburg SHARC holders used setline gear since the new subsistence halibut regulations have been in place.
Cordova (Regulatory Area 3A) Cordova’s population in 2010 was 2,239, with 344 Alaska Natives (Table 1); the estimated population was 2,316 in 2012. Before 2003, there were 6 Division of Subsistence household surveys that estimated noncommercial halibut harvests in Cordova (Table 15). After subtracting fish removed from commercial harvests for home use, estimated noncommercial halibut harvests by Cordova residents ranged from 25,609 lb (net weight; ±33%) in 1991 to 120,221 lb (±62%) in 1988, with an average over the 6 project years of 57,285 lb. The estimated number of Cordova households with at least one member fishing noncommercially for halibut ranged from 228 in 1985 to 401 in 1992, with a mean of 325 households (CSIS).
SHARC survey subsistence halibut harvest estimates and participation estimates for Cordova residents for 2003, the first year in which the new subsistence halibut regulations were in place, were lower than might be expected from previous research (Fall et al. 2004:24–25). In 2003, 358 residents of Cordova obtained SHARCs, 194 fished in either the subsistence or sport halibut fishery, and the total of 27,032 lb was about 47% of the average for previous project years (Table 11).
Based on these comparisons, the final report for 2003 suggested that the SHARC survey had underestimated the amount of halibut harvested by Cordova residents for home use, perhaps because not all subsistence fishers in Cordova obtained SHARCs in 2003. The results of the survey for 2004 supported this conclusion (Fall, George, and Easley 2005:25–26). A total of 526 Cordova residents obtained SHARCs by the end of 2004 (an increase of 47%) (Table 11), and 325 fished for halibut. The total estimate of 52,789 lb of halibut harvested noncommercially (in the subsistence and sport fisheries) was an increase of 95% over 2003, and was about 92% of the average for the 6 survey years prior to 2003 (and exceeded the total for 3 of those 6 years). Given that some Cordova residents likely obtained halibut for home use exclusively in the sport fishery and without obtaining SHARCs, the SHARC survey estimate for 2004 appeared consistent with earlier estimates of subsistence halibut harvests in Cordova.
22
DRAFT

Findings for Cordova for 2005 were much like those for 2004 and supported the conclusions of the 2004 final report.
Between 2006 and 2010, halibut harvest estimates for Cordova were lower than for 2004 and 2005, ranging between 36,047 lb in 2006 and 27,232 lb in 2009, and below that 6-year average from the pre-2003 household surveys. The reasons for this decline in harvests are uncertain. SHARC numbers held relatively steady between about 550 to 600, and the estimated number of halibut fishers ranged from 261 (in 2010) to 315 (in 2007). The estimated subsistence halibut harvest for Cordova for 2011 was 21,789 lb, the lowest for any of the first 9 study years (Table 11).
The estimated subsistence halibut harvest for Cordova for 2012 dropped to was 19,417 lb, the lowest for any of the 10 study years (Table 11). Of the 2012 subsistence harvest, 83% (16,105 lb) was harvested with setline gear and the remaining 17% (3,312 lb) with hand-operated gear. Sport harvests of halibut by Cordova SHARC holders in 2012 added 3,017 lb. The 2012 total noncommercial harvest of halibut by Cordova SHARC holders was 22,434 lb, down 10% from 2011 (24,818 lb) and, again, the lowest of any study year. The 2012 estimated harvest was 39% of the annual average for pre-2003 project years, and lower than any of those 6 study years (Table 15).
Fewer Cordova residents held SHARCs in 2012 (470) than in any year since 2003 (358) and fewer participated in the subsistence halibut fishery (202) than any year except 2003 (102) and 2011 (198). However, these declines in the number of Cordova SHARC holders and halibut fishers were minor in comparison with the relatively lower estimated harvest levels in 2012 (Table 11).
Port Graham (Regulatory Area 3A) Port Graham, which is located in Lower Cook Inlet, had a population of 177 in 2010, with 160 Alaska Natives (Table 1); the population was estimated at 168 in 2012. It is presented as a case example of the smaller, predominantly Alaska Native communities in regulatory areas 3A and 3B that depend heavily on subsistence harvests of fish and wildlife resources. The division has produced estimates of subsistence halibut harvests by Port Graham residents based on household surveys for 7 project years (Table 16). Excluding 1989, the year of the Exxon Valdez oil spill, Port Graham’s noncommercial halibut harvests ranged from 4,451 lb (net weight; ±14%) in 1993 to 11,232 lb (±14%) in 1992, with a 6-year average of 7,591 lb (net weight; Figure 32). Again excluding 1989, an estimated average of 38 Port Graham households had at least one member who subsistence fished for halibut in the project years in the late 1980s and 1990s.
In 2012, a total of 32 Port Graham residents held SHARCs (excluding Port Graham tribal members who do not live in Port Graham), a notable drop from all years since 2003; the previous low was 46 SHARCs in 2011. In 2012, an estimated 18 Port Graham residents participated in the subsistence halibut fishery, with 10 using setline gear and 11 hand-operated gear; 5 reported they went sport fishing for halibut. In comparison, in 2010 (when 47 SHARCs were held by residents of the community), an estimated 30 Port Graham residents participated in the subsistence halibut fishery, with 23 using setline gear and 18 hand-operated gear; 5 said they went sport fishing for halibut. Levels of participation in the subsistence halibut fishery at Port Graham in 2012 were lower than any previous study year except 2011 (range 15 subsistence halibut fishers in 2011 to 42 in 2004) (Table 11). The findings for the 2003–2010 SHARC surveys, except 2005, were consistent with levels of participation found in the noncommercial halibut fisheries during previous studies in Port Graham; thus the levels of participation estimated for 2011 and 2012 were unusually low.
The subsistence halibut harvest estimate for Port Graham in 2012 was 3,460 lb (Table 11). Of this, 1,677 lb (48%) were harvested with setline gear and 1,783 lb (52%) with hand-operated gear. In addition, Port Graham SHARC holders reported “sport” harvests of 44 lb, for a noncommercial total harvest of 3,503 lb of halibut. Harvests at Port Graham in 2012 were the lowest of any study year, and down 53% from 2010. The lowest previous harvest estimate was 3,638 lb in 2011, and the highest was 11,615 lb in 2005.
23
DRAFT
Total noncommercial halibut harvest estimates for Port Graham (subsistence plus sport harvests reported by SHARC holders) for 2003–2005 were similar to the highest estimate generated prior to the SHARC survey (11,232 lb in 1992) (Table 11; Table 16), and they also exceeded the average of previous (pre-2003) project years of 7,591 lb. This finding was not unexpected: Port Graham has traditionally used setlines with multiple hooks to harvest halibut as well as hand-operated gear (Stanek 1985:67–69, 151). With May 2003 regulations finally consistent with traditional harvest methods, residents of Port Graham and other communities with similar traditions could fish with setline gear and hand-operated gear, and thus their reported subsistence halibut harvests were probably similar to historical levels.26 However, estimated harvests have dropped since 2006 and, as noted, the estimate for 2012 was the lowest on record, less than half the pre-2003 average (Table 15; Figure 32). The reasons for the lower harvests in 2006–2012 compared to 2003–2005 are uncertain; a decline in the community’s population in the mid-2000s may be part of the explanation, although the population has been relatively stable in recent years.
Kodiak City and Road System (Regulatory Area 3A) “Kodiak” in this report includes the city of Kodiak and those portions of the Kodiak Island Borough connected to the city of Kodiak by road. This area had a population 12,824 in 2010, with 983 Alaska Natives; the estimated population in 2012 was 13,235 (Table 1). This is the largest rural community eligible to participate in the Alaska subsistence halibut fishery.
Based on Division of Subsistence household surveys, estimates of halibut harvests for home use are available in the CSIS for the entire Kodiak road system population for 1982 and 1991. Estimates for Kodiak city residents alone are available for 1992 and 1993, and these can be expanded to produce a total for the entire road system population (Table 17). Excluding fish removed from commercial catches for home use, noncommercial halibut harvests by Kodiak road system residents ranged from 247,283 lb (usable weight; ±30%) in 1991 to 511,254 lb (±33%) in 1993. The average for the 4 available project years was 366,682 lb; of this, 338,476 lb (92%) was taken with rod and reel, most likely consistent with sport fishing regulations. On average for the 4 project years, 1,306 Kodiak road system households had at least one member who fished for halibut for home use.
Kodiak residents held 1,503 SHARCs during 2012, down from 1,660 SHARCs during 2011; 1,702 SHARCs during 2010; and 1,826 in 2009 (Table 11). In 2012, an estimated 769 Kodiak SHARC holders subsistence fished for halibut; most (619; 80%) used set gear. Fewer Kodiak SHARC holders participated in the subsistence halibut fishery in 2012 than in any other study year except 2003 (646); the highest estimate was 963 participants in 2008.
In 2012, an estimated 499 Kodiak SHARC holders sport fished for halibut, and 967 fished for halibut under noncommercial rules. This compares to 2011, when 513 Kodiak SHARC holders sport fished for halibut and 1,009 were involved in noncommercial halibut fishing. Since 2003, the lowest estimate of participation in either the subsistence or sport halibut fishery was 858 in 2003 and the highest was 1,213 in 2008 (Table 11). Given the likelihood that many Kodiak residents continued to fish for halibut under sport fishing regulations in 2003–2012 without obtaining SHARCs, the estimated level of participation in the subsistence fishery based on the SHARC survey appears reasonable when compared to the earlier household survey results.
The estimated subsistence harvest of halibut in 2012 for Kodiak road system area residents was 125,820 lb, with 93,417 lb (74%) harvested with set line gear and 32,403 (26%) taken with hand-operated gear. The 2012 subsistence halibut harvest estimate was 9% lower than the estimate for 2011 of 138,348 lb, and
26 A cautionary note for Port Graham for 2005 concerns response rate. Only 16 of 52 SHARC holders responded to the 2005 survey (31%) (Fall, Koster, and Davis 2006:52). Further outreach in this community was necessary to improve the response rate and build confidence in the harvest estimates. This outreach occurred in 2007 for the 2006 project year, and a response rate of 66% was achieved.
24
DRAFT

was the lowest estimate for any of the 10 years of the project; the previous low was 138,348 lb in 2011 and the highest estimate was 210,828 lb in 2005 (Table 11).
In addition, Kodiak road system SHARC holders harvested an estimated 44,041 lb (net weight) of halibut in 2012 that they classified as sport caught, which was below the range of harvests in other years, from 45,725 in 2011 to 82,455 lb in 2005. In total, Kodiak SHARC holders harvested 169,861 lb (net weight) of halibut in 2012; this is lower than all previous study years, which ranged from 184,073 lb in 2011 to 293,283 lb in 2005 (Table 11). Not surprisingly, the totals for all 10 years of the SHARC survey are lower than those based on household surveys for previous years (except that the 2004, 2005, 2006, 2007, and 2008 SHARC survey estimates are higher than the household survey estimate for 1991) because, as noted, many Kodiak road system residents who fish for halibut likely do not obtain SHARCs and continue to harvest halibut under sport fishing rules. Overall, the 2003–2012 subsistence harvest estimates for Kodiak appear reasonable, but they should be further evaluated using ADF&G Division of Sport Fish Statewide Harvest Survey data and with additional years of subsistence harvest survey data. Also, reasons for the trend toward lower estimated harvests, especially during 2010–2012, need investigation.
Sand Point (Regulatory Area 3B) The population of Sand Point in 2010 was 976 with 417 Alaska Natives; the estimated population in 2012 was 983 (Table 1). The only estimate of halibut harvests for home use by Sand Point residents based on Division of Subsistence household surveys prior to 2003 is for 1992 (Fall et al. 1993), at 13,981 lb (net weight). Of this, 6,240 lb were removed from commercial harvests, 6,934 lb were taken with subsistence methods (setline or jigging with a hand-held line) and 807 lb were harvested with rod and reel. The total harvest with noncommercial methods was 7,741 lb. Of the 204 permanent households in the community, 122 harvested halibut for home use; 65 used “subsistence methods,” 16 fished with rod and reel, and the rest obtained halibut for home use from their commercial harvests.
At the end of 2003, 73 residents of Sand Point had obtained SHARCs. The estimated subsistence halibut harvest for 2003 was 4,819 lb (net weight), based on the SHARC survey. Of this, 3,409 lb were harvested with setline gear and 1,410 lb with hand-operated gear. Twenty-one Sand Point residents reported that they subsistence fished for halibut in 2003. In addition, 11 Sand Point SHARC holders reported that they harvested an estimated 410 lb of halibut while sport fishing, for a total estimated noncommercial harvest of 5,229 lb of halibut (Table 11). These were lower harvests and levels of participation than might be expected, considering the 1992 survey findings.
By December 31, 2004, 351 Sand Point residents had obtained SHARCs, a very substantial increase over 2003. The estimated total subsistence halibut harvest was 11,355 lb (net weight). Of this total, 4,360 lb were harvested with setline gear (38%) and 6,996 lb (61%) with hand-operated gear. In total, an estimated 109 Sand Point SHARC holders subsistence fished for halibut in 2004, about 5 times the estimate for 2003. Also, an estimated 50 Sand Point SHARC holders sport fished for halibut, with an estimated total harvest of 1,384 lb. In total, 121 Sand Point SHARC holders fished for halibut noncommercially in 2004 and had a total estimated harvest of 12,739 lb (net weight; Table 11). This is more than double the 2003 estimate, and similar to the total community estimate for 1992 (which included halibut removed from commercial harvests). It is likely that the higher estimate for 2004 does not indicate an increased harvest by Sand Point residents over 2003, but rather a more complete estimate due to much larger number of participants in the SHARC program.
From 2005 through 2008, between 321 (in 2005) and 365 (in 2006) Sand Point residents held SHARCs. Estimated harvests by SHARC holders in the subsistence and sport fisheries ranged between 23,182 lb (2005) and 27,649 lb (2007) (Table 11). The increase in the total halibut harvest, especially the increase in setline harvests (which ranged between 7,406 lb and 15,766 lb), suggested that Sand Point residents were increasingly participating in the opportunities provided by the federal subsistence halibut fishery.
25
DRAFT
The majority of SHARCs issued to Sand Point residents expired during 2008 and were not renewed. The number of active SHARCs during 2009 was 137, down 60% from the 342 active SHARCs in 2008. Correspondingly, based on survey responses, estimates of participation in the subsistence halibut fishery in Sand Point in 2009 and estimated harvests were down substantially from 2005–2008. During 2009, an estimated 70 Sand Point residents participated in the subsistence halibut fishery, compared to 130 in 2008. In 2009, 28 Sand Point fishers used setlines, compared to 71 in 2008. In total, the noncommercial halibut harvest estimate for Sand Point in 2009 was 14,424 lb, with 70 people involved in this harvest; this harvest was 55% of the annual average of the previous 4 years (Table 11).
The survey findings for Sand Point for 2010 illustrated the pattern first noted for 2009 of declining estimates of harvests and participation in the subsistence halibut fishery that may be the result of lowered rates of participation in the SHARC program. In 2010, the number of active SHARCs in Sand Point dropped to 130, the lowest since 2003. An estimated 61 SHARC holders participated in the subsistence fishery, again the lowest numbers since 2003. The total noncommercial halibut harvest for Sand Point in 2010 was 8,435 lb, again lower than any year but 2003.
In 2011, 136 Sand Point residents held SHARCs, consistent with totals since 2009. An estimated 85 SHARC holders participated in the subsistence fishery; 23 sport-fished for halibut, resulting in an estimate of 87 halibut fishers in 2011, higher than either 2009 or 2010 but notably lower than the peak years of 2004–2008. The total harvest estimate of 14,640 lb of halibut in 2011 was a substantial increase of 74% over 2010, but remained much lower than the range of 23,182 lb to 27,649 lb from 2005 to 2008.
In 2012, 136 Sand Point residents held SHARCs, again consistent with totals since 2009. An estimated 61 SHARC holders participated in the subsistence fishery; 32 sport-fished for halibut, resulting in an estimate of 75 halibut fishers in 2012, higher than either 2009 or 2010 but notably lower than the peak years of 2004–2008. The total harvest estimate of 6,989 lb of halibut in 2012 was a substantial decrease of 52% from 2011, and was the lowest estimate since 2003, the first year of the harvest monitoring program. Outreach in Sand Point is necessary to determine if subsistence halibut harvests have declined since 2008 or whether the lower estimates are solely the result of decreased participation in the SHARC program.
Unalaska–Dutch Harbor (Regulatory Area 4A)
The city of Unalaska (which includes Dutch Harbor) had a population of 4,376 in 2010, including 355 Alaska Natives; the estimated 2012 population was 4,768 (Table 1). The Division of Subsistence conducted a household harvest survey in Unalaska–Dutch Harbor for the 1994 data year and estimated that the total halibut harvest was 97,601 lb (net weight; 3,049 fish; ±34%), excluding 10,606 lb (331 fish) removed from commercial catches for home use. Of the 700 households in the community, an estimated 391 (56%) had at least one member who fished for halibut in 1994. Most of the noncommercial harvest, 88,142 lb (90%), was taken with rod and reel (CSIS).
By the close of 2003, only 92 residents of Unalaska and Dutch Harbor had obtained SHARCs (Table 11). Notably, only 14 members of the Qawalangin Tribe of Unalaska obtained SHARCs in 2003. These numbers increased in subsequent years, peaking at 176 Unalaska–Dutch Harbor SHARC holders in 2007, including 46 Qawalangin Tribe members. In 2012, the total was 141 SHARCs for all residents of Unalaska-Dutch Harbor and 27 Qawalangin Tribe members.
In 2012, an estimated 62 Unalaska–Dutch Harbor SHARC holders participated in the subsistence halibut fishery, an estimated 44 sport fished, and an estimated 83 participated in either fishery. These were generally lower levels of participation than previous study years except 2003 and 2011. For example, in 2010, an estimated 92 Unalaska–Dutch Harbor SHARC holders subsistence-fished for halibut, and 103 engaged in either the subsistence or sport fishery (Table 11).
In 2012, SHARC holders in Unalaska–Dutch Harbor harvested an estimated 10,059 lb of halibut in the subsistence fishery. Of this, 5,342 lb was harvested with set lines (53%) and 4,717 lb (47%) with hand-
26
DRAFT
operated gear. Additionally, they harvested 4,221 lb of halibut in the sport fishery, for a total noncommercial harvest of 14,280 lb (Table 11).
The 2012 harvest was similar to, but slightly lower than, harvest estimates from 2003, 2004, 2007, 2008, 2010, and 2011, which ranged between about 15,000 lb and 18,000 lb. However, the 2012 harvest estimate was 54% below the highest estimate for the community, 31,167 lb in 2009, and was the lowest estimate of any study year (Table 11).
The 2009 noncommercial halibut harvest by Unalaska–Dutch Harbor SHARC holders, by far the highest for the 9 study years, represents just 32% of the harvest estimate for 1994. Similarly, the 2012 estimate was 15% of the 1994 estimate. There are at least 5 explanations for these differences. First, actual noncommercial halibut harvests in Unalaska may have declined since 1994, although a decline of this magnitude is probably unlikely. Second, if many fishers are not obtaining SHARCs, the SHARC survey may have underestimated the subsistence halibut harvest. A third explanation is that the 1994 survey may have overestimated the halibut harvest. A fourth explanation is that many halibut fishers in Unalaska may prefer to harvest halibut under sport fishing regulations and therefore do not obtain SHARCs. A fifth possibility that may account for a decline in subsistence halibut harvests is a decline in stock abundance. The IPHC has noted a decline in abundance in Area 4A since 1994 (Gregg Williams, IPHC, personal communication, 2005). A combination of all 5 factors could be responsible for the unexpectedly low subsistence halibut harvest estimated for Unalaska from the SHARC surveys in all 10 study years. Further outreach in Unalaska is clearly appropriate, as well as additional research to better understand patterns of halibut fishing in the community.
Toksook Bay (Regulatory Area 4E) Toksook Bay had a population of 590 in 2010 and 638 in 2012 (Table 1). As discussed in Chapter 1, the number of valid SHARCs held by Toksook Bay residents dropped from 533 (approximating the community’s total population) in 2007 to 34 in 2008 and just 7 in 2012. Very few SHARCs that had been obtained in 2003 and that expired at the close of 2007 were renewed. The Division of Subsistence has not conducted a household harvest survey in this community. Wolfe (2002) estimated a subsistence halibut harvest of 12,600 lb (net weight; 16,800 lb round weight) for this community for 2000, based upon a 1986 per capita estimate for the neighboring community of Tununak. During SHARC project years from 2003–2007, Division of Subsistence staff, with the assistance of the Toksook Bay tribal government, evaluated the list of SHARC holders in the community, estimated the total number of subsistence halibut fishers, and conducted interviews with likely fishers. Based on the results of this collaboration with the tribal government, it is highly likely that most community residents who subsistence fished for halibut in 2003–2007 provided harvest data through the SHARC survey. Therefore, harvest estimates for Toksook Bay for 2003–2007 represent the harvests reported by respondents to the survey, and are not expanded to the total number of SHARC holders in the community. Project staff consider harvest data for these years to be reliable. In 2008–2012, however, no outreach or interviewing occurred in Toksook Bay. Of 34 SHARC holders in 2008, 11 (32%) responded to the mailed survey, as did 13 (39%) of 33 in 2009, 12 (38%) of 32 in 2010, and 13 (41%) of 32 in 2011. Of the 7 SHARC holders in 2012, 6 (86%) returned the survey. Unlike 2003–2007, returned survey data were expanded to estimate 2008–2012 halibut harvests in Toksook Bay.
The annual report for study year 2010 (Fall and Koster 2012:32–34) an overview of harvests and participation levels in the subsistence halibut fishery for Toksook Bay for 2003 through 2010, as well as U32 (under 32 inches in length) halibut retained for home use from commercial harvests by members of the Coastal Villages Regional Fund Community Development Quota (CDQ) group, the majority of which are landed at Toksook Bay. As summarized in Table 11, from 2003 through 2007, subsistence halibut harvests ranged widely, from 6,596 lb in 2004 to 36,481 lb in 2006. The number of subsistence halibut fishers in Toksook Bay ranged from 54 in 2003 to 113 in 2006. In all study years, hand-operated gear accounted for most of the harvest.
27
DRAFT

As noted above, the number of valid SHARCs for Toksook Bay dropped to 34 in 2008. Based on the SHARC survey returns (11 of 34; 32%), it is likely that many active halibut fishers in the community did not renew their SHARCs and therefore were not part of the SHARC survey, resulting in underestimates of participation in the fishery and in estimated harvests. For example, based on the survey results, just 9 Toksook Bay residents participated in the subsistence halibut fishery in 2008, compared to an average of 73 for the previous 5 years (range 54 to 113; Table 11). The estimated harvest was 2,143 lb in 2008, while the previous 5-year average was 18,074 lb (range 6,596 to 36,481 lb). Results for 2009 were similar to those of 2008 and results for 2010 and 2011continued trends observed for 2008 and 2009 (Table 11)
In 2012, only 7 SHARCs were active in Toksook Bay, again suggesting that many subsistence fishers are not participating in the program. Based on returned surveys (6 of 7; 86%), the estimated subsistence halibut harvest was 294 lb, with just 140 lb (48%) taken with hand-operated gear. This harvest was just 2% of the annual average from 2003–2007 (18,074 lb). The estimated number of subsistence halibut fishers in Toksook Bay in 2012 was 5, compared to 113 in 2006 and an average of 79 from 2003–2007.
In 2012, Toksook Bay obtained 43% of the U32 halibut retained by the Coastal Villages Regional Fund CDQ catch, about 4,482 lb (Williams 2013:68).
Without renewed registrations in the SHARC program and outreach in the community, it is unlikely that a mail survey alone will provide reliable harvest estimates for the subsistence halibut fishery in Toksook Bay in the future.
Tununak (Regulatory Area 4E) Tununak had a population of 327 in 2010, with 314 Alaska Natives; the population estimate was 354 in 2012 (Table 1). The Division of Subsistence conducted a comprehensive household harvest survey in Tununak in 1986, which provides the only estimate of subsistence halibut harvests for the community prior to the adoption of the 2003 subsistence regulations. The harvest estimate for 1986 was 1,532 fish and 30,643 lb (net [dressed] weight), with a 95% confidence limit of ±26%. The harvest per capita was 93 lb (net weight) (CSIS).
No residents of Tununak obtained SHARCs in 2003,27 and the Traditional Elders’ Council in Tununak did not approve Division of Subsistence plans to conduct interviews with potential subsistence halibut fishers for 2003. Therefore, there is no subsistence halibut harvest estimate for this community for 2003. By the close of 2004, however, 70 residents of Tununak had obtained SHARCs (Table 11). Because only 9 SHARC holders responded to the postal survey (13%), harvest estimates for Tununak for 2004 are based on a very low sample achievement. The estimated total subsistence halibut harvest was 1,954 lb (net weight) by 31 fishers, 878 lb harvested with setline gear and 1,076 lb with hand-operated gear. No Tununak SHARC holders reported sport fishing activity in any study year.
The tribal government supported Division of Subsistence interviewing of subsistence halibut fishers in Tununak for the 2005 project year (Fall, Koster, and Davis 2006:5). Thirty-three of 70 SHARC holders were interviewed (47%). As in Toksook Bay, reported harvests were not expanded for Tununak for the 2005 project year because most known halibut fishers were interviewed. The total subsistence harvest of halibut was 2,661 lb by 20 fishers. Most of the harvest (88%) was taken with hand-operated gear (Table 11).
In 2006, 70 Tununak residents held SHARCs. No interviewing took place in the community, but division staff attempted to contact SHARC holders by telephone. Sample achievement was low (10 of 70 SHARC holders; 14%). Based on this limited sample, the estimated subsistence halibut harvest at Tununak in 2006 was 4,032 lb by 33 subsistence fishers. Almost all of this harvest (3,808 lb; 94%) was with hand-operated gear (Table 11).
27 One tribal member obtained a SHARC, but this person was not a resident of Tununak.
28
DRAFT

In 2007, 69 Tununak residents held SHARCs for a part of the year. With the support of a short-term contract with the division, staff of the Tununak IRA council conducted interviews in their community in order to supplement SHARC survey data. The estimated subsistence harvest in Tununak in 2007 was 7,015 lb by 38 fishers. Most of this harvest (5,479 lb; 78%) was taken with hand-operated gear (Table 11).
In 2008, 68 Tununak residents held SHARCs. No outreach or supplemental interviewing took place in the community in 2008. The response rate to the mailed survey was 10% (7 of 68 SHARC holders). Estimated harvested based on this sample were by far the lowest of any project year up to that point: 2,143 lb, all with hand-operated gear by an estimated 8 fishers (Table 11). This was almost certainly a large underestimation of the subsistence harvest of halibut in Tununak in 2008.
Few of the SHARCs active in 2008 in Tununak were renewed and only 11 were active in 2009; 6 (55%) responded to the survey. An estimated 7 subsistence fishers harvested 488 lb of halibut in 2009, all with hand-operated gear (Table 11). Due to the very limited participation in the SHARC program and based on results from 2004–2007, it is highly likely that a reliable estimate of subsistence halibut harvests in Tununak was not obtained for 2009.
As in 2009, only 11 SHARCs were active in Tununak in 2010; 3 (27%) responded to the survey. An estimated 9 subsistence fishers harvested 576 lb of halibut in 2010, all with hand-operated gear (Table 11). Due to the very limited participation in the SHARC program and based on results from 2004–2007, it is highly likely that, as for 2009, a reliable estimate of subsistence halibut harvests in Tununak was not obtained for 2010.
Similarly, only 11 SHARCs were active in Tununak in 2011. An estimated 4 SHARC holders fished, for an estimated harvest of 84 lb, all with hand-operated gear. In 2012, 11 Tununak residents had SHARCs. An estimated 3 SHARC holders fished for halibut, with an estimated harvest of 173 lb, all with hand-operated gear (Table 11). As for 2008–2010, it is unlikely that study results for 2011 and 2012 provide a reliable estimate of subsistence halibut harvests in the community.
Also, compared to the results of the 1986 survey, the harvest estimates for Tununak for 2004 through 2007 appear low. The reasons for this difference are uncertain. As just noted, the low response to the mailed SHARC survey plus a lack of outreach or follow-up interviews likely resulted in a large underestimation of the 2008–2012 harvests. Several additional years of harvest data collection plus renewed outreach and community support will be necessary to adequately document subsistence halibut harvest trends in this community.
COMPARISONS WITH NONSUBSISTENCE REMOVALS IN 2012 As reported in Table 18, the preliminary estimated total halibut removal in Alaskan waters in 2012 was 42,491,178 lb (net weight) based on data compiled by the IPHC (International Pacific Halibut Commission 2012; Williams 2013) and this project. In this total, the removal of 20,187 lb of U32 (under 32 inches in length) halibut for personal use by CDQ organizations in Area 4D and Area 4E has been added to the subsistence harvest category. Commercial harvests accounted for 59.9% of halibut removals in Alaska in 2012 (Figure 33).28 Bycatch mortality of halibut in various other commercial fisheries ranked second, with 22.5% of the statewide removals. Sport harvests ranked third, with 12.6%. Wastage in the commercial halibut fishery added 3.3% to the total halibut removals. Finally, the subsistence fishery accounted for 1.7% of the total removals of halibut in Alaska waters in 2012.
Halibut harvests by fishery in 2012 at the regulatory area level did not differ substantially from the statewide pattern (Table 18; Figure 34). In all regulatory areas, commercial harvests accounted for 47% or
28 The commercial harvest category includes 605,000 lb of halibut harvested in the IPHC research program, which represents about 2.4% of the category, and 1.4% of halibut removals in Alaska in 2012 (International Pacific Halibut Commission 2013a).
29
DRAFT

more of the total pounds net weight of halibut removals. In Area 2C (Southeast Alaska) and Area 3A (Southcentral Alaska), sport fisheries took 30.7% and 21.0%, respectively, of the halibut harvest in 2012; however, sport fisheries were just 0.2% of the total harvest in Area 3B (compared to 0.2% for the subsistence harvest) and in Area 4 just 0.1%, compared to subsistence harvests of 0.3%. Commercial bycatch accounted for 50.5% of halibut removals in Area 4. As a percentage of the total removal, subsistence halibut harvests were largest in Area 2C at 8.6% of the total (although they were 28% of the sport harvest and about 15% of the commercial harvest) and in Area 3A at 1.4%.
30
DRAFT

CHAPTER 4: CONCLUSIONS AND RECOMMENDATIONS SUMMARY AND CONCLUSIONS New federal regulations governing subsistence halibut fishing in Alaska went into effect in May 2003. The 2012 calendar year was the tenth for which a program was implemented to estimate the subsistence harvest of halibut under these regulations. Based upon survey return rates, the program was a success. Of 9,944 SHARC holders, 7,054 (71%) voluntarily provided information about their subsistence halibut fishing activities in 2012 by responding to the survey. This was the highest response rate for any year of the program, which ranged from 58% in 2007 to 68% in 2011.
However, in 2012, the number of valid SHARCs (9,944) dropped 11% from 2011, and was 22% lower than the 9-year average from 2003–2011 (Table 19). Nonrenewed SHARCs account for most of this decline. The largest portion of this decline in the number of SHARC holders was in the tribal segment: 3,425 SHARCs in 2012 compared to 7,446 in 2007, a decline of 54%. Tribal SHARCs are valid for 4 years, so those issued in 2003, the first year of the new fishery, expired in 2007. In comparison, the number of nontribal SHARC holders dropped 5% from 2007 (7,601 SHARCs) to 2008 (7,249 SHARCs), increased to 7,724 in 2009, and decreased to 7,047 in 2010, 7,010 in 2011, and 6,519 in 2012, a decline of 14% since 2007. Nontribal SHARCs are valid for 2 years, so, in contrast to the tribal SHARC group, there have been several rounds of expirations and renewals since 2003. The next section of the report discusses SHARC expiration and renewal patterns and identifies some implications of these patterns for future harvest estimates.
Based on the survey returns, an estimated 4,394 individuals participated in the Alaska subsistence halibut fishery in 2012. This is the lowest estimate since the new regulations came into effect in 2003, and is 19% lower than the 9-year average from 2003–2011. The estimated subsistence harvest of halibut in Alaska in 2012 is 37,093 fish and 686,991 lb (±2.9%). As measured in pounds, the 2012 subsistence halibut harvest was the lowest of any study year and 30% lower than the 9-year average from 2003–2011 (Table 19). The total estimated harvests for 2003–2012 are below the 1.5 million net pounds estimated for the Alaska subsistence halibut harvest when the current regulations were developed by the North Pacific Fishery Management Council (see http://www.fakr.noaa.gov/frules/70fr16742.pdf, page 16748; North Pacific Fishery Management Council 2003). The larger estimated harvest in 2004 compared to 2003 most likely corresponded to the greater number of individuals who held SHARCs through December 2004 and a proportional increase in the number of individuals who subsistence fished for halibut. The leveling off and slight decline in the harvests in 2006 and 2005, compared to 2004, are consistent with the leveling-off of the number of individuals who held SHARCs for at least a portion of these years. However, harvests as estimated in pounds dropped in 2007 despite an increase in individuals who held a SHARC for at least part of the year. In 2008, estimated harvests dropped by 14% and the number of SHARC holders dropped by 23%; in 2009, the number of SHARC holders rose slightly (1.5%) while the harvest dropped by 0.1%; in 2010 both the number of SHARC holders and the harvest dropped by about 7% compared to the previous year. Study year 2011 continued the trend of lower harvests begun in 2004, and was 12% below the estimated harvest for 2010 despite a 2% increase in the number of SHARC holders. In 2012, the number of SHARCs dropped 11% while the estimated harvest declined 2%.
Average harvests per fisher in the subsistence halibut fishery in 2012 at 8.4 fish and 156 lb rose slightly from the 8.1 fish and 148 lb estimated for 2011 (the lowest over the 10 years of the project). The average harvest per fisher in pounds was 13% below the average of the previous 9 years, during which on average subsistence fishers harvested between 148 lb (in 2011) and 211 lb (in 2003) (Table 19).
Over the 10 project years, the average weight of subsistence-caught halibut declined from 23.7 lb in 2003 to 18.2 lb in 2008 (a decline of 23%), rose slightly to 19.0 lb in 2009, and then leveled off at 18.4 lb per
31
DRAFT

fish in 2010, 18.3 lb in 2011, and 18.5 lb in 2012 (Table 19). The average weight of a subsistence-caught halibut dropped 8% from 2003 to 2012.
After 10 years of the harvest assessment program, it appears likely that the overall larger statewide harvest estimates in 2004, 2005, and 2006, compared to 2003, were, at least in part, a consequence of increased participation of subsistence fishers in the SHARC program after 2003 and, perhaps, an increase in trust on the part of subsistence fishers in the survey. The lower harvest estimates for 2008–2012 may in part be a consequence of reduced participation in the SHARC program, especially among eligible tribal members and especially in Area 4. As the community case studies demonstrate, however, a number of factors appear to have caused the differences in harvest estimates over the 10 project years, and these differ by community. Some were methodological (St. Paul, for example), while other factors were probably linked to more thorough and accurate documentation of harvests (Cordova and Sand Point, for example), for some study years at least, rather than a true increase. On the other hand, decreases in subsistence halibut harvests in Area 2C appear to reflect declining success in harvests, with declines in Sitka (down 55% from 2003 to 2012) particularly notable. (See below for additional discussion of changes in harvest estimates.)
In 2012, most subsistence halibut were harvested with setline (stationary) gear (78%) and the rest with hand-operated gear (22%) (Figure 23). The portion of the subsistence halibut harvested with set lines has ranged since 2003 from 69% in 2007 to 77% in 2010 and 2011 and 78% in 2012.
The largest portion of the Alaska subsistence halibut harvest in 2012 occurred in Regulatory Area 2C (Southeast Alaska), at 58% (396,043 lb), followed by Area 3A (Southcentral Alaska) at 37% (253,516 lb), Area 3B (Alaska Peninsula) at 2% (15,959 lb), Area 4A (Eastern Aleutian Islands) at 1% (9,543 lb), Area 4E (East Bering Sea Coast) at 1% (8,384 lb), Area 4B (Western Aleutian Islands) at less than 1% (1,698 lb), Area 4C (Pribilof Islands) less than 1% (1,176 lb), and Area 4D (Central Bering Sea) at less than 1% (672 lb) (Table 6; Figure 14). In 2003–2011, Area 2C (Southeast Alaska) and Area 3A (Southcentral Alaska) also accounted for most of the subsistence harvests.
The proportion of the statewide subsistence halibut harvest occurring in Area 2C (Southeast Alaska) ranged from 60% in 2003, 58% in 2012, and 57% in 2004, to between 51% and 55% from 2005 through 2011. The portion occurring in Area 3A (Southcentral Alaska) ranged from 27% in 2003 to between 34% and 39% from 2004 through 2012. Subsistence harvests accounted for 1.7% of the total halibut removals in Alaska waters in 2012, compared to between 1.2% (in 2009) and 1.5% (in 2004, 2005, and 2006).
Subsistence halibut fishers had an estimated incidental harvest of 9,568 rockfish in 2012. This was the lowest estimate of any study year and a decrease of 34% compared to the 9-year average from 2003–2011 (Table 19). There were 1,161 SHARC holders who harvested rockfish while subsistence halibut fishing in 2012, compared to a range since 2003 of 1,220 (in 2011) to 1,616 (in 2004). Most of the incidental rockfish harvests in 2012 occurred in Area 2C (73%), similar to all previous study years.
In 2012, subsistence halibut fishers harvested an estimated 2,247 lingcod in the subsistence halibut fishery. This was the lowest estimate of any study year and 30% below the 9-year average from 2003–2011. In total, 696 SHARC holders harvested lingcod while subsistence halibut fishing in 2012; this number has ranged in previous study years from 699 in 2003 to 959 in 2007. As with rockfish, most of the incidental lingcod harvests took place in Area 2C in 2012 (68%), similar to all previous study years.
As discussed above, although comparisons of the 2003–2012 harvest estimates with those from previous research by the Division of Subsistence are complicated by different research methods, such comparisons may still be instructive. Subsistence harvest estimates for most of the larger communities (combining tribal and rural SHARC holders) such as Sitka, Petersburg, and Kodiak for the first several years of the SHARC surveys were not markedly different from range of earlier estimates based on household surveys. This is significant in that these communities account for a very large percentage of the total harvest. On the other hand, registration in the SHARC program and survey response rates have declined in several
32
DRAFT

key halibut-fishing communities in Area 4, perhaps resulting in underestimated subsistence harvests for that regulatory area. Declining numbers of SHARCs issued in the other regulatory areas also raise questions about trends in participation in the SHARC program, including the survey. We conclude, however, that the 10 years of the survey of SHARC holders produced sound estimates of subsistence harvests of halibut in Alaska based on a scientific sample and a relatively high response rate in Areas 2C and 3A, where approximately 90% of the subsistence halibut fishing in the state occurs. Future documentation of the subsistence harvests will be necessary for any meaningful discussion of long-term trends in the fishery.
SHARC EXPIRATION AND RENEWAL PATTERNS, 2003–201229 Since the current federal subsistence halibut regulations came into effect in 2003 through 2012, 21,835 individuals had obtained SHARCs.30 SHARCs must be renewed periodically: rural SHARCs every 2 years and tribal SHARCs every 4 years. Continuing participation in the SHARC program by subsistence halibut fishers is essential for achieving reliable harvest estimates.
Of the 21,835 SHARC holders, 11,865 (54%) did not have valid SHARCs for 2012 (classified as “did not renew” in this analysis), including 60% of tribal SHARC holders and 51% of rural SHARC holders (Figure 35). The remaining 9,970 SHARCs were active in 201231 (46% of all SHARCs ever issued), either being renewed one or more times or not yet being subject to renewal. This includes 3,430 tribal SHARCs (40% of all tribal SHARCs that have been issued) and 6,540 rural SHARCs (49%) (Table 20).
SHARC holders who did not renew their SHARCs were more likely than currently (in 2012) active SHARC holders to have never responded to the harvest survey or to never have participated in the subsistence halibut fishery (Table 20; Figure 36). Of all SHARC holders, 24% of nonrenewals had never responded to the survey, compared to 9% of currently active SHARC holders. Additionally, 26% of expired SHARCs had not been fished; 8% of active SHARC holders have never fished. This pattern exists within each SHARC type as well. Of tribal SHARC holders, 26% who did not renew their SHARC never responded to the survey, compared to 14% of currently active tribal SHARC holders. Also, 37% of expired tribal SHARCs never were fished, compared to 15% of active tribal SHARCs. Of all rural SHARC holders whose SHARCs expired, 22% never responded to the survey and 18% did not fish. Of active rural SHARCs, 7% have not responded to the survey and 5% have never fished.
This finding suggests that over time, the set of active SHARC holders has become more likely to include individuals who will respond to the survey and participate in the subsistence halibut fishery. The trend is more pronounced for tribal SHARC holders, most likely because, as discussed above, this group initially included a large percentage of young tribal members and elders who did not actively participate in the fishery.
However, 49% of expired SHARCs were held by individuals who had participated in the subsistence halibut fishery, including 37% of expired tribal SHARCs and 60% of expired rural SHARCs (Table 20). Of all SHARC holders that reported some subsistence fishing activity, 42% did not renew their SHARC, including 44% of tribal SHARC holders who fished and 41% of rural SHARC holders who fished (Figure 35). The reasons why subsistence halibut fishers did not renew their SHARCs are unknown. If a substantial number of these individuals have continued to participate in the subsistence halibut fishery without renewing their SHARC, an underestimate of future subsistence halibut harvests will result.
29 The following is an update of the analysis that was summarized in the report for study year 2009 (Fall and Koster 2011:35–36), which was based on SHARC renewal patterns for 2003–2009.
30 This total includes individual SHARC holders only; it does not include educational, ceremonial, or community permits. 31 This total includes 26 SHARC holders who passed away in 2012 and are not included in the total of 9,944 SHARCs used to
develop harvest estimates in this report.
33
DRAFT
There were 37 tribes with 12 or more individuals who obtained SHARCs from 2003 through 2012 that had SHARC renewal rates of less than 50%. In total, 5,531 members of these tribes obtained SHARCs, 65% of all tribal SHARC holders, and 3,819 of these SHARCs (69%) were not renewed, which is 75% of all nonrenewed tribal SHARCs. Of the 2,612 members of these tribes who held SHARCs and participated in the subsistence halibut fishery, 52% did not renew their SHARCs. Nonrenewal rates for subsistence fishers among this group of tribes ranged from 31% to 100%. This finding suggests a trend in at least some tribes of subsistence fishers dropping out of the SHARC program, which may result in an underestimate of the subsistence halibut harvest in the future.
In summary, this analysis of renewal patterns for SHARC holders from 2003 through 2012 suggests 2 trends that may have opposite effects on subsistence halibut harvest estimates. First, it appears that individuals who did not respond to the survey or did not participate in the fishery were less likely than those who fished to renew their SHARCs. Thus nonfishers may have been overrepresented in the first several years of the harvest survey, and been overrepresented in the nonrespondent group. If so, harvests for the early years of the program may have been overestimated. Second, it appears that a notable portion of SHARC holders who participated in the subsistence fishery have not renewed their SHARCs. If these individuals have continued to fish for halibut for subsistence use, future estimates of subsistence halibut harvests will be too low, because they are based solely on responses to the survey that is mailed to SHARC holders.
PATTERNS OF CHANGE IN HALIBUT REMOVALS, 2003-2012 As noted, subsistence harvests of halibut in Alaska in 2012 were 30% lower than the previous 9-year average, a decline that exceeded the 22% drop in SHARCs issued and the 19% drop in the estimated number of subsistence halibut fishers (Table 19). In comparison, commercial harvests of halibut in Alaska were 50% lower in 2012 than the average from 2003–2011, sport harvests were 31% lower, and total removals (which also include wastage and bycatch in commercial fisheries) were 42% lower (Table 21; Figure 37). From 2003 to 2012, the Alaska subsistence harvest declined at an annual rate of -3.4%, compared to -5.8% average annual decline in the commercial fishery, -3.0% in the sport fishery, and -4.9% for total halibut removals (Table 21). Also, population estimates for Pacific halibut over the entire range, as estimated in net pounds, indicate a decline of 19% in biomass (average annual rate of decline of -2.9%) and a decline of 29% in exploitable biomass32 (average annual rate of decline of -5.3%) in 2012 compared to the previous 9-year average (Table 22), a result “of decreasing size-at-age, as well as relatively poor recruitment strengths” (Stewart et al. 2012:101). Thus the declines in Alaska subsistence halibut harvests documented by the survey of SHARC holders reflect lower harvests in other halibut fisheries in Alaska as well as declines in biomass and size at age in halibut stocks over the same time period.
Although drops in subsistence halibut harvests in Alaska correspond to declines in the stock and other halibut fisheries, as noted earlier, changes in subsistence harvest levels, especially at the regulatory area and community level, likely have complex causes. In this regard, a comparison of harvest and participation patterns in the subsistence halibut fisheries in Area 2C (Southeast Alaska) and Area 4 (Western Alaska) is instructive. As noted in the previous section, 54% of the SHARCs issued for the Alaska subsistence halibut fishery from 2003–2012 had expired (were not renewed) by 2012 (Figure 35). Renewal rates in Area 4 were much lower. During this 10-year period, 2,093 members of eligible tribes and rural communities in Area 4 held SHARCs. Of these, 1,737 (83%) had expired by the end of 2012, and 356 (17%) were active. Of the 1,026 SHARC holders from Area 4 who are known to have fished (had returned a survey indicating an attempt to harvest), only 27% (274) held valid SHARCs in 2012; 73% (752) had expired. This compares to 42% of all SHARC holders who fished (Figure 38). Subsistence
32 “Exploitable biomass” or “Ebio” is “the fraction of the total biomass exploited by the directed fisheries and for which the harvest policy is defined” (International Pacific Halibut Commission 2013b:6).
34
DRAFT
halibut harvests in Area 4 in 2012 were down 70% compared to the previous 9-year average, and declined at an annual rate of -8.0% over the 10-year period, compared to -3.4% for the Alaska subsistence fishery overall. Similarly, the estimated number of subsistence halibut fishers in Area 4 declined at a much higher rate, -7.4%, compared to all the regulatory areas of Alaska combined, -1.1% (Table 23). In summary, while halibut populations have declined, subsistence harvests in Area 4 account for only 0.3% of total removals, suggesting that drops in subsistence harvest estimates in Area 4 are more likely a result of declines in participation in the SHARC program by fishers than solely the result of decreased fishing effort or success.
Patterns in Area 2C exhibit some contrasts to those of Area 4. In total, 12,880 SHARCs were held by tribes and rural communities of Area 2C from 2003–2012. Of these 50% (6,452) had expired and 50% (6,428) were valid in 2012, slightly higher rates of renewal than in Alaska overall and much higher than Area 4 (Figure 38). Of the 8,549 SHARC holders from Area 2C that had indicated fishing, 63% (5,346) held valid SHARCs in 2012 and 37% (3,203) had expired. Again, renewal rates exceeded those of all Alaska SHARC holders and SHARC holders from Area 4. Subsistence harvests in Area 2C in 2012 were 25% lower than the previous 9-year average for that area, lower than the 30% decline for Alaska and the 70% decline for Area 4. The subsistence halibut harvest in Area 2C declined by an average annual rate of -3.7% from 2003–2012, compared to -3.4% for Alaska and -8.0% for Area 4. Also, the estimated number of subsistence halibut fishers in Area 2C dropped at a lower rate of -1.2% from 2003–2012 than either SHARCs (-1.3%) or harvests (-3.7%) (Table 22). Given that subsistence harvests represented 8.6% of halibut removals in Area 2C in 2012 (more than any other regulatory area), lower abundance of halibut and smaller halibut may account for more of the decline in estimated harvests in this area than a drop in participation in the SHARC program, in contrast to Area 4. Clearly, however, until additional research is undertaken, the reasons for lower harvest estimates in the Alaska subsistence halibut fishery will remain uncertain.
RECOMMENDATIONS As noted in Chapter 1, 2012 marked the tenth consecutive year of documentation of the subsistence halibut harvests in Alaska, but due to budget constraints, the project will not continue for the 2013 harvest year. We conclude this report with the following recommendations for potential future research based on experiences during the 10 years of this project.
1. The estimates of subsistence halibut harvests in Alaska documented by this program should be updated in the future. As discussed, these harvest estimates declined over the 10-year monitoring program, but the reasons for the lower estimates are likely complex and have not been explored thoroughly. For example, the number of valid SHARCs has declined, and analysis suggests that a significant number of subsistence halibut fishers may have not renewed their SHARCs. This may have resulted in underestimated harvests in the later years of the program in some communities, but may also be evidence that fewer people are participating in the fishery. Declines in the harvestable surplus of halibut leading to lower catch rates is an additional possible explanation for lower harvests.
2. Over the 10 years of the project, 77,363 SHARC surveys were returned. Analysis of this database could reveal patterns in renewals, participation in the fishery, and harvest levels that could be applied to future harvest monitoring efforts. Linked to this analysis could be a systematic survey of a sample of SHARC holders and harvest survey respondents to explore topics such as reasons for renewing or not renewing SHARCs, factors affecting participation in the fishery, and factors influencing harvest rates.
3. Linked to this quantitative analysis, ethnographic investigations should take place in a sample of key halibut fishing communities to evaluate the effects of the new subsistence fishing regulations on fishing patterns as well as patterns of involvement during the first 10 years that the regulations were in effect. These studies would entail more detailed interviewing of
35
DRAFT
fishers regarding changes in gear choice, fishing effort, harvest amounts, or other fishing activities that have resulted from the regulatory changes, as well as reasons for renewing or not renewing SHARCs. These interviews could also investigate traditional and local knowledge about halibut stocks that might prove useful to agencies, communities, and tribes for future management of the subsistence, sport, and commercial halibut fisheries in Alaska. In addition, participant observation of subsistence halibut fishing could provide important information about the fishery. Findings of these ethnographic investigations should be applied to assist in designing future harvest monitoring programs for the fishery.
4. A recommendation in the final report for the third year of the program was that “implementation of a program to collect harvest data in season in selected communities should be considered on a trial basis to help supplement and evaluate the data collected through the postal survey” (Fall, Koster, and Davis 2006:37). The Division of Subsistence conducted an in-season harvest monitoring project for the subsistence halibut fishery in Sitka and Kodiak in 2006 with funding provided by NMFS. Findings were presented in Special Publication No. 2009-06 (Fall, Koster, and Turek 2009:37). Consideration should be given in the future to in-season monitoring programs in other communities as a method to compare harvest estimates with those from mailed surveys.
5. Further evaluation of several years of sport fishing harvest data achieved through the postal Statewide Harvest Survey administered by the Division of Sport Fish could take place for the larger rural communities participating in the subsistence halibut fishery. (Analysis of these data for Sitka was conducted as a pilot effort for 2004. See Fall, George, and Easley [2005:22–24].) As discussed in Chapter 2 and Chapter 3, many SHARC holders also reported that they sport fished for halibut in 2003–2012. It would be instructive to learn if a shift in harvest from the “sport” category to the “subsistence” category, or in the other direction from subsistence to sport, has occurred, in order to evaluate trends in the subsistence fishery and the effect of the new subsistence halibut regulations on fishing patterns.
6. Even without harvest monitoring, additional or renewed outreach is needed in a number of communities with historically high subsistence harvests of halibut but low or declining numbers of SHARCs issued. Contracts with tribal governments could facilitate this outreach.
7. In summary, the results of a quantitative analysis of the 10 years of survey data, systematic interviews, ethnographic research, and in-season harvest monitoring should be evaluated to design a sustainable harvest monitoring program for the Alaska subsistence halibut fishery consistent with available long-term funding. Such a program could be based on a postal survey linked with other data gathering methods in selected communities or regulatory areas, such as face-to-face interviews, calendars, or limited in-season monitoring. Outreach about the subsistence halibut regulations, including the requirement to obtain a SHARC, should be part of any future harvest monitoring program.
36
DRAFT
REFERENCES CITED Alaska Department of Labor and Workforce Development 2011 2010 Census Demographic Profiles. Juneau: Alaska Department of Labor and Workforce Development, Research and Analysis Section. http://live.laborstats.alaska.gov/cen/dparea.cfm. 2013 Alaska Population Estimates by Borough, Census Area, City and Census Designated Place (CDP), 2010-2012. Alaska Department of Labor and Workforce Development, Research and Analysis Section. http://laborstats.alaska.gov/pop/popest.htm. Cochran, William G. 1977 Sampling Techniques. 3rd edition. New York: John Wiley & Sons. Crapo, Chuck, Brian Paust, and Jerry Babbitt 1993 Recoveries and Yields from Pacific Fish and Shellfish. Fairbanks: Marine advisory bulletin #37. University of Alaska Fairbanks Alaska Sea Grant College Program. Fall, James A., David B. Andersen, Louis Brown, et al. 1993 Noncommercial Harvests and Uses of Wild Resources in Sand Point, Alaska, 1992. Juneau: Alaska Department of Fish and Game, Division of Subsistence, Technical Paper No. 226. http://www.subsistence.adfg.state.ak.us/techpap/tp226.pdf. Fall, James A., Mykel George, and Bridget Easley 2005 Subsistence Harvests of Pacific Halibut in Alaska, 2004. Alaska Department of Fish and Game, Division of Subsistence, Technical Paper No. 304. Fall, James A., Madel Kerlin, Bridget Easley, and Robert J. Walker 2004 Subsistence Harvests of Pacific Halibut in Alaska, 2003. Juneau: Alaska Department of Fish and Game, Division of Subsistence, Technical Paper No. 288. Fall, James A., David Koster, and Brian Davis 2006 Subsistence Harvests of Pacific Halibut in Alaska, 2005. Alaska Department of Fish and Game, Division of Subsistence, Technical Paper No. 320. Fall, James A., and David S. Koster 2008 Subsistence Harvests of Pacific Halibut in Alaska, 2007. Anchorage: Alaska Department of Fish and Game, Division of Subsistence, Technical Paper No. 342. 2010 Subsistence Harvests of Pacific Halibut in Alaska, 2008. Anchorage: Alaska Department of Fish and Game, Division of Subsistence, Technical Paper No. 348. 2011 Subsistence Harvests of Pacific Halibut in Alaska, 2009. Anchorage: Alaska Department of Fish and Game, Division of Subsistence, Technical Paper No. 357. 2012 Subsistence Harvests of Pacific Halibut in Alaska, 2010. Anchorage: Alaska Department of Fish and Game, Division of Subsistence, Technical Paper No. 367. 2013 Subsistence Harvests of Pacific Halibut in Alaska, 2011. Anchorage: Alaska Department of Fish and Game, Division of Subsistence, Technical Paper No. 378. Fall, James A., David S. Koster, and Michael Turek 2007 Subsistence Harvests of Pacific Halibut in Alaska, 2006. Juneau: Alaska Department of Fish and Game, Division of Subsistence, Technical Paper No. 333. Fall, James A., David Koster, and Michael Turek 2009 Estimates of Subsistence Harvests of Pacific Halibut in Kodiak and Sitka, Alaska, 2006. Anchorage: Alaska Department of Fish and Game, Division of Subsistence, Special Publication No. 2009-06. Gilroy, Heather L. 2005 The Pacific Halibut Fishery, 2004. Victoria, British Columbia: Pages 5–18 in the proceedings of the
37
DRAFT

International Pacific Halibut Commission Eighty-First Annual Meeting, January 17–21, 2005. International Pacific Halibut Commission. http://www.iphc.washington.edu/halcom/pubs/annmeet/2005/bluebook/Bluebook2005.pdf. 2013 The Pacific Halibut Fishery, 2012. In International Pacific Halibut Commission Eighty-ninth Annual Meeting Handout Pp. 9–27. Seattle, WA: International Pacific Halibut Commission. http://www.iphc.int/publications/bluebooks/IPHC_bluebook_2013.pdf. International Pacific Halibut Commission 2012 International Pacific Halibut Commission Annual Report 2011. Seattle, WA: Prepared by Eric Chastain and Internation Pacific Halibut Commission. http://www.iphc.int/publications/annual/ar2011.pdf. 2013a 2012 Sector Removals by Regulatory Area. International Pacific Halibut Commission. http://www.iphc.int/commercial/catch-data/350-sector-removals2012.html. 2013b Internal Pacific Halibut Commission Eighty-ninth Annual Meeting Handout. International Pacific Halibut Commission. http://www.iphc.int/publications/bluebooks/IPHC_bluebook_2013.pdf. National Marine Fisheries Service 2000 Environmental Assessment/regulatory Impact Review/initial Regulatory Flexibility Analysis for a Regulatory Amendment for Defining a Halibut Subsistence Fishery Category (EA/RIR/RFA). Anchorage: North Pacific Fishery Management Council, Alaska Department of Fish and Game, International Pacific Halibut Commission, and National Marine Fisheries Service. North Pacific Fishery Management Council 2003 Environmental Assessment and Regulatory Impact Review for a Regulatory Amendment to Define a Halibut Subsistence Fishery Category in Convention Waters. Anchorage: National Marine Fisheries Service, Juneau and the North Pacific Fishery Management Council. http://www.fakr.noaa.gov/analyses/subsistence/halibut0403.pdf. Scott, Cheryl, Louis B. Brown, Gretchen B. Jennings, and Charles Utermohle Unpublished Community Profile Database, 2001, for Microsoft Access. Version 3.12. Juneau: Alaska Department of Fish and Game, Division of Subsistence. Stanek, Ronald T. 1985 Patterns of Wild Resource Use in English Bay and Port Graham, Alaska. Technical paper, 104. Anchorage: Alaska Department of Fish and Game, Division of Subsistence. http://www.adfg.alaska.gov/techpap/tp104.pdf, accessed December 11, 2012. Stewart, Ian J., Bruce M. Leaman, Steven Martell, and Raymond A. Webster 2012 Assessment of the Pacific Halibut Stock at the End of 2012. In IPHC Report of Assessment and Research Activities, 2011 Pp. 93–186. Seattle, WA: International Pacific Halibut Commission. Trumble, Robert J. n.d. 1998 Estimates of Personal Use Halibut. In Report of Assessment and Research Activities 1998 Pp. 61–64. Seattle, WA: International Pacific Halibut Commission. U.S. Census Bureau 2001 Profiles of General Demographic Characteristics, Alaska: 2000. Washington, D.C.: U.S. Department of Commerce. 2011 2010 Census. Washington, D.C.: U.S. Census Bureau. http://factfinder2.census.gov/faces/nav/jsf/pages/index.xhtml. Williams, Gregg H. 2011 Retention of U32 Halibut in the 2010 Area 4D/4E CDQ Fishery. In IPHC Report of Assessment and Research Activities, 2010 Pp. 63–66. Seattle, WA: International Pacific Halibut Commission. http://www.iphc.washington.edu/publications/rara/2010/2010.63.RetentionofU32halibutinthe2010Area4D_4ECDQfishery.pdf.
38
DRAFT

2013 Retention of U32 Halibut in the 2012 Area 4D/4E CDQ Fishery. In International Pacific Halibut Commission Report of Assessment and Research Activities 2012 Pp. 67–69. Seattle, WA: International Pacific Halibut Commission. Wolfe, Robert J. 2001 Subsistence Halibut Fishing in Alaska–harvest Patterns. Presentation to the Alaska Board of Fisheries. May 2001 (RC 8).Alaska Department of Fish and Game, Division of Subsistence. 2002 Subsistence Halibut Harvest Assessment Methodologies. San Marcos, CA: Report prepared for the National Marine Fisheries Service, Sustainable Fisheries Division, Robert J. Wolfe and Associates.
39
DRAFT
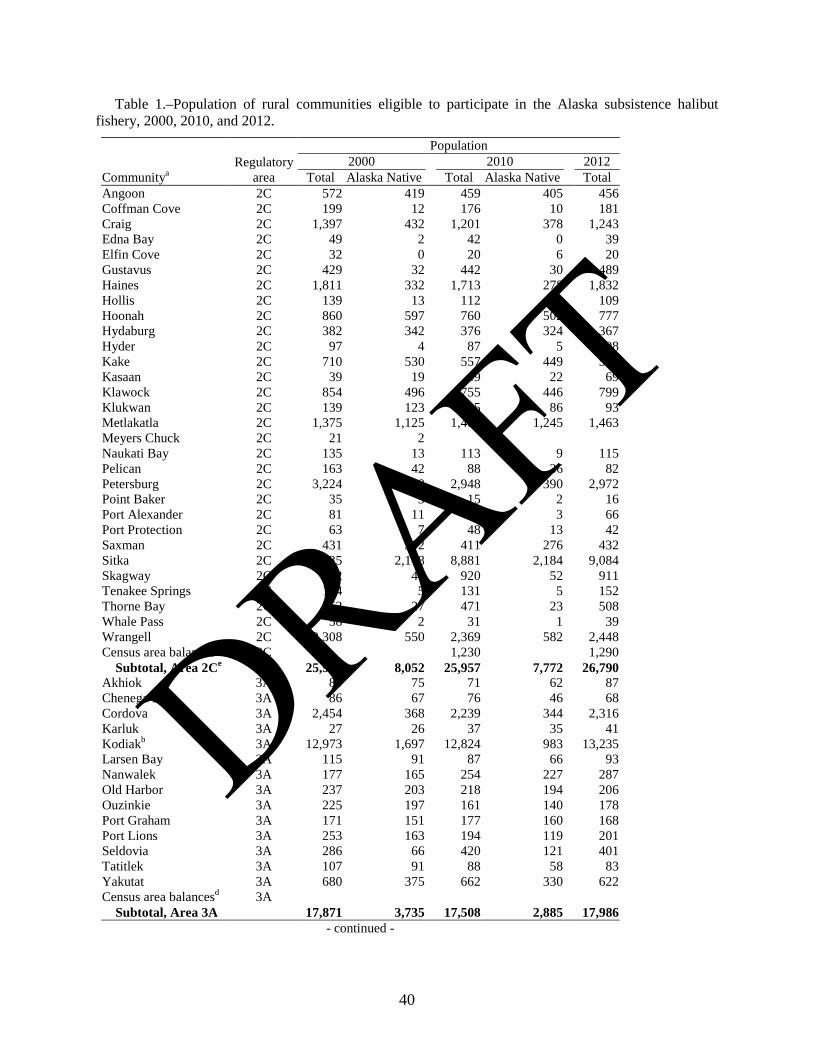
Table 1.–Population of rural communities eligible to participate in the Alaska subsistence halibut fishery, 2000, 2010, and 2012.
Communitya Regulatory
area
Population 2000
2010
2012
Total Alaska Native Total Alaska Native Total Angoon 2C 572 419
459 405
456
Coffman Cove 2C 199 12
176 10
181 Craig 2C 1,397 432
1,201 378
1,243
Edna Bay 2C 49 2
42 0
39 Elfin Cove 2C 32 0
20 6
20
Gustavus 2C 429 32
442 30
489 Haines 2C 1,811 332
1,713 278
1,832
Hollis 2C 139 13
112 10
109 Hoonah 2C 860 597
760 502
777
Hydaburg 2C 382 342
376 324
367 Hyder 2C 97 4
87 5
98
Kake 2C 710 530
557 449
598 Kasaan 2C 39 19
49 22
69
Klawock 2C 854 496
755 446
799 Klukwan 2C 139 123
95 86
93
Metlakatla 2C 1,375 1,125
1,405 1,245
1,463 Meyers Chuck 2C 21 2
Naukati Bay 2C 135 13
113 9
115 Pelican 2C 163 42
88 36
82
Petersburg 2C 3,224 388
2,948 390
2,972 Point Baker 2C 35 3
15 2
16
Port Alexander 2C 81 11
52 3
66 Port Protection 2C 63 7
48 13
42
Saxman 2C 431 302
411 276
432 Sitka 2C 8,835 2,178
8,881 2,184
9,084
Skagway 2C 862 44
920 52
911 Tenakee Springs 2C 104 5
131 5
152
Thorne Bay 2C 552 27
471 23
508 Whale Pass 2C 58 2
31 1
39
Wrangell 2C 2,308 550
2,369 582
2,448 Census area balancesd 2C
1,230
1,290
Subtotal, Area 2Ce
25,956 8,052
25,957 7,772
26,790 Akhiok 3A 80 75
71 62
87
Chenega Bay 3A 86 67
76 46
68 Cordova 3A 2,454 368
2,239 344
2,316
Karluk 3A 27 26
37 35
41 Kodiakb 3A 12,973 1,697
12,824 983
13,235
Larsen Bay 3A 115 91
87 66
93 Nanwalek 3A 177 165
254 227
287
Old Harbor 3A 237 203
218 194
206 Ouzinkie 3A 225 197
161 140
178
Port Graham 3A 171 151
177 160
168 Port Lions 3A 253 163
194 119
201
Seldovia 3A 286 66
420 121
401 Tatitlek 3A 107 91
88 58
83
Yakutat 3A 680 375
662 330
622 Census area balancesd 3A
Subtotal, Area 3A
17,871 3,735
17,508 2,885
17,986 - continued -
40
DRAFT

Table 1.–Page 2 of 3.
Communitya Regulatory
area
Population 2000
2010
2012
Total Alaska Native Total Alaska Native Total Chignik 3B 79 48
91 56
91
Chignik Lagoon 3B 103 85
78 58
82 Chignik Lake 3B 145 127
73 70
70
Cold Bay 3B 88 15
108 20
98 False Pass 3B 64 42
35 27
26
Ivanof Bay 3B 22 21
7 7
7 King Cove 3B 792 379
938 384
963
Nelson Lagoon 3B 83 68
52 40
46 Perryville 3B 107 105
113 110
112
Sand Point 3B 952 421
976 417
983 Census area balancesd 3B
5
5
Subtotal, Area 3B
2,435 1,311
2,476 1,189
2,483 Akutan 4A 713 117
1,027 76
1,106
Nikolski 4A 39 27
18 17
16 Unalaska 4A 4,283 397
4,376 355
4,768
Census area balancesd 4A
178
178 Subtotal, Area 4A
5,035 541
5,599 448
6,068
Adak 4B 316 118
326 46
321 Atka 4B 92 84
61 58
59
Census area balancesd 4B Subtotal, Area 4B
408 202
387 104
380
St George Island 4C 152 140
102 92
86 St Paul Island 4C 532 460
479 417
453
Census area balancesd 4C Subtotal, Area 4C
684 600
581 509
539
Gambell 4D 649 622
681 654
696 Savoonga 4D 643 614
671 637
713
Diomede 4D 146 137
115 110
121 Census area balancesd 4D
Subtotal, Area 4D
1,438 1,373
1,467 1,401
1,530 Alakanuk 4E 652 638
677 660
707
Aleknagik 4E 221 187
219 185
204 Brevig Mission 4E 276 254
388 366
417
Bethel 4E 5,471 3,719
6,080 4,334
6,113 Chefornak 4E 394 386
418 403
434
Chevak 4E 765 734
938 912
970 Clark's Point 4E 75 69
62 55
59
Council ANVSAc 4E 0 0
0 0
0 Dillingham 4E 2,466 1,503
2,329 1,549
2,406
Eek 4E 280 271
296 289
339 Egegik 4E 116 89
109 51
106
Elim 4E 313 297
330 305
365 Emmonak 4E 767 720
762 737
755
Golovin 4E 144 133
156 148
173 Goodnews Bay 4E 230 216
243 232
258
Hooper Bay 4E 1,014 971
1,093 1,070
1,114 King Salmon 4E 442 133
374 132
357
Kipnuk 4E 644 631
639 626
641 Kongiganak 4E 359 349
439 430
464
Kotlik 4E 591 568
577 563
628 - continued -
Table 1.–Page 3 of 3.
41
DRAFT
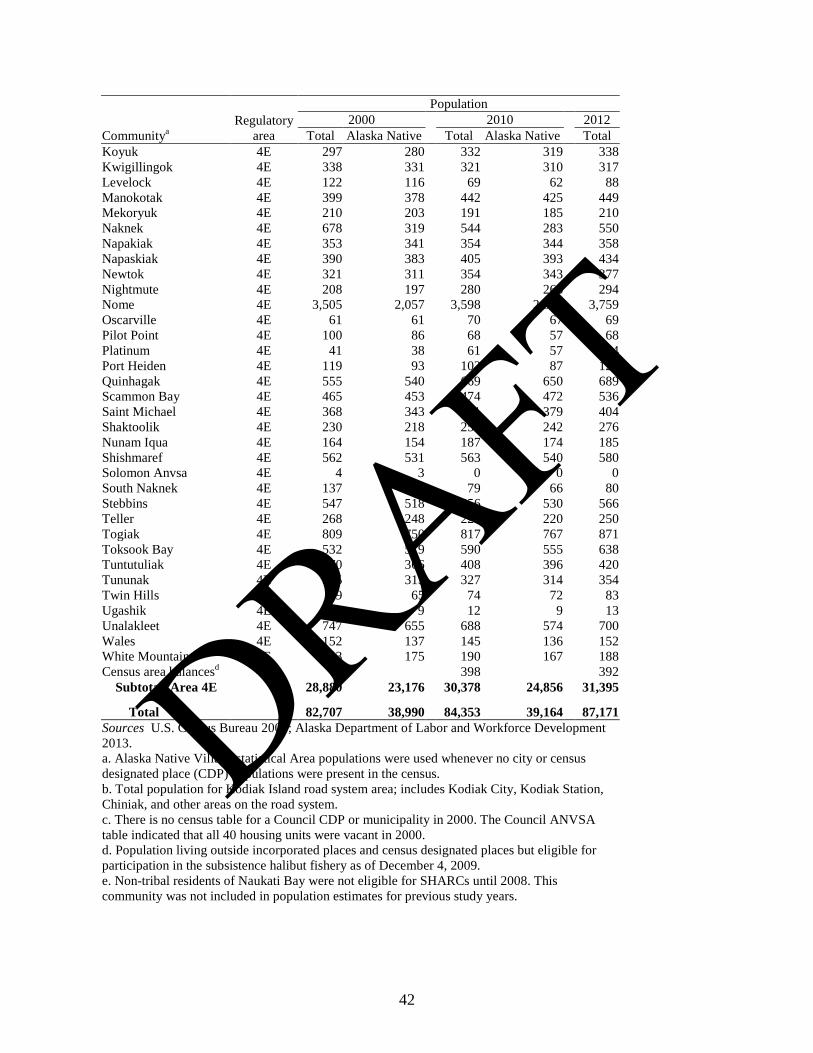
Communitya Regulatory
area
Population 2000
2010
2012
Total Alaska Native Total Alaska Native Total Koyuk 4E 297 280
332 319
338
Kwigillingok 4E 338 331
321 310
317 Levelock 4E 122 116
69 62
88
Manokotak 4E 399 378
442 425
449 Mekoryuk 4E 210 203
191 185
210
Naknek 4E 678 319
544 283
550 Napakiak 4E 353 341
354 344
358
Napaskiak 4E 390 383
405 393
434 Newtok 4E 321 311
354 343
377
Nightmute 4E 208 197
280 266
294 Nome 4E 3,505 2,057
3,598 2,348
3,759
Oscarville 4E 61 61
70 67
69 Pilot Point 4E 100 86
68 57
68
Platinum 4E 41 38
61 57
74 Port Heiden 4E 119 93
102 87
123
Quinhagak 4E 555 540
669 650
689 Scammon Bay 4E 465 453
474 472
536
Saint Michael 4E 368 343
401 379
404 Shaktoolik 4E 230 218
251 242
276
Nunam Iqua 4E 164 154
187 174
185 Shishmaref 4E 562 531
563 540
580
Solomon Anvsa 4E 4 3
0 0
0 South Naknek 4E 137 115
79 66
80
Stebbins 4E 547 518
556 530
566 Teller 4E 268 248
229 220
250
Togiak 4E 809 750
817 767
871 Toksook Bay 4E 532 519
590 555
638
Tuntutuliak 4E 370 366
408 396
420 Tununak 4E 325 315
327 314
354
Twin Hills 4E 69 65
74 72
83 Ugashik 4E 11 9
12 9
13
Unalakleet 4E 747 655
688 574
700 Wales 4E 152 137
145 136
152
White Mountain 4E 203 175
190 167
188 Census area balancesd 4E
398
392
Subtotal, Area 4E
28,880 23,176
30,378 24,856
31,395
Total
82,707 38,990
84,353 39,164
87,171 Sources U.S. Census Bureau 2001; Alaska Department of Labor and Workforce Development 2013. a. Alaska Native Village statistical Area populations were used whenever no city or census designated place (CDP) populations were present in the census. b. Total population for Kodiak Island road system area; includes Kodiak City, Kodiak Station, Chiniak, and other areas on the road system. c. There is no census table for a Council CDP or municipality in 2000. The Council ANVSA table indicated that all 40 housing units were vacant in 2000. d. Population living outside incorporated places and census designated places but eligible for participation in the subsistence halibut fishery as of December 4, 2009. e. Non-tribal residents of Naukati Bay were not eligible for SHARCs until 2008. This community was not included in population estimates for previous study years.
42
DRAFT

Table 2.–Project chronology, 2012 study year.
Date Event/Action October 1, 2012 NOAA Grant Award No. NA11NMF4370059, as amended, between NMFS and
ADF&G in effect to support the research for study year 2012 December 5, 2012 Presentation of 2011 study findings at NPFMC meeting, Anchorage, AK January 7, 2013 First mailing of survey forms January 14, 2013 Distribution of final report and 4 page summary for study year 2011 January 23, 2013 Presentation of 2011 study findings at IPHC annual meeting, Victoria, BC February 15, 2013 Second mailing of survey forms March 27, 2013 Third mailing of survey forms April through June, 2013 Administration of surveys in Angoon, Hydaburg, Ketchikan, Metlakatla, and Sitka April 16, 2013 Submission of semi-annual report on project progress to NMFS October 25, 2012 Submission of semi-annual report on project progress to NMFS November 25, 2013 Release of public review draft of final report December 11, 2013 Presentation of study findings, NPFMC, Anchorage January 10, 2014 Completion of revised, final report; distribution of findings summary January 15, 2014 Presentation of 2012 study findings at IPHC annual meeting, Seattle, WA
43
DRAFT

44
Table 3.–Sample achievement, 2012.
Tribal name Regulatory
area
First mailing Second mailing Third mailing Totals
Surveys mailed
Surveys returned
Surveys returned
undeliverable Surveys mailed
Surveys returned
Surveys returned
undeliverable Surveys mailed
Surveys returned
Surveys returned
undeliverable SHARCs
issued Returned by mail
Returned through
staff Response Response
rate Undeliverable Angoon Community
Association 2C 74 20 0 54 7 2 46 3 0 74 30 42 72 97.3% 2
Aukquan Traditional Council
2C 1
Central Council Tlingit and Haida Indian Tribes
2C 485 160 57 313 55 16 228 20 6 485 235 9 244 50.3% 71
Chilkat Indian Village 2C 12 9 0 4 2 0 2 0 0 12 11 1 12 100.0% 0 Chilkoot Indian
Association 2C 50 25 3 27 7 1 18 1 1 50 33 4 37 74.0% 4
Craig Community Association
2C 59 25 6 34 7 0 25 1 0 59 33 0 33 55.9% 6
Douglas Indian Association
2C 11 4 2 7 0 0 6 0 0 11 4 0 4 36.4% 2
Hoonah Indian Association
2C 110 42 2 78 14 0 54 9 0 110 65 2 67 60.9% 2
Hydaburg Cooperative Association
2C 108 19 7 92 4 0 80 2 0 108 25 21 46 42.6% 7
Ketchikan Indian Corporation
2C 454 150 26 317 36 6 259 15 6 454 201 117 318 70.0% 38
Klawock Cooperative Association
2C 63 24 2 42 8 0 31 6 0 63 38 1 39 61.9% 2
Metlakatla Indian Community, Annette Island Reserve
2C 119 40 0 84 10 0 69 1 0 119 51 43 94 79.0% 0
Organized Village of Kake
2C 72 34 3 41 16 1 22 3 0 72 53 0 53 73.6% 3
Organized Village of Kasaan
2C 5
Organized Village of Saxman
2C 30 11 1 20 4 0 18 1 0 30 16 7 23 76.7% 1
Petersburg Indian Association
2C 68 31 2 48 13 0 29 3 0 68 47 1 48 70.6% 2
Sitka Tribe of Alaska 2C 263 81 34 160 30 2 118 12 1 264 123 31 154 58.3% 36 Skagway Village 2C 3 Wrangell Cooperative
Association 2C 82 54 0 35 10 0 28 4 0 82 68 0 68 82.9% 0
Subtotal, Area 2C 2,069 734 145 1,362 224 28 1,036 81 14 2,070 1,039 280 1,319 63.7% 176 Kenaitze Indian Tribe 3A 132 56 9 77 14 3 60 5 2 132 75 0 75 56.8% 12 Lesnoi Village (Woody
Island) 3A 34 15 2 22 5 0 13 1 1 34 21 0 21 61.8% 3
Native Village of Afognak
3A 20 8 2 11 2 0 9 1 0 20 11 0 11 55.0% 2
Native Village of Akhiok
3A 7 4 1 2 0 0 2 0 0 7 4 0 4 57.1% 1
Native Village of Chenega
3A 18 10 1 15 1 1 12 0 1 18 11 0 11 61.1% 1
Native Village of Eyak 3A 71 29 6 35 12 0 26 2 1 71 43 0 43 60.6% 7 Native Village of
Karluk 3A 4
- continued -
DRAFT

45
Table 3.–Page 2 of 9.
Tribal name Regulatory
area
First mailing Second mailing Third mailing Totals
Surveys mailed
Surveys returned
Surveys returned
undeliverable Surveys mailed
Surveys returned
Surveys returned
undeliverable Surveys mailed
Surveys returned
Surveys returned
undeliverable SHARCs
issued Returned by mail
Returned through
staff Response Response
rate Undeliverable Native Village of Larsen
Bay 3A 31 10 1 22 4 1 18 0 0 31 14 0 14 45.2% 1
Native Village of Nanwalek
3A 71 19 4 52 2 1 46 6 0 71 27 2 29 40.8% 4
Native Village of Ouzinkie
3A 28 9 1 18 6 0 13 1 0 28 16 0 16 57.1% 1
Native Village of Port Graham
3A 34 17 0 18 3 0 14 1 0 34 21 2 23 67.6% 0
Native Village of Port Lions
3A 28 14 1 13 1 0 12 1 0 28 16 0 16 57.1% 1
Native Village of Tatitlek
3A 25 11 0 18 2 1 9 2 0 25 15 1 16 64.0% 1
Ninilchik Village 3A 73 29 3 51 8 1 36 4 0 73 41 0 41 56.2% 4 Seldovia Village Tribe 3A 58 27 3 35 7 0 25 5 0 58 39 0 39 67.2% 3 Sun'aq Tribe of Kodiak
(formerly Shoonaq') 3A 112 54 3 66 7 1 49 7 0 112 68 0 68 60.7% 4
Village of Kanatak 3A 19 2 4 14 1 0 13 0 5 19 3 0 3 15.8% 9 Village of Old Harbor 3A 43 15 2 33 6 2 19 0 3 43 21 0 21 48.8% 6 Village of Salamatoff 3A 25 17 0 14 3 0 8 0 0 25 20 0 20 80.0% 0 Yakutat Tlingit Tribe 3A 43 19 2 24 2 0 19 0 0 43 21 0 21 48.8% 2 Subtotal, Area 3A 876 366 45 543 86 11 406 37 13 876 489 5 494 56.4% 62 Agdaagux Tribe of King
Cove 3B 53 20 1 36 6 1 28 4 1 53 30 0 30 56.6% 2
Chignik Lake Village 3B 11 1 0 11 0 0 10 2 0 11 3 0 3 27.3% 0 Ivanoff Bay Village 3B 4 Native Village of
Belkofski 3B 5
Native Village of Chignik
3B 4
Native Village of Chignik Lagoon
3B 16 5 0 13 5 0 6 0 0 16 10 0 10 62.5% 0
Native Village of False Pass
3B 1
Native Village of Nelson Lagoon
3B 3
Native Village of Perryville
3B 18 11 2 7 1 0 3 1 0 18 13 1 14 77.8% 2
Native Village of Unga 3B 1 Pauloff Harbor Village 3B 79 16 11 58 2 1 50 1 3 79 19 1 20 25.3% 13 Qagan Toyagungin
Tribe of Sand Point Village
3B 82 31 3 57 15 4 32 3 4 82 49 0 49 59.8% 7
Subtotal, Area 3B 277 92 17 193 33 7 135 11 8 277 136 2 138 49.8% 25 Native Village of
Akutan 4A 11 4 0 8 0 0 8 0 0 11 4 0 4 36.4% 0
Qawalingin Tribe of Unalaska
4A 27 8 0 21 2 1 18 0 0 27 10 1 11 40.7% 1
Subtotal, Area 4A 38 12 0 29 2 1 26 0 0 38 14 1 15 39.5% 1 Native Village of Atka 4B 4 Subtotal, Area 4B 4 1 1 2 1 0 1 0 0 4 2 0 2 50.0% 1
- continued -
DRAFT
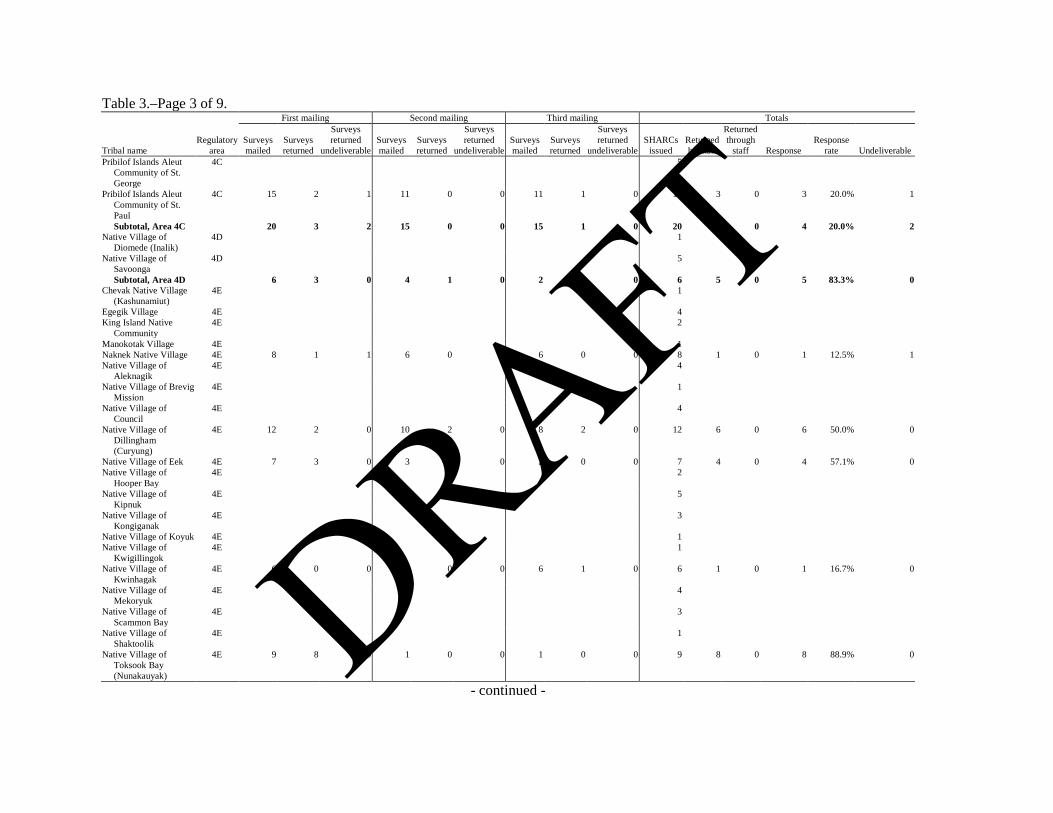
46
Table 3.–Page 3 of 9.
Tribal name Regulatory
area
First mailing Second mailing Third mailing Totals
Surveys mailed
Surveys returned
Surveys returned
undeliverable Surveys mailed
Surveys returned
Surveys returned
undeliverable Surveys mailed
Surveys returned
Surveys returned
undeliverable SHARCs
issued Returned by mail
Returned through
staff Response Response
rate Undeliverable Pribilof Islands Aleut
Community of St. George
4C 5
Pribilof Islands Aleut Community of St. Paul
4C 15 2 1 11 0 0 11 1 0 15 3 0 3 20.0% 1
Subtotal, Area 4C 20 3 2 15 0 0 15 1 0 20 4 0 4 20.0% 2 Native Village of
Diomede (Inalik) 4D 1
Native Village of Savoonga
4D 5
Subtotal, Area 4D 6 3 0 4 1 0 2 1 0 6 5 0 5 83.3% 0 Chevak Native Village
(Kashunamiut) 4E 1
Egegik Village 4E 4 King Island Native
Community 4E 2
Manokotak Village 4E 1 Naknek Native Village 4E 8 1 1 6 0 0 6 0 0 8 1 0 1 12.5% 1 Native Village of
Aleknagik 4E 4
Native Village of Brevig Mission
4E 1
Native Village of Council
4E 4
Native Village of Dillingham (Curyung)
4E 12 2 0 10 2 0 8 2 0 12 6 0 6 50.0% 0
Native Village of Eek 4E 7 3 0 3 1 0 2 0 0 7 4 0 4 57.1% 0 Native Village of
Hooper Bay 4E 2
Native Village of Kipnuk
4E 5
Native Village of Kongiganak
4E 3
Native Village of Koyuk 4E 1 Native Village of
Kwigillingok 4E 1
Native Village of Kwinhagak
4E 6 0 0 6 0 0 6 1 0 6 1 0 1 16.7% 0
Native Village of Mekoryuk
4E 4
Native Village of Scammon Bay
4E 3
Native Village of Shaktoolik
4E 1
Native Village of Toksook Bay (Nunakauyak)
4E 9 8 0 1 0 0 1 0 0 9 8 0 8 88.9% 0
- continued -
DRAFT
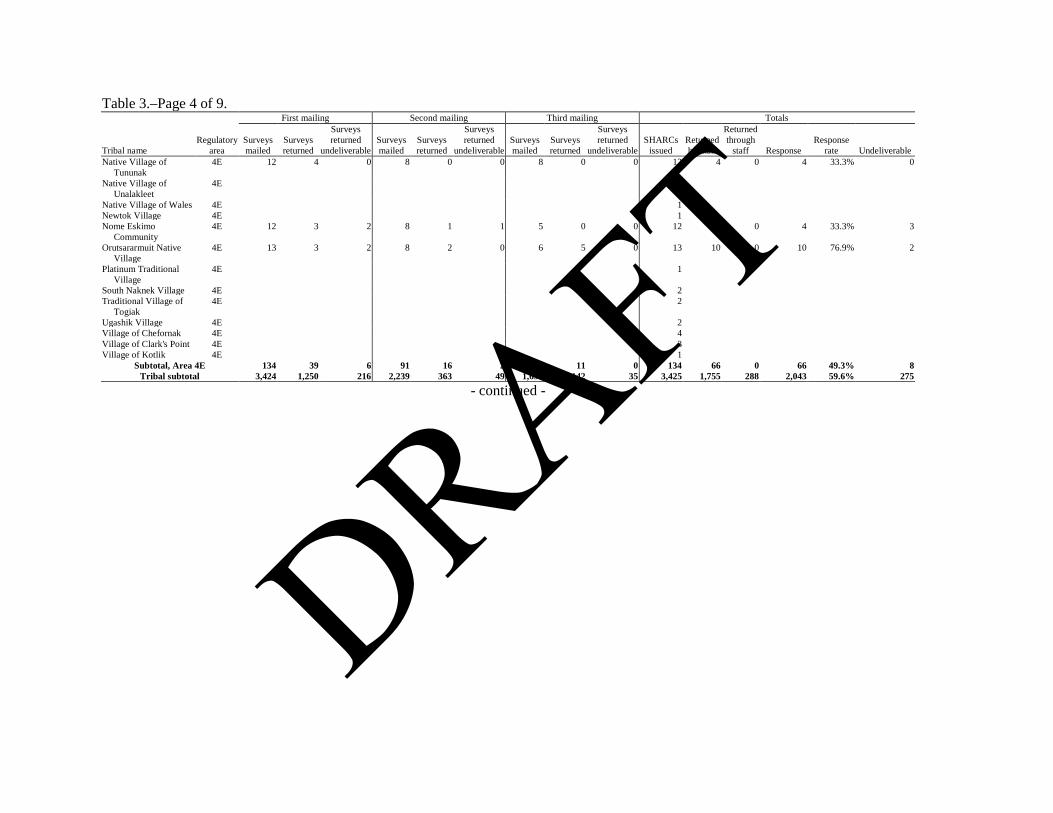
47
Table 3.–Page 4 of 9.
Tribal name Regulatory
area
First mailing Second mailing Third mailing Totals
Surveys mailed
Surveys returned
Surveys returned
undeliverable Surveys mailed
Surveys returned
Surveys returned
undeliverable Surveys mailed
Surveys returned
Surveys returned
undeliverable SHARCs
issued Returned by mail
Returned through
staff Response Response
rate Undeliverable Native Village of
Tununak 4E 12 4 0 8 0 0 8 0 0 12 4 0 4 33.3% 0
Native Village of Unalakleet
4E 1
Native Village of Wales 4E 1 Newtok Village 4E 1 Nome Eskimo
Community 4E 12 3 2 8 1 1 5 0 0 12 4 0 4 33.3% 3
Orutsararmuit Native Village
4E 13 3 2 8 2 0 6 5 0 13 10 0 10 76.9% 2
Platinum Traditional Village
4E 1
South Naknek Village 4E 2 Traditional Village of
Togiak 4E 2
Ugashik Village 4E 2 Village of Chefornak 4E 4 Village of Clark's Point 4E 3 Village of Kotlik 4E 1
Subtotal, Area 4E 134 39 6 91 16 2 73 11 0 134 66 0 66 49.3% 8 Tribal subtotal 3,424 1,250 216 2,239 363 49 1,694 142 35 3,425 1,755 288 2,043 59.6% 275
- continued -
DRAFT
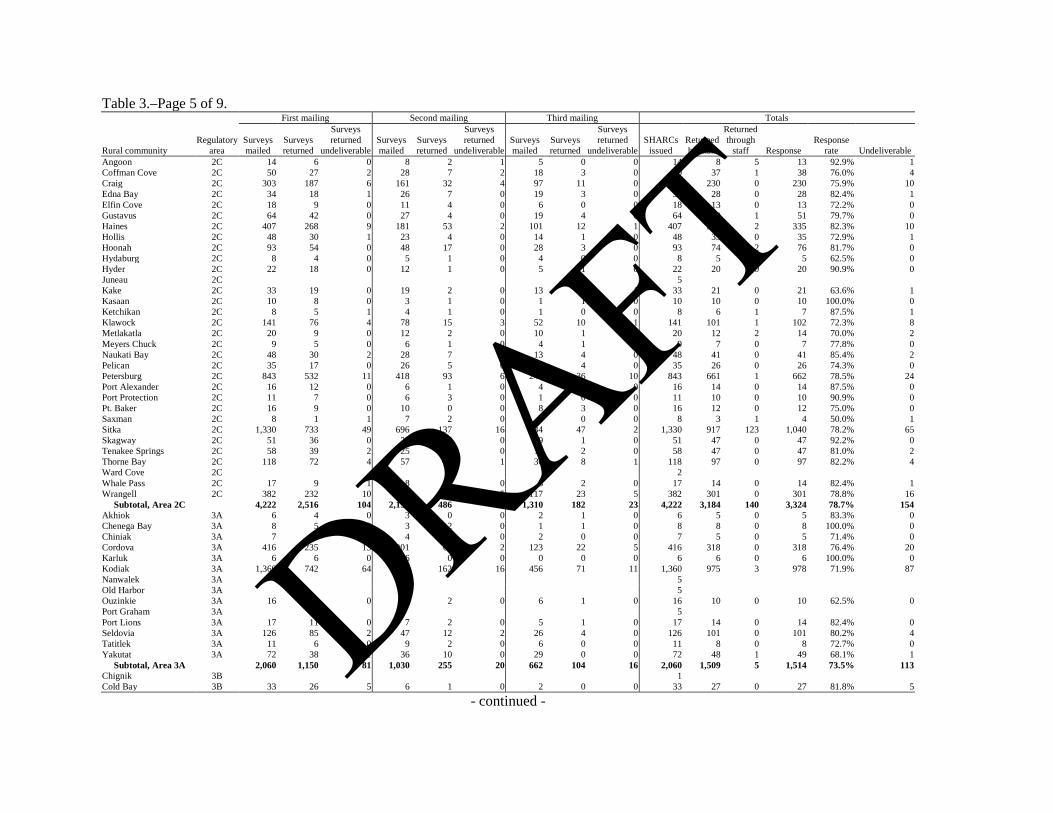
48
Table 3.–Page 5 of 9.
Rural community Regulatory
area
First mailing Second mailing Third mailing Totals
Surveys mailed
Surveys returned
Surveys returned
undeliverable Surveys mailed
Surveys returned
Surveys returned
undeliverable Surveys mailed
Surveys returned
Surveys returned
undeliverable SHARCs
issued Returned by mail
Returned through
staff Response Response
rate Undeliverable Angoon 2C 14 6 0 8 2 1 5 0 0 14 8 5 13 92.9% 1 Coffman Cove 2C 50 27 2 28 7 2 18 3 0 50 37 1 38 76.0% 4 Craig 2C 303 187 6 161 32 4 97 11 0 303 230 0 230 75.9% 10 Edna Bay 2C 34 18 1 26 7 0 19 3 0 34 28 0 28 82.4% 1 Elfin Cove 2C 18 9 0 11 4 0 6 0 0 18 13 0 13 72.2% 0 Gustavus 2C 64 42 0 27 4 0 19 4 0 64 50 1 51 79.7% 0 Haines 2C 407 268 9 181 53 2 101 12 1 407 333 2 335 82.3% 10 Hollis 2C 48 30 1 23 4 0 14 1 0 48 35 0 35 72.9% 1 Hoonah 2C 93 54 0 48 17 0 28 3 0 93 74 2 76 81.7% 0 Hydaburg 2C 8 4 0 5 1 0 4 0 0 8 5 0 5 62.5% 0 Hyder 2C 22 18 0 12 1 0 5 1 0 22 20 0 20 90.9% 0 Juneau 2C 5 Kake 2C 33 19 0 19 2 0 13 0 1 33 21 0 21 63.6% 1 Kasaan 2C 10 8 0 3 1 0 1 1 0 10 10 0 10 100.0% 0 Ketchikan 2C 8 5 1 4 1 0 1 0 0 8 6 1 7 87.5% 1 Klawock 2C 141 76 4 78 15 3 52 10 1 141 101 1 102 72.3% 8 Metlakatla 2C 20 9 0 12 2 0 10 1 2 20 12 2 14 70.0% 2 Meyers Chuck 2C 9 5 0 6 1 0 4 1 0 9 7 0 7 77.8% 0 Naukati Bay 2C 48 30 2 28 7 1 13 4 0 48 41 0 41 85.4% 2 Pelican 2C 35 17 0 26 5 0 18 4 0 35 26 0 26 74.3% 0 Petersburg 2C 843 532 11 418 93 6 248 36 10 843 661 1 662 78.5% 24 Port Alexander 2C 16 12 0 6 1 0 4 1 0 16 14 0 14 87.5% 0 Port Protection 2C 11 7 0 6 3 0 1 0 0 11 10 0 10 90.9% 0 Pt. Baker 2C 16 9 0 10 0 0 8 3 0 16 12 0 12 75.0% 0 Saxman 2C 8 1 1 7 2 0 4 0 0 8 3 1 4 50.0% 1 Sitka 2C 1,330 733 49 696 137 16 434 47 2 1,330 917 123 1,040 78.2% 65 Skagway 2C 51 36 0 20 10 0 9 1 0 51 47 0 47 92.2% 0 Tenakee Springs 2C 58 39 2 25 6 0 15 2 0 58 47 0 47 81.0% 2 Thorne Bay 2C 118 72 4 57 17 1 30 8 1 118 97 0 97 82.2% 4 Ward Cove 2C 2 Whale Pass 2C 17 9 1 8 3 0 8 2 0 17 14 0 14 82.4% 1 Wrangell 2C 382 232 10 191 46 5 117 23 5 382 301 0 301 78.8% 16 Subtotal, Area 2C 4,222 2,516 104 2,156 486 41 1,310 182 23 4,222 3,184 140 3,324 78.7% 154 Akhiok 3A 6 4 0 3 0 0 2 1 0 6 5 0 5 83.3% 0 Chenega Bay 3A 8 5 0 3 2 0 1 1 0 8 8 0 8 100.0% 0 Chiniak 3A 7 3 0 4 2 0 2 0 0 7 5 0 5 71.4% 0 Cordova 3A 416 235 13 201 61 2 123 22 5 416 318 0 318 76.4% 20 Karluk 3A 6 6 0 6 0 0 0 0 0 6 6 0 6 100.0% 0 Kodiak 3A 1,360 742 64 700 162 16 456 71 11 1,360 975 3 978 71.9% 87 Nanwalek 3A 5 Old Harbor 3A 5 Ouzinkie 3A 16 7 0 8 2 0 6 1 0 16 10 0 10 62.5% 0 Port Graham 3A 5 Port Lions 3A 17 11 0 7 2 0 5 1 0 17 14 0 14 82.4% 0 Seldovia 3A 126 85 2 47 12 2 26 4 0 126 101 0 101 80.2% 4 Tatitlek 3A 11 6 0 9 2 0 6 0 0 11 8 0 8 72.7% 0 Yakutat 3A 72 38 1 36 10 0 29 0 0 72 48 1 49 68.1% 1 Subtotal, Area 3A 2,060 1,150 81 1,030 255 20 662 104 16 2,060 1,509 5 1,514 73.5% 113 Chignik 3B 1 Cold Bay 3B 33 26 5 6 1 0 2 0 0 33 27 0 27 81.8% 5
- continued -
DRAFT

49
Table 3.–Page 6 of 9.
Rural community Regulatory
area
First mailing Second mailing Third mailing Totals
Surveys mailed
Surveys returned
Surveys returned
undeliverable Surveys mailed
Surveys returned
Surveys returned
undeliverable Surveys mailed
Surveys returned
Surveys returned
undeliverable SHARCs
issued Returned by mail
Returned through
staff Response Response
rate Undeliverable False Pass 3B 2 King Cove 3B 19 14 1 9 3 0 2 1 0 19 18 0 18 94.7% 1 Sand Point 3B 6 0 0 5 2 1 3 0 0 6 2 0 2 33.3% 1 Subtotal, Area 3B 61 42 6 21 6 1 8 1 0 61 49 0 49 80.3% 7 Unalaska 4A 114 63 2 68 16 0 39 4 0 114 83 0 83 72.8% 2 Subtotal, Area 4A 114 63 2 68 16 0 39 4 0 114 83 0 83 72.8% 2 Adak 4B 8 4 0 4 0 0 4 0 0 8 4 1 5 62.5% 0 Subtotal, Area 4B 8 4 0 4 0 0 4 0 0 8 4 1 5 62.5% 0 St. George Island 4C 1 St. Paul Island 4C 1 Subtotal, Area 4C 2 1 0 1 0 0 1 0 0 2 1 0 1 50.0% 0 Savoonga 4D 1 Subtotal, Area 4D 1 0 0 1 0 0 1 1 0 1 1 0 1 100.0% 0 Bethel 4E 1 Chevak 4E 1 Dillingham 4E 21 12 0 10 2 0 8 2 0 21 16 0 16 76.2% 0 Egegik 4E 1 King Salmon 4E 3 Kotlik 4E 1 Koyuk 4E 1 Manokotak 4E 2 Naknek 4E 3 Nightmute 4E 1 Nome 4E 13 5 0 10 1 0 9 2 1 13 8 0 8 61.5% 1 Port Heiden 4E 1 Togiak 4E 2 Subtotal, Area 4E 51 24 0 32 4 0 25 6 1 51 34 0 34 66.7% 1 Rural community subtotal 6,519 3,800 193 3,313 767 62 2,050 298 40 6,519 4,865 146 5,011 76.9% 277 Total (tribal and rural) 9,943 5,050 409 5,552 1,130 111 3,744 440 75 9,944 6,620 434 7,054 70.9% 552
- continued -
DRAFT

50
Table 3.–Page 7 of 9.
Community of residence Regulatory
area
First mailing Second mailing Third mailing Totals
Surveys mailed
Surveys returned
Surveys returned
undeliverable Surveys mailed
Surveys returned
Surveys returned
undeliverable Surveys mailed
Surveys returned
Surveys returned
undeliverable SHARCs
issued Returned by mail
Returned through
staff Response Response
rate Undeliverable Adak AK 7 2 0 5 0 0 5 0 0 7 2 1 3 42.9% 0 Akhiok AK 4 Akutan AK 6 0 0 6 0 0 6 0 0 6 0 0 0 0.0% 0 Anchor Point AK 16 7 0 9 0 0 9 0 0 16 7 0 7 43.8% 0 Anchorage AK 198 92 23 101 18 7 64 5 3 198 115 0 115 58.1% 30 Angoon AK 97 27 1 69 8 4 57 3 1 97 38 54 92 94.8% 6 Auke Bay AK 4 Barrow AK 2 Bethel AK 13 3 0 10 2 0 8 5 0 13 10 0 10 76.9% 0 Chefornak AK 3 Chenega Bay AK 10 7 0 4 2 0 2 1 0 10 10 0 10 100.0% 0 Chevak AK 1 Chignik AK 6 1 0 5 3 0 2 0 0 6 4 0 4 66.7% 0 Chignik Lagoon AK 9 4 0 7 1 0 4 0 0 9 5 0 5 55.6% 0 Chignik Lake AK 1 Chiniak AK 13 6 0 7 5 0 4 0 0 13 11 0 11 84.6% 0 Chugiak AK 4 Clarks Point AK 3 Coffman Cove AK 49 26 1 29 8 1 18 4 0 49 38 1 39 79.6% 2 Cold Bay AK 37 28 5 8 2 0 4 0 0 37 30 0 30 81.1% 5 Cordova AK 470 255 16 232 72 1 148 24 6 470 351 0 351 74.7% 23 Craig AK 450 273 13 235 45 5 144 15 1 450 333 0 333 74.0% 19 Dillingham AK 25 12 0 14 4 0 10 2 0 25 18 0 18 72.0% 0 Douglas AK 11 4 3 6 0 0 6 0 0 11 4 0 4 36.4% 3 Dutch Harbor AK 70 31 1 46 14 0 28 2 0 70 47 0 47 67.1% 1 Eagle River AK 9 5 0 4 0 0 4 0 0 9 5 0 5 55.6% 0 Edna Bay AK 26 13 1 20 7 0 15 0 0 26 20 0 20 76.9% 1 Eek AK 5 Egegik AK 1 Elfin Cove AK 17 8 0 11 4 0 6 0 0 17 12 0 12 70.6% 0 Excursion Inlet AK 4 Fairbanks AK 6 3 0 4 0 1 2 1 0 6 4 0 4 66.7% 1 False Pass AK 2 Fritz Creek AK 1 Gakona AK 1 Girdwood AK 1 Gustavus AK 64 41 1 28 4 0 19 4 0 64 49 1 50 78.1% 1 Haines AK 455 291 11 205 64 2 117 14 1 455 369 2 371 81.5% 12 Homer AK 30 13 2 17 9 0 9 0 0 30 22 1 23 76.7% 2 Hoonah AK 199 95 1 126 32 3 79 11 1 199 138 4 142 71.4% 3 Hydaburg AK 105 23 2 90 3 0 78 2 0 105 28 21 49 46.7% 2 Hyder AK 22 18 0 12 1 0 5 1 0 22 20 0 20 90.9% 0 Juneau AK 338 98 48 221 38 11 168 12 6 338 148 1 149 44.1% 60 Kake AK 103 58 0 60 19 0 31 1 1 103 78 0 78 75.7% 1 Karluk AK 9 6 0 9 0 0 3 1 0 9 7 0 7 77.8% 0 Kasaan AK 9 8 0 2 0 0 1 1 0 9 9 0 9 100.0% 0 Kasilof AK 14 4 1 11 3 1 7 0 0 14 7 0 7 50.0% 2 Kenai AK 106 43 6 67 11 3 53 6 1 106 60 0 60 56.6% 9 Ketchikan AK 524 179 30 362 47 4 285 22 6 524 248 133 381 72.7% 40 King Cove AK 73 32 2 48 6 5 37 6 6 73 44 0 44 60.3% 6
- continued -
DRAFT
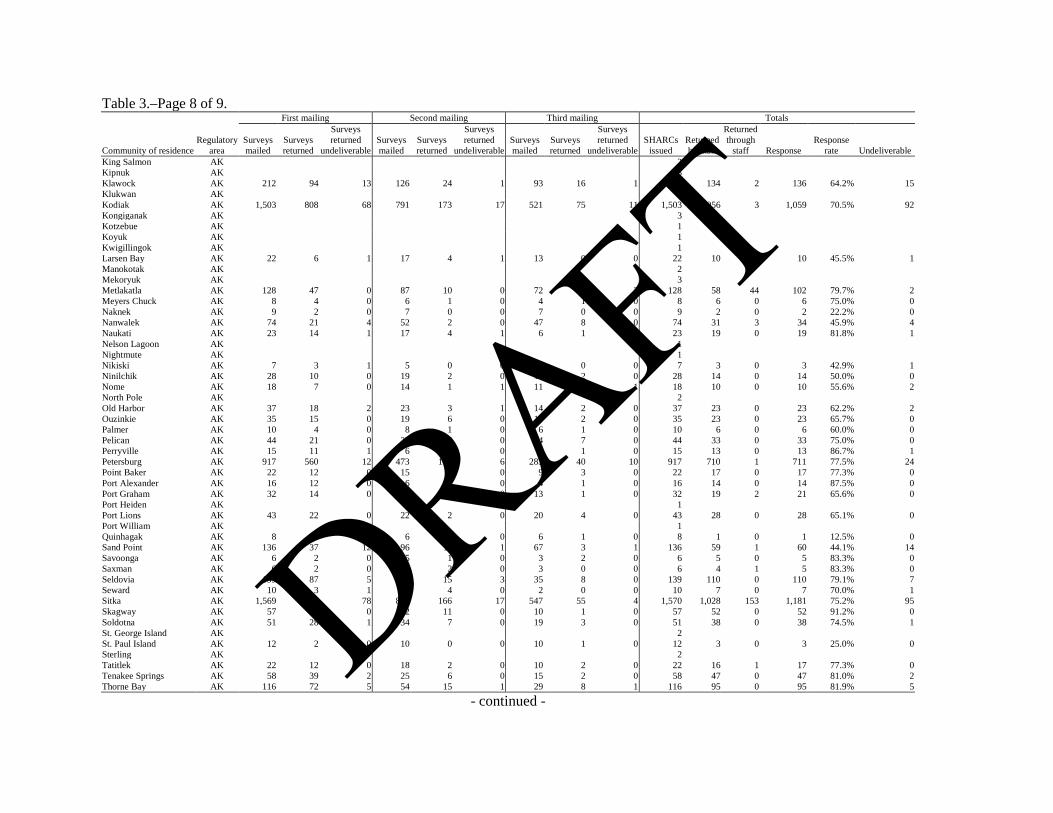
51
Table 3.–Page 8 of 9.
Community of residence Regulatory
area
First mailing Second mailing Third mailing Totals
Surveys mailed
Surveys returned
Surveys returned
undeliverable Surveys mailed
Surveys returned
Surveys returned
undeliverable Surveys mailed
Surveys returned
Surveys returned
undeliverable SHARCs
issued Returned by mail
Returned through
staff Response Response
rate Undeliverable King Salmon AK 2 Kipnuk AK 5 Klawock AK 212 94 13 126 24 1 93 16 1 212 134 2 136 64.2% 15 Klukwan AK 1 Kodiak AK 1,503 808 68 791 173 17 521 75 11 1,503 1,056 3 1,059 70.5% 92 Kongiganak AK 3 Kotzebue AK 1 Koyuk AK 1 Kwigillingok AK 1 Larsen Bay AK 22 6 1 17 4 1 13 0 0 22 10 0 10 45.5% 1 Manokotak AK 2 Mekoryuk AK 3 Metlakatla AK 128 47 0 87 10 0 72 1 2 128 58 44 102 79.7% 2 Meyers Chuck AK 8 4 0 6 1 0 4 1 0 8 6 0 6 75.0% 0 Naknek AK 9 2 0 7 0 0 7 0 0 9 2 0 2 22.2% 0 Nanwalek AK 74 21 4 52 2 0 47 8 0 74 31 3 34 45.9% 4 Naukati AK 23 14 1 17 4 1 6 1 0 23 19 0 19 81.8% 1 Nelson Lagoon AK 1 Nightmute AK 1 Nikiski AK 7 3 1 5 0 0 3 0 0 7 3 0 3 42.9% 1 Ninilchik AK 28 10 0 19 2 0 16 2 0 28 14 0 14 50.0% 0 Nome AK 18 7 0 14 1 1 11 2 1 18 10 0 10 55.6% 2 North Pole AK 2 Old Harbor AK 37 18 2 23 3 1 14 2 0 37 23 0 23 62.2% 2 Ouzinkie AK 35 15 0 19 6 0 14 2 0 35 23 0 23 65.7% 0 Palmer AK 10 4 0 8 1 0 6 1 0 10 6 0 6 60.0% 0 Pelican AK 44 21 0 32 5 0 24 7 0 44 33 0 33 75.0% 0 Perryville AK 15 11 1 6 1 0 2 1 0 15 13 0 13 86.7% 1 Petersburg AK 917 560 12 473 110 6 283 40 10 917 710 1 711 77.5% 24 Point Baker AK 22 12 0 15 2 0 9 3 0 22 17 0 17 77.3% 0 Port Alexander AK 16 12 0 6 1 0 4 1 0 16 14 0 14 87.5% 0 Port Graham AK 32 14 0 18 4 0 13 1 0 32 19 2 21 65.6% 0 Port Heiden AK 1 Port Lions AK 43 22 0 22 2 0 20 4 0 43 28 0 28 65.1% 0 Port William AK 1 Quinhagak AK 8 0 0 6 0 0 6 1 0 8 1 0 1 12.5% 0 Sand Point AK 136 37 12 96 19 1 67 3 1 136 59 1 60 44.1% 14 Savoonga AK 6 2 0 5 1 0 3 2 0 6 5 0 5 83.3% 0 Saxman AK 6 2 0 4 2 0 3 0 0 6 4 1 5 83.3% 0 Seldovia AK 139 87 5 60 15 3 35 8 0 139 110 0 110 79.1% 7 Seward AK 10 3 1 7 4 0 2 0 0 10 7 0 7 70.0% 1 Sitka AK 1,569 807 78 846 166 17 547 55 4 1,570 1,028 153 1,181 75.2% 95 Skagway AK 57 40 0 22 11 0 10 1 0 57 52 0 52 91.2% 0 Soldotna AK 51 28 1 34 7 0 19 3 0 51 38 0 38 74.5% 1 St. George Island AK 2 St. Paul Island AK 12 2 0 10 0 0 10 1 0 12 3 0 3 25.0% 0 Sterling AK 2 Tatitlek AK 22 12 0 18 2 0 10 2 0 22 16 1 17 77.3% 0 Tenakee Springs AK 58 39 2 25 6 0 15 2 0 58 47 0 47 81.0% 2 Thorne Bay AK 116 72 5 54 15 1 29 8 1 116 95 0 95 81.9% 5
- continued -
DRAFT
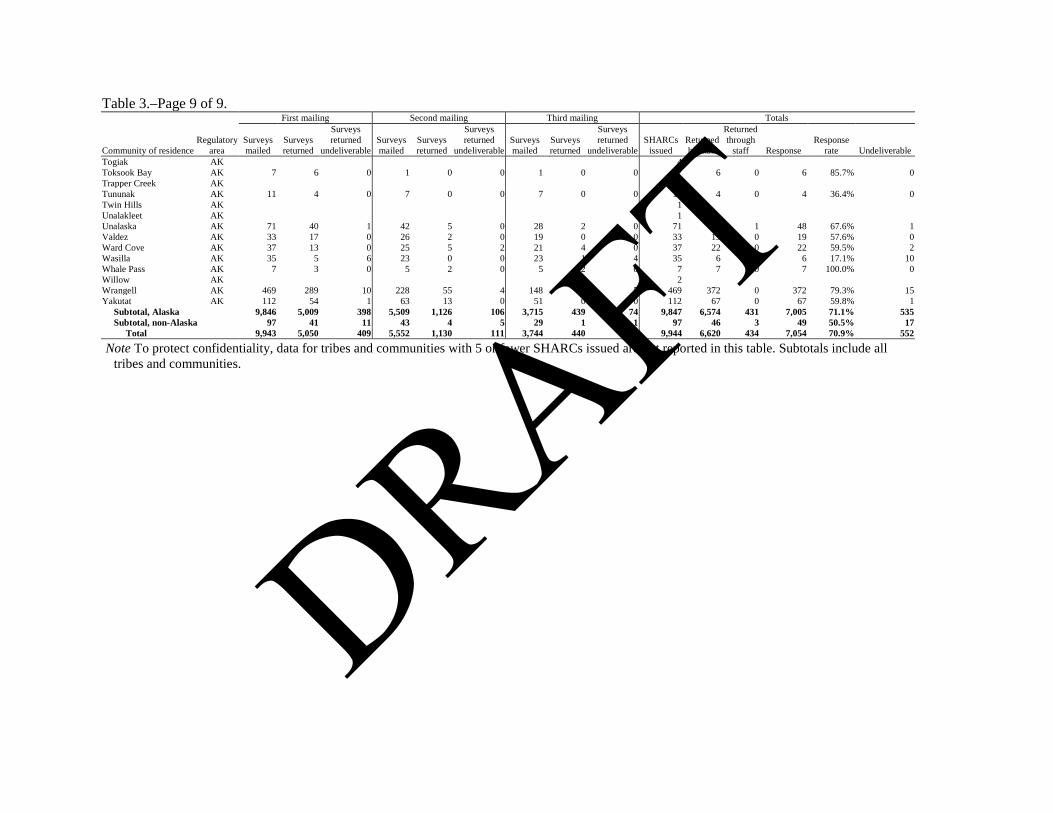
52
Table 3.–Page 9 of 9.
Community of residence Regulatory
area
First mailing Second mailing Third mailing Totals
Surveys mailed
Surveys returned
Surveys returned
undeliverable Surveys mailed
Surveys returned
Surveys returned
undeliverable Surveys mailed
Surveys returned
Surveys returned
undeliverable SHARCs
issued Returned by mail
Returned through
staff Response Response
rate Undeliverable Togiak AK 4 Toksook Bay AK 7 6 0 1 0 0 1 0 0 7 6 0 6 85.7% 0 Trapper Creek AK 1 Tununak AK 11 4 0 7 0 0 7 0 0 11 4 0 4 36.4% 0 Twin Hills AK 1 Unalakleet AK 1 Unalaska AK 71 40 1 42 5 0 28 2 0 71 47 1 48 67.6% 1 Valdez AK 33 17 0 26 2 0 19 0 0 33 19 0 19 57.6% 0 Ward Cove AK 37 13 0 25 5 2 21 4 0 37 22 0 22 59.5% 2 Wasilla AK 35 5 6 23 0 0 23 1 4 35 6 0 6 17.1% 10 Whale Pass AK 7 3 0 5 2 0 5 2 0 7 7 0 7 100.0% 0 Willow AK 2 Wrangell AK 469 289 10 228 55 4 148 28 5 469 372 0 372 79.3% 15 Yakutat AK 112 54 1 63 13 0 51 0 0 112 67 0 67 59.8% 1 Subtotal, Alaska 9,846 5,009 398 5,509 1,126 106 3,715 439 74 9,847 6,574 431 7,005 71.1% 535 Subtotal, non-Alaska 97 41 11 43 4 5 29 1 1 97 46 3 49 50.5% 17 Total 9,943 5,050 409 5,552 1,130 111 3,744 440 75 9,944 6,620 434 7,054 70.9% 552
Note To protect confidentiality, data for tribes and communities with 5 or fewer SHARCs issued are not reported in this table. Subtotals include all tribes and communities.
DRAFT

53
Table 4.–Estimated subsistence harvests of halibut, 2012, by SHARC type and regulatory area.
Tribalb name Regulatory
area
Return rate Subsistence fished halibut
Subsistence halibut harvest Sport fished halibut Sport halibut harvest Lingcod bycatch Rockfish bycatch
SHARCsa issued
Surveys returned
Percent of SHARCsa
Estimated number
respondents Percent of SHARCsa
Estimated number
fish
Estimated number poundsc
Estimated number
respondents Percent of SHARCsa
Estimated number
fish
Estimated number poundsc
Estimated number
respondents
Estimated number
fish
Estimated number
respondents
Estimated number
fish Angoon Community
Association 2C 74 72 97.3% 36 48.6% 481 9,000 4 5.5% 10 143 0 0 11 57
Aukquan Traditional Council
2C 1
Central Council Tlingit and Haida Indian Tribes
2C 485 244 50.3% 147 30.4% 1,523 31,840 87 17.9% 353 4,765 12 40 40 333
Chilkat Indian Village 2C 12 12 100.0% 1 8.3% 0 0 2 16.7% 7 74 0 0 0 0 Chilkoot Indian
Association 2C 50 37 74.0% 18 35.8% 52 1,154 4 8.3% 0 0 3 3 3 6
Craig Community Association
2C 59 33 55.9% 27 45.9% 277 6,526 8 13.5% 5 190 5 8 13 120
Douglas Indian Association
2C 11 4 36.4% 2 18.2% 4 133 2 18.2% 2 63 0 0 0 0
Hoonah Indian Association
2C 110 67 60.9% 53 48.6% 700 8,466 16 14.4% 44 662 0 0 2 13
Hydaburg Cooperative Association
2C 108 46 42.6% 65 59.9% 980 26,122 9 8.7% 13 667 14 65 27 562
Ketchikan Indian Corporation
2C 454 318 70.0% 115 25.3% 1,727 30,483 61 13.4% 250 5,038 19 70 41 494
Klawock Cooperative Association
2C 63 39 61.9% 19 30.2% 162 5,109 2 2.5% 8 166 3 6 6 44
Metlakatla Indian Community, Annette Island Reserve
2C 119 94 79.0% 26 22.0% 140 2,789 8 6.3% 11 272 1 3 3 20
Organized Village of Kake
2C 72 53 73.6% 24 33.5% 211 6,597 1 1.8% 6 67 3 4 4 75
Organized Village of Kasaan
2C 5
Organized Village of Saxman
2C 30 23 76.7% 20 65.0% 271 4,318 4 12.5% 56 319 1 3 1 10
Petersburg Indian Association
2C 68 48 70.6% 24 34.9% 179 2,903 16 22.9% 45 909 0 0 5 12
Sitka Tribe of Alaska 2C 264 154 58.3% 98 37.2% 587 14,421 11 4.3% 10 317 32 130 33 252 Skagway Village 2C 3 Wrangell Cooperative
Association 2C 82 68 82.9% 32 39.0% 283 7,744 18 21.7% 66 2,334 0 0 4 56
Subtotal, Area 2C 2,070 1,319 63.7% 710 34.3% 7,592 157,963 255 12.3% 890 16,059 95 334 195 2,061 Kenaitze Indian Tribe 3A 132 75 56.8% 23 17.2% 572 8,823 19 14.5% 80 767 2 3 2 16 Lesnoi Village (Woody
Island) 3A 34 21 61.8% 5 15.9% 50 884 0 0.0% 0 0 1 1 1 4
Native Village of Afognak
3A 20 11 55.0% 10 49.0% 77 1,446 0 0.0% 0 0 0 0 0 0
Native Village of Akhiok
3A 7 4 57.1% 3 42.9% 43 804 0 0.0% 0 0 0 0 0 0
Native Village of Chenega
3A 18 11 61.1% 5 30.3% 49 1,145 4 22.7% 7 210 1 3 3 34
Native Village of Eyak 3A 71 43 60.6% 20 27.9% 102 1,779 13 17.7% 27 579 2 3 2 19
- continued -
DRAFT

54
Table 4.–Page 2 of 7.
Tribalb name Regulatory
area
Return rate Subsistence fished halibut
Subsistence halibut harvest Sport fished halibut Sport halibut harvest Lingcod bycatch Rockfish bycatch
SHARCsa issued
Surveys returned
Percent of SHARCsa
Estimated number
respondents Percent of SHARCsa
Estimated number
fish
Estimated number poundsc
Estimated number
respondents Percent of SHARCsa
Estimated number
fish
Estimated number poundsc
Estimated number
respondents
Estimated number
fish
Estimated number
respondents
Estimated number
fish Native Village of
Karluk 3A 4
Native Village of Larsen Bay
3A 31 14 45.2% 17 54.8% 180 4,319 3 9.7% 22 168 4 6 6 78
Native Village of Nanwalek
3A 71 29 40.8% 29 40.8% 569 7,275 0 0.0% 0 0 4 64 10 127
Native Village of Ouzinkie
3A 28 16 57.1% 13 46.2% 114 1,964 8 29.9% 28 519 0 0 2 37
Native Village of Port Graham
3A 34 23 67.6% 20 58.0% 504 9,427 6 16.6% 6 59 4 8 4 63
Native Village of Port Lions
3A 28 16 57.1% 16 58.0% 94 2,437 15 52.2% 42 908 0 0 0 0
Native Village of Tatitlek
3A 25 16 64.0% 9 36.0% 106 2,375 0 0.0% 0 0 0 0 2 8
Ninilchik Village 3A 73 41 56.2% 19 26.3% 866 5,255 12 16.5% 72 958 0 0 0 0 Seldovia Village Tribe 3A 58 39 67.2% 35 60.7% 497 6,739 19 32.5% 90 1,372 5 16 4 51 Sun'aq Tribe of Kodiak
(formerly Shoonaq') 3A 112 68 60.7% 62 55.4% 567 12,758 20 17.5% 51 1,182 16 50 6 60
Village of Kanatak 3A 19 3 15.8% 0 0.0% 0 0 6 33.3% 13 89 0 0 0 0 Village of Old Harbor 3A 43 21 48.8% 21 49.3% 163 1,778 3 7.6% 23 308 2 10 7 42 Village of Salamatoff 3A 25 20 80.0% 7 27.8% 184 1,799 7 27.8% 25 276 0 0 0 0 Yakutat Tlingit Tribe 3A 43 21 48.8% 29 68.1% 428 11,054 2 4.5% 0 0 2 39 2 37 Subtotal, Area 3A 876 494 56.4% 348 39.7% 5,213 82,641 136 15.6% 487 7,396 44 204 54 600 Agdaagux Tribe of King
Cove 3B 53 30 56.6% 15 27.5% 188 2,657 8 15.4% 46 880 0 0 3 11
Chignik Lake Village 3B 11 3 27.3% 0 0.0% 0 0 0 0.0% 0 0 0 0 0 0 Ivanoff Bay Village 3B 4 Native Village of
Belkofski 3B 5
Native Village of Chignik
3B 4
Native Village of Chignik Lagoon
3B 16 10 62.5% 10 63.5% 63 839 4 22.9% 15 295 1 4 5 65
Native Village of False Pass
3B 1
Native Village of Nelson Lagoon
3B 3
Native Village of Perryville
3B 18 14 77.8% 15 80.6% 120 2,188 1 5.6% 0 0 0 0 3 13
Native Village of Unga 3B 1 Pauloff Harbor Village 3B 79 20 25.3% 38 48.0% 231 3,869 10 13.1% 38 507 0 0 3 7 Qagan Toyagungin
Tribe of Sand Point Village
3B 82 49 59.8% 26 31.4% 179 2,780 20 23.9% 78 773 1 1 3 37
Subtotal, Area 3B 277 138 49.8% 105 37.9% 795 12,515 51 18.3% 186 2,630 2 5 18 136 Native Village of
Akutan 4A 11 4 36.4% 0 0.0% 0 0 0 0.0% 0 0 0 0 0 0
Qawalingin Tribe of Unalaska
4A 27 11 40.7% 11 41.2% 31 260 4 16.5% 18 202 0 0 4 53
- continued -
DRAFT

55
Table 4.–Page 3 of 7.
Tribalb name Regulatory
area
Return rate Subsistence fished halibut
Subsistence halibut harvest Sport fished halibut Sport halibut harvest Lingcod bycatch Rockfish bycatch
SHARCsa issued
Surveys returned
Percent of SHARCsa
Estimated number
respondents Percent of SHARCsa
Estimated number
fish
Estimated number poundsc
Estimated number
respondents Percent of SHARCsa
Estimated number
fish
Estimated number poundsc
Estimated number
respondents
Estimated number
fish
Estimated number
respondents
Estimated number
fish Subtotal, Area 4A 38 15 39.5% 11 29.2% 31 260 4 11.7% 18 202 0 0 4 53 Native Village of Atka 4B 4 Subtotal, Area 4B 4 Pribilof Islands Aleut
Community of St. George
4C 5
Pribilof Islands Aleut Community of St. Paul
4C 15 3 20.0% 14 93.3% 149 2,009 0 0.0% 0 0 0 0 0 0
Subtotal, Area 4C 20 4 20.0% 14 70.0% 149 2,009 0 0.0% 0 0 0 0 0 0 Native Village of
Diomede (Inalik) 4D 1
Native Village of Savoonga
4D 5
Subtotal, Area 4D 6 5 83.3% 5 79.2% 27 777 0 0.0% 0 0 0 0 0 0 Chevak Native Village
(Kashunamiut) 4E 1
Egegik Village 4E 4 King Island Native
Community 4E 2
Manokotak Village 4E 1 Naknek Native Village 4E 8 1 12.5% 0 0.0% 0 0 0 0.0% 0 0 0 0 0 0 Native Village of
Aleknagik 4E 4
Native Village of Brevig Mission
4E 1
Native Village of Council
4E 4
Native Village of Dillingham (Curyung)
4E 12 6 50.0% 3 25.0% 24 516 2 16.7% 12 259 0 0 0 0
Native Village of Eek 4E 7 4 57.1% 5 75.0% 21 698 0 0.0% 0 0 0 0 0 0 Native Village of
Hooper Bay 4E 2
Native Village of Kipnuk
4E 5
Native Village of Kongiganak
4E 3
Native Village of Koyuk 4E 1 Native Village of
Kwigillingok 4E 1
Native Village of Kwinhagak
4E 6 1 16.7% 0 0.0% 0 0 0 0.0% 0 0 0 0 0 0
Native Village of Mekoryuk
4E 4
Native Village of Scammon Bay
4E 3
Native Village of Shaktoolik
4E 1
- continued -
DRAFT
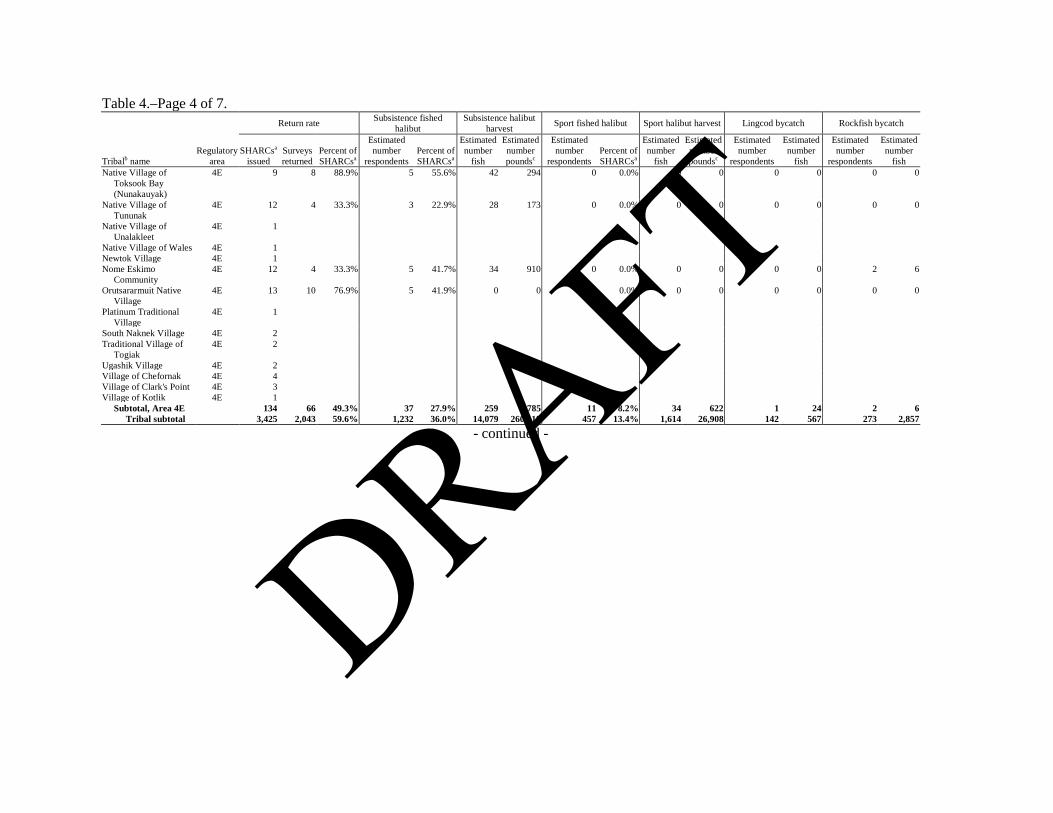
56
Table 4.–Page 4 of 7.
Tribalb name Regulatory
area
Return rate Subsistence fished halibut
Subsistence halibut harvest Sport fished halibut Sport halibut harvest Lingcod bycatch Rockfish bycatch
SHARCsa issued
Surveys returned
Percent of SHARCsa
Estimated number
respondents Percent of SHARCsa
Estimated number
fish
Estimated number poundsc
Estimated number
respondents Percent of SHARCsa
Estimated number
fish
Estimated number poundsc
Estimated number
respondents
Estimated number
fish
Estimated number
respondents
Estimated number
fish Native Village of
Toksook Bay (Nunakauyak)
4E 9 8 88.9% 5 55.6% 42 294 0 0.0% 0 0 0 0 0 0
Native Village of Tununak
4E 12 4 33.3% 3 22.9% 28 173 0 0.0% 0 0 0 0 0 0
Native Village of Unalakleet
4E 1
Native Village of Wales 4E 1 Newtok Village 4E 1 Nome Eskimo
Community 4E 12 4 33.3% 5 41.7% 34 910 0 0.0% 0 0 0 0 2 6
Orutsararmuit Native Village
4E 13 10 76.9% 5 41.9% 0 0 0 0.0% 0 0 0 0 0 0
Platinum Traditional Village
4E 1
South Naknek Village 4E 2 Traditional Village of
Togiak 4E 2
Ugashik Village 4E 2 Village of Chefornak 4E 4 Village of Clark's Point 4E 3 Village of Kotlik 4E 1 Subtotal, Area 4E 134 66 49.3% 37 27.9% 259 3,785 11 8.2% 34 622 1 24 2 6 Tribal subtotal 3,425 2,043 59.6% 1,232 36.0% 14,079 260,118 457 13.4% 1,614 26,908 142 567 273 2,857
- continued -
DRAFT
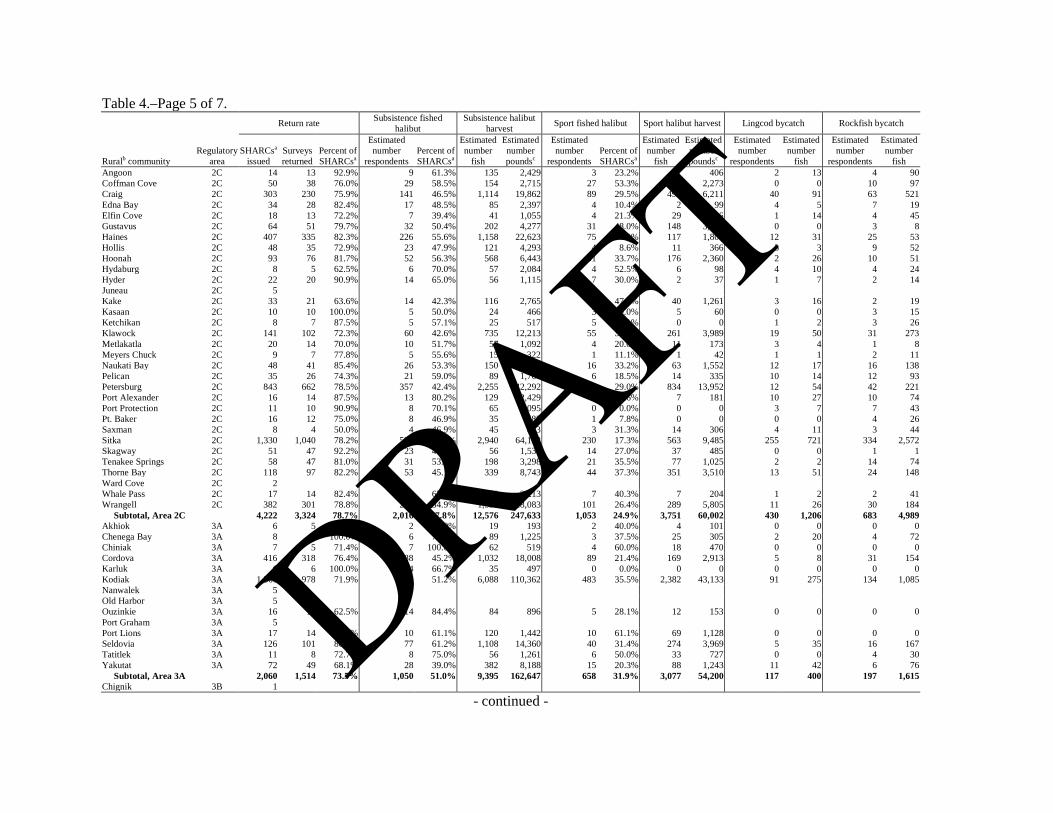
57
Table 4.–Page 5 of 7.
Ruralb community Regulatory
area
Return rate Subsistence fished halibut
Subsistence halibut harvest Sport fished halibut Sport halibut harvest Lingcod bycatch Rockfish bycatch
SHARCsa issued
Surveys returned
Percent of SHARCsa
Estimated number
respondents Percent of SHARCsa
Estimated number
fish
Estimated number poundsc
Estimated number
respondents Percent of SHARCsa
Estimated number
fish
Estimated number poundsc
Estimated number
respondents
Estimated number
fish
Estimated number
respondents
Estimated number
fish Angoon 2C 14 13 92.9% 9 61.3% 135 2,429 3 23.2% 41 406 2 13 4 90 Coffman Cove 2C 50 38 76.0% 29 58.5% 154 2,715 27 53.3% 152 2,273 0 0 10 97 Craig 2C 303 230 75.9% 141 46.5% 1,114 19,862 89 29.5% 493 6,211 40 91 63 521 Edna Bay 2C 34 28 82.4% 17 48.5% 85 2,397 4 10.4% 2 99 4 5 7 19 Elfin Cove 2C 18 13 72.2% 7 39.4% 41 1,055 4 21.3% 29 616 1 14 4 45 Gustavus 2C 64 51 79.7% 32 50.4% 202 4,277 31 48.0% 148 3,364 0 0 3 8 Haines 2C 407 335 82.3% 226 55.6% 1,158 22,623 75 18.5% 117 1,808 12 31 25 53 Hollis 2C 48 35 72.9% 23 47.9% 121 4,293 4 8.6% 11 366 3 3 9 52 Hoonah 2C 93 76 81.7% 52 56.3% 568 6,443 31 33.7% 176 2,360 2 26 10 51 Hydaburg 2C 8 5 62.5% 6 70.0% 57 2,084 4 52.5% 6 98 4 10 4 24 Hyder 2C 22 20 90.9% 14 65.0% 56 1,115 7 30.0% 2 37 1 7 2 14 Juneau 2C 5 Kake 2C 33 21 63.6% 14 42.3% 116 2,765 16 47.0% 40 1,261 3 16 2 19 Kasaan 2C 10 10 100.0% 5 50.0% 24 466 3 30.0% 5 60 0 0 3 15 Ketchikan 2C 8 7 87.5% 5 57.1% 25 517 5 57.1% 0 0 1 2 3 26 Klawock 2C 141 102 72.3% 60 42.6% 735 12,213 55 39.1% 261 3,989 19 50 31 273 Metlakatla 2C 20 14 70.0% 10 51.7% 57 1,092 4 20.0% 11 173 3 4 1 8 Meyers Chuck 2C 9 7 77.8% 5 55.6% 15 322 1 11.1% 1 42 1 1 2 11 Naukati Bay 2C 48 41 85.4% 26 53.3% 150 2,997 16 33.2% 63 1,552 12 17 16 138 Pelican 2C 35 26 74.3% 21 59.0% 89 1,768 6 18.5% 14 335 10 14 12 93 Petersburg 2C 843 662 78.5% 357 42.4% 2,255 42,292 245 29.0% 834 13,952 12 54 42 221 Port Alexander 2C 16 14 87.5% 13 80.2% 129 2,429 4 26.6% 7 181 10 27 10 74 Port Protection 2C 11 10 90.9% 8 70.1% 65 1,095 0 0.0% 0 0 3 7 7 43 Pt. Baker 2C 16 12 75.0% 8 46.9% 35 585 1 7.8% 0 0 0 0 4 26 Saxman 2C 8 4 50.0% 4 46.9% 45 683 3 31.3% 14 306 4 11 3 44 Sitka 2C 1,330 1,040 78.2% 596 44.8% 2,940 64,152 230 17.3% 563 9,485 255 721 334 2,572 Skagway 2C 51 47 92.2% 23 45.9% 56 1,531 14 27.0% 37 485 0 0 1 1 Tenakee Springs 2C 58 47 81.0% 31 53.0% 198 3,298 21 35.5% 77 1,025 2 2 14 74 Thorne Bay 2C 118 97 82.2% 53 45.1% 339 8,743 44 37.3% 351 3,510 13 51 24 148 Ward Cove 2C 2 Whale Pass 2C 17 14 82.4% 11 67.2% 79 3,213 7 40.3% 7 204 1 2 2 41 Wrangell 2C 382 301 78.8% 210 54.9% 1,533 28,083 101 26.4% 289 5,805 11 26 30 184 Subtotal, Area 2C 4,222 3,324 78.7% 2,016 47.8% 12,576 247,633 1,053 24.9% 3,751 60,002 430 1,206 683 4,989 Akhiok 3A 6 5 83.3% 2 40.0% 19 193 2 40.0% 4 101 0 0 0 0 Chenega Bay 3A 8 8 100.0% 6 75.0% 89 1,225 3 37.5% 25 305 2 20 4 72 Chiniak 3A 7 5 71.4% 7 100.0% 62 519 4 60.0% 18 470 0 0 0 0 Cordova 3A 416 318 76.4% 188 45.2% 1,032 18,008 89 21.4% 169 2,913 5 8 31 154 Karluk 3A 6 6 100.0% 4 66.7% 35 497 0 0.0% 0 0 0 0 0 0 Kodiak 3A 1,360 978 71.9% 696 51.2% 6,088 110,362 483 35.5% 2,382 43,133 91 275 134 1,085 Nanwalek 3A 5 Old Harbor 3A 5 Ouzinkie 3A 16 10 62.5% 14 84.4% 84 896 5 28.1% 12 153 0 0 0 0 Port Graham 3A 5 Port Lions 3A 17 14 82.4% 10 61.1% 120 1,442 10 61.1% 69 1,128 0 0 0 0 Seldovia 3A 126 101 80.2% 77 61.2% 1,108 14,360 40 31.4% 274 3,969 5 35 16 167 Tatitlek 3A 11 8 72.7% 8 75.0% 56 1,261 6 50.0% 33 727 0 0 4 30 Yakutat 3A 72 49 68.1% 28 39.0% 382 8,188 15 20.3% 88 1,243 11 42 6 76 Subtotal, Area 3A 2,060 1,514 73.5% 1,050 51.0% 9,395 162,647 658 31.9% 3,077 54,200 117 400 197 1,615 Chignik 3B 1
- continued -
DRAFT
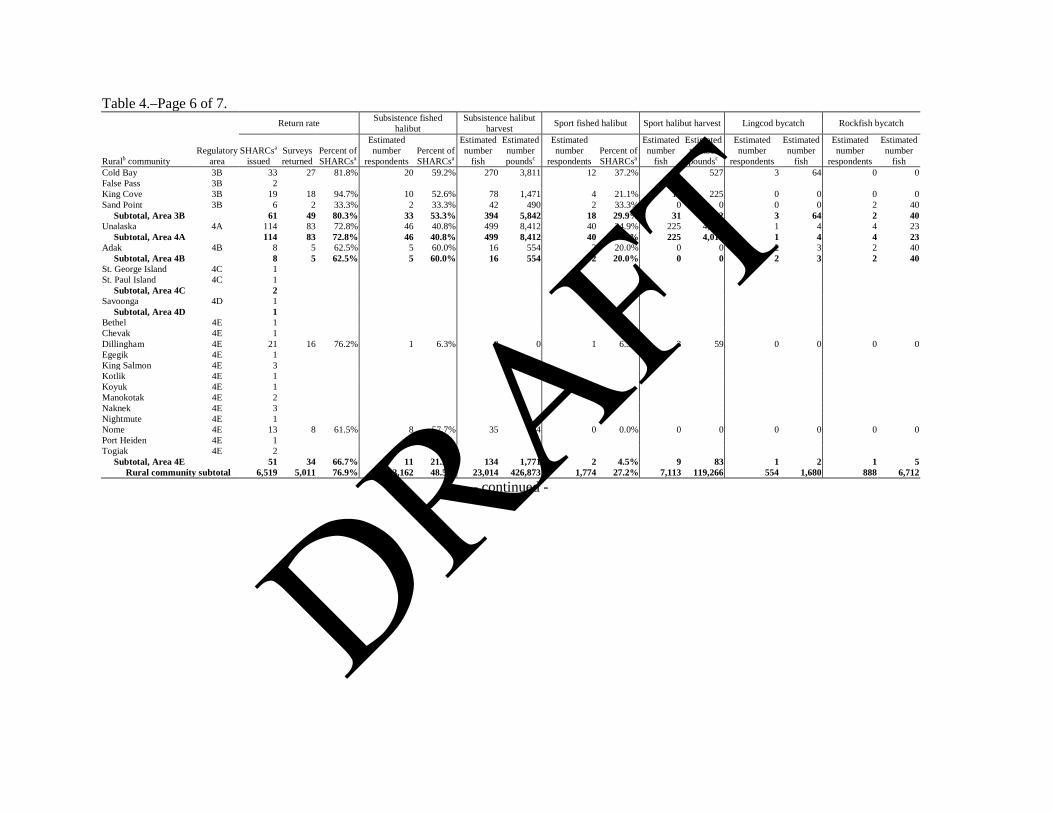
58
Table 4.–Page 6 of 7.
Ruralb community Regulatory
area
Return rate Subsistence fished halibut
Subsistence halibut harvest Sport fished halibut Sport halibut harvest Lingcod bycatch Rockfish bycatch
SHARCsa issued
Surveys returned
Percent of SHARCsa
Estimated number
respondents Percent of SHARCsa
Estimated number
fish
Estimated number poundsc
Estimated number
respondents Percent of SHARCsa
Estimated number
fish
Estimated number poundsc
Estimated number
respondents
Estimated number
fish
Estimated number
respondents
Estimated number
fish Cold Bay 3B 33 27 81.8% 20 59.2% 270 3,811 12 37.2% 21 527 3 64 0 0 False Pass 3B 2 King Cove 3B 19 18 94.7% 10 52.6% 78 1,471 4 21.1% 10 225 0 0 0 0 Sand Point 3B 6 2 33.3% 2 33.3% 42 490 2 33.3% 0 0 0 0 2 40 Subtotal, Area 3B 61 49 80.3% 33 53.3% 394 5,842 18 29.9% 31 752 3 64 2 40 Unalaska 4A 114 83 72.8% 46 40.8% 499 8,412 40 34.9% 225 4,019 1 4 4 23 Subtotal, Area 4A 114 83 72.8% 46 40.8% 499 8,412 40 34.9% 225 4,019 1 4 4 23 Adak 4B 8 5 62.5% 5 60.0% 16 554 2 20.0% 0 0 2 3 2 40 Subtotal, Area 4B 8 5 62.5% 5 60.0% 16 554 2 20.0% 0 0 2 3 2 40 St. George Island 4C 1 St. Paul Island 4C 1 Subtotal, Area 4C 2 Savoonga 4D 1 Subtotal, Area 4D 1 Bethel 4E 1 Chevak 4E 1 Dillingham 4E 21 16 76.2% 1 6.3% 0 0 1 6.3% 3 59 0 0 0 0 Egegik 4E 1 King Salmon 4E 3 Kotlik 4E 1 Koyuk 4E 1 Manokotak 4E 2 Naknek 4E 3 Nightmute 4E 1 Nome 4E 13 8 61.5% 8 57.7% 35 704 0 0.0% 0 0 0 0 0 0 Port Heiden 4E 1 Togiak 4E 2 Subtotal, Area 4E 51 34 66.7% 11 21.2% 134 1,771 2 4.5% 9 83 1 2 1 5 Rural community subtotal 6,519 5,011 76.9% 3,162 48.5% 23,014 426,873 1,774 27.2% 7,113 119,266 554 1,680 888 6,712
- continued -
DRAFT
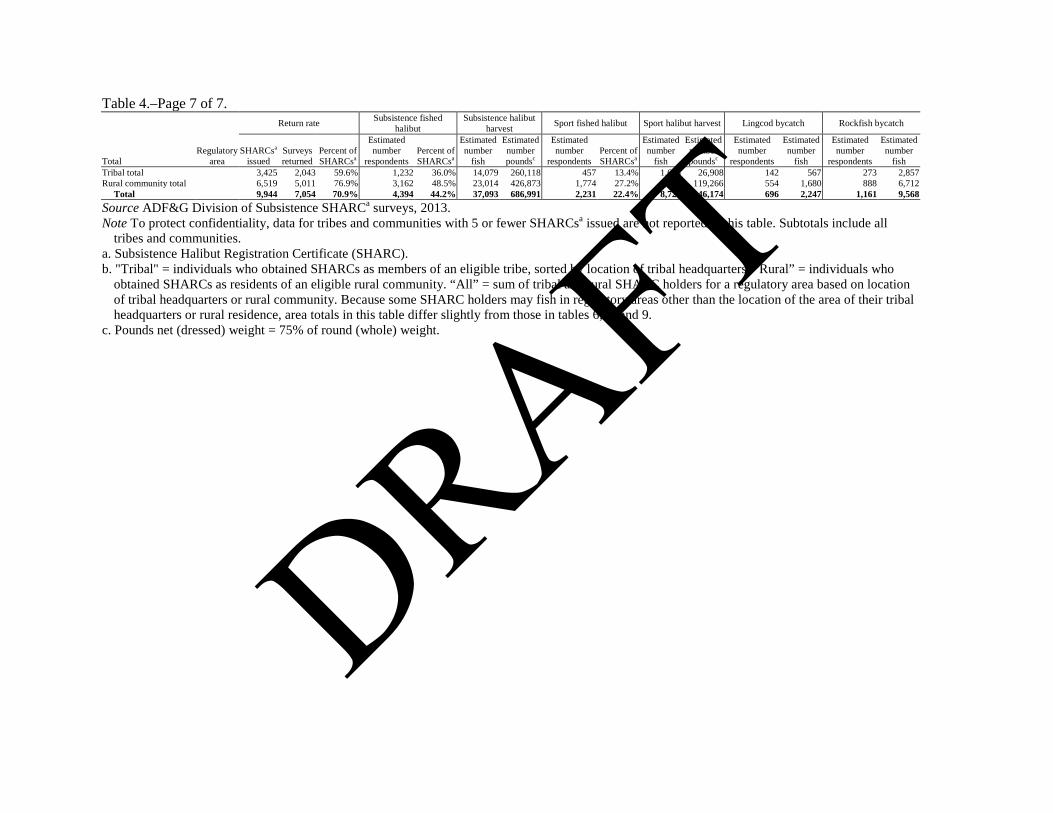
59
Table 4.–Page 7 of 7.
Total Regulatory
area
Return rate Subsistence fished halibut
Subsistence halibut harvest Sport fished halibut Sport halibut harvest Lingcod bycatch Rockfish bycatch
SHARCsa issued
Surveys returned
Percent of SHARCsa
Estimated number
respondents Percent of SHARCsa
Estimated number
fish
Estimated number poundsc
Estimated number
respondents Percent of SHARCsa
Estimated number
fish
Estimated number poundsc
Estimated number
respondents
Estimated number
fish
Estimated number
respondents
Estimated number
fish Tribal total 3,425 2,043 59.6% 1,232 36.0% 14,079 260,118 457 13.4% 1,614 26,908 142 567 273 2,857 Rural community total 6,519 5,011 76.9% 3,162 48.5% 23,014 426,873 1,774 27.2% 7,113 119,266 554 1,680 888 6,712 Total 9,944 7,054 70.9% 4,394 44.2% 37,093 686,991 2,231 22.4% 8,727 146,174 696 2,247 1,161 9,568 Source ADF&G Division of Subsistence SHARCa surveys, 2013. Note To protect confidentiality, data for tribes and communities with 5 or fewer SHARCsa issued are not reported in this table. Subtotals include all
tribes and communities. a. Subsistence Halibut Registration Certificate (SHARC). b. "Tribal" = individuals who obtained SHARCs as members of an eligible tribe, sorted by location of tribal headquarters. “Rural” = individuals who
obtained SHARCs as residents of an eligible rural community. “All” = sum of tribal and rural SHARC holders for a regulatory area based on location of tribal headquarters or rural community. Because some SHARC holders may fish in regulatory areas other than the location of the area of their tribal headquarters or rural residence, area totals in this table differ slightly from those in tables 6, 7, and 9.
c. Pounds net (dressed) weight = 75% of round (whole) weight.
DRAFT

60
Table 5.–Age of Subsistence Halibut Registration Certificate holders by SHARC type, 2012.
SHARC type
Age cohort (years) Number of SHARC holders
Total 0–4 5–9 10–14 15–19 20–24 25–29 30–34 35–39 40–44 45–49 50–54 55–59 60–64 65–69 70–74 75–79 80–84 85–89 90–94 95+
Tribal 9 53 109 158 222 246 245 259 262 345 404 376 300 192 121 77 29 12 3 1 3,425 0.3% 1.6% 3.2% 4.6% 6.5% 7.2% 7.2% 7.6% 7.7% 10.1% 11.8% 11.0% 8.7% 5.6% 3.5% 2.3% 0.8% 0.4% 0.1% 0.0%
Rural 11 38 93 160 152 321 441 517 565 623 884 925 771 525 294 133 49 13 3 1 6,519 0.2% 0.6% 1.4% 2.5% 2.3% 4.9% 6.8% 7.9% 8.7% 9.6% 13.6% 14.2% 11.8% 8.1% 4.5% 2.0% 0.8% 0.2% 0.0% 0.0%
Total 20 91 202 319 375 567 686 776 827 968 1,287 1,300 1,071 717 415 210 78 25 6 2 9,944
0.2% 0.9% 2.0% 3.2% 3.8% 5.7% 6.9% 7.8% 8.3% 9.7% 12.9% 13.1% 10.8% 7.2% 4.2% 2.1% 0.8% 0.3% 0.1% 0.0%
Source SHARC database, Restricted Access Management Program, NMFS, Juneau, as of 12/31/2012.
DRAFT

61
Table 6.–Estimated harvests of halibut in numbers of fish and pounds net (dressed, head-off) weight by regulatory area and subarea, 2012.
Subarea Regulatory
area
Number of SHARCs
subsistence fishedc
Estimated subsistence harvest by gear typea
Estimated sport harvest Set hook gear
Hook and line or handline
All gear Estimated number
respondents fished
Estimated number halibut
harvested
Estimated pounds halibut
harvestedb
Estimated number
respondents fished
Estimated number halibut
harvested
Estimated pounds halibut
harvestedb
Estimated number
respondents fished
Estimated number halibut
harvested
Estimated pounds halibut
harvestedb
Estimated number
respondents fished
Estimated number halibut
harvested
Estimated pounds halibut
harvestedb Northern Southeast Alaska 2C 687 613 3,813 68,658
238 983 14,966
687 4,796 83,624
311 1,018 15,859
Sitka LAMP Area 2C 690 651 2,813 67,374
179 452 7,140
690 3,266 74,514
248 533 9,637 Southern Southeast Alaska 2C 1,436 1,216 8,887 190,217
559 2,806 47,688
1,436 11,694 237,905
802 3,036 49,898
Subtotal, Area 2C
2,715 2,387 15,514 326,249
940 4,241 69,794
2,715 19,755 396,043
1,312 4,587 75,394 Cook Inlet 3A 262 167 2,468 37,940
168 2,534 27,161
262 5,002 65,100
141 649 9,133
Kodiak Island Other 3A 553 434 2,530 48,027
265 1,234 19,887
553 3,765 67,914
300 987 16,571 Kodiak Island Road System 3A 553 453 2,786 54,545
255 1,091 17,971
553 3,877 72,516
391 1,650 30,704
Prince William Sound 3A 262 234 1,293 23,693
96 253 4,179
262 1,545 27,873
138 278 4,680 Yakutat Area 3A 70 57 738 17,902
27 121 2,210
70 859 20,113
31 133 2,476
Subtotal, Area 3A
1,474 1,151 9,814 182,107
690 5,233 71,409
1,474 15,047 253,516
845 3,697 63,565 Chignik Area 3B 26 19 109 1,617
18 68 1,178
26 177 2,795
4 7 103
Lower Alaska Peninsula 3B 112 69 580 8,730
77 328 4,434
112 907 13,164
58 193 2,892 Subtotal, Area 3B
137 88 689 10,347
94 395 5,612
137 1,085 15,959
62 200 2,994
Eastern Aleutians–East 4A 60 40 282 4,512
39 272 4,548
60 554 9,061
38 205 3,614 Eastern Aleutians–West 4A 6 5 19 445
5 3 37
6 22 482
9 27 450
Subtotal, Area 4A
61 40 301 4,957
41 275 4,586
61 576 9,543
44 232 4,064 Western Aleutians–East 4B 10 6 79 1,558
7 6 141
10 84 1,698
2 0 0
Subtotal, Area 4B
10 6 79 1,558
7 6 141
10 84 1,698
2 0 0 St. Paul Island 4C 9 5 65 686
5 19 490
9 84 1,176
0 0 0
Subtotal, Area 4C
9 5 65 686
5 19 490
9 84 1,176
0 0 0 St. Lawrence Island 4D 5 5 22 672
0 0 0
5 22 672
0 0 0
Subtotal, Area 4D
5 5 22 672
0 0 0
5 22 672
0 0 0 Bristol Bay 4E 6 5 14 259
6 5 70
6 18 329
1 0 0
Norton Sound 4E 9 9 41 816
0 0 0
9 41 816
0 0 0 Yukon Delta 4E 41 19 198 4,973
26 183 2,266
41 381 7,239
3 11 158
Subtotal, Area 4E
55 32 252 6,048
32 187 2,336
55 440 8,384
4 11 158 Total 4,394 3,655 26,736 532,623 1,775 10,357 154,368 4,394 37,093 686,991 2,231 8,727 146,174
Source ADF&G Division of Subsistence SHARC survey, 2013. a. "Setline" = longline or skate. "Hand-operated gear" = rod and reel, or handline. b. Weights given are "net weight." Pounds net (dressed, head off) weight = 75% of round (whole) weight. c. Because fishers may fish in more than one area, subtotals for regulatory areas and the state total might exceed the sum of the subarea values. Includes
subsistence and sport fishing.
DRAFT
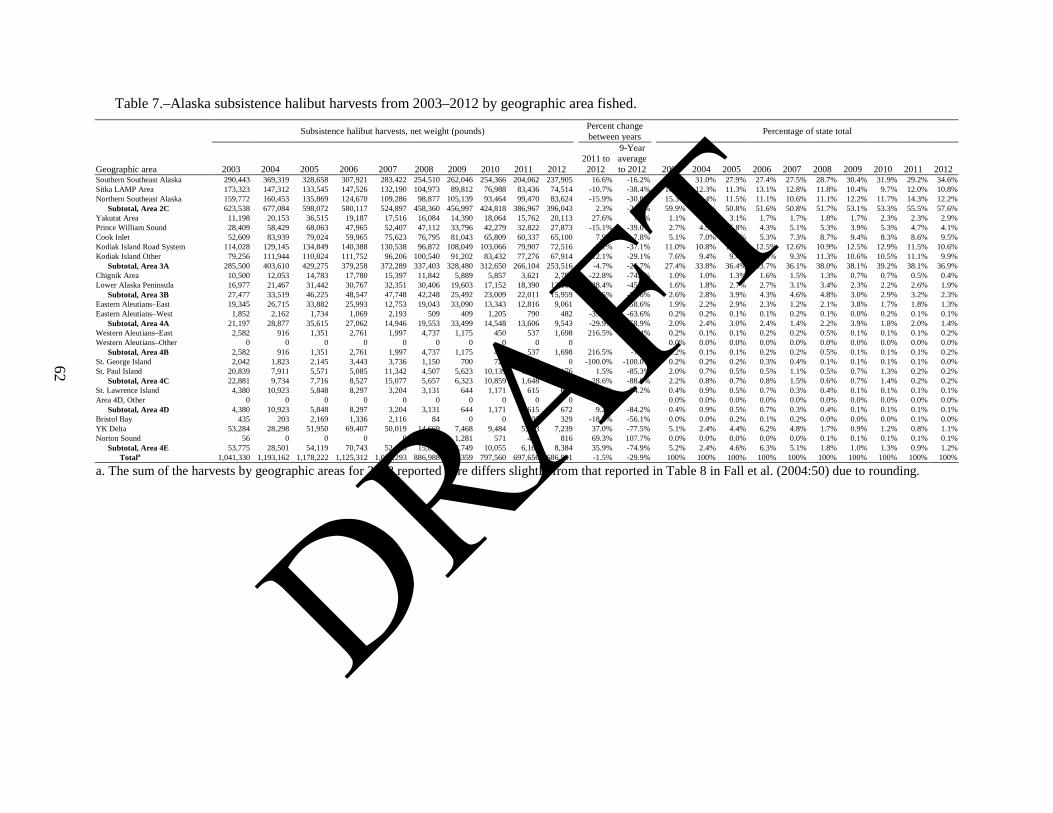
62
Table 7.–Alaska subsistence halibut harvests from 2003–2012 by geographic area fished.
Geographic area
Subsistence halibut harvests, net weight (pounds)
Percent change between years
Percentage of state total
2003 2004 2005 2006 2007 2008 2009 2010 2011 2012 2011 to
2012
9-Year average to 2012 2003 2004 2005 2006 2007 2008 2009 2010 2011 2012
Southern Southeast Alaska 290,443 369,319 328,658 307,921 283,422 254,510 262,046 254,366 204,062 237,905 16.6% -16.2% 27.9% 31.0% 27.9% 27.4% 27.5% 28.7% 30.4% 31.9% 29.2% 34.6% Sitka LAMP Area 173,323 147,312 133,545 147,526 132,190 104,973 89,812 76,988 83,436 74,514 -10.7% -38.4% 16.6% 12.3% 11.3% 13.1% 12.8% 11.8% 10.4% 9.7% 12.0% 10.8% Northern Southeast Alaska 159,772 160,453 135,869 124,670 109,286 98,877 105,139 93,464 99,470 83,624 -15.9% -30.8% 15.3% 13.4% 11.5% 11.1% 10.6% 11.1% 12.2% 11.7% 14.3% 12.2% Subtotal, Area 2C 623,538 677,084 598,072 580,117 524,897 458,360 456,997 424,818 386,967 396,043 2.3% -24.7% 59.9% 56.7% 50.8% 51.6% 50.8% 51.7% 53.1% 53.3% 55.5% 57.6% Yakutat Area 11,198 20,153 36,515 19,187 17,516 16,084 14,390 18,064 15,762 20,113 27.6% 7.2% 1.1% 1.7% 3.1% 1.7% 1.7% 1.8% 1.7% 2.3% 2.3% 2.9% Prince William Sound 28,409 58,429 68,063 47,965 52,407 47,112 33,796 42,279 32,822 27,873 -15.1% -39.0% 2.7% 4.9% 5.8% 4.3% 5.1% 5.3% 3.9% 5.3% 4.7% 4.1% Cook Inlet 52,609 83,939 79,024 59,965 75,623 76,795 81,043 65,809 60,337 65,100 7.9% -7.8% 5.1% 7.0% 6.7% 5.3% 7.3% 8.7% 9.4% 8.3% 8.6% 9.5% Kodiak Island Road System 114,028 129,145 134,849 140,388 130,538 96,872 108,049 103,066 79,907 72,516 -9.2% -37.1% 11.0% 10.8% 11.4% 12.5% 12.6% 10.9% 12.5% 12.9% 11.5% 10.6% Kodiak Island Other 79,256 111,944 110,824 111,752 96,206 100,540 91,202 83,432 77,276 67,914 -12.1% -29.1% 7.6% 9.4% 9.4% 9.9% 9.3% 11.3% 10.6% 10.5% 11.1% 9.9% Subtotal, Area 3A 285,500 403,610 429,275 379,258 372,289 337,403 328,480 312,650 266,104 253,516 -4.7% -26.7% 27.4% 33.8% 36.4% 33.7% 36.1% 38.0% 38.1% 39.2% 38.1% 36.9% Chignik Area 10,500 12,053 14,783 17,780 15,397 11,842 5,889 5,857 3,621 2,795 -22.8% -74.3% 1.0% 1.0% 1.3% 1.6% 1.5% 1.3% 0.7% 0.7% 0.5% 0.4% Lower Alaska Peninsula 16,977 21,467 31,442 30,767 32,351 30,406 19,603 17,152 18,390 13,164 -28.4% -45.8% 1.6% 1.8% 2.7% 2.7% 3.1% 3.4% 2.3% 2.2% 2.6% 1.9% Subtotal, Area 3B 27,477 33,519 46,225 48,547 47,748 42,248 25,492 23,009 22,011 15,959 -27.5% -54.6% 2.6% 2.8% 3.9% 4.3% 4.6% 4.8% 3.0% 2.9% 3.2% 2.3% Eastern Aleutians–East 19,345 26,715 33,882 25,993 12,753 19,043 33,090 13,343 12,816 9,061 -29.3% -58.6% 1.9% 2.2% 2.9% 2.3% 1.2% 2.1% 3.8% 1.7% 1.8% 1.3% Eastern Aleutians–West 1,852 2,162 1,734 1,069 2,193 509 409 1,205 790 482 -39.0% -63.6% 0.2% 0.2% 0.1% 0.1% 0.2% 0.1% 0.0% 0.2% 0.1% 0.1% Subtotal, Area 4A 21,197 28,877 35,615 27,062 14,946 19,553 33,499 14,548 13,606 9,543 -29.9% -58.9% 2.0% 2.4% 3.0% 2.4% 1.4% 2.2% 3.9% 1.8% 2.0% 1.4% Western Aleutians–East 2,582 916 1,351 2,761 1,997 4,737 1,175 450 537 1,698 216.5% -7.4% 0.2% 0.1% 0.1% 0.2% 0.2% 0.5% 0.1% 0.1% 0.1% 0.2% Western Aleutians–Other 0 0 0 0 0 0 0 0 0 0 0.0% 0.0% 0.0% 0.0% 0.0% 0.0% 0.0% 0.0% 0.0% 0.0% Subtotal, Area 4B 2,582 916 1,351 2,761 1,997 4,737 1,175 450 537 1,698 216.5% -7.4% 0.2% 0.1% 0.1% 0.2% 0.2% 0.5% 0.1% 0.1% 0.1% 0.2% St. George Island 2,042 1,823 2,145 3,443 3,736 1,150 700 720 490 0 -100.0% -100.0% 0.2% 0.2% 0.2% 0.3% 0.4% 0.1% 0.1% 0.1% 0.1% 0.0% St. Paul Island 20,839 7,911 5,571 5,085 11,342 4,507 5,623 10,139 1,158 1,176 1.5% -85.3% 2.0% 0.7% 0.5% 0.5% 1.1% 0.5% 0.7% 1.3% 0.2% 0.2% Subtotal, Area 4C 22,881 9,734 7,716 8,527 15,077 5,657 6,323 10,859 1,648 1,176 -28.6% -88.0% 2.2% 0.8% 0.7% 0.8% 1.5% 0.6% 0.7% 1.4% 0.2% 0.2% St. Lawrence Island 4,380 10,923 5,848 8,297 3,204 3,131 644 1,171 615 672 9.2% -84.2% 0.4% 0.9% 0.5% 0.7% 0.3% 0.4% 0.1% 0.1% 0.1% 0.1% Area 4D, Other 0 0 0 0 0 0 0 0 0 0 0.0% 0.0% 0.0% 0.0% 0.0% 0.0% 0.0% 0.0% 0.0% 0.0% Subtotal, Area 4D 4,380 10,923 5,848 8,297 3,204 3,131 644 1,171 615 672 9.2% -84.2% 0.4% 0.9% 0.5% 0.7% 0.3% 0.4% 0.1% 0.1% 0.1% 0.1% Bristol Bay 435 203 2,169 1,336 2,116 84 0 0 403 329 -18.3% -56.1% 0.0% 0.0% 0.2% 0.1% 0.2% 0.0% 0.0% 0.0% 0.1% 0.0% YK Delta 53,284 28,298 51,950 69,407 50,019 14,669 7,468 9,484 5,283 7,239 37.0% -77.5% 5.1% 2.4% 4.4% 6.2% 4.8% 1.7% 0.9% 1.2% 0.8% 1.1% Norton Sound 56 0 0 0 0 1,145 1,281 571 482 816 69.3% 107.7% 0.0% 0.0% 0.0% 0.0% 0.0% 0.1% 0.1% 0.1% 0.1% 0.1% Subtotal, Area 4E 53,775 28,501 54,119 70,743 52,135 15,898 8,749 10,055 6,168 8,384 35.9% -74.9% 5.2% 2.4% 4.6% 6.3% 5.1% 1.8% 1.0% 1.3% 0.9% 1.2% Totala 1,041,330 1,193,162 1,178,222 1,125,312 1,032,293 886,988 861,359 797,560 697,656 686,991 -1.5% -29.9% 100% 100% 100% 100% 100% 100% 100% 100% 100% 100%
a. The sum of the harvests by geographic areas for 2003 reported here differs slightly from that reported in Table 8 in Fall et al. (2004:50) due to rounding.
DRAFT

63
Table 8.–Number of hooks usually fished, setline (stationary) gear, Alaska halibut subsistence fishery, 2012.
Regulatory area
SHARC holders
Number of hooksb
Totala 1 2 3 4 5 6 7 8 9 10 11 12 13 14 15 16 17 18 19 20 21 22 23 24 25 26 27 28 29 30 Missing
2C No. 6,292 13 10 5 0 16 9 2 17 4 120 3 47 6 13 424 10 0 11 2 371 2 6 0 13 144 25 12 78 28 907 94 2,392
Pct.
0.5 0.4 0.2 0.0 0.7 0.4 0.1 0.7 0.2 5.0 0.1 2.0 0.3 0.6 17.7 0.4 0.0 0.5 0.1 15.5 0.1 0.2 0.0 0.5 6.0 1.1 0.5 3.2 1.1 37.9 3.6
3A No. 2,936 1 9 4 4 4 5 3 4 1 65 0 11 1 0 44 4 1 8 1 187 1 0 1 3 118 7 6 34 11 500 50 1,091
Pct.
0.1 0.8 0.4 0.4 0.4 0.5 0.3 0.4 0.1 6.0 0.0 1.0 0.1 0.0 4.1 0.4 0.1 0.8 0.1 17.2 0.1 0.0 0.1 0.2 10.8 0.6 0.5 3.1 1.0 45.8 6.7
3B No. 338 0 1 0 0 0 2 2 0 0 5 0 7 0 0 3 0 0 0 0 10 0 0 0 0 1 0 0 0 1 47 7 87
Pct.
0.0 1.4 0.0 0.0 0.0 2.8 2.5 0.0 0.0 5.3 0.0 7.9 0.0 0.0 3.6 0.0 0.0 0.0 0.0 11.0 0.0 0.0 0.0 0.0 1.3 0.0 0.0 0.0 1.6 54.2 10.9
4A No. 152 2 0 0 0 0 0 0 0 0 1 0 0 0 1 3 0 0 0 0 6 0 1 0 0 2 0 0 0 1 17 2 37
Pct.
6.1 0.0 0.0 0.0 0.0 0.0 0.0 0.0 0.0 3.7 0.0 0.0 0.0 3.7 7.3 0.0 0.0 0.0 0.0 16.1 0.0 3.7 0.0 0.0 4.1 0.0 0.0 0.0 3.7 45.8 5.3
4B No. 12 0 0 0 0 0 0 0 0 0 4 0 0 0 0 0 0 0 0 0 2 0 0 0 0 0 0 0 0 0 2 0 7
Pct.
0.0 0.0 0.0 0.0 0.0 0.0 0.0 0.0 0.0 52.9 0.0 0.0 0.0 0.0 0.0 0.0 0.0 0.0 0.0 23.5 0.0 0.0 0.0 0.0 0.0 0.0 0.0 0.0 0.0 23.5 0.0
4C No. 22 0 0 0 0 0 0 0 0 0 0 0 0 0 0 0 0 0 0 0 0 0 0 0 0 0 0 0 0 0 5 5 9
Pct.
0.0 0.0 0.0 0.0 0.0 0.0 0.0 0.0 0.0 0.0 0.0 0.0 0.0 0.0 0.0 0.0 0.0 0.0 0.0 0.0 0.0 0.0 0.0 0.0 0.0 0.0 0.0 0.0 0.0 50.0 10.4
4D No. 7 0 0 0 0 0 0 0 0 0 0 0 0 0 0 1 0 0 0 0 1 0 0 0 0 0 0 0 0 0 3 0 6
Pct.
0.0 0.0 0.0 0.0 0.0 0.0 0.0 0.0 0.0 0.0 0.0 0.0 0.0 0.0 21.7 0.0 0.0 0.0 0.0 21.7 0.0 0.0 0.0 0.0 0.0 0.0 0.0 0.0 0.0 56.5 0.0
4E No. 185 1 1 0 0 0 0 0 3 0 3 0 0 0 0 2 0 0 0 0 1 0 0 0 0 0 0 0 0 0 13 3 27
Pct.
3.7 3.7 0.0 0.0 0.0 0.0 0.0 11.2 0.0 11.2 0.0 0.0 0.0 0.0 7.5 0.0 0.0 0.0 0.0 3.7 0.0 0.0 0.0 0.0 0.0 0.0 0.0 0.0 0.0 46.7 4.1
Alaska No. 9,944 17 21 9 4 20 17 8 24 5 198 3 66 7 15 478 14 1 20 4 577 3 7 1 15 264 32 18 111 42 1,493 162 3,655
Pct.
0.5 0.6 0.3 0.1 0.5 0.5 0.2 0.6 0.1 5.4 0.1 1.8 0.2 0.4 13.1 0.4 0.0 0.5 0.1 15.8 0.1 0.2 0.0 0.4 7.2 0.9 0.5 3.0 1.1 40.8 4.4
Source ADF&G Division of Subsistence, SHARC surveys, 2013. a. Number of fishers using setline (fixed) gear. Based on location of tribe or rural community of SHARC holder. b. The column for 30 hooks includes those fishers who reported using more than 30. There is no 30-hook limit in Areas 4C, 4D, or 4E.
DRAFT
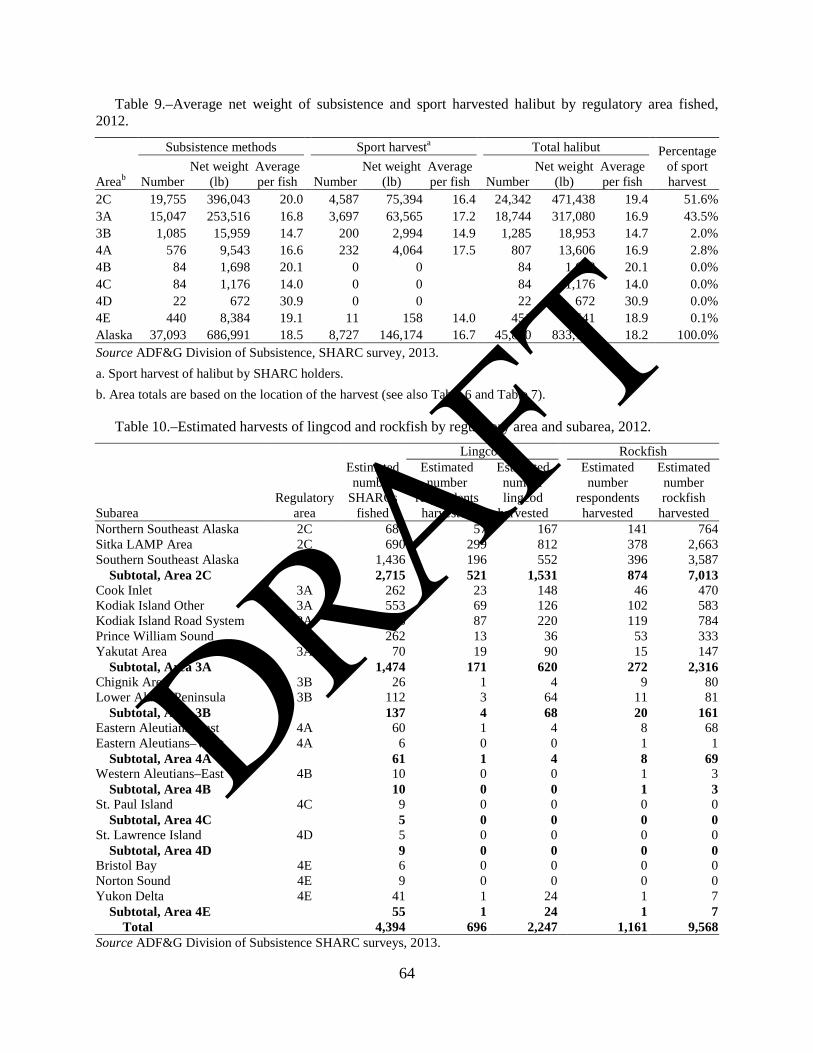
Table 9.–Average net weight of subsistence and sport harvested halibut by regulatory area fished, 2012.
Areab
Subsistence methods
Sport harvesta
Total halibut
Percentage of sport harvest Number
Net weight (lb)
Average per fish Number
Net weight (lb)
Average per fish Number
Net weight (lb)
Average per fish
2C 19,755 396,043 20.0
4,587 75,394 16.4
24,342 471,438 19.4
51.6% 3A 15,047 253,516 16.8
3,697 63,565 17.2
18,744 317,080 16.9
43.5%
3B 1,085 15,959 14.7
200 2,994 14.9
1,285 18,953 14.7
2.0% 4A 576 9,543 16.6
232 4,064 17.5
807 13,606 16.9
2.8%
4B 84 1,698 20.1
0 0
84 1,698 20.1
0.0% 4C 84 1,176 14.0
0 0
84 1,176 14.0
0.0%
4D 22 672 30.9
0 0
22 672 30.9
0.0% 4E 440 8,384 19.1
11 158 14.0
451 8,541 18.9
0.1%
Alaska 37,093 686,991 18.5
8,727 146,174 16.7
45,820 833,165 18.2
100.0% Source ADF&G Division of Subsistence, SHARC survey, 2013. a. Sport harvest of halibut by SHARC holders. b. Area totals are based on the location of the harvest (see also Table 6 and Table 7).
Table 10.–Estimated harvests of lingcod and rockfish by regulatory area and subarea, 2012.
Subarea Regulatory
area
Estimated number
SHARCs fished
Lingcod
Rockfish Estimated number
respondents harvested
Estimated number lingcod
harvested
Estimated number
respondents harvested
Estimated number rockfish
harvested Northern Southeast Alaska 2C 687 57 167
141 764
Sitka LAMP Area 2C 690 299 812
378 2,663 Southern Southeast Alaska 2C 1,436 196 552
396 3,587
Subtotal, Area 2C
2,715 521 1,531
874 7,013 Cook Inlet 3A 262 23 148
46 470
Kodiak Island Other 3A 553 69 126
102 583 Kodiak Island Road System 3A 553 87 220
119 784
Prince William Sound 3A 262 13 36
53 333 Yakutat Area 3A 70 19 90
15 147
Subtotal, Area 3A
1,474 171 620
272 2,316 Chignik Area 3B 26 1 4
9 80
Lower Alaska Peninsula 3B 112 3 64
11 81 Subtotal, Area 3B
137 4 68
20 161
Eastern Aleutians–East 4A 60 1 4
8 68 Eastern Aleutians–West 4A 6 0 0
1 1
Subtotal, Area 4A
61 1 4
8 69 Western Aleutians–East 4B 10 0 0
1 3
Subtotal, Area 4B
10 0 0
1 3 St. Paul Island 4C 9 0 0
0 0
Subtotal, Area 4C
5 0 0
0 0 St. Lawrence Island 4D 5 0 0
0 0
Subtotal, Area 4D
9 0 0
0 0 Bristol Bay 4E 6 0 0
0 0
Norton Sound 4E 9 0 0
0 0 Yukon Delta 4E 41 1 24
1 7
Subtotal, Area 4E
55 1 24
1 7 Total
4,394 696 2,247
1,161 9,568
Source ADF&G Division of Subsistence SHARC surveys, 2013.
64
DRAFT
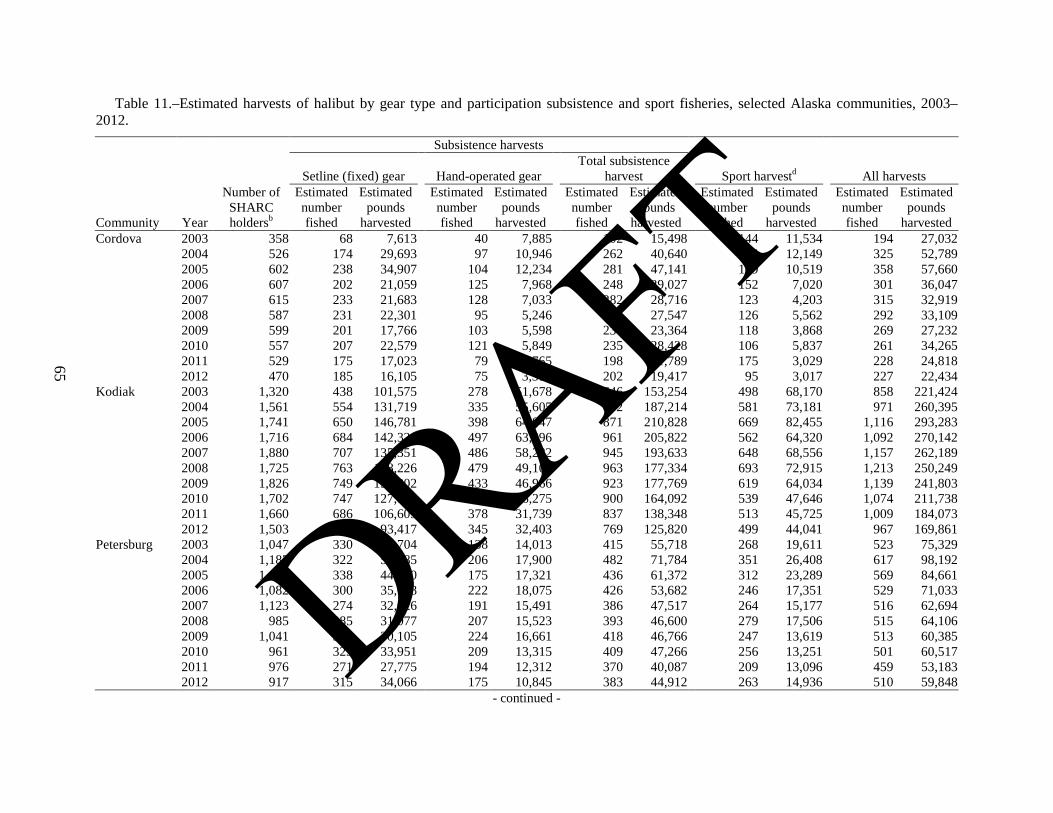
65
Table 11.–Estimated harvests of halibut by gear type and participation subsistence and sport fisheries, selected Alaska communities, 2003–2012.
Community Year
Number of SHARC holdersb
Subsistence harvests
Sport harvestd
All harvests Setline (fixed) gear
Hand-operated gear
Total subsistence harvest
Estimated number fished
Estimated pounds
harvested
Estimated number fished
Estimated pounds
harvested
Estimated number fished
Estimated pounds
harvested
Estimated number fished
Estimated pounds
harvested
Estimated number fished
Estimated pounds
harvested Cordova 2003 358 68 7,613
40 7,885
102 15,498
144 11,534
194 27,032
2004 526 174 29,693
97 10,946
262 40,640
174 12,149
325 52,789
2005 602 238 34,907
104 12,234
281 47,141
179 10,519
358 57,660
2006 607 202 21,059
125 7,968
248 29,027
152 7,020
301 36,047
2007 615 233 21,683
128 7,033
282 28,716
123 4,203
315 32,919
2008 587 231 22,301
95 5,246
254 27,547
126 5,562
292 33,109
2009 599 201 17,766
103 5,598
234 23,364
118 3,868
269 27,232
2010 557 207 22,579
121 5,849
235 28,428
106 5,837
261 34,265
2011 529 175 17,023
79 4,765
198 21,789
175 3,029
228 24,818
2012 470 185 16,105
75 3,312
202 19,417
95 3,017
227 22,434
Kodiak 2003 1,320 438 101,575
278 51,678
646 153,254
498 68,170
858 221,424
2004 1,561 554 131,719
335 55,605
802 187,214
581 73,181
971 260,395
2005 1,741 650 146,781
398 64,047
871 210,828
669 82,455
1,116 293,283
2006 1,716 684 142,326
497 63,496
961 205,822
562 64,320
1,092 270,142
2007 1,880 707 135,351
486 58,282
945 193,633
648 68,556
1,157 262,189
2008 1,725 763 128,226
479 49,108
963 177,334
693 72,915
1,213 250,249
2009 1,826 749 130,802
433 46,966
923 177,769
619 64,034
1,139 241,803
2010 1,702 747 127,816
374 36,275
900 164,092
539 47,646
1,074 211,738
2011 1,660 686 106,609
378 31,739
837 138,348
513 45,725
1,009 184,073
2012 1,503 619 93,417
345 32,403
769 125,820
499 44,041
967 169,861
Petersburg 2003 1,047 330 41,704
138 14,013
415 55,718
268 19,611
523 75,329
2004 1,187 322 53,885
206 17,900
482 71,784
351 26,408
617 98,192
2005 1,197 338 44,050
175 17,321
436 61,372
312 23,289
569 84,661
2006 1,082 300 35,608
222 18,075
426 53,682
246 17,351
529 71,033
2007 1,123 274 32,026
191 15,491
386 47,517
264 15,177
516 62,694
2008 985 285 31,077
207 15,523
393 46,600
279 17,506
515 64,106
2009 1,041 323 30,105
224 16,661
418 46,766
247 13,619
513 60,385
2010 961 323 33,951
209 13,315
409 47,266
256 13,251
501 60,517
2011 976 271 27,775
194 12,312
370 40,087
209 13,096
459 53,183
2012 917 315 34,066
175 10,845
383 44,912
263 14,936
510 59,848
- continued -
DRAFT

66
Table 11.–Page 2 of 4.
Community Year
Number of SHARC holdersb
Subsistence harvests
Sport harvestd
All harvests Setline (fixed) gear
Hand-operated gear
Total subsistence harvest
Estimated number fished
Estimated pounds
harvested
Estimated number fished
Estimated pounds
harvested
Estimated number fished
Estimated pounds
harvested
Estimated number fished
Estimated pounds
harvested
Estimated number fished
Estimated pounds
harvested Port Graham 2003 52 10 4,398
28 7,056
35 11,454
3 156
36 11,610
2004 57 15 4,425
31 4,755
42 9,181
11 850
42 10,031
2005 52 8 7,938
18 3,190
18 11,127
9 488
18 11,615
2006 50 9 2,397
24 3,797
30 6,194
2 0
30 6,194
2007 59 22 5,347
28 3,146
36 8,493
4 233
36 8,726
2008 48 13 6,896
23 2,200
30 9,097
2 51
30 9,148
2009 47 22 1,454
31 4,973
35 6,426
9 197
35 6,623
2010 47 23 5,011
18 2,211
30 7,222
5 267
30 7,489
2011 46 13 2,569
9 1,059
15 3,638
0 0
15 3,638
2012 32 10 1,677
11 1,783
18 3,460
5 44
19 3,503
Sand Point 2003 73 15 3,409
11 1,410
21 4,819
11 410
21 5,229
2004 351 25 4,360
74 6,996
109 11,355
50 1,384
121 12,739
2005 321 35 12,201
77 9,700
100 21,901
23 1,281
105 23,182
2006 365 59 7,406
87 12,809
133 20,214
29 6,300
140 26,514
2007 364 49 13,278
113 11,337
138 24,615
16 3,034
138 27,649
2008 342 71 15,766
88 9,247
130 25,013
19 2,195
132 27,208
2009 137 28 3,987
58 7,772
70 11,759
19 2,665
70 14,424
2010 130 22 3,408
50 3,898
61 7,306
18 1,129
67 8,435
2011 136 51 7,358
74 6,039
85 13,397
23 1,243
87 14,640
2012 136 30 3,401
46 2,307
61 5,708
32 1,280
75 6,989
Sitka 2003 1,639 760 155,276
160 19,604
821 174,880
401 32,408
956 207,288
2004 1,871 714 151,660
147 14,739
904 166,474
412 25,829
1,026 192,303
2005 1,974 738 126,426
172 19,893
814 146,319
417 55,913
987 202,232
2006 1,895 809 145,542
297 17,830
915 163,372
395 23,032
1,036 186,404
2007 1,954 839 115,162
270 26,886
921 142,049
315 16,200
1,010 158,249
2008 1,662 784 96,314
232 13,266
845 109,581
307 13,055
932 122,636
2009 1,731 774 86,219
265 11,205
844 97,424
265 10,516
941 107,940
2010 1,635 700 74,394
218 8,334
755 82,728
228 9,257
849 91,985
2011 1,658 739 84,426
159 8,604
784 93,030
249 8,336
867 101,366
2012 1,570 659 71,261
168 7,445
697 78,706
237 9,096
799 87,802
- continued -
DRAFT

67
Table 11.–Page 3 of 4.
Community Year
Number of SHARC holdersb
Subsistence harvests
Sport harvestd
All harvests Setline (fixed) gear
Hand-operated gear
Total subsistence harvest
Estimated number fished
Estimated pounds
harvested
Estimated number fished
Estimated pounds
harvested
Estimated number fished
Estimated pounds
harvested
Estimated number fished
Estimated pounds
harvested
Estimated number fished
Estimated pounds
harvested Toksook Bay 2003 532 8 3,790
47 20,709
54 24,500
0 0
54 24,500
2004 529 7 859
44 5,737
56 6,596
0 0
56 6,596
2005 522 5 602
60 14,269
61 14,870
2 98
62 14,968
2006 533 6 2,333
112 34,149
113 36,481
0 0
113 36,481
2007 533 17 1,451
100 6,469
112 7,921
0 0
112 7,921
2008 34 6 707
8 1,436
9 2,143
0 0
9 2,143
2009 33 3 266
10 789
10 1,055
0 0
10 1,055
2010 32 5 315
10 560
10 875
0 0
10 875
2011 32 2 378
7 219
8 597
0 0
8 597
2012 7 1 140
4 154
5 294
0 0
5 294
Tununak 2003 0
2004 70 16 878
23 1,076
31 1,954
0 0
31 1,954
2005 70 3 332
18 2,329
20 2,661
0 0
20 2,661
2006 70 7 224
33 3,808
33 4,032
0 0
33 4,032
2007 69 14 1,536
38 5,479
38 7,015
0 0
38 7,015
2008 68 0 0
8 1,296
8 1,296
0 0
8 1,296
2009 11 0 0
7 488
7 488
0 0
7 488
2010 11 0 0
9 576
9 576
0 0
9 576
2011 11 0 0
4 84
4 84
0 0
4 84
2012 11 0 0
3 173
3 173
0 0
3 173
Unalaskac 2003 92 39 6,713
31 4,146
50 10,860
33 5,519
70 16,379
2004 131 43 9,557
39 5,973
81 15,530
34 2,165
93 17,695
2005 150 60 9,573
57 8,535
88 18,108
28 2,439
97 20,547
2006 171 53 7,526
47 8,805
81 16,331
50 3,768
101 20,100
2007 176 67 9,012
38 4,238
83 13,250
33 2,287
92 15,537
2008 173 59 7,293
42 6,417
87 13,710
43 2,962
101 16,672
2009 164 56 19,204
54 10,102
76 29,306
45 1,861
98 31,167
2010 155 58 7,417
60 5,663
92 13,081
54 2,730
103 15,811
2011 141 33 4,449
50 7,808
65 12,257
27 3,030
75 15,287
2012 141 41 5,342
41 4,717
62 10,059
44 4,221
83 14,280
- continued -
DRAFT
68
Table 11.–Page 4 of 4.
Community Year
Number of SHARC holdersb
Subsistence harvests
Sport harvestd
All harvests Setline (fixed) gear
Hand-operated gear
Total subsistence harvest
Estimated number fished
Estimated pounds
harvested
Estimated number fished
Estimated pounds
harvested
Estimated number fished
Estimated pounds
harvested
Estimated number fished
Estimated pounds
harvested
Estimated number fished
Estimated pounds
harvested Source ADF&G Division of Subsistence SHARC surveys, 2004–2013. a. For data on all communities for 2009, see Appendix Tables A-4, A-5, and A-6. b. SHARC = Subsistence halibut registration certificate; includes all SHARC holders living in the community. c. Includes Dutch Harbor. d. Sport harvests by SHARC holders only.
DRAFT

Table 12.–Estimated harvests of halibut for home use, Sitka, 1987 and 1996.
Year
Number of fishing
households
Pounds usable (net) weight
95% confidence
range (±%)b
Removed from
commercial harvests
Rod and reel
Other methodsa Total
Total w/o commercial
removal 1987 1,252 12,353 180,982 193,335 180,982 22 1996 943 16,528 135,048 14,196 165,772 149,244 28
Annual average 1,098 14,441 158,015 14,196 179,554 165,113 Source ADF&G Community Subsistence Information System (CSIS). a. Harvest data not collected for "other methods" in 1987. b. Pertains to estimate of total harvests.
Table 13.–Number of SHARCs issued, estimated number of subsistence halibut fishers, and estimated harvests by SHARC category, Sitka, 2003–2012.
Year
Rural SHARCs
Tribal SHARCs
All SHARC holders residing in Sitka
SHARCs Subsistence
fished Harvest
Average harvest
per fisher (pounds) SHARCs
Subsistence fished Harvest
Average harvest
per fisher (pounds) SHARCs
Subsistence fished Harvest
Average harvest
per fisher (pounds)
2003 1,224 679 128,489 189.2 415 142 46,391 326.7 1,639 821 174,880 213.0 2004 1,464 785 135,532 172.7 407 119 30,942 260.0 1,871 904 166,474 184.2 2005 1,578 654 114,632 175.3 396 160 31,687 198.1 1,974 814 146,319 179.8 2006 1,429 759 120,735 159.1 466 156 42,637 273.6 1,895 915 163,372 178.6 2007 1,484 754 104,530 138.6 470 167 37,519 224.7 1,954 921 142,049 154.2 2008 1,388 722 87,945 121.8 274 123 21,636 175.9 1,662 845 109,581 129.7 2009 1,446 717 82,246 114.7 285 127 15,178 119.5 1,731 844 97,424 115.4 2010 1,363 632 69,779 110.5 272 124 12,949 104.6 1,635 755 82,728 109.5 2011 1,370 663 77,544 117.0 288 121 15,486 128.0 1,658 784 93,030 118.7 2012 1,330 596 64,152 107.6 240 101 14,555 144.5 1,570 697 78,706 112.9
Previous 9-year
average (2003– 2011)
1,416 707 102,381 144.8 364 138 28,269 205.4 1,780 845 130,651 154.7
10-year average (2003– 2012)
1,408 696 98,558 141.6 351 134 26,898 200.8 1,759 830 125,456 151.1
Table 14.–Estimated harvests of halibut for home use, Petersburg, 1987 and 2000.
Year
Number of fishing
households
Pounds usable (net) weight
95% confidence range (±%)b
Removed from commercial
harvests Rod and reel Other methodsa Total
Total without commercial
removal 1987 604 11,728 107,448
119,176 107,448 51
2000 468 6,951 49,023 0 55,974 49,023 39 Annual average 536 9,339 78,236 0 87,575 78,236
Sources ADF&G Community Subsistence Information System (CSIS); ADF&G Division of Subsistence household
survey, 2001. a. Harvest data not collected for “other methods” in 1987. b. Pertains to estimate of total harvests.
69
DRAFT

Table 15.–Estimated harvests of halibut for home use, Cordova, 1985, 1988, 1991–1993, and 1997.
Year
Number of fishing
households
Pounds usable (net) weight
95% confidence range (±%)a
Removed from commercial
harvests Rod and reel Other methods Total
Total without commercial
removal 1985 228 3,776 31,002 1,752 36,530 32,754 29% 1988 343 18,701 119,873 348 138,922 120,221 62% 1991 272 25,107 25,493 116 50,716 25,609 33% 1992 401 11,383 60,612 0 71,995 60,612 48% 1993 382 3,762 39,556 2,056 45,374 41,612 32% 1997 321 3,551 58,647 4,252 66,450 62,899 41% Annual average 325 11,047 55,864 1,421 68,331 57,285
Source ADF&G Community Subsistence Information System (CSIS). a. Pertains to estimate of total harvests.
Table 16.–Estimated harvests of halibut for home use, Port Graham, 1987, 1989, 1990–1993, and 1997.
Year
Number of fishing
households
Pounds usable (net) weight
95% confidence range (±%)b
Removed from commercial
harvests Rod and reel Other methods Total
Total without commercial
removal 1987 42 1,237 3,809 3,389 8,435 7,198 14% 1989 29 3,217 1,482 1,222 5,921 2,704 47% 1990 32 3,003 4,106 3,171 10,280 7,277 22% 1991 35 1,663 2,332 4,846 8,841 7,178 17% 1992 42 24 7,867 3,365 11,256 11,232 14% 1993 42 86 3,105 1,346 4,537 4,451 14% 1997 36 79 2,881 5,326 8,286 8,207 28% Annual averagea 38 1,015 4,017 3,574 8,606 7,591
Source ADF&G Community Subsistence Information System (CSIS). a. Excludes 1989, the year of the Exxon Valdez Oil Spill. b. Pertains to estimate of total harvests.
Table 17.–Estimated harvests of halibut for home use, Kodiak road system, 1982, and 1991–1993.a
Year
Number of fishing
households
Pounds usable (net) weight
95% confidence range (±%)b
Removed from commercial
harvests Rod and reel Other methods Total
Total without commercial
removal 1982 1,404 NA NA NA 451,223 360,113 45% 1991 1,178 48,245 206,692 40,591 295,528 247,283 30% 1992 1,178 89,625 329,345 18,732 437,702 348,077 33% 1993 1,336 142,108 479,391 31,863 653,362 511,254 33% Annual average 1,306 93,326 338,476 30,395 462,197 366,682
Source ADF&G Community Subsistence Information System (CSIS). a. Harvest data are available based on random samples drawn from the entire road system population for 1982 and
1991. Only Kodiak City was sampled in 1992 and 1993. Estimates for the entire road system population were developed for this table based on the known portion of the total road system harvest harvested by city residents in 1982 and 1991.
b. Pertains to estimate of total harvests.
70
DRAFT
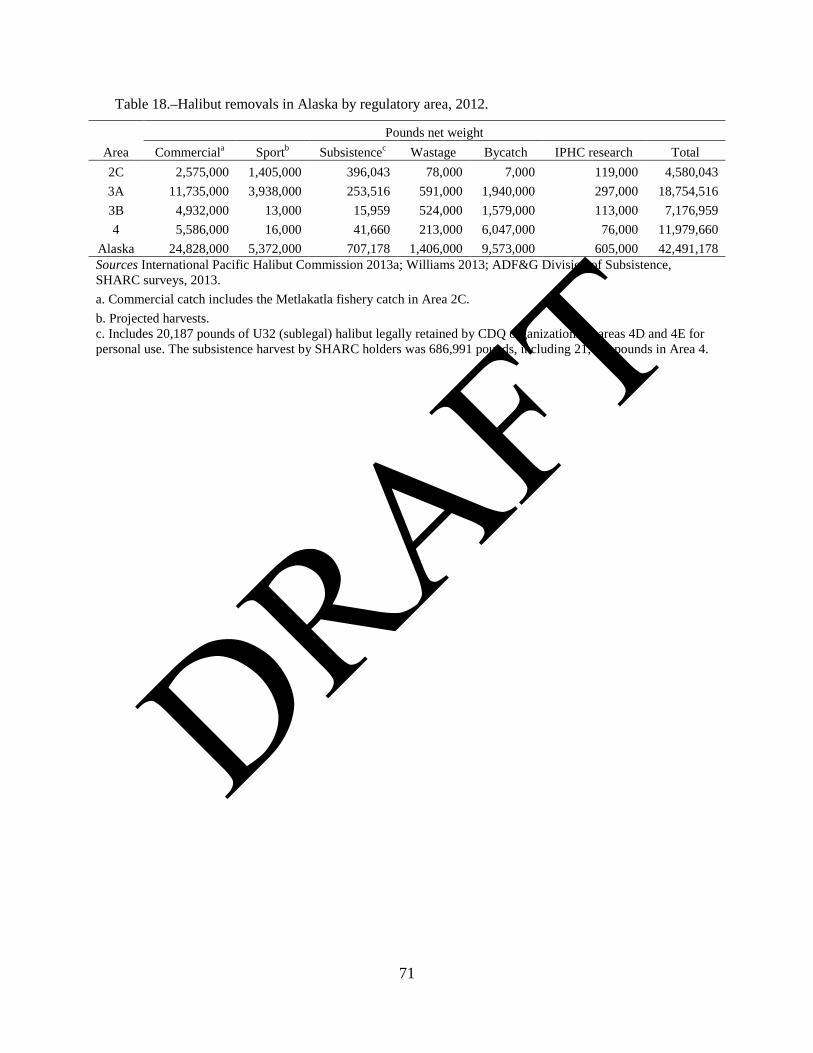
Table 18.–Halibut removals in Alaska by regulatory area, 2012.
Area Pounds net weight
Commerciala Sportb Subsistencec Wastage Bycatch IPHC research Total 2C 2,575,000 1,405,000 396,043 78,000 7,000 119,000 4,580,043 3A 11,735,000 3,938,000 253,516 591,000 1,940,000 297,000 18,754,516 3B 4,932,000 13,000 15,959 524,000 1,579,000 113,000 7,176,959 4 5,586,000 16,000 41,660 213,000 6,047,000 76,000 11,979,660
Alaska 24,828,000 5,372,000 707,178 1,406,000 9,573,000 605,000 42,491,178 Sources International Pacific Halibut Commission 2013a; Williams 2013; ADF&G Division of Subsistence, SHARC surveys, 2013. a. Commercial catch includes the Metlakatla fishery catch in Area 2C. b. Projected harvests. c. Includes 20,187 pounds of U32 (sublegal) halibut legally retained by CDQ organizations in areas 4D and 4E for personal use. The subsistence harvest by SHARC holders was 686,991 pounds, including 21,473 pounds in Area 4.
71
DRAFT
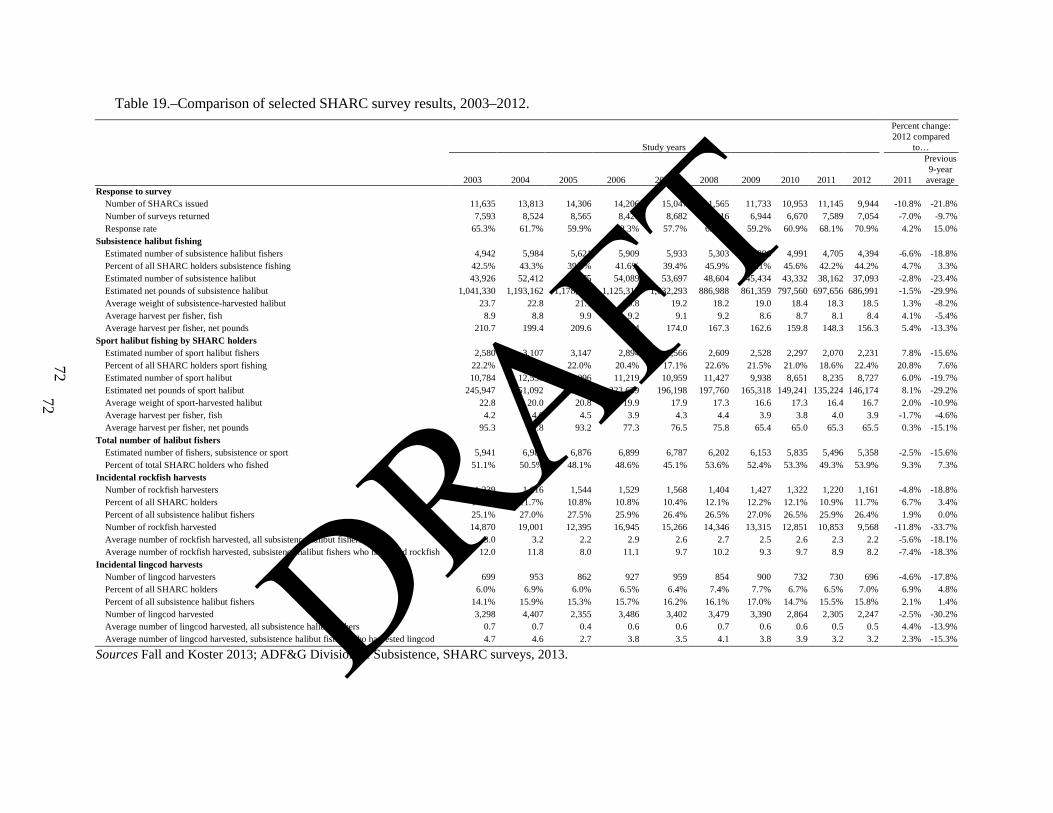
72
Table 19.–Comparison of selected SHARC survey results, 2003–2012.
Study years
Percent change: 2012 compared
to…
2003 2004 2005 2006 2007 2008 2009 2010 2011 2012 2011
Previous 9-year
average Response to survey
Number of SHARCs issued 11,635 13,813 14,306 14,206 15,047 11,565 11,733 10,953 11,145 9,944 -10.8% -21.8% Number of surveys returned 7,593 8,524 8,565 8,426 8,682 7,316 6,944 6,670 7,589 7,054 -7.0% -9.7% Response rate 65.3% 61.7% 59.9% 59.3% 57.7% 63.3% 59.2% 60.9% 68.1% 70.9% 4.2% 15.0%
Subsistence halibut fishing Estimated number of subsistence halibut fishers 4,942 5,984 5,621 5,909 5,933 5,303 5,296 4,991 4,705 4,394 -6.6% -18.8% Percent of all SHARC holders subsistence fishing 42.5% 43.3% 39.3% 41.6% 39.4% 45.9% 45.1% 45.6% 42.2% 44.2% 4.7% 3.3% Estimated number of subsistence halibut 43,926 52,412 55,875 54,089 53,697 48,604 45,434 43,332 38,162 37,093 -2.8% -23.4% Estimated net pounds of subsistence halibut 1,041,330 1,193,162 1,178,222 1,125,312 1,032,293 886,988 861,359 797,560 697,656 686,991 -1.5% -29.9% Average weight of subsistence-harvested halibut 23.7 22.8 21.1 20.8 19.2 18.2 19.0 18.4 18.3 18.5 1.3% -8.2% Average harvest per fisher, fish 8.9 8.8 9.9 9.2 9.1 9.2 8.6 8.7 8.1 8.4 4.1% -5.4% Average harvest per fisher, net pounds 210.7 199.4 209.6 190.4 174.0 167.3 162.6 159.8 148.3 156.3 5.4% -13.3%
Sport halibut fishing by SHARC holders Estimated number of sport halibut fishers 2,580 3,107 3,147 2,894 2,566 2,609 2,528 2,297 2,070 2,231 7.8% -15.6% Percent of all SHARC holders sport fishing 22.2% 22.5% 22.0% 20.4% 17.1% 22.6% 21.5% 21.0% 18.6% 22.4% 20.8% 7.6% Estimated number of sport halibut 10,784 12,530 14,096 11,219 10,959 11,427 9,938 8,651 8,235 8,727 6.0% -19.7% Estimated net pounds of sport halibut 245,947 251,092 293,415 223,639 196,198 197,760 165,318 149,241 135,224 146,174 8.1% -29.2% Average weight of sport-harvested halibut 22.8 20.0 20.8 19.9 17.9 17.3 16.6 17.3 16.4 16.7 2.0% -10.9% Average harvest per fisher, fish 4.2 4.0 4.5 3.9 4.3 4.4 3.9 3.8 4.0 3.9 -1.7% -4.6% Average harvest per fisher, net pounds 95.3 80.8 93.2 77.3 76.5 75.8 65.4 65.0 65.3 65.5 0.3% -15.1%
Total number of halibut fishers Estimated number of fishers, subsistence or sport 5,941 6,980 6,876 6,899 6,787 6,202 6,153 5,835 5,496 5,358 -2.5% -15.6% Percent of total SHARC holders who fished 51.1% 50.5% 48.1% 48.6% 45.1% 53.6% 52.4% 53.3% 49.3% 53.9% 9.3% 7.3%
Incidental rockfish harvests Number of rockfish harvesters 1,239 1,616 1,544 1,529 1,568 1,404 1,427 1,322 1,220 1,161 -4.8% -18.8% Percent of all SHARC holders 10.6% 11.7% 10.8% 10.8% 10.4% 12.1% 12.2% 12.1% 10.9% 11.7% 6.7% 3.4% Percent of all subsistence halibut fishers 25.1% 27.0% 27.5% 25.9% 26.4% 26.5% 27.0% 26.5% 25.9% 26.4% 1.9% 0.0% Number of rockfish harvested 14,870 19,001 12,395 16,945 15,266 14,346 13,315 12,851 10,853 9,568 -11.8% -33.7% Average number of rockfish harvested, all subsistence halibut fishers 3.0 3.2 2.2 2.9 2.6 2.7 2.5 2.6 2.3 2.2 -5.6% -18.1% Average number of rockfish harvested, subsistence halibut fishers who harvested rockfish 12.0 11.8 8.0 11.1 9.7 10.2 9.3 9.7 8.9 8.2 -7.4% -18.3%
Incidental lingcod harvests Number of lingcod harvesters 699 953 862 927 959 854 900 732 730 696 -4.6% -17.8% Percent of all SHARC holders 6.0% 6.9% 6.0% 6.5% 6.4% 7.4% 7.7% 6.7% 6.5% 7.0% 6.9% 4.8% Percent of all subsistence halibut fishers 14.1% 15.9% 15.3% 15.7% 16.2% 16.1% 17.0% 14.7% 15.5% 15.8% 2.1% 1.4% Number of lingcod harvested 3,298 4,407 2,355 3,486 3,402 3,479 3,390 2,864 2,305 2,247 -2.5% -30.2% Average number of lingcod harvested, all subsistence halibut fishers 0.7 0.7 0.4 0.6 0.6 0.7 0.6 0.6 0.5 0.5 4.4% -13.9% Average number of lingcod harvested, subsistence halibut fishers who harvested lingcod 4.7 4.6 2.7 3.8 3.5 4.1 3.8 3.9 3.2 3.2 2.3% -15.3%
Sources Fall and Koster 2013; ADF&G Division of Subsistence, SHARC surveys, 2013.
72
DRAFT

Table 20.–Percentage of SHARCs that expired or were valid in 2012, by SHARC type.
Percentage of SHARCs Tribal
Rural
All
Expired Active Expired Active Expired Active Never responded to harvest survey 26.0% 14.46%
22.1% 6.7%
23.8% 9.4%
Never subsistence fished for halibut 37.2% 14.9%
18.3% 4.6%
26.5% 8.1% Never harvested halibut 6.8% 15.9%
12.4% 13.9%
10.0% 14.6%
Harvest: low (1 to 100 lb) 15.2% 25.2%
22.9% 33.0%
19.5% 30.3% Harvest: medium (101 to 1000 lb) 14.0% 27.8%
23.5% 40.9%
19.4% 36.4%
Harvest: high (>1000 lb) 0.9% 1.7%
0.8% 0.8%
0.8% 1.1% All harvesters (any amount) 30.0% 54.8%
47.2% 74.7%
39.8% 67.9%
All fishers (includes never harvested) 36.8% 70.7%
59.6% 88.7%
49.8% 82.5% All SHARC holders 59.9% 40.1% 50.8% 49.2% 54.3% 45.7%
Table 21.–Removals of Pacific halibut in Alaska, 1993–2012.
Year
Removals of Pacific halibut (million lb, net wt) Total
removalsa Commercial
harvests Sport harvests Subsistence
harvestsb 1993 71.410 49.309 7.151 1994 69.040 46.003 6.551 1995 55.000 34.450 6.339 1996 59.100 38.080 6.967 1997 74.090 52.988 7.783 1998 77.230 56.844 7.316 1999 81.830 61.904 6.182 2000 78.580 57.661 7.644 2001 80.400 60.572 6.643 2002 81.870 62.754 6.353 2003 83.030 61.458 7.725 1.041 2004 83.650 61.022 8.603 1.193 2005 82.680 58.659 8.534 1.178 2006 78.140 55.997 7.923 1.125 2007 76.280 53.151 9.401 1.032 2008 73.180 50.852 8.650 0.887 2009 66.140 45.471 7.195 0.861 2010 62.650 43.028 6.296 0.798 2011 50.220 32.835 5.468 0.698 2012 42.470 25.881 5.372 0.687
2012 compared to previous 9-year
average -41.7% -49.6% -30.7% -29.9%
Average annual change, 2003–2012 -4.9% -5.8% -3.0% -3.4%
Sources Stewart et al. 2012:183, 184; Gilroy 2013:24. a. Total removals includes commercial harvests, IPHC research, sport harvests, subsistence harvests, wastage, and bycatch. b. Subsistence harvests authorized beginning 2003. No annual statewide harvest data available for prior years.
73
DRAFT
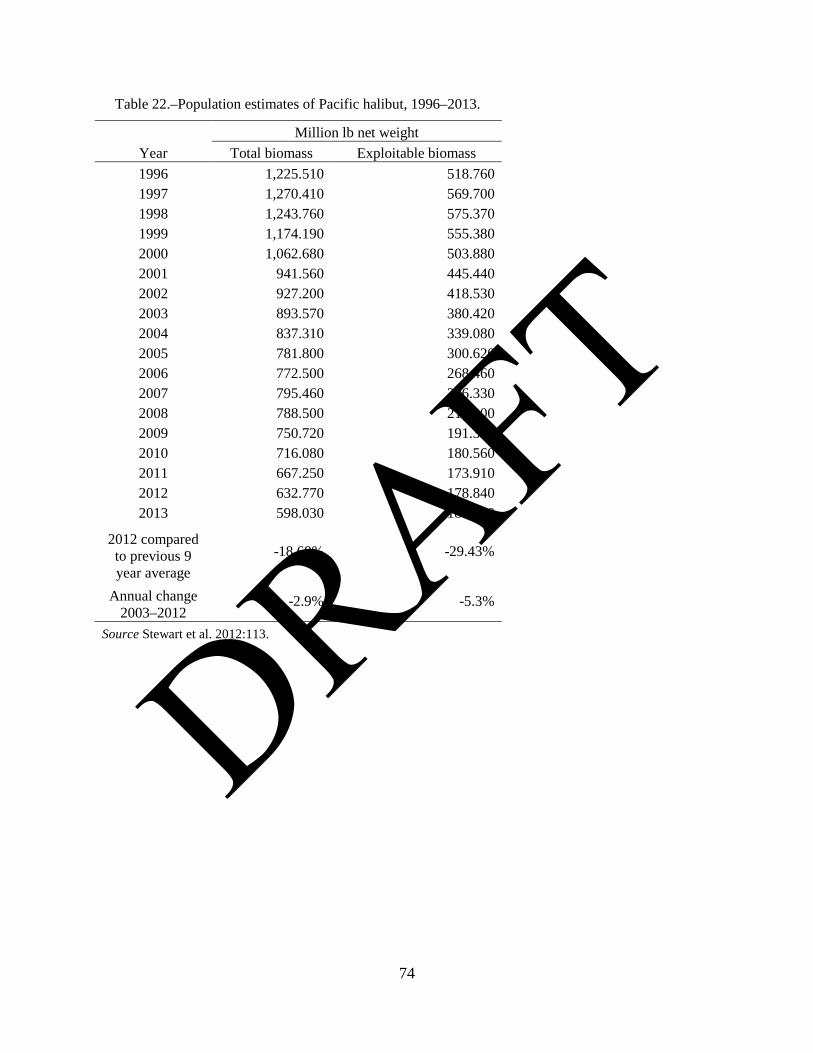
Table 22.–Population estimates of Pacific halibut, 1996–2013.
Year Million lb net weight
Total biomass Exploitable biomass 1996 1,225.510 518.760 1997 1,270.410 569.700 1998 1,243.760 575.370 1999 1,174.190 555.380 2000 1,062.680 503.880 2001 941.560 445.440 2002 927.200 418.530 2003 893.570 380.420 2004 837.310 339.080 2005 781.800 300.620 2006 772.500 268.460 2007 795.460 236.330 2008 788.500 210.100 2009 750.720 191.320 2010 716.080 180.560 2011 667.250 173.910 2012 632.770 178.840 2013 598.030 186.490
2012 compared to previous 9 year average
-18.68% -29.43%
Annual change 2003–2012
-2.9% -5.3%
Source Stewart et al. 2012:113.
74
DRAFT
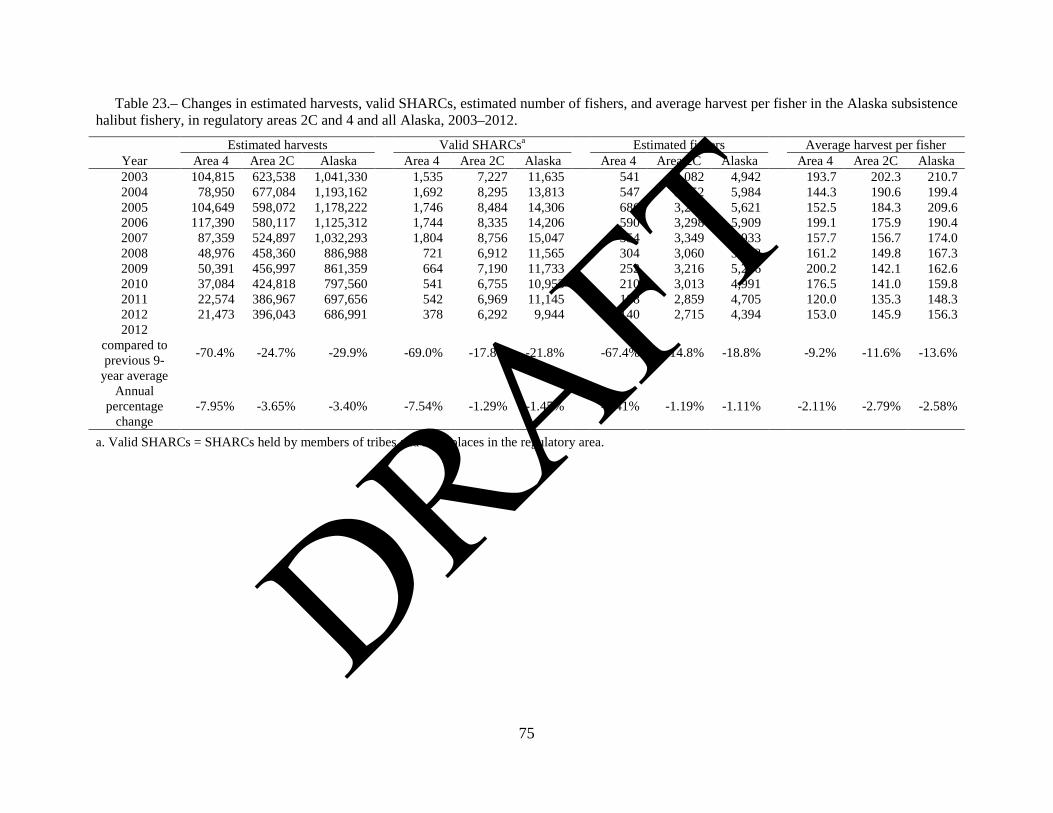
Table 23.– Changes in estimated harvests, valid SHARCs, estimated number of fishers, and average harvest per fisher in the Alaska subsistence halibut fishery, in regulatory areas 2C and 4 and all Alaska, 2003–2012.
Year Estimated harvests Valid SHARCsa Estimated fishers Average harvest per fisher
Area 4 Area 2C Alaska Area 4 Area 2C Alaska Area 4 Area 2C Alaska Area 4 Area 2C Alaska 2003 104,815 623,538 1,041,330 1,535 7,227 11,635 541 3,082 4,942 193.7 202.3 210.7 2004 78,950 677,084 1,193,162 1,692 8,295 13,813 547 3,552 5,984 144.3 190.6 199.4 2005 104,649 598,072 1,178,222 1,746 8,484 14,306 686 3,245 5,621 152.5 184.3 209.6 2006 117,390 580,117 1,125,312 1,744 8,335 14,206 590 3,298 5,909 199.1 175.9 190.4 2007 87,359 524,897 1,032,293 1,804 8,756 15,047 554 3,349 5,933 157.7 156.7 174.0 2008 48,976 458,360 886,988 721 6,912 11,565 304 3,060 5,303 161.2 149.8 167.3 2009 50,391 456,997 861,359 664 7,190 11,733 252 3,216 5,296 200.2 142.1 162.6 2010 37,084 424,818 797,560 541 6,755 10,953 210 3,013 4,991 176.5 141.0 159.8 2011 22,574 386,967 697,656 542 6,969 11,145 188 2,859 4,705 120.0 135.3 148.3 2012 21,473 396,043 686,991 378 6,292 9,944 140 2,715 4,394 153.0 145.9 156.3 2012
compared to previous 9-
year average
-70.4% -24.7% -29.9% -69.0% -17.8% -21.8% -67.4% -14.8% -18.8% -9.2% -11.6% -13.6%
Annual percentage
change -7.95% -3.65% -3.40% -7.54% -1.29% -1.45% -7.41% -1.19% -1.11% -2.11% -2.79% -2.58%
a. Valid SHARCs = SHARCs held by members of tribes and rural places in the regulatory area.
75
DRAFT

76
Figure 1.–Regulatory areas for the Pacific halibut fishery.
DRAFT

77
Figure 2.–Number of surveys returned and return rates for subsistence halibut surveys, by SHARC type, 2012.
0
3,000
6,000
9,000
12,000
Tribal SHARCs Rural SHARCs Total SHARCs
Num
ber o
f sur
veys
or S
HA
RC
s
Returned Not returned
Return rate = 60%
Return rate = 77%
Return rate = 71%
DRAFT
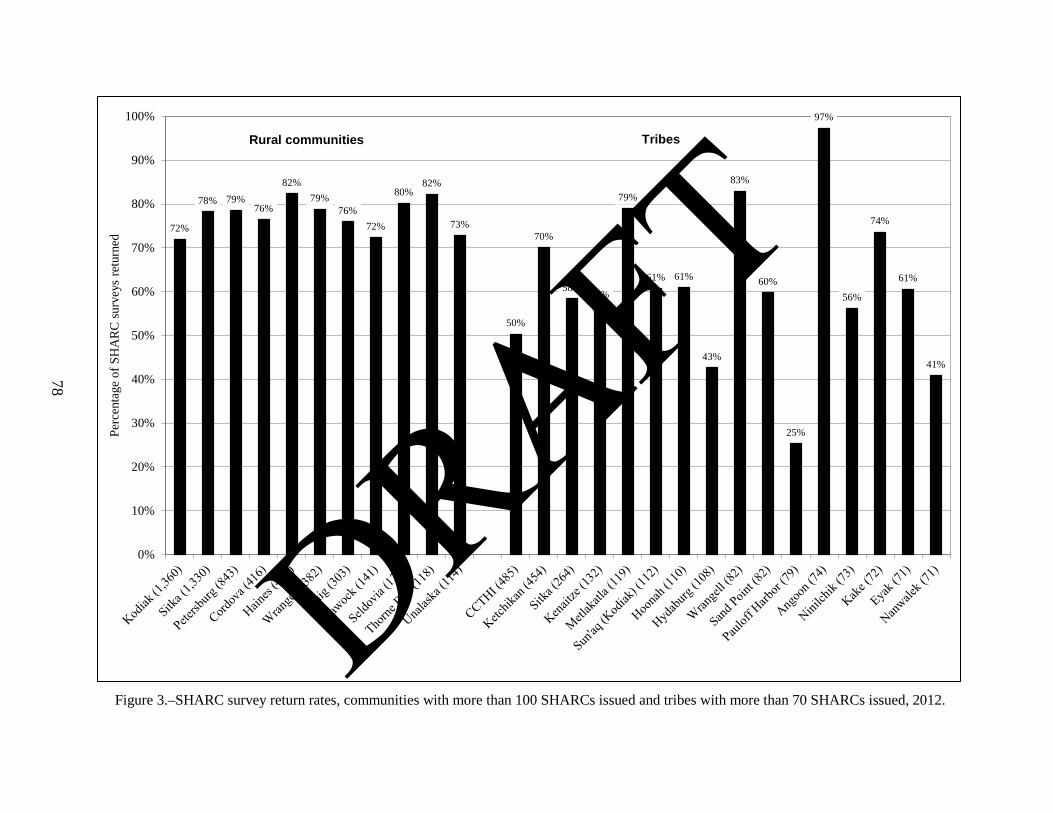
78
Figure 3.–SHARC survey return rates, communities with more than 100 SHARCs issued and tribes with more than 70 SHARCs issued, 2012.
72%
78% 79%76%
82%79%
76%72%
80%82%
73%
50%
70%
58% 57%
79%
61% 61%
43%
83%
60%
25%
97%
56%
74%
61%
41%
0%
10%
20%
30%
40%
50%
60%
70%
80%
90%
100%Pe
rcen
tage
of S
HA
RC
sur
veys
retu
rned
Rural communities Tribes
DRAFT
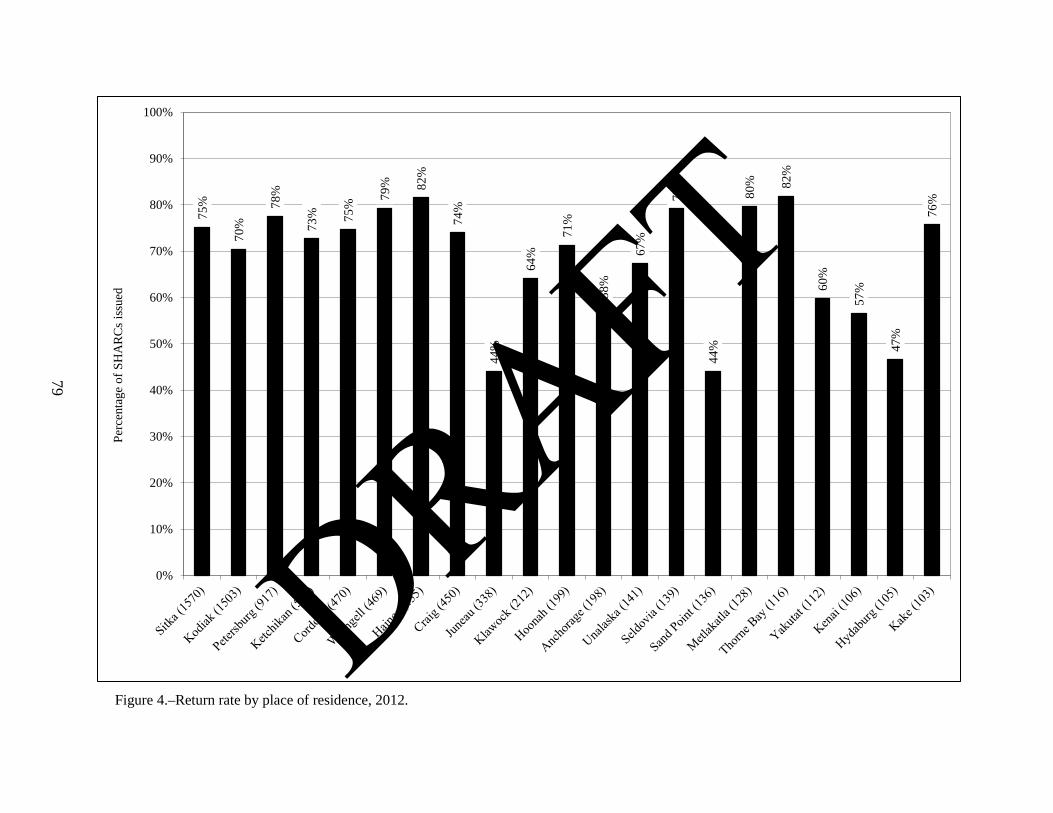
79
Figure 4.–Return rate by place of residence, 2012.
75%
70%
78%
73% 75
%
79% 82
%
74%
44%
64%
71%
58%
67%
79%
44%
80% 82
%
60%
57%
47%
76%
0%
10%
20%
30%
40%
50%
60%
70%
80%
90%
100%Pe
rcen
tage
of S
HA
RC
s is
sued
DRAFT
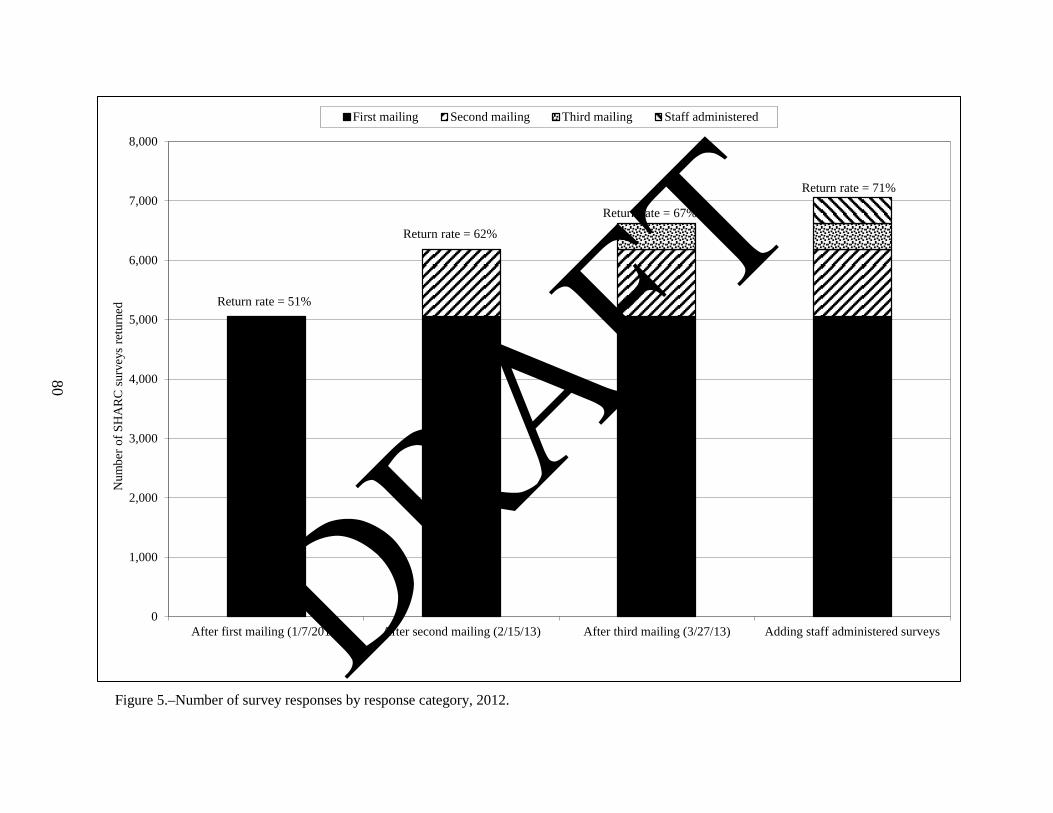
80
Figure 5.–Number of survey responses by response category, 2012.
0
1,000
2,000
3,000
4,000
5,000
6,000
7,000
8,000
After first mailing (1/7/2013) After second mailing (2/15/13) After third mailing (3/27/13) Adding staff administered surveys
Num
ber o
f SH
AR
C s
urve
ys re
turn
edFirst mailing Second mailing Third mailing Staff administered
Return rate = 51%
Return rate = 62%
Return rate = 67%
Return rate = 71%
DRAFT

81
Figure 6.–Number of SHARCs issued and estimated number of subsistence halibut fishers by SHARC type, 2003–2012.
5,57
8
1,83
6
6,05
7
3,10
6
11,6
35
4,94
2
6,53
3
2,15
7
7,28
0
3,82
7
13,8
13
5,98
46,43
7
2,03
5
7,86
9
3,58
6
14,3
06
5,62
1
7,12
3
2,32
9
7,08
3
3,58
0
14,2
06
5,90
9
7,44
6
2,22
2
7,60
1
3,71
0
15,0
47
5,93
3
4,31
6
1,59
5
7,24
9
3,70
8
11,5
65
5,30
3
4,00
9
1,54
9
7,72
4
3,74
8
11,7
33
5,29
6
3,90
6
1,50
2
7,04
7
3,48
9
10,9
53
4,99
1
4,13
5
1,42
2
7,01
0
3,28
3
11,1
45
4,70
5
3,42
5
1,23
2
6,51
9
3,16
2
9,94
4
4,39
4
0
2,000
4,000
6,000
8,000
10,000
12,000
14,000
16,000
SHARCs issued (tribal) Estimated subsistencefishers (tribal)
SHARCs issued (rural) Estimated subsistencefishers (rural)
SHARCs issued (total) Estimated subsistencefishers (total)
Num
ber o
f SH
AR
Cs
2003 2004 2005 2006 2007 2008 2009 2010 2011 2012
DRAFT

82
Figure 7.–Age of subsistence halibut registration certificate holders by SHARC type, 2012.
0%
2%
4%
6%
8%
10%
12%
14%
16%
0–4 5–9 10–14 15–19 20–24 25–29 30–34 35–39 40–44 45–49 50–54 55–59 60–64 65–69 70–74 75–79 80–84 85–89 90–94 95+
Perc
enta
ge o
f SH
AR
C h
olde
rs
Age cohort (years)
Tribal Rural Grand Totals
DRAFT

83
Figure 8.–Estimated number of subsistence halibut fishers by place of residence, 2003–2012, communities with 50 or more fishers in 2012.
0
200
400
600
800
1,000
1,200
Kod
iak
Sitk
a
Pete
rsbu
rg
Hai
nes
Wra
ngel
l
Cra
ig
Cor
dova
Ket
chik
an
Hoo
nah
Kla
woc
k
Sand
Poi
nt
June
au
Met
laka
tla
Seld
ovia
Una
lask
a/D
utch
Har
bor
Ang
oon
Hyd
abur
g
Thor
ne B
ay
Kak
e
Yak
utat
Anc
hora
ge
Num
ber o
f sub
sist
ence
hal
ibut
fish
ers
2003 2004 2005 2006 2007 2008 2009 2010 2011 2012
Ave
rage
, 862
Ave
rage
, 830
Ave
rage
,230
Ave
rage
,238
Ave
rage
,252
Ave
rage
, 260
Ave
rage
,41
2
Ave
rage
, 84
Ave
rage
, 88
Ave
rage
, 89
Ave
rage
,91
Ave
rage
, 104
Ave
rage
, 118
Ave
rage
,193
Ave
rage
, 60
Ave
rage
, 63
Ave
rage
,65
Ave
rage
, 66
Ave
rage
, 77
Ave
rage
, 57
Ave
rage
, 50
DRAFT
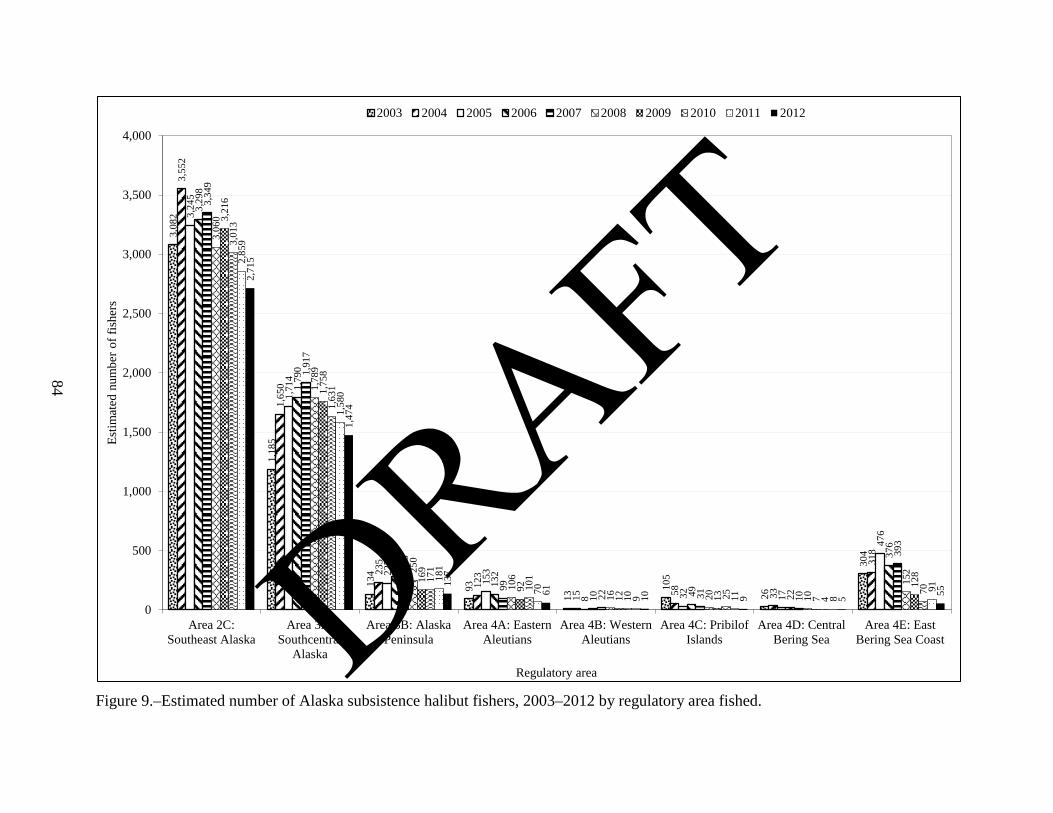
84
Figure 9.–Estimated number of Alaska subsistence halibut fishers, 2003–2012 by regulatory area fished.
3,08
2
1,18
5
134
93
13
105
26
304
3,55
2
1,65
0
235
123
15 58 33
318
3,24
5
1,71
4
227
153
8 32 17
476
3,29
8
1,79
0
285
132
10 49 22
376
3,34
9
1,91
7
266
99
22 31 10
393
3,06
0
1,78
9
250
106
16 20 10
152
3,21
6
1,75
8
169
92
12 13 7
128
3,01
3
1,63
1
171
101
10 25 4
70
2,85
9
1,58
0
181
70
9 11 8
91
2,71
5
1,47
4
137
61 10 9 5 55
0
500
1,000
1,500
2,000
2,500
3,000
3,500
4,000
Area 2C:Southeast Alaska
Area 3A:Southcentral
Alaska
Area 3B: AlaskaPeninsula
Area 4A: EasternAleutians
Area 4B: WesternAleutians
Area 4C: PribilofIslands
Area 4D: CentralBering Sea
Area 4E: EastBering Sea Coast
Estim
ated
num
ber o
f fis
hers
Regulatory area
2003 2004 2005 2006 2007 2008 2009 2010 2011 2012
DRAFT
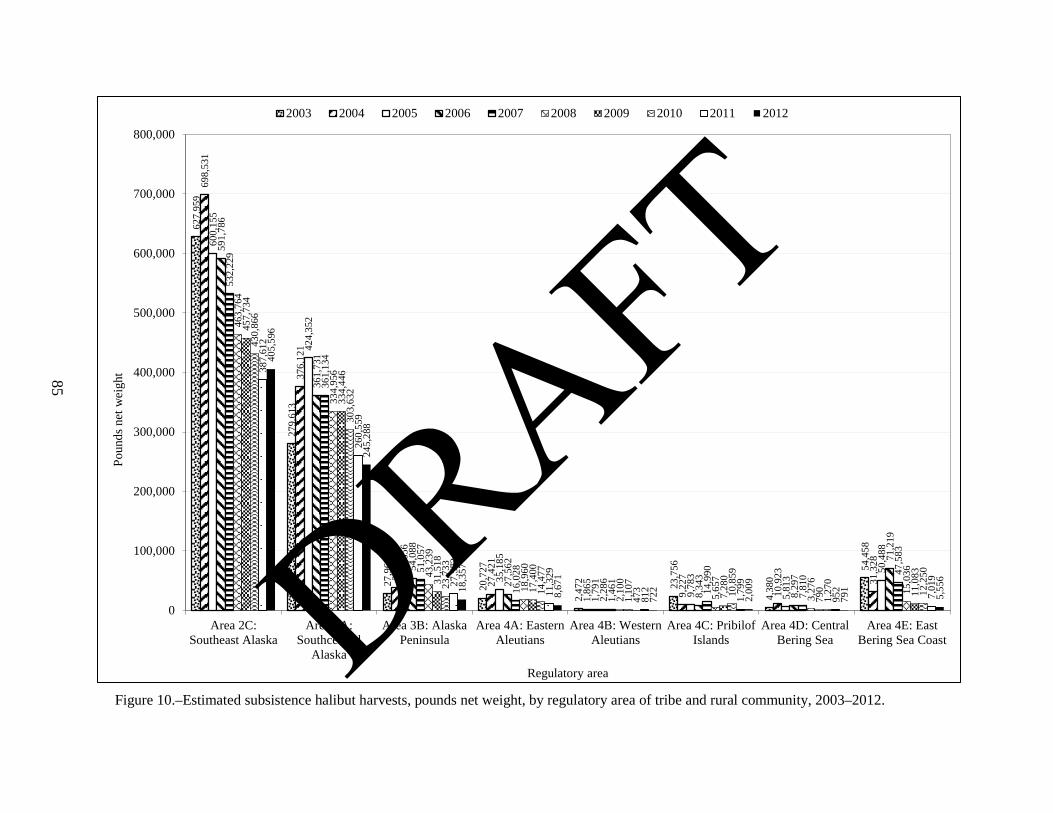
85
Figure 10.–Estimated subsistence halibut harvests, pounds net weight, by regulatory area of tribe and rural community, 2003–2012.
627,
959
279,
613
27,9
65
20,7
27
2,47
2 23,7
56
4,38
0
54,4
58
698,
531
376,
121
37,7
45
27,4
21
1,86
5
9,22
7
10,9
23 31,3
28
600,
155
424,
352
50,6
56
35,1
85
1,79
1
9,78
3
5,81
3
50,4
88
591,
786
361,
731
54,0
88
27,5
62
2,28
6
8,34
3
8,29
7
71,2
19
532,
229
361,
134
51,0
57
16,0
28
1,46
1
14,9
90
7,81
0 47,5
83
463,
764
334,
956
43,2
39
18,9
60
2,10
0
5,65
7
3,27
6
15,0
36
457,
734
334,
446
31,5
18
17,4
00
1,10
7
7,28
0
790 11
,083
430,
866
303,
632
23,7
33
14,4
77
473 10
,859
1,27
0
12,2
50
387,
612
260,
559
27,5
73
11,3
29
812
1,79
9
952
7,01
9
405,
596
245,
288
18,3
57
8,67
1
722
2,00
9
791
5,55
6
0
100,000
200,000
300,000
400,000
500,000
600,000
700,000
800,000
Area 2C:Southeast Alaska
Area 3A:Southcentral
Alaska
Area 3B: AlaskaPeninsula
Area 4A: EasternAleutians
Area 4B: WesternAleutians
Area 4C: PribilofIslands
Area 4D: CentralBering Sea
Area 4E: EastBering Sea Coast
Poun
ds n
et w
eigh
t
Regulatory area
2003 2004 2005 2006 2007 2008 2009 2010 2011 2012
DRAFT
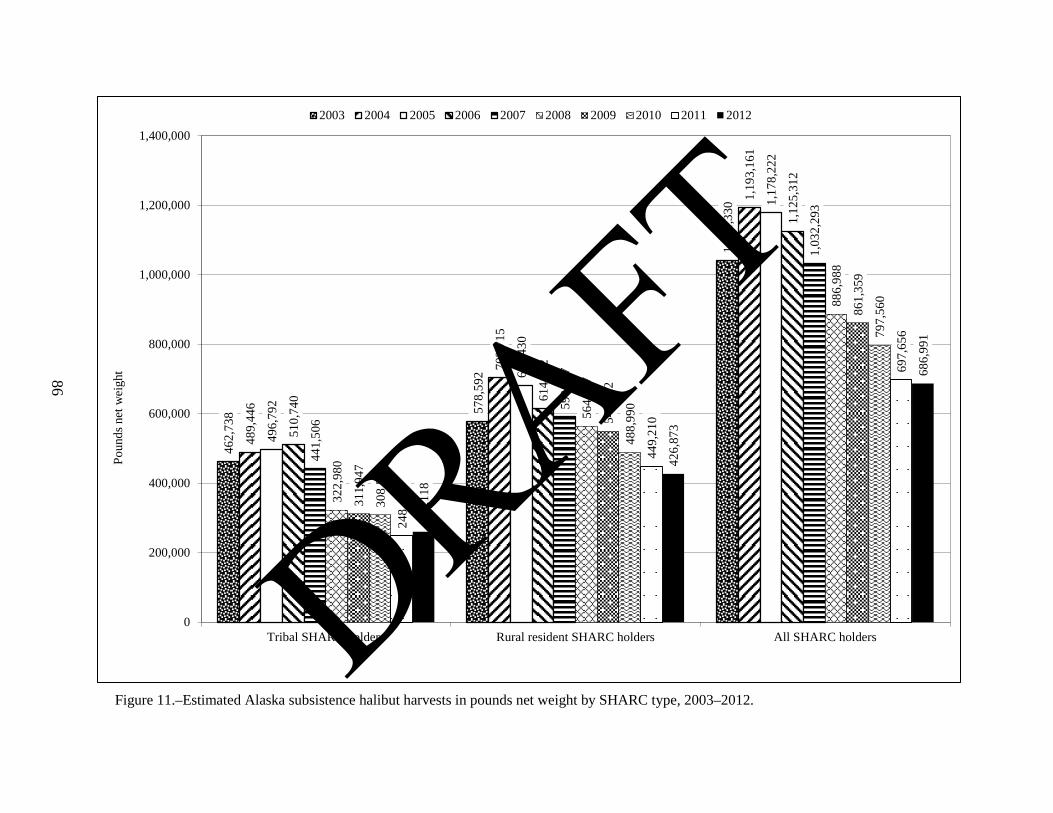
86
Figure 11.–Estimated Alaska subsistence halibut harvests in pounds net weight by SHARC type, 2003–2012.
462,
738 57
8,59
2
1,04
1,33
0
489,
446
703,
715
1,19
3,16
1
496,
792
681,
430
1,17
8,22
2
510,
740 61
4,57
2
1,12
5,31
2
441,
506
590,
787
1,03
2,29
3
322,
980
564,
007
886,
988
311,
947
549,
412
861,
359
308,
569
488,
990
797,
560
248,
446
449,
210
697,
656
260,
118
426,
873
686,
991
0
200,000
400,000
600,000
800,000
1,000,000
1,200,000
1,400,000
Tribal SHARC holders Rural resident SHARC holders All SHARC holders
Poun
ds n
et w
eigh
t2003 2004 2005 2006 2007 2008 2009 2010 2011 2012
DRAFT

87
Figure 12.–Percentage of tribal subsistence halibut harvest by tribe, 2012.
12.2% 11.7%
10.0%
5.5%4.9%
4.2%3.6% 3.5% 3.4% 3.3% 3.0% 2.8% 2.6% 2.5% 2.5%
24.2%
0%
5%
10%
15%
20%
25%
Cent
ral C
ounc
il Tl
ingi
t and
Hai
da In
dian
Trib
es
Ket
chik
an In
dian
Cor
pora
tion
Hyd
abur
g C
oope
rativ
e A
ssoc
iatio
n
Sitk
a Tr
ibe
of A
lask
a
Sun'
aq T
ribe
of K
odia
k
Yak
utat
Tlin
git T
ribe
Nat
ive
Vill
age
of P
ort G
raha
m
Ang
oon
Com
mun
ity A
ssoc
iatio
n
Ken
aitz
e In
dian
Trib
e
Hoo
nah
Indi
an A
ssoc
iatio
n
Wra
ngel
l Coo
pera
tive
Ass
ocia
tion
Nat
ive
Vill
age
of N
anw
alek
Seld
ovia
Vill
age
Trib
e
Org
aniz
ed V
illag
e of
Kak
e
Crai
g Co
mm
unity
Ass
ocia
tion
All
othe
r trib
es
Perc
enta
ge o
f tot
al p
ound
s har
vest
ed
DRAFT

88
Figure 13.–Percentage of rural community subsistence halibut harvest by community, 2012.
25.9%
15.0%
9.9%
6.6%5.3%
4.7% 4.2%3.4% 2.9%
22.2%
0%
5%
10%
15%
20%
25%
30%Pe
rcen
tage
of t
otal
pou
nds h
arve
sted
DRAFT

89
Figure 14.–Percentage of subsistence halibut harvest by regulatory area fished, 2012.
Area 2C -Southeast57.6%
Area 3A -Southcentral36.9%
Area 3B- AK Peninsula2.3%
Area 4A-East Aleutians1.4%
Area 4B-West Aleutians 0.2%
Area 4C-Pribilofs 0.2%
Area 4D-Central Bering Sea0.1%
Area 4E-East Bering Sea Coast1.2%
N= 686,991 pounds net weight
DRAFT
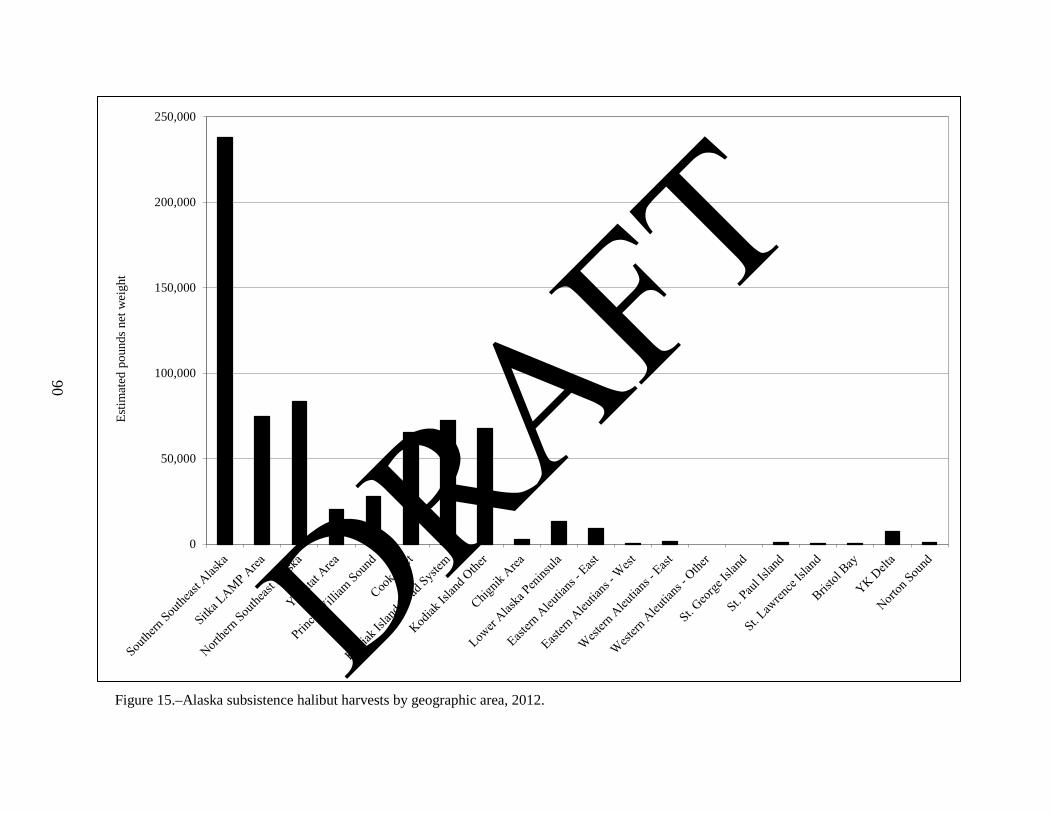
90
Figure 15.–Alaska subsistence halibut harvests by geographic area, 2012.
0
50,000
100,000
150,000
200,000
250,000Es
timat
ed p
ound
s net
wei
ght
DRAFT
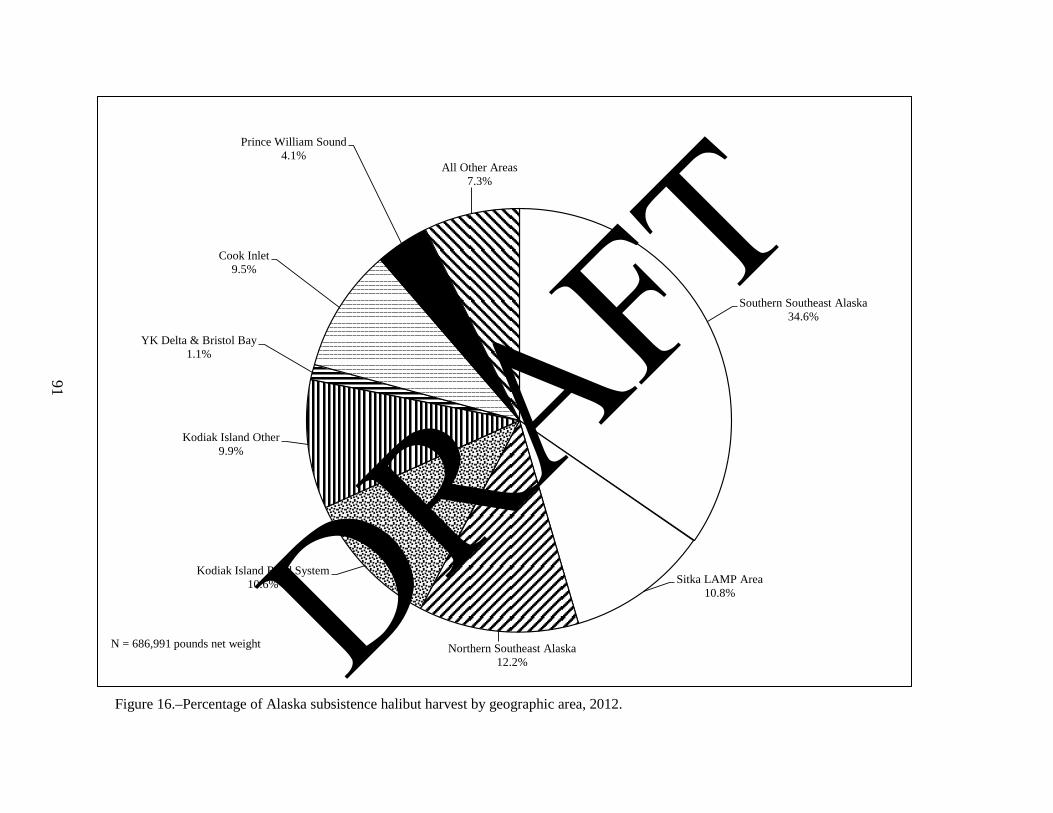
91
Figure 16.–Percentage of Alaska subsistence halibut harvest by geographic area, 2012.
Southern Southeast Alaska34.6%
Sitka LAMP Area10.8%
Northern Southeast Alaska12.2%
Kodiak Island Road System10.6%
Kodiak Island Other9.9%
YK Delta & Bristol Bay1.1%
Cook Inlet9.5%
Prince William Sound4.1%
All Other Areas7.3%
N = 686,991 pounds net weight
DRAFT

92
Figure 17.–Estimated subsistence halibut harvests, pounds net weight, by regulatory area fished, 2003–2012.
623,
538
285,
500
27,4
77
21,1
97
2,58
2 22,8
81
4,38
0
53,7
75
677,
084
403,
610
33,5
19
28,8
77
916 9,73
4
10,9
23
28,5
01
598,
072
429,
275
46,2
25
35,6
15
1,35
1
7,71
6
5,84
8
54,1
19
580,
117
379,
258
48,5
47
27,0
62
2,76
1
8,52
7
8,29
7
70,7
43
524,
897
372,
289
47,7
48
14,9
46
1,99
7
15,0
77
3,20
4
52,1
35
458,
360
337,
403
42,2
48
19,5
53
4,73
7
5,65
7
3,13
1
15,8
98
456,
997
328,
480
25,4
92
33,4
99
1,17
5
6,32
3
644 8,74
9
424,
818
312,
650
23,0
09
14,5
48
450 10
,859
1,17
1
10,0
55
386,
967
266,
104
22,0
11
13,6
06
537
1,64
8
615
6,16
8
396,
043
253,
516
15,9
59
9,54
3
1,69
8
1,17
6
672 8,38
4
0
100,000
200,000
300,000
400,000
500,000
600,000
700,000
800,000
Area 2C:Southeast Alaska
Area 3A:Southcentral
Alaska
Area 3B: AlaskaPeninsula
Area 4A: EasternAleutians
Area 4B: WesternAleutians
Area 4C: PribilofIslands
Area 4D: CentralBering Sea
Area 4E: EastBering Sea Coast
Poun
ds n
et w
eigh
t2003 2004 2005 2006 2007 2008 2009 2010 2011 2012
DRAFT

93
Figure 18.–Change in Alaska subsistence halibut harvests from 2011 through 2012 by regulatory area fished.
2%
-5%
-27% -30%
216%
-29%
9%
36%
-2%
-50%
0%
50%
100%
150%
200%
250%
Area 2C:Southeast
Alaska
Area 3A:Southcentral
Alaska
Area 3B: AlaskaPeninsula
Area 4A:Eastern
Aleutians
Area 4B:Western
Aleutians
Area 4C:Pribilof Islands
Area 4D:Central Bering
Sea
Area 4E: EastBering Sea
Coast
Alaska
Cha
nge
in h
arve
st (p
ound
s net
wei
ght)
Regulatory area
DRAFT

94
Figure 19.–Change in Alaska subsistence halibut harvests in 2012 compared to recent 9-year average (2003–2011) by regulatory area fished.
-25% -27%
-55%-59%
-7%
-88%-84%
-75%
-30%
-110%
-90%
-70%
-50%
-30%
-10%
10%
30%
50%
Area 2C:Southeast
Alaska
Area 3A:Southcentral
Alaska
Area 3B: AlaskaPeninsula
Area 4A:Eastern
Aleutians
Area 4B:Western
Aleutians
Area 4C:Pribilof Islands
Area 4D:Central Bering
Sea
Area 4E: EastBering Sea
Coast
Alaska
Cha
nge
in h
arve
st (p
ound
s net
wei
ght)
Regulatory area
DRAFT
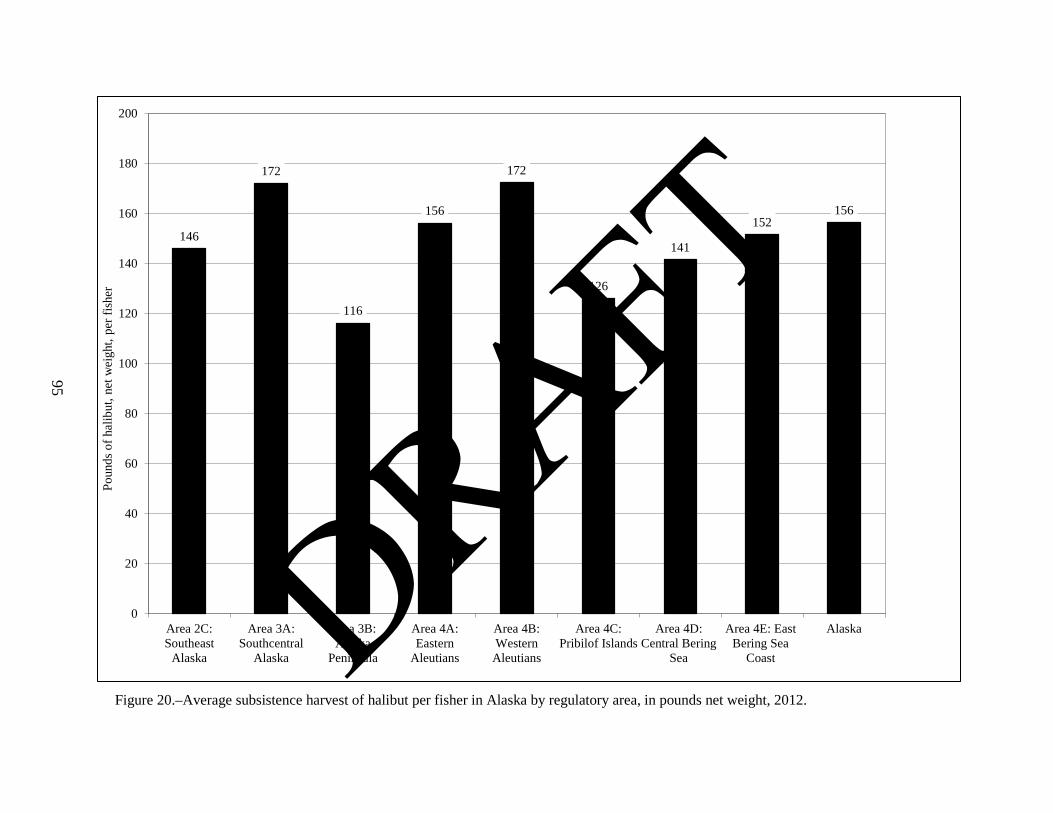
95
Figure 20.–Average subsistence harvest of halibut per fisher in Alaska by regulatory area, in pounds net weight, 2012.
146
172
116
156
172
126
141
152156
0
20
40
60
80
100
120
140
160
180
200
Area 2C:Southeast
Alaska
Area 3A:Southcentral
Alaska
Area 3B:Alaska
Peninsula
Area 4A:Eastern
Aleutians
Area 4B:Western
Aleutians
Area 4C:Pribilof Islands
Area 4D:Central Bering
Sea
Area 4E: EastBering Sea
Coast
Alaska
Poun
ds o
f hal
ibut
, net
wei
ght,
per f
ishe
r
DRAFT
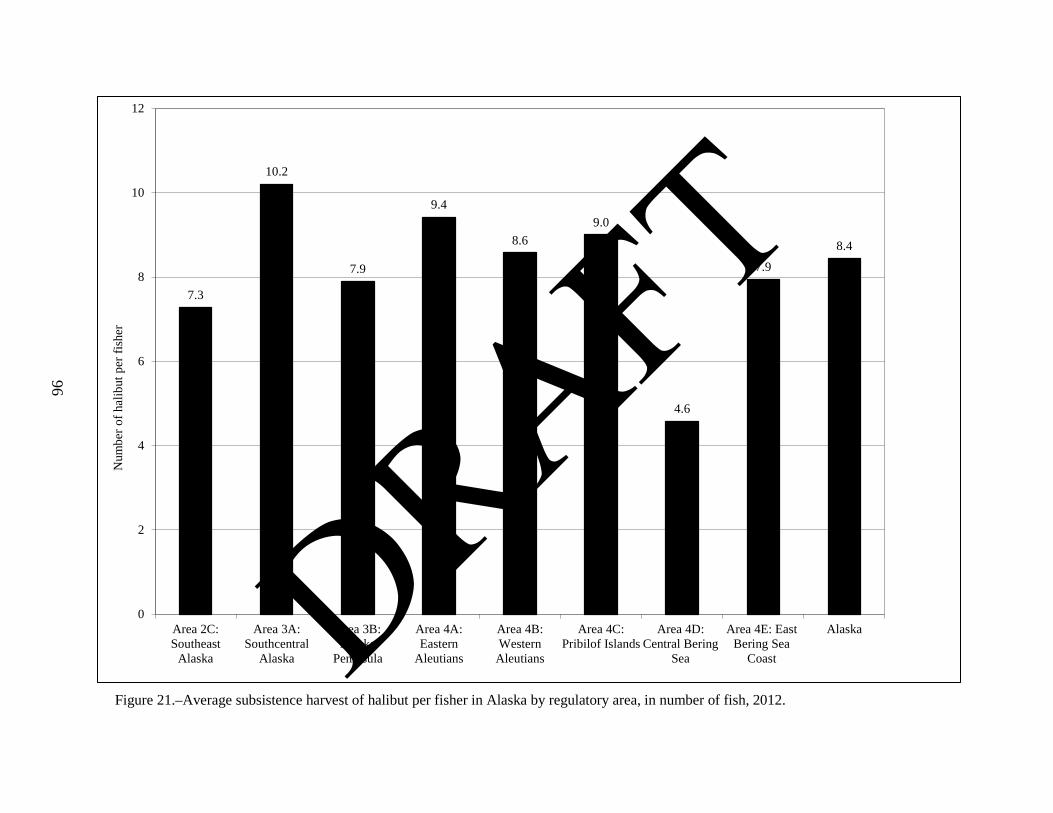
96
Figure 21.–Average subsistence harvest of halibut per fisher in Alaska by regulatory area, in number of fish, 2012.
7.3
10.2
7.9
9.4
8.69.0
4.6
7.9
8.4
0
2
4
6
8
10
12
Area 2C:Southeast
Alaska
Area 3A:Southcentral
Alaska
Area 3B:Alaska
Peninsula
Area 4A:Eastern
Aleutians
Area 4B:Western
Aleutians
Area 4C:Pribilof Islands
Area 4D:Central Bering
Sea
Area 4E: EastBering Sea
Coast
Alaska
Num
ber o
f hal
ibut
per
fish
er
DRAFT

97
Figure 22.–Alaska subsistence halibut harvests by place of residence, 2012.
0
20,000
40,000
60,000
80,000
100,000
120,000
140,000
Kod
iak
Sitk
a
Pete
rsbu
rg
Ket
chik
an
Wra
ngel
l
Cra
ig
Hyd
abur
g
Kla
woc
k
Hai
nes
Cor
dova
Yak
utat
Hoo
nah
Seld
ovia
Ang
oon
Nan
wal
ek
Anc
hora
ge
Una
lask
a/D
utch
Har
bor
Kak
e
June
au
Thor
ne B
ay
Ken
ai
Sand
Poi
nt
Oth
er A
lask
a
Non
-Ala
ska
Poun
ds n
et w
eigh
t
DRAFT

98
Figure 23.–Percentage of subsistence halibut harvest by gear type by regulatory area, 2012.
82%
72%
65%
52%
92%
58%
100%
72%
78%
18%
28%
35%
48%
8%
42%
0%
28%
22%
0%
10%
20%
30%
40%
50%
60%
70%
80%
90%
100%
2C 3A 3B 4A 4B 4C 4D 4E Alaska
Perc
enta
ge o
f hub
sist
ence
hal
ibut
har
vest
Regulatory area
Setline (stationary) gear Hand-operated gear
DRAFT
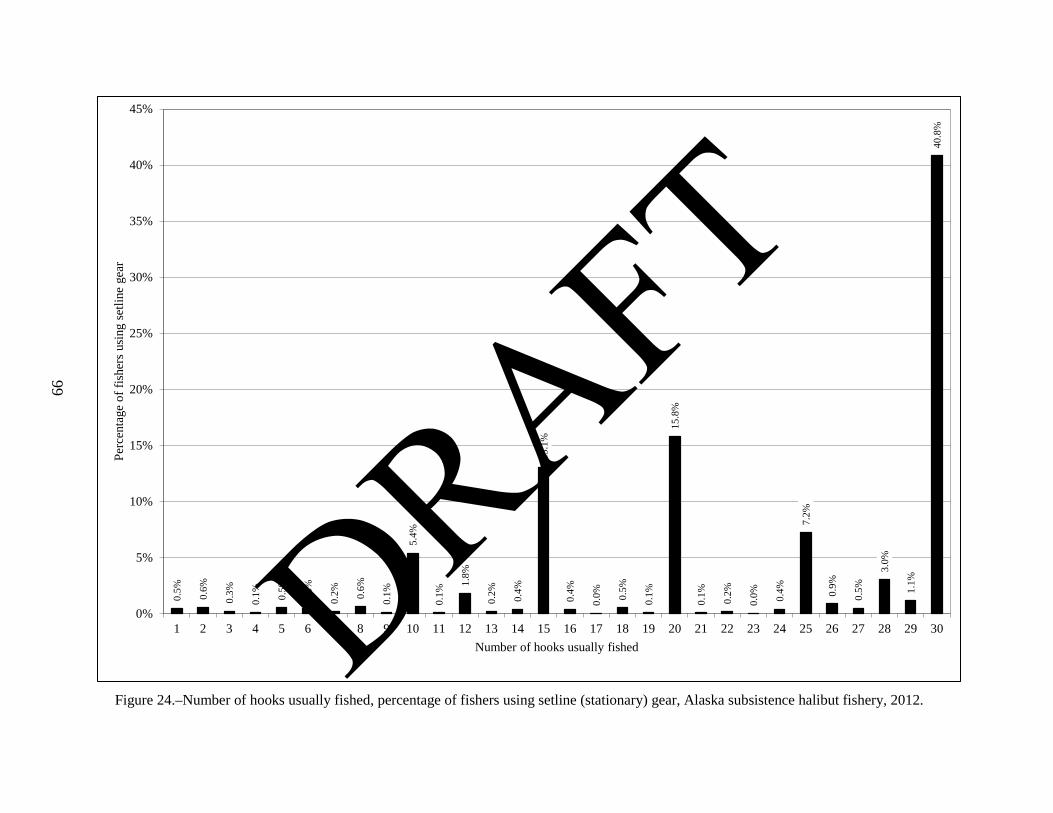
99
Figure 24.–Number of hooks usually fished, percentage of fishers using setline (stationary) gear, Alaska subsistence halibut fishery, 2012.
0.5% 0.6%
0.3%
0.1% 0.5%
0.5%
0.2% 0.6%
0.1%
5.4%
0.1%
1.8%
0.2% 0.4%
13.1
%
0.4%
0.0% 0.
5%
0.1%
15.8
%
0.1% 0.2%
0.0% 0.4%
7.2%
0.9%
0.5%
3.0%
1.1%
40.8
%
0%
5%
10%
15%
20%
25%
30%
35%
40%
45%
1 2 3 4 5 6 7 8 9 10 11 12 13 14 15 16 17 18 19 20 21 22 23 24 25 26 27 28 29 30
Perc
enta
ge o
f fis
hers
usi
ng s
etlin
e ge
ar
Number of hooks usually fished
DRAFT

100
Figure 25.–Average number of subsistence fishing trips for halibut by regulatory area and SHARC type, 2012.
4.3
5.6
3.84.0
4.3 4.3
15.0
2.9
4.64.3 4.1
4.9
4.4 4.3
0.0
15.0
3.2
4.24.3 4.54.0
4.3 4.3 4.3
15.0
2.9
4.3
0
2
4
6
8
10
12
14
16
Area 2C Area 3A Area 3B Area 4A Area 4B Area 4C Area 4D Area 4E All
Ave
rage
num
ber o
f trip
s
Regulatory area
Tribal Rural All
DRAFT

101
Figure 26.–Number of subsistence fishing trips for halibut, by percentage of total reported trips, 2012.
0%
5%
10%
15%
20%
25%
1 2 3 4 5 6 7 8 9 10 11 12 13 14 15 16 17 18 19 20 >20
Perc
enta
ge o
f res
pons
es
Number of trips
DRAFT
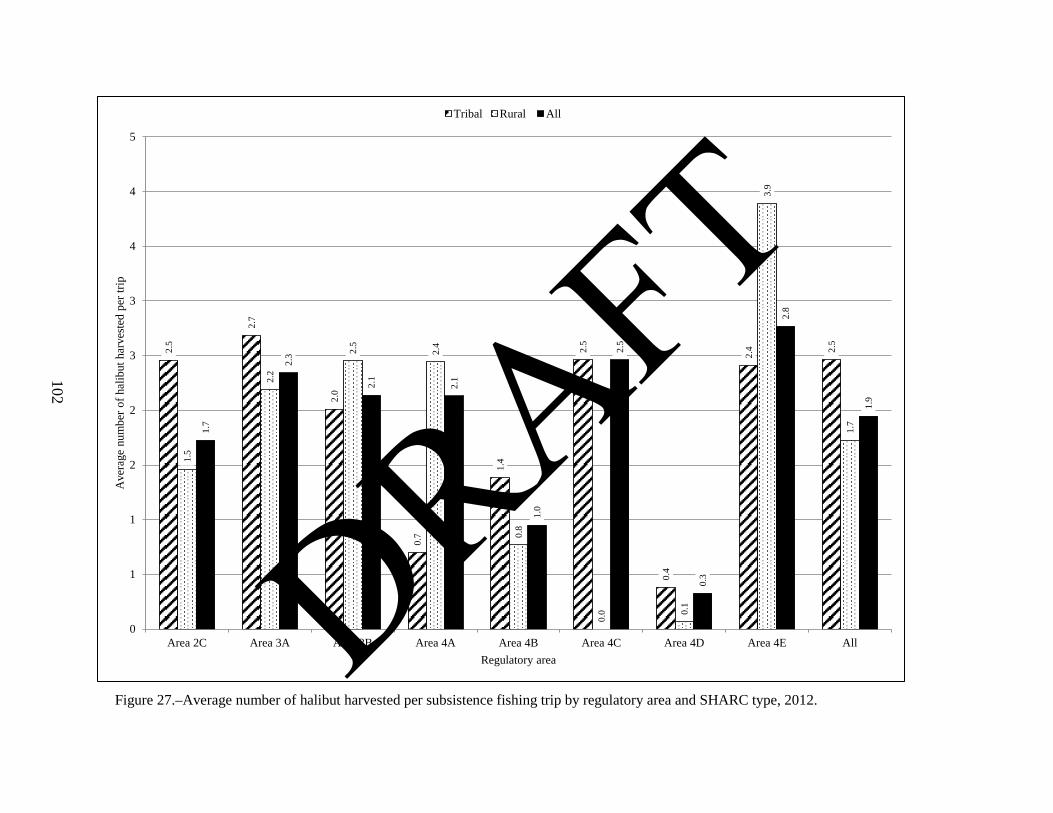
102
Figure 27.–Average number of halibut harvested per subsistence fishing trip by regulatory area and SHARC type, 2012.
2.5
2.7
2.0
0.7
1.4
2.5
0.4
2.4 2.
5
1.5
2.2
2.5
2.4
0.8
0.0 0.
1
3.9
1.7
1.7
2.3
2.1
2.1
1.0
2.5
0.3
2.8
1.9
0
1
1
2
2
3
3
4
4
5
Area 2C Area 3A Area 3B Area 4A Area 4B Area 4C Area 4D Area 4E All
Ave
rage
num
ber o
f hal
ibut
har
vest
ed p
er tr
ip
Regulatory area
Tribal Rural All
DRAFT

103
Figure 28.–Estimated incidental harvests of rockfish in the Alaska subsistence halibut fishery, number of fish, by regulatory area fished, 2003–
2012.
9,91
7
3,54
8
240
952
5 93 4 111
12,8
45
5,09
0
325 54
6
3 0 9 183
7,76
4
3,63
8
384
337
94 141
4 31
11,4
86
3,97
7
1,01
4
247
9 0 19 194
10,3
31
3,70
6
666
100
5 27 170
261
9,98
2
3,52
3
508
132
16 0 34 152
8,95
8
3,24
2
888
152
24 13 0 38
7,68
8
4,42
6
242 40
6
0 50 17 23
7,63
6
2,81
0
302
105
0 0 0 0
7,01
3
2,31
6
161
69 3 0 0 7
0
2,000
4,000
6,000
8,000
10,000
12,000
14,000
Area 2C:Southeast Alaska
Area 3A:Southcentral
Alaska
Area 3B: AlaskaPeninsula
Area 4A: EasternAleutians
Area 4B: WesternAleutians
Area 4C: PribilofIslands
Area 4D: CentralBering Sea
Area 4E: EastBering Sea Coast
Num
ber o
f roc
kfis
h
Regulatory area
2003 2004 2005 2006 2007 2008 2009 2010 2011 2012
DRAFT

104
Figure 29.–Percentage of incidental harvest of rockfish by regulatory area fished, 2012.
Area 2C 73.3%
Area 3A 24.2%
Area 3B 1.7%
Area 4A 0.7% Areas 4B,4C,4D,4E
0.1%
N = 9,568 rockfish
DRAFT

105
Figure 30.–Estimated incidental harvests of lingcod in the Alaska subsistence halibut fishery, number of fish, by regulatory area fished, 2003–
2012.
1,68
5
613
202
447
43
99 61
148
2,47
5
1,12
5
262 36
1
0 0 6
178
1,31
1
735
233
30 0 9 0 38
2,05
7
949
221
51
0 0 19
189
2,24
1
810
67 25 15 7 29
208
2,46
6
763
143
44 29 0 0 35
2,03
6
972
303
37 3 5 0 34
1,80
0
880
102
59
0 5 15 3
1,51
5
550
137
81
0 0 0 20
1,53
1
620
68
4 0 0 0 24
0
500
1,000
1,500
2,000
2,500
3,000
Area 2C:Southeast Alaska
Area 3A:Southcentral
Alaska
Area 3B: AlaskaPeninsula
Area 4A: EasternAleutians
Area 4B: WesternAleutians
Area 4C: PribilofIslands
Area 4D: CentralBering Sea
Area 4E: EastBering Sea Coast
Num
ber o
f lin
gcod
Regulatory area
2003 2004 2005 2006 2007 2008 2009 2010 2011 2012
DRAFT
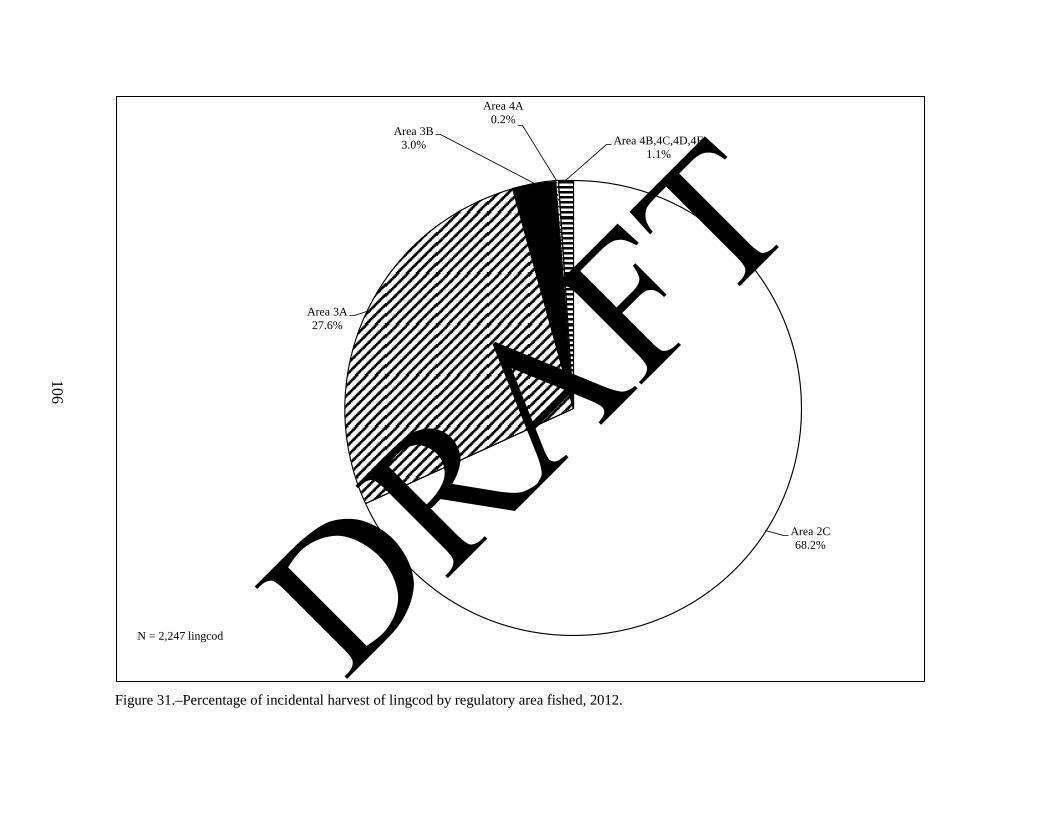
106
Figure 31.–Percentage of incidental harvest of lingcod by regulatory area fished, 2012.
Area 2C 68.2%
Area 3A 27.6%
Area 3B 3.0%
Area 4A 0.2%
Area 4B,4C,4D,4E1.1%
N = 2,247 lingcod
DRAFT

107
Figure 32.–Estimated harvests of halibut for home use, Port Graham.
0
2,000
4,000
6,000
8,000
10,000
12,000
14,000
1987 1989 1990 1991 1992 1993 1997 2003 2004 2005 2006 2007 2008 2009 2010 2011 2012
Tota
l pou
nds,
net w
eigh
tNoncommercial Harvest Removed from Commercial Harvest (not available for 2003-2012)
Annual average non-commercial harvest, excluding 1989 (7,591 lbs)
DRAFT
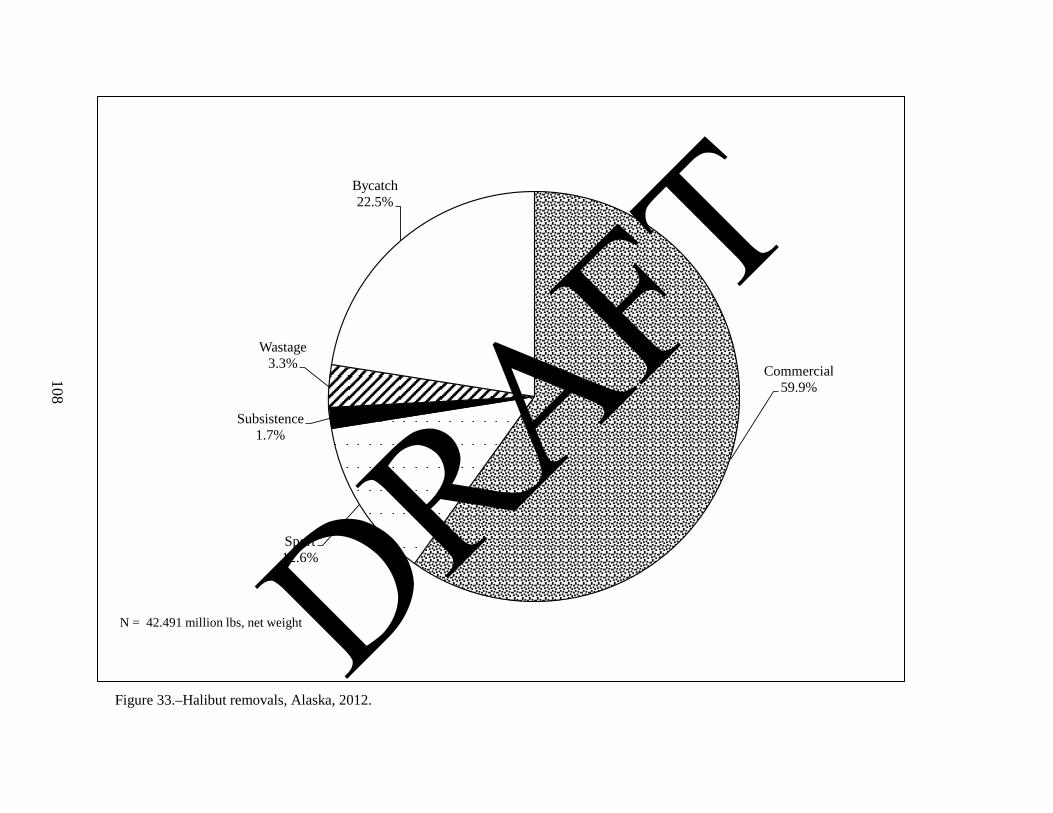
108
Figure 33.–Halibut removals, Alaska, 2012.
Commercial59.9%
Sport12.6%
Subsistence1.7%
Wastage3.3%
Bycatch22.5%
N = 42.491 million lbs, net weight
DRAFT

109
Figure 34.–Halibut removals in Alaska by regulatory area and removal category, 2012.
58.8
% 64.2
% 70.3
%
47.3
%
59.9
%
30.7
%
21.0
%
0.2%
0.1%
12.6
%
8.6%
1.4%
0.2%
0.3% 1.7%
1.7% 3.
2%
7.3%
1.8% 3.
3%
0.2%
10.3
%
22.0
%
50.5
%
22.5
%
0%
10%
20%
30%
40%
50%
60%
70%
80%
90%
100%
2C 3A 3B 4 Alaska
Perc
enta
ge o
f tot
al re
mov
als,
poun
ds n
et w
eigh
t
Halibut regulatory area
Commercial Sport Subsistence Wastage Bycatch
DRAFT

110
Figure 35.–Percentage of SHARC holders, and SHARC holders who fished for halibut, who did not renew their SHARC, by SHARC type,
2003–2012.
59.9%
43.7%
50.8%
40.9%
54.3%
41.8%
0%
10%
20%
30%
40%
50%
60%
70%
80%
Percentage of SHARCs that expired Percentage of SHARCs known to have fished that expired
Tribal SHARCs Rural SHARCs All SHARCs
DRAFT

111
Figure 36.–Percentage of SHARCs that were not renewed by survey response type and SHARC type, 2003–2012.
0%
5%
10%
15%
20%
25%
30%
35%
40%
45%
50%
Tribal:Expired
Tribal: Active Rural: Expired Rural: Active All: Expired All: Active
Never responded
Never fished
Never harvested
Harvest: low (1 to 100 lb)
Harvest: mediium (101 to 1000 lb)
Harvest: high (> 1000 lb)
DRAFT
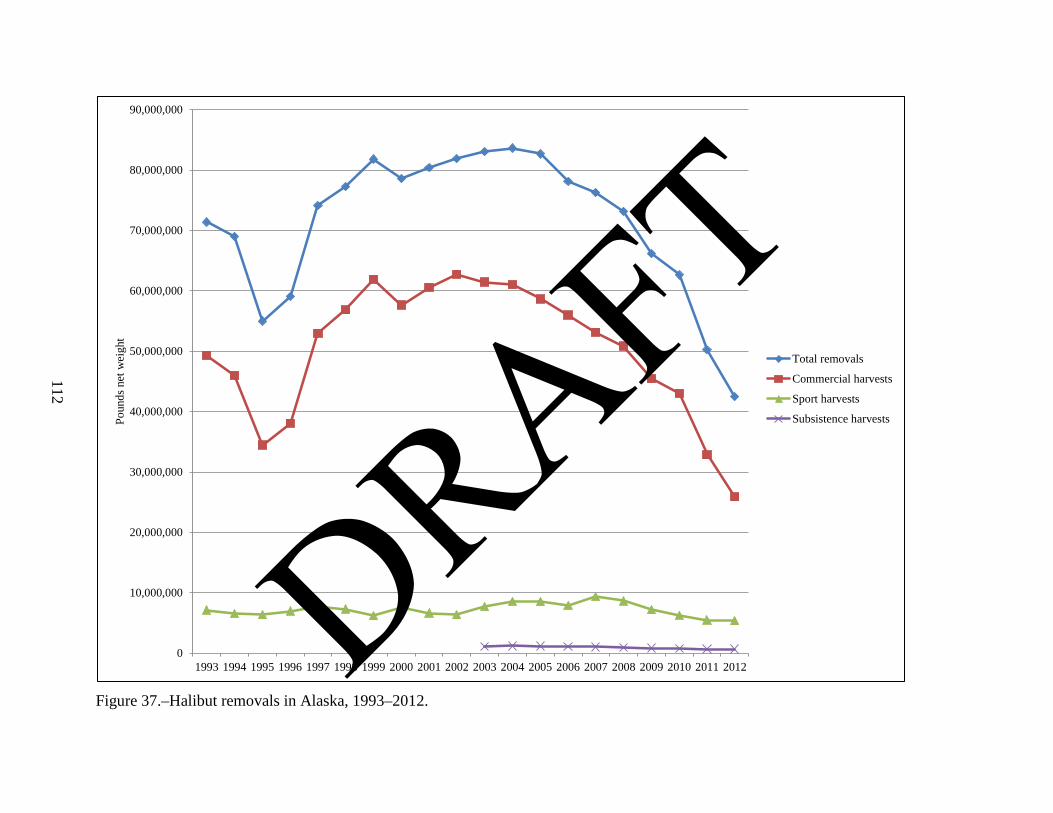
112
Figure 37.–Halibut removals in Alaska, 1993–2012.
0
10,000,000
20,000,000
30,000,000
40,000,000
50,000,000
60,000,000
70,000,000
80,000,000
90,000,000
1993 1994 1995 1996 1997 1998 1999 2000 2001 2002 2003 2004 2005 2006 2007 2008 2009 2010 2011 2012
Poun
ds n
et w
eigh
t
Total removals
Commercial harvests
Sport harvests
Subsistence harvests
DRAFT
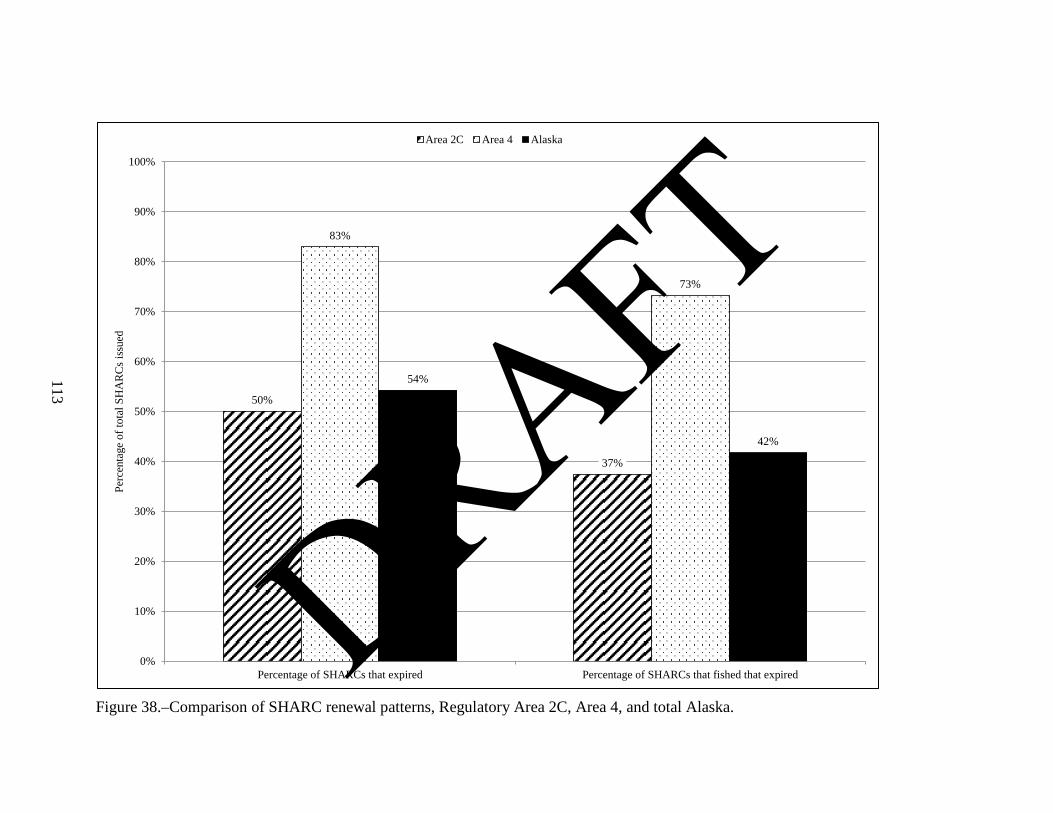
113
Figure 38.–Comparison of SHARC renewal patterns, Regulatory Area 2C, Area 4, and total Alaska.
50%
37%
83%
73%
54%
42%
0%
10%
20%
30%
40%
50%
60%
70%
80%
90%
100%
Percentage of SHARCs that expired Percentage of SHARCs that fished that expired
Perc
enta
ge o
f tot
al S
HA
RC
s is
sued
Area 2C Area 4 Alaska
DRAFT

APPENDICES
114
DRAFT
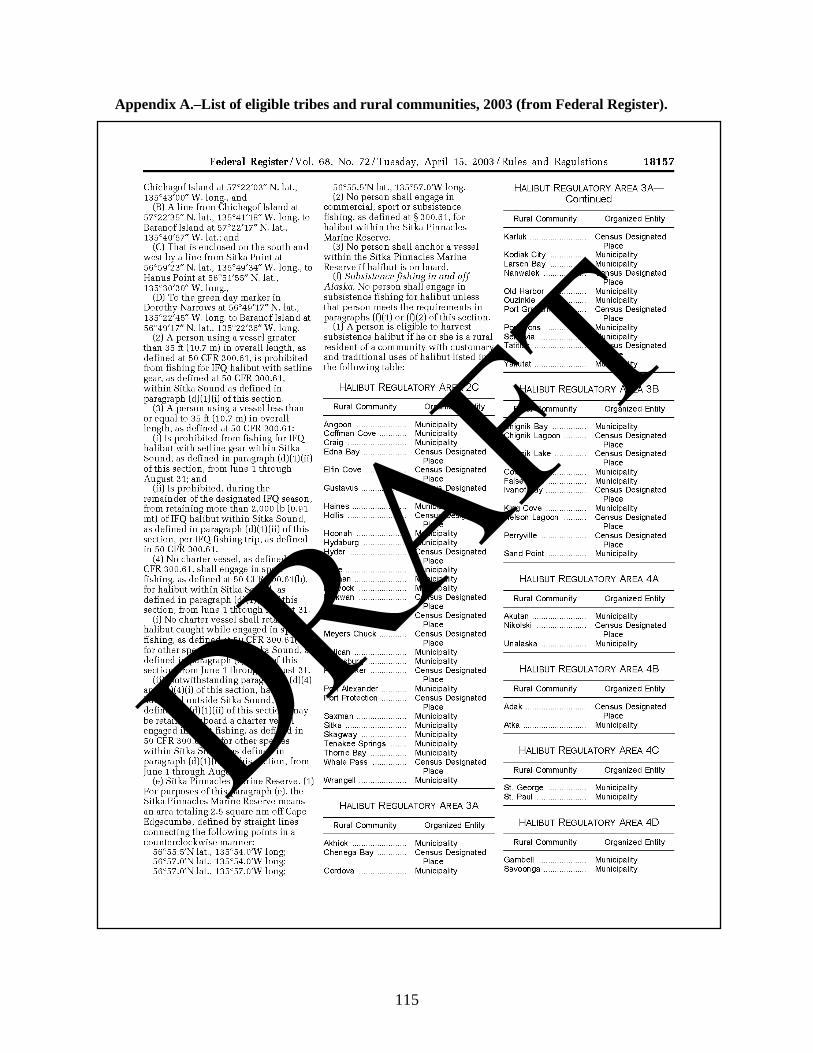
Appendix A.–List of eligible tribes and rural communities, 2003 (from Federal Register).
115
DRAFT

116
DRAFT
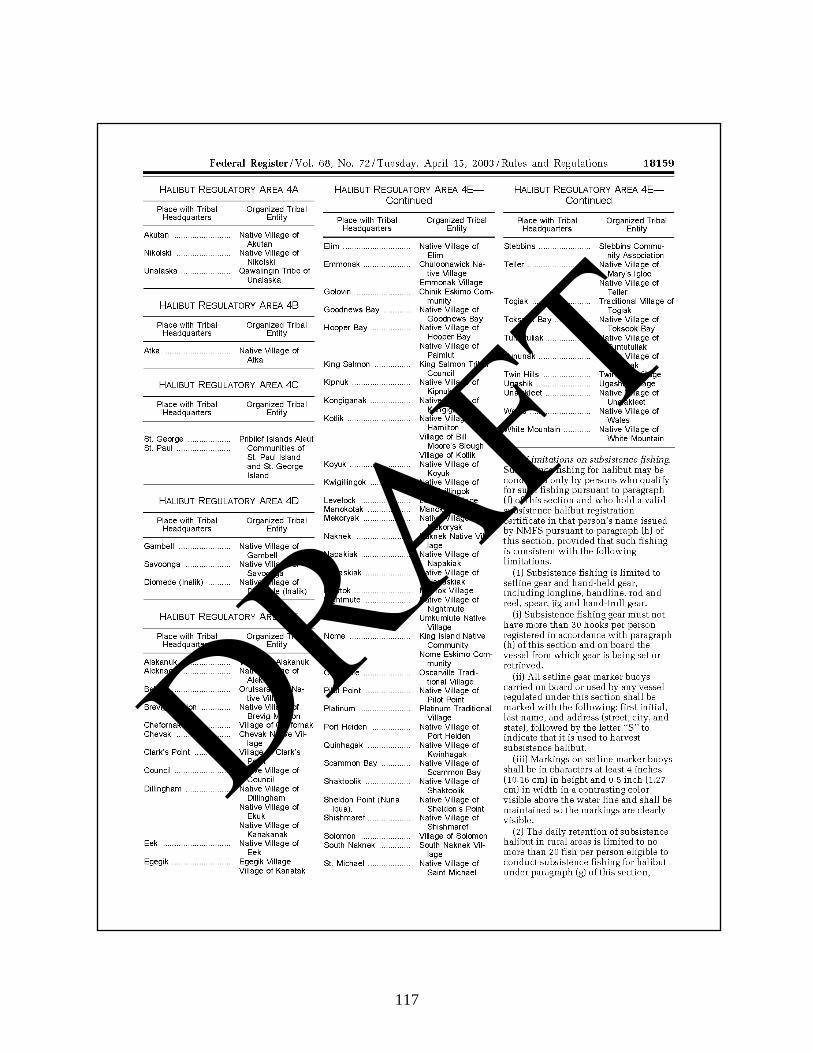
117
DRAFT
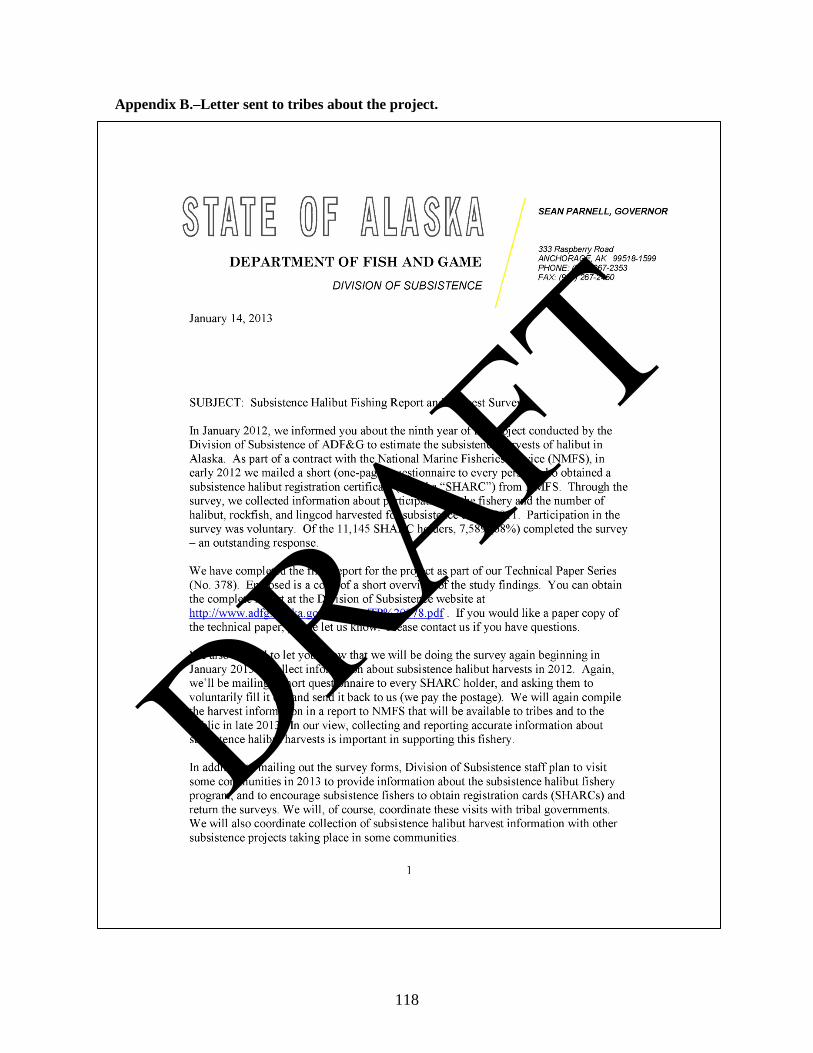
Appendix B.–Letter sent to tribes about the project.
118
DRAFT

119
DRAFT

Appendix C.–Survey instrument.
120
DRAFT
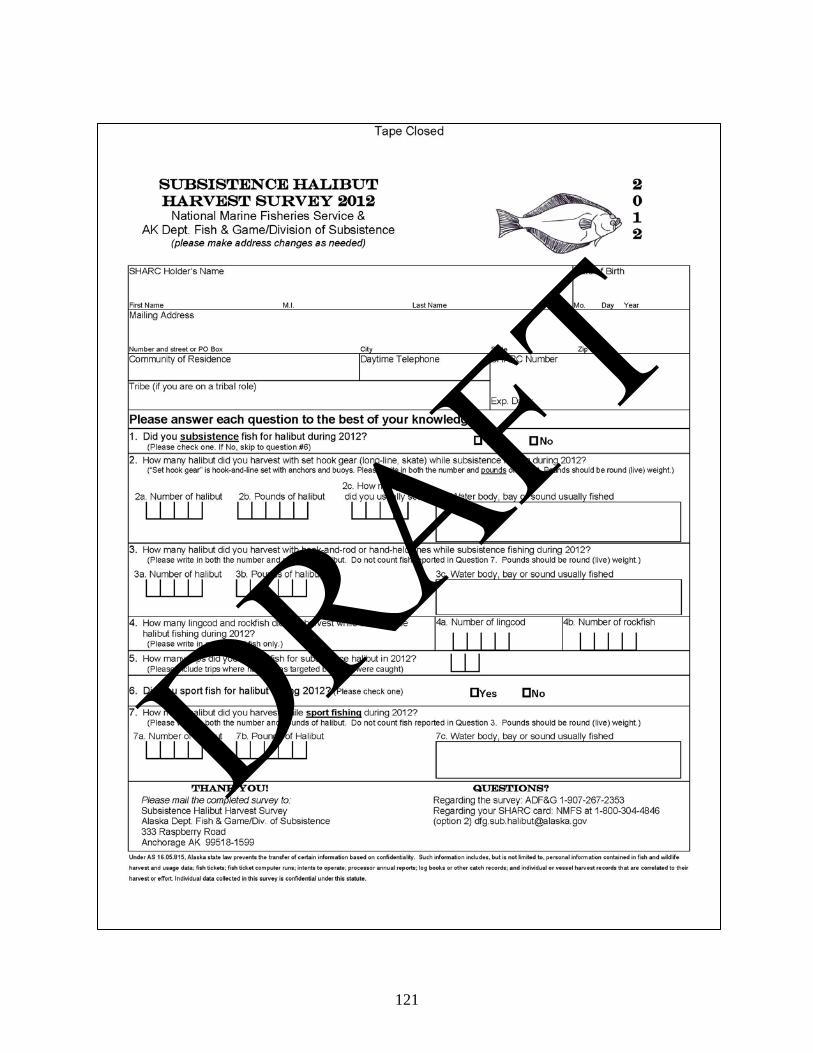
121
DRAFT
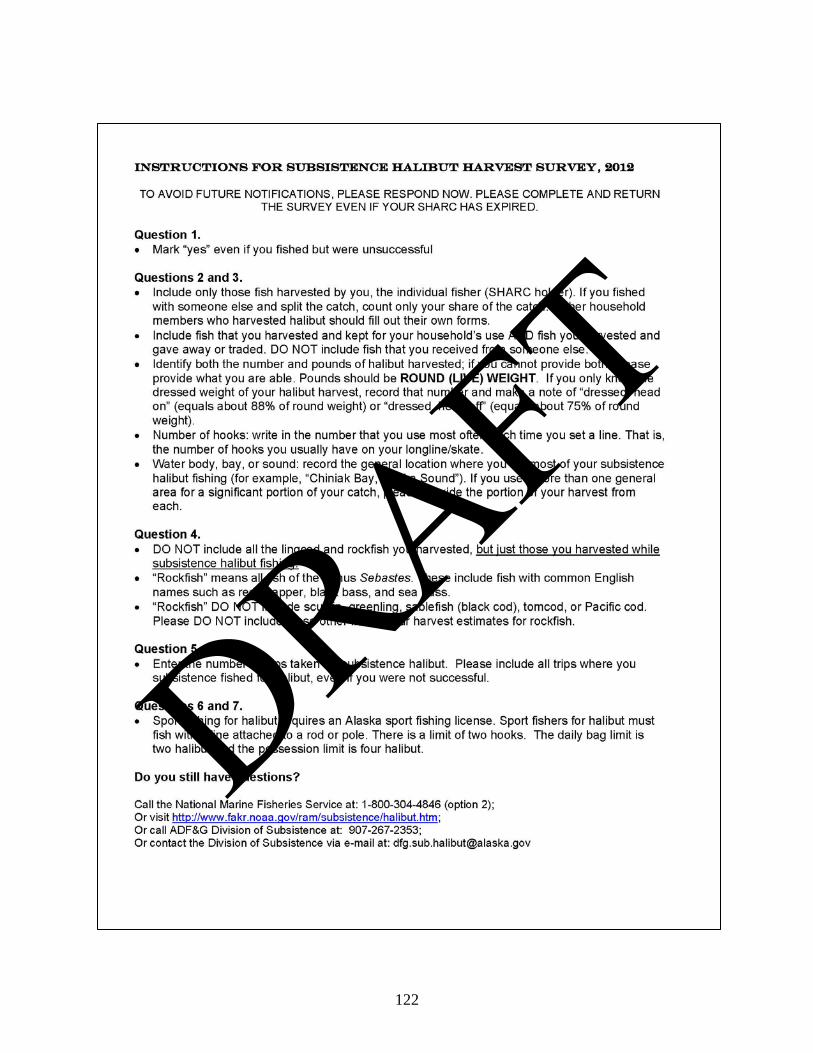
122
DRAFT
123
DRAFT

Appendix D.–Set of frequently asked questions and responses.
124
DRAFT

125
DRAFT

APPENDIX E.–APPENDIX TABLES.
126
DRAFT

127
Appendix tables.
Appendix E-1.–Results from returned surveys, 2012.
Tribal name Regulatory
area
Return rate Subsistence fished Subsistence harvest Sport fished Sport harvest Lingcod bycatch Rockfish bycatch SHARCs issueda
Surveys returned
Percent returned
Number respondents
Percent respondents
Number halibut
Pounds halibutb
Number respondents
Percent respondents
Number halibut
Pounds halibutb
Number respondents
Number lingcod
Number respondents
Number rockfish
Angoon Community Association
2C 74 72 97.3% 35 48.6% 404 12,500 4 5.6% 10 200 0 0 11 55
Aukquan Traditional Council 2C 1 Central Council Tlingit and
Haida Indian Tribes 2C 485 244 50.3% 78 32.0% 819 24,297 47 19.3% 191 3,704 7 22 22 185
Chilkat Indian Village 2C 12 12 100.0% 1 8.3% 0 0 2 16.7% 7 105 0 0 0 0 Chilkoot Indian Association 2C 50 37 74.0% 13 35.1% 38 1,199 3 8.1% 0 0 2 2 2 4 Craig Community Association 2C 59 33 55.9% 17 51.5% 174 5,850 5 15.2% 3 170 3 5 8 75 Douglas Indian Association 2C 11 4 36.4% 1 25.0% 2 95 1 25.0% 1 45 0 0 0 0 Hoonah Indian Association 2C 110 67 60.9% 34 50.7% 396 7,691 10 14.9% 28 598 0 0 1 8 Hydaburg Cooperative
Association 2C 108 46 42.6% 31 67.4% 465 19,727 5 10.9% 7 510 8 37 15 308
Ketchikan Indian Corporation 2C 454 318 70.0% 83 26.1% 1,165 31,400 44 13.8% 186 5,438 14 51 29 353 Klawock Cooperative
Association 2C 63 39 61.9% 12 30.8% 102 4,610 1 2.6% 5 150 2 4 4 28
Metlakatla Indian Community, Annette Island Reserve
2C 119 94 79.0% 21 22.3% 112 3,050 6 6.4% 9 310 1 2 2 16
Organized Village of Kake 2C 72 53 73.6% 19 35.8% 166 7,425 1 1.9% 5 75 2 3 3 59 Organized Village of Kasaan 2C 5 Organized Village of Saxman 2C 30 23 76.7% 16 69.6% 221 5,095 3 13.0% 45 365 1 2 1 8 Petersburg Indian Association 2C 68 48 70.6% 17 35.4% 129 3,004 12 25.0% 35 1,002 0 0 4 9 Sitka Tribe of Alaska 2C 264 154 58.3% 61 39.6% 358 12,491 7 4.5% 6 280 20 81 21 159 Skagway Village 2C 3 Wrangell Cooperative
Association 2C 82 68 82.9% 27 39.7% 239 9,339 15 22.1% 56 2,815 0 0 3 47
Subtotal, Area 2C 2,070 1,319 63.7% 469 35.6% 4,797 148,283 169 12.8% 597 15,872 62 212 128 1,323 Kenaitze Indian Tribe 3A 132 75 56.8% 13 17.3% 328 7,076 11 14.7% 46 629 1 2 1 9 Lesnoi Village (Woody Island) 3A 34 21 61.8% 4 19.0% 37 935 0 0.0% 0 0 1 1 1 3 Native Village of Afognak 3A 20 11 55.0% 7 63.6% 55 1,475 0 0.0% 0 0 0 0 0 0 Native Village of Akhiok 3A 7 4 57.1% 2 50.0% 33 898 0 0.0% 0 0 0 0 0 0 Native Village of Chenega 3A 18 11 61.1% 4 36.4% 36 1,200 3 27.3% 5 220 1 2 2 25 Native Village of Eyak 3A 71 43 60.6% 13 30.2% 66 1,485 8 18.6% 17 528 1 2 1 12 Native Village of Karluk 3A 4 Native Village of Larsen Bay 3A 31 14 45.2% 9 64.3% 91 3,120 2 14.3% 12 140 2 3 3 39 Native Village of Nanwalek 3A 71 29 40.8% 29 100.0% 569 10,393 0 0.0% 0 0 4 64 10 127 Native Village of Ouzinkie 3A 28 16 57.1% 7 43.8% 62 1,520 5 31.3% 17 445 0 0 1 20 Native Village of Port Graham 3A 34 23 67.6% 14 60.9% 358 8,375 4 17.4% 4 60 3 6 3 45 Native Village of Port Lions 3A 28 16 57.1% 10 62.5% 58 2,142 9 56.3% 26 798 0 0 0 0 Native Village of Tatitlek 3A 25 16 64.0% 6 37.5% 74 980 0 0.0% 0 0 0 0 1 5 Ninilchik Village 3A 73 41 56.2% 11 26.8% 503 4,359 7 17.1% 42 795 0 0 0 0 Seldovia Village Tribe 3A 58 39 67.2% 24 61.5% 338 6,503 13 33.3% 62 1,327 4 11 3 34 Sun'aq Tribe of Kodiak
(formerly Shoonaq') 3A 112 68 60.7% 36 52.9% 382 9,972 14 20.6% 36 1,182 4 13 4 42
Village of Kanatak 3A 19 3 15.8% 0 0.0% 0 0 1 33.3% 2 20 0 0 0 0 Village of Old Harbor 3A 43 21 48.8% 13 61.9% 100 1,557 2 9.5% 14 270 1 6 4 26 Village of Salamatoff 3A 25 20 80.0% 6 30.0% 159 2,220 6 30.0% 22 340 0 0 0 0 Yakutat Tlingit Tribe 3A 43 21 48.8% 15 71.4% 219 8,088 1 4.8% 0 0 1 20 1 19
Subtotal, Area 3A 876 494 56.4% 225 45.5% 3,491 72,713 86 17.4% 305 6,754 23 130 37 418
- continued -
DRAFT

128
Appendix E-1.–Page 2 of 8.
Tribal name Regulatory
area
Return rate Subsistence fished Subsistence harvest Sport fished Sport harvest Lingcod bycatch Rockfish bycatch SHARCs issueda
Surveys returned
Percent returned
Number respondents
Percent respondents
Number halibut
Pounds halibutb
Number respondents
Percent respondents
Number halibut
Pounds halibutb
Number respondents
Number lingcod
Number respondents
Number rockfish
Agdaagux Tribe of King Cove 3B 53 30 56.6% 11 36.7% 140 2,814 6 20.0% 34 926 0 0 2 8 Chignik Lake Village 3B 11 3 27.3% 0 0.0% 0 0 0 0.0% 0 0 0 0 0 0 Ivanoff Bay Village 3B 4 Native Village of Belkofski 3B 5 Native Village of Chignik 3B 4 Native Village of Chignik
Lagoon 3B 16 10 62.5% 6 60.0% 36 745 2 20.0% 8 230 1 4 3 40
Native Village of False Pass 3B 1 Native Village of Nelson
Lagoon 3B 3
Native Village of Perryville 3B 18 14 77.8% 11 78.6% 90 1,915 1 7.1% 0 0 0 0 2 10 Native Village of Unga 3B 1 Pauloff Harbor Village 3B 79 20 25.3% 11 55.0% 67 1,602 3 15.0% 11 210 0 0 1 2 Qagan Toyagungin Tribe of
Sand Point Village 3B 82 49 59.8% 17 34.7% 115 2,660 7 14.3% 26 240 1 1 2 28
Subtotal, Area 3B 277 138 49.8% 57 41.3% 455 9,866 22 15.9% 86 1,816 2 5 11 90 Native Village of Akutan 4A 11 4 36.4% 0 0.0% 0 0 0 0.0% 0 0 0 0 0 0 Qawalingin Tribe of Unalaska 4A 27 11 40.7% 5 45.5% 14 167 2 18.2% 8 130 0 0 2 24
Subtotal, Area 4A 38 15 39.5% 5 33.3% 14 167 2 13.3% 8 130 0 0 2 24 Native Village of Atka 4B 4
Subtotal, Area 4B 4 Pribilof Islands Aleut
Community of St. George 4C 5
Pribilof Islands Aleut Community of St. Paul
4C 15 3 20.0% 3 100.0% 32 615 0 0.0% 0 0 0 0 0 0
Subtotal, Area 4C 20 4 20.0% 3 75.0% 32 615 0 0.0% 0 0 0 0 0 0 Native Village of Diomede
(Inalik) 4D 1
Native Village of Savoonga 4D 5 Subtotal, Area 4D 6 5 83.3% 4 80.0% 23 920 0 0.0% 0 0 0 0 0 0
Chevak Native Village (Kashunamiut)
4E 1
Egegik Village 4E 4 King Island Native Community 4E 2 Manokotak Village 4E 1 Naknek Native Village 4E 8 1 12.5% 0 0.0% 0 0 0 0.0% 0 0 0 0 0 0 Native Village of Aleknagik 4E 4 Native Village of Brevig
Mission 4E 1
Native Village of Council 4E 4 Native Village of Dillingham
(Curyung) 4E 12 6 50.0% 2 33.3% 16 491 1 16.7% 6 185 0 0 0 0
Native Village of Eek 4E 7 4 57.1% 3 75.0% 12 570 0 0.0% 0 0 0 0 0 0 Native Village of Hooper Bay 4E 2 Native Village of Kipnuk 4E 5 Native Village of Kongiganak 4E 3 Native Village of Koyuk 4E 1 Native Village of Kwigillingok 4E 1 Native Village of Kwinhagak 4E 6 1 16.7% 0 0.0% 0 0 0 0.0% 0 0 0 0 0 0 Native Village of Mekoryuk 4E 4
- continued -
DRAFT
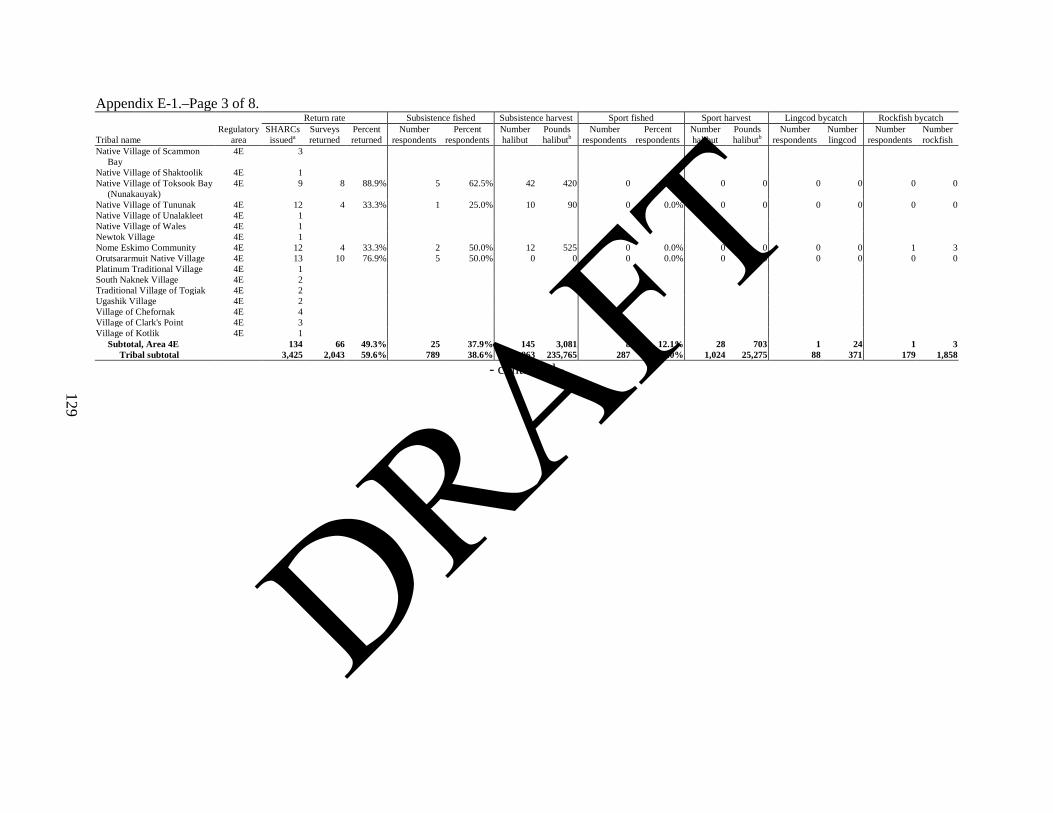
129
Appendix E-1.–Page 3 of 8.
Tribal name Regulatory
area
Return rate Subsistence fished Subsistence harvest Sport fished Sport harvest Lingcod bycatch Rockfish bycatch SHARCs issueda
Surveys returned
Percent returned
Number respondents
Percent respondents
Number halibut
Pounds halibutb
Number respondents
Percent respondents
Number halibut
Pounds halibutb
Number respondents
Number lingcod
Number respondents
Number rockfish
Native Village of Scammon Bay
4E 3
Native Village of Shaktoolik 4E 1 Native Village of Toksook Bay
(Nunakauyak) 4E 9 8 88.9% 5 62.5% 42 420 0 0.0% 0 0 0 0 0 0
Native Village of Tununak 4E 12 4 33.3% 1 25.0% 10 90 0 0.0% 0 0 0 0 0 0 Native Village of Unalakleet 4E 1 Native Village of Wales 4E 1 Newtok Village 4E 1 Nome Eskimo Community 4E 12 4 33.3% 2 50.0% 12 525 0 0.0% 0 0 0 0 1 3 Orutsararmuit Native Village 4E 13 10 76.9% 5 50.0% 0 0 0 0.0% 0 0 0 0 0 0 Platinum Traditional Village 4E 1 South Naknek Village 4E 2 Traditional Village of Togiak 4E 2 Ugashik Village 4E 2 Village of Chefornak 4E 4 Village of Clark's Point 4E 3 Village of Kotlik 4E 1 Subtotal, Area 4E 134 66 49.3% 25 37.9% 145 3,081 8 12.1% 28 703 1 24 1 3 Tribal subtotal
3,425 2,043 59.6% 789 38.6% 8,963 235,765 287 14.0% 1,024 25,275 88 371 179 1,858
- continued -
DRAFT

130
Appendix E-1.–Page 4 of 8.
Rural community Regulatory
area
Return rate Subsistence fished Subsistence harvest Sport fished Sport harvest Lingcod bycatch Rockfish bycatch SHARCs issueda
Surveys returned
Percent returned
Number respondents
Percent respondents
Number halibut
Pounds halibutb
Number respondents
Percent respondents
Number halibut
Pounds halibutb
Number respondents
Number lingcod
Number respondents
Number rockfish
Angoon 2C 14 13 92.9% 8 61.5% 125 3,209 3 23.1% 38 535 2 12 4 83 Coffman Cove 2C 50 38 76.0% 23 60.5% 121 3,047 21 55.3% 127 2,571 0 0 8 76 Craig 2C 303 230 75.9% 110 47.8% 877 22,255 70 30.4% 390 6,982 32 73 49 414 Edna Bay 2C 34 28 82.4% 14 50.0% 72 2,905 3 10.7% 2 120 3 4 6 16 Elfin Cove 2C 18 13 72.2% 5 38.5% 29 1,064 3 23.1% 22 680 1 10 3 32 Gustavus 2C 64 51 79.7% 26 51.0% 162 4,908 25 49.0% 123 3,945 0 0 2 6 Haines 2C 407 335 82.3% 189 56.4% 956 26,934 62 18.5% 94 2,114 10 26 21 44 Hollis 2C 48 35 72.9% 17 48.6% 90 4,515 3 8.6% 8 380 2 2 7 38 Hoonah 2C 93 76 81.7% 43 56.6% 465 7,531 26 34.2% 146 2,828 2 21 8 42 Hydaburg 2C 8 5 62.5% 4 80.0% 41 2,127 3 60.0% 4 100 3 7 3 17 Hyder 2C 22 20 90.9% 13 65.0% 51 1,448 6 30.0% 2 48 1 6 2 13 Juneau 2C 5
Kake 2C 33 21 63.6% 9 42.9% 75 1,670 10 47.6% 26 1,162 2 10 1 12 Kasaan 2C 10 10 100.0% 5 50.0% 24 665 3 30.0% 5 85 0 0 3 15 Ketchikan 2C 8 7 87.5% 4 57.1% 22 646 4 57.1% 0 0 1 2 3 23 Klawock 2C 141 102 72.3% 46 45.1% 577 13,422 44 43.1% 209 4,559 13 36 23 198 Metlakatla 2C 20 14 70.0% 8 57.1% 47 1,276 3 21.4% 8 185 2 3 1 6 Meyers Chuck 2C 9 7 77.8% 5 71.4% 15 460 1 14.3% 1 60 1 1 2 11 Naukati Bay 2C 48 41 85.4% 22 53.7% 129 3,684 14 34.1% 55 1,938 10 15 14 119 Pelican 2C 35 26 74.3% 16 61.5% 69 1,595 5 19.2% 11 370 8 11 9 72 Petersburg 2C 843 662 78.5% 289 43.7% 1,827 48,855 194 29.3% 658 16,006 10 44 34 179 Port Alexander 2C 16 14 87.5% 12 85.7% 120 3,242 4 28.6% 7 250 9 25 9 69 Port Protection 2C 11 10 90.9% 7 70.0% 57 1,380 0 0.0% 0 0 3 6 6 40 Pt. Baker 2C 16 12 75.0% 6 50.0% 28 669 1 8.3% 0 0 0 0 3 21 Saxman 2C 8 4 50.0% 3 75.0% 36 780 2 50.0% 11 350 3 9 2 35 Sitka 2C 1,330 1,040 78.2% 481 46.3% 2,373 74,261 183 17.6% 452 10,922 205 583 269 2,082 Skagway 2C 51 47 92.2% 22 46.8% 52 2,045 13 27.7% 35 648 0 0 1 1 Tenakee Springs 2C 58 47 81.0% 25 53.2% 160 3,823 17 36.2% 63 1,212 2 2 11 60 Thorne Bay 2C 118 97 82.2% 45 46.4% 294 9,995 36 37.1% 302 4,245 9 43 19 126 Ward Cove 2C 2
Whale Pass 2C 17 14 82.4% 10 71.4% 69 2,980 6 42.9% 6 255 1 2 2 36 Wrangell 2C 382 301 78.8% 168 55.8% 1,208 32,216 81 26.9% 233 6,716 8 18 23 131 Subtotal, Area 2C
4,222 3,324 78.7% 1,636 49.2% 10,173 283,747 846 25.5% 3,038 69,266 344 972 549 4,021
Akhiok 3A 6 5 83.3% 2 40.0% 16 230 2 40.0% 3 120 0 0 0 0 Chenega Bay 3A 8 8 100.0% 6 75.0% 89 1,750 3 37.5% 25 435 2 20 4 72 Chiniak 3A 7 5 71.4% 5 100.0% 44 530 3 60.0% 13 480 0 0 0 0 Cordova 3A 416 318 76.4% 146 45.9% 804 20,031 68 21.4% 132 3,244 4 6 24 118 Karluk 3A 6 6 100.0% 4 66.7% 35 710 0 0.0% 0 0 0 0 0 0 Kodiak 3A 1,360 978 71.9% 516 52.8% 4,589 118,471 352 36.0% 1,747 45,533 68 206 101 815 Nanwalek 3A 5
Old Harbor 3A 5
Ouzinkie 3A 16 10 62.5% 9 90.0% 56 853 3 30.0% 8 146 0 0 0 0
Port Graham 3A 5
Port Lions 3A 17 14 82.4% 9 64.3% 104 1,785 9 64.3% 60 1,397 0 0 0 0
Seldovia 3A 126 101 80.2% 63 62.4% 912 16,881 33 32.7% 228 4,714 4 29 13 138 Tatitlek 3A 11 8 72.7% 6 75.0% 41 1,310 4 50.0% 24 755 0 0 3 22 Yakutat 3A 72 49 68.1% 20 40.8% 272 8,327 11 22.4% 70 1,310 8 30 4 54
Subtotal, Area 3A
2,060 1,514 73.5% 794 52.4% 7,256 178,638 490 32.4% 2,313 58,204 88 312 151 8,460 Chignik 3B 1
Cold Bay 3B 33 27 81.8% 17 63.0% 234 4,725 11 40.7% 18 650 3 55 0 0 False Pass 3B 2
- continued -
DRAFT
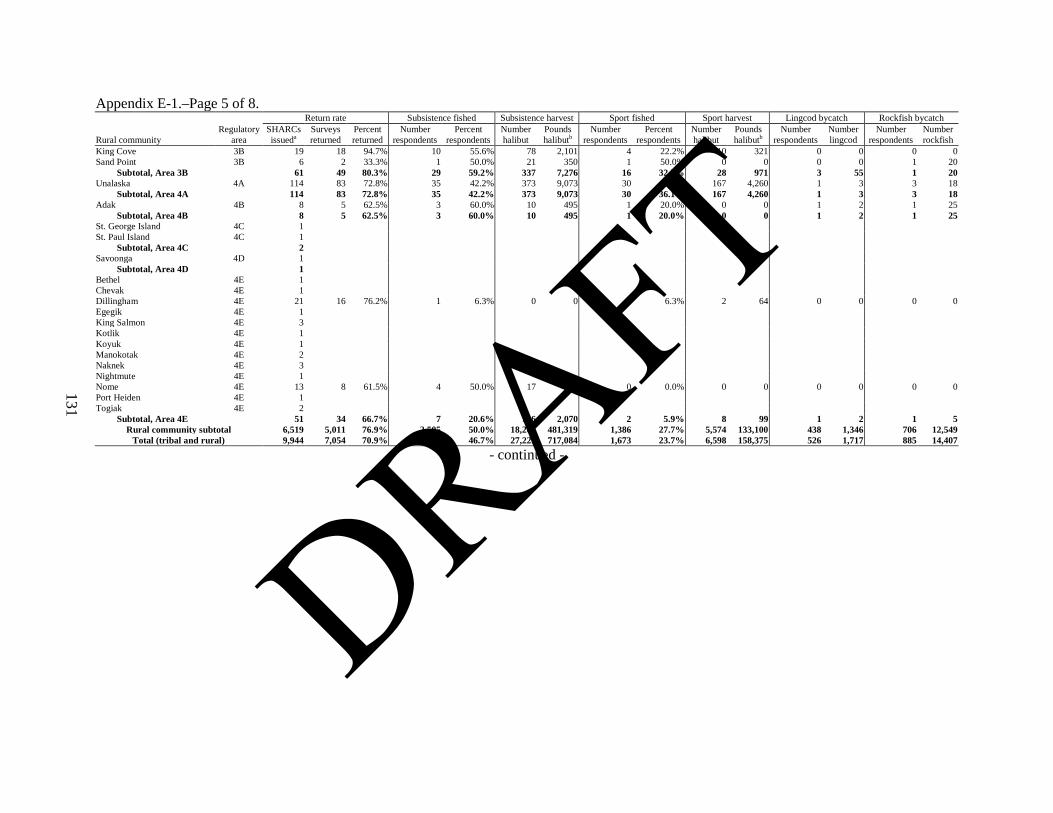
131
Appendix E-1.–Page 5 of 8.
Rural community Regulatory
area
Return rate Subsistence fished Subsistence harvest Sport fished Sport harvest Lingcod bycatch Rockfish bycatch SHARCs issueda
Surveys returned
Percent returned
Number respondents
Percent respondents
Number halibut
Pounds halibutb
Number respondents
Percent respondents
Number halibut
Pounds halibutb
Number respondents
Number lingcod
Number respondents
Number rockfish
King Cove 3B 19 18 94.7% 10 55.6% 78 2,101 4 22.2% 10 321 0 0 0 0 Sand Point 3B 6 2 33.3% 1 50.0% 21 350 1 50.0% 0 0 0 0 1 20
Subtotal, Area 3B
61 49 80.3% 29 59.2% 337 7,276 16 32.7% 28 971 3 55 1 20 Unalaska 4A 114 83 72.8% 35 42.2% 373 9,073 30 36.1% 167 4,260 1 3 3 18
Subtotal, Area 4A
114 83 72.8% 35 42.2% 373 9,073 30 36.1% 167 4,260 1 3 3 18 Adak 4B 8 5 62.5% 3 60.0% 10 495 1 20.0% 0 0 1 2 1 25
Subtotal, Area 4B
8 5 62.5% 3 60.0% 10 495 1 20.0% 0 0 1 2 1 25 St. George Island 4C 1
St. Paul Island 4C 1
Subtotal, Area 4C
2
Savoonga 4D 1
Subtotal, Area 4D
1
Bethel 4E 1
Chevak 4E 1
Dillingham 4E 21 16 76.2% 1 6.3% 0 0 1 6.3% 2 64 0 0 0 0 Egegik 4E 1
King Salmon 4E 3
Kotlik 4E 1
Koyuk 4E 1
Manokotak 4E 2
Naknek 4E 3
Nightmute 4E 1
Nome 4E 13 8 61.5% 4 50.0% 17 545 0 0.0% 0 0 0 0 0 0 Port Heiden 4E 1
Togiak 4E 2
Subtotal, Area 4E
51 34 66.7% 7 20.6% 116 2,070 2 5.9% 8 99 1 2 1 5
Rural community subtotal 6,519 5,011 76.9% 2,505 50.0% 18,266 481,319 1,386 27.7% 5,574 133,100 438 1,346 706 12,549 Total (tribal and rural) 9,944 7,054 70.9% 3,294 46.7% 27,229 717,084 1,673 23.7% 6,598 158,375 526 1,717 885 14,407
- continued -
DRAFT

132
Appendix E-1.–Page 6 of 8.
Community of residence Regulatory
area
Return rate Subsistence fished Subsistence harvest Sport fished Sport harvest Lingcod bycatch Rockfish bycatch SHARCs issueda
Surveys returned
Percent returned
Number respondents
Percent respondents
Number halibut
Pounds halibutb
Number respondents
Percent respondents
Number halibut
Pounds halibutb
Number respondents
Number lingcod
Number respondents
Number rockfish
Adak AK 7 3 42.9% 1 33.3% 1 155 1 33.3% 0 0 0 0 0 0 Akhiok AK 4
Akutan AK 6 0 0.0% 0 0.0% 0 0 0 0.0% 0 0 0 0 0 0 Anchor Point AK 16 7 43.8% 6 85.7% 108 2,040 1 14.3% 4 80 0 0 0 0 Anchorage AK 198 115 58.1% 31 27.0% 371 10,927 26 22.6% 60 1,530 4 7 10 63 Angoon AK 97 92 94.8% 47 51.1% 565 16,464 7 7.6% 48 735 2 12 16 140 Auke Bay AK 4
Barrow AK 2
Bethel AK 13 10 76.9% 5 50.0% 4 160 0 0.0% 0 0 0 0 0 0
Chefornak AK 3
Chenega Bay AK 10 10 100.0% 7 70.0% 99 2,450 4 40.0% 26 475 3 22 5 92
Chevak AK 1
Chignik AK 6 4 66.7% 0 0.0% 0 0 0 0.0% 0 0 0 0 0 0
Chignik Lagoon AK 9 5 55.6% 2 40.0% 26 470 1 20.0% 4 80 0 0 2 30 Chignik Lake AK 1
Chiniak AK 13 11 84.6% 8 72.7% 52 825 4 36.4% 13 480 0 0 0 0 Chugiak AK 4
Clarks Point AK 3
Coffman Cove AK 49 39 79.6% 22 56.4% 113 2,791 21 53.8% 127 2,571 0 0 8 76
Cold Bay AK 37 30 81.1% 17 56.7% 234 4,725 12 40.0% 23 820 3 55 0 0 Cordova AK 470 351 74.7% 155 44.2% 862 21,166 72 20.5% 135 3,339 5 8 25 130 Craig AK 450 333 74.0% 161 48.3% 1,309 36,184 88 26.4% 417 7,977 43 95 77 624 Dillingham AK 25 18 72.0% 3 16.7% 16 491 1 5.6% 2 64 0 0 0 0 Douglas AK 11 4 36.4% 2 50.0% 8 200 2 50.0% 2 40 0 0 0 0 Dutch Harbor AK 70 47 67.1% 22 46.8% 262 6,256 19 40.4% 99 3,035 0 0 2 8 Eagle River AK 9 5 55.6% 3 60.0% 43 705 2 40.0% 6 120 0 0 0 0 Edna Bay AK 26 20 76.9% 10 50.0% 55 2,240 2 10.0% 2 120 2 3 3 7 Eek AK 5
Egegik AK 1
Elfin Cove AK 17 12 70.6% 5 41.7% 29 1,064 3 25.0% 22 680 1 10 3 32
Excursion Inlet AK 4
Fairbanks AK 6 4 66.7% 1 25.0% 6 200 0 0.0% 0 0 0 0 0 0
False Pass AK 2
Fritz Creek AK 1
Gakona AK 1
Girdwood AK 1
Gustavus AK 64 50 78.1% 25 50.0% 157 4,788 24 48.0% 117 3,795 0 0 2 6 Haines AK 455 371 81.5% 196 52.8% 951 26,823 62 16.7% 76 1,729 10 26 21 44 Homer AK 30 23 76.7% 7 30.4% 114 2,255 7 30.4% 30 685 2 4 2 31 Hoonah AK 199 142 71.4% 79 55.6% 951 16,912 36 25.4% 174 3,426 2 21 9 50 Hydaburg AK 105 49 46.7% 35 71.4% 506 21,854 7 14.3% 7 510 11 44 18 325 Hyder AK 22 20 90.9% 13 65.0% 51 1,448 6 30.0% 2 48 1 6 2 13 Juneau AK 338 149 44.1% 37 24.8% 316 8,175 33 22.1% 158 3,014 1 2 10 51 Kake AK 103 78 75.7% 31 39.7% 248 9,725 11 14.1% 27 1,242 4 13 5 73 Karluk AK 9 7 77.8% 5 71.4% 55 1,085 0 0.0% 0 0 0 0 1 10 Kasaan AK 9 9 100.0% 7 77.8% 30 915 3 33.3% 8 190 2 3 4 22 Kasilof AK 14 7 50.0% 3 42.9% 61 1,455 3 42.9% 12 230 0 0 1 6 Kaukati AK 1
Kenai AK 106 60 56.6% 9 15.0% 284 6,983 11 18.3% 47 744 1 2 1 9 Ketchikan AK 524 381 72.7% 117 30.7% 1,538 44,052 67 17.6% 298 7,618 24 84 44 614 King Cove AK 73 44 60.3% 20 45.5% 215 4,618 9 20.5% 37 1,062 0 0 1 6
- continued -
DRAFT

133
Appendix E-1.–Page 7 of 8.
Community of residence Regulatory
area
Return rate Subsistence fished Subsistence harvest Sport fished Sport harvest Lingcod bycatch Rockfish bycatch SHARCs issueda
Surveys returned
Percent returned
Number respondents
Percent respondents
Number halibut
Pounds halibutb
Number respondents
Percent respondents
Number halibut
Pounds halibutb
Number respondents
Number lingcod
Number respondents
Number rockfish
King Salmon AK 2
Kipnuk AK 5
Klawock AK 212 136 64.2% 59 43.4% 705 22,538 41 30.1% 218 4,532 16 35 24 172 Klukwan AK 1
Kodiak AK 1,503 1,059 70.5% 558 52.7% 4,997 130,328 364 34.4% 1,794 46,435 74 223 107 883 Kongiganak AK 3
Kotzebue AK 1
Koyuk AK 1
Kwigillingok AK 1
Larsen Bay AK 22 10 45.5% 7 70.0% 67 1,370 2 20.0% 12 140 1 1 2 14
Manokotak AK 2
Mekoryuk AK 3
Metlakatla AK 128 102 79.7% 27 26.5% 132 3,726 9 8.8% 17 495 3 5 3 22 Meyers Chuck AK 8 6 75.0% 5 83.3% 15 460 1 16.7% 1 60 1 1 2 11 Naknek AK 9 2 22.2% 0 0.0% 0 0 0 0.0% 0 0 0 0 0 0 Nanwalek AK 74 34 45.9% 33 97.1% 824 17,393 0 0.0% 0 0 6 85 12 157 Naukati AK 22 18 81.8% 10 55.6% 77 1,857 4 22.2% 19 675 4 6 5 36 Nelson Lagoon AK 1
Nightmute AK 1
Nikiski AK 7 3 42.9% 1 33.3% 20 450 1 33.3% 4 60 0 0 0 0
Ninilchik AK 28 14 50.0% 1 7.1% 32 512 3 21.4% 22 320 0 0 0 0 Nome AK 18 10 55.6% 5 50.0% 23 705 0 0.0% 0 0 0 0 0 0 North Pole AK 2
Old Harbor AK 37 23 62.2% 16 69.6% 132 2,565 3 13.0% 15 320 1 6 3 21 Ouzinkie AK 35 23 65.7% 15 65.2% 106 1,858 5 21.7% 18 376 0 0 1 20 Palmer AK 10 6 60.0% 1 16.7% 1 22 1 16.7% 1 88 0 0 0 0 Pelican AK 44 33 75.0% 23 69.7% 112 3,442 7 21.2% 12 395 10 14 14 93 Perryville AK 15 13 86.7% 8 61.5% 65 1,355 1 7.7% 0 0 0 0 2 10 Petersburg AK 917 711 77.5% 305 42.9% 1,985 51,241 208 29.3% 699 17,083 10 49 37 197 Point Baker AK 22 17 77.3% 11 64.7% 55 1,391 1 5.9% 0 0 1 2 7 50 Port Alexander AK 16 14 87.5% 12 85.7% 120 3,242 4 28.6% 7 250 9 25 9 69 Port Graham AK 32 21 65.6% 12 57.1% 144 2,213 4 19.0% 4 50 2 2 0 0 Port Heiden AK 1
Port Lions AK 43 28 65.1% 18 64.3% 158 3,547 17 60.7% 85 1,970 0 0 0 0 Port William AK 1
Quinhagak AK 8 1 12.5% 0 0.0% 0 0 0 0.0% 0 0 0 0 0 0 Sand Point AK 136 60 44.1% 28 46.7% 176 3,989 11 18.3% 37 450 1 1 4 50 Savoonga AK 6 5 83.3% 4 80.0% 18 780 0 0.0% 0 0 0 0 0 0 Saxman AK 6 5 83.3% 4 80.0% 29 695 0 0.0% 0 0 1 2 1 8 Seldovia AK 139 110 79.1% 72 65.5% 990 18,606 34 30.9% 242 4,874 5 35 14 141 Seward AK 10 7 70.0% 1 14.3% 4 200 1 14.3% 3 110 1 4 1 10 Sitka AK 1,570 1,181 75.2% 544 46.1% 2,681 86,815 187 15.8% 412 10,397 226 661 290 2,247 Skagway AK 57 52 91.2% 24 46.2% 69 2,370 14 26.9% 35 648 0 0 1 1 Soldotna AK 51 38 74.5% 13 34.2% 547 3,720 8 21.1% 48 1,020 0 0 0 0 St. George Island AK 2
St. Paul Island AK 12 3 25.0% 3 100.0% 32 615 0 0.0% 0 0 0 0 0 0 Sterling AK 2
Tatitlek AK 22 17 77.3% 9 52.9% 98 1,895 1 5.9% 15 500 0 0 3 17 Tenakee Springs AK 58 47 81.0% 25 53.2% 160 3,823 17 36.2% 63 1,212 2 2 11 60 Thorne Bay AK 116 95 81.9% 45 47.4% 298 10,051 35 36.8% 302 4,245 9 43 19 126 Togiak AK 4
- continued -
DRAFT
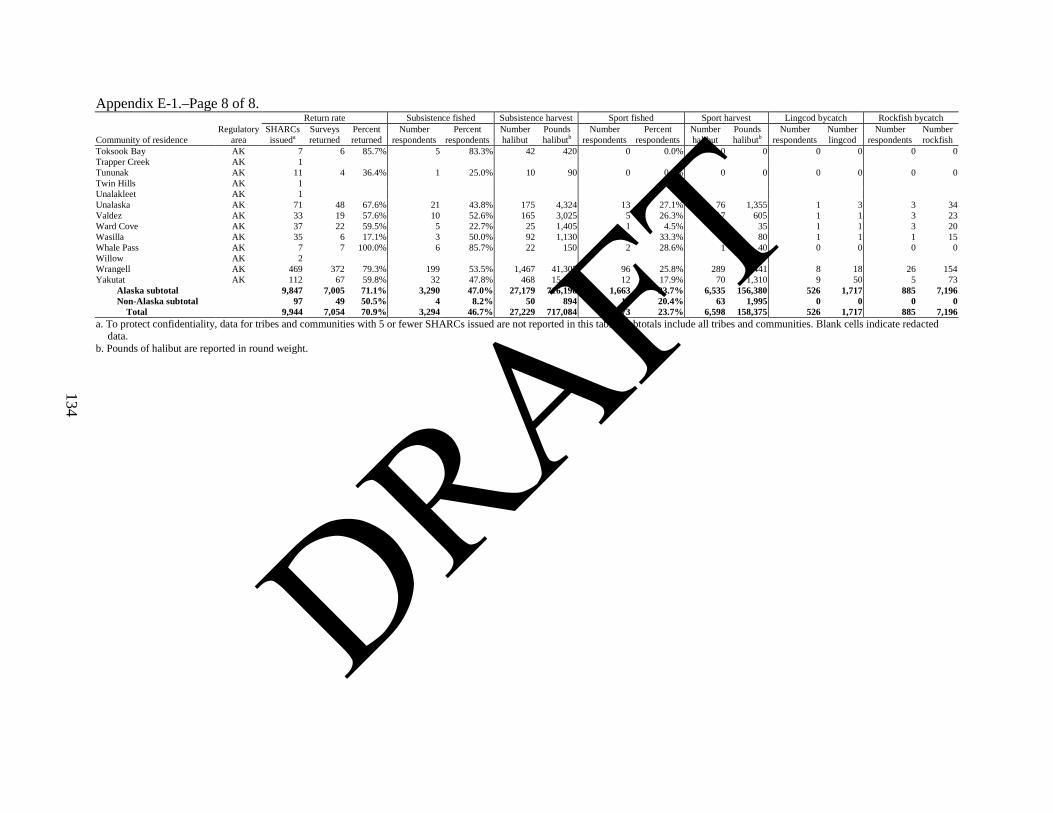
134
Appendix E-1.–Page 8 of 8.
Community of residence Regulatory
area
Return rate Subsistence fished Subsistence harvest Sport fished Sport harvest Lingcod bycatch Rockfish bycatch SHARCs issueda
Surveys returned
Percent returned
Number respondents
Percent respondents
Number halibut
Pounds halibutb
Number respondents
Percent respondents
Number halibut
Pounds halibutb
Number respondents
Number lingcod
Number respondents
Number rockfish
Toksook Bay AK 7 6 85.7% 5 83.3% 42 420 0 0.0% 0 0 0 0 0 0 Trapper Creek AK 1
Tununak AK 11 4 36.4% 1 25.0% 10 90 0 0.0% 0 0 0 0 0 0 Twin Hills AK 1
Unalakleet AK 1
Unalaska AK 71 48 67.6% 21 43.8% 175 4,324 13 27.1% 76 1,355 1 3 3 34
Valdez AK 33 19 57.6% 10 52.6% 165 3,025 5 26.3% 17 605 1 1 3 23 Ward Cove AK 37 22 59.5% 5 22.7% 25 1,405 1 4.5% 1 35 1 1 3 20 Wasilla AK 35 6 17.1% 3 50.0% 92 1,130 2 33.3% 4 80 1 1 1 15 Whale Pass AK 7 7 100.0% 6 85.7% 22 150 2 28.6% 1 40 0 0 0 0 Willow AK 2
Wrangell AK 469 372 79.3% 199 53.5% 1,467 41,305 96 25.8% 289 9,441 8 18 26 154 Yakutat AK 112 67 59.8% 32 47.8% 468 15,675 12 17.9% 70 1,310 9 50 5 73
Alaska subtotal
9,847 7,005 71.1% 3,290 47.0% 27,179 716,190 1,663 23.7% 6,535 156,380 526 1,717 885 7,196 Non-Alaska subtotal
97 49 50.5% 4 8.2% 50 894 10 20.4% 63 1,995 0 0 0 0
Total
9,944 7,054 70.9% 3,294 46.7% 27,229 717,084 1,673 23.7% 6,598 158,375 526 1,717 885 7,196 a. To protect confidentiality, data for tribes and communities with 5 or fewer SHARCs issued are not reported in this table. Subtotals include all tribes and communities. Blank cells indicate redacted
data. b. Pounds of halibut are reported in round weight.
DRAFT

135
Appendix E-2.–Harvests by return category.
Tribal name Regulatory
area
First mailing response Second mailing response Third mailing response Staff administered
Number returned
Number subsistence
fished
Number of halibut harvested
Mean, all
returned
Mean, those who
fished Number returned
Number subsistence
fished
Number of halibut harvested
Mean, all
returned
Mean, those who
fished Number returned
Number subsistence
fished
Number of halibut harvested
Mean, all
returned
Mean, those who
fished Number returned
Number subsistence
fished
Number of halibut harvested
Mean, all
returned
Mean, those who
fished Angoon Community
Association 2C 20 8 108 5.4 13.5 7 3 63 9.0 21.0 3 2 0 0.0 0.0 42 22 233 5.5 10.6
Aukquan Traditional Council
2C
Central Council Tlingit and Haida Indian Tribes
2C 160 43 528 3.3 12.3 55 21 178 3.2 8.5 20 8 63 3.2 7.9 9 6 50 5.6 8.3
Chilkat Indian Village 2C 9 1 0 0.0 0.0 2 0 0 0.0 0.0 0 0 0 0.0 0.0 1 0 0 0.0 0.0 Chilkoot Indian
Association 2C 25 10 32 1.3 3.2 7 3 6 0.9 2.0 1 0 0 0.0 0.0 4 0 0 0.0 0.0
Craig Community Association
2C 25 14 150 6.0 10.7 7 2 20 2.9 10.0 1 1 4 4.0 4.0 0 0 0 0.0 0.0
Douglas Indian Association
2C 4 1 2 0.5 2.0 0 0 0 0.0 0.0 0 0 0 0.0 0.0 0 0 0 0.0 0.0
Hoonah Indian Association
2C 42 23 260 6.2 11.3 14 6 122 8.7 20.3 9 3 14 1.6 4.7 2 2 0 0.0 0.0
Hydaburg Cooperative Association
2C 19 12 90 4.7 7.5 4 3 58 14.5 19.3 2 2 25 12.5 12.5 21 14 292 13.9 20.9
Ketchikan Indian Corporation
2C 150 49 849 5.7 17.3 36 7 123 3.4 17.6 15 5 26 1.7 5.2 117 22 167 1.4 7.6
Klawock Cooperative Association
2C 24 9 85 3.5 9.4 8 1 10 1.3 10.0 6 2 7 1.2 3.5 1 0 0 0.0 0.0
Metlakatla Indian Community, Annette Island Reserve
2C 40 8 29 0.7 3.6 10 6 27 2.7 4.5 1 1 4 4.0 4.0 43 6 52 1.2 8.7
Organized Village of Kake
2C 34 13 107 3.1 8.2 16 4 37 2.3 9.3 3 2 22 7.3 11.0 0 0 0 0.0 0.0
Organized Village of Kasaan
2C
Organized Village of Saxman
2C 11 6 138 12.5 23.0 4 4 23 5.8 5.8 1 1 4 4.0 4.0 7 5 56 8.0 11.2
Petersburg Indian Association
2C 31 16 124 4.0 7.8 13 0 0 0.0 0.0 3 1 5 1.7 5.0 1 0 0 0.0 0.0
Sitka Tribe of Alaska 2C 81 32 196 2.4 6.1 30 14 78 2.6 5.6 12 5 35 2.9 7.0 31 10 49 1.6 4.9 Skagway Village 2C Wrangell Cooperative
Association 2C 54 19 161 3.0 8.5 10 7 68 6.8 9.7 4 1 10 2.5 10.0 0 0 0 0.0 0.0
Subtotal, Area 2C 734 266 2,866 3.9 10.8 224 81 813 3.6 10.0 81 34 219 2.7 6.4 280 88 899 3.2 10.2 Kenaitze Indian Tribe 3A 56 6 80 1.4 13.3 14 6 233 16.6 38.8 5 1 15 3.0 15.0 0 0 0 0.0 0.0 Lesnoi Village
(Woody Island) 3A 15 3 36 2.4 12.0 5 1 1 0.2 1.0 1 0 0 0.0 0.0 0 0 0 0.0 0.0
Native Village of Afognak
3A 8 6 50 6.3 8.3 2 1 5 2.5 5.0 1 0 0 0.0 0.0 0 0 0 0.0 0.0
Native Village of Akhiok
3A 4 2 33 8.3 16.5 0 0 0 0.0 0.0 0 0 0 0.0 0.0 0 0 0 0.0 0.0
Native Village of Chenega
3A 10 3 36 3.6 12.0 1 0 0 0.0 0.0 0 1 0 0.0 0.0 0 0 0 0.0 0.0
Native Village of Eyak 3A 29 9 43 1.5 4.8 12 4 23 1.9 5.8 2 0 0 0.0 0.0 0 0 0 0.0 0.0
- continued -
DRAFT
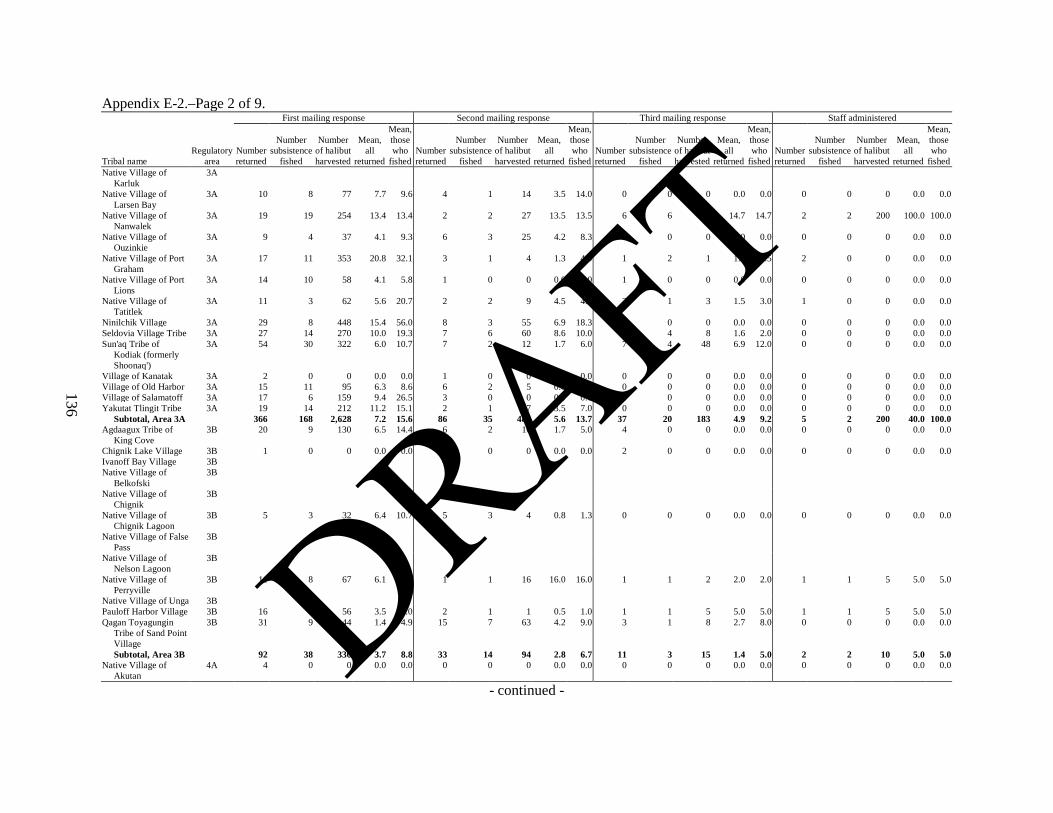
136
Appendix E-2.–Page 2 of 9.
Tribal name Regulatory
area
First mailing response Second mailing response Third mailing response Staff administered
Number returned
Number subsistence
fished
Number of halibut harvested
Mean, all
returned
Mean, those who
fished Number returned
Number subsistence
fished
Number of halibut harvested
Mean, all
returned
Mean, those who
fished Number returned
Number subsistence
fished
Number of halibut harvested
Mean, all
returned
Mean, those who
fished Number returned
Number subsistence
fished
Number of halibut harvested
Mean, all
returned
Mean, those who
fished Native Village of
Karluk 3A
Native Village of Larsen Bay
3A 10 8 77 7.7 9.6 4 1 14 3.5 14.0 0 0 0 0.0 0.0 0 0 0 0.0 0.0
Native Village of Nanwalek
3A 19 19 254 13.4 13.4 2 2 27 13.5 13.5 6 6 88 14.7 14.7 2 2 200 100.0 100.0
Native Village of Ouzinkie
3A 9 4 37 4.1 9.3 6 3 25 4.2 8.3 1 0 0 0.0 0.0 0 0 0 0.0 0.0
Native Village of Port Graham
3A 17 11 353 20.8 32.1 3 1 4 1.3 4.0 1 2 1 1.0 0.5 2 0 0 0.0 0.0
Native Village of Port Lions
3A 14 10 58 4.1 5.8 1 0 0 0.0 0.0 1 0 0 0.0 0.0 0 0 0 0.0 0.0
Native Village of Tatitlek
3A 11 3 62 5.6 20.7 2 2 9 4.5 4.5 2 1 3 1.5 3.0 1 0 0 0.0 0.0
Ninilchik Village 3A 29 8 448 15.4 56.0 8 3 55 6.9 18.3 4 0 0 0.0 0.0 0 0 0 0.0 0.0 Seldovia Village Tribe 3A 27 14 270 10.0 19.3 7 6 60 8.6 10.0 5 4 8 1.6 2.0 0 0 0 0.0 0.0 Sun'aq Tribe of
Kodiak (formerly Shoonaq')
3A 54 30 322 6.0 10.7 7 2 12 1.7 6.0 7 4 48 6.9 12.0 0 0 0 0.0 0.0
Village of Kanatak 3A 2 0 0 0.0 0.0 1 0 0 0.0 0.0 0 0 0 0.0 0.0 0 0 0 0.0 0.0 Village of Old Harbor 3A 15 11 95 6.3 8.6 6 2 5 0.8 2.5 0 0 0 0.0 0.0 0 0 0 0.0 0.0 Village of Salamatoff 3A 17 6 159 9.4 26.5 3 0 0 0.0 0.0 0 0 0 0.0 0.0 0 0 0 0.0 0.0 Yakutat Tlingit Tribe 3A 19 14 212 11.2 15.1 2 1 7 3.5 7.0 0 0 0 0.0 0.0 0 0 0 0.0 0.0 Subtotal, Area 3A 366 168 2,628 7.2 15.6 86 35 480 5.6 13.7 37 20 183 4.9 9.2 5 2 200 40.0 100.0 Agdaagux Tribe of
King Cove 3B 20 9 130 6.5 14.4 6 2 10 1.7 5.0 4 0 0 0.0 0.0 0 0 0 0.0 0.0
Chignik Lake Village 3B 1 0 0 0.0 0.0 0 0 0 0.0 0.0 2 0 0 0.0 0.0 0 0 0 0.0 0.0 Ivanoff Bay Village 3B Native Village of
Belkofski 3B
Native Village of Chignik
3B
Native Village of Chignik Lagoon
3B 5 3 32 6.4 10.7 5 3 4 0.8 1.3 0 0 0 0.0 0.0 0 0 0 0.0 0.0
Native Village of False Pass
3B
Native Village of Nelson Lagoon
3B
Native Village of Perryville
3B 11 8 67 6.1 8.4 1 1 16 16.0 16.0 1 1 2 2.0 2.0 1 1 5 5.0 5.0
Native Village of Unga 3B Pauloff Harbor Village 3B 16 8 56 3.5 7.0 2 1 1 0.5 1.0 1 1 5 5.0 5.0 1 1 5 5.0 5.0 Qagan Toyagungin
Tribe of Sand Point Village
3B 31 9 44 1.4 4.9 15 7 63 4.2 9.0 3 1 8 2.7 8.0 0 0 0 0.0 0.0
Subtotal, Area 3B 92 38 336 3.7 8.8 33 14 94 2.8 6.7 11 3 15 1.4 5.0 2 2 10 5.0 5.0 Native Village of
Akutan 4A 4 0 0 0.0 0.0 0 0 0 0.0 0.0 0 0 0 0.0 0.0 0 0 0 0.0 0.0
- continued -
DRAFT

137
Appendix E-2.–Page 3 of 9.
Tribal name Regulatory
area
First mailing response Second mailing response Third mailing response Staff administered
Number returned
Number subsistence
fished
Number of halibut harvested
Mean, all
returned
Mean, those who
fished Number returned
Number subsistence
fished
Number of halibut harvested
Mean, all
returned
Mean, those who
fished Number returned
Number subsistence
fished
Number of halibut harvested
Mean, all
returned
Mean, those who
fished Number returned
Number subsistence
fished
Number of halibut harvested
Mean, all
returned
Mean, those who
fished Qawalingin Tribe of
Unalaska 4A 8 3 14 1.8 4.7 2 2 0 0.0 0.0 0 0 0 0.0 0.0 1 0 0 0.0 0.0
Subtotal, Area 4A 12 3 14 1.2 4.7 2 2 0 0.0 0.0 0 0 0 0.0 0.0 1 0 0 0.0 0.0 Native Village of Atka 4B Subtotal, Area 4B 1 0 0 0.0 0.0 1 1 6 6.0 6.0 0 0 0 0.0 0.0 0 0 0 0.0 0.0 Pribilof Islands Aleut
Community of St George
4C
Pribilof Islands Aleut Community of St Paul
4C 2 2 11 5.5 5.5 0 0 0 0.0 0.0 1 1 21 21.0 21.0 0 0 0 0.0 0.0
Subtotal, Area 4C 3 2 11 3.7 5.5 0 0 0 0.0 0.0 1 1 21 21.0 21.0 0 0 0 0.0 0.0 Native Village of
Diomede (Inalik) 4D
Native Village of Savoonga
4D
Subtotal, Area 4D 3 3 21 7.0 7.0 1 0 0 0.0 0.0 1 1 2 2.0 2.0 0 0 0 0.0 0.0 Chevak Native Village
(Kashunamiut) 4E
Egegik Village 4E King Island Native
Community 4E
Manokotak Village 4E Naknek Native Village 4E 1 0 0 0.0 0.0 0 0 0 0.0 0.0 0 0 0 0.0 0.0 0 0 0 0.0 0.0 Native Village of
Aleknagik 4E
Native Village of Brevig Mission
4E
Native Village of Council
4E
Native Village of Dillingham (Curyung)
4E 2 0 0 0.0 0.0 2 2 16 8.0 8.0 2 0 0 0.0 0.0 0 0 0 0.0 0.0
Native Village of Eek 4E 3 3 12 4.0 4.0 1 0 0 0.0 0.0 0 0 0 0.0 0.0 0 0 0 0.0 0.0 Native Village of
Hooper Bay 4E
Native Village of Kipnuk
4E
Native Village of Kongiganak
4E
Native Village of Koyuk
4E
Native Village of Kwigillingok
4E
Native Village of Kwinhagak
4E 0 0 0 0.0 0.0 0 0 0 0.0 0.0 1 0 0 0.0 0.0 0 0 0 0.0 0.0
Native Village of Mekoryuk
4E
- continued -
DRAFT

138
Appendix E-2.–Page 4 of 9.
Tribal name Regulatory
area
First mailing response Second mailing response Third mailing response Staff administered
Number returned
Number subsistence
fished
Number of halibut harvested
Mean, all
returned
Mean, those who
fished Number returned
Number subsistence
fished
Number of halibut harvested
Mean, all
returned
Mean, those who
fished Number returned
Number subsistence
fished
Number of halibut harvested
Mean, all
returned
Mean, those who
fished Number returned
Number subsistence
fished
Number of halibut harvested
Mean, all
returned
Mean, those who
fished Native Village of
Scammon Bay 4E
Native Village of Shaktoolik
4E
Native Village of Toksook Bay (nunakauyak)
4E 8 5 42 5.3 8.4 0 0 0 0.0 0.0 0 0 0 0.0 0.0 0 0 0 0.0 0.0
Native Village of Tununak
4E 4 1 10 2.5 10.0 0 0 0 0.0 0.0 0 0 0 0.0 0.0 0 0 0 0.0 0.0
Native Village of Unalakleet
4E
Native Village of Wales
4E
Newtok Village 4E Nome Eskimo
Community 4E 3 1 2 0.7 2.0 1 1 10 10.0 10.0 0 0 0 0.0 0.0 0 0 0 0.0 0.0
Orutsararmuit Native Village
4E 3 2 0 0.0 0.0 2 0 0 0.0 0.0 5 3 0 0.0 0.0 0 0 0 0.0 0.0
Platinum Traditional Village
4E
South Naknek Village 4E Traditional Village of
Togiak 4E
Ugashik Village 4E Village of Chefornak 4E Village of Clark's
Point 4E
Village of Kotlik 4E Subtotal, Area 4E 39 18 119 3.1 6.6 16 3 26 1.6 8.7 11 4 0 0.0 0.0 0 0 0 0.0 0.0 Tribal subtotal 1,250 498 5,995 4.8 12.0 363 136 1,419 3.9 10.4 142 63 440 3.1 7.0 288 92 1,109 3.9 12.1
- continued -
DRAFT
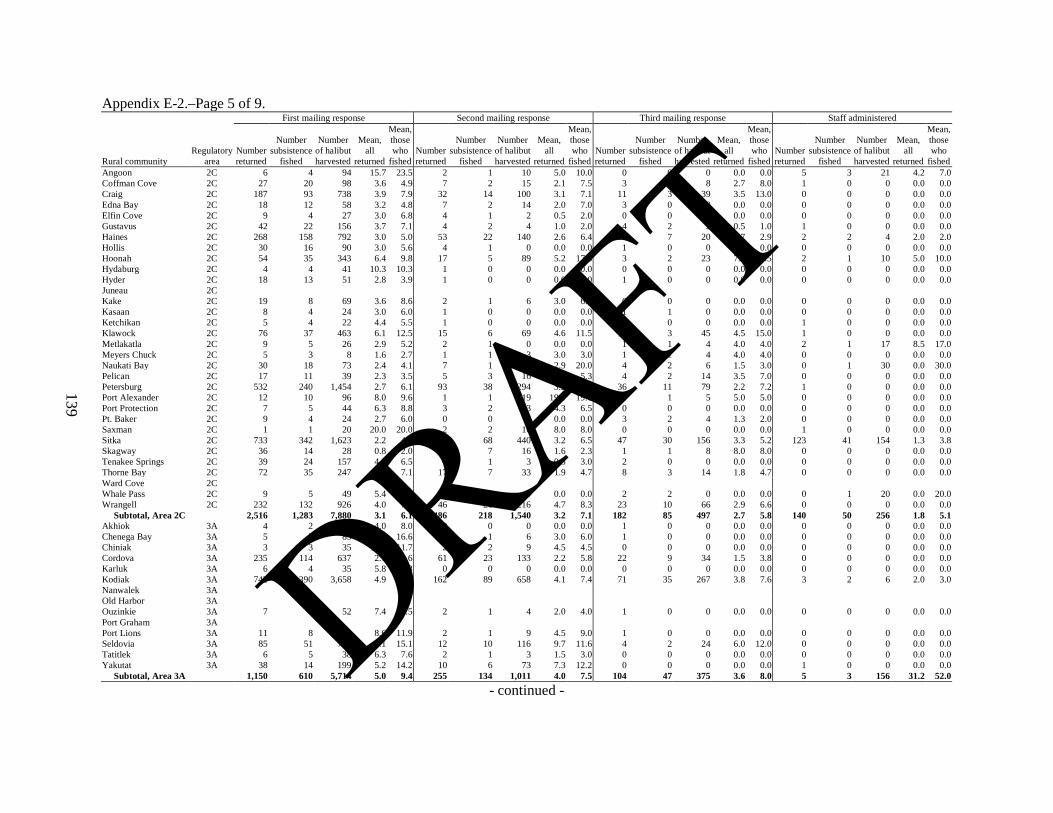
139
Appendix E-2.–Page 5 of 9.
Rural community Regulatory
area
First mailing response Second mailing response Third mailing response Staff administered
Number returned
Number subsistence
fished
Number of halibut harvested
Mean, all
returned
Mean, those who
fished Number returned
Number subsistence
fished
Number of halibut harvested
Mean, all
returned
Mean, those who
fished Number returned
Number subsistence
fished
Number of halibut harvested
Mean, all
returned
Mean, those who
fished Number returned
Number subsistence
fished
Number of halibut harvested
Mean, all
returned
Mean, those who
fished Angoon 2C 6 4 94 15.7 23.5 2 1 10 5.0 10.0 0 0 0 0.0 0.0 5 3 21 4.2 7.0 Coffman Cove 2C 27 20 98 3.6 4.9 7 2 15 2.1 7.5 3 1 8 2.7 8.0 1 0 0 0.0 0.0 Craig 2C 187 93 738 3.9 7.9 32 14 100 3.1 7.1 11 3 39 3.5 13.0 0 0 0 0.0 0.0 Edna Bay 2C 18 12 58 3.2 4.8 7 2 14 2.0 7.0 3 0 0 0.0 0.0 0 0 0 0.0 0.0 Elfin Cove 2C 9 4 27 3.0 6.8 4 1 2 0.5 2.0 0 0 0 0.0 0.0 0 0 0 0.0 0.0 Gustavus 2C 42 22 156 3.7 7.1 4 2 4 1.0 2.0 4 2 2 0.5 1.0 1 0 0 0.0 0.0 Haines 2C 268 158 792 3.0 5.0 53 22 140 2.6 6.4 12 7 20 1.7 2.9 2 2 4 2.0 2.0 Hollis 2C 30 16 90 3.0 5.6 4 1 0 0.0 0.0 1 0 0 0.0 0.0 0 0 0 0.0 0.0 Hoonah 2C 54 35 343 6.4 9.8 17 5 89 5.2 17.8 3 2 23 7.7 11.5 2 1 10 5.0 10.0 Hydaburg 2C 4 4 41 10.3 10.3 1 0 0 0.0 0.0 0 0 0 0.0 0.0 0 0 0 0.0 0.0 Hyder 2C 18 13 51 2.8 3.9 1 0 0 0.0 0.0 1 0 0 0.0 0.0 0 0 0 0.0 0.0 Juneau 2C Kake 2C 19 8 69 3.6 8.6 2 1 6 3.0 6.0 0 0 0 0.0 0.0 0 0 0 0.0 0.0 Kasaan 2C 8 4 24 3.0 6.0 1 0 0 0.0 0.0 1 1 0 0.0 0.0 0 0 0 0.0 0.0 Ketchikan 2C 5 4 22 4.4 5.5 1 0 0 0.0 0.0 0 0 0 0.0 0.0 1 0 0 0.0 0.0 Klawock 2C 76 37 463 6.1 12.5 15 6 69 4.6 11.5 10 3 45 4.5 15.0 1 0 0 0.0 0.0 Metlakatla 2C 9 5 26 2.9 5.2 2 1 0 0.0 0.0 1 1 4 4.0 4.0 2 1 17 8.5 17.0 Meyers Chuck 2C 5 3 8 1.6 2.7 1 1 3 3.0 3.0 1 1 4 4.0 4.0 0 0 0 0.0 0.0 Naukati Bay 2C 30 18 73 2.4 4.1 7 1 20 2.9 20.0 4 2 6 1.5 3.0 0 1 30 0.0 30.0 Pelican 2C 17 11 39 2.3 3.5 5 3 16 3.2 5.3 4 2 14 3.5 7.0 0 0 0 0.0 0.0 Petersburg 2C 532 240 1,454 2.7 6.1 93 38 294 3.2 7.7 36 11 79 2.2 7.2 1 0 0 0.0 0.0 Port Alexander 2C 12 10 96 8.0 9.6 1 1 19 19.0 19.0 1 1 5 5.0 5.0 0 0 0 0.0 0.0 Port Protection 2C 7 5 44 6.3 8.8 3 2 13 4.3 6.5 0 0 0 0.0 0.0 0 0 0 0.0 0.0 Pt. Baker 2C 9 4 24 2.7 6.0 0 0 0 0.0 0.0 3 2 4 1.3 2.0 0 0 0 0.0 0.0 Saxman 2C 1 1 20 20.0 20.0 2 2 16 8.0 8.0 0 0 0 0.0 0.0 1 0 0 0.0 0.0 Sitka 2C 733 342 1,623 2.2 4.7 137 68 440 3.2 6.5 47 30 156 3.3 5.2 123 41 154 1.3 3.8 Skagway 2C 36 14 28 0.8 2.0 10 7 16 1.6 2.3 1 1 8 8.0 8.0 0 0 0 0.0 0.0 Tenakee Springs 2C 39 24 157 4.0 6.5 6 1 3 0.5 3.0 2 0 0 0.0 0.0 0 0 0 0.0 0.0 Thorne Bay 2C 72 35 247 3.4 7.1 17 7 33 1.9 4.7 8 3 14 1.8 4.7 0 0 0 0.0 0.0 Ward Cove 2C Whale Pass 2C 9 5 49 5.4 9.8 3 2 0 0.0 0.0 2 2 0 0.0 0.0 0 1 20 0.0 20.0 Wrangell 2C 232 132 926 4.0 7.0 46 26 216 4.7 8.3 23 10 66 2.9 6.6 0 0 0 0.0 0.0 Subtotal, Area 2C 2,516 1,283 7,880 3.1 6.1 486 218 1,540 3.2 7.1 182 85 497 2.7 5.8 140 50 256 1.8 5.1 Akhiok 3A 4 2 16 4.0 8.0 0 0 0 0.0 0.0 1 0 0 0.0 0.0 0 0 0 0.0 0.0 Chenega Bay 3A 5 5 83 16.6 16.6 2 1 6 3.0 6.0 1 0 0 0.0 0.0 0 0 0 0.0 0.0 Chiniak 3A 3 3 35 11.7 11.7 2 2 9 4.5 4.5 0 0 0 0.0 0.0 0 0 0 0.0 0.0 Cordova 3A 235 114 637 2.7 5.6 61 23 133 2.2 5.8 22 9 34 1.5 3.8 0 0 0 0.0 0.0 Karluk 3A 6 4 35 5.8 8.8 0 0 0 0.0 0.0 0 0 0 0.0 0.0 0 0 0 0.0 0.0 Kodiak 3A 742 390 3,658 4.9 9.4 162 89 658 4.1 7.4 71 35 267 3.8 7.6 3 2 6 2.0 3.0 Nanwalek 3A Old Harbor 3A Ouzinkie 3A 7 8 52 7.4 6.5 2 1 4 2.0 4.0 1 0 0 0.0 0.0 0 0 0 0.0 0.0 Port Graham 3A Port Lions 3A 11 8 95 8.6 11.9 2 1 9 4.5 9.0 1 0 0 0.0 0.0 0 0 0 0.0 0.0 Seldovia 3A 85 51 772 9.1 15.1 12 10 116 9.7 11.6 4 2 24 6.0 12.0 0 0 0 0.0 0.0 Tatitlek 3A 6 5 38 6.3 7.6 2 1 3 1.5 3.0 0 0 0 0.0 0.0 0 0 0 0.0 0.0 Yakutat 3A 38 14 199 5.2 14.2 10 6 73 7.3 12.2 0 0 0 0.0 0.0 1 0 0 0.0 0.0 Subtotal, Area 3A 1,150 610 5,714 5.0 9.4 255 134 1,011 4.0 7.5 104 47 375 3.6 8.0 5 3 156 31.2 52.0
- continued -
DRAFT
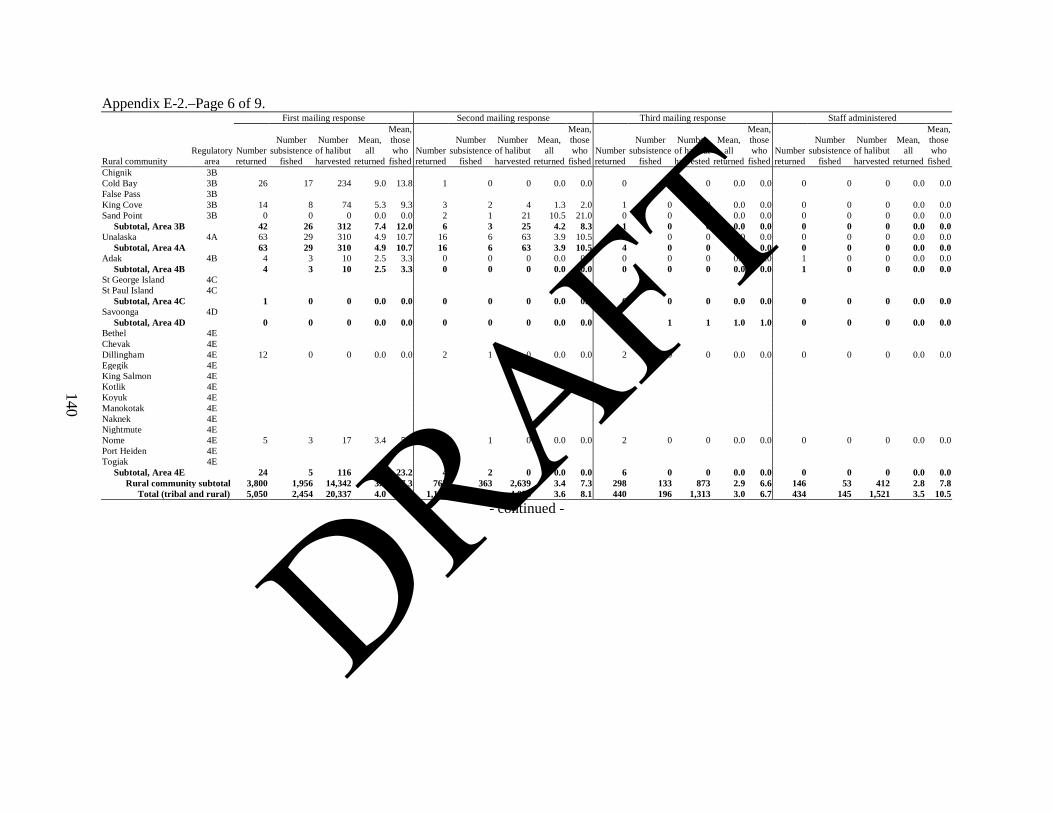
140
Appendix E-2.–Page 6 of 9.
Rural community Regulatory
area
First mailing response Second mailing response Third mailing response Staff administered
Number returned
Number subsistence
fished
Number of halibut harvested
Mean, all
returned
Mean, those who
fished Number returned
Number subsistence
fished
Number of halibut harvested
Mean, all
returned
Mean, those who
fished Number returned
Number subsistence
fished
Number of halibut harvested
Mean, all
returned
Mean, those who
fished Number returned
Number subsistence
fished
Number of halibut harvested
Mean, all
returned
Mean, those who
fished Chignik 3B Cold Bay 3B 26 17 234 9.0 13.8 1 0 0 0.0 0.0 0 0 0 0.0 0.0 0 0 0 0.0 0.0 False Pass 3B King Cove 3B 14 8 74 5.3 9.3 3 2 4 1.3 2.0 1 0 0 0.0 0.0 0 0 0 0.0 0.0 Sand Point 3B 0 0 0 0.0 0.0 2 1 21 10.5 21.0 0 0 0 0.0 0.0 0 0 0 0.0 0.0 Subtotal, Area 3B 42 26 312 7.4 12.0 6 3 25 4.2 8.3 1 0 0 0.0 0.0 0 0 0 0.0 0.0 Unalaska 4A 63 29 310 4.9 10.7 16 6 63 3.9 10.5 4 0 0 0.0 0.0 0 0 0 0.0 0.0 Subtotal, Area 4A 63 29 310 4.9 10.7 16 6 63 3.9 10.5 4 0 0 0.0 0.0 0 0 0 0.0 0.0 Adak 4B 4 3 10 2.5 3.3 0 0 0 0.0 0.0 0 0 0 0.0 0.0 1 0 0 0.0 0.0 Subtotal, Area 4B 4 3 10 2.5 3.3 0 0 0 0.0 0.0 0 0 0 0.0 0.0 1 0 0 0.0 0.0 St George Island 4C St Paul Island 4C Subtotal, Area 4C 1 0 0 0.0 0.0 0 0 0 0.0 0.0 0 0 0 0.0 0.0 0 0 0 0.0 0.0 Savoonga 4D Subtotal, Area 4D 0 0 0 0.0 0.0 0 0 0 0.0 0.0 1 1 1 1.0 1.0 0 0 0 0.0 0.0 Bethel 4E Chevak 4E Dillingham 4E 12 0 0 0.0 0.0 2 1 0 0.0 0.0 2 0 0 0.0 0.0 0 0 0 0.0 0.0 Egegik 4E King Salmon 4E Kotlik 4E Koyuk 4E Manokotak 4E Naknek 4E Nightmute 4E Nome 4E 5 3 17 3.4 5.7 1 1 0 0.0 0.0 2 0 0 0.0 0.0 0 0 0 0.0 0.0 Port Heiden 4E Togiak 4E Subtotal, Area 4E 24 5 116 4.8 23.2 4 2 0 0.0 0.0 6 0 0 0.0 0.0 0 0 0 0.0 0.0 Rural community subtotal 3,800 1,956 14,342 3.8 7.3 767 363 2,639 3.4 7.3 298 133 873 2.9 6.6 146 53 412 2.8 7.8 Total (tribal and rural) 5,050 2,454 20,337 4.0 8.3 1,130 499 4,058 3.6 8.1 440 196 1,313 3.0 6.7 434 145 1,521 3.5 10.5
- continued -
DRAFT
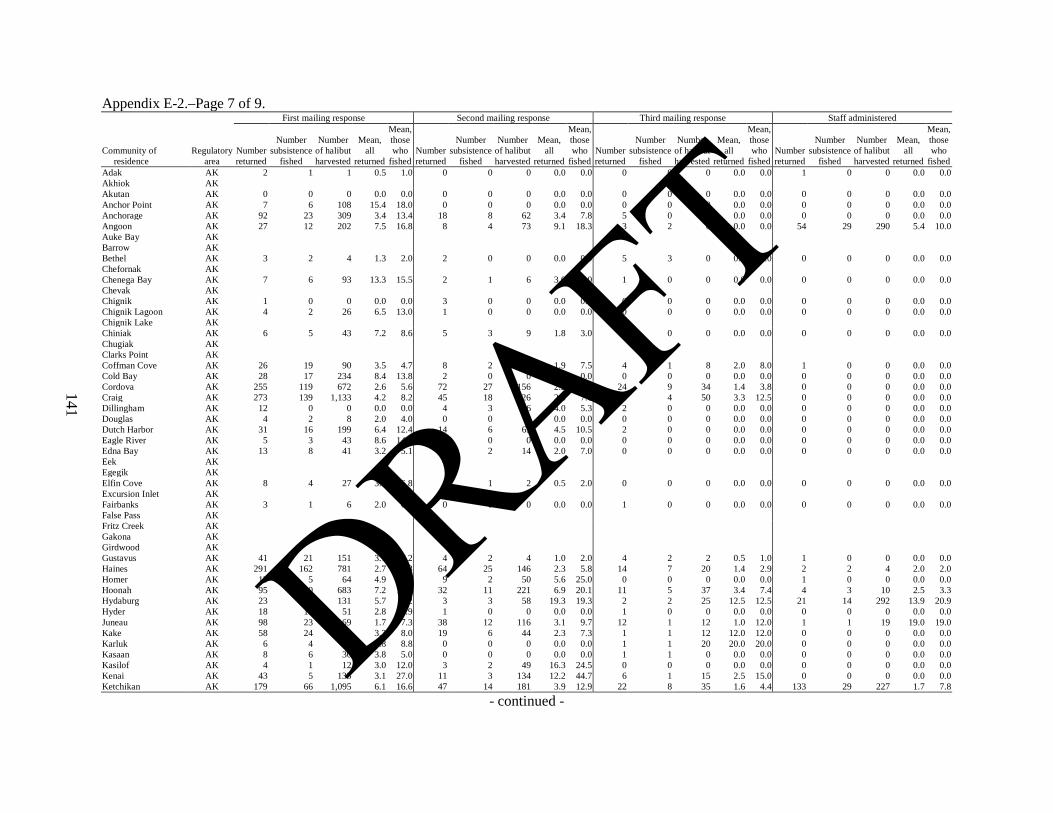
141
Appendix E-2.–Page 7 of 9.
Community of residence
Regulatory area
First mailing response Second mailing response Third mailing response Staff administered
Number returned
Number subsistence
fished
Number of halibut harvested
Mean, all
returned
Mean, those who
fished Number returned
Number subsistence
fished
Number of halibut harvested
Mean, all
returned
Mean, those who
fished Number returned
Number subsistence
fished
Number of halibut harvested
Mean, all
returned
Mean, those who
fished Number returned
Number subsistence
fished
Number of halibut harvested
Mean, all
returned
Mean, those who
fished Adak AK 2 1 1 0.5 1.0 0 0 0 0.0 0.0 0 0 0 0.0 0.0 1 0 0 0.0 0.0 Akhiok AK Akutan AK 0 0 0 0.0 0.0 0 0 0 0.0 0.0 0 0 0 0.0 0.0 0 0 0 0.0 0.0 Anchor Point AK 7 6 108 15.4 18.0 0 0 0 0.0 0.0 0 0 0 0.0 0.0 0 0 0 0.0 0.0 Anchorage AK 92 23 309 3.4 13.4 18 8 62 3.4 7.8 5 0 0 0.0 0.0 0 0 0 0.0 0.0 Angoon AK 27 12 202 7.5 16.8 8 4 73 9.1 18.3 3 2 0 0.0 0.0 54 29 290 5.4 10.0 Auke Bay AK Barrow AK Bethel AK 3 2 4 1.3 2.0 2 0 0 0.0 0.0 5 3 0 0.0 0.0 0 0 0 0.0 0.0 Chefornak AK Chenega Bay AK 7 6 93 13.3 15.5 2 1 6 3.0 6.0 1 0 0 0.0 0.0 0 0 0 0.0 0.0 Chevak AK Chignik AK 1 0 0 0.0 0.0 3 0 0 0.0 0.0 0 0 0 0.0 0.0 0 0 0 0.0 0.0 Chignik Lagoon AK 4 2 26 6.5 13.0 1 0 0 0.0 0.0 0 0 0 0.0 0.0 0 0 0 0.0 0.0 Chignik Lake AK Chiniak AK 6 5 43 7.2 8.6 5 3 9 1.8 3.0 0 0 0 0.0 0.0 0 0 0 0.0 0.0 Chugiak AK Clarks Point AK Coffman Cove AK 26 19 90 3.5 4.7 8 2 15 1.9 7.5 4 1 8 2.0 8.0 1 0 0 0.0 0.0 Cold Bay AK 28 17 234 8.4 13.8 2 0 0 0.0 0.0 0 0 0 0.0 0.0 0 0 0 0.0 0.0 Cordova AK 255 119 672 2.6 5.6 72 27 156 2.2 5.8 24 9 34 1.4 3.8 0 0 0 0.0 0.0 Craig AK 273 139 1,133 4.2 8.2 45 18 126 2.8 7.0 15 4 50 3.3 12.5 0 0 0 0.0 0.0 Dillingham AK 12 0 0 0.0 0.0 4 3 16 4.0 5.3 2 0 0 0.0 0.0 0 0 0 0.0 0.0 Douglas AK 4 2 8 2.0 4.0 0 0 0 0.0 0.0 0 0 0 0.0 0.0 0 0 0 0.0 0.0 Dutch Harbor AK 31 16 199 6.4 12.4 14 6 63 4.5 10.5 2 0 0 0.0 0.0 0 0 0 0.0 0.0 Eagle River AK 5 3 43 8.6 14.3 0 0 0 0.0 0.0 0 0 0 0.0 0.0 0 0 0 0.0 0.0 Edna Bay AK 13 8 41 3.2 5.1 7 2 14 2.0 7.0 0 0 0 0.0 0.0 0 0 0 0.0 0.0 Eek AK Egegik AK Elfin Cove AK 8 4 27 3.4 6.8 4 1 2 0.5 2.0 0 0 0 0.0 0.0 0 0 0 0.0 0.0 Excursion Inlet AK Fairbanks AK 3 1 6 2.0 6.0 0 0 0 0.0 0.0 1 0 0 0.0 0.0 0 0 0 0.0 0.0 False Pass AK Fritz Creek AK Gakona AK Girdwood AK Gustavus AK 41 21 151 3.7 7.2 4 2 4 1.0 2.0 4 2 2 0.5 1.0 1 0 0 0.0 0.0 Haines AK 291 162 781 2.7 4.8 64 25 146 2.3 5.8 14 7 20 1.4 2.9 2 2 4 2.0 2.0 Homer AK 13 5 64 4.9 12.8 9 2 50 5.6 25.0 0 0 0 0.0 0.0 1 0 0 0.0 0.0 Hoonah AK 95 60 683 7.2 11.4 32 11 221 6.9 20.1 11 5 37 3.4 7.4 4 3 10 2.5 3.3 Hydaburg AK 23 16 131 5.7 8.2 3 3 58 19.3 19.3 2 2 25 12.5 12.5 21 14 292 13.9 20.9 Hyder AK 18 13 51 2.8 3.9 1 0 0 0.0 0.0 1 0 0 0.0 0.0 0 0 0 0.0 0.0 Juneau AK 98 23 169 1.7 7.3 38 12 116 3.1 9.7 12 1 12 1.0 12.0 1 1 19 19.0 19.0 Kake AK 58 24 192 3.3 8.0 19 6 44 2.3 7.3 1 1 12 12.0 12.0 0 0 0 0.0 0.0 Karluk AK 6 4 35 5.8 8.8 0 0 0 0.0 0.0 1 1 20 20.0 20.0 0 0 0 0.0 0.0 Kasaan AK 8 6 30 3.8 5.0 0 0 0 0.0 0.0 1 1 0 0.0 0.0 0 0 0 0.0 0.0 Kasilof AK 4 1 12 3.0 12.0 3 2 49 16.3 24.5 0 0 0 0.0 0.0 0 0 0 0.0 0.0 Kenai AK 43 5 135 3.1 27.0 11 3 134 12.2 44.7 6 1 15 2.5 15.0 0 0 0 0.0 0.0 Ketchikan AK 179 66 1,095 6.1 16.6 47 14 181 3.9 12.9 22 8 35 1.6 4.4 133 29 227 1.7 7.8
- continued -
DRAFT

142
Appendix E-2.–Page 8 of 9.
Community of residence
Regulatory area
First mailing response Second mailing response Third mailing response Staff administered
Number returned
Number subsistence
fished
Number of halibut harvested
Mean, all
returned
Mean, those who
fished Number returned
Number subsistence
fished
Number of halibut harvested
Mean, all
returned
Mean, those who
fished Number returned
Number subsistence
fished
Number of halibut harvested
Mean, all
returned
Mean, those who
fished Number returned
Number subsistence
fished
Number of halibut harvested
Mean, all
returned
Mean, those who
fished King Cove AK 32 16 198 6.2 12.4 6 3 9 1.5 3.0 6 1 8 1.3 8.0 0 0 0 0.0 0.0 King Salmon AK Kipnuk AK Klawock AK 94 44 558 5.9 12.7 24 8 77 3.2 9.6 16 7 70 4.4 10.0 2 0 0 0.0 0.0 Klukwan AK Kodiak AK 808 423 3,981 4.9 9.4 173 93 690 4.0 7.4 75 39 315 4.2 8.1 3 3 11 3.7 3.7 Kongiganak AK Kotzebue AK Koyuk AK Kwigillingok AK Larsen Bay AK 6 6 53 8.8 8.8 4 1 14 3.5 14.0 0 0 0 0.0 0.0 0 0 0 0.0 0.0 Manokotak AK Mekoryuk AK Metlakatla AK 47 13 55 1.2 4.2 10 6 13 1.3 2.2 1 2 8 8.0 4.0 44 6 56 1.3 9.3 Meyers Chuck AK 4 3 8 2.0 2.7 1 1 3 3.0 3.0 1 1 4 4.0 4.0 0 0 0 0.0 0.0 Naknek AK 2 0 0 0.0 0.0 0 0 0 0.0 0.0 0 0 0 0.0 0.0 0 0 0 0.0 0.0 Nanwalek AK 21 21 309 14.7 14.7 2 2 27 13.5 13.5 8 7 138 17.3 19.7 3 3 350 116.7 116.7 Naukati AK 14 8 43 3.1 5.4 4 0 0 0.0 0.0 1 1 4 4.0 4.0 0 1 30 0.0 30.0 Nelson Lagoon AK Nightmute AK Nikiski AK 3 1 20 6.7 20.0 0 0 0 0.0 0.0 0 0 0 0.0 0.0 0 0 0 0.0 0.0 Ninilchik AK 10 1 32 3.2 32.0 2 0 0 0.0 0.0 2 0 0 0.0 0.0 0 0 0 0.0 0.0 Nome AK 7 4 23 3.3 5.8 1 1 0 0.0 0.0 2 0 0 0.0 0.0 0 0 0 0.0 0.0 North Pole AK Old Harbor AK 18 14 127 7.1 9.1 3 2 5 1.7 2.5 2 0 0 0.0 0.0 0 0 0 0.0 0.0 Ouzinkie AK 15 12 91 6.1 7.6 6 3 15 2.5 5.0 2 0 0 0.0 0.0 0 0 0 0.0 0.0 Palmer AK 4 1 1 0.3 1.0 1 0 0 0.0 0.0 1 0 0 0.0 0.0 0 0 0 0.0 0.0 Pelican AK 21 14 57 2.7 4.1 5 4 22 4.4 5.5 7 5 33 4.7 6.6 0 0 0 0.0 0.0 Perryville AK 11 6 47 4.3 7.8 1 1 16 16.0 16.0 1 1 2 2.0 2.0 0 0 0 0.0 0.0 Petersburg AK 560 253 1,598 2.9 6.3 110 40 303 2.8 7.6 40 12 84 2.1 7.0 1 0 0 0.0 0.0 Point Baker AK 12 7 38 3.2 5.4 2 2 13 6.5 6.5 3 2 4 1.3 2.0 0 0 0 0.0 0.0 Port Alexander AK 12 10 96 8.0 9.6 1 1 19 19.0 19.0 1 1 5 5.0 5.0 0 0 0 0.0 0.0 Port Graham AK 14 8 136 9.7 17.0 4 2 7 1.8 3.5 1 2 1 1.0 0.5 2 0 0 0.0 0.0 Port Heiden AK Port Lions AK 22 17 149 6.8 8.8 2 1 9 4.5 9.0 4 0 0 0.0 0.0 0 0 0 0.0 0.0 Port William AK Quinhagak AK 0 0 0 0.0 0.0 0 0 0 0.0 0.0 1 0 0 0.0 0.0 0 0 0 0.0 0.0 Sand Point AK 37 16 76 2.1 4.8 19 10 90 4.7 9.0 3 1 5 1.7 5.0 1 1 5 5.0 5.0 Savoonga AK 2 2 15 7.5 7.5 1 0 0 0.0 0.0 2 2 3 1.5 1.5 0 0 0 0.0 0.0 Saxman AK 2 1 8 4.0 8.0 2 2 17 8.5 8.5 0 0 0 0.0 0.0 1 1 4 4.0 4.0 Seldovia AK 87 52 799 9.2 15.4 15 14 159 10.6 11.4 8 6 32 4.0 5.3 0 0 0 0.0 0.0 Seward AK 3 0 0 0.0 0.0 4 1 4 1.0 4.0 0 0 0 0.0 0.0 0 0 0 0.0 0.0 Sitka AK 807 379 1,804 2.2 4.8 166 80 491 3.0 6.1 55 34 183 3.3 5.4 153 51 203 1.3 4.0 Skagway AK 40 16 45 1.1 2.8 11 7 16 1.5 2.3 1 1 8 8.0 8.0 0 0 0 0.0 0.0 Soldotna AK 28 11 475 17.0 43.2 7 2 72 10.3 36.0 3 0 0 0.0 0.0 0 0 0 0.0 0.0 St George Island AK St Paul Island AK 2 2 11 5.5 5.5 0 0 0 0.0 0.0 1 1 21 21.0 21.0 0 0 0 0.0 0.0 Sterling AK Tatitlek AK 12 6 86 7.2 14.3 2 2 9 4.5 4.5 2 1 3 1.5 3.0 1 0 0 0.0 0.0
- continued -
DRAFT
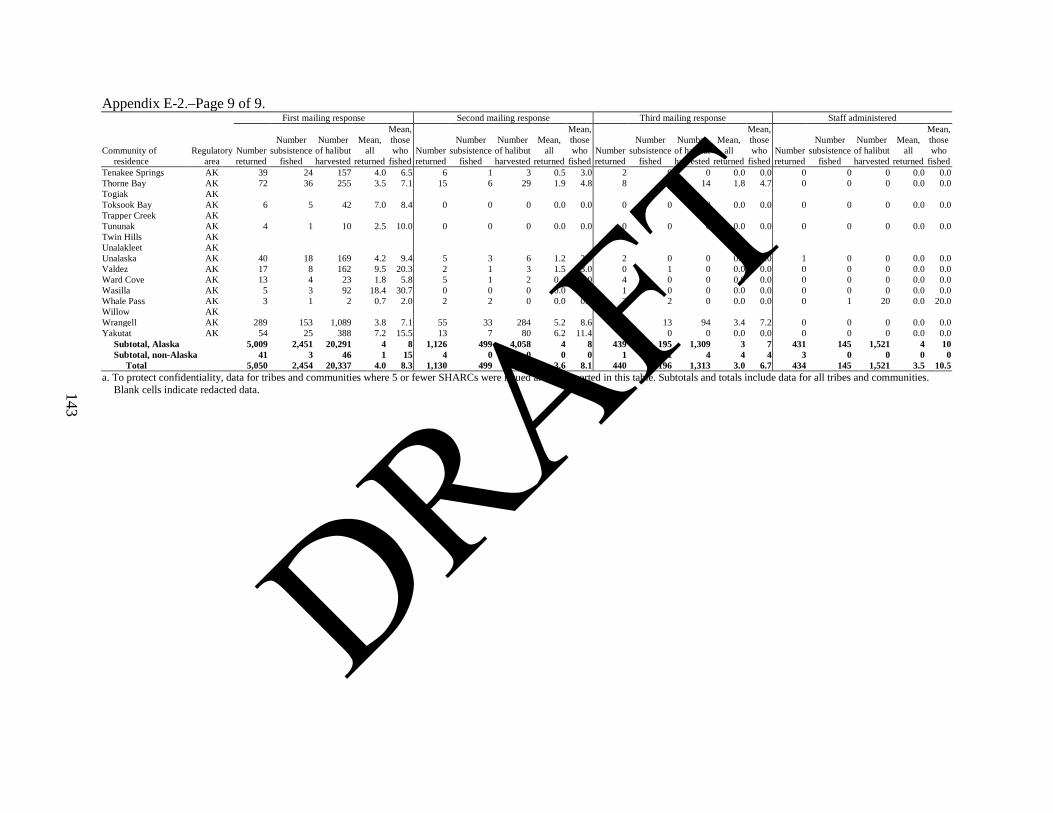
143
Appendix E-2.–Page 9 of 9.
Community of residence
Regulatory area
First mailing response Second mailing response Third mailing response Staff administered
Number returned
Number subsistence
fished
Number of halibut harvested
Mean, all
returned
Mean, those who
fished Number returned
Number subsistence
fished
Number of halibut harvested
Mean, all
returned
Mean, those who
fished Number returned
Number subsistence
fished
Number of halibut harvested
Mean, all
returned
Mean, those who
fished Number returned
Number subsistence
fished
Number of halibut harvested
Mean, all
returned
Mean, those who
fished Tenakee Springs AK 39 24 157 4.0 6.5 6 1 3 0.5 3.0 2 0 0 0.0 0.0 0 0 0 0.0 0.0 Thorne Bay AK 72 36 255 3.5 7.1 15 6 29 1.9 4.8 8 3 14 1.8 4.7 0 0 0 0.0 0.0 Togiak AK Toksook Bay AK 6 5 42 7.0 8.4 0 0 0 0.0 0.0 0 0 0 0.0 0.0 0 0 0 0.0 0.0 Trapper Creek AK Tununak AK 4 1 10 2.5 10.0 0 0 0 0.0 0.0 0 0 0 0.0 0.0 0 0 0 0.0 0.0 Twin Hills AK Unalakleet AK Unalaska AK 40 18 169 4.2 9.4 5 3 6 1.2 2.0 2 0 0 0.0 0.0 1 0 0 0.0 0.0 Valdez AK 17 8 162 9.5 20.3 2 1 3 1.5 3.0 0 1 0 0.0 0.0 0 0 0 0.0 0.0 Ward Cove AK 13 4 23 1.8 5.8 5 1 2 0.4 2.0 4 0 0 0.0 0.0 0 0 0 0.0 0.0 Wasilla AK 5 3 92 18.4 30.7 0 0 0 0.0 0.0 1 0 0 0.0 0.0 0 0 0 0.0 0.0 Whale Pass AK 3 1 2 0.7 2.0 2 2 0 0.0 0.0 2 2 0 0.0 0.0 0 1 20 0.0 20.0 Willow AK Wrangell AK 289 153 1,089 3.8 7.1 55 33 284 5.2 8.6 28 13 94 3.4 7.2 0 0 0 0.0 0.0 Yakutat AK 54 25 388 7.2 15.5 13 7 80 6.2 11.4 0 0 0 0.0 0.0 0 0 0 0.0 0.0 Subtotal, Alaska 5,009 2,451 20,291 4 8 1,126 499 4,058 4 8 439 195 1,309 3 7 431 145 1,521 4 10 Subtotal, non-Alaska 41 3 46 1 15 4 0 0 0 0 1 1 4 4 4 3 0 0 0 0 Total 5,050 2,454 20,337 4.0 8.3 1,130 499 4,058 3.6 8.1 440 196 1,313 3.0 6.7 434 145 1,521 3.5 10.5 a. To protect confidentiality, data for tribes and communities where 5 or fewer SHARCs were issued are not reported in this table. Subtotals and totals include data for all tribes and communities.
Blank cells indicate redacted data.
DRAFT

144
Appendix E-3.–Estimated subsistence harvests of halibut by gear type, 2012.
Tribal name Regulatory
area
Number of SHARCs issueda
Set hook gear Hook and line or handline All gear Estimated number
respondents fished
Estimated number halibut
harvested
Estimated pounds halibut
harvested
Estimated number
respondents fished
Estimated number halibut
harvested
Estimated pounds halibut
harvested
Estimated number
respondents fished
Estimated number halibut
harvested
Confidence interval for number of
halibut
Estimated pounds halibut
harvested
Confidence interval for pounds of
halibut Angoon Community Association
2C 74 33 415 7,732 10 66 1,268 36 481 6.2% 9,000 6.3%
Aukquan Traditional Council 2C 1 Central Council Tlingit and Haida Indian Tribes
2C 485 121 1,095 25,793 50 428 6,047 147 1,523 25.7% 31,840 29.5%
Chilkat Indian Village 2C 12 1 0 0 0 0 0 1 0 0.0% 0 0.0% Chilkoot Indian Association 2C 50 18 50 1,111 1 3 43 18 52 32.4% 1,154 34.0% Craig Community Association 2C 59 22 242 5,639 14 35 887 27 277 48.5% 6,526 48.8% Douglas Indian Association 2C 11 0 0 0 2 4 133 2 4 349.1% 133 349.1% Hoonah Indian Association 2C 110 47 585 7,094 24 115 1,372 53 700 34.1% 8,466 26.1% Hydaburg Cooperative Association
2C 108 63 916 24,026 20 64 2,095 65 980 75.5% 26,122 39.6%
Ketchikan Indian Corporation 2C 454 89 1,159 21,152 46 568 9,331 115 1,727 21.9% 30,483 19.4% Klawock Cooperative Association
2C 63 16 143 4,389 3 19 720 19 162 39.6% 5,109 48.3%
Metlakatla Indian Community, Annette Island Reserve
2C 119 20 96 2,226 8 44 563 26 140 24.8% 2,789 26.0%
Organized Village of Kake 2C 72 22 187 5,970 6 24 626 24 211 24.1% 6,597 28.3% Organized Village of Kasaan 2C 5 Organized Village of Saxman 2C 30 16 205 3,154 9 66 1,164 20 271 43.9% 4,318 38.2% Petersburg Indian Association 2C 68 19 151 2,207 8 29 696 24 179 36.4% 2,903 26.5% Sitka Tribe of Alaska 2C 264 92 545 13,605 24 42 816 98 587 24.9% 14,421 24.1% Skagway Village 2C 3 Wrangell Cooperative Association
2C 82 27 242 6,869 11 41 875 32 283 16.9% 7,744 21.8%
Subtotal, Area 2C 2,070 608 6,042 131,305 237 1,550 26,658 710 7,592 10.1% 157,963 8.7% Kenaitze Indian Tribe 3A 132 12 246 1,793 16 326 7,031 23 572 48.0% 8,823 78.0% Lesnoi Village (Woody Island) 3A 34 4 49 851 3 1 33 5 50 102.0% 884 100.8% Native Village of Afognak 3A 20 8 63 1,137 4 14 309 10 77 65.0% 1,446 54.2% Native Village of Akhiok 3A 7 1 20 448 3 23 356 3 43 184.9% 804 194.3% Native Village of Chenega 3A 18 5 49 1,145 3 0 0 5 49 99.3% 1,145 106.0% Native Village of Eyak 3A 71 20 88 1,549 6 14 230 20 102 44.7% 1,779 44.6% Native Village of Karluk 3A 4 Native Village of Larsen Bay 3A 31 8 56 2,940 17 124 1,379 17 180 55.4% 4,319 91.4% Native Village of Nanwalek 3A 71 12 353 5,184 24 216 2,092 29 569 0.0% 7,275 0.0% Native Village of Ouzinkie 3A 28 11 81 1,628 6 33 336 13 114 50.2% 1,964 46.5% Native Village of Port Graham 3A 34 11 262 6,196 14 242 3,230 20 504 53.2% 9,427 62.5% Native Village of Port Lions 3A 28 16 88 2,311 3 7 125 16 94 37.1% 2,437 36.8% Native Village of Tatitlek 3A 25 9 106 2,375 0 0 0 9 106 72.2% 2,375 75.2% Ninilchik Village 3A 73 7 188 2,389 14 679 2,866 19 866 48.9% 5,255 47.4% Seldovia Village Tribe 3A 58 26 316 4,873 23 182 1,866 35 497 24.3% 6,739 23.1% Sun'aq Tribe of Kodiak (formerly Shoonaq')
3A 112 55 503 11,484 20 64 1,274 62 567 25.5% 12,758 21.0%
Village of Kanatak 3A 19 0 0 0 0 0 0 0 0 0.0% 0 0.0% Village of Old Harbor 3A 43 13 126 1,125 13 38 653 21 163 94.5% 1,778 53.4% Village of Salamatoff 3A 25 1 0 0 7 184 1,799 7 184 46.6% 1,799 43.3% Yakutat Tlingit Tribe 3A 43 27 414 10,827 6 14 227 29 428 65.2% 11,054 61.7%
Subtotal, Area 3A 876 248 3,007 58,254 186 2,206 24,387 348 5,213 14.8% 82,641 16.8% Agdaagux Tribe of King Cove 3B 53 10 111 1,734 11 77 923 15 188 56.1% 2,657 52.1%
- continued -
DRAFT

145
Appendix E-3.–Page 2 of 6.
Tribal name Regulatory
area
Number of SHARCs issueda
Set hook gear Hook and line or handline All gear Estimated number
respondents fished
Estimated number halibut
harvested
Estimated pounds halibut
harvested
Estimated number
respondents fished
Estimated number halibut
harvested
Estimated pounds halibut
harvested
Estimated number
respondents fished
Estimated number halibut
harvested
Confidence interval for number of
halibut
Estimated pounds halibut
harvested
Confidence interval for pounds of
halibut Chignik Lake Village 3B 11 0 0 0 0 0 0 0 0 0.0% 0 0.0% Ivanoff Bay Village 3B 4 Native Village of Belkofski 3B 5 Native Village of Chignik 3B 4 Native Village of Chignik Lagoon
3B 16 7 26 390 7 37 449 10 63 73.4% 839 77.7%
Native Village of False Pass 3B 1 Native Village of Nelson Lagoon
3B 3
Native Village of Perryville 3B 18 12 95 1,537 6 24 652 15 120 27.4% 2,188 26.4% Native Village of Unga 3B 1 Pauloff Harbor Village 3B 79 21 145 2,500 31 86 1,369 38 231 74.9% 3,869 68.9% Qagan Toyagungin Tribe of Sand Point Village
3B 82 11 101 1,588 17 78 1,193 26 179 38.8% 2,780 47.0%
Subtotal, Area 3B 277 62 486 7,853 75 309 4,663 105 795 24.5% 12,515 23.8% Native Village of Akutan 4A 11 0 0 0 0 0 0 0 0 0.0% 0 0.0% Qawalingin Tribe of Unalaska 4A 27 9 31 260 7 0 0 11 31 140.6% 260 127.2%
Subtotal, Area 4A 38 9 31 260 7 0 0 11 31 142.7% 260 129.7% Native Village of Atka 4B 4
Subtotal, Area 4B 4 Pribilof Islands Aleut Community of St. George
4C 5
Pribilof Islands Aleut Community of St. Paul
4C 15 9 131 1,519 5 19 490 14 149 202.5% 2,009 110.6%
Subtotal, Area 4C 20 9 131 1,519 19 19 490 14 149 174.0% 2,009 127.6% Native Village of Diomede (Inalik)
4D 1
Native Village of Savoonga 4D 5 Subtotal, Area 4D 6 5 27 777 0 0 0 5 27 42.9% 777 53.0%
Chevak Native Village (Kashunamiut)
4E 1
Egegik Village 4E 4 King Island Native Community 4E 2 Manokotak Village 4E 1 Naknek Native Village 4E 8 0 0 0 0 0 0 0 0 0.0% 0 0.0% Native Village of Aleknagik 4E 4 Native Village of Brevig Mission
4E 1
Native Village of Council 4E 4 Native Village of Dillingham (Curyung)
4E 12 3 14 259 3 11 256 3 24 155.1% 516 154.2%
Native Village of Eek 4E 7 2 0 0 5 21 698 5 21 75.0% 698 112.0% Native Village of Hooper Bay 4E 2 Native Village of Kipnuk 4E 5 Native Village of Kongiganak 4E 3 Native Village of Koyuk 4E 1 Native Village of Kwigillingok 4E 1 Native Village of Kwinhagak 4E 6 0 0 0 0 0 0 0 0 0.0% 0 0.0% Native Village of Mekoryuk 4E 4
- continued -
DRAFT

146
Appendix E-3.–Page 3 of 6.
Tribal name Regulatory
area
Number of SHARCs issueda
Set hook gear Hook and line or handline All gear Estimated number
respondents fished
Estimated number halibut
harvested
Estimated pounds halibut
harvested
Estimated number
respondents fished
Estimated number halibut
harvested
Estimated pounds halibut
harvested
Estimated number
respondents fished
Estimated number halibut
harvested
Confidence interval for number of
halibut
Estimated pounds halibut
harvested
Confidence interval for pounds of
halibut Native Village of Scammon Bay
4E 3
Native Village of Shaktoolik 4E 1 Native Village of Toksook Bay (Nunakauyak)
4E 9 1 20 140 4 22 154 5 42 44.2% 294 44.2%
Native Village of Tununak 4E 12 0 0 0 3 28 173 3 28 253.9% 173 253.9% Native Village of Unalakleet 4E 1 Native Village of Wales 4E 1 Newtok Village 4E 1 Nome Eskimo Community 4E 12 5 34 910 0 0 0 5 34 218.3% 910 182.2% Orutsararmuit Native Village 4E 13 1 0 0 4 0 0 5 0 0.0% 0 0.0% Platinum Traditional Village 4E 1 South Naknek Village 4E 2 Traditional Village of Togiak 4E 2 Ugashik Village 4E 2 Village of Chefornak 4E 4 Village of Clark's Point 4E 3 Village of Kotlik 4E 1
Subtotal, Area 4E 134 17 100 1,673 28 160 2,111 37 259 44.0% 3,785 39.4% Tribal subtotal 3,425 960 9,827 201,697 539 4,252 58,421 1,232 14,079 8.0% 260,118 7.7%
- continued -
DRAFT

147
Appendix E-3.–Page 4 of 6.
Rural community Regulatory
area
Number of SHARCs issueda
Set hook gear Hook and line or handline All gear Estimated number
respondents fished
Estimated number halibut
harvested
Estimated pounds halibut
harvested
Estimated number
respondents fished
Estimated number halibut
harvested
Estimated pounds halibut
harvested
Estimated number
respondents fished
Estimated number halibut
harvested
Confidence interval for number of
halibut
Estimated pounds halibut
harvested
Confidence interval for pounds of
halibut Angoon 2C 14 7 49 925 5 86 1,503 9 135 22.0% 2,429 21.3% Coffman Cove 2C 50 23 88 1,787 18 66 927 29 154 22.3% 2,715 19.5% Craig 2C 303 117 854 16,319 44 260 3,543 141 1,114 10.5% 19,862 10.6% Edna Bay 2C 34 15 79 2,083 5 6 314 17 85 29.3% 2,397 22.5% Elfin Cove 2C 18 7 34 792 3 7 263 7 41 63.0% 1,055 68.6% Gustavus 2C 64 25 135 2,635 16 66 1,642 32 202 25.0% 4,277 24.9% Haines 2C 407 219 1,093 21,408 56 66 1,215 226 1,158 7.6% 22,623 8.3% Hollis 2C 48 20 104 3,509 7 17 784 23 121 30.1% 4,293 40.6% Hoonah 2C 93 43 367 4,117 25 202 2,326 52 568 15.0% 6,443 13.8% Hydaburg 2C 8 6 55 1,986 3 3 98 6 57 94.0% 2,084 90.5% Hyder 2C 22 14 51 1,036 7 6 79 14 56 31.3% 1,115 22.6% Juneau 2C 5
Kake 2C 33 12 91 1,959 6 25 806 14 116 39.7% 2,765 40.0% Kasaan 2C 10 4 22 396 2 2 70 5 24 0.0% 466 0.0% Ketchikan 2C 8 5 16 301 5 9 216 5 25 43.1% 517 41.2% Klawock 2C 141 39 373 7,767 30 362 4,446 60 735 19.4% 12,213 18.0% Metlakatla 2C 20 9 50 1,035 3 7 57 10 57 57.5% 1,092 56.7% Meyers Chuck 2C 9 5 14 294 1 1 28 5 15 46.4% 322 46.0% Naukati Bay 2C 48 24 102 2,472 13 48 525 26 150 22.0% 2,997 16.6% Pelican 2C 35 18 59 1,248 12 30 520 21 89 31.3% 1,768 26.8% Petersburg 2C 843 297 1,665 32,358 164 589 9,934 357 2,255 6.8% 42,292 7.4% Port Alexander 2C 16 13 129 2,429 0 0 0 13 129 24.1% 2,429 23.9% Port Protection 2C 11 7 50 872 3 15 223 8 65 29.5% 1,095 29.4% Pt. Baker 2C 16 6 34 560 3 1 25 8 35 82.7% 585 86.3% Saxman 2C 8 3 13 114 3 33 569 4 45 168.2% 683 157.5% Sitka 2C 1,330 561 2,496 57,443 149 444 6,708 596 2,940 6.3% 64,152 6.3% Skagway 2C 51 21 39 1,314 9 17 217 23 56 16.0% 1,531 14.6% Tenakee Springs 2C 58 28 151 2,751 14 47 548 31 198 17.1% 3,298 17.5% Thorne Bay 2C 118 48 274 7,427 20 65 1,315 53 339 15.8% 8,743 14.8% Ward Cove 2C 2
Whale Pass 2C 17 8 62 2,532 10 17 681 11 79 49.6% 3,213 56.5% Wrangell 2C 382 180 1,167 21,961 73 365 6,122 210 1,533 9.4% 28,083 8.6%
Subtotal, Area 2C
4,222 1,784 9,716 201,928 707 2,860 45,706 2,016 12,576 3.0% 247,633 3.1% Akhiok 3A 6 1 1 42 1 18 151 2 19 104.7% 193 85.9% Chenega Bay 3A 8 4 57 791 5 32 434 6 89 0.0% 1,225 0.0% Chiniak 3A 7 7 62 519 3 0 0 7 62 63.4% 519 37.2% Cordova 3A 416 170 847 14,838 72 186 3,171 188 1,032 10.6% 18,008 10.7% Karluk 3A 6 0 0 0 4 35 497 4 35 0.0% 497 0.0% Kodiak 3A 1,360 559 4,257 79,575 319 1,831 30,786 696 6,088 5.9% 110,362 6.4% Nanwalek 3A 5
Old Harbor 3A 5
Ouzinkie 3A 16 3 15 238 12 69 657 14 84 33.4% 896 24.7%
Port Graham 3A 5
Port Lions 3A 17 7 45 755 3 75 687 10 120 30.7% 1,442 31.9%
Seldovia 3A 126 59 682 9,532 40 426 4,827 77 1,108 15.2% 14,360 15.1% Tatitlek 3A 11 7 56 1,261 1 0 0 8 56 56.4% 1,261 42.1% Yakutat 3A 72 21 287 6,547 10 96 1,641 28 382 32.1% 8,188 45.7% Chignik 3B 1
Subtotal, Area 3B
2,060 843 6,538 118,789 477 2,856 43,858 1,050 9,395 4.8% 162,647 5.1%
- continued -
DRAFT
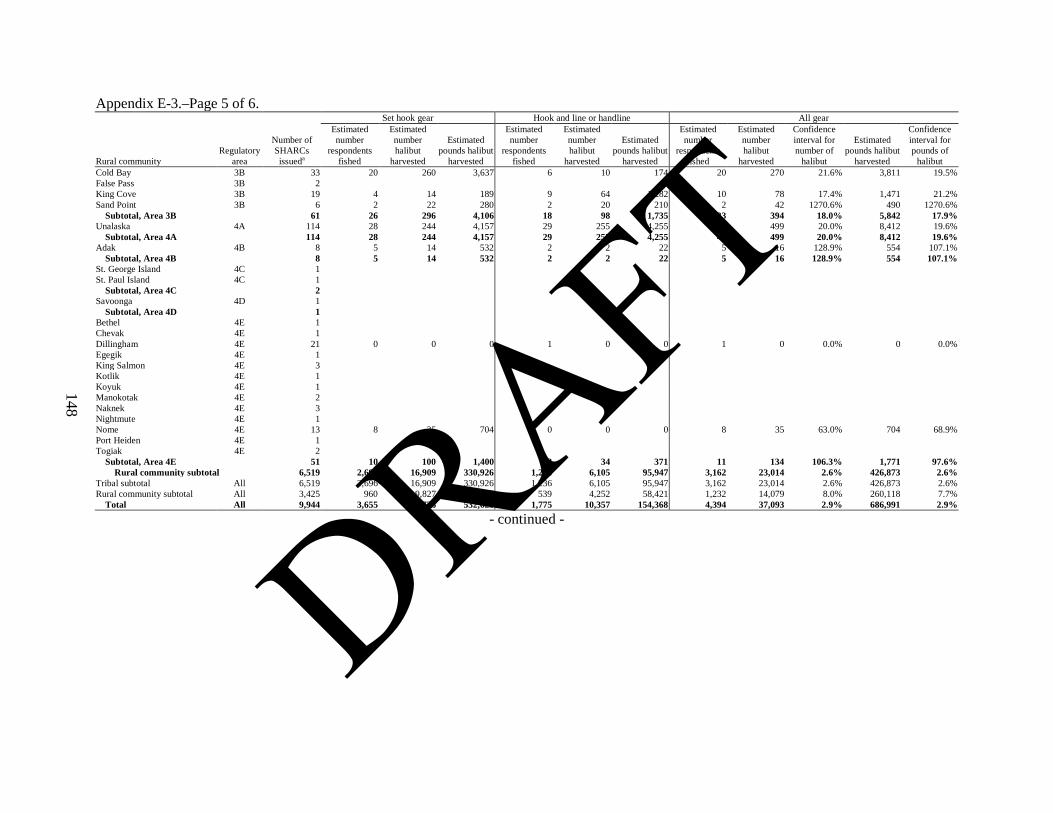
148
Appendix E-3.–Page 5 of 6.
Rural community Regulatory
area
Number of SHARCs issueda
Set hook gear Hook and line or handline All gear Estimated number
respondents fished
Estimated number halibut
harvested
Estimated pounds halibut
harvested
Estimated number
respondents fished
Estimated number halibut
harvested
Estimated pounds halibut
harvested
Estimated number
respondents fished
Estimated number halibut
harvested
Confidence interval for number of
halibut
Estimated pounds halibut
harvested
Confidence interval for pounds of
halibut Cold Bay 3B 33 20 260 3,637 6 10 174 20 270 21.6% 3,811 19.5% False Pass 3B 2
King Cove 3B 19 4 14 189 9 64 1,282 10 78 17.4% 1,471 21.2% Sand Point 3B 6 2 22 280 2 20 210 2 42 1270.6% 490 1270.6%
Subtotal, Area 3B
61 26 296 4,106 18 98 1,735 33 394 18.0% 5,842 17.9% Unalaska 4A 114 28 244 4,157 29 255 4,255 46 499 20.0% 8,412 19.6%
Subtotal, Area 4A
114 28 244 4,157 29 255 4,255 46 499 20.0% 8,412 19.6% Adak 4B 8 5 14 532 2 2 22 5 16 128.9% 554 107.1%
Subtotal, Area 4B
8 5 14 532 2 2 22 5 16 128.9% 554 107.1% St. George Island 4C 1
St. Paul Island 4C 1
Subtotal, Area 4C
2
Savoonga 4D 1
Subtotal, Area 4D
1
Bethel 4E 1
Chevak 4E 1
Dillingham 4E 21 0 0 0 1 0 0 1 0 0.0% 0 0.0% Egegik 4E 1
King Salmon 4E 3
Kotlik 4E 1
Koyuk 4E 1
Manokotak 4E 2
Naknek 4E 3
Nightmute 4E 1
Nome 4E 13 8 35 704 0 0 0 8 35 63.0% 704 68.9% Port Heiden 4E 1
Togiak 4E 2
Subtotal, Area 4E
51 10 100 1,400 3 34 371 11 134 106.3% 1,771 97.6%
Rural community subtotal 6,519 2,696 16,909 330,926 1,236 6,105 95,947 3,162 23,014 2.6% 426,873 2.6% Tribal subtotal All 6,519 2,696 16,909 330,926 1,236 6,105 95,947 3,162 23,014 2.6% 426,873 2.6% Rural community subtotal All 3,425 960 9,827 201,697 539 4,252 58,421 1,232 14,079 8.0% 260,118 7.7%
Total All 9,944 3,655 26,736 532,623 1,775 10,357 154,368 4,394 37,093 2.9% 686,991 2.9%
- continued -
DRAFT

149
Appendix E-3.–Page 6 of 6.
Regulatory
area
Number of SHARCs issueda
Set hook gear Hook and line or handline All gear Estimated number
respondents fished
Estimated number halibut
harvested
Estimated pounds halibut
harvested
Estimated number
respondents fished
Estimated number halibut
harvested
Estimated pounds halibut
harvested
Estimated number
respondents fished
Estimated number halibut
harvested
Confidence interval for number of
halibut
Estimated pounds halibut
harvested
Confidence interval for pounds of
halibut 2C 6,292 2,392 15,758 333,232 944 4,411 72,364 2,726 20,168 3.6% 405,596 3.3% 3A 2,936 1,091 9,545 177,043 663 5,063 68,245 1,398 14,608 5.1% 245,288 5.6% 3B 338 87 782 11,959 92 407 6,398 137 1,189 19.5% 18,357 19.0% 4A 152 37 275 4,416 36 255 4,255 58 530 24.9% 8,671 25.1% 4B 12 7 18 588 4 10 134 7 28 84.5% 722 83.7% 4C 22 9 131 1,519 5 19 490 14 149 139.5% 2,009 109.6% 4D 7 6 28 791 0 0 0 6 28 36.8% 791 45.6% 4E 185 27 199 3,073 32 194 2,482 48 393 55.4% 5,556 48.3% Total
9,944 3,655 26,736 532,623 1,775 10,357 154,368 4,394 37,093 2.9% 686,991 2.9%
a. To protect confidentiality, data for tribes and communities with 5 or fewer SHARCs issued are not reported in this table. Subtotals include all tribes and communities. Blank cells indicate redacted data.
DRAFT
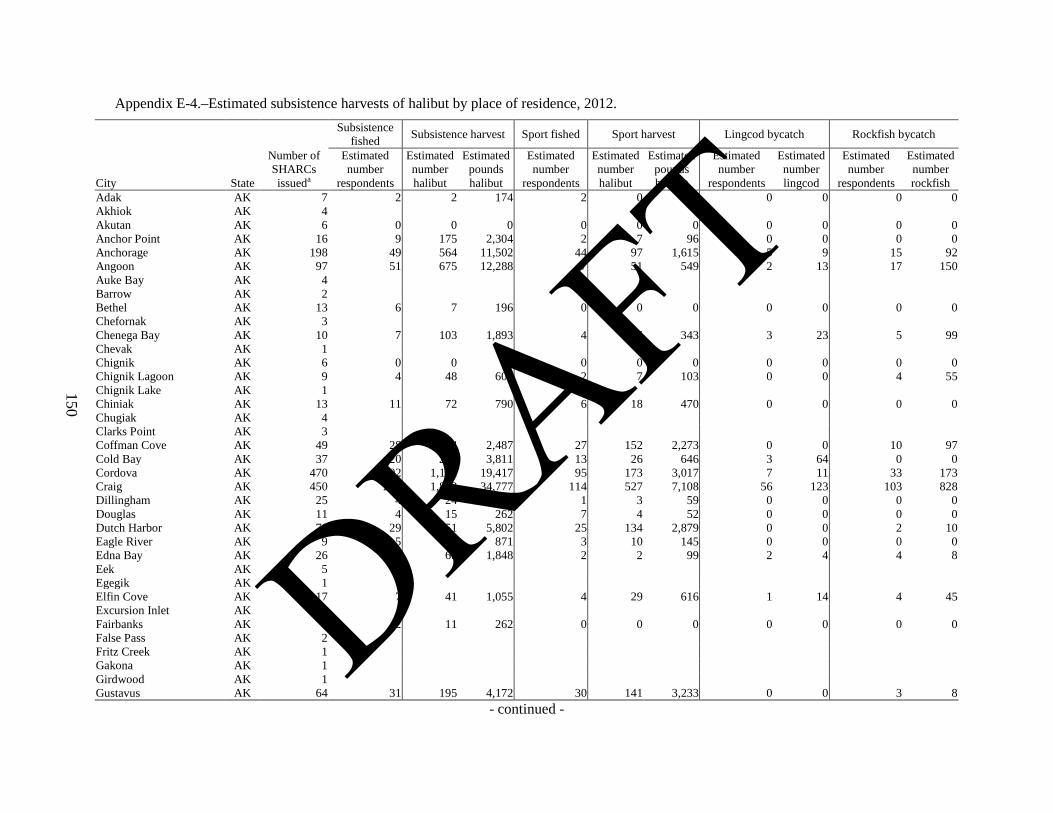
150
Appendix E-4.–Estimated subsistence harvests of halibut by place of residence, 2012.
City State
Number of SHARCs issueda
Subsistence fished Subsistence harvest Sport fished Sport harvest Lingcod bycatch Rockfish bycatch
Estimated number
respondents
Estimated number halibut
Estimated pounds halibut
Estimated number
respondents
Estimated number halibut
Estimated pounds halibut
Estimated number
respondents
Estimated number lingcod
Estimated number
respondents
Estimated number rockfish
Adak AK 7 2 2 174 2 0 0 0 0 0 0 Akhiok AK 4
Akutan AK 6 0 0 0 0 0 0 0 0 0 0 Anchor Point AK 16 9 175 2,304 2 7 96 0 0 0 0 Anchorage AK 198 49 564 11,502 44 97 1,615 5 9 15 92 Angoon AK 97 51 675 12,288 7 51 549 2 13 17 150 Auke Bay AK 4
Barrow AK 2
Bethel AK 13 6 7 196 0 0 0 0 0 0 0
Chefornak AK 3
Chenega Bay AK 10 7 103 1,893 4 26 343 3 23 5 99
Chevak AK 1
Chignik AK 6 0 0 0 0 0 0 0 0 0 0
Chignik Lagoon AK 9 4 48 603 2 7 103 0 0 4 55 Chignik Lake AK 1
Chiniak AK 13 11 72 790 6 18 470 0 0 0 0 Chugiak AK 4
Clarks Point AK 3
Coffman Cove AK 49 28 144 2,487 27 152 2,273 0 0 10 97
Cold Bay AK 37 20 270 3,811 13 26 646 3 64 0 0 Cordova AK 470 202 1,121 19,417 95 173 3,017 7 11 33 173 Craig AK 450 216 1,803 34,777 114 527 7,108 56 123 103 828 Dillingham AK 25 4 24 516 1 3 59 0 0 0 0 Douglas AK 11 4 15 262 7 4 52 0 0 0 0 Dutch Harbor AK 70 29 351 5,802 25 134 2,879 0 0 2 10 Eagle River AK 9 5 75 871 3 10 145 0 0 0 0 Edna Bay AK 26 12 65 1,848 2 2 99 2 4 4 8 Eek AK 5
Egegik AK 1
Elfin Cove AK 17 7 41 1,055 4 29 616 1 14 4 45
Excursion Inlet AK 4
Fairbanks AK 6 2 11 262 0 0 0 0 0 0 0
False Pass AK 2
Fritz Creek AK 1
Gakona AK 1
Girdwood AK 1
Gustavus AK 64 31 195 4,172 30 141 3,233 0 0 3 8 - continued -
DRAFT

151
Appendix E-4.–Page 2 of 4.
City State
Number of SHARCs issueda
Subsistence fished Subsistence harvest Sport fished Sport harvest Lingcod bycatch Rockfish bycatch
Estimated number
respondents
Estimated number halibut
Estimated pounds halibut
Estimated number
respondents
Estimated number halibut
Estimated pounds halibut
Estimated number
respondents
Estimated number lingcod
Estimated number
respondents
Estimated number rockfish
Haines AK 455 237 1,160 22,718 75 95 1,478 12 31 25 53 Homer AK 30 12 199 2,767 10 46 735 3 6 3 46 Hoonah AK 199 111 1,440 17,145 47 220 3,022 2 26 11 64 Hydaburg AK 105 70 1,038 28,206 12 13 667 18 75 31 586 Hyder AK 22 14 56 1,115 7 2 37 1 7 2 14 Juneau AK 338 64 551 9,887 60 286 3,791 2 4 18 93 Kake AK 103 43 336 9,947 18 42 1,373 6 19 7 96 Karluk AK 9 6 75 1,022 0 0 0 0 0 2 20 Kasaan AK 9 8 30 641 3 8 133 2 3 4 22 Kasilof AK 14 5 112 1,867 5 22 294 0 0 2 11 Kaukati AK 1
Kenai AK 106 14 423 7,785 17 74 835 2 3 2 16 Ketchikan AK 524 158 2,183 41,808 89 397 7,019 32 117 58 843 King Cove AK 73 24 270 3,981 11 47 929 0 0 1 8 King Salmon AK 2
Kipnuk AK 5
Klawock AK 212 82 953 23,231 52 274 4,007 23 50 33 247
Klukwan AK 1
Kodiak AK 1,503 769 6,704 125,820 500 2,444 44,110 111 331 144 1,196
Kongiganak AK 3
Kotzebue AK 1
Koyuk AK 1
Kwigillingok AK 1
Larsen Bay AK 22 13 132 1,869 3 22 168 2 2 4 28 Manokotak AK 2
Mekoryuk AK 3
Metlakatla AK 128 34 163 3,354 12 22 445 4 7 4 28
Meyers Chuck AK 8 5 15 322 1 1 42 1 1 2 11 Naknek AK 9 0 0 0 0 0 0 0 0 0 0 Nanwalek AK 74 33 824 12,175 0 0 0 6 85 12 157 Naukati AK 22 12 91 1,536 4 22 536 5 7 6 42 Nelson Lagoon AK 1
Nightmute AK 1
Nikiski AK 7 2 35 549 1 5 49 0 0 0 0
Ninilchik AK 28 2 55 617 5 37 378 0 0 0 0 Nome AK 18 9 41 816 0 0 0 0 0 0 0 North Pole AK 2
- continued -
DRAFT
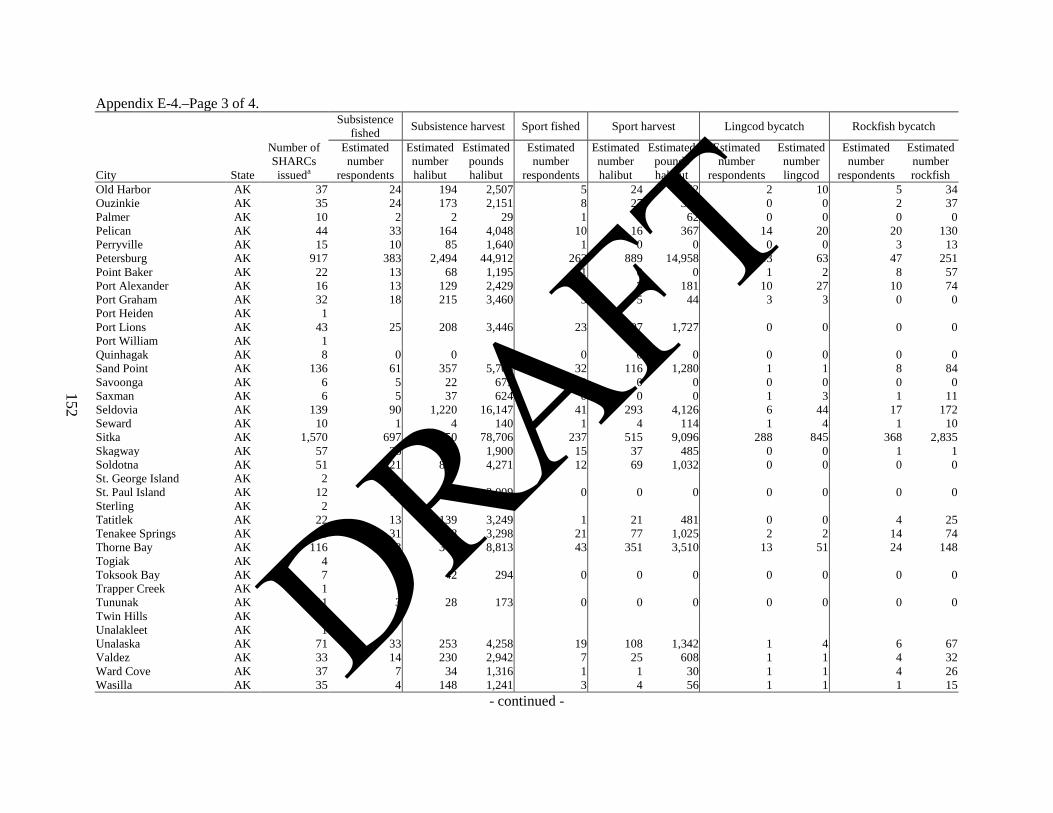
152
Appendix E-4.–Page 3 of 4.
City State
Number of SHARCs issueda
Subsistence fished Subsistence harvest Sport fished Sport harvest Lingcod bycatch Rockfish bycatch
Estimated number
respondents
Estimated number halibut
Estimated pounds halibut
Estimated number
respondents
Estimated number halibut
Estimated pounds halibut
Estimated number
respondents
Estimated number lingcod
Estimated number
respondents
Estimated number rockfish
Old Harbor AK 37 24 194 2,507 5 24 352 2 10 5 34 Ouzinkie AK 35 24 173 2,151 8 27 394 0 0 2 37 Palmer AK 10 2 2 29 1 1 62 0 0 0 0 Pelican AK 44 33 164 4,048 10 16 367 14 20 20 130 Perryville AK 15 10 85 1,640 1 0 0 0 0 3 13 Petersburg AK 917 383 2,494 44,912 263 889 14,958 13 63 47 251 Point Baker AK 22 13 68 1,195 1 0 0 1 2 8 57 Port Alexander AK 16 13 129 2,429 4 7 181 10 27 10 74 Port Graham AK 32 18 215 3,460 5 5 44 3 3 0 0 Port Heiden AK 1
Port Lions AK 43 25 208 3,446 23 107 1,727 0 0 0 0 Port William AK 1
Quinhagak AK 8 0 0 0 0 0 0 0 0 0 0 Sand Point AK 136 61 357 5,708 32 116 1,280 1 1 8 84 Savoonga AK 6 5 22 679 0 0 0 0 0 0 0 Saxman AK 6 5 37 624 0 0 0 1 3 1 11 Seldovia AK 139 90 1,220 16,147 41 293 4,126 6 44 17 172 Seward AK 10 1 4 140 1 4 114 1 4 1 10 Sitka AK 1,570 697 3,450 78,706 237 515 9,096 288 845 368 2,835 Skagway AK 57 26 83 1,900 15 37 485 0 0 1 1 Soldotna AK 51 21 898 4,271 12 69 1,032 0 0 0 0 St. George Island AK 2
St. Paul Island AK 12 14 149 2,009 0 0 0 0 0 0 0 Sterling AK 2
Tatitlek AK 22 13 139 3,249 1 21 481 0 0 4 25 Tenakee Springs AK 58 31 198 3,298 21 77 1,025 2 2 14 74 Thorne Bay AK 116 53 344 8,813 43 351 3,510 13 51 24 148 Togiak AK 4
Toksook Bay AK 7 5 42 294 0 0 0 0 0 0 0 Trapper Creek AK 1
Tununak AK 11 3 28 173 0 0 0 0 0 0 0 Twin Hills AK 1
Unalakleet AK 1
Unalaska AK 71 33 253 4,258 19 108 1,342 1 4 6 67
Valdez AK 33 14 230 2,942 7 25 608 1 1 4 32 Ward Cove AK 37 7 34 1,316 1 1 30 1 1 4 26 Wasilla AK 35 4 148 1,241 3 4 56 1 1 1 15
- continued -
DRAFT

153
Appendix E-4.–Page 4 of 4.
City State
Number of SHARCs issueda
Subsistence fished Subsistence harvest Sport fished Sport harvest Lingcod bycatch Rockfish bycatch
Estimated number
respondents
Estimated number halibut
Estimated pounds halibut
Estimated number
respondents
Estimated number halibut
Estimated pounds halibut
Estimated number
respondents
Estimated number lingcod
Estimated number
respondents
Estimated number rockfish
Whale Pass AK 7 7 25 949 2 1 32 0 0 0 0 Willow AK 2
Wrangell AK 469 249 1,857 35,885 121 358 8,133 11 26 34 216 Yakutat AK 112 52 765 18,230 17 88 1,243 13 81 8 113
Alaska Subtotal
9,847 4,386 36,965 685,334 2,218 8,647 144,379 696 2,247 1,161 9,568 Non-Alaska Subtotal 97 9 128 1,657 13 80 1,795 0 0 0 0
Total
9,944 4,394 37,093 686,991 2,231 8,727 146,174 696 2,247 1,161 9,568 a. To protect confidentiality, data for tribes and communities with 5 or fewer SHARCs issued are not reported in this table. Subtotals include all tribes and communities. Blank cells indicate redacted data.
DRAFT
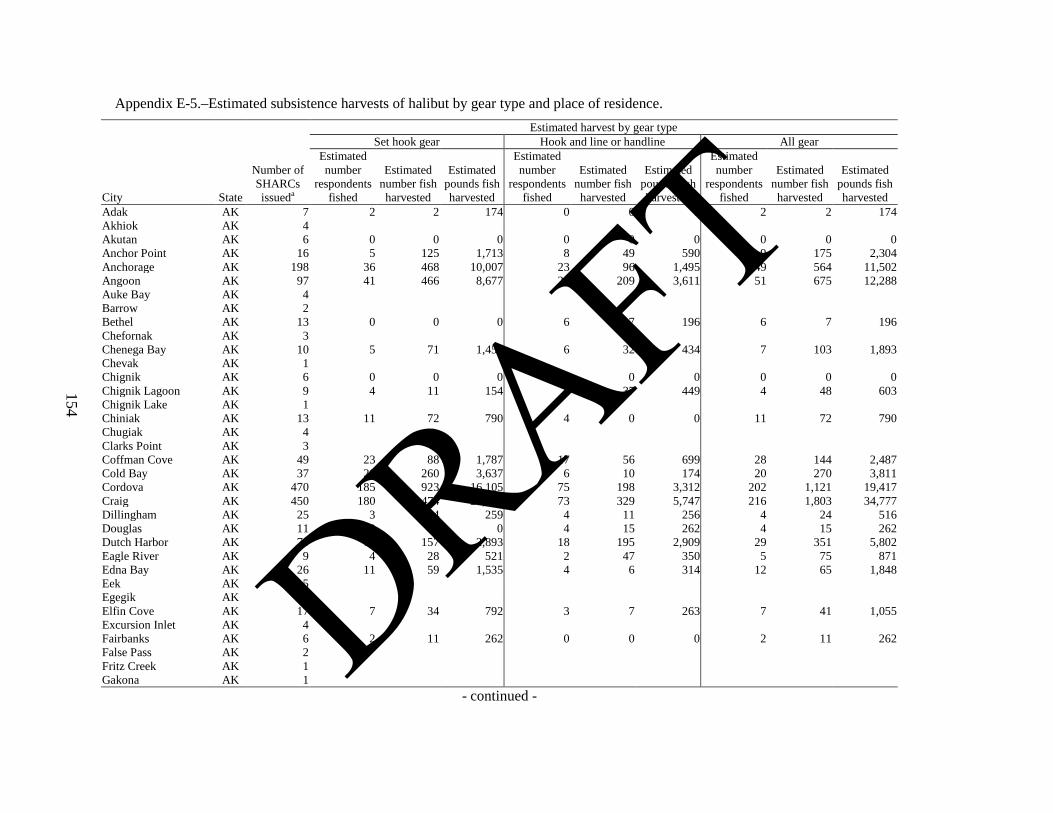
154
Appendix E-5.–Estimated subsistence harvests of halibut by gear type and place of residence.
City State
Number of SHARCs issueda
Estimated harvest by gear type Set hook gear Hook and line or handline All gear
Estimated number
respondents fished
Estimated number fish harvested
Estimated pounds fish harvested
Estimated number
respondents fished
Estimated number fish harvested
Estimated pounds fish harvested
Estimated number
respondents fished
Estimated number fish harvested
Estimated pounds fish harvested
Adak AK 7 2 2 174 0 0 0 2 2 174 Akhiok AK 4 Akutan AK 6 0 0 0 0 0 0 0 0 0 Anchor Point AK 16 5 125 1,713 8 49 590 9 175 2,304 Anchorage AK 198 36 468 10,007 23 96 1,495 49 564 11,502 Angoon AK 97 41 466 8,677 21 209 3,611 51 675 12,288 Auke Bay AK 4 Barrow AK 2 Bethel AK 13 0 0 0 6 7 196 6 7 196 Chefornak AK 3 Chenega Bay AK 10 5 71 1,459 6 32 434 7 103 1,893 Chevak AK 1 Chignik AK 6 0 0 0 0 0 0 0 0 0 Chignik Lagoon AK 9 4 11 154 4 37 449 4 48 603 Chignik Lake AK 1 Chiniak AK 13 11 72 790 4 0 0 11 72 790 Chugiak AK 4 Clarks Point AK 3 Coffman Cove AK 49 23 88 1,787 17 56 699 28 144 2,487 Cold Bay AK 37 20 260 3,637 6 10 174 20 270 3,811 Cordova AK 470 185 923 16,105 75 198 3,312 202 1,121 19,417 Craig AK 450 180 1,474 29,031 73 329 5,747 216 1,803 34,777 Dillingham AK 25 3 14 259 4 11 256 4 24 516 Douglas AK 11 0 0 0 4 15 262 4 15 262 Dutch Harbor AK 70 15 157 2,893 18 195 2,909 29 351 5,802 Eagle River AK 9 4 28 521 2 47 350 5 75 871 Edna Bay AK 26 11 59 1,535 4 6 314 12 65 1,848 Eek AK 5 Egegik AK 1 Elfin Cove AK 17 7 34 792 3 7 263 7 41 1,055 Excursion Inlet AK 4 Fairbanks AK 6 2 11 262 0 0 0 2 11 262 False Pass AK 2 Fritz Creek AK 1 Gakona AK 1
- continued -
DRAFT
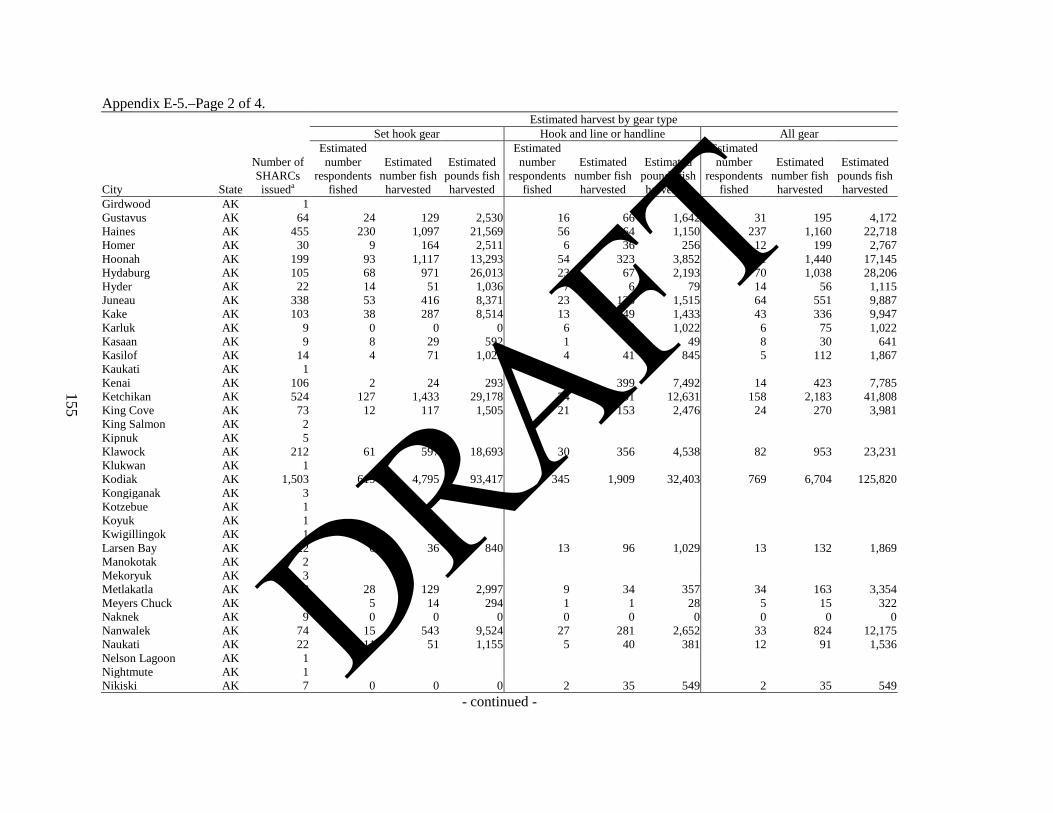
155
Appendix E-5.–Page 2 of 4.
City State
Number of SHARCs issueda
Estimated harvest by gear type Set hook gear Hook and line or handline All gear
Estimated number
respondents fished
Estimated number fish harvested
Estimated pounds fish harvested
Estimated number
respondents fished
Estimated number fish harvested
Estimated pounds fish harvested
Estimated number
respondents fished
Estimated number fish harvested
Estimated pounds fish harvested
Girdwood AK 1 Gustavus AK 64 24 129 2,530 16 66 1,642 31 195 4,172 Haines AK 455 230 1,097 21,569 56 64 1,150 237 1,160 22,718 Homer AK 30 9 164 2,511 6 36 256 12 199 2,767 Hoonah AK 199 93 1,117 13,293 54 323 3,852 111 1,440 17,145 Hydaburg AK 105 68 971 26,013 23 67 2,193 70 1,038 28,206 Hyder AK 22 14 51 1,036 7 6 79 14 56 1,115 Juneau AK 338 53 416 8,371 23 135 1,515 64 551 9,887 Kake AK 103 38 287 8,514 13 49 1,433 43 336 9,947 Karluk AK 9 0 0 0 6 75 1,022 6 75 1,022 Kasaan AK 9 8 29 592 1 1 49 8 30 641 Kasilof AK 14 4 71 1,022 4 41 845 5 112 1,867 Kaukati AK 1 Kenai AK 106 2 24 293 12 399 7,492 14 423 7,785 Ketchikan AK 524 127 1,433 29,178 74 751 12,631 158 2,183 41,808 King Cove AK 73 12 117 1,505 21 153 2,476 24 270 3,981 King Salmon AK 2 Kipnuk AK 5 Klawock AK 212 61 597 18,693 30 356 4,538 82 953 23,231 Klukwan AK 1 Kodiak AK 1,503 619 4,795 93,417 345 1,909 32,403 769 6,704 125,820 Kongiganak AK 3 Kotzebue AK 1 Koyuk AK 1 Kwigillingok AK 1 Larsen Bay AK 22 6 36 840 13 96 1,029 13 132 1,869 Manokotak AK 2 Mekoryuk AK 3 Metlakatla AK 128 28 129 2,997 9 34 357 34 163 3,354 Meyers Chuck AK 8 5 14 294 1 1 28 5 15 322 Naknek AK 9 0 0 0 0 0 0 0 0 0 Nanwalek AK 74 15 543 9,524 27 281 2,652 33 824 12,175 Naukati AK 22 11 51 1,155 5 40 381 12 91 1,536 Nelson Lagoon AK 1 Nightmute AK 1 Nikiski AK 7 0 0 0 2 35 549 2 35 549
- continued -
DRAFT
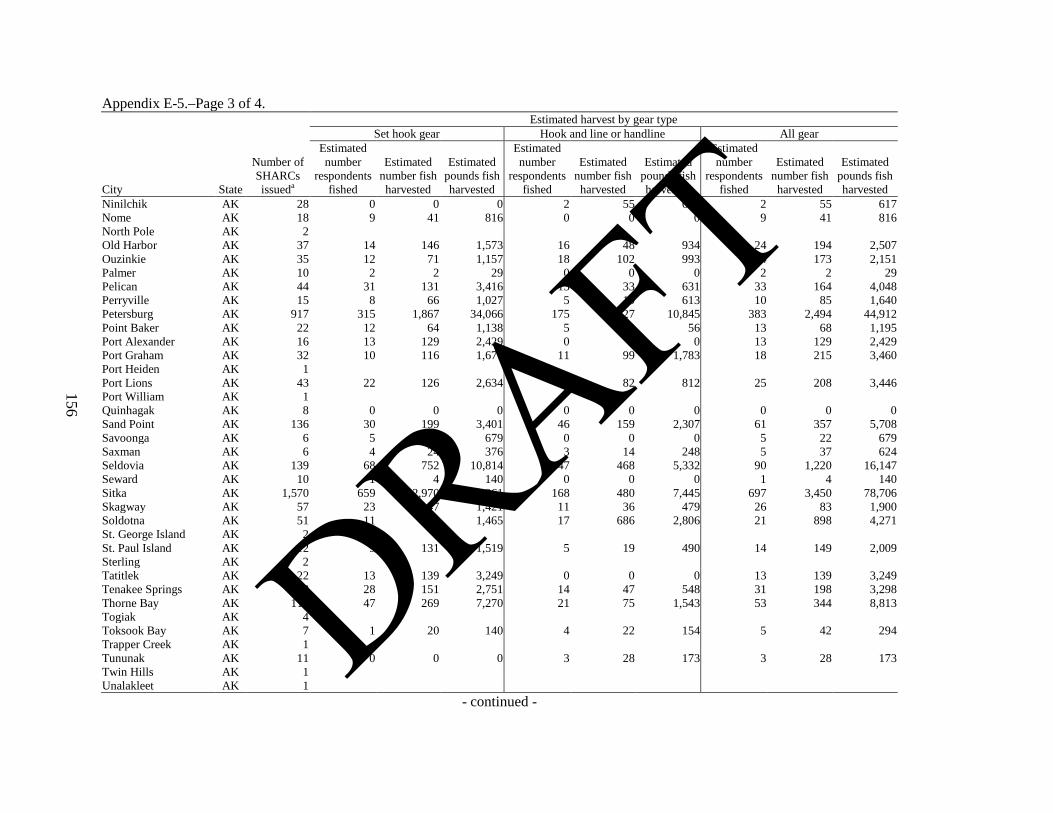
156
Appendix E-5.–Page 3 of 4.
City State
Number of SHARCs issueda
Estimated harvest by gear type Set hook gear Hook and line or handline All gear
Estimated number
respondents fished
Estimated number fish harvested
Estimated pounds fish harvested
Estimated number
respondents fished
Estimated number fish harvested
Estimated pounds fish harvested
Estimated number
respondents fished
Estimated number fish harvested
Estimated pounds fish harvested
Ninilchik AK 28 0 0 0 2 55 617 2 55 617 Nome AK 18 9 41 816 0 0 0 9 41 816 North Pole AK 2 Old Harbor AK 37 14 146 1,573 16 48 934 24 194 2,507 Ouzinkie AK 35 12 71 1,157 18 102 993 24 173 2,151 Palmer AK 10 2 2 29 0 0 0 2 2 29 Pelican AK 44 31 131 3,416 13 33 631 33 164 4,048 Perryville AK 15 8 66 1,027 5 19 613 10 85 1,640 Petersburg AK 917 315 1,867 34,066 175 627 10,845 383 2,494 44,912 Point Baker AK 22 12 64 1,138 5 3 56 13 68 1,195 Port Alexander AK 16 13 129 2,429 0 0 0 13 129 2,429 Port Graham AK 32 10 116 1,677 11 99 1,783 18 215 3,460 Port Heiden AK 1 Port Lions AK 43 22 126 2,634 7 82 812 25 208 3,446 Port William AK 1 Quinhagak AK 8 0 0 0 0 0 0 0 0 0 Sand Point AK 136 30 199 3,401 46 159 2,307 61 357 5,708 Savoonga AK 6 5 22 679 0 0 0 5 22 679 Saxman AK 6 4 24 376 3 14 248 5 37 624 Seldovia AK 139 68 752 10,814 47 468 5,332 90 1,220 16,147 Seward AK 10 1 4 140 0 0 0 1 4 140 Sitka AK 1,570 659 2,970 71,261 168 480 7,445 697 3,450 78,706 Skagway AK 57 23 47 1,421 11 36 479 26 83 1,900 Soldotna AK 51 11 213 1,465 17 686 2,806 21 898 4,271 St. George Island AK 2 St. Paul Island AK 12 9 131 1,519 5 19 490 14 149 2,009 Sterling AK 2 Tatitlek AK 22 13 139 3,249 0 0 0 13 139 3,249 Tenakee Springs AK 58 28 151 2,751 14 47 548 31 198 3,298 Thorne Bay AK 116 47 269 7,270 21 75 1,543 53 344 8,813 Togiak AK 4 Toksook Bay AK 7 1 20 140 4 22 154 5 42 294 Trapper Creek AK 1 Tununak AK 11 0 0 0 3 28 173 3 28 173 Twin Hills AK 1 Unalakleet AK 1
- continued -
DRAFT

157
Appendix E-5.–Page 4 of 4.
City State
Number of SHARCs issueda
Estimated harvest by gear type Set hook gear Hook and line or handline All gear
Estimated number
respondents fished
Estimated number fish harvested
Estimated pounds fish harvested
Estimated number
respondents fished
Estimated number fish harvested
Estimated pounds fish harvested
Estimated number
respondents fished
Estimated number fish harvested
Estimated pounds fish harvested
Unalaska AK 71 27 165 2,450 23 88 1,808 33 253 4,258 Valdez AK 33 11 89 1,462 7 141 1,480 14 230 2,942 Ward Cove AK 37 7 34 1,316 0 0 0 7 34 1,316 Wasilla AK 35 2 30 284 3 118 956 4 148 1,241 Whale Pass AK 7 3 11 360 7 14 589 7 25 949 Willow AK 2 Wrangell AK 469 214 1,454 29,013 84 403 6,873 249 1,857 35,885 Yakutat AK 112 43 656 16,362 16 109 1,868 52 765 18,230
Alaska subtotal 9,847 3,647 26,622 531,159 1,771 10,343 154,175 4,386 36,965 685,334 Non-Alaska subtotal 97 9 114 1,463 3 14 193 9 128 1,657
Total 9,944 3,655 26,736 532,623 1,775 10,357 154,368 4,394 37,093 686,991 a. To protect confidentiality, data for tribes and communities with 5 or fewer SHARCs issued are not reported in this table. Subtotals include all tribes and communities. Blank cells indicate redacted data.
DRAFT
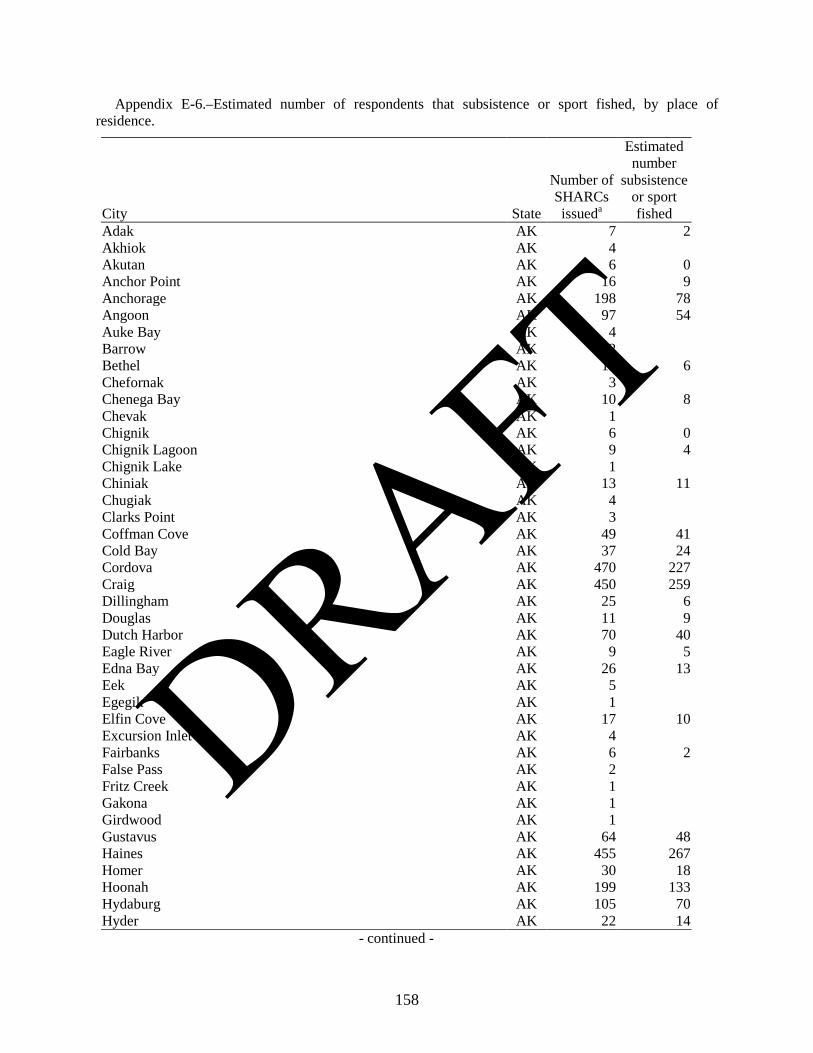
Appendix E-6.–Estimated number of respondents that subsistence or sport fished, by place of residence.
City State
Number of SHARCs issueda
Estimated number
subsistence or sport fished
Adak AK 7 2 Akhiok AK 4 Akutan AK 6 0 Anchor Point AK 16 9 Anchorage AK 198 78 Angoon AK 97 54 Auke Bay AK 4 Barrow AK 2 Bethel AK 13 6 Chefornak AK 3 Chenega Bay AK 10 8 Chevak AK 1 Chignik AK 6 0 Chignik Lagoon AK 9 4 Chignik Lake AK 1 Chiniak AK 13 11 Chugiak AK 4 Clarks Point AK 3 Coffman Cove AK 49 41 Cold Bay AK 37 24 Cordova AK 470 227 Craig AK 450 259 Dillingham AK 25 6 Douglas AK 11 9 Dutch Harbor AK 70 40 Eagle River AK 9 5 Edna Bay AK 26 13 Eek AK 5 Egegik AK 1 Elfin Cove AK 17 10 Excursion Inlet AK 4 Fairbanks AK 6 2 False Pass AK 2 Fritz Creek AK 1 Gakona AK 1 Girdwood AK 1 Gustavus AK 64 48 Haines AK 455 267 Homer AK 30 18 Hoonah AK 199 133 Hydaburg AK 105 70 Hyder AK 22 14
- continued -
158
DRAFT
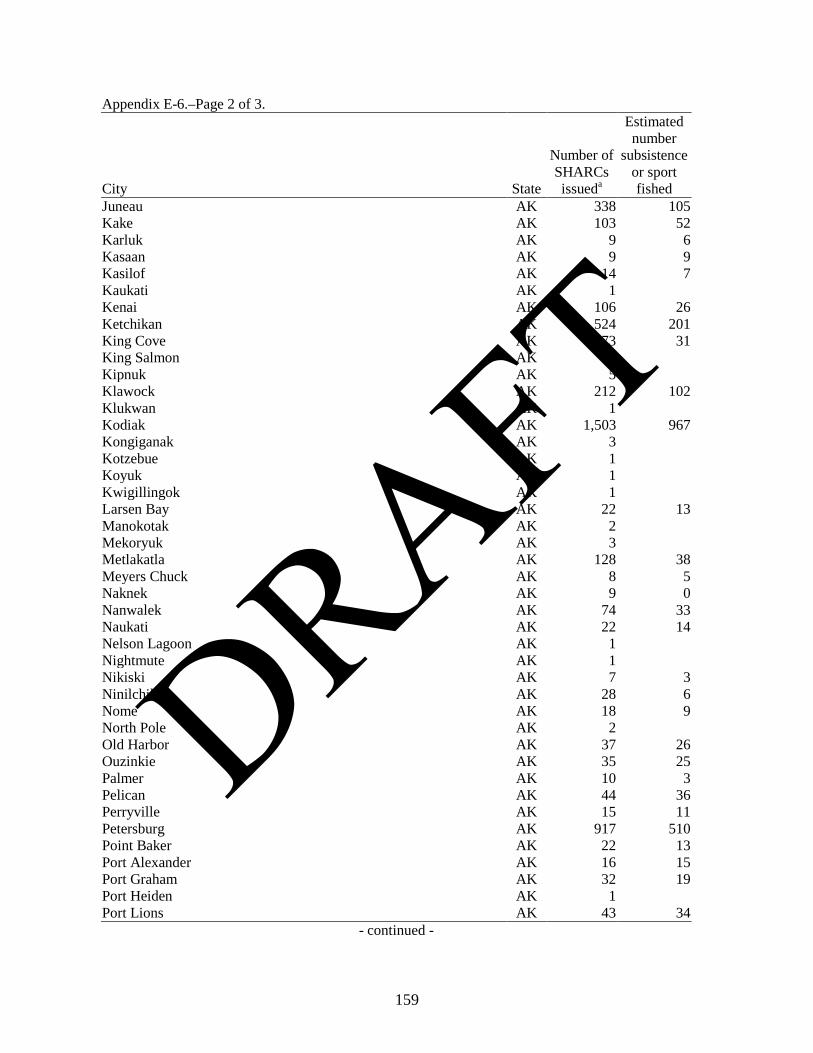
Appendix E-6.–Page 2 of 3.
City State
Number of SHARCs issueda
Estimated number
subsistence or sport fished
Juneau AK 338 105 Kake AK 103 52 Karluk AK 9 6 Kasaan AK 9 9 Kasilof AK 14 7 Kaukati AK 1 Kenai AK 106 26 Ketchikan AK 524 201 King Cove AK 73 31 King Salmon AK 2 Kipnuk AK 5 Klawock AK 212 102 Klukwan AK 1 Kodiak AK 1,503 967 Kongiganak AK 3 Kotzebue AK 1 Koyuk AK 1 Kwigillingok AK 1 Larsen Bay AK 22 13 Manokotak AK 2 Mekoryuk AK 3 Metlakatla AK 128 38 Meyers Chuck AK 8 5 Naknek AK 9 0 Nanwalek AK 74 33 Naukati AK 22 14 Nelson Lagoon AK 1 Nightmute AK 1 Nikiski AK 7 3 Ninilchik AK 28 6 Nome AK 18 9 North Pole AK 2 Old Harbor AK 37 26 Ouzinkie AK 35 25 Palmer AK 10 3 Pelican AK 44 36 Perryville AK 15 11 Petersburg AK 917 510 Point Baker AK 22 13 Port Alexander AK 16 15 Port Graham AK 32 19 Port Heiden AK 1 Port Lions AK 43 34
- continued -
159
DRAFT

Appendix E-6.–Page 3 of 3.
City State
Number of SHARCs issueda
Estimated number
subsistence or sport fished
Port William AK 1 Quinhagak AK 8 0 Sand Point AK 136 75 Savoonga AK 6 5 Saxman AK 6 5 Seldovia AK 139 112 Seward AK 10 2 Sitka AK 1,570 799 Skagway AK 57 33 Soldotna AK 51 23 St. George Island AK 2 St. Paul Island AK 12 14 Sterling AK 2 Tatitlek AK 22 14 Tenakee Springs AK 58 41 Thorne Bay AK 116 72 Togiak AK 4 Toksook Bay AK 7 5 Trapper Creek AK 1 Tununak AK 11 3 Twin Hills AK 1 Unalakleet AK 1 Unalaska AK 71 42 Valdez AK 33 15 Ward Cove AK 37 8 Wasilla AK 35 4 Whale Pass AK 7 7 Willow AK 2 Wrangell AK 469 290 Yakutat AK 112 62
Alaska subtotal 9,847 5,337 Non-Alaska subtotal 97 22
Total 9,944 5,358 a. To protect confidentiality, data for tribes and communities with 5 or fewer SHARCs issued are not reported in this table. Subtotals include all tribes and communities. Blank cells indicate redacted data.
160
DRAFT
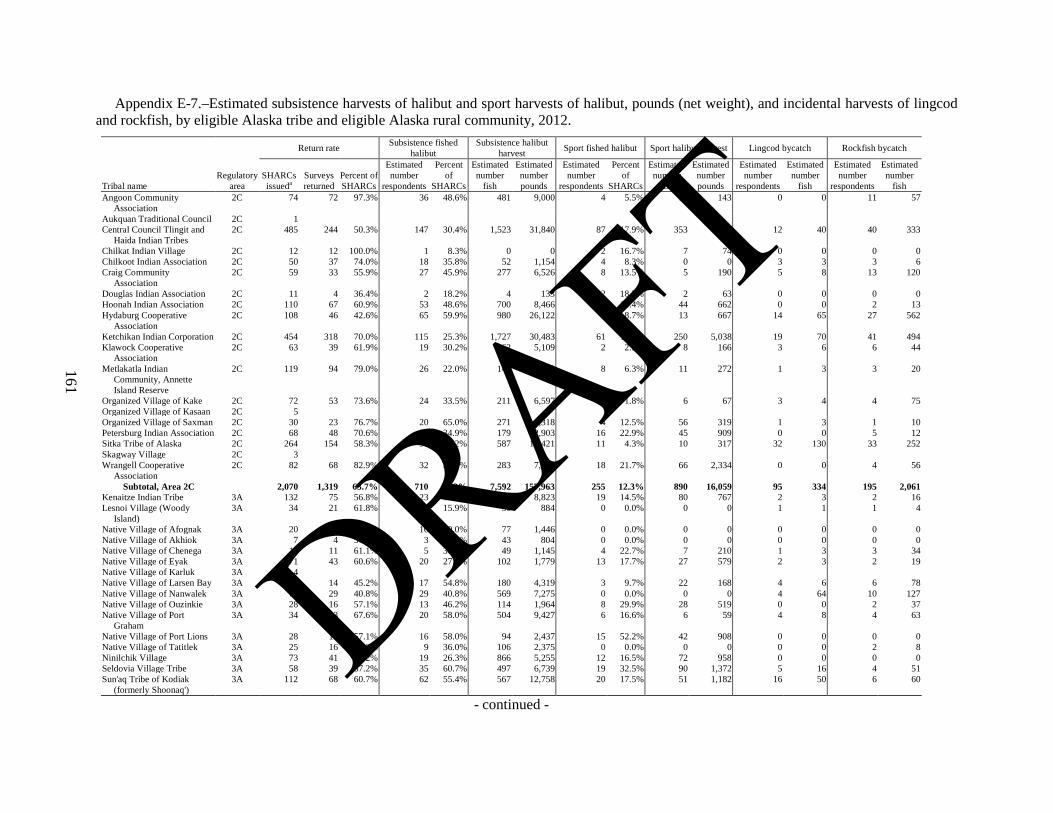
161
Appendix E-7.–Estimated subsistence harvests of halibut and sport harvests of halibut, pounds (net weight), and incidental harvests of lingcod and rockfish, by eligible Alaska tribe and eligible Alaska rural community, 2012.
Tribal name Regulatory
area
Return rate Subsistence fished halibut
Subsistence halibut harvest Sport fished halibut Sport halibut harvest Lingcod bycatch Rockfish bycatch
SHARCs issueda
Surveys returned
Percent of SHARCs
Estimated number
respondents
Percent of
SHARCs
Estimated number
fish
Estimated number pounds
Estimated number
respondents
Percent of
SHARCs
Estimated number
fish
Estimated number pounds
Estimated number
respondents
Estimated number
fish
Estimated number
respondents
Estimated number
fish Angoon Community
Association 2C 74 72 97.3% 36 48.6% 481 9,000 4 5.5% 10 143 0 0 11 57
Aukquan Traditional Council 2C 1 Central Council Tlingit and
Haida Indian Tribes 2C 485 244 50.3% 147 30.4% 1,523 31,840 87 17.9% 353 4,765 12 40 40 333
Chilkat Indian Village 2C 12 12 100.0% 1 8.3% 0 0 2 16.7% 7 74 0 0 0 0 Chilkoot Indian Association 2C 50 37 74.0% 18 35.8% 52 1,154 4 8.3% 0 0 3 3 3 6 Craig Community
Association 2C 59 33 55.9% 27 45.9% 277 6,526 8 13.5% 5 190 5 8 13 120
Douglas Indian Association 2C 11 4 36.4% 2 18.2% 4 133 2 18.2% 2 63 0 0 0 0 Hoonah Indian Association 2C 110 67 60.9% 53 48.6% 700 8,466 16 14.4% 44 662 0 0 2 13 Hydaburg Cooperative
Association 2C 108 46 42.6% 65 59.9% 980 26,122 9 8.7% 13 667 14 65 27 562
Ketchikan Indian Corporation 2C 454 318 70.0% 115 25.3% 1,727 30,483 61 13.4% 250 5,038 19 70 41 494 Klawock Cooperative
Association 2C 63 39 61.9% 19 30.2% 162 5,109 2 2.5% 8 166 3 6 6 44
Metlakatla Indian Community, Annette Island Reserve
2C 119 94 79.0% 26 22.0% 140 2,789 8 6.3% 11 272 1 3 3 20
Organized Village of Kake 2C 72 53 73.6% 24 33.5% 211 6,597 1 1.8% 6 67 3 4 4 75 Organized Village of Kasaan 2C 5 Organized Village of Saxman 2C 30 23 76.7% 20 65.0% 271 4,318 4 12.5% 56 319 1 3 1 10 Petersburg Indian Association 2C 68 48 70.6% 24 34.9% 179 2,903 16 22.9% 45 909 0 0 5 12 Sitka Tribe of Alaska 2C 264 154 58.3% 98 37.2% 587 14,421 11 4.3% 10 317 32 130 33 252 Skagway Village 2C 3 Wrangell Cooperative
Association 2C 82 68 82.9% 32 39.0% 283 7,744 18 21.7% 66 2,334 0 0 4 56
Subtotal, Area 2C 2,070 1,319 63.7% 710 34.3% 7,592 157,963 255 12.3% 890 16,059 95 334 195 2,061 Kenaitze Indian Tribe 3A 132 75 56.8% 23 17.2% 572 8,823 19 14.5% 80 767 2 3 2 16 Lesnoi Village (Woody
Island) 3A 34 21 61.8% 5 15.9% 50 884 0 0.0% 0 0 1 1 1 4
Native Village of Afognak 3A 20 11 55.0% 10 49.0% 77 1,446 0 0.0% 0 0 0 0 0 0 Native Village of Akhiok 3A 7 4 57.1% 3 42.9% 43 804 0 0.0% 0 0 0 0 0 0 Native Village of Chenega 3A 18 11 61.1% 5 30.3% 49 1,145 4 22.7% 7 210 1 3 3 34 Native Village of Eyak 3A 71 43 60.6% 20 27.9% 102 1,779 13 17.7% 27 579 2 3 2 19 Native Village of Karluk 3A 4 Native Village of Larsen Bay 3A 31 14 45.2% 17 54.8% 180 4,319 3 9.7% 22 168 4 6 6 78 Native Village of Nanwalek 3A 71 29 40.8% 29 40.8% 569 7,275 0 0.0% 0 0 4 64 10 127 Native Village of Ouzinkie 3A 28 16 57.1% 13 46.2% 114 1,964 8 29.9% 28 519 0 0 2 37 Native Village of Port
Graham 3A 34 23 67.6% 20 58.0% 504 9,427 6 16.6% 6 59 4 8 4 63
Native Village of Port Lions 3A 28 16 57.1% 16 58.0% 94 2,437 15 52.2% 42 908 0 0 0 0 Native Village of Tatitlek 3A 25 16 64.0% 9 36.0% 106 2,375 0 0.0% 0 0 0 0 2 8 Ninilchik Village 3A 73 41 56.2% 19 26.3% 866 5,255 12 16.5% 72 958 0 0 0 0 Seldovia Village Tribe 3A 58 39 67.2% 35 60.7% 497 6,739 19 32.5% 90 1,372 5 16 4 51 Sun'aq Tribe of Kodiak
(formerly Shoonaq') 3A 112 68 60.7% 62 55.4% 567 12,758 20 17.5% 51 1,182 16 50 6 60
- continued -
DRAFT
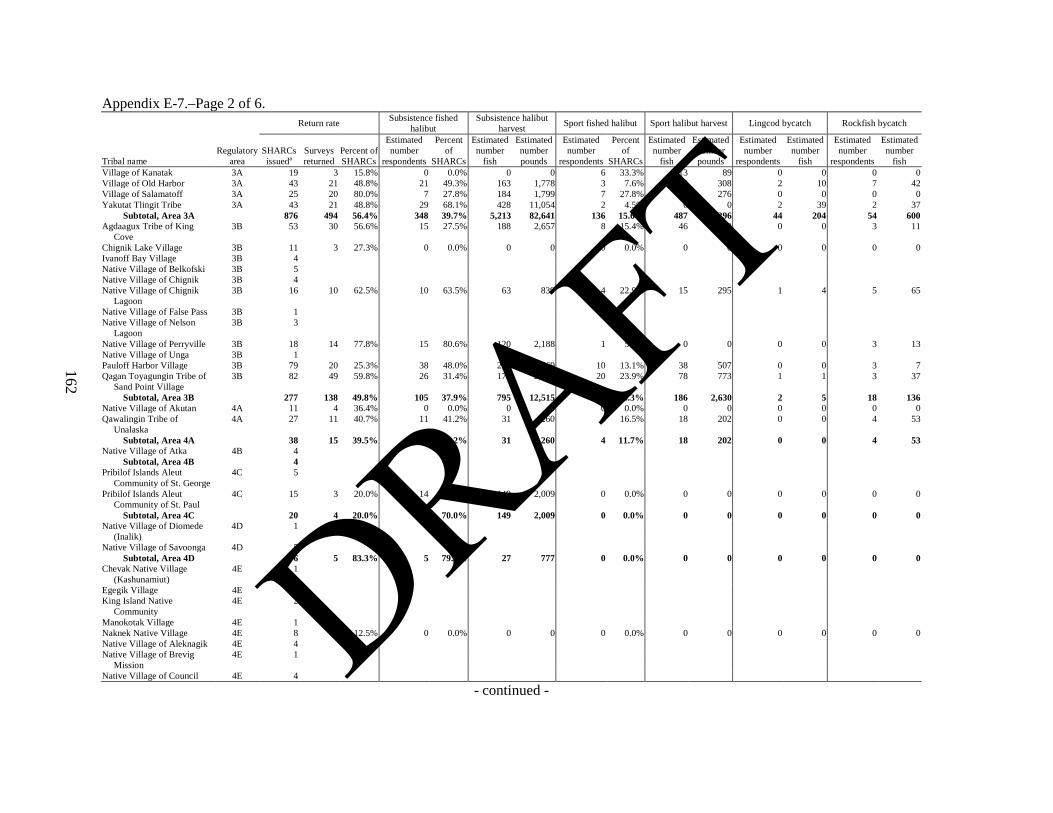
162
Appendix E-7.–Page 2 of 6.
Tribal name Regulatory
area
Return rate Subsistence fished halibut
Subsistence halibut harvest Sport fished halibut Sport halibut harvest Lingcod bycatch Rockfish bycatch
SHARCs issueda
Surveys returned
Percent of SHARCs
Estimated number
respondents
Percent of
SHARCs
Estimated number
fish
Estimated number pounds
Estimated number
respondents
Percent of
SHARCs
Estimated number
fish
Estimated number pounds
Estimated number
respondents
Estimated number
fish
Estimated number
respondents
Estimated number
fish Village of Kanatak 3A 19 3 15.8% 0 0.0% 0 0 6 33.3% 13 89 0 0 0 0 Village of Old Harbor 3A 43 21 48.8% 21 49.3% 163 1,778 3 7.6% 23 308 2 10 7 42 Village of Salamatoff 3A 25 20 80.0% 7 27.8% 184 1,799 7 27.8% 25 276 0 0 0 0 Yakutat Tlingit Tribe 3A 43 21 48.8% 29 68.1% 428 11,054 2 4.5% 0 0 2 39 2 37
Subtotal, Area 3A 876 494 56.4% 348 39.7% 5,213 82,641 136 15.6% 487 7,396 44 204 54 600 Agdaagux Tribe of King
Cove 3B 53 30 56.6% 15 27.5% 188 2,657 8 15.4% 46 880 0 0 3 11
Chignik Lake Village 3B 11 3 27.3% 0 0.0% 0 0 0 0.0% 0 0 0 0 0 0 Ivanoff Bay Village 3B 4 Native Village of Belkofski 3B 5 Native Village of Chignik 3B 4 Native Village of Chignik
Lagoon 3B 16 10 62.5% 10 63.5% 63 839 4 22.9% 15 295 1 4 5 65
Native Village of False Pass 3B 1 Native Village of Nelson
Lagoon 3B 3
Native Village of Perryville 3B 18 14 77.8% 15 80.6% 120 2,188 1 5.6% 0 0 0 0 3 13 Native Village of Unga 3B 1 Pauloff Harbor Village 3B 79 20 25.3% 38 48.0% 231 3,869 10 13.1% 38 507 0 0 3 7 Qagan Toyagungin Tribe of
Sand Point Village 3B 82 49 59.8% 26 31.4% 179 2,780 20 23.9% 78 773 1 1 3 37
Subtotal, Area 3B 277 138 49.8% 105 37.9% 795 12,515 51 18.3% 186 2,630 2 5 18 136 Native Village of Akutan 4A 11 4 36.4% 0 0.0% 0 0 0 0.0% 0 0 0 0 0 0 Qawalingin Tribe of
Unalaska 4A 27 11 40.7% 11 41.2% 31 260 4 16.5% 18 202 0 0 4 53
Subtotal, Area 4A 38 15 39.5% 11 29.2% 31 260 4 11.7% 18 202 0 0 4 53 Native Village of Atka 4B 4
Subtotal, Area 4B 4 Pribilof Islands Aleut
Community of St. George 4C 5
Pribilof Islands Aleut Community of St. Paul
4C 15 3 20.0% 14 93.3% 149 2,009 0 0.0% 0 0 0 0 0 0
Subtotal, Area 4C 20 4 20.0% 14 70.0% 149 2,009 0 0.0% 0 0 0 0 0 0 Native Village of Diomede
(Inalik) 4D 1
Native Village of Savoonga 4D 5 Subtotal, Area 4D 6 5 83.3% 5 79.2% 27 777 0 0.0% 0 0 0 0 0 0
Chevak Native Village (Kashunamiut)
4E 1
Egegik Village 4E 4 King Island Native
Community 4E 2
Manokotak Village 4E 1 Naknek Native Village 4E 8 1 12.5% 0 0.0% 0 0 0 0.0% 0 0 0 0 0 0 Native Village of Aleknagik 4E 4 Native Village of Brevig
Mission 4E 1
Native Village of Council 4E 4
- continued -
DRAFT

163
Appendix E-7.–Page 3 of 6.
Tribal name Regulatory
area
Return rate Subsistence fished halibut
Subsistence halibut harvest Sport fished halibut Sport halibut harvest Lingcod bycatch Rockfish bycatch
SHARCs issueda
Surveys returned
Percent of SHARCs
Estimated number
respondents
Percent of
SHARCs
Estimated number
fish
Estimated number pounds
Estimated number
respondents
Percent of
SHARCs
Estimated number
fish
Estimated number pounds
Estimated number
respondents
Estimated number
fish
Estimated number
respondents
Estimated number
fish Native Village of Dillingham
(Curyung) 4E 12 6 50.0% 3 25.0% 24 516 2 16.7% 12 259 0 0 0 0
Native Village of Eek 4E 7 4 57.1% 5 75.0% 21 698 0 0.0% 0 0 0 0 0 0 Native Village of Hooper Bay 4E 2 Native Village of Kipnuk 4E 5 Native Village of Kongiganak 4E 3 Native Village of Koyuk 4E 1 Native Village of
Kwigillingok 4E 1
Native Village of Kwinhagak 4E 6 1 16.7% 0 0.0% 0 0 0 0.0% 0 0 0 0 0 0 Native Village of Mekoryuk 4E 4 Native Village of Scammon
Bay 4E 3
Native Village of Shaktoolik 4E 1 Native Village of Toksook
Bay (Nunakauyak) 4E 9 8 88.9% 5 55.6% 42 294 0 0.0% 0 0 0 0 0 0
Native Village of Tununak 4E 12 4 33.3% 3 22.9% 28 173 0 0.0% 0 0 0 0 0 0 Native Village of Unalakleet 4E 1 Native Village of Wales 4E 1 Newtok Village 4E 1 Nome Eskimo Community 4E 12 4 33.3% 5 41.7% 34 910 0 0.0% 0 0 0 0 2 6 Orutsararmuit Native Village 4E 13 10 76.9% 5 41.9% 0 0 0 0.0% 0 0 0 0 0 0 Platinum Traditional Village 4E 1 South Naknek Village 4E 2 Traditional Village of Togiak 4E 2 Ugashik Village 4E 2 Village of Chefornak 4E 4 Village of Clark's Point 4E 3 Village of Kotlik 4E 1
Subtotal, Area 4E 134 66 49.3% 37 27.9% 259 3,785 11 8.2% 34 622 1 24 2 6 Tribal subtotal 3,425 2,043 59.6% 1,232 36.0% 14,079 260,118 457 13.4% 1,614 26,908 142 567 273 2,857
- continued -
DRAFT
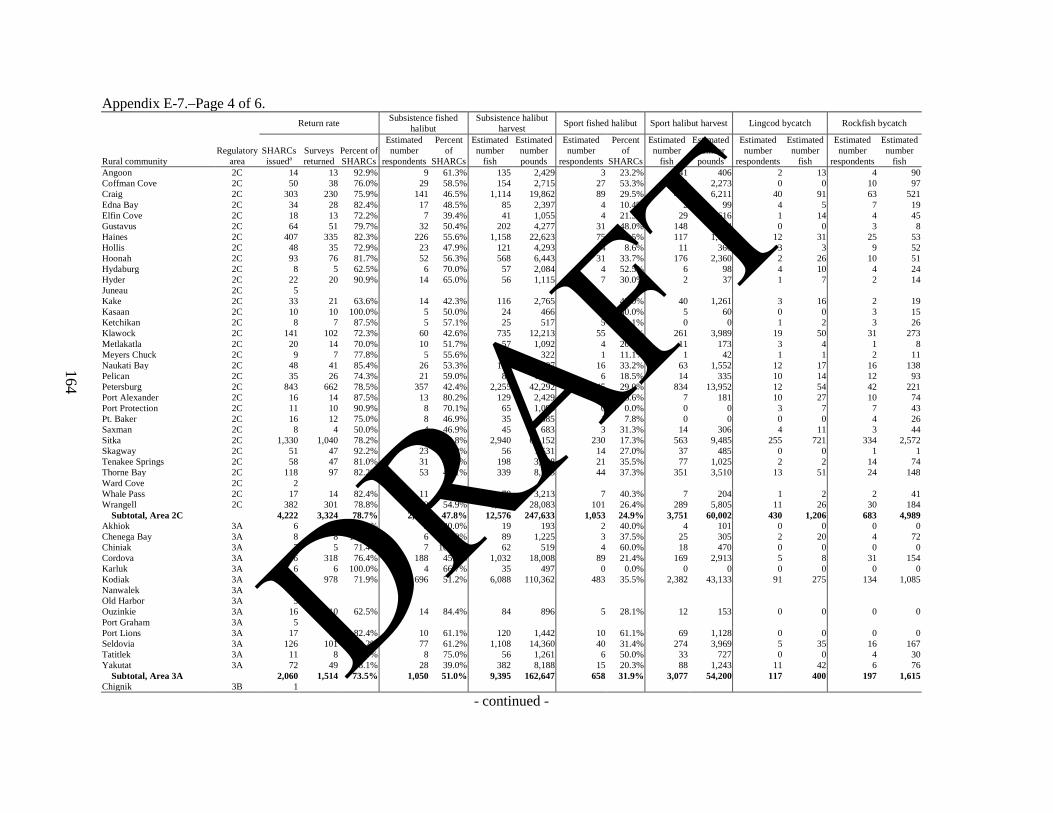
164
Appendix E-7.–Page 4 of 6.
Rural community Regulatory
area
Return rate Subsistence fished halibut
Subsistence halibut harvest Sport fished halibut Sport halibut harvest Lingcod bycatch Rockfish bycatch
SHARCs issueda
Surveys returned
Percent of SHARCs
Estimated number
respondents
Percent of
SHARCs
Estimated number
fish
Estimated number pounds
Estimated number
respondents
Percent of
SHARCs
Estimated number
fish
Estimated number pounds
Estimated number
respondents
Estimated number
fish
Estimated number
respondents
Estimated number
fish Angoon 2C 14 13 92.9% 9 61.3% 135 2,429 3 23.2% 41 406 2 13 4 90 Coffman Cove 2C 50 38 76.0% 29 58.5% 154 2,715 27 53.3% 152 2,273 0 0 10 97 Craig 2C 303 230 75.9% 141 46.5% 1,114 19,862 89 29.5% 493 6,211 40 91 63 521 Edna Bay 2C 34 28 82.4% 17 48.5% 85 2,397 4 10.4% 2 99 4 5 7 19 Elfin Cove 2C 18 13 72.2% 7 39.4% 41 1,055 4 21.3% 29 616 1 14 4 45 Gustavus 2C 64 51 79.7% 32 50.4% 202 4,277 31 48.0% 148 3,364 0 0 3 8 Haines 2C 407 335 82.3% 226 55.6% 1,158 22,623 75 18.5% 117 1,808 12 31 25 53 Hollis 2C 48 35 72.9% 23 47.9% 121 4,293 4 8.6% 11 366 3 3 9 52 Hoonah 2C 93 76 81.7% 52 56.3% 568 6,443 31 33.7% 176 2,360 2 26 10 51 Hydaburg 2C 8 5 62.5% 6 70.0% 57 2,084 4 52.5% 6 98 4 10 4 24 Hyder 2C 22 20 90.9% 14 65.0% 56 1,115 7 30.0% 2 37 1 7 2 14 Juneau 2C 5 Kake 2C 33 21 63.6% 14 42.3% 116 2,765 16 47.0% 40 1,261 3 16 2 19 Kasaan 2C 10 10 100.0% 5 50.0% 24 466 3 30.0% 5 60 0 0 3 15 Ketchikan 2C 8 7 87.5% 5 57.1% 25 517 5 57.1% 0 0 1 2 3 26 Klawock 2C 141 102 72.3% 60 42.6% 735 12,213 55 39.1% 261 3,989 19 50 31 273 Metlakatla 2C 20 14 70.0% 10 51.7% 57 1,092 4 20.0% 11 173 3 4 1 8 Meyers Chuck 2C 9 7 77.8% 5 55.6% 15 322 1 11.1% 1 42 1 1 2 11 Naukati Bay 2C 48 41 85.4% 26 53.3% 150 2,997 16 33.2% 63 1,552 12 17 16 138 Pelican 2C 35 26 74.3% 21 59.0% 89 1,768 6 18.5% 14 335 10 14 12 93 Petersburg 2C 843 662 78.5% 357 42.4% 2,255 42,292 245 29.0% 834 13,952 12 54 42 221 Port Alexander 2C 16 14 87.5% 13 80.2% 129 2,429 4 26.6% 7 181 10 27 10 74 Port Protection 2C 11 10 90.9% 8 70.1% 65 1,095 0 0.0% 0 0 3 7 7 43 Pt. Baker 2C 16 12 75.0% 8 46.9% 35 585 1 7.8% 0 0 0 0 4 26 Saxman 2C 8 4 50.0% 4 46.9% 45 683 3 31.3% 14 306 4 11 3 44 Sitka 2C 1,330 1,040 78.2% 596 44.8% 2,940 64,152 230 17.3% 563 9,485 255 721 334 2,572 Skagway 2C 51 47 92.2% 23 45.9% 56 1,531 14 27.0% 37 485 0 0 1 1 Tenakee Springs 2C 58 47 81.0% 31 53.0% 198 3,298 21 35.5% 77 1,025 2 2 14 74 Thorne Bay 2C 118 97 82.2% 53 45.1% 339 8,743 44 37.3% 351 3,510 13 51 24 148 Ward Cove 2C 2 Whale Pass 2C 17 14 82.4% 11 67.2% 79 3,213 7 40.3% 7 204 1 2 2 41 Wrangell 2C 382 301 78.8% 210 54.9% 1,533 28,083 101 26.4% 289 5,805 11 26 30 184
Subtotal, Area 2C 4,222 3,324 78.7% 2,016 47.8% 12,576 247,633 1,053 24.9% 3,751 60,002 430 1,206 683 4,989 Akhiok 3A 6 5 83.3% 2 40.0% 19 193 2 40.0% 4 101 0 0 0 0 Chenega Bay 3A 8 8 100.0% 6 75.0% 89 1,225 3 37.5% 25 305 2 20 4 72 Chiniak 3A 7 5 71.4% 7 100.0% 62 519 4 60.0% 18 470 0 0 0 0 Cordova 3A 416 318 76.4% 188 45.2% 1,032 18,008 89 21.4% 169 2,913 5 8 31 154 Karluk 3A 6 6 100.0% 4 66.7% 35 497 0 0.0% 0 0 0 0 0 0 Kodiak 3A 1,360 978 71.9% 696 51.2% 6,088 110,362 483 35.5% 2,382 43,133 91 275 134 1,085 Nanwalek 3A 5 Old Harbor 3A 5 Ouzinkie 3A 16 10 62.5% 14 84.4% 84 896 5 28.1% 12 153 0 0 0 0 Port Graham 3A 5 Port Lions 3A 17 14 82.4% 10 61.1% 120 1,442 10 61.1% 69 1,128 0 0 0 0 Seldovia 3A 126 101 80.2% 77 61.2% 1,108 14,360 40 31.4% 274 3,969 5 35 16 167 Tatitlek 3A 11 8 72.7% 8 75.0% 56 1,261 6 50.0% 33 727 0 0 4 30 Yakutat 3A 72 49 68.1% 28 39.0% 382 8,188 15 20.3% 88 1,243 11 42 6 76
Subtotal, Area 3A 2,060 1,514 73.5% 1,050 51.0% 9,395 162,647 658 31.9% 3,077 54,200 117 400 197 1,615 Chignik 3B 1
- continued -
DRAFT

165
Appendix E-7.–Page 5 of 6.
Rural community Regulatory
area
Return rate Subsistence fished halibut
Subsistence halibut harvest Sport fished halibut Sport halibut harvest Lingcod bycatch Rockfish bycatch
SHARCs issueda
Surveys returned
Percent of SHARCs
Estimated number
respondents
Percent of
SHARCs
Estimated number
fish
Estimated number pounds
Estimated number
respondents
Percent of
SHARCs
Estimated number
fish
Estimated number pounds
Estimated number
respondents
Estimated number
fish
Estimated number
respondents
Estimated number
fish Cold Bay 3B 33 27 81.8% 20 59.2% 270 3,811 12 37.2% 21 527 3 64 0 0 False Pass 3B 2 King Cove 3B 19 18 94.7% 10 52.6% 78 1,471 4 21.1% 10 225 0 0 0 0 Sand Point 3B 6 2 33.3% 2 33.3% 42 490 2 33.3% 0 0 0 0 2 40
Subtotal, Area 3B 61 49 80.3% 33 53.3% 394 5,842 18 29.9% 31 752 3 64 2 40 Unalaska 4A 114 83 72.8% 46 40.8% 499 8,412 40 34.9% 225 4,019 1 4 4 23
Subtotal, Area 4A 114 83 72.8% 46 40.8% 499 8,412 40 34.9% 225 4,019 1 4 4 23 Adak 4B 8 5 62.5% 5 60.0% 16 554 2 20.0% 0 0 2 3 2 40
Subtotal, Area 4B 8 5 62.5% 5 60.0% 16 554 2 20.0% 0 0 2 3 2 40 St. George Island 4C 1 St. Paul Island 4C 1
Subtotal, Area 4C 2 Savoonga 4D 1
Subtotal, Area 4D 1 Bethel 4E 1 Chevak 4E 1 Dillingham 4E 21 16 76.2% 1 6.3% 0 0 1 6.3% 3 59 0 0 0 0 Egegik 4E 1 King Salmon 4E 3 Kotlik 4E 1 Koyuk 4E 1 Manokotak 4E 2 Naknek 4E 3 Nightmute 4E 1 Nome 4E 13 8 61.5% 8 57.7% 35 704 0 0.0% 0 0 0 0 0 0 Port Heiden 4E 1 Togiak 4E 2
Subtotal, Area 4E 51 34 66.7% 11 21.2% 134 1,771 2 4.5% 9 83 1 2 1 5 Rural community subtotal 6,519 5,011 76.9% 3,162 48.5% 23,014 426,873 1,774 27.2% 7,113 119,266 554 1,680 888 6,712
- continued -
DRAFT

166
Appendix E-7.–Page 6 of 6.
Rural community Regulatory
area
Return rate Subsistence fished halibut
Subsistence halibut harvest Sport fished halibut Sport halibut harvest Lingcod bycatch Rockfish bycatch
SHARCs issueda
Surveys returned
Percent of SHARCs
Estimated number
respondents
Percent of
SHARCs
Estimated number
fish
Estimated number pounds
Estimated number
respondents
Percent of
SHARCs
Estimated number
fish
Estimated number pounds
Estimated number
respondents
Estimated number
fish
Estimated number
respondents
Estimated number
fish Tribal name subtotal All 3,425 2,043 59.6% 1,232 36.0% 14,079 260,118 457 13.4% 1,614 26,908 142 567 273 2,857 Rural community subtotal All 6,519 5,011 76.9% 3,162 48.5% 23,014 426,873 1,774 27.2% 7,113 119,266 554 1,680 888 6,712
Total All 9,944 7,054 70.9% 4,394 44.2% 37,093 686,991 2,231 22.4% 8,727 146,174 696 2,247 1,161 9,568 a. To protect confidentiality, data for tribes and communities with 5 or fewer SHARCs issued are not reported in this table. Subtotals include all tribes and communities. Blank cells indicate redacted data.
DRAFT
Appendix F.–Comparison of mean harvests per respondent and participation rates by response category, 2005–2012.
Project staff explored the possibility of nonresponse bias for the mailed surveys in 2012 by reviewing average reported harvests in usable pounds per respondent for each of the 3 mailings. Also reviewed was the average number of respondents per mailing who reported that they participated in the subsistence fishery in 2012.
For survey respondents overall (6,620 responded by mail), average harvests did not differ significantly between mailings (Appendix Table F-1; Appendix Figure F-1). On average, respondents to the first mailing averaged harvests of 73.3 lb (±3.2), respondents to the second mailing averaged 65.2 lb (±7.2), and average harvests for respondents to the third mailing were 60.3 lb (±11.9). Thus, no evidence supported different harvests based on response category. The same relationships were found for respondents from Area 2C (4,223 respondents by mail) and 3A (1,998 respondents), which, together, account for 94.0% of mailed survey responses in 2012. Response patterns for Area 3B (185 responses) showed a notably lower harvest rate for responses to the third mailing. In Area 4 (189 responses by mail), harvest rates declined over the 3 mailings, with a significant difference between the average for the first and third mailings.
In 2012, a similar but not identical pattern occurred based on the percentage of respondents that reported participation in the subsistence fishery (Appendix Table F-2; Appendix Figure F-2). The average was 49% (±1.0%) for respondents for the first mailing, and dropped significantly to 45% (±2.0%) for respondents to the second mailing. However, 42% (±4.0) of respondents to the third mailing participated in the fishery, a rate that was not significantly different from the set of respondents to the second mailing. Virtually the same pattern occurred for respondents from Area 2C. In Area 3A, Area 3B, and Area 4, there were no significant differences in participation rates for the 3 sets of respondents, although there was a notable drop in fishery participation for the respondents to the third mailing in Area 3B and Area 4. Thus the analysis did not uncover strong evidence that later respondents to the survey were less likely to participate in the subsistence halibut fishery than those who responded to earlier mailings.
Based on these findings, project staff made no adjustments to data analysis. Because there was little evidence for lower harvest rates or fishery participation for later respondents to the mailed surveys, non-respondents (except for the few exceptions discussed in Chapter 1) were assigned mean values for their tribe or rural residence for estimating total harvests and participation rates.
Appendix Figure F-3 shows results for study years 2005 to 2012 for average harvests by response category, with all SHARC holders from all regulatory areas combined. Three mailings took place for 2005–2008, and 2011-2012. Except for 2006 and 2011, no significant differences were found between the mean harvests for respondents to each mailing. In 2006, average harvests for respondents to the second and third mailings were significantly lower than those for the first mailing, but were not different from each other. In 2011, average harvests for the second mailing were significantly lower than those for the first, but the average for respondents for the third mailing increased and was not significantly different from those for either of the other mailings. In 2009 and 2010 just 2 mailings occurred. In 2009, mean harvests for respondents for the second mailing were significantly lower than the mean for the first mailing. In 2010, there were no significant differences in harvest levels reported by respondents to the first mailing compared to the results for respondents to the second mailing.
Appendix Figure F-4 shows results for study years 2005 to 2012 for percentage of respondents who participated in the subsistence fishery by response category, with SHARC holders from all regulatory areas combined. From 2005 to 2008 and again in 2012, there was a small but significant drop in the percentage of respondents who participated in the fishery from the first set of responses compared to the second and third set, but no meaningful difference between the second and third sets. In 2011,
167
DRAFT
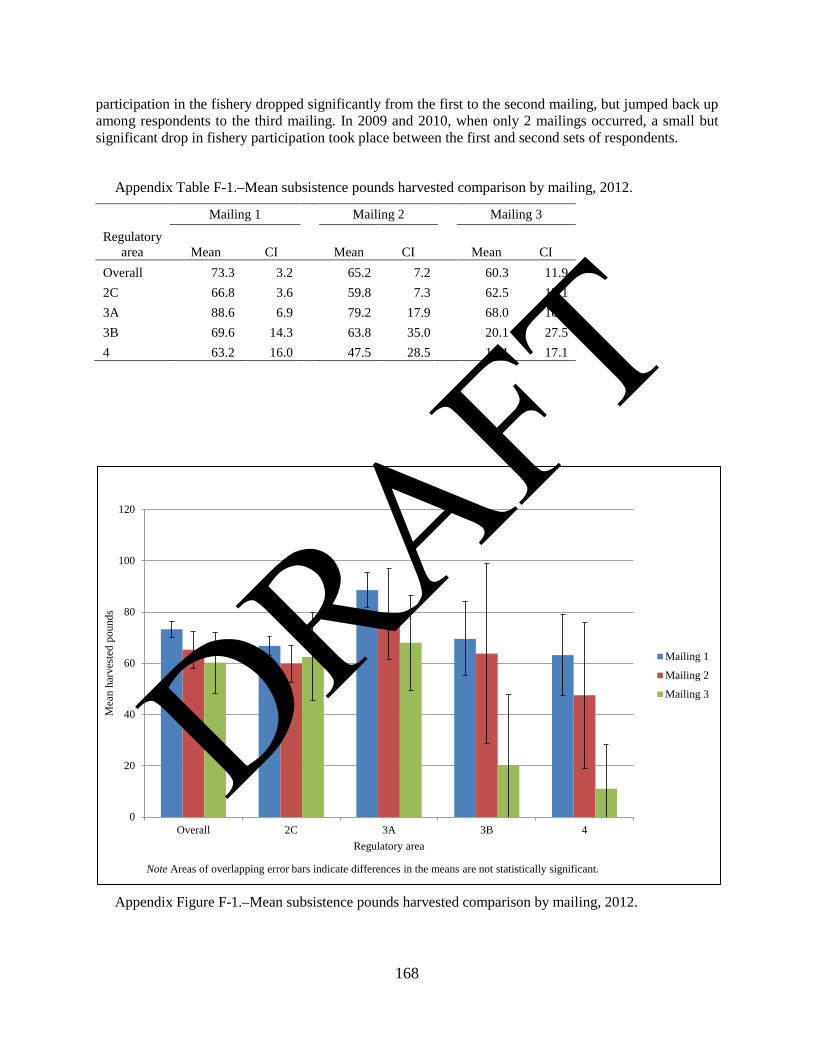
participation in the fishery dropped significantly from the first to the second mailing, but jumped back up among respondents to the third mailing. In 2009 and 2010, when only 2 mailings occurred, a small but significant drop in fishery participation took place between the first and second sets of respondents.
Appendix Table F-1.–Mean subsistence pounds harvested comparison by mailing, 2012.
Regulatory area
Mailing 1
Mailing 2
Mailing 3
Mean CI Mean CI Mean CI Overall 73.3 3.2
65.2 7.2
60.3 11.9
2C 66.8 3.6
59.8 7.3
62.5 17.1 3A 88.6 6.9
79.2 17.9
68.0 18.5
3B 69.6 14.3
63.8 35.0
20.1 27.5 4 63.2 16.0 47.5 28.5 11.1 17.1
Appendix Figure F-1.–Mean subsistence pounds harvested comparison by mailing, 2012.
0
20
40
60
80
100
120
Overall 2C 3A 3B 4
Mea
n ha
rves
ted
poun
ds
Regulatory area
Mailing 1
Mailing 2
Mailing 3
Note Areas of overlapping error bars indicate differences in the means are not statistically significant.
168
DRAFT
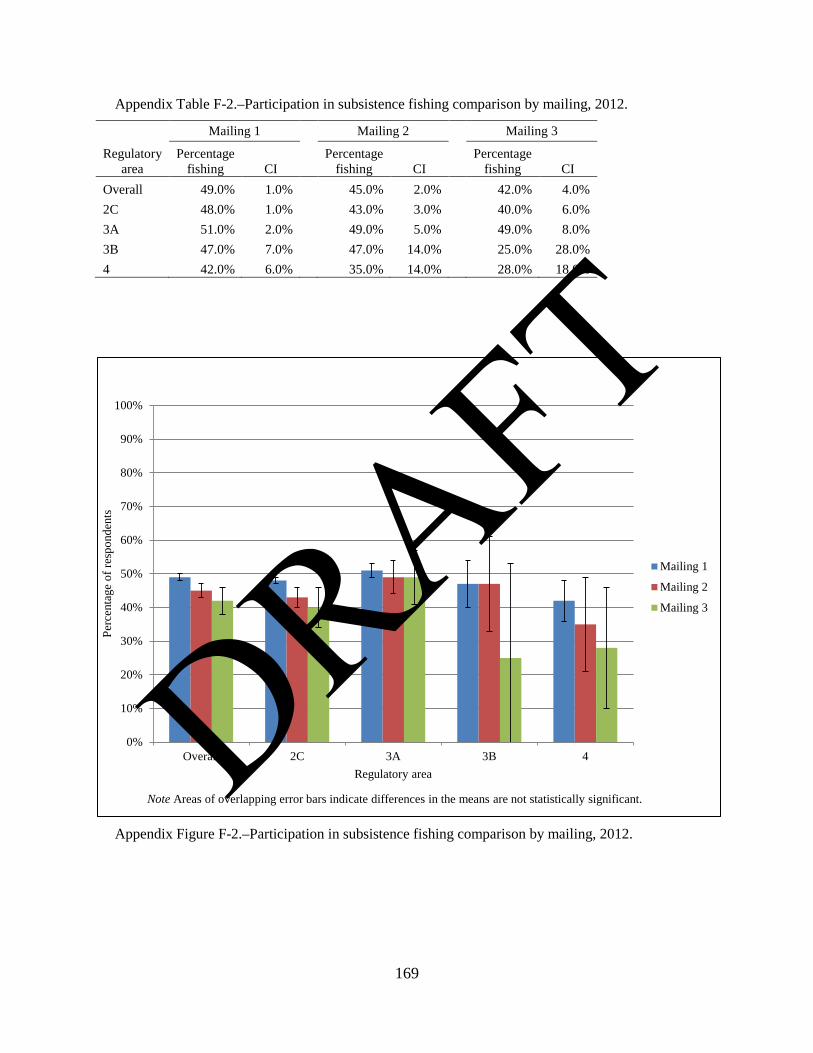
Appendix Table F-2.–Participation in subsistence fishing comparison by mailing, 2012.
Regulatory area
Mailing 1
Mailing 2
Mailing 3
Percentage fishing CI
Percentage fishing CI
Percentage fishing CI
Overall 49.0% 1.0%
45.0% 2.0%
42.0% 4.0% 2C 48.0% 1.0%
43.0% 3.0%
40.0% 6.0%
3A 51.0% 2.0%
49.0% 5.0%
49.0% 8.0% 3B 47.0% 7.0%
47.0% 14.0%
25.0% 28.0%
4 42.0% 6.0% 35.0% 14.0% 28.0% 18.0%
Appendix Figure F-2.–Participation in subsistence fishing comparison by mailing, 2012.
0%
10%
20%
30%
40%
50%
60%
70%
80%
90%
100%
Overall 2C 3A 3B 4
Perc
enta
ge o
f res
pond
ents
Regulatory area
Mailing 1
Mailing 2
Mailing 3
Note Areas of overlapping error bars indicate differences in the means are not statistically significant.
169
DRAFT

Appendix Figure F-3.–Mean subsistence harvest of halibut, pounds net weight, by response category,
2005–2012.
Appendix Figure F-4.–Percentage of respondents who participated in the subsistence halibut fishery
by response category, 2005–2012.
0
20
40
60
80
100
120
140
2005 2006 2007 2008 2009 2010 2011 2012
Ave
rage
har
vest
ed p
ound
sMailing 1 Mailing 2 Mailing 3
Note Areas of overlapping error bars indicate differences in the means are not statistically significant.
0%
10%
20%
30%
40%
50%
60%
70%
80%
90%
100%
2005 2006 2007 2008 2009 2010 2011 2012
Perc
enta
ge o
f res
pond
ents
Mailing 1 Mailing 2 Mailing 3
Note Areas of overlapping error bars indicate differences in the means are not statistically significant.
170
DRAFT

Appendix G.–Project findings summary.
171
DRAFT
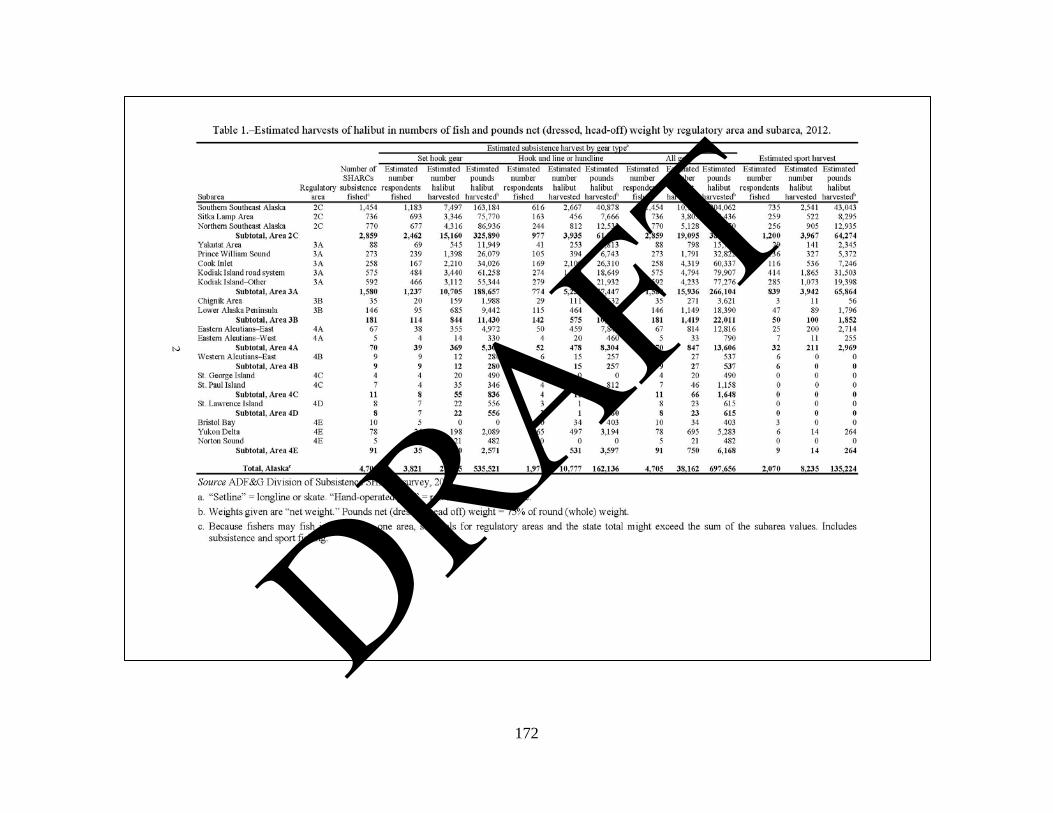
172
DRAFT

173
DRAFT

174
DRAFT