subsistence harvests of pacific halibut - alaska
TRANSCRIPT

SUBSISTENCE HARVESTS OF PACIFIC HALIBUT IN ALASKA, 2003
by
James A. Fall, Madel Kerlin, Bridget Easley, and Robert J. Walker
Technical Paper No. 288
Division of Subsistence Alaska Department of Fish and Game
333 Raspberry Road Anchorage, Alaska 99518
Preparation of this report was supported through a contract between the Alaska Department of Fish and Game and the National Marine Fisheries Service.
Division of Subsistence Alaska Department of Fish and Game
PO Box 25526 Juneau, Alaska 99802-5526
December 2004
The Alaska Department of Fish and Game conducts all programs and activities free from discrimination on the basis of sex, color, race, religion, national origin, age, marital status, pregnancy, parenthood, or disability. For information on alternative formats available for this and other department publications, please contact the department ADA Coordinator at (voice) 907-465-4120, (TDD) 1-800-478-3648 or (FAX) 907-586-6595. Any person who believes s/he has been discriminated against should write to: ADF&G, P.O. Box 25526, Juneau, Alaska 99802-5526; or O.E.O., U.S. Department of the Interior, Washington, D.C. 20240.

ABSTRACT This report presents findings of a study designed to estimate the subsistence harvest of Pacific halibut (Hippoglossus stenolepis) in Alaska in 2003. The Division of Subsistence of the Alaska Department of Fish and Game conducted the study under contract to the National Marine Fisheries Service (NMFS). In May 2003, NMFS published final federal regulations implementing a subsistence halibut fishery in Alaska for qualified individuals who are residents of 117 rural communities or members of 123 Alaska Native tribes with traditional uses of halibut. Subsistence fishers are required to obtain a subsistence halibut registration certificate (SHARC) from NMFS before fishing. A one-page survey form was mailed to 11,635 SHARC holders in early 2004, with two follow-up mailings. Household visits supplemented the mailings in selected communities. In total, 7,593 surveys were returned, a sampling rate of 65.3 percent. Participation in the survey was voluntary. According to the study findings, an estimated 4,942 individuals subsistence fished for halibut in 2003. The estimated subsistence halibut harvest was 43,926 fish for 1,041,330 pounds (+/- 3.9 percent) net weight. (“Net weight” is 75 percent of “round” or live weight.) Of this total, 752,858 pounds (72.3 percent) were harvested with setline (fixed) gear (longlines or skates) and 288,474 pounds (27.7 percent) were harvested with hand-operated gear (rod and reel or handline). Of those subsistence fishers using setline gear, the most (43.1 percent) usually fished with 30 hooks, the maximum number allowed by regulation. Subsistence fishers also harvested an estimated 14,870 rockfish (Sebastes spp) and 3,298 lingcod (Ophiodon elongatus) in 2003 while fishing for halibut. The largest subsistence halibut harvest in 2003 occurred in Halibut Regulatory Area 2C (southeast Alaska), 627,959 pounds net weight, for 60.3 percent of the statewide total. Harvests for the other regulatory areas, in descending order, were as follows: Area 3A (southcentral Alaska), 279,613 pounds (26.9 percent); Area 4E (east Bering Sea coast), 54,458 pounds (5.2 percent); Area 3B (Alaska Peninsula), 27,613 pounds (2.7 percent); Area 4C (Pribilof Islands), 23,756 pounds (2.3 percent); Area 4A (east Aleutian Islands), 20,727 pounds (2.0 percent); Area 4D (central Bering Sea), 4,380 pounds (0.4 percent); and Area 4B (western Aleutian Islands), 2,472 pounds (0.2 percent). Preliminary data from the International Pacific Halibut Commission indicate that 83.065 million pounds (net weight) of halibut were removed from Alaskan waters in 2003. Of this total, the subsistence harvest accounted for 1.3 percent. Commercial harvests took 73.0 percent of the halibut, followed by bycatch in other commercial fisheries (14.5 percent), sport harvests (9.2 percent), and wastage in the commercial fishery (2.0 percent). This was the first study to estimate the subsistence halibut harvest in Alaska for a single year. Also, 2003 was the first year for the new subsistence halibut regulations. Therefore, it is not possible to compare the statewide harvest estimate for 2003 with estimates developed with similar methods and under similar conditions for previous years. Changes in the magnitude of the Alaska subsistence halibut harvest resulting from the new regulations cannot be demonstrated using the results of the SHARC survey for 2003, given the limitations of the earlier harvest estimates. Subsistence harvest estimates for 2003 for many of the larger communities such as

Sitka, Petersburg, and Kodiak for 2003 are not markedly different from earlier estimates based on household surveys. The report concludes that the study’s estimate of about one million pounds is a reliable estimate of subsistence harvests of halibut in Alaska for 2003. It recommends that the research be continued for at least two more years in order to develop a time series for assessment of trends in the fishery and to further assess the study results for 2003.

TABLE OF CONTENTS List of Tables ................................................................................................................................ iii List of Figures ................................................................................................................................ iv List of Acronyms Used in the Report ..............................................................................................v Acknowledgements........................................................................................................................ vi Chapter One: Background and Methods.........................................................................................1 Background..........................................................................................................................1 Project Objectives ................................................................................................................1 Data Collection Methods .....................................................................................................2 Public Outreach........................................................................................................2 Mailed Household Survey........................................................................................2 Community Visits ....................................................................................................4 Sample Achievement ...........................................................................................................6 Data Analysis .......................................................................................................................7 Data Entry ................................................................................................................7 Analysis: Development of Harvest Estimates.........................................................7 Products..................................................................................................................10 Chapter Two: Findings .................................................................................................................11 Subsistence Halibut Harvests in 2003................................................................................11 Estimated Number of Subsistence Halibut Fishers................................................11 Estimated Alaska Subsistence Halibut Harvests by Regulatory Area ...................12 Subsistence Harvests by Gear Type.......................................................................13 Number of Hooks Fished with Setline Gear ..........................................................13 Subsistence Halibut Harvests by Place of Residence ............................................13 Average Net Weights of Subsistence Halibut........................................................14 Harvest Locations ..................................................................................................14 Sport Harvests of Halibut by SHARC Holders......................................................15 Rockfish Harvests ..............................................................................................................15 Lingcod Harvests ...............................................................................................................16 Chapter Three: Discussion............................................................................................................19 Comparisons with Other Harvest Estimates ......................................................................19 Community Case Studies...................................................................................................22 Sitka .......................................................................................................................23 Petersburg ..............................................................................................................23 Cordova..................................................................................................................24 Port Graham...........................................................................................................25 Kodiak City and Road System...............................................................................26 Unalaska/Dutch Harbor .........................................................................................26 Toksook Bay ..........................................................................................................27 Tununak .................................................................................................................28 Comparisons with Non-Subsistence Harvests in 2003 ......................................................28
i

Chapter Four: Conclusions and Recommendations......................................................................29 Summary and Conclusions ................................................................................................29 Recommendations..............................................................................................................30 References Cited ............................................................................................................................33 Report Tables ................................................................................................................................37 Report Figures ................................................................................................................................59 Appendix A: List of Eligible Tribes and Rural Communities.................................................. A-1 Appendix B: Letter to Tribes.................................................................................................... A-7 Appendix C: News Release .................................................................................................... A-11 Appendix D: Newspaper Notice............................................................................................. A-15 Appendix E: Survey Form...................................................................................................... A-19 Appendix F Survey Instructions ........................................................................................... A-23 Appendix G Balsiger Letter................................................................................................... A-27 Appendix H Frequently Asked Questions ............................................................................. A-31 Appendix I Project findings summary ................................................................................. A-37 Appendix J: Appendix Tables ............................................................................................... A-43
ii

LIST OF TABLES Table 1. Population of Rural Communities Eligible to Participate in the Alaska Subsistence Halibut Fishery, 2000.........................................................38 Table 2. Project Chronology ......................................................................................................41 Table 3. Sample Achievement, Alaska Subsistence Halibut Survey for 2003 ..........................42 Table 4. Estimated Alaska Subsistence Harvests of Halibut by SHARC Type, Regulatory Area, and Gear Type, 2003 .......................................................................46 Table 5. Age of Subsistence Halibut Registration Certificate Holders by SHARC Type, 2003................................................................................................47 Table 6. Number of Hooks Usually Fished, Setline (Fixed) Gear, Alaska Subsistence Halibut Fishery, 2003...................................................................48 Table 7. Average Net Weight of Subsistence and Sport Harvested Halibut, 2003, by Regulatory Area ......................................................................................................49 Table 8. Estimated Alaska Subsistence Harvests of Halibut by Halibut Regulatory Area and Subarea, 2003........................................................................................................50 Table 9. Estimated Sport Harvests of Halibut by SHARC Type and Halibut Regulatory Area, 2003 ....................................................................................51 Table 10. Estimated Incidental Harvests of Lingcod and Rockfish by SHARC Type and Halibut Regulatory Area, 2003 .............................................................................52 Table 11. Estimated Harvests of Lingcod and Rockfish by SHARC Holders while Subsistence Fishing for Halibut, by Geographic Area, 2003.......................................53 Table 12. Comparison of “Subsistence” Halibut Harvest Estimates by Regulatory Area, Pounds Net Weight..........................................................................54 Table 13. Estimated Harvests of Halibut by Gear Type and Participation in the Subsistence and Sport Fisheries, Selected Alaska Communities, 2003.......................55 Table 14. Estimated Harvests of Halibut for Home Use, Sitka ...................................................56 Table 15. Estimated Harvests of Halibut for Home Use, Petersburg ..........................................56 Table 16. Estimated Harvests of Halibut for Home Use, Cordova..............................................57 Table 17. Estimated Harvests of Halibut for Home Use, Port Graham.......................................57 Table 18. Estimated Harvests of Halibut for Home Use, Kodiak Road System..........................58 Table 19. Halibut Removals in Alaska by Regulatory Area, 2003..............................................58 Appendix Tables Table A-1 Results from Returned Surveys by Tribe and Rural Community, 2003 ................. A-45 Table A-2 Reported Harvests of Halibut in Number of Fish by Return Category, 2003......... A-49 Table A-3 Estimated Alaska Subsistence Harvests of Halibut by Tribe and Rural Community, by Gear Type and Regulatory Area in Number of Fish and Pounds Net Weight, 2003 ...................................................... A-52 Table A-4 Estimated Subsistence and Sport Harvests of Halibut and Harvests of Lingcod and Rockfish by Place of Residence, 2003 .......................................... A-57 Table A-5 Estimated Alaska Subsistence Harvests of Halibut by Gear Type and Place of Residence, 2003 ................................................................................. A-60 Table A-6 Estimated Number of SHARC Holders Who Either Subsistence or Sport Fished, 2003 .................................................................................................. A-64
iii

LIST OF FIGURES Figure 1. Regulatory Areas for the Pacific Halibut Fishery........................................................60 Figure 2. Return Rates for Subsistence Halibut Surveys by SHARC Type, 2003......................61 Figure 3. Subsistence Halibut Harvest Survey Return Rates, Communities and Tribes
with More than 100 SHARCs Issued, 2003.................................................................61 Figure 4. Number of Survey Responses by Response Category.................................................62 Figure 5. Age of Subsistence Halibut Registration Certificate Holders by SHARC Type, 2003................................................................................................62 Figure 6. Estimated Number of Subsistence Halibut Fishers in Alaska, 2003, by Regulatory Area ......................................................................................................63 Figure 7. Estimated Subsistence Harvest of Halibut in Alaska, 2003, by Regulatory Area, in Pounds Net Weight ........................................................................................63 Figure 8. Percentage of Subsistence Halibut Harvest by Regulatory Area, 2003.......................64 Figure 9. Percentage of Rural Community Subsistence Halibut Harvest by Community, 2003 64 Figure 10. Percentage of Tribal Subsistence Halibut Harvest by Tribe, 2003..............................65 Figure 11. Average Subsistence Harvest of Halibut per Fisher in Alaska, 2003, by Regulatory Area, in Pounds Net Weight.......................................................65 Figure 12. Average Subsistence Harvest of Halibut per Fisher in Alaska, 2003, by Regulatory Area, in Number of Fish.............................................................66 Figure 13. Percentage of Subsistence Halibut Harvest by Gear Type by Regulatory Area, 2003 ............................................................................................66 Figure 14. Number of Hooks Usually Fished, Percentage of Fishers Using Setline (Fixed) Gear, Alaska Subsistence Halibut Fishery, 2003................................67 Figure 15. Alaska Subsistence Halibut Harvests by Place of Residence, 2003 ............................67 Figure 16. Alaska Subsistence Halibut Harvests by Geographic Area, 2003 ...............................68 Figure 17. Percentage of Alaska Subsistence Halibut Harvest by Geographic Area, 2003..........68 Figure 18. Estimated Incidental Harvest of Rockfish in the Alaska Subsistence Halibut Fishery, 2003, by Regulatory Area .................................................................69 Figure 19. Percentage of Incidental Harvest of Rockfish by Regulatory Area, 2003...................69 Figure 20. Estimated Incidental Harvest of Lingcod in the Alaska Subsistence Halibut Fishery, 2003, by Regulatory Area .................................................................70 Figure 21. Percentage of Incidental Harvest of Lingcod by Regulatory Area, 2003 ....................70 Figure 22. Comparison of Subsistence Halibut Harvest Estimates by Regulatory Area, 2000 and 2003 .................................................................................71 Figure 23. Percentage of Estimated Subsistence Halibut Harvests by Regulatory Area, 2000 and 2003 .................................................................................71 Figure 24. Estimated Harvests of Halibut for Home Use, Port Graham.......................................72 Figure 25. Halibut Removals, Alaska, 2003 .................................................................................73 Figure 26. Halibut Removals in Alaska by Regulatory Area and Removal Category, 2003........73
iv

LIST OF ACRONYMS USED IN THE REPORT ADF&G Alaska Department of Fish and Game ANHSC Alaska Native Harbor Seal Commission ANSHWG Alaska Native Subsistence Halibut Working Group BOF Alaska Board of Fisheries CDQ Community Development Quota CPDB Community Profile Database (of the Division of Subsistence) EVOS Exxon Valdez Oil Spill IPHC International Pacific Halibut Commission LAMP Local area management plan NMFS National Marine Fisheries Service NPFMC North Pacific Fishery Management Council RAM Restricted Access Management Office, NMFS SHARC Subsistence Halibut Registration Certificate
v

ACKNOWLEGEMENTS First and foremost, we thank the thousands of individuals who took the time to respond to the mailed survey form. This report would not be possible without their cooperation. Staff within the National Marine Fisheries Service (NMFS) who facilitated the contract that funded this project and who otherwise provided project support included Jay Ginter, Alfred “Bubba” Cook, and Patsy Bearden. Staff within the Restricted Access Management program of NMFS (RAM) administered the subsistence halibut registration certificate (SHARC) program and helped provide information to the public about the research. We thank Phil Smith, Jessica Gharrett, Tom Fletcher, Toni Fratzki, Robin Martin, Tracy Buck, Geri Reetz, Amberly Lail, Allen Butner, Marie Wilson, Terry Smith, Brian Brown, Kristie Balovich, and Clydina Bailey. We gratefully acknowledge the input and support of the Alaska Native Subsistence Halibut Working Group. We also thank the many tribal governments that granted approvals for the several survey projects with which the subsistence halibut research was coordinated, and the local research assistants who helped with these projects. Especially, we thank the Sitka Tribe of Alaska (Ms Robie Craig and Doug Dobyns) and the Hydaburg Cooperative Association (Anthony Christianson) for assisting with administering surveys in their communities. In addition to the co-authors of this report, other Division of Subsistence staff who assisted with research, data management, and report preparation included Erin Baldwin Gagnon, Mike Turek, Matt Kookesh, Mathew Brock, Brian Davis, Davin Holen, Pippa Coiley Kenner, Lisa Scarbrough, Bill Simeone, Ron Stanek, Liz Williams, Molly Chythlook, Ted Krieg, Mike Koskey, Jim Simon, and Jesse Dizard. We thank the following individuals for reading drafts of this final report and providing comments and suggestions: Bruce Leaman, Heather Gilroy, and Gregg Williams (staff to the International Pacific Halibut Commission); Scott Meyer (Division of Sport Fish, ADF&G); Doug Woodby and Victoria O’Connell (Division of Commercial Fisheries, ADF&G); and Ken Pitcher (Division of Wildlife Conservation, ADF&G). The authors are of course responsible for any errors or deficiencies that the report may still contain.
vi

CHAPTER ONE: BACKGROUND AND METHODS
BACKGROUND The primary goal of this project was to estimate the subsistence harvest of Pacific halibut (Hippoglossus stenolepis) in Alaska in 2003 through a survey mailed to registered subsistence halibut fishers and supplemented by a limited number of face-to-face interviews in selected communities. The project was conducted by the Division of Subsistence of the Alaska Department of Fish and Game (ADF&G) through a contract with the National Marine Fisheries Service (NMFS) (Contract No. 50ABNF-02-RP-0107; ADF&G No. IHP-03-029). As noted by Wolfe (2002) and described in Environmental Assessment/Regulatory Impact Review/Initial Regulatory Flexibility Analysis for a Regulatory Amendment for Defining a Halibut Subsistence Fishery Category (an “EA/RIR”) by NPFMC, ADF&G, IPHC, and NMFS, August 11, 2000 (NMFS 2000), subsistence halibut fisheries are local, non-commercial, customary and traditional food fisheries in Alaska’s coastal areas. The EA/RIR summarizes information about the subsistence halibut fishery in Alaska. This background information is not repeated here. Figure 1 illustrates halibut regulatory areas in Alaska. In May 2003, the National Marine Fisheries Service, Alaska Region, published final federal regulations implementing a subsistence halibut fishery for qualified individuals in the waters in and off Alaska (50 CFR Parts 300, 600, and 679). In total, residents of 117 rural communities and members of 123 Alaska Native tribes are eligible to participate in the fishery. (See Appendix A for a list of eligible tribes and communities as they appear in the federal register.) Subsistence halibut fishers are required to obtain a Subsistence Halibut Registration Certificate (SHARC) from the Restricted Access Management Program (RAM) office of NMFS prior to fishing. These federal regulations (50 CFR Part 300.65(h)(4)) authorize periodic surveys of holders of SHARCs to estimate annual subsistence harvests and related catch and effort information. The regulation states that, “Responding to a subsistence halibut harvest survey will be voluntary.” The total population of eligible rural communities and tribes was estimated at approximately 90,000 (Wolfe 2001), although Wolfe (2002) also estimated the number of potential subsistence halibut fishers at about 9,300. Table 1 provides population estimates for the eligible rural communities for 2000 based on the federal decennial census. The total population of these communities in 2000 was 81,193, of which 37,816 were Alaska Natives. In addition, the non-rural places of Juneau and Ketchikan in 2000 had Alaska Native populations of 5,084 and 2,689, respectively, most of whom were eligible to participate in the subsistence halibut program through their tribal membership. Also, an unknown number of eligible tribal members lived in other non-rural places such as Anchorage and the Kenai Peninsula Borough. Thus the estimate of about 90,000 eligible individuals continues to appear reasonable.
PROJECT OBJECTIVES The primary goal of the project was to estimate the subsistence harvest of halibut in Alaska in the calendar year 2003. Objectives included:
1

1. An expanded list of subsistence halibut fishers (and SHARC holders), to serve as the basis for the mailed survey and household interviews in the study year and in subsequent years.
2. An estimate of the subsistence harvest of halibut in Alaska in 2003 by community, tribe, and IPHC regulatory area, along with an estimate of the number of individuals who subsistence fished for halibut in 2003.1
3. An estimate of the number of lingcod (Ophiodon elongatus) and rockfish (genus Sebastes) taken by subsistence fishers while fishing for halibut.
DATA COLLECTION METHODS
Public Outreach Division of Subsistence personnel, working in coordination with NMFS, tribes, and the Alaska Native Subsistence Halibut Working Group (ANSHWG), contacted communities and tribes in November 2003 to encourage enrollment of subsistence halibut fishers in the registration certificate system and to provide background on the harvest assessment program. (Appendix B is a copy of the letter sent to all eligible tribes.) In January 2004, announcements were made through the media (local newspapers and radio stations) about the upcoming mailing of halibut survey forms to SHARC holders. (Appendix C is a copy of the news release. Appendix D is a copy of an announcement that ran in the following Alaska newspapers in late January 2004: Kodiak Daily Mirror, Bristol Bay Times [Dillingham], the Dutch Harbor Fisherman, the Tundra Drums [Bethel], the Cordova Times, the Sitka Sentinel, the Ketchikan Daily News, the Petersburg Pilot, and the Chilkat Valley News [Haines]). Information was also available on the NMFS web site for subsistence halibut fishing in Alaska (http://www.fakr.noaa.gov/ram/subsistence/halibut.htm). Mailed Household Survey This was the first year of a harvest assessment program for the subsistence halibut fishery in Alaska. Because the subsistence halibut regulations only came into effect in May 2003, this first year of collecting harvest data should be viewed as a trial run and exploratory. It was expected that harvest estimates for some communities and tribes would be incomplete, based upon relatively low response rates or incomplete registration of halibut fishers with NMFS. Subsequent years will build upon the lessons learned in this first year and benefit from outreach efforts to improve response rates in subsequent years. (See recommendations in Chapter Four.) As recommended by Wolfe (2002), the methodology was based upon the registration system for all subsistence halibut fishers, which requires fishers to obtain a SHARC before fishing. All SHARC holders as of December 31, 2003 were surveyed with a mailed, retrospective recall survey covering a 12-month harvest period in calendar year 2003.
1 It should be noted that the survey documented subsistence halibut harvests and sport fishing for halibut by SHARC holders for a full calendar year (2003). For the full year, subsistence halibut fishing was allowed under state regulations outside nonsubsistence areas using a hand held line with no more than two hooks attached, with a two fish per day bag limit. The survey documented subsistence halibut harvests for only a partial year, from May 15 through December 31, 2003, that took place under the new federal subsistence fishing regulations.
2
The survey form was based on that which appears in Wolfe (2002) as Appendix A, with slight modifications such as study year and return address. (See Appendix E in this report.) Wolfe (2002: 15-18) provided justification for the kinds of data to be collected, which included name and address of the fisher; halibut harvests in numbers and pounds round (whole) weight by gear type in 2003; number of hooks usually set; and harvests of lingcod and rockfish taken while subsistence fishing for halibut. A question addressing the water body fished (primary location) was added at the recommendation of NMFS staff. The form was designed to reduce the potential double counting of halibut taken with rod and reel gear in both the subsistence survey and the Sport Angler Survey conducted by the Department of Fish and Game, Division of Sport Fish (Wolfe 2002:19) by asking respondents to distinguish between their subsistence and sport harvests with this gear type. The form received approval from the federal Office of Management and Budget as required under the Paperwork Reduction Act (Approval Number 0648-0486). A short explanatory letter with instructions on the back for completing the form was included in the mailings (Appendix F). Also included was a letter from NMFS regional administrator James Balsiger explaining the background for the survey (Appendix G). The form was designed so that it could be directly mailed to the Division of Subsistence, postage paid. Presently, under International Pacific Halibut Commission (IPHC) regulations, Community Development Quota (CDQ) fishers may retain halibut under 32 inches (“shorts”) while commercial CDQ fishing in Areas 4D and 4E only. These regulations require the CDQ organization to report this harvest to the IPHC. To avoid double counting, subsistence fishers were instructed not to include these fish on their subsistence halibut survey forms. During the meeting of the ANSHWG on October 9, 2003, community representatives expressed concern that not all fishers would know what fish are to be included under the category “rockfish” for the incidental harvest question on the survey form. This could lead to an overestimation of this harvest if fishers reported fish such as Pacific cod or sculpins in response to this question. The instructions mailed with the survey provided guidance on this question, and incorporated local English and/or Alaska Native language names when known.2 The first mailing of the survey form to 11,635 SHARC holders took place on February 11, 2004. Table 2 provides a chronology of key activities during the project. In addition to the initial mail-out of the survey form, there were two more mailings of the form to nonrespondents: the second mailing, to 8,263 SHARC holders, occurred on March 8, and the third mailing, to 5,484 SHARC holders, occurred on April 9, 2004. The Division of Subsistence set up a dedicated e-mail address that recipients of the mailed survey could use if they had questions about how to respond. Also, the RAM Program set up a 1-800 number (1-800-304-4846) to provide information about the subsistence halibut program,
2 The principal investigators for this study are aware that more than 30 species of rockfish inhabit Alaska waters. (See Alaska Administrative Code 5 AAC 39.975 for definitions of management assemblages of rockfishes. See also Meyer [2000:6].) The goal of the first year of this study was to keep the questions about incidental harvests simple. As discussed in the recommendations section (see Chapter Four), if more precise harvest data for various rockfish are needed for particular areas, future research should be designed and funded to address these data needs.
3

including the harvest assessment program. Both the e-mail address and 1-800 phone number appeared on the survey form. A set of “frequently asked questions” and responses was developed by ADF&G and NMFS staff to guide staff responses to phone calls and e-mail inquiries about how to fill out the survey form (Appendix H). Community Visits Because the response rate to the mailed survey was uncertain and was expected to vary by community and tribe, the mailings were supplemented in selected communities with face-to-face household surveys conducted by Division of Subsistence staff or local research assistants. The latter were hired through subcontracts with tribes or Alaska Native regional organizations. Because of the large number of eligible communities and tribes, it was not possible to conduct face-to-face surveys in most communities. Therefore, communities and tribes were divided into four categories based upon the potential need and opportunity to conduct household surveys in order to augment the mailed survey returns.
A. Category A Communities: Coordination with Other Fieldwork
Communities in this category were already part of other Division of Subsistence harvest assessment survey projects that entailed household visits and face-to-face interviewing. Collection of information about subsistence halibut harvests became part of these interviews. As noted above, all SHARC holders were mailed survey forms, including those living in communities where household surveys were planned. These individuals received the mailed forms before these community visits took place. A.1. EVOS Update Project. The Division of Subsistence, in partnership with the Chugach Regional Resources Commission, the Kodiak Area Native Association, and the Bristol Bay Native Association, conducted a comprehensive household harvest survey in 15 communities in early 2004 as part of an Exxon Valdez Oil Spill (EVOS) Trustee Council-funded project to update information about subsistence uses and harvests in the EVOS area. These were Akhiok, Chenega Bay, Chignik, Chignik Lagoon, Chignik Lake, Cordova, Karluk, Larsen Bay, Nanwalek, Old Harbor, Ouzinkie, Perryville, Port Graham, Port Lions, and Tatitlek. The Trustee Council approved this project in November 2003. Except for Cordova, where a stratified random design was used, the project attempted to census all households in these communities. Fieldwork commenced in mid February 2004. In these EVOS study communities, harvest and use information for halibut was collected as part of the face-to-face survey. At the completion of the survey, the respondent was asked if household members who fished for halibut received and returned a mailed survey form. If they said that they had already returned the forms, they were not interviewed again. If they had not returned the forms, the interviewer, with the consent of the persons being interviewed, used the earlier household-level responses to the EVOS survey to assist the respondent to fill out the halibut survey form for each person in the household who obtained a SHARC in 2003. In a few cases, persons interviewed for the EVOS project indicated a subsistence harvest of halibut but had not obtained a SHARC. These individuals were encouraged to enroll, and in some cases
4

staff assisted them in completing a SHARC application at the completion of the EVOS interview. These harvests are not included in the estimates presented in this report. In a few cases (48 SHARC holders), SHARC surveys were not received in the mail from individuals who after the EVOS survey had said they had mailed them. Project staff completed a SHARC survey for these individuals based on their EVOS survey responses. These harvests are included in the estimates in this report. A. 2. Marine Mammal Harvest Surveys. Through a contract with the Alaska Native Harbor Seal Commission (ANHSC), the Division of Subsistence and the ANHSC conduct annual household surveys in approximately 60 communities to collect harbor seal and sea lion harvest data from Alaska Native subsistence hunters. For the 2003 study year, most of these interviews took place in late January, February, and March 2004. In many of the study communities (especially in Southeast Alaska), only known marine mammal hunters are interviewed, but in others (primarily the smaller communities), the goal is to interview all Alaska Native households.3 For communities in the latter category (Akutan, Alegnagik, Atka, False Pass, Nikolski, Saint George, Egegik, Levelock, Pilot Point, Port Heiden, South Naknek, and Twin Hills, and some smaller Southeast Alaska communities), the plan was for local research assistants to contact all households in the community (Alaska Native and others) to determine if household members harvested halibut in 2003 and if so, if they obtained a SHARC. In practice, few individuals other than marine mammal hunters and members of Alaska Native households were contacted. Individuals who said they had obtained a SHARC, and who had also received and returned the mailed survey, were not interviewed about their halibut harvests. If individuals who had obtained a SHARC indicated that the survey was not received or returned, they, with their consent, were to be interviewed using the survey form. In larger communities, and those Southeast Alaska communities where marine mammal surveys are only conducted with hunters, respondents were asked about their involvement in halibut fishing, following the procedure just described.
B. Category B Communities: Plan to Conduct Interviews This category included selected communities for which SHARC registrations appeared unexpectedly low or unexpectedly high, or for which prior data on subsistence halibut harvests were lacking, making it difficult to evaluate the mailed survey returns. This included Gambell, Savoonga, Toksook Bay, Tununak, Sitka, and Hydaburg. Sitka was included in this category because prior studies suggested that residents of this community account for a very large portion of the total Alaska subsistence halibut harvests and a good estimate for this community was important for success of the project overall. Also, the Sitka Tribe was an experienced and interested partner for the project. Because of the large number of SHARCs issued in Sitka and Hydaburg, tribal staff reviewed the lists of SHARC holders and attempted to contact those which they believed fished for halibut. Contacts were primarily face-to-face. In Gambell and Savoonga, a large sampling fraction of SHARC holders was achievable without selecting a random sample. 3 For a description of this project, including a complete list of study communities and sampling goals, see Wolfe et al. 2003.
5

In Toksook Bay, the number of SHARCs issued (533) appeared to approximate the community’s total population. Therefore, Division of Subsistence staff member Mike Koskey visited the community in March and April 2004. He consulted with tribal leaders and determined that there are about 90 to 100 active halibut fishers in Toksook Bay, but only about a third to one-half fish in a particular year. Most of these fishers returned SHARC surveys through the mail or were interviewed by Koskey in Toksook Bay. Koskey also visited Tununak in April 2004. Although residents of this community harvest halibut for subsistence purposes (Scott et al. 2001), no one in the community had obtained a SHARC in 2003. The goal of the community visit was to identify subsistence fishers, encourage them to obtain SHARCs, and conduct harvest interviews. However, the Tununak Traditional Elders’ Council did not grant approval for the research, and therefore no interviewing took place.
C. Category C Communities: Evaluate for Possible Interviewing Division staff assessed response rates by community and tribe after the second mailing. The plan was to travel to selected communities to administer the surveys and enroll fishers. It was determined that this was unnecessary in most communities because they were already covered in Categories A and B, above, or had high response rates and SHARC enrollments. An exception was Unalaska/Dutch Harbor, where SHARC enrollments appeared lower than expected (see Chapter Three). Although the Division offered to contract with the Qawalingin Tribe in Unalaska, the tribe could not locate anyone who was interested in contacting and surveying local households. Therefore no supplemental interviewing took place in Unalaska.
D. Category D Communities: Plan to rely on mail-out response only Category D included most eligible communities and about half of the SHARC holders. These communities were either too large to consider for face-to-face interviewing (such as Ketchikan, Petersburg, and Wrangell) or were unlikely to harvest a large portion of the statewide total subsistence harvest based on the results of previous surveys or because of their relatively small population In Chapter Four, there are recommendations regarding communities in which outreach and/or in-person interviewing should be considered for subsequent study years.
SAMPLE ACHIEVEMENT
Table 3 reports sample achievement by tribe and rural community. Overall, 7,593 surveys were returned, a response rate of 65.3 percent (Fig. 2). For the 117 eligible rural communities, 4,697 of 6,057 surveys were returned (77.5 percent). As shown in Figure 3, there were nine communities with more than 100 SHARC holders, accounting in total for 79.3 percent of all SHARCs issued in rural communities. Return rates were approximately 70 percent or better in all nine of these communities. Of the 5,578 individual tribal members who obtained SHARCs in 2003, 2,896 (51.9 percent) returned surveys. As shown in Figure 3, there were 14 tribes with more than 100 members who obtained SHARCs. Return rates for these 14 tribes varied widely, from 83.9 percent in Hydaburg (where a contract between the Division of Subsistence and Hydaburg Cooperative
6

Association [the tribal governing body] facilitated survey returns) to 16.7 percent in St. Paul (where no outreach efforts took place other than the initial letter to the tribal government). In total, these 14 tribes accounted for 71.5 percent of all Tribal SHARCs. Figure 4 illustrates the survey return rate by response category. After the first mailing, 3,830 surveys were returned, for a response rate of 32.9 percent. Responses to the second mailing added 2,160 surveys, a total response rate of 51.5 percent. Responses to the third and final mailing added 1,211 surveys, for a total response to the mailout of 7,201 surveys, 61.9 percent of the 11,635 surveys initially mailed. In addition, surveys administered by staff, either ADF&G personnel or representatives of tribal organizations under contract to ADF&G, added 392 surveys. Most of these were in Hydaburg, Savoonga, Toksook Bay, and Sitka. This brought the total response to 7,593 surveys, 65.3 percent of all SHARC holders through December 31, 2003.
DATA ANALYSIS Data Entry All returned survey forms were reviewed for completeness prior to data entry. Responses were coded following standardized codebook conventions used by Division of Subsistence. Staff within the Information Management Section of the division set up database structures within an MS SQL Server at ADF&G in Anchorage to hold the survey data. The database structures included rules, constraints, and referential integrity to insure that data were entered completely and accurately. Data entry screens were available on a secure Internet site. Daily incremental backups of the database occurred, and transaction logs were backed up hourly. Full backups of the database occurred twice weekly. This ensured that no more than one hour of data entry would be lost in the unlikely event of a catastrophic failure. Survey responses were manually entered twice, and survey forms were electronically scanned. All data were compared programmatically for inconsistent data entry. Double data entry ensured a more accurate transfer of information from the coded survey forms into the database, and is a standard practice with data processing for the Division of Subsistence. Data did not pass to the processing phase until inconsistencies between the twice-entered data set were eliminated. The scanned survey forms also facilitated efficient data correction and editing. Information was processed and analyzed using MS SQL programming. Initial processing included the performance of standardized logic checks of the data. Logic checks are often needed in complex data sets where rules, constraints, and referential integrity do not capture all of the possible inconsistencies that may appear. Analysis: Development of Harvest Estimates Analysis included review of raw data frequencies, cross tabulations, table generation, and estimates of population parameters. Missing information was dealt with situationally. The Division of Subsistence has standard practices for dealing with missing information, such as minimal value substitution or use of an average response for similarly characterized households
7

or communities. Typically, missing data are an uncommon, randomly occurring phenomenon in household surveys conducted by the division, as was the case in this project. In the EVOS surveys, halibut harvest data were only collected in pounds. Therefore, pounds of fish derived from individual EVOS household surveys were divided by average weights of fish from the SHARC returns from their community or tribe to determine number of fish for these SHARC holders. In general, subsistence halibut harvest estimates were calculated based upon the application of weighted means (Cochran 1977). These calculations are standard methods for extrapolating sampled data. In this study, each tribe and rural community was a separate stratum for purposes of estimating total harvests. In most cases, the mean for returned SHARC surveys was applied to the total number of SHARCs issued for the tribe or community to calculate the estimated harvest. (See Appendix Table A-1 for the reported harvests for each tribe and community.) The formula for standard expansion of community harvests is:
iii ShH =
where i
ii n
hh = (mean harvest per returned survey)
Hi = the total harvest (numbers of fish or pounds) for tribe or community i, hi = the total harvest reported in returned surveys ni = the number of returned surveys, and Si = the number of SHARCs issued. Rounding to two significant digits also occurs at every stage of the operation. There were two exceptions. As discussed above, 533 SHARCs were issued to members of the Native Village of Toksook Bay, most of whom do not fish for halibut. Expanding the reported harvest based on in-person interviews and mailed survey returns (109 returns, or 20.5 percent of all SHARCs issued) would result in a large overestimate of the subsistence halibut harvest for the community. Therefore, the reported harvest is the estimated harvest for Toksook Bay. Second, 170 SHARCs were issued to eligible tribal members living outside of Alaska. Less than half of the mailed surveys were returned from this group, and only four of these returned surveys indicated any fishing activity. Rather than assign the mean value for their tribe (which would likely result in an overestimate of the harvest), all non-returned surveys for SHARC holders with out-of-state addresses were coded as “did not fish.” It should also be noted that not every individual who obtained a SHARC as a tribal member resided in the community where his or her tribe’s headquarters is located. Therefore, the sum of harvest estimates for tribal SHARC holders and rural resident SHARC holders does not necessarily equal the halibut harvest for particular communities. Rather, an additional analysis was necessary to estimate harvests by community of residence that assigned tribal SHARC
8

holders to a community based on their mailing addresses. Appendix Tables A-4, A-5, and A-6 report study results by place of residence of the SHARC holders. As an interim step in the data analysis, the standard deviation (SD) (or Variance [V], which is the SD squared) was also calculated with the raw, unexpanded data. The Standard Error (SE), or SD of the mean, was also calculated for each community or tribe. It is also important to note the relative precision of the mean, or the likelihood an unknown value falls within a certain distance from the mean. In this study, the relative precision of the mean is shown in the tables as a confidence interval (CI), expressed as a percent. Once the standard error was calculated, the CI was determined by multiplying the SE by a constant that reflected the level of significance desired, based on a normal distribution. The constant for 95 percent confidence intervals is 1.96. Though there are numerous ways to express the formula below, it contains the components of a SD, V, and SE. Relative Precision of the Mean (CI%):
sample standard deviation =s sample size =n population size =N
=t 2αStudent’s t statistic for alpha level (α=.95) with n-1 degrees of freedom.
Project staff explored the possibility of non-response bias for returned mail out surveys and its effect on harvest estimates. However, it was determined that responses to the survey, including harvest levels and involvement in the fishery, were not significantly different between any of the response categories (responses to the first mail out, the second mail out, the third mail out, and staff administered surveys) (see Appendix Table A-2). As noted above, survey respondents provided harvest estimates in pounds round (whole, live) weight. For ease of comparison with estimates of halibut removals in other fisheries, we have converted these estimates to pounds net (dressed, head off) weight, where (0.75) (round weight) = net weight.4
4 The factor of 0.75 for converting halibut round weight to net weight is the standard used by the International Pacific Halibut Commission and the Division of Sport Fish of ADF&G. Division of Subsistence studies, as reported in the Technical Paper Series and the Community Profile Database (Scott et. al 2001), generally use a factor of .72 for converting halibut round weights to net weights, based on Crapo et al (1993:7), who report that on average, the weight of a dressed halibut with the head removed is 72 percent of the round weight, with a range of 68 percent to 80 percent. In Division reports, “net” weight (dressed, head off) is usually referred to as “usable weight.”
9
Products A presentation with an update on survey progress was provided to the ANSHWG on May 6, 2004 in Anchorage and at a joint meeting of the NPFMC and Alaska Board of Fisheries (BOF) in Anchorage on March 30, 2004. The public review draft of the final report was completed in mid September 2004 and circulated for review and comments. Presentations of study findings and recommendations took place at the October 2004 meeting of the NPFMC and the ANSHWG in Sitka, Alaska; and at a meeting of the BOF in Anchorage in November 2004. The final report was revised in consideration of comments and suggestions received from reviewers of the public review draft and those received during the NPFMC and ANSHWG meetings. In addition to the final report, a short findings summary was prepared (Appendix I). The summary was sent to tribal government representatives and other interested individuals and groups. This report and the project summary were posted on the Division of Subsistence web site and the RAM website in PDF format for downloading and printing by the public.
10

CHAPTER TWO: FINDINGS
SUBSISTENCE HALIBUT HARVESTS IN 2003 Estimated Number of Subsistence Halibut Fishers Of the 11,635 individuals who obtained SHARCs in 2003, an estimated 4,942 (42.5 percent) subsistence fished for halibut in 2003 (Table 4). Of the 5,578 individuals who obtained SHARCs as members of an eligible tribe, an estimated 1,836 subsistence fished for halibut (32.9 percent). Of the 6,057 individuals who obtained SHARCs as residents of qualifying rural communities, an estimated 3,106 (51.3 percent) subsistence fished for halibut in 2003. Demography may account for the difference between tribal SHARC holders and rural SHARC holders regarding participation in the fishery. As shown in Table 5 and illustrated in Figure 5, 17.5 percent of tribal SHARC holders were younger than 20 years of age, compared to 7.3 percent of rural SHARC holders. This may reflect a policy on the part of some eligible tribes to register all or most tribal members, including younger people who were less likely to subsistence fish than adults. For example, 533 members of the Native Village of Toksook Bay obtained SHARCs; of these, 44.2 percent were younger than 20 years of age (Table 5). As illustrated in Figure 6 (see also Table 4), the largest number of Alaska subsistence halibut fishers in 2003 were from tribes and rural communities in Regulatory Area 2C (Southeast Alaska), 3,082 (62.4 percent). There were 1,185 halibut fishers (24.0 percent) from tribes and communities in Regulatory Area 3A (Southcentral Alaska) and 304 (6.2 percent) from Regulatory Area 4E (East Bering Sea Coast) tribes and communities. Additionally, there were 371 (7.5 percent) halibut fishers who were members of tribes and residents of communities in the five other regulatory areas. Tribes with the most subsistence halibut fishers in 2003 included the Central Council of Tlingit and Haida Indians (166 subsistence halibut fishers), the Sitka Tribe of Alaska (132), the Ketchikan Indian Corporation (127), the Metlakatla Indian Community (111), the Pribilof Islands Aleut Community of St. Paul (88), Hoonah Indian Association (71), and the Shoonaq’ Tribe of Kodiak (71). Of the SHARC holders who registered as residents of eligible rural communities, the most subsistence fishers lived in Sitka (679) followed by Kodiak (569), Petersburg (368), Haines (234), Wrangell (189), and Craig (141). Appendix Table A-3 provides details for each tribe and community regarding participation in the subsistence fishery and subsistence halibut harvests in 2003. As noted above, not every tribal SHARC holder lives in his or her tribe’s headquarters community. After assigning tribal members to a community based on their place of residence, an estimate of participation in the subsistence halibut fishery in 2003 by community can be obtained. Appendix Table A-4 provides study findings based on place of residence. Communities with 100 or more SHARC holders who participated in the subsistence halibut fishery in 2003 were Sitka (821), Kodiak (646), Petersburg (415), Haines (269), Wrangell (223), Craig (210), Ketchikan (187), Hoonah (138), Metlakatla (121), Cordova (102), and Klawock (101).
11

Estimated Alaska Subsistence Halibut Harvests in 2003 by Regulatory Area Table 4 reports estimated Alaska subsistence halibut harvests for 2003 by SHARC type, regulatory area, and gear type. The total estimated subsistence halibut harvest in Alaska in 2003 was 43,926 fish (+/- 3.6 percent) for 1,041,330 pounds (+/- 3.9 percent) net weight.5 As estimated in pounds net weight, 60.3 percent of the subsistence halibut harvest (627,959 pounds [+/- 5.5%]) was taken by fishers registered with tribes or rural communities in Regulatory Area 2C (Fig. 7, Fig 8). Fishers from Area 3A tribes and rural communities harvested 279,613 pounds (+/- 5.0 percent) (26.9 percent). Harvests totaled 54,458 pounds (+/- 14.2 percent) (5.2 percent) for communities and tribes in Regulatory Area 4E.6 Tribes and communities in the remaining five regulatory areas harvested 79,300 pounds (7.6 percent). As shown in Figure 9, 12 rural communities accounted for 83.5 percent of the subsistence halibut harvest by the holders of rural SHARCs in 2003. These communities accounted for 83.6 percent of the rural SHARCs. Residents of the remaining 105 communities harvested 16.5 percent of the total. Residents of 65 eligible rural communities harvested subsistence halibut in 2003. In two others, SHARC holders fished, but had no harvest. In 13 others, individuals obtained SHARCs but no one fished. No one in the remaining 35 eligible rural communities obtained a SHARC in 2003. Most of these communities (30) were in Regulatory Area 4E (East Bering Sea Coast). As also shown in Figure 9, rural SHARC holders from two communities accounted for just under half the total harvest by this group: Kodiak (23.6 percent) and Sitka (22.2 percent). Adding Petersburg, the next highest rural community harvest at 8.8 percent, the top three rural communities accounted for 54.6 percent of the rural community (non-tribal) subsistence halibut harvest in Alaska in 2003. As shown in Figure 10, members of 12 tribes accounted for 70.5 percent of the total subsistence halibut harvest by tribal SHARC holders in 2003. These 12 tribes accounted for 64.8 percent of the tribal SHARCs (3,613 of 5,578). Members of the remaining 111 tribes harvested 29.5 percent of the total. Members of 74 Alaska tribes harvested subsistence halibut in 2003. In three others, SHARC holders fished but had no subsistence harvest. In 15 others, tribal members obtained SHARCs, but no one fished. No one in the remaining 31 eligible tribes obtained a SHARC in 2003. Most of these tribes (28) were in Regulatory Area 4E (East Bering Sea Coast). Figure 11 illustrates the average subsistence halibut harvest in pounds net weight for those SHARC holders who subsistence fished in 2003. Figure 12 illustrates the average harvest per fisher in number of halibut. For the state overall, the average subsistence halibut fisher harvested 211 pounds net weight or about 8.9 halibut in 2003. Average harvests per fisher at the
5 This approximates 1,388,440 pounds round (live or whole) weight. 6 Community Development Quota (CDQ) organizations operating exclusively in Areas 4D and 4E may retain sublegal halibut (less than 32 inches) from their commercial catches for home use. In 2003, a total of 14,341 pounds net weight of halibut was retained by three organizations: Coastal Villages Regional Fund (5,034 pounds), Bristol Bay Economic Development Corporation (6,346 pounds), and Norton Sound Economic Development Corporation (2,961 pounds) (Williams 2004b). In the past, the IPHC has included these fish within the “personal use” removal category, a category that also includes subsistence harvests (Williams 2004c:57). See also the section in Chapter Three, “Comparisons with Non-Subsistence Harvests.”
12

regulatory area level ranged from 168 pounds net weight in Area 4D to 236 pounds per fisher in Area 3A. Subsistence Harvests by Gear Type Table 4 reports the estimated subsistence harvests of halibut in Alaska in 2003 by gear type and regulatory area. In total, 752,858 pounds (72.3 percent) of halibut (net weight) were harvested using setline (fixed) gear (longlines or skates) and 288,474 pounds (27.7 percent) were harvested using handlines or lines attached to a rod or pole (hand-operated gear). There were notable differences between regulatory areas (Table 4, Fig. 13). Harvests using setline (fixed) gear predominated in Area 4D (89.9 percent of the total subsistence harvest), 2C (85.8 percent), 3A (60.0 percent), and 4B (59.9 percent). In contrast, hand-operated gear accounted for most of the subsistence halibut harvests in Area 4E (80.8 percent) and 4A (68.8 percent). Harvests were more evenly split between setline (fixed) gear and hand-operated gear in Area 3B (45.4 percent with setline gear, 54.6 percent with hand-operated gear) and Area 4C (49.2 percent with setline gear, 50.8 percent with hand-operated gear). Number of Hooks Fished with Setline Gear Respondents who fished with setline (fixed) gear (longline or skate) were asked to report how many hooks they “usually set.” The findings by regulatory area are reported in Table 6. For the fishery overall, most setline fishers (43.1 percent) used 30 hooks, the maximum number allowed by regulation (Figure 14). The next most frequently reported number was 20 hooks, usually used by 20.2 percent of the fishers who used setline gear. Ten hooks (8.4 percent) ranked third, followed by 15 hooks (7.0 percent) and 25 hooks (6.8 percent). Thirty was the most frequently used number of hooks with setline gear in seven of the eight regulatory areas (Table 6): 4C (Pribilof Islands), 45.8 percent; 2C (Southeast Alaska), 46.3 percent; 3B (Alaska Peninsula), 39.5 percent; 4D (Central Bering Sea), 36.0 percent; 4E (East Bering Sea Coast), 38.0 percent; 4A (Eastern Aleutian Islands), 34.4 percent; and 3A (Southcentral Alaska), 33.6 percent). In Area 4B (Western Aleutians), 36.1 percent of fishers who used set hook gear used one hook and 20.8 percent used 15 hooks. Setting a single hook was also frequent in Area 4E (30.4 percent), Area 4C (26.6 percent), and Area 3B (23.8 percent). Subsistence Halibut Harvests by Place of Residence As shown in Figure 15, there were 29 Alaska communities whose residents had combined estimated subsistence halibut harvests of more than 7,000 pounds net weight (over 10,000 pounds round weight) in 2003. In this figure, community totals include harvests of all SHARC holders living in the community, regardless of type of SHARC (tribal or rural) or tribal affiliation. Residents of these communities accounted for 88.4 percent of the total Alaska subsistence halibut harvest in 2003. Residents of Sitka accounted for 16.8 percent of the total harvest and Kodiak (Kodiak includes Kodiak city and other portions of the Kodiak Island Borough connected to it by roads) ranked second with 14.7 percent. With 8,835 and 12,973 residents, respectively, these two communities included about 26.9 of the population of rural communities eligible to participate in the subsistence fishery. There were 67 other Alaska
13

communities with at least one resident who participated in the subsistence halibut fishery in 2003. The total harvest for these other communities represented 11.6 percent of the state total. A total of 170 SHARC holders provided out of state addresses, including 115 communities in 27 states.7 Seattle was the non-Alaska community with the most SHARC holders, with nine. Only 5.1 percent of non-Alaska resident SHARC holders (an estimated five individuals) subsistence fished for halibut in 2003, with an estimated total harvest of 5 fish and 122 pounds net weight. Average Net Weights of Subsistence Halibut Table 7 reports the average net weight of subsistence and sport-caught halibut by SHARC holders in 2003. (See below for further discussion of sport harvests of halibut by SHARC holders.) For the state, the average net weight of subsistence caught halibut was 23.7 pounds and the average net weight of sport-harvested halibut by SHARC holders was 22.8 pounds. For all halibut harvested by SHARC holders in 2003, the average net weight per harvested halibut was 23.5 pounds. There was not a great deal of difference between regulatory areas in average weight per halibut, with two exceptions. The halibut harvested by the two communities of Area 4D (the Saint Lawrence Island communities of Savoonga and Gambell), averaged 58.4 pounds per fish, more than twice the statewide average. In Area 4E, halibut averaged 15.2 pounds net weight, about a third lower than the statewide average. Harvest Locations Survey respondents were asked to report the “water body, bay, or sound usually fished” for subsistence halibut in 2003. In Table 8, estimated subsistence halibut harvests are reported for the eight Alaska halibut regulatory areas and 21 subdivisions within these areas. It should be noted that regulatory area totals in Table 8 differ slightly from those reported in Table 4 because not all SHARC holders fished within the regulatory area in which their tribal headquarters or residence is located. These differences are very minor, however. The three geographic subareas with the largest subsistence halibut harvests in 2003 were all in Regulatory Area 2C, Southeast Alaska: southern Southeast Alaska (290,441 pounds net weight; 27 percent of the state total); the Sitka Local Area Management Plan (LAMP) area (173,322 pounds; 17 percent); and the remainder of northern Southeast Alaska (159,771 pounds; 15 percent) as shown in Table 8, Figure 16, and Figure 17. Waters bordering the Kodiak Island road system (including Chiniak Bay) ranked fourth, with a subsistence halibut harvest of 114,027 pounds (11 percent), followed by the remainder of the Kodiak Island area (79,255 pounds; 8 percent). Combined, Bristol Bay and the Yukon/Kuskokwim Delta area contributed about 5 percent of the state harvest. Harvests within Cook Inlet waters accounted for 5 percent of the state total (52,609 pounds) and those within Prince William Sound added 28,409 pounds (3 percent of the statewide total). All other areas (Yakutat Area, Chignik Area, Alaska Peninsula, Aleutian Islands, Pribilof Islands, Saint Lawrence Island, and Norton Sound) accounted for the remaining 9 percent of the statewide subsistence halibut harvest in 2003.
7 Note that members of eligible tribes could obtain SHARCs regardless of their place of residence.
14
Sport Harvests of Halibut by SHARC Holders Survey respondents were asked to report the number of halibut and pounds of halibut they harvested “while sport fishing during 2003.” They were instructed not to include fish they included as part of their subsistence harvests as sport caught. The goal of this question was to avoid double-counting harvested halibut in this survey and in the statewide survey of sport fishers administered by ADF&G’s Division of Sport Fish. Answering this question required respondents to classify their hand-operated gear (hook and line and hook and rod) harvests as either subsistence or sport; these gear types are legal gear for both sport fishing and subsistence fishing. Fish reported in the survey as “sport harvests” are not included in the estimated subsistence harvests discussed above. If SHARC holders also received the sport fish survey for 2003, they would be expected to report the same number of halibut as sport-caught as in their response in the SHARC survey and not include any halibut they reported as subsistence harvests, even if taken with rod and reel or handheld line with two or less hooks. Note that the study findings do not represent the total recreational halibut harvest by residents of eligible communities and tribes in 2003, because individuals from these tribes and communities who did not obtain SHARCs could have sport fished. As shown in Table 9, the estimated total sport halibut harvest by holders of SHARCs in 2003 was 10,784 fish and 245,947 pounds net weight. Of the total harvest, most was taken by SHARC holders from Area 2C (Southeast Alaska) (111,502 pounds; 45.3 percent) and Area 3A (southcentral Alaska) (103,804 pounds; 42.2 percent). In total, an estimated 2,580 SHARC holders (22.2 percent) reported that they sport fished for halibut in 2003. A very large majority of these fishers were from either Area 2C (1,591; 61.7 percent) or Area 3A (853; 33.1 percent). The study did not investigate the criteria by which survey respondents classified their rod and reel halibut harvests as subsistence or sport. One possibility is that respondents viewed their rod and reel halibut harvests prior to May 15, 2003 (when the new regulations allowing rod and reel as a subsistence gear came into effect) as sport-caught, and as subsistence harvests after that date or after they obtained their SHARC. If so, in future years these respondents may classify more or all of their halibut harvest in the subsistence category. Also, most tribal SHARC holders who live in nonrural places are required by the regulations to subsistence fish for halibut only “in his or her area of tribal membership” (50 CFR 300.65(g)(4)(ii)). Tribal members who halibut fished in other locations (for example, a SHARC holder who is a member of the Sitka Tribe living in Anchorage and halibut fishing in Cook Inlet) would need to abide by sport fishing regulations and report any harvests from these locations as sport-caught on the SHARC survey.
ROCKFISH HARVESTS Survey respondents were asked to estimate the number of rockfish they harvested while subsistence fishing for halibut. Harvest data at the species level were not collected as part of this survey. Note that these survey results do not represent an estimate for the total subsistence rockfish harvest by SHARC holders because they might have harvested rockfish while fishing for species other than halibut, and other fishers in the communities who did not obtain SHARCs might have
15

fished for or harvested rockfish. The Division of Subsistence Community Profile Database (Scott et al. 2001) includes estimates of rockfish harvests for communities in which comprehensive household surveys have been administered. It should also be noted that the label “bycatch” for these harvests is misleading.8 Rockfish are used for subsistence purposes in rural communities throughout their range in Alaska. It is highly likely that rockfish harvested incidentally in the subsistence halibut fishery are utilized as a subsistence food. It is highly unlikely that many incidentally caught rockfish are discarded in this subsistence fishery. As shown in Table 10, the statewide estimated rockfish incidental harvest in the subsistence halibut fishery in 2003 was 14,870 fish by 1,239 fishers. This is an average of about 3 rockfish per fisher for all subsistence halibut fishers and about 12 rockfish per fisher for those who had a rockfish harvest. Most of the subsistence halibut fishers who caught rockfish lived in Area 2C (919 fishers; 74.2 percent) and Area 3A (245 fishers; 19.8 percent). Of all SHARC holders who subsistence fished for halibut in 2003, 25.1 percent harvested at least one rockfish while fishing. The highest percentage of subsistence halibut fishers who incidentally harvested rockfish was in Area 2C (Southeast Alaska), at 29.8 percent. As illustrated in Figure 18 and Figure 19, most of the incidental rockfish harvest was harvested by fishers from Area 2C tribes and communities: 9,967 rockfish, 67.0 percent of the statewide total. Area 3A tribes and communities accounted for the second-highest total: 3,498 rockfish, 23.5 percent of the total. Harvests were relatively small in the other regulatory areas, which combined harvested 1,405 rockfish, 9.4 percent of the statewide total. Table 11 reports the estimated incidental rockfish harvest in 2003 by SHARC holders by geographic subarea. Most of the harvest occurred in southern Southeast Alaska (4,366 fish), the Sitka LAMP area (4,355 rockfish), and northern Southeast Alaska (1,194 rockfish). Incidental rockfish harvests totaled 752 fish in Prince William Sound, 815 rockfish in Cook Inlet, 955 rockfish in Kodiak road system waters, and 833 rockfish in other Kodiak waters. In Aleutian Islands waters, there was an incidental harvest of 952 rockfish.
LINGCOD HARVESTS Survey respondents were asked to estimate the number of lingcod they harvested while subsistence fishing for halibut. Note that these survey results do not provide an estimate of the total subsistence lingcod harvest by SHARC holders because they might have harvested lingcod while fishing for species other than halibut. Also, other fishers in the communities who did not hold SHARCs might have fished for or harvested lingcod, so that these incidental harvests represent only a portion of the total harvest. The Division of Subsistence Community Profile 8 The Magnuson-Stevens Fishery Conservation and Management Act (Section 3) defines “bycatch” as “fish harvested in a fishery, but which are not sold or kept for personal use, and includes economic discards and regulatory discards. Such term does not include fish released alive under a recreational catch and release fishery management program.” Federal regulations (50 CFR 679.2) define bycatch or bycatch species as fish caught and released while targeting another species or caught and released while targeting the same species; under 50 CFR 600.10 discard means to release or return fish to the sea, whether or not such fish are brought fully on board a fishing vessel. In all cases, bycatch means to discard fish and excludes retaining fish for use.
16
Database (Scott et al. 2001) includes estimates of lingcod harvests for communities in which comprehensive household surveys have been administered. It should also be noted that the label “bycatch” for these harvests might be misleading.9 Lingcod are used for subsistence purposes throughout their range in rural Alaska. It is highly likely that lingcod harvested incidentally in the subsistence halibut fishery are utilized as a subsistence food. It is very unlikely that many lingcod caught in this subsistence fishery are discarded. The statewide estimated incidental lingcod harvest in the subsistence halibut fishery in 2003 was 3,298 fish by 699 fishers (Table 10). This is an average of about 0.7 lingcod per fisher for all subsistence halibut fishers and 4.7 lingcod per fisher for those who had a lingcod harvest. Of all SHARC holders who subsistence fished for halibut in 2003, 14.1 percent harvested at least one lingcod while halibut fishing. Most of the subsistence halibut fishers who harvested lingcod lived in Area 2C (Southeast Alaska) (452; 64.7 percent) and Area 3A (Southcentral Alaska) (160; 22.9 percent). As illustrated in Figure 20 and Figure 21, most of the incidental lingcod were harvested by fishers from Area 2C tribes and communities: 1,685 lingcod, 51.1 percent. Area 3A tribes and communities accounted for the second-highest total: 611 lingcod, 18.5 percent. Table 11 reports the incidental harvest of lingcod in 2003 by SHARC holders while they were subsistence fishing for halibut by geographic subarea. Most of this harvest occurred in Area 2C (southeast Alaska): the Sitka LAMP area (993 lingcod), southern Southeast Alaska (551 lingcod), and the remainder of northern Southeast Alaska (138 lingcod). Incidental lingcod harvests totaled 447 fish in the eastern Aleutian Islands (Area 4A). Harvests totaled less than 200 lingcod in each of the other geographic subareas.
9 See footnote 8 for definitions of bycatch.
17

18

CHAPTER THREE: DISCUSSION
COMPARISONS WITH OTHER HARVEST ESTIMATES Comparing the statewide harvest estimate for the Alaska subsistence halibut fishery for 2003 presented in this report with estimates for previous years is difficult for several reasons. As noted in Chapter One, regulations that allow subsistence halibut fishing in Alaska waters using traditional gear such as longlines with more than two hooks, and that removed the restrictive daily harvest limit of two fish, have only been in place since May 2003. Also, 2003 was the first year for which a study was implemented to develop a comprehensive estimate of subsistence halibut harvests in Alaska. Although the Division of Subsistence of ADF&G has conducted systematic household surveys in many of the rural Alaska communities with traditional uses of halibut, these studies pertain to differing harvest years. There are many communities, especially in western Alaska, where such surveys have not been conducted. Also, Division of Subsistence studies have attempted to estimate the total halibut harvest for home use in communities, including harvests conducted under sport fishing rules and harvests removed from commercial fisheries for home use. Typically, these studies collected harvests by gear type, such as rod and reel or “other gear.” Therefore, it is not possible to separate the “sport harvest” from the “subsistence harvest” for past harvest years, especially in the larger rural communities with a diverse population. In contrast, the statewide estimate of subsistence halibut harvests for 2003 based on the SHARC mailed survey includes only subsistence harvests by individuals who obtained SHARCs. The estimate does not include harvests accomplished under sport fishing regulations or halibut removed by commercial fishers for their households’ use or for noncommercial sharing. Thus it is only a partial estimate of the total harvest of halibut for home use by rural Alaska residents and is not directly comparable to previous estimates from Division of Subsistence studies. Despite these limitations, it is instructive to compare the 2003 estimate with previous attempts to estimate the annual statewide subsistence halibut harvest. For 2000, the IPHC estimated 439,000 pounds net weight for Alaska “personal use” (noncommercial, non-recreational) harvests (in Wolfe 2001). This represented about 0.5 percent of the total halibut removals in Alaska in that year. The IPHC estimate is based upon a methodology described by Trumble (1999). The estimate used household survey data collected by the Division of Subsistence, ADF&G (Scott et al. 2001), which, as noted above, do not distinguish between subsistence and sport harvests. The IPHC method assumed that 50 percent of Alaska Native rod and reel halibut harvests as reported in ADF&G household surveys are “sport” and 50 percent “personal use,” and that 75 percent of the non-native rod and reel harvests are “sport” and 25 percent “personal use” (Trumble 1999:62). No justification for these assumptions is provided, and changing these sport to personal use ratios can result in a very different estimate for the “personal use” halibut harvest. In a report to the Alaska Board of Fisheries in May 2001, using the same data source as the IPHC, Wolfe (2001) estimated that the subsistence halibut harvest in Alaska “probably ranges between 400,000 and 1,000,000 pounds (round weight) annually,” based on harvest data in the Division of Subsistence Community Profile Database (Scott et al. 2001). This is an estimated harvest of 300,000 to 750,000 pounds net weight. (Further discussion of data from Wolfe [2001] will be based on converting his data in round weights to net weights to facilitate comparisons.)
19

Wolfe calculated per capita halibut harvest estimates from these community studies pertaining to different years and then applied these values to the population of the communities in 2000 to estimate the harvest. For communities in which no harvest surveys had been done, he applied the per capita harvest value for a similar community in the regulatory area. Wolfe noted, as did the IPHC analysis, that subsistence harvest estimates based on CPDB data are affected by how harvests by gear type are classified, including rod and reel harvests and retention from commercial catches. As shown in Table 12, Wolfe estimated that Alaska rural residents and members of tribes with traditional uses of halibut harvested 1,078,486 pounds of halibut (net weight) in 2000. Of this, 739,546 pounds (63.3 percent) was harvested with rod and reel, 185,266 pounds (23.7 percent) with “other gear” (likely handline and longline); and 153,674 pounds (13.0 percent) were retained for home use by commercial fishers in these communities. Excluding the latter as not a subsistence harvest gives a total estimated harvest of 924,811 pounds net weight. Wolfe adjusted this estimate downward to his range of 300,000 to 750,000 pounds to account for rod and reel harvests in larger communities that might be better classified as sport harvests. As with the IHPC estimate, the separation of sport and subsistence harvests in Wolfe’s analysis is speculative. Two further limitations pertaining to Wolfe’s estimate are: 1) household surveys in Southeast Alaska did not ask about subsistence harvests with “other noncommercial gear” and 2) harvest estimates were lacking for most communities in Regulatory Area 4E. These limitations likely lead to an underestimate of the halibut harvests in Alaska rural communities. An added limitation for both the IPHC estimate and the estimate by Wolfe is that both rely on CPDB data for different single years to develop a hypothetical “typical year” harvest estimate. However, the range of variation from year to year in subsistence halibut harvests is undocumented. It is unknown how representative any single harvest estimate in the CPDB is of each community’s range of harvest over several years. The estimated Alaska subsistence harvest of halibut of 1,041,330 pounds (+/- 3.9 percent) for 2003 based on the SHARC mailed survey approximates Wolfe’s unadjusted estimate of harvests for home use for 2000 based on CPDB data of 1,078,486 pounds (Table 12). However, adding the “sport harvests” by SHARC holders gives a 2003 total of 1,287,277 pounds, which is about 20 percent higher than the upper bound of Wolfe’s unadjusted estimate. Further, the total harvest of halibut for home use in rural Alaska in 2003 also certainly included an unknown number of fish harvested in the sport fishery by community residents who did not obtain SHARCs, and removals from the commercial fishery. (Recall that the CPDB estimates used by Wolfe include all rod and reel harvests, including any that might be classified as “sport,” and also include commercial removals.) One evident difference between the harvest estimate for 2003 and those for earlier years is the estimated harvest of about 753,000 pounds of halibut with setline gear in 2003, compared to just 185,266 pounds for 2000 (and an estimate of zero for Southeast Alaska). Some additional potential reasons for the differences between the two estimates can be discerned by comparing the data at the regulatory area level (Table 12 and Figure 22). Estimates for Area 2C (Southeast Alaska) and Area 3B (Southcentral Alaska) are higher for 2003 than those developed for 2000. Setline gear harvests in 2003 account for most of the difference in the estimates. On the other hand, the 2003 estimate for Area 4A (eastern Aleutian Islands) is much lower than that for 2000, because of a lower estimate for Unalaska/Dutch Harbor (see below). The 2003 estimate for Area 4E (East Bering Sea Coast) is
20

lower than that for 2000; this is likely the result of the relatively low enrollment of subsistence fishers in the SHARC program in some key halibut fishing communities in this area (see, for example, the discussion of Tununak, below). Expressed as a percentage of the statewide harvest, the rankings of most regulatory areas are similar in the subsistence halibut harvest estimates for 2000 and 2003 (Fig. 23). Southeast Alaska (Area 2C) ranked first for both years, at 54.1 percent of the total for 2000 and 57.4 percent for 2003 (when subsistence and sport harvests by SHARC holders are combined). Southcentral Alaska (Area 3A) ranked second (19.0 percent and 29.8 percent respectively), although its percentage of the total harvest was higher in 2003 due to the lower harvest estimate for Area 4A (eastern Aleutians), which dropped in ranking (see above). District 4E (East Bering Sea Coast) had a higher percentage of the statewide estimate for 2000 (7.5 percent) than 2003 (4.3 percent). Further, when comparing the 2003 estimate with those of previous years, in addition to considering differing research methods, the possible effects of the new subsistence halibut regulation on fishing patterns must also be taken into account. Presently, these effects are largely unknown because systematic research has not focused on this topic, including the following questions:
1. Did the new subsistence halibut regulations encourage new participants in the fishery, especially in the larger communities? If so, estimated harvests will likely increase.
2. Did legalization of setline gear (longlines) in the subsistence fishery lead to less retention of halibut from commercial fisheries? If so, the 2003 estimates for the subsistence fishery would exceed community estimates for previous years that are adjusted to exclude commercial retention.
3. Was there a shift in gear used in fishing for halibut for home use from rod and reel to setline gear? If so, the 2003 setline harvest is not an increment to the previous levels of rod and reel harvests.
4. Did the new subsistence halibut regulations result in less participation in the “sport fishery”? That is, since May 15, 2003, when rod and reel became a legal gear in the subsistence fishery, are rod and reel fishers with SHARCs likely to classify their harvests as subsistence rather than recreational? And did some rod and reel halibut fishers begin using setlines instead of rod and reel? If either is the case, estimates of recreational harvests in the larger communities, such as Sitka, Cordova, and Kodiak, as developed through the statewide sport fish harvest survey of sport license holders, are likely to decline.
5. On the other hand, will SHARC holders who fished for the first time with longlines in 2003 continue to use this gear? If not, the harvests by gear type documented for 2003 may not persist in future years.
6. Did more liberal gear limits (from two hooks to thirty hooks) and daily harvest limits (from two fish to twenty fish) encourage more fishing effort and harvest by those who had already been involved in the subsistence fishery? If so, comparisons with harvest estimates from previous years should reveal increased harvests in 2003 and future years.
21

Regarding the sixth point above, it should be noted that changes in the magnitude of the Alaska subsistence halibut harvest resulting from liberalized regulations cannot be demonstrated using the results of the SHARC survey for 2003, given the limitations of the earlier harvest estimates. Also relevant is the point made by Wolfe and Walker (1987:68; see also Lonner 1980) that:
Subsistence activities, while often highly productive, are not oriented toward sale or accumulated profit as is commercial market production. Rather, they are directed toward meeting the self-limiting needs of families and small communities.
Given the self-limiting characteristic of subsistence fisheries in rural Alaska, the new regulations could have provided for more efficient subsistence harvesting (with setline gear and higher daily bag limits) without necessarily increasing the annual harvest of halibut. That is, annual harvest levels that were previously regulated as a recreational activity that required a sport-fishing license are now being achieved under subsistence regulations. On the other hand, the new opportunities for subsistence fishing for halibut might result in an increased harvest that is more consistent with levels needed to provide for local subsistence uses. Under that scenario, reported harvests might increase in some communities as participants adjust to the new regulations. Investigating these and the other questions listed above will require additional research using a combination of survey and ethnographic methods and, especially, the development of a time series of harvest data (see Recommendations in Chapter Four). Because of the limitations associated with the previous subsistence harvest estimates at the statewide level, until that time series is developed, discussion of harvest trends in the subsistence halibut fishery will remain speculative.
COMMUNITY CASE STUDIES To evaluate the subsistence halibut harvest estimate for 2003, comparisons can be made with previous harvest estimates for particular communities where Division of Subsistence household harvest surveys have been administered. These comparisons are subject to the same limitations as discussed above for the statewide estimates, including different sampling methods, uncertainty in the separation of subsistence and recreational harvests, and the potential effects of the subsistence regulatory changes beginning in 2003. The following communities were selected as case studies to represent communities of similar size and geographic location. In this evaluation, an emphasis is placed on larger communities, since, as discussed in Chapter Two, a small number of large communities accounted for most of the statewide subsistence halibut harvest in 2003. The quality of the harvest estimates for these places largely determines the reliability of the statewide estimate and the performance of the harvest assessment program. Also, as noted in Chapter One, not all tribal SHARC holders live in the community where their tribal headquarters is located. The following comparisons are based upon place of residence of the SHARC holder to be consistent with earlier division studies. Table 13 reports selected study findings for the case study communities discussed below. Appendix Tables A-4, A-5, and A-6 report study results for all communities based upon residence of SHARC holders.
22

Sitka (Regulatory Area 2C) Sitka had a population of 8,835 people in 2000, 2,178 of whom were Alaska Native. Sitka was the second largest rural community eligible to participate in the subsistence halibut fishery in 2003. According to survey results, residents of Sitka harvested more subsistence halibut in 2003 than any other community and accounted for 16.8 percent of the statewide total. Developing a reliable subsistence harvest estimate for Sitka is essential for the success of the subsistence harvest assessment program. Based on Division of Subsistence research, there are two previous estimates of halibut harvests for home use for Sitka (Table 14). For 1987, the estimated total harvest was 193,335 pounds (+/- 22%) (net weight); or 180,982 pounds if fish removed from commercial harvests are deleted. This noncommercial total only includes rod and reel harvests, because data on any harvests using “other methods” such as longlines (not then allowed in the subsistence fishery) were not collected. An estimated 1,252 Sitka households had at least one member who fished for halibut in 1987. For 1996, the total estimated harvest was 165,772 pounds net weight (+/- 28%), 149,244 pounds with commercial removals deleted. In 1996, an estimated 943 Sitka households had at least one member who fished for halibut. The estimated subsistence harvest of halibut by Sitka Tribal members who live in Sitka and other residents of Sitka for 2003 (1,639 SHARC holders) was 174,880 pounds net weight. Of this, 155,276 pounds (88.8 percent) was taken with setline gear, and 19,604 pounds (11.2 percent) was taken with hand-operated gear. Adding sport harvests by SHARC holders (32,408 pounds) increases the estimate to 207,288 pounds net weight. Eight hundred twenty one SHARC holders from Sitka subsistence fished for halibut in 2003. Of these, 760 used setline gear and 160 used hand-operated gear. Also, 401 SHARC holders from Sitka sport-fished for halibut in 2003 (Table 13). Halibut harvest estimates for the three study years for Sitka are generally similar to each other. The 2003 estimate is probably a minimum, since it is likely that some Sitka residents sport-fished for halibut but did not have a SHARC. This number of fishers is likely to be relatively small, given that about 956 SHARC holders fished for halibut in 2003 (either subsistence or sport) (Table 13), very similar to estimates of Sitka halibut-fishing households for 1987 and 1996. On the other hand, as noted in Chapter One, the Sitka Tribe prioritized interviewing SHARC holders who were likely subsistence fishers. This may have introduced some bias into the sample resulting in a higher harvest estimate. In short, however, this comparison, although it has limitations, suggests that the 2003 subsistence halibut harvest estimate for Sitka appears reasonable based on previous household surveys in the community. Petersburg (Regulatory Area 2C) In 2000, Petersburg had population of 3,224, including 388 Alaska Natives. There are two prior estimates for halibut harvests by Petersburg residents available, pertaining to 1987 and 2000 (Table 15). In the 1987 study, a random sample of 49 of the 1,123 households in Petersburg were interviewed (4.4 percent). In that year, Petersburg residents harvested an estimated 119,176 pounds of halibut (net weight) (+/-51%); of this, 11,723 pounds were removed from
23
commercial harvests, giving a noncommercial harvest of 107,448 pounds. As with Sitka, the 1987 study in Petersburg only collected noncommercial harvest data for halibut taken with rod and reel. Of the 1,123 households in Petersburg, 53.8 had at least one member that fished for halibut non-commercially, for a minimum of 604 halibut fishers in the community in 1987 (Scott et al. 2001). In 2000, Petersburg residents harvested an estimated 55,974 pounds net weight of halibut (+/-39%). Of this, 6,951 pounds were removed from commercial harvests, for a noncommercial harvest of 49,023 pounds, all of which was taken with rod and reel. In 2000, 468 Petersburg households had at least one member who fished for halibut for home use. For 2003, the estimated subsistence harvest of halibut by Petersburg residents with SHARCs (1,047 SHARC holders) was 55,718 pounds net weight. Of this, 41,704 pounds (74.8 percent) was harvested with setline gear, and 14,013 pounds (25.2 percent) with hand operated gear. Petersburg SHARC holders also harvested 19,611 pounds net weight of halibut they classified as sport harvested. This gives a total harvest by Petersburg SHARC holders of 75,329 pounds (Table 13). A total of 415 Petersburg SHARC holders harvested halibut in the subsistence fishery (330 used setline gear, 138 used hand operated gear); 268 participated in the sport fishery; and 523 harvested halibut either with subsistence gear or while sport fishing. Given that some Petersburg residents without SHARC cards likely sport fished for halibut, the 2003 estimate of noncommercial halibut harvests in the community based on the SHARC survey appears consistent with the 1987 estimate based on household interviews, but is slightly higher than the estimate for 2000. Note that in 2000, when regulations restricted subsistence fishing to handlines or rod and reel using no more than two hooks, no Petersburg households reported taking halibut for home use with any gear other than rod and reel, while 330 used setline gear in 2003 (Table 13, Table 15). Cordova (Regulatory Area 3A) In 2000, Cordova had a population of 2,454 people, including 368 Alaska Natives. There are six Division of Subsistence household surveys that estimate home-use halibut harvests for previous years (Table 16). After subtracting fish removed from commercial harvests for home use, estimated noncommercial halibut harvests by Cordova residents ranged from 32,754 pounds (+/-29%) net weight in 1985 to 120,221 pounds (+/- 62%) in 1988, with an average over the six study years of 57,285 pounds. The estimated number of Cordova household with at least one member fishing non-commercially for halibut ranged from 228 in 1985 to 401 in 1992, with a mean of 325 households. Subsistence halibut harvest estimates and participation estimates for Cordova residents for 2003 are lower than might be expected from previous research. The estimated subsistence harvest was 15,498 pounds net weight (7,613 pounds [49.1 percent] with setline gear, 7,885 pounds [50.9 percent] with hand operated gear), with an additional 11,534 pounds taken by SHARC holders while sport fishing (Table 13). The total of 27,032 pounds is about 47.2 percent of the average for previous study years. In 2003, 358 residents of Cordova obtained SHARCs. Of these, 102 subsistence-fished (68 with setline gear, 40 with hand operated gear), 144 reported that they sport fished for halibut, and 194 fished for halibut either under the new subsistence provisions or in the sport fishery (Table 13). This is a lower number of halibut fishers than might be expected from the earlier household survey results.
24

Based on these comparisons, it is possible that the SHARC survey underestimated the amount of halibut harvested by Cordova residents for home use in 2003. One explanation for this possible underestimate is that perhaps not all subsistence fishers in Cordova obtained SHARCs in 2003. Another possible factor is that many Cordova residents might prefer to harvest halibut under sport fishing regulations and did not obtain SHARCs to subsistence fish. A third factor is that until 2003, noncommercial halibut fishers were limited to fishing with hand-operated gear with no more than two hooks; it may take some time for Cordova residents to adapt to the new subsistence fishing opportunities with setline gear (as just noted, only 68 fished with setline gear in 2003). It appears that additional public outreach in Cordova is advisable, along with further analysis of sport and subsistence harvest data for future years so that noncommercial use patterns in the community can be better understood. Port Graham (Regulatory Area 3A) Located in lower Cook Inlet, Port Graham had a population of 171 in 2000, including 151 Alaska Natives. It is included here as a case example to represent the other small, predominantly Alaska Native communities in Regulatory Areas 3A and 3B that depend heavily on subsistence harvests of fish and wildlife resources. There are estimates of subsistence halibut harvests by Port Graham residents for seven previous study years (Table 17). Excluding 1989, the year of the Exxon Valdez Oil Spill, Port Graham’s halibut harvests ranged from 4,451 pounds (+/-14%) net weight in 1993 to 11,232 pounds (+/-14%) in 1992, with a six-year average of 7,591 pounds (net weight) (Fig. 24). Again excluding 1989, an average of 38 Port Graham households had at least one member who subsistence fished for halibut in the study years in the late 1980s and 1990s. In 2003, a total of 52 Port Graham residents obtained SHARCs. (Recall that this does not include Port Graham tribal members who do not live in Port Graham.) Of these, 35 subsistence fished for halibut in 2003 (10 used setline gear, 28 used hand operated gear), and 3 said they sport fished for halibut. Thirty-six fished for halibut under subsistence or sport fishing rules (Table 13). This finding is consistent with levels of participation in the halibut fishery that could be expected from the previous studies. Given the long tradition of subsistence halibut fishing in Port Graham, it is not surprising that very few residents of this community classified any of their halibut fishing as “sport.” The subsistence halibut harvest estimate for Port Graham for 2003 was 11,454 pounds net weight. Of this, 4,398 pounds (38.4 percent) was harvested with setline gear, and 7,056 pounds (61.6 percent) with hand operated gear. Adding 156 pounds of halibut taken while sport fishing gives a community total of 11,610 pounds of halibut harvested for home use by Port Graham residents in 2003 (Table 13). While this total is very similar to the previous highest estimate (11,232 pounds in 1992), it exceeds the average of previous study years of 7,591 pounds. This is not unexpected: Port Graham has traditionally used setlines with multiple hooks to harvest halibut as well as hand-operated gear (Stanek 1985:67-69,151). With regulations in place in 2003 consistent with traditional harvest methods, residents of Port Graham and other communities with similar traditions fished with setline gear and hand operated gear, and reported subsistence halibut harvests that are likely similar to historic levels.
25

Kodiak City and Road System (Regulatory Area 3A) “Kodiak” in this report includes the city of Kodiak (population 6,334 in 2000, including 829 Alaska Natives) and those portions of the Kodiak Island Borough connected to Kodiak city by road. This area had a population of 12,973 people in 2000, including 1,697 Alaska Natives. This is the largest rural community eligible to participate in the Alaska subsistence halibut fishery in 2003. Based on Division of Subsistence household surveys, estimates of halibut harvests for home use are available for the entire Kodiak road system population for 1982 and 1991. Estimates for Kodiak city residents alone are available for 1992 and 1993, but these can be used to develop a projected total for the entire road system population (Table 18). Excluding fish removed from commercial catches for home use, halibut harvests by Kodiak residents ranged from 247,283 pounds usable weight (+/-30%) in 1991 to 511,254 pounds (+/-33%) in 1993. The average for the four available study years was 366,682 pounds; of this, 338,476 pounds (92.3 percent) was taken with rod and reel, most likely consistent with sport fishing regulations. On average for the four study years, 1,306 Kodiak road system households had at least one member who fished for halibut for home use. Kodiak residents obtained 1,320 SHARCs in 2003. Of these, an estimated 646 subsistence fished for halibut with most (438 or 67.8 percent) using setline (fixed) gear. Also, an estimated 498 fished for halibut under sport fishing regulations. A total of 858 Kodiak resident SHARC holders fished for halibut either in the subsistence fishery or sport fishery (Table 13). Given that it is likely that many Kodiak residents continued to fish for halibut under sport fishing regulations in 2003, the estimated level of participation in the subsistence fishery based on the SHARC survey appears reasonable. The estimated subsistence harvest of halibut in 2003 for Kodiak road system area residents was 153,254 pounds; of this, 101,575 pounds were taken with setline gear (66.3 percent) and the rest (51,678 pounds; 33.7 percent) with hand-operated gear (handline or rod and reel). In addition, Kodiak road system SHARC holders harvested an estimated 68,170 pounds net weight of halibut they classified as sport-caught. This gives a total estimated halibut harvest by Kodiak road system SHARC holders of 221,424 pounds net weight (Table 13). Not surprisingly, this total is lower than totals based on household surveys for previous years because, as just noted, many Kodiak road system residents who fish for halibut likely did not obtain SHARCs and harvested halibut under sport fishing rules in 2003. Overall, the 2003 subsistence harvest estimate for Kodiak appears reasonable, although it needs to be further evaluated when findings from the 2003 sport fishing survey become available and with additional years of subsistence harvest survey data. Unalaska/Dutch Harbor (Regulatory Area 4A) The city of Unalaska (which includes Dutch Harbor) had a population of 4,283 in 2000, including 397 Alaska Natives. The Division of Subsistence conducted a household harvest survey in Unalaska/Dutch Harbor for 1994. The estimated total halibut harvest was 97,601 pounds net weight (3,049 fish) (+/-34%), excluding 10,606 pounds (331 fish) removed from
26
commercial catches for home use. Of the 700 households in the community, an estimated 391 (55.8 percent) had at least one member who fished for halibut in 1994. Most of the noncommercial harvest, 88,142 pounds (90.3 percent), was taken with rod and reel. In 2003, 92 residents of Unalaska and Dutch Harbor obtained SHARCs (Table 13). Notably, only 14 members of the Qawalingin Tribe of Unalaska registered to subsistence fish for halibut (see Table 3). For the community overall and for the tribe, this is far fewer registrants than might have been predicted from the 1994 survey results. Fifty Unalaska/Dutch Harbor SHARC holders subsistence fished for halibut in 2003 and 33 sport fished; 70 fished in either fishery (Table 13). The estimated subsistence harvest for Unalaska and Dutch Harbor residents with SHARCs (including tribal members who live in Unalaska or Dutch Harbor) was 10,860 pounds net weight, and these SHARC holders harvested an additional 5,519 pounds of halibut while sport fishing, for a total noncommercial harvest of 16,379 pounds (Table 13). This is just 16.8 percent of the harvest estimate for 1994. There are at least four possible explanations for this difference. One, halibut harvests in Unalaska may have declined since 1994, although an actual level of decline of this magnitude appears unlikely. Second, the SHARC survey may have underestimated the subsistence halibut harvest if many fishers did not obtain a SHARC from RAM. A third possible explanation is that the 1994 survey might have overestimated the halibut harvest. A fourth potential explanation is that many halibut fishers in Unalaska perhaps prefer to harvest halibut under sport fishing regulations and therefore did not obtain a SHARC. A combination of all four factors could be responsible for the unexpectedly low subsistence halibut harvest estimated for Unalaska from the SHARC survey for 2003. Further outreach in Unalaska is clearly appropriate, as well as additional research to better understand patterns of halibut fishing in the community. Toksook Bay (Regulatory Area 4E) As discussed in Chapter Two, 533 Toksook Bay tribal members (population 532 in 2000) obtained SHARCs in 2003. The Division of Subsistence has not conducted a household harvest survey in this community. Wolfe (2002) estimated a subsistence halibut harvest of 12,600 pounds net weight (16,800 pounds round weight) for this community for 2000, based upon the per capita estimate for the neighboring community of Tununak from 1986. As also discussed above, with the assistance of the tribal government in Toksook Bay, Division of Subsistence staff evaluated the list of SHARC holders in the community, estimated the total number of subsistence halibut fishers, and conducted interviews with likely fishers. Based upon this collaboration with the tribal government, it is highly likely that most community residents who subsistence fished for halibut in 2003 provided harvest data through the SHARC survey. The estimated harvest for Toksook Bay for 2003 was 24,500 pounds net weight by 54 fishers (Table 13). In the assessment by project staff, this is a very reliable subsistence harvest estimate for the community. It should be noted that Toksook Bay is a member of the Coastal Villages Regional Fund CDQ organization. The majority of the 5,034 pounds of sublegal halibut retained for home use by members of this CDQ organization was landed at Toksook Bay and Mekoryuk (Williams 2004b:59-60).
27

Tununak (Regulatory Area 4E) Tununak had a population of 325 in 2000, 315 of whom were Alaska Native. The Division of Subsistence conducted a comprehensive household harvest survey in the community in 1986, which provides the only estimate of subsistence halibut harvests. The estimate was 1,532 fish and 30,643 pounds net (dressed) weight, with a 95% confidence limit of +/-26%. The harvest per capita was 93.49 pounds net weight (Scott et al. 2001). No residents of Tununak obtained SHARCs in 2003.10 As discussed in Chapter One, the Traditional Elders’ Council in Tununak did not approve Division of Subsistence plans to conduct interviews with potential subsistence halibut fishers. Therefore, there is no subsistence halibut harvest estimate for this community for 2003. Given the importance of subsistence halibut fishing in Tununak, this means that the harvest estimate for 2003 for Area 4E is probably low. It should be noted that as of November 24, 2004, 73 members of the Native Village of Tununak tribe had obtained SHARCs. Assuming that an acceptable percentage of these SHARC holders respond to the harvest survey for 2004, it should be possible to develop a harvest estimate for the community for future years.
COMPARISONS WITH NON-SUBSISTENCE HARVESTS IN 2003 As reported in Table 19, the preliminary estimated total halibut removal in Alaskan waters in 2003 was 83,064,671 pounds (net weight). In this total, the removal of 14,341 pounds of sublegal halibut for personal use by CDQ organizations in Areas 4D and 4E has been added to the subsistence harvest category. Commercial harvests accounted for 73.0 percent of halibut removals in Alaska in 2003 (Fig. 25). Bycatch of halibut in various other commercial fisheries ranked second, with 14.5 percent of the statewide removals. Sport harvests ranked third, with 9.2 percent. Wastage in commercial fisheries added 2.0 percent to the total halibut removals. Finally, the subsistence fishery accounted for 1.3 percent of the total removals of halibut in Alaska waters in 2003. Halibut harvests by fishery in 2003 at the regulatory area level did not differ substantially from the statewide pattern (Table 19, Fig. 26). In all regulatory areas, commercial harvests accounted for 60 percent or more of the total pounds net weight. In Area 2C (Southeast Alaska) and Area 3A (Southcentral Alaska), sport fisheries took 21.4 percent and 15.7 percent, respectively, of the halibut harvest in 2003, but sport fisheries were smaller than the subsistence harvests in Area 3B and Area 4. Commercial bycatch accounted for 35.4 percent of halibut removals in Area 4. As a percentage of the total removal, subsistence halibut harvests were largest in Area 2C at 5.2 percent of the total (although they were still about a quarter of the sport harvest and about 7.5 percent of the commercial harvest) and 0.9 percent in Area 3A.
10 One tribal member obtained a SHARC, but this person was not a resident of Tununak.
28

CHAPTER FOUR: CONCLUSIONS AND RECOMMENDATIONS
SUMMARY AND CONCLUSIONS New federal regulations governing subsistence halibut fishing in Alaska came into effect in May 2003. By December 2003, 11,625 members of tribes with traditional uses of halibut and residents of eligible rural communities obtained subsistence halibut registration cards (SHARCs) from NMFS. In 2004, 7,593 of these SHARC holders (65.3 percent) voluntarily provided information about their subsistence halibut fishing activities in 2003 by responding to a survey administered by the Division of Subsistence of ADF&G (see Table 3). Based on these survey returns, an estimated 4,942 individuals subsistence fished for halibut in Alaska in 2003. They harvested an estimated 43,926 halibut for 1,041,330 pounds (+/- 3.9 percent) (net weight), with most of this harvested with setline gear (72.3 percent) and the remainder with hand-operated gear (hook and rod or handline) (27.7 percent). The largest portion of the Alaska subsistence halibut harvest in 2003 occurred in Regulatory Area 2C (Southeast Alaska), 60.3 percent; followed by Area 3A (Southcentral Alaska), 26.9 percent; and Area 4E (east Bering Sea Coast), 5.2 percent. The remaining five regulatory areas (3B, Alaska Peninsula; 4A, eastern Aleutian Islands; 4B, western Aleutian Islands; 4C, Pribilof Islands; and 4D, Central Bering Sea) accounted for 7.6 percent of the statewide total (see Table 4). Subsistence harvests accounted for 1.3 percent of the total halibut removals in Alaska waters in 2003 (see Fig. 25). The 2003 calendar year was the first for which a program was implemented to attempt to estimate the statewide subsistence harvest of halibut in Alaska. By several measures, the program was a success. Overall, there was a very high response rate of 65.3 percent. Response rates were 70 percent or higher in the nine rural communities with the largest number of SHARCs issued. This is especially encouraging given that this was the first year of a voluntary program. Through contracts and outreach, high levels of involvement in the research were achieved in many key communities and tribes, including Sitka, Hydaburg, Toksook Bay, Gambell, and Savoonga. On the other hand, return rates were lower in some other communities and tribes, raising questions about the thoroughness and precision of the harvest estimates in those places. As discussed above, comparisons of the 2003 harvest estimates with those from previous research by the Division of Subsistence are complicated by different research methods, but such comparisons are still instructive. It appears that subsistence harvest estimates for most of the larger communities (combining tribal and rural SHARC holders) such as Sitka, Petersburg, and Kodiak for 2003 are not markedly different from earlier estimates based on household surveys. This is significant in that these communities account for a very large percentage of the total harvest. In some cases, such as Cordova and Unalaska/Dutch Harbor, it appears that participation in the SHARC program by subsistence fishers may be more incomplete than in other communities, suggesting that further community outreach is necessary. We conclude that the first year of the survey of SHARC holders produced a reliable estimate of subsistence harvests of halibut in Alaska for 2003. The estimate can be further evaluated in the future as the new subsistence regulations become more completely implemented and additional years of harvest data are collected. Continued documentation of the subsistence harvests is also necessary for any meaningful discussion of trends in the fishery.
29

RECOMMENDATIONS
We conclude this report with the following recommendations. 1. The harvest assessment program for the Alaska subsistence halibut fishery should continue for at least two more years, using methods similar to those employed for 2003. This will begin to develop a time series for assessment of trends in the fishery as well as assessment of information for the early years of the harvest assessment program, such as this first year of the program just completed. As discussed above, the methods used for 2003 (a short, mailed survey with three mailings, supplemented by community outreach, interviewing in selected communities, and partnerships with tribal governments), were successful and should be retained to facilitate comparisons across study years. 2. Outreach is needed in several communities, including Unalaska/Dutch Harbor, St. Paul, Ketchikan, and Angoon, and perhaps Cordova, based on relatively low response rates or unexpectedly low numbers of SHARCs issued. Contracts with tribal governments in Sitka and Hydaburg should be renewed for at least a second year to build upon the successful work in those communities in accomplishing the 2003 harvest estimate. 3. Further community outreach should also occur in Area 4E. There are many communities in this very large geographic area but relatively few SHARCs were issued and, as discussed above, the 2003 harvest estimate was likely low. The focus of this outreach should be on those communities that are known to have relatively large traditional harvests of halibut. Harvests in many other communities in this area are likely to be small. Although a major outreach effort including most of these communities would be expensive and unnecessary, communications with tribal governments could result in more enrollments in the SHARC program and more confidence in the survey results. 4. Regulations likely to be adopted by NMFS in late 2004 will create a community harvester program for subsistence halibut fishing. It will be essential to integrate this program into the SHARC harvest assessment program. This will entail further cooperative work with tribal governments. 5. Consideration should be given to dropping from the mailed survey the questions about incidental harvests of lingcod and rockfish if it is determined, based upon consultations with fishery managers, that these harvests are not of regulatory or conservation concern. An alternative is to include these questions only for areas with potential management concerns for rockfish or lingcod or where stock assessments may occur. The harvest estimates for lingcod and rockfish developed through the SHARC survey represent only a portion of the total subsistence harvest of these resources in the study communities and are therefore not useful other than for the specific purpose of assessing incidental harvests in the subsistence halibut fishery. If an assessment of these incidental harvests is not necessary, there is no value in collecting rockfish and lingcod harvest data through the SHARC survey.
30

6. If rockfish (or lingcod) incidental harvests in the halibut subsistence fishery continue to be of interest to managers in some areas, more specific data collection tools need to be developed to collect harvest data at the species level for rockfish in particular communities. This should only be done in selected areas of concern given the additional costs to data collection and analysis that this will entail (see Wolfe 2002 for more discussion of collection of rockfish harvest data through the SHARC survey). Such research should only occur through partnerships with local communities and tribes, and should include a combination of participant observation, key respondent interviewing, and survey methods. 7. Evaluation of sport fish harvest data, achieved through the mailed survey administered by the Division of Sport Fish of ADF&G, should take place systematically for the larger rural communities participating in the subsistence halibut fishery for at least several years. As discussed in Chapter Two and Chapter Three, many SHARC holders also reported that they sport fished for halibut in 2003. Whether this was due to the subsistence fishing regulations not being in effect until May, or for some other reason, it will be important to determine if a shift in harvest from the “sport” category to the subsistence category is occurring, in order to evaluate trends in the subsistence fishery and the effect of the new subsistence halibut regulations on fishing patterns. Also, as also noted in Chapter Three, comparisons of community harvest estimates from previous research require consideration of sport harvests as well as harvests under the new subsistence regulations. Such comparisons are also important for evaluating the subsistence harvest assessment program and the performance of the new subsistence regulations. 8. Consideration should be given to funding and implementing ethnographic investigations in key halibut fishing communities to evaluate the effects of the new subsistence fishing regulations on fishing patterns. These studies would entail more detailed interviewing of fishers regarding any changes in gear choice, fishing effort, harvest amounts, or other fishing activities that have resulted from the regulatory changes. These interviews could also investigate traditional knowledge about local halibut stocks that might prove useful to management agencies, communities, and tribes for future management of the subsistence, sport, and commercial halibut fisheries in Alaska.
31

32

REFERENCES CITED Blood, Calvin L.
2004 2003 Sport Fishery. International Pacific Halibut Commission. Report of Assessment and Research Activities 2003: pp. 45-52.
Cochran, W. G.
1977 Sampling techniques. 3rd ed. John Wiley & Sons, New York. Crapo, Chuck, Brian Paust, and Jerry Babbitt
1993 Recoveries and Yields from Pacific Fish and Shellfish. Alaska Sea Grant College Program, Marine Advisory Bulletin No. 37. Fairbanks.
Gilroy, Heather
2004a The Pacific Halibut Fishery, 2003. In 2004 International Pacific Halibut Commission Annual Meeting Handout, pp. 5 – 17. International Pacific Halibut Commission, Eightieth Annual Meeting, Juneau, Alaska, January 19 – 23, 2004.
2004b Wastage in the 2003 Pacific Halibut Fishery. International Pacific Halibut
Commission. Report of Assessment and Research Activities 2003: pp. 53-56. Gilroy, Heather, Thomas M. Kong, and Tracee O. Geernaert
2004 2003 Commercial Fishery and Regulation Changes. International Pacific Halibut Commission. Report of Assessment and Research Activities 2003: pp. 33-43.
International Pacific Halibut Commission
2004 Report of Assessment and Research Activities 2003. Produced by the IPHC staff. Seattle.
Lonner, Thomas D.
1980 Subsistence as an Economic System in Alaska: Theoretical and Policy Implications. Alaska Department of Fish and Game, Division of Subsistence Technical Paper Series No. 67. Juneau.
Meyer, Scott C.
2000 Composition and Biomass of the Recreational Rockfish Sebastes Harvest in Southcentral Alaska, 1992 – 1995. Alaska Department of Fish and Game, Division of Sport Fish Fishery Data Series No. 00-6. Anchorage.
National Marine Fisheries Service
2000 Environmental Assessment/Regulatory Impact Review/Initial Regulatory Flexibility Analysis for a Regulatory Amendment for Defining a Halibut Subsistence Fishery Category (EA/RIR). North Pacific Fishery Management Council, Alaska Department of Fish and Game, International Pacific Halibut Commission, and National Marine Fisheries Service. Anchorage, August 11, 2000.
33

Scott, Cheryl, Louis A. Brown, Gretchen B. Jennings, and Charles J. Utermohle 2001 Community Profile Database for Access 2000. Version 3.12. Alaska Department of
Fish and Game, Division of Subsistence. Juneau. Stanek, Ronald
1985 Patterns of Wild Resource Use in English Bay and Port Graham, Alaska. Alaska Department of Fish and Game, Division of Subsistence Technical Paper No. 104. Juneau.
Trumble, Robert J.
1999 1998 Estimates of Personal Use Halibut. International Pacific Halibut Commission. Report of Assessment and Research Activities 1998: 61-64.
United States Bureau of the Census
2001 Profiles of General Demographic Characteristics, 2000 Census of Population and Housing: Alaska. U.S. Department of Commerce. Washington, D.C.
Williams, Gregg H.
2004a Incidental Catch and Mortality of Pacific Halibut, 1962 – 2003. International Pacific Halibut Commission. Report of Assessment and Research Activities 2003: pp. 215-225.
2004b Retention of Sublegal Halibut in the Areas 4D/4E CDQ Fishery: 2003 Harvests.
International Pacific Halibut Commission. Report of Assessment and Research Activities 2003: pp. 59-60.
2004c Estimates of the 2003 Personal Use Harvests. International Pacific Halibut
Commission. Report of Assessment and Research Activities 2003: pp. 57-58. 2004d Personal communication, 11/29/2004, regarding data on halibut bycatch.
Wolfe, Robert J.
2001 Subsistence Halibut Fishing in Alaska – Harvest Patterns. Presentation to the Alaska Board of Fisheries, May 2001 (RC 8). Alaska Department of Fish and Game, Division of Subsistence.
2002 Subsistence Halibut Harvest Assessment Methodologies. Report prepared for the
National Marine Fisheries Service, Sustainable Fisheries Division. Robert J. Wolfe and Associates. San Marcos, CA.
Wolfe, Robert, J., James A. Fall, and Ronald T. Stanek.
2003 The Subsistence Harvest of Harbor Seals and Sea Lions by Alaska Natives in 2002. Alaska Department of Fish and Game, Division of Subsistence Technical Paper No. 277. Juneau.
34

Wolfe, Robert J. and Robert J. Walker 1987 Subsistence Economies in Alaska: Productivity, Geography, and Development
Impacts. Arctic Anthropology 24(2):56-81.
35

36

REPORT TABLES
37
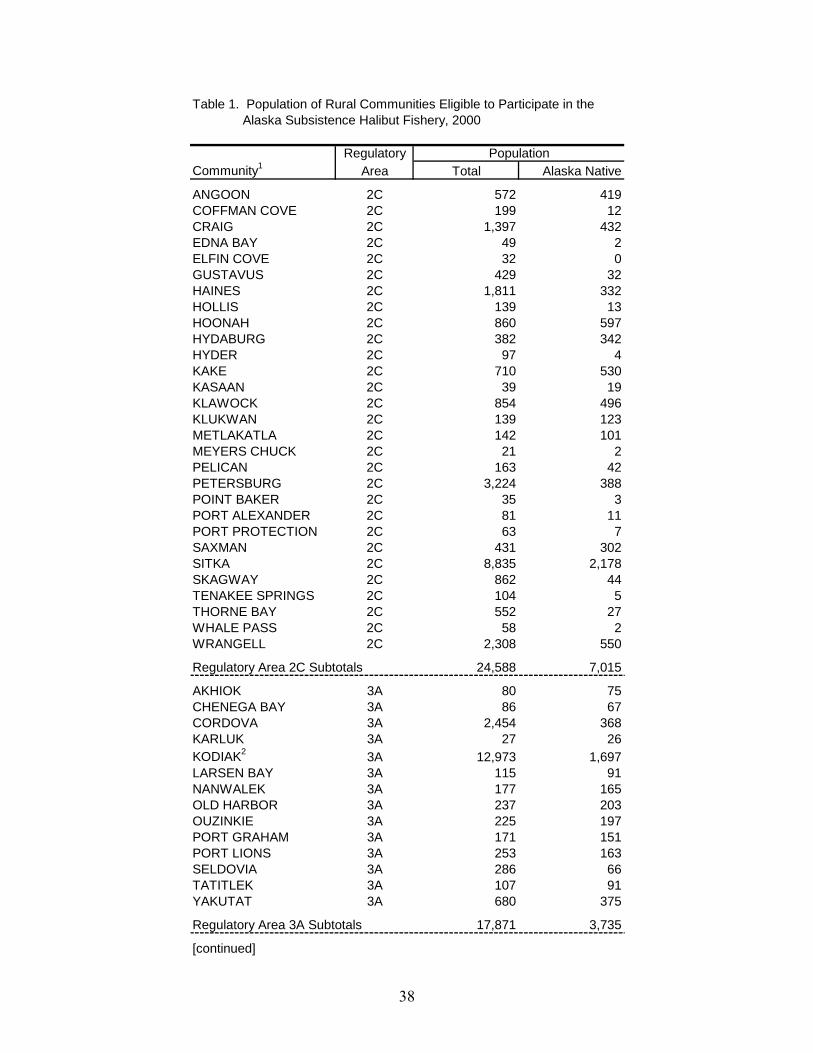
Table 1. Population of Rural Communities Eligible to Participate in the Alaska Subsistence Halibut Fishery, 2000
RegulatoryCommunity1 Area Total Alaska Native
ANGOON 2C 572 419COFFMAN COVE 2C 199 12CRAIG 2C 1,397 432EDNA BAY 2C 49 2ELFIN COVE 2C 32 0GUSTAVUS 2C 429 32HAINES 2C 1,811 332HOLLIS 2C 139 13HOONAH 2C 860 597HYDABURG 2C 382 342HYDER 2C 97 4KAKE 2C 710 530KASAAN 2C 39 19KLAWOCK 2C 854 496KLUKWAN 2C 139 123METLAKATLA 2C 142 101MEYERS CHUCK 2C 21 2PELICAN 2C 163 42PETERSBURG 2C 3,224 388POINT BAKER 2C 35 3PORT ALEXANDER 2C 81 11PORT PROTECTION 2C 63 7SAXMAN 2C 431 302SITKA 2C 8,835 2,178SKAGWAY 2C 862 44TENAKEE SPRINGS 2C 104 5THORNE BAY 2C 552 27WHALE PASS 2C 58 2WRANGELL 2C 2,308 550
Regulatory Area 2C Subtotals 24,588 7,015
AKHIOK 3A 80 75CHENEGA BAY 3A 86 67CORDOVA 3A 2,454 368KARLUK 3A 27 26KODIAK2 3A 12,973 1,697LARSEN BAY 3A 115 91NANWALEK 3A 177 165OLD HARBOR 3A 237 203OUZINKIE 3A 225 197PORT GRAHAM 3A 171 151PORT LIONS 3A 253 163SELDOVIA 3A 286 66TATITLEK 3A 107 91YAKUTAT 3A 680 375
Regulatory Area 3A Subtotals 17,871 3,735
[continued]
Population
38

Table 1. [continued]
RegulatoryCommunity1 Area Total Alaska Native
CHIGNIK 3B 79 48CHIGNIK LAGOON 3B 103 85CHIGNIK LAKE 3B 145 127COLD BAY 3B 88 15FALSE PASS 3B 64 42IVANOF BAY 3B 22 21KING COVE 3B 792 379NELSON LAGOON 3B 83 68PERRYVILLE 3B 107 105SAND POINT 3B 952 421
Regulatory Area 3B Subtotals 2,435 1,311
AKUTAN 4A 713 117NIKOLSKI 4A 39 27UNALASKA 4A 4,283 397
Regulatory Area 4A Subtotals 5,035 541
ADAK 4B 316 118ATKA 4B 92 84
Regulatory Area 4B Subtotals 408 202
ST GEORGE ISLAND 4C 152 140ST PAUL ISLAND 4C 532 460
Regulatory Area 4C Subtotals 684 600
GAMBELL 4D 649 622SAVOONGA 4D 643 614
Regulatory Area 4D Subtotals 1,292 1,236
ALAKANUK 4E 652 638ALEKNAGIK 4E 221 187BREVIG MISSION 4E 276 254BETHEL 4E 5,471 3,719CHEFORNAK 4E 394 386CHEVAK 4E 765 734CLARK'S POINT 4E 75 69COUNCIL ANVSA3 4E 0 0DILLINGHAM 4E 2,466 1,503EEK 4E 280 271EGEGIK 4E 116 89ELIM 4E 313 297EMMONAK 4E 767 720GOLOVIN 4E 144 133GOODNEWS BAY 4E 230 216HOOPER BAY 4E 1,014 971
[continued]
Population
39

Table 1. [continued]
RegulatoryCommunity1 Area Total Alaska Native
KING SALMON 4E 442 133KIPNUK 4E 644 631KONGIGANAK 4E 359 349KOTLIK 4E 591 568KOYUK 4E 297 280KWIGILLINGOK 4E 338 331LEVELOCK 4E 122 116MANOKOTAK 4E 399 378MEKORYUK 4E 210 203NAKNEK 4E 678 319NAPAKIAK 4E 353 341NAPASKIAK 4E 390 383NEWTOK 4E 321 311NIGHTMUTE 4E 208 197NOME 4E 3,505 2,057OSCARVILLE 4E 61 61PILOT POINT 4E 100 86PLATINUM 4E 41 38PORT HEIDEN 4E 119 93QUINHAGAK 4E 555 540SCAMMON BAY 4E 465 453SAINT MICHAEL 4E 368 343SHAKTOOLIK 4E 230 218SHELDON POINT 4E 164 154SHISHMAREF 4E 562 531SOLOMON ANVSA 4E 4 3SOUTH NAKNEK 4E 137 115STEBBINS 4E 547 518TELLER 4E 268 248TOGIAK 4E 809 750TOKSOOK BAY 4E 532 519TUNTUTULIAK 4E 370 366TUNUNAK 4E 325 315TWIN HILLS 4E 69 65UGASHIK 4E 11 9UNALAKLEET 4E 747 655WALES 4E 152 137WHITE MOUNTAIN 4E 203 175
Regulatory Area 4E Subtotals 28,880 23,176
Grand Total 81,193 37,816
Source: U.S. Census Bureau 20011 Alaska Native Village statistical Area populations were used whenever no cityor census designated place (CDP) populations were present in the census.2 Total population for Kodiak Island road system area; includes KodiakCity, Kodiak Station, Chiniak, and other areas on the road system.3 There is no census table for a Council CDP or municiplaity.The Council ANVSA table indicated that all 40 housing units were vacant.
Population
40

Table 2. Project Chronology
Date Event/Action
May 2003 Adoption of Final Rule, Subsistence Halibut Fishing in Alaska, by NMFS
October 9, 2003 Review of study design at ANSHWG meeting, Anchorage
Mid January 2004 Running of newspaper adsJanuary 20, 2004 ADF&G news release regarding mailing of SHARC surveys11-Feb-04 First Mailing of Survey FormsFebruary and March 2004 Administration of EVOS Surveys in 15 southcentral and southwest
Alaska communitiesMarch 8, 2004 Second Mailing of Survey FormsMarch 13 - 17, 2004 Survey administration in Gambell and SavoongaMarch 29 - April 6, 2004 Meetings in Toksook Bay and Tununak; Survey administration in
Toksook BayMarch 30, 2004 Briefing to the NPFMC and Alaska Board of Fisheries regarding project
progressApril 9, 2004 Third Mailing of Survey Forms
May 6, 2004 Review of some preliminary results at ANSHWG meeting, Anchorage
September 22, 2004 Release of public review draft of final reportOctober 6, 2004 Presentation of Study Findings, NPFMC, Sitka December 2004 Completion of revised, final report
41

42
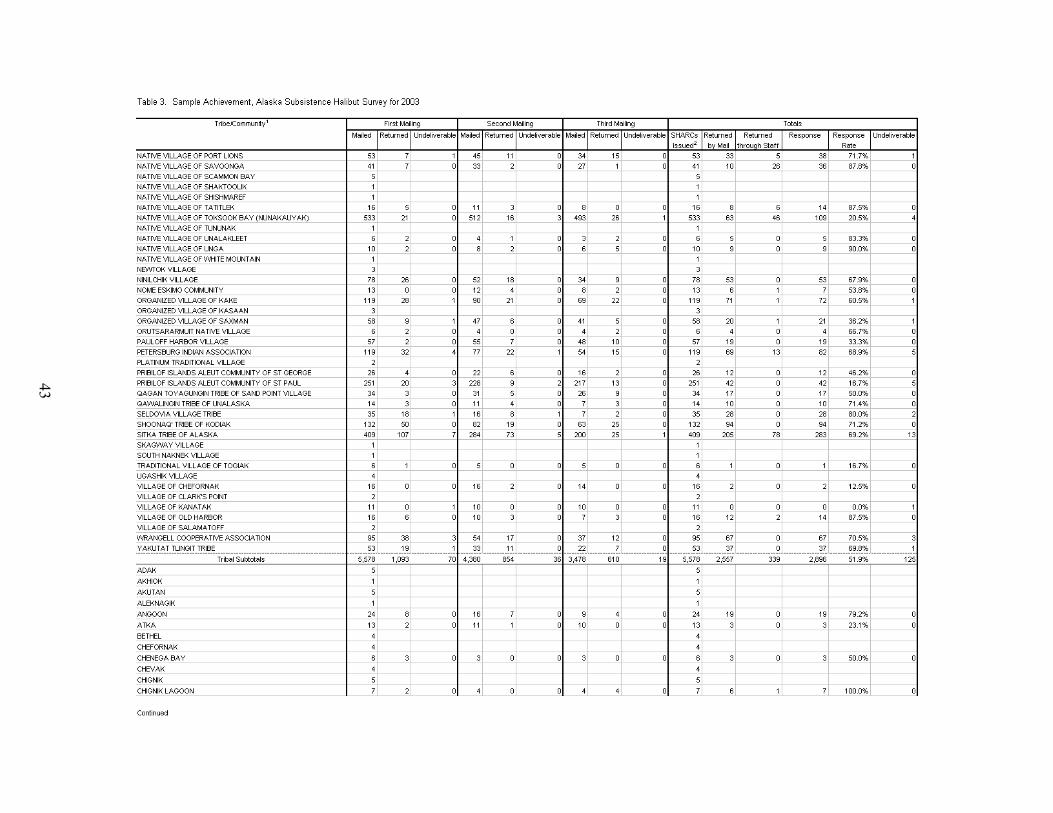
43
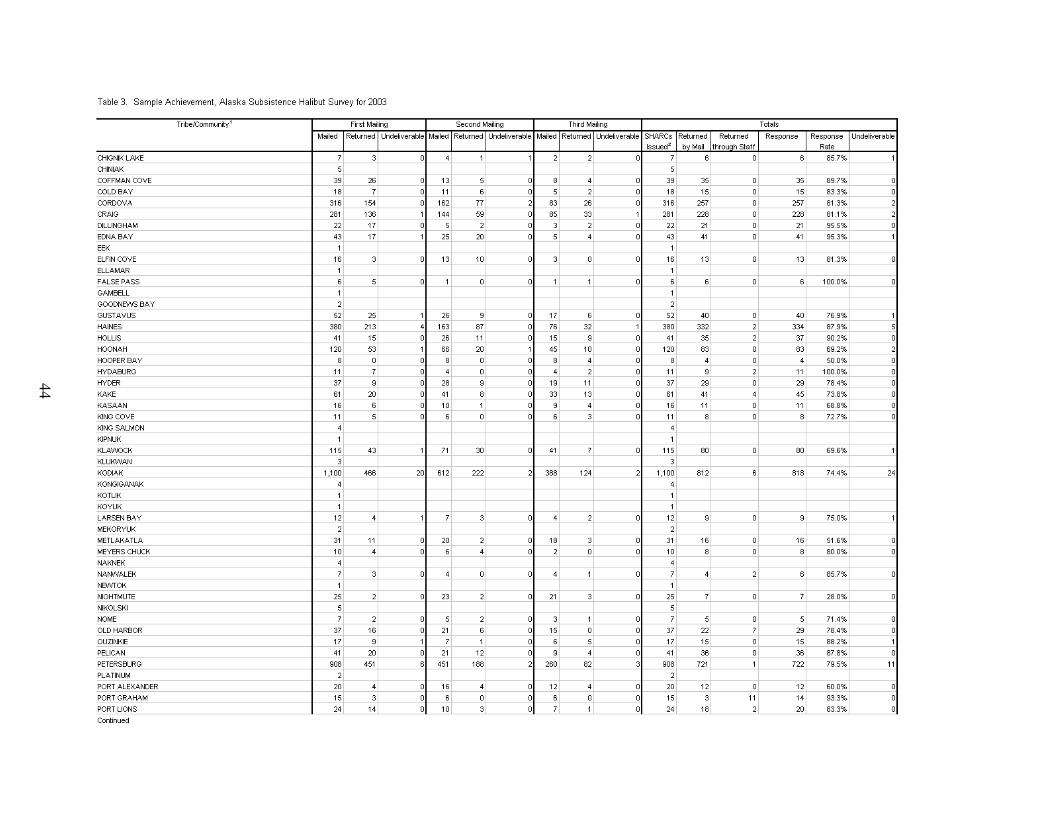
44

45

46
Table 4. Estimated Alaska Subsistence Harvests of Halibut by SHARC Type, Regulatory Area, and Gear Type, 20031
Estimated Number Fished
Estimated Number
Harvested
Estimated Pounds
Harvested
Estimated Number Fished
Estimated Number
Harvested
Estimated Pounds
Harvested
Estimated Number Fished
Estimated Number
Harvested
95% C.I. Percent
(Number)
Estimated Pounds
Harvested
95% C.I. Percent
(Pounds)
Tribal 2C 3,132 793 8,085 239,225 264 1,434 32,193 968 9,518 10.3% 271,416 11.8%Tribal 3A 936 208 2,102 51,085 191 1,727 35,477 358 3,828 8.3% 86,563 10.7%Tribal 3B 204 43 502 9,293 59 380 9,035 90 884 26.1% 18,328 26.6%Tribal 4A 70 9 31 376 42 323 11,269 45 353 52.7% 11,645 46.3%Tribal 4B 6 2 11 198 2 8 180 4 19 73.7% 378 79.1%Tribal 4C 277 44 707 11,698 73 504 11,690 101 1,211 60.2% 23,388 46.8%Tribal 4D 47 19 67 3,936 2 8 444 25 75 26.7% 4,380 24.6%Tribal 4E 906 69 803 10,116 183 2,244 36,528 245 3,046 17.0% 46,640 12.9%
Tribal All 5,578 1,187 12,308 325,927 816 6,628 136,816 1,836 18,934 7.3% 462,738 7.8%
Rural 2C 4,095 1,832 12,027 299,259 489 2,938 57,283 2,114 14,963 3.5% 356,543 3.7%Rural 3A 1,674 534 4,854 116,582 397 3,634 76,467 827 8,485 5.4% 193,050 5.5%Rural 3B 59 22 162 3,391 34 289 6,247 44 450 13.1% 9,637 18.3%Rural 4A 84 33 324 6,082 25 153 3,000 48 476 24.0% 9,082 20.4%Rural 4B 18 9 37 1,281 4 17 812 9 55 172.7% 2,094 194.6%Rural 4C 12 0 0 0 4 23 368 4 23 147.8% 368 140.4%Rural 4D 3 0 0 0 0 0 0 1 0 0.0% 0 0.0%Rural 4E 112 11 33 336 39 506 7,481 59 540 56.9% 7,818 62.7%
Rural All 6,057 2,441 17,437 426,931 992 7,560 151,658 3,106 24,992 3.1% 578,592 3.1%
All 2C 7,227 2,625 20,112 538,484 753 4,372 89,476 3,082 24,481 4.5% 627,959 5.5%All 3A 2,610 742 6,956 167,667 588 5,361 111,944 1,185 12,313 4.5% 279,613 5.0%All 3B 263 65 664 12,684 93 669 15,282 134 1,334 17.9% 27,965 18.5%All 4A 154 42 355 6,458 67 476 14,269 93 829 25.8% 20,727 26.9%All 4B 24 11 48 1,479 6 25 992 13 74 105.4% 2,472 134.8%All 4C 289 44 707 11,698 77 527 12,058 105 1,234 59.1% 23,756 46.1%All 4D 50 19 67 3,936 2 8 444 26 75 26.7% 4,380 24.6%All 4E 1,018 80 836 10,452 222 2,750 44,009 304 3,586 16.8% 54,458 14.2%
All All 11,635 3,628 29,745 752,858 1,808 14,188 288,474 4,942 43,926 3.6% 1,041,330 3.9%
1 SHARC = Subsistence halibut registration certificate.2 Pounds are net (dressed) weight. Net weight = 75% of round weight. Setline = longline or skate. Hand-operated gear = rod and reel or handline.
Source: Alaska Department of Fish and Game, Division of Subsistence Survey, 2004
SHARC Type
Halibut Regulatory
Area
Number of SHARCs Issued
Estimated Harvest by Gear Type2
Setline (Fixed) Gear Hand-Operated Gear All Gear

Table 5. Age of Subsistence Halibut Registration Certificate Holders by SHARC Type, 2003
SHARCType 0 - 4 5 - 9 10 - 14 15 - 19 20 - 24 25 - 29 30 - 34 35 - 39 40 - 44 45 - 49 50 - 54 55 - 59 60 - 64 65 - 69 70 - 74 75 - 79 80 - 84 85 - 89 90 - 94 95 - 99 totals
Tribal 102 219 322 336 358 364 409 539 660 580 536 372 311 215 143 70 26 10 5 1 55781.8% 3.9% 5.8% 6.0% 6.4% 6.5% 7.3% 9.7% 11.8% 10.4% 9.6% 6.7% 5.6% 3.9% 2.6% 1.3% 0.5% 0.2% 0.1% 0.0%
Rural 33 90 141 181 226 271 431 528 784 890 839 655 453 258 150 81 38 4 2 2 60570.5% 1.5% 2.3% 3.0% 3.7% 4.5% 7.1% 8.7% 12.9% 14.7% 13.9% 10.8% 7.5% 4.3% 2.5% 1.3% 0.6% 0.1% 0.0% 0.0%
Grand Totals 135 309 463 517 584 635 840 1067 1444 1470 1375 1027 764 473 293 151 64 14 7 3 116351.2% 2.7% 4.0% 4.4% 5.0% 5.5% 7.2% 9.2% 12.4% 12.6% 11.8% 8.8% 6.6% 4.1% 2.5% 1.3% 0.6% 0.1% 0.1% 0.0%
Toksook Bay 14 70 95 57 37 35 41 47 37 17 20 17 25 8 3 6 0 2 1 1 5332.6% 13.1% 17.8% 10.7% 6.9% 6.6% 7.7% 8.8% 6.9% 3.2% 3.8% 3.2% 4.7% 1.5% 0.6% 1.1% 0.0% 0.4% 0.2% 0.2%
Source: SHARC database, Restricted Access Management Program, NMFS, Juneau
Age in Years (Number of SHARC Holders)
47

Table 6. Number of Hooks Usually Fished, Setline (Fixed) Gear, Alaska Halibut Subsistence Fishery, 2003
1 2 3 4 5 6 7 8 9 10 11 12 13 14 15 16 17 18 20 21 22 23 24 25 26 27 28 29 30 Missing2C 7,227 16 40 24 17 19 31 5 10 5 190 1 38 6 3 185 4 3 14 541 2 6 2 9 171 4 8 19 20 1,215 20 2,627
0.6% 1.5% 0.9% 0.6% 0.7% 1.2% 0.2% 0.4% 0.2% 7.2% 0.0% 1.4% 0.2% 0.1% 7.0% 0.1% 0.1% 0.5% 20.6% 0.1% 0.2% 0.1% 0.4% 6.5% 0.1% 0.3% 0.7% 0.8% 46.3% 0.8%
3A 2,610 9 8 1 5 18 7 0 4 0 100 0 9 1 0 58 0 1 5 164 0 0 0 2 72 0 0 9 3 251 18 7471.2% 1.1% 0.2% 0.6% 2.4% 0.9% 0.0% 0.6% 0.0% 13.4% 0.0% 1.2% 0.2% 0.0% 7.7% 0.0% 0.2% 0.7% 22.0% 0.0% 0.0% 0.0% 0.2% 9.7% 0.0% 0.0% 1.3% 0.4% 33.6% 2.4%
3B 263 16 0 1 0 0 0 0 0 0 6 0 0 0 0 3 0 0 0 9 0 1 1 0 1 0 0 0 1 26 1 6723.8% 0.0% 1.7% 0.0% 0.0% 0.0% 0.0% 0.0% 0.0% 9.1% 0.0% 0.0% 0.0% 0.0% 3.7% 0.0% 0.0% 0.0% 13.4% 0.0% 1.7% 2.1% 0.0% 1.8% 0.0% 0.0% 0.0% 1.8% 39.5% 1.6%
4A 154 6 0 0 1 0 0 0 0 0 1 0 4 0 0 4 0 0 1 5 0 0 0 0 4 0 0 0 0 14 0 4213.7% 0.0% 0.0% 3.1% 0.0% 0.0% 0.0% 0.0% 0.0% 3.1% 0.0% 9.6% 0.0% 0.0% 9.7% 0.0% 0.0% 3.1% 12.6% 0.0% 0.0% 0.0% 0.0% 9.6% 0.0% 0.0% 0.0% 0.0% 34.4% 0.0%
4B 24 4 0 0 0 0 0 0 0 0 0 0 0 0 0 3 0 0 0 3 0 0 0 0 0 0 0 0 0 1 1 1236.1% 0.0% 0.0% 0.0% 0.0% 0.0% 0.0% 0.0% 0.0% 0.0% 0.0% 0.0% 0.0% 0.0% 20.8% 0.0% 0.0% 0.0% 20.8% 0.0% 0.0% 0.0% 0.0% 0.0% 0.0% 0.0% 0.0% 0.0% 10.0% 10.0%
4C 289 12 0 0 0 0 0 0 0 0 0 0 0 6 0 0 0 0 0 0 0 0 0 0 0 0 0 0 0 21 6 4526.6% 0.0% 0.0% 0.0% 0.0% 0.0% 0.0% 0.0% 0.0% 0.0% 0.0% 0.0% 13.3% 0.0% 0.0% 0.0% 0.0% 0.0% 0.0% 0.0% 0.0% 0.0% 0.0% 0.0% 0.0% 0.0% 0.0% 0.0% 45.8% 13.3%
4D 50 0 0 0 0 0 0 0 0 0 3 0 0 0 0 3 0 0 0 5 0 0 0 0 0 0 0 0 0 7 0 190.0% 0.0% 0.0% 0.0% 0.0% 0.0% 0.0% 0.0% 0.0% 18.0% 0.0% 0.0% 0.0% 0.0% 18.0% 0.0% 0.0% 0.0% 28.5% 0.0% 0.0% 0.0% 0.0% 0.0% 0.0% 0.0% 0.0% 0.0% 36.0% 0.0%
4E 1,018 24 3 3 2 0 3 0 0 0 4 0 0 0 2 0 0 0 0 7 0 0 0 0 0 0 0 0 0 30 2 8030.4% 3.8% 3.1% 2.1% 0.0% 4.2% 0.0% 0.0% 0.0% 5.0% 0.0% 0.0% 0.0% 2.3% 0.0% 0.0% 0.0% 0.0% 8.6% 0.0% 0.0% 0.0% 0.0% 0.0% 0.0% 0.0% 0.0% 0.0% 38.0% 2.1%
Alaska 11,635 87 51 29 24 37 42 5 14 5 305 1 51 13 4 255 4 4 21 734 2 7 4 11 249 4 8 29 24 1,566 48 3,6372.4% 1.4% 0.8% 0.7% 1.0% 1.1% 0.1% 0.4% 0.1% 8.4% 0.0% 1.4% 0.4% 0.1% 7.0% 0.1% 0.1% 0.6% 20.2% 0.1% 0.2% 0.1% 0.3% 6.8% 0.1% 0.2% 0.8% 0.7% 43.1% 1.3%
1 Number of fishers using setline (fixed) gear. Due to rounding, totals do not exactly match Table 4.
Source: Alaska Department of Fish and Game, Division of Subsistence, SHARC Survey, 2004
Grand Total1
Regulatory Area
SHARC holders
Number of Hooks
48

49
Table 7. Average Net Weight of Subsistence and Sport Harvested Halibut, 2003, by Regulatory Area
Area Number
Pounds, Net
WeightAverage per fish Number
Pounds, Net
WeightAverage per fish Number
Pounds, Net
WeightAverage per fish
2C 24,481 627,959 25.7 5,226 111,502 21.3 29,707 739,461 24.93A 12,313 279,613 22.7 4,597 103,804 22.6 16,910 383,417 22.73B 1,334 27,965 21.0 139 3,844 27.7 1,473 31,809 21.64A 829 20,727 25.0 216 6,068 28.1 1,045 26,795 25.64B 74 2,472 33.4 44 1,232 28.0 118 3,704 31.44C 1,234 23,756 19.3 502 18,387 36.6 1,736 42,143 24.34D 75 4,380 58.4 0 0 0.0 75 4,380 58.44E 3,586 54,458 15.2 60 1,110 18.5 3,646 55,568 15.2
Alaska 43,926 1,041,330 23.7 10,784 245,947 22.8 54,710 1,287,277 23.5
1 Sport harvest of halibut by SHARC holders.
Source: Alaska Department of Fish and Game, Division of Subsistence, SHARC Survey, 2004
Subsistence Methods Sport Harvest1 Total Halibut
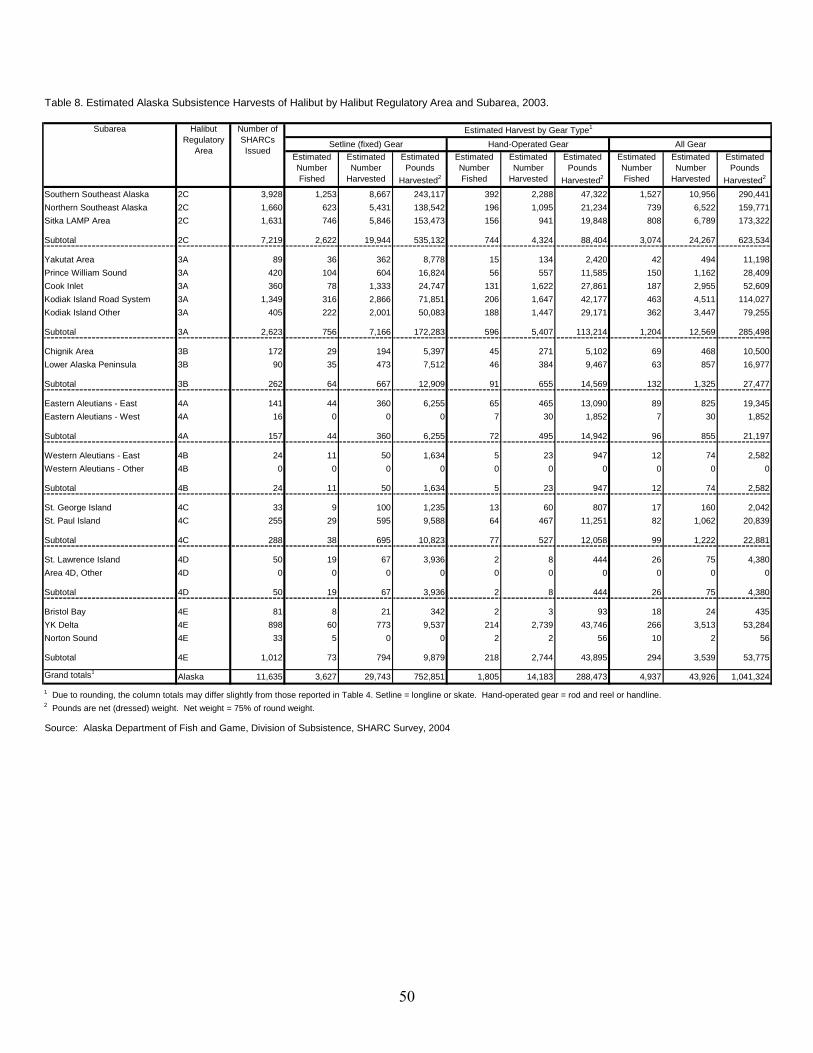
Table 8. Estimated Alaska Subsistence Harvests of Halibut by Halibut Regulatory Area and Subarea, 2003.
Estimated Number Fished
Estimated Number
Harvested
Estimated Pounds
Harvested2
Estimated Number Fished
Estimated Number
Harvested
Estimated Pounds
Harvested2
Estimated Number Fished
Estimated Number
Harvested
Estimated Pounds
Harvested2
Southern Southeast Alaska 2C 3,928 1,253 8,667 243,117 392 2,288 47,322 1,527 10,956 290,441Northern Southeast Alaska 2C 1,660 623 5,431 138,542 196 1,095 21,234 739 6,522 159,771Sitka LAMP Area 2C 1,631 746 5,846 153,473 156 941 19,848 808 6,789 173,322
Subtotal 2C 7,219 2,622 19,944 535,132 744 4,324 88,404 3,074 24,267 623,534
Yakutat Area 3A 89 36 362 8,778 15 134 2,420 42 494 11,198Prince William Sound 3A 420 104 604 16,824 56 557 11,585 150 1,162 28,409Cook Inlet 3A 360 78 1,333 24,747 131 1,622 27,861 187 2,955 52,609Kodiak Island Road System 3A 1,349 316 2,866 71,851 206 1,647 42,177 463 4,511 114,027Kodiak Island Other 3A 405 222 2,001 50,083 188 1,447 29,171 362 3,447 79,255
Subtotal 3A 2,623 756 7,166 172,283 596 5,407 113,214 1,204 12,569 285,498
Chignik Area 3B 172 29 194 5,397 45 271 5,102 69 468 10,500Lower Alaska Peninsula 3B 90 35 473 7,512 46 384 9,467 63 857 16,977
Subtotal 3B 262 64 667 12,909 91 655 14,569 132 1,325 27,477
Eastern Aleutians - East 4A 141 44 360 6,255 65 465 13,090 89 825 19,345Eastern Aleutians - West 4A 16 0 0 0 7 30 1,852 7 30 1
Subtotal 4A 157 44 360 6,255 72 495 14,942 96 855 21,197
Western Aleutians - East 4B 24 11 50 1,634 5 23 947 12 74 2,582Western Aleutians - Other 4B 0 0 0 0 0 0 0 0 0 0
Subtotal 4B 24 11 50 1,634 5 23 947 12 74 2,582
St. George Island 4C 33 9 100 1,235 13 60 807 17 160 2,042St. Paul Island 4C 255 29 595 9,588 64 467 11,251 82 1,062 20,839
Subtotal 4C 288 38 695 10,823 77 527 12,058 99 1,222 22,881
St. Lawrence Island 4D 50 19 67 3,936 2 8 444 26 75 4,380Area 4D, Other 4D 0 0 0 0 0 0 0 0 0 0
Subtotal 4D 50 19 67 3,936 2 8 444 26 75 4,380
Bristol Bay 4E 81 8 21 342 2 3 93 18 24 435YK Delta 4E 898 60 773 9,537 214 2,739 43,746 266 3,513 53,284Norton Sound 4E 33 5 0 0 2 2 56 10 2
Subtotal 4E 1,012 73 794 9,879 218 2,744 43,895 294 3,539 53,775
Grand totals
,852
56
1Alaska 11,635 3,627 29,743 752,851 1,805 14,183 288,473 4,937 43,926 1,041,324
1 Due to rounding, the column totals may differ slightly from those reported in Table 4. Setline = longline or skate. Hand-operated gear = rod and reel or handline.2 Pounds are net (dressed) weight. Net weight = 75% of round weight.
Source: Alaska Department of Fish and Game, Division of Subsistence, SHARC Survey, 2004
Hand-Operated Gear All GearEstimated Harvest by Gear Type1Subarea Number of
SHARCs Issued
Halibut Regulatory
AreaSetline (fixed) Gear
50

Table 9. Estimated Sport Harvests of Halibut by SHARC Type and Halibut Regulatory Area, 20031
Number of SHARCs Issued
Estimated Number
Percent Estimated Number
Estimated Pounds, Net
Weight
Tribal SHARCs:
Area 2 C Subtotal 3,132 447 14.3% 1,206 30,017Area 3 A Subtotal 936 169 18.1% 714 16,477Area 3B Subtotal 204 25 12.3% 98 2,939Area 4A Subtotal 70 13 18.6% 27 1,073Area 4B Subtotal 6 1 16.7% 2 45Area 4C Subtotal 277 18 6.5% 502 18,387Area 4D Subtotal 47 0 0.0% 0 0Area 4E Subtotal 906 17 1.9% 47 863
Tribal Subtotals 5,578 690 12.4% 2,596 69,801
Rural SHARCs:
Area 2C Subtotal 4,095 1,144 27.9% 4,020 81,485Area 3A Subtotal 1,674 684 40.9% 3,883 87,327Area 3B Subtotal 59 13 22.0% 41 905Area 4A Subtotal 84 34 40.5% 189 4,995Area 4B Subtotal 18 7 38.9% 42 1,187Area 4C Subtotal 12 0 0.0% 0 0Area 4D Subtotal 3 0 0.0% 0 0Area 4E Subtotal 112 8 7.1% 13 247
Rural Subtotals 6,057 1,890 31.2% 8,188 176,146
Alaska Totals 11,635 2,580 22.2% 10,784 245,947
Tribal and Rural SHARCs Combined:
Area 2C Total 7,227 1,591 31.8% 5,226 111,502Area 3A Total 2,610 853 43.2% 4,597 103,804Area 3B Total 263 38 21.7% 139 3,844Area 4A Total 154 47 49.5% 216 6,068Area 4B Total 24 8 80.0% 44 1,232Area 4C Total 289 18 30.5% 502 18,387Area 4D Total 50 0 0.0% 0 0Area 4E Total 1,018 25 7.8% 60 1,110
Alaska Totals 11,635 2,580 22.2% 10,784 245,947
1 SHARC = Subsistence Halibut Registration Certificate, issued by the National Marine Fisheries Service
Source: Alaska Department of Fish and Game, Division of Subsistence, SHARC Survey, 2004
Sport Fished? Sport Harvest
Habibut Regulatory Area
51

Table 10. Estimated Incidental Harvests of Lingcod and Rockfish by SHARC Type and Halibut Regulatory Area, 20031
Number of SHARCs Issued
Estimated Number
Percent Estimated Number with
Harvest
Percent of Those Who Subsistence Fished for
Halibut
Estimated Number of
fish
Estimated Number with
Harvest
Percent of Those Who Subsistence Fished for
Halibut
Estimated Number of
fish
Tribal SHARCs:
Area 2 C Subtotal 3,132 968 30.9% 124 12.8% 557 276 28.5% 2,962Area 3 A Subtotal 936 358 38.2% 50 14.0% 221 69 19.3% 1,211Area 3B Subtotal 204 90 44.1% 4 4.4% 60 6 6.7% 154Area 4A Subtotal 70 45 64.3% 9 20.0% 419 20 44.4% 846Area 4B Subtotal 6 4 66.7% 0 0.0% 0 0 0.0% 0Area 4C Subtotal 277 101 36.5% 18 17.8% 99 12 11.9% 93Area 4D Subtotal 47 25 53.2% 3 12.0% 61 2 8.0% 4Area 4E Subtotal 906 245 27.0% 33 13.5% 101 13 5.3% 75
Tribal Subtotals 5,578 1,836 32.9% 241 13.1% 1,518 398 21.7% 5,345
Rural SHARCs:
Area 2C Subtotal 4,095 2,114 51.6% 328 15.5% 1,128 643 30.4% 7,005Area 3A Subtotal 1,674 827 49.4% 110 13.3% 390 176 21.3% 2,287Area 3B Subtotal 59 44 74.6% 9 20.5% 142 5 11.4% 86Area 4A Subtotal 84 48 57.1% 3 6.3% 29 7 14.6% 106Area 4B Subtotal 18 9 50.0% 4 44.4% 43 3 33.3% 5Area 4C Subtotal 12 4 33.3% 0 0.0% 0 0 0.0% 0Area 4D Subtotal 3 1 33.3% 0 0.0% 0 0 0.0% 0Area 4E Subtotal 112 59 52.7% 4 6.8% 48 7 11.9% 36
Rural Subtotals 6,057 3,106 51.3% 458 14.7% 1,780 841 27.1% 9,525
Totals 11,635 4,942 42.5% 699 14.1% 3,298 1,239 25.1% 14,870
Tribal and Rural SHARCs Combined:
Area 2C Total 7,227 3,082 42.6% 452 14.7% 1,685 919 29.8% 9,967Area 3A Total 2,610 1,185 45.4% 160 13.5% 611 245 20.7% 3,498Area 3B Total 263 134 51.0% 13 9.7% 202 11 8.2% 240Area 4A Total 154 93 60.4% 12 12.9% 448 27 29.0% 952Area 4B Total 24 13 54.2% 4 30.8% 43 3 23.1% 5Area 4C Total 289 105 36.3% 18 17.1% 99 12 11.4% 93Area 4D Total 50 26 52.0% 3 11.5% 61 2 7.7% 4Area 4E Total 1,018 304 29.9% 37 12.2% 149 20 6.6% 111
Totals 11,635 4,942 42.5% 699 14.1% 3,298 1,239 25.1% 14,870
1 SHARC = Subsistence Halibut Registration Certificate, issued by the National Marine Fisheries Service
Source: Alaska Department of Fish and Game, Division of Subsistence, SHARC Survey, 2004
Rockfish Incidental HarvestLingcod Incidental Harvest
Habibut Regulatory Area
Subsistence Fished for Halibut?
52

Table 11. Estimated Harvests of Lingcod and Rockfish by SHARC Holders while Subsistence Fishing for Halibut, by Geographic Area, 2003
Estimated Number Fished
Estimated Number
Harvested
Estimated Number Fished
Estimated Number
HarvestedSouthern Southeast Alaska 2C 3,928 146 551 432 4,366Northern Southeast Alaska 2C 1,660 47 138 136 1,194Sitka LAMP Area 2C 1,631 258 993 348 4,355
Subtotal 2C 7,219 451 1,682 916 9,915
Yakutat Area 3A 89 20 77 12 192Prince William Sound 3A 420 35 143 62 752Cook Inlet 3A 360 20 117 37 815Kodiak Island Road System 3A 1,349 51 144 92 955Kodiak Island Other 3A 405 33 131 50 833
Subtotal 3A 2,623 159 612 253 3,547
Chignik Area 3B 172 8 24 3 43Lower Alaska Peninsula 3B 90 5 178 8 197
Subtotal 3B 262 13 202 11 240
Eastern Aleutians - East 4A 141 12 447 25 912Eastern Aleutians - West 4A 16 0 0 2 40
Subtotal 4A 157 12 447 27 952
Western Aleutians - East 4B 24 4 43 2 5
Subtotal 4B 24 4 43 2 5
St. George Island 4C 33 0 0 0 0St. Paul Island 4C 255 18 99 12 93
Subtotal 4C 288 18 99 12 93
St. Lawrence Island 4D 50 3 61 2 4
Subtotal 4D 50 3 61 2 4
Bristol Bay 4E 81 0 0 1 10YK Delta 4E 898 37 148 17 73Norton Sound 4E 33 0 0 2 28
Subtotal 4E 1,012 37 148 20 111
Grand Total1 Alaska 11,635 697 3,294 1,243 14,867
1 Due to rounding, the column totals differ slightly from those reported in Table 10.
Source: Alaska Department of Fish and Game, Division of Subsistence, SHARC Survey, 2004
Estimated Harvest1Subarea Regulatory Area
Number of SHARCs Issued
Lingcod Rockfish
53

54
Table 12. Comparison of "Subsistence" Halibut Harvest Estimates by Regulatory Area, Pounds Net Weight
Regulatory Area
Removed from Commercial Gear
Other Non-Commercial Gear3 Rod and Reel Total
w/o Commercial
retentionSetline
(Fixed) GearRod and Reel or Handline
All Subsistence
Methods "Sport"5 TotalDistrict 2C 82,632 500,095 582,727 500,095 538,484 89,476 627,959 111,502 739,461District 3A 25,775 29,359 146,321 201,454 175,679 167,667 111,944 279,613 103,804 383,417District 3B 17,008 18,174 4,027 39,209 22,201 12,684 15,282 27,965 3,844 31,809District 4A 12,774 24,374 88,330 125,477 112,704 6,458 14,269 20,727 6,068 26,795District 4B 320 2,961 413 3,695 3,375 1,479 992 2,472 1,232 3,704District 4C 14,907 40,958 94 55,959 41,051 11,698 12,058 23,756 18,387 42,143District 4D4 3,936 444 4,380 0 4,380District 4E 259 69,440 267 69,966 69,707 10,452 44,009 54,458 1,110 55,568
Totals 153,674 185,266 739,546 1,078,486 924,811 752,858 288,474 1,041,330 245,947 1,287,277
1 As estimated by R. Wolfe in a report to the Alaska Board of Fisheries, May 2001. Based on data in the Community Profile Database (Scott et al. 2001)This estimate is based on household surveys for varying harvest years. Per capita harvests from those studies are applied to the 2000 population of communities to develop a harvest estimate. Wolfe reported the data in round weight. Weights have been converted to net weight (net weight = 75% round weight)2 ADF&G Division of Subsistence SHARC survey, 20043 In 2C and Yakutat in 3A, surveys did not ask about "other non-commercial gear." This category primarily includes setlines (longlines or skate).4 No harvest data available prior to 20035 By holders of SHARCs only.
Estimated Pounds, 20032Estimated Pounds, 20001

55
Table 13. Estimated Harvests of Halibut by Gear Type and Partipication in the Subsistence and Sport Fisheries, Selected Alaska Communities, 20031
Community
Number of SHARCs Issued2
Estimated Number Fished
Estimated Pounds
Harvested
Estimated Number Fished
Estimated Pounds
Harvested
Estimated Number Fished
Estimated Pounds
Harvested
Estimated Number Fished
Estimated Pounds
Harvested
Estimated Number Fished
Estimated Pounds
Harvested
Cordova 358 68 7,613 40 7,885 102 15,498 144 11,534 194 27,032Kodiak 1,320 438 101,575 278 51,678 646 153,254 498 68,170 858 221,424Petersburg 1,047 330 41,704 138 14,013 415 55,718 268 19,611 523 75,329Port Graham 52 10 4,398 28 7,056 35 11,454 3 156 36 11,610Sitka 1,639 760 155,276 160 19,604 821 174,880 401 32,408 956 207,288Toksook Bay 532 8 3,790 47 20,709 54 24,500 0 0 54 24,500Unalaska3 92 39 6,713 31 4,146 50 10,860 33 5,519 70 16,379
1 For data on all communities, see Appendix Tables A-4, A-5, and A-62 SHARC = Subsistence halibut registration certificate; includes all SHARC holders living in the community3 Includes Dutch Harbor
Source: Alaska Department of Fish and Game, Division of Subsistence SHARC Survey, 2004
Sport Harvest All HarvestsSubsistence Harvests
Setline (fixed) Gear Hand-Operated Gear Total Subsistence Harvest
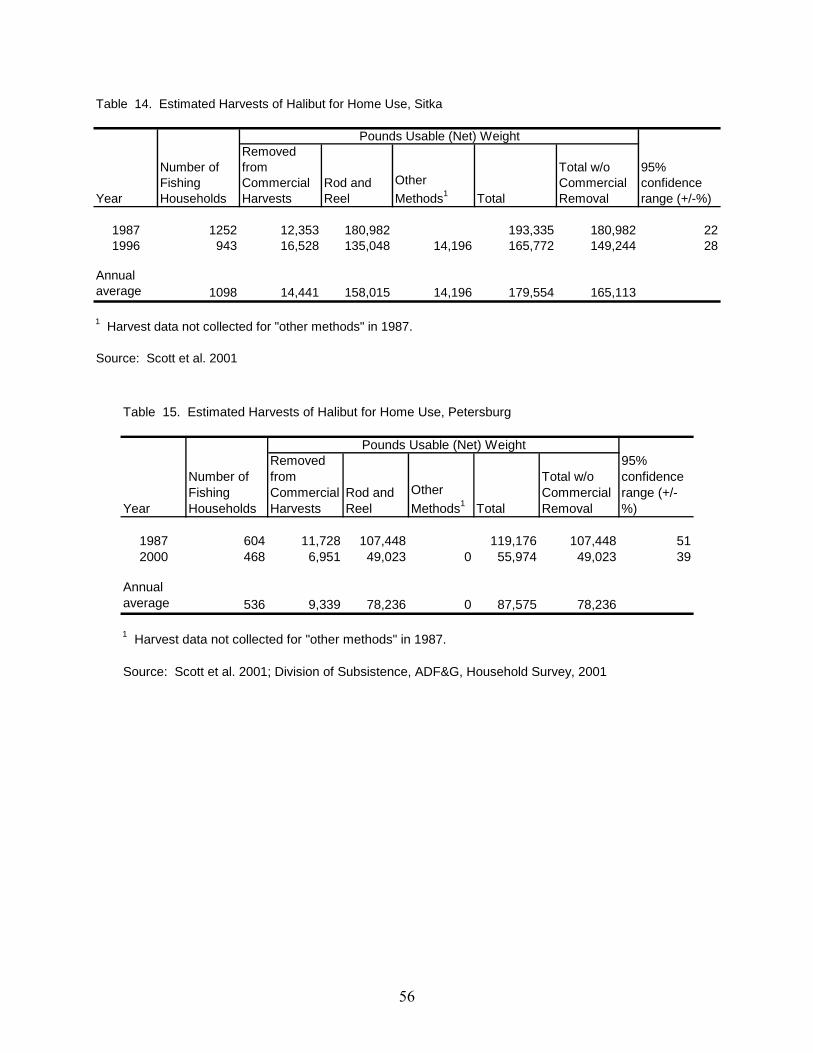
Table 14. Estimated Harvests of Halibut for Home Use, Sitka
Year
Number of Fishing Households
Removed from Commercial Harvests
Rod and Reel
Other Methods1 Total
Total w/o Commercial Removal
95% confidence range (+/-%)
1987 1252 12,353 180,982 193,335 180,982 221996 943 16,528 135,048 14,196 165,772 149,244 28
Annual average 1098 14,441 158,015 14,196 179,554 165,113
1 Harvest data not collected for "other methods" in 1987.
Source: Scott et al. 2001
Pounds Usable (Net) Weight
Table 15. Estimated Harvests of Halibut for Home Use, Petersburg
Year
Number of Fishing Households
Removed from Commercial Harvests
Rod and Reel
Other Methods1 Total
Total w/o Commercial Removal
95% confidence range (+/-%)
1987 604 11,728 107,448 119,176 107,448 512000 468 6,951 49,023 0 55,974 49,023 39
Annual average 536 9,339 78,236 0 87,575 78,236
1 Harvest data not collected for "other methods" in 1987.
Source: Scott et al. 2001; Division of Subsistence, ADF&G, Household Survey, 2001
Pounds Usable (Net) Weight
56

Table 16. Estimated Harvests of Halibut for Home Use, Cordova
Year
Number of Fishing Households
Removed from Commercial Harvests
Rod and Reel
Other Methods Total
Total w/o Commercial Removal
95% confidence range (+/-%)
1985 228 3,776 31,002 1,752 36,530 32,754 291988 343 18,701 119,873 348 138,922 120,221 621991 272 25,107 25,493 116 50,716 25,609 331992 401 11,383 60,612 0 71,995 60,612 481993 382 3,762 39,556 2,056 45,374 41,612 321997 321 3,551 58,647 4,252 66,450 62,899 41
Annual average1 325 11,047 55,864 1,421 68,331 57,285
Source: Scott et al. 2001
Pounds Usable (Net) Weight
Table 17. Estimated Harvests of Halibut for Home Use, Port Graham
Year
Number of Fishing Households
Removed from Commercial Harvests
Rod and Reel
Other Methods Total
Total w/o Commercial Removal
95% confidence range (+/-%)
1987 42 1,237 3,809 3,389 8,435 7,198 141989 29 3,217 1,482 1,222 5,921 2,704 471990 32 3,003 4,106 3,171 10,280 7,277 221991 35 1,663 2,332 4,846 8,841 7,178 171992 42 24 7,867 3,365 11,256 11,232 141993 42 86 3,105 1,346 4,537 4,451 141997 36 79 2,881 5,326 8,286 8,207 28
Annual average1 38 1,015 4,017 3,574 8,606 7,591
1 Excludes 1989, the year of the Exxon Valdez Oil Spill
Source: Scott et al. 2001
Pounds Usable (Net) Weight
57
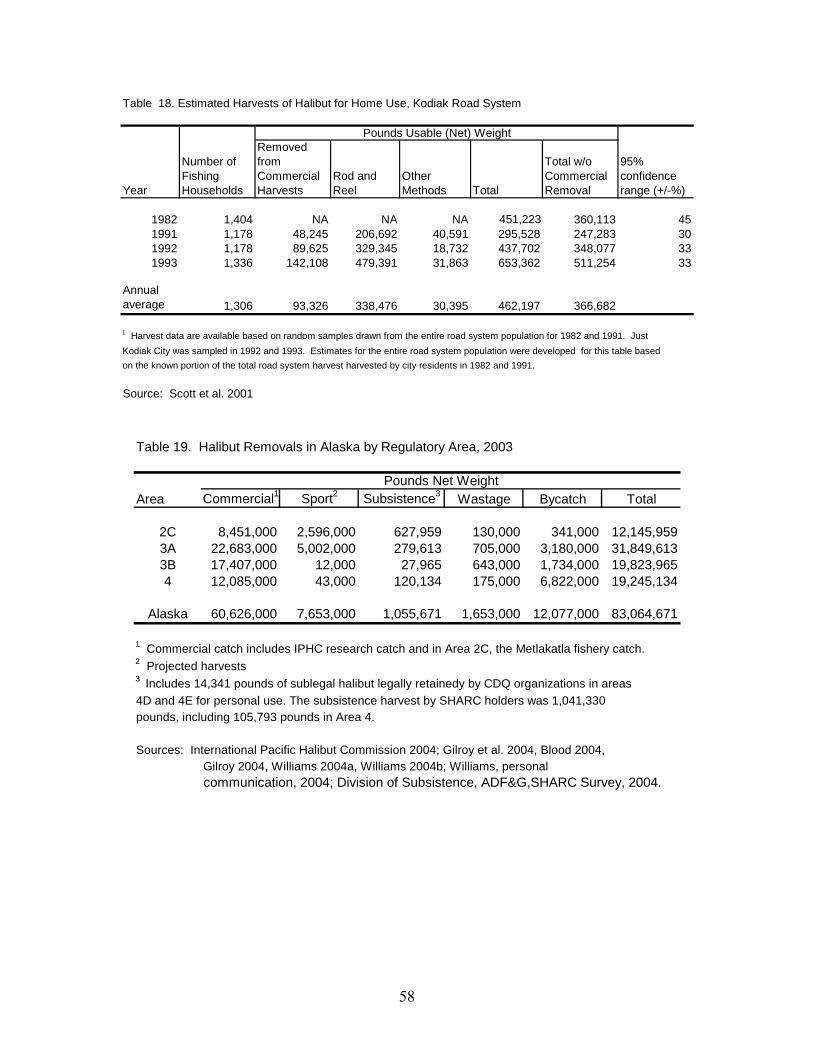
Table 18. Estimated Harvests of Halibut for Home Use, Kodiak Road System
Year
Number of Fishing Households
Removed from Commercial Harvests
Rod and Reel
Other Methods Total
Total w/o Commercial Removal
95% confidence range (+/-%)
1982 1,404 NA NA NA 451,223 360,113 451991 1,178 48,245 206,692 40,591 295,528 247,283 301992 1,178 89,625 329,345 18,732 437,702 348,077 331993 1,336 142,108 479,391 31,863 653,362 511,254 33
Annual average 1,306 93,326 338,476 30,395 462,197 366,682
1 Harvest data are available based on random samples drawn from the entire road system population for 1982 and 1991. JustKodiak City was sampled in 1992 and 1993. Estimates for the entire road system population were developed for this table based on the known portion of the total road system harvest harvested by city residents in 1982 and 1991.
Source: Scott et al. 2001
Pounds Usable (Net) Weight
Table 19. Halibut Removals in Alaska by Regulatory Area, 2003
Area Commercial1 Sport2 Subsistence3 Wastage Bycatch Total
2C 8,451,000 2,596,000 627,959 130,000 341,000 12,145,9593A 22,683,000 5,002,000 279,613 705,000 3,180,000 31,849,6133B 17,407,000 12,000 27,965 643,000 1,734,000 19,823,9654 12,085,000 43,000 120,134 175,000 6,822,000 19,245,134
Alaska 60,626,000 7,653,000 1,055,671 1,653,000 12,077,000 83,064,671
1 Commercial catch includes IPHC research catch and in Area 2C, the Metlakatla fishery catch.2 Projected harvests3 Includes 14,341 pounds of sublegal halibut legally retainedy by CDQ organizations in areas 4D and 4E for personal use. The subsistence harvest by SHARC holders was 1,041,330pounds, including 105,793 pounds in Area 4.
Sources: International Pacific Halibut Commission 2004; Gilroy et al. 2004, Blood 2004, Gilroy 2004, Williams 2004a, Williams 2004b; Williams, personal communication, 2004; Division of Subsistence, ADF&G,SHARC Survey, 2004.
Pounds Net Weight
58
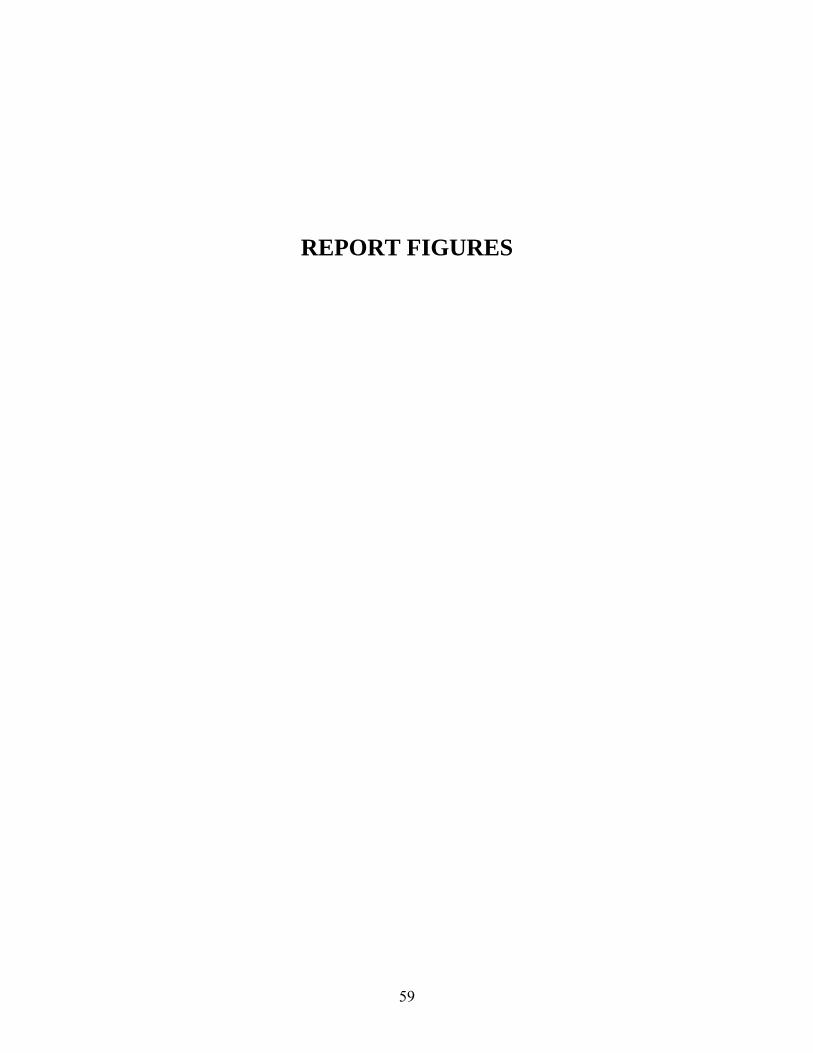
REPORT FIGURES
59

60
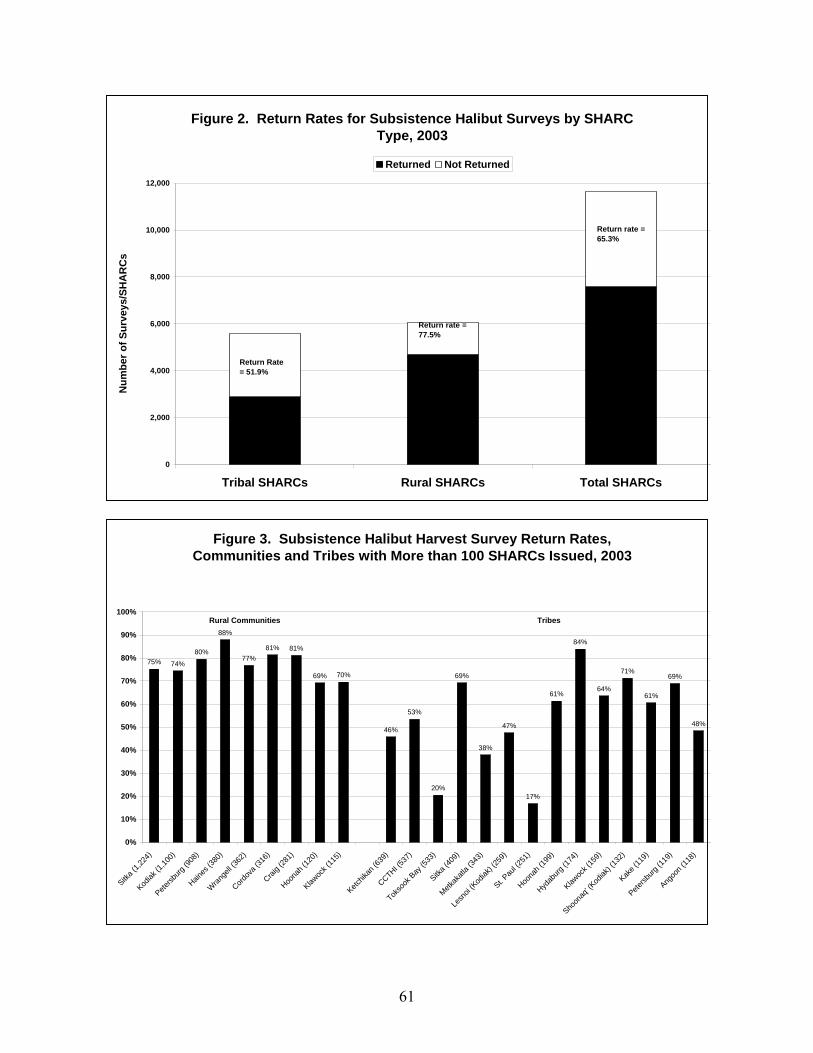
Figure 2. Return Rates for Subsistence Halibut Surveys by SHARC Type, 2003
0
2,000
4,000
6,000
8,000
10,000
12,000
Tribal SHARCs Rural SHARCs Total SHARCs
Num
ber o
f Sur
veys
/SH
AR
Cs
Returned Not Returned
Return Rate = 51.9%
Return rate = 77.5%
Return rate = 65.3%
Figure 3. Subsistence Halibut Harvest Survey Return Rates, Communities and Tribes with More than 100 SHARCs Issued, 2003
75% 74%
80%
88%
77%81% 81%
69% 70%
46%
53%
20%
69%
38%
47%
17%
61%
84%
64%
71%
61%
69%
48%
0%
10%
20%
30%
40%
50%
60%
70%
80%
90%
100%
Sitka (
1,224
)
Kodiak
(1,10
0)
Petersb
urg (9
08)
Haines
(380
)
Wrange
ll (36
2)
Cordov
a (31
6)
Craig (
281)
Hoona
h (12
0)
Klawoc
k (11
5)
Ketchik
an (6
39)
CCTHI (537
)
Tokso
ok B
ay (5
33)
Sitka (
409)
Metkak
atla (
343)
Lesn
oi (K
odiak
) (25
9)
St. Pau
l (251
)
Hoona
h (19
9)
Hydab
urg (1
74)
Klawoc
k (15
9)
Shoon
aq' (K
odiak
) (13
2)
Kake (
119)
Petersb
urg (1
19)
Angoo
n (11
8)
Rural Communities Tribes
61
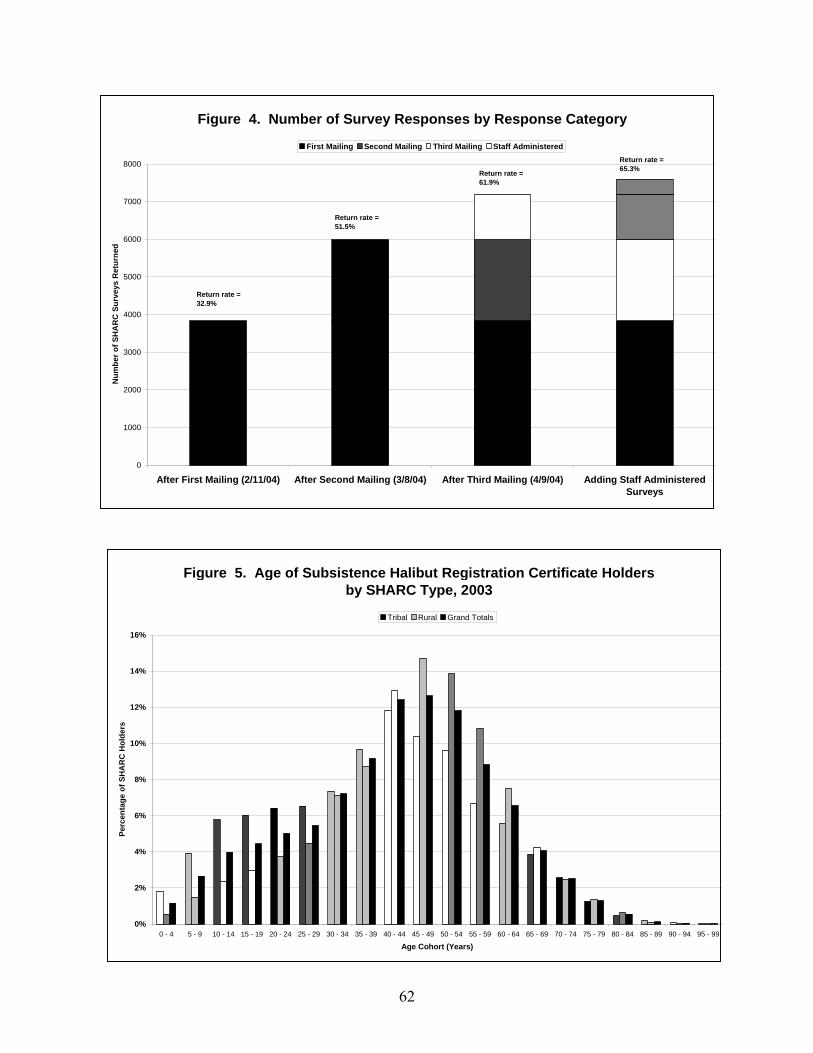
Figure 4. Number of Survey Responses by Response Category
0
1000
2000
3000
4000
5000
6000
7000
8000
After First Mailing (2/11/04) After Second Mailing (3/8/04) After Third Mailing (4/9/04) Adding Staff AdministeredSurveys
Num
ber o
f SH
AR
C S
urve
ys R
etur
ned
First Mailing Second Mailing Third Mailing Staff Administered
Return rate = 32.9%
Return rate = 51.5%
Return rate = 61.9%
Return rate = 65.3%
Figure 5. Age of Subsistence Halibut Registration Certificate Holders by SHARC Type, 2003
0%
2%
4%
6%
8%
10%
12%
14%
16%
0 - 4 5 - 9 10 - 14 15 - 19 20 - 24 25 - 29 30 - 34 35 - 39 40 - 44 45 - 49 50 - 54 55 - 59 60 - 64 65 - 69 70 - 74 75 - 79 80 - 84 85 - 89 90 - 94 95 - 99
Age Cohort (Years)
Perc
enta
ge o
f SH
AR
C H
olde
rs
Tribal Rural Grand Totals
62

Figure 6. Estimated Number of Subsistence Halibut Fishers in Alaska, 2003, by Regulatory Area
3,082
1,185
134 9313
10526
304
0
500
1000
1500
2000
2500
3000
3500
Area 2C:Southeast
Alaska
Area 3A:Southcentral
Alaska
Area 3B: AlaskaPeninsula
Area 4A: EasternAleutians
Area 4B:WesternAleutians
Area 4C: PribilofIslands
Area 4D: CentralBering Sea
Area 4E: EastBering Sea
Coast
Figure 7. Estimated Subsistence Harvest of Halibut in Alaska, 2003, by Regulatory Area, in Pounds Net Weight
627,959
279,613
27,965 20,7272,472
23,7564,380
54,458
0
100,000
200,000
300,000
400,000
500,000
600,000
700,000
Area 2C:Southeast
Alaska
Area 3A:Southcentral
Alaska
Area 3B: AlaskaPeninsula
Area 4A:Eastern
Aleutians
Area 4B:WesternAleutians
Area 4C:Pribilof Islands
Area 4D:Central Bering
Sea
Area 4E: EastBering Sea
Coast
Poun
ds o
f Hal
ibut
, Net
Wei
ght
63

Figure 8. Percentage of Subsistence Halibut Harvest by Regulatory Area, 2003
Area 2C 60.3%
Area 3A 26.9%
Area 4B 0.2%
Area 4C 2.3%
Area 4A 2.0%
Area 4D 0.4%
Area 3B 2.7%
Area 4E 5.2%
N= 1.041 million lbs net weight
Figure 9. Percentage of Rural Community Subsistence Halibut Harvest by Community, 2003
23.6%
22.2%
8.8%
5.1% 5.0% 4.8%
3.2%2.5% 2.4% 2.3% 2.1%
1.4%
16.5%
0%
5%
10%
15%
20%
25%
KODIAK
SITKA
PETERSBURG
CRAIG
HAINES
WRANGELL
HOONAH
SELDOVIA
CORDOVA
THORNE BAY
KLAW
OCK
UNALASKA/D
UTCH HARBOR
All Othe
r Rura
l Com
munitie
s
Perc
enta
ge o
f Tot
al P
ound
s H
arve
sted
64

Figure 10. Percentage of Tribal Subsistence Halibut Harvest by Tribe, 2003
9.9%9.1%
8.4%
6.5%5.7% 5.5% 5.2% 4.7% 4.5% 4.4%
3.6% 3.1%
29.5%
0%
5%
10%
15%
20%
25%
30%
35%
Sitka Hoonah CentralCouncil THI
Ketchikan Shoonaq'(Kodiak)
Metkakatla Toksookbay
St. Paul Hydaburg Klawock Angoon Kake All OtherTribes
Perc
enta
ge o
f Tot
al P
ound
s H
arve
sted
Figure 11. Average Subsistence Harvest of Halibut per Fisher in Alaska, 2003, by Regulatory Area, in Pounds Net Weight
204
236
209
223
190
226
168179
211
0
50
100
150
200
250
Area 2C:Southeast
Alaska
Area 3A:Southcentral
Alaska
Area 3B:Alaska
Peninsula
Area 4A:Eastern
Aleutians
Area 4B:WesternAleutians
Area 4C:PribilofIslands
Area 4D:Central Bering
Sea
Area 4E: EastBering Sea
Coast
Alaska
Poun
ds o
f Hal
ibut
, Net
Wei
ght,
per F
ishe
r
65

Figure 12. Average Subsistence Harvest of Halibut per Fisher in Alaska, 2003, by Regulatory Area, in Number of Fish
7.9
10.410.0
8.9
5.7
11.8
2.9
11.8
8.9
0
2
4
6
8
10
12
14
Area 2C:Southeast
Alaska
Area 3A:Southcentral
Alaska
Area 3B:Alaska
Peninsula
Area 4A:Eastern
Aleutians
Area 4B:WesternAleutians
Area 4C:PribilofIslands
Area 4D:Central Bering
Sea
Area 4E: EastBering Sea
Coast
Alaska
Num
ber o
f Hal
ibut
per
Fis
her
Figure 13. Percentage of Subsistence Halibut Harvest by Gear Type by Regulatory Area, 2003
85.8%
60.0%
45.4%
31.2%
59.9%
49.2%
89.9%
19.2%
72.3%
14.2%
40.0%
54.6%
68.8%
40.1%
50.8%
10.1%
80.8%
27.7%
0%
10%
20%
30%
40%
50%
60%
70%
80%
90%
100%
2C 3A 3B 4A 4B 4C 4D 4E Alaska
Regulatory Area
Perc
enta
ge o
f Sub
sist
ence
Hal
ibut
Har
vest
Setline (Fixed) Gear Hand-Operated Gear
66
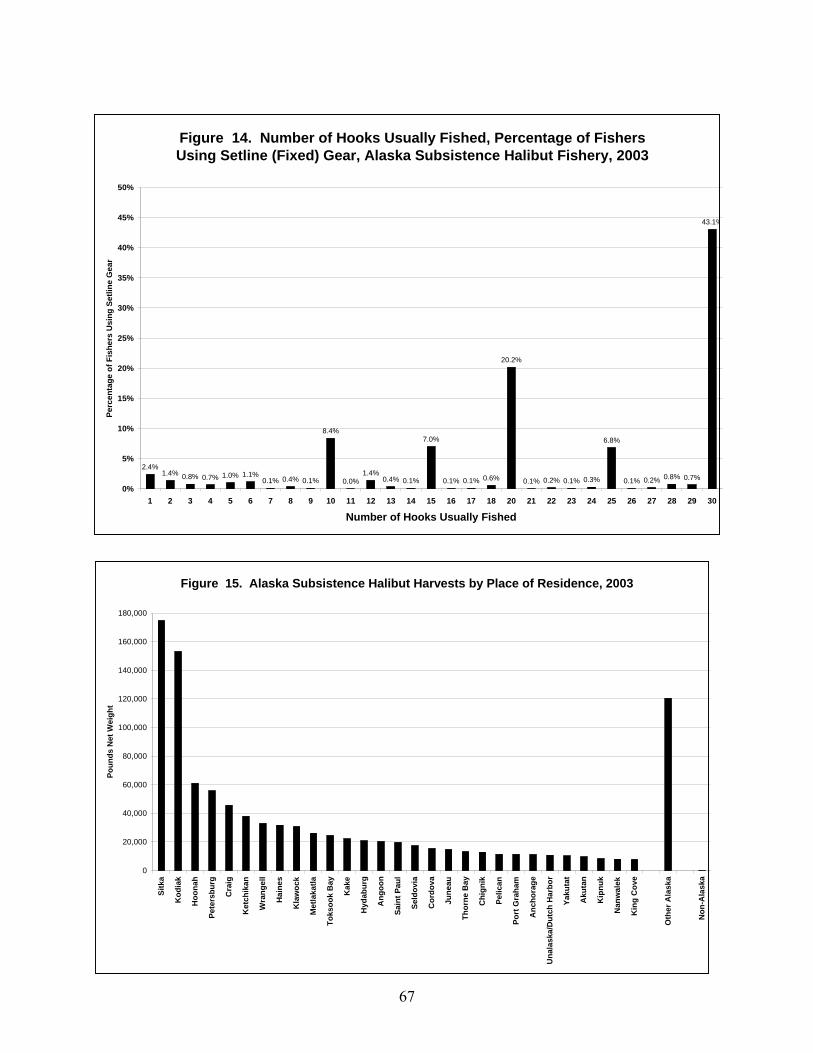
Figure 14. Number of Hooks Usually Fished, Percentage of Fishers Using Setline (Fixed) Gear, Alaska Subsistence Halibut Fishery, 2003
2.4%1.4% 0.8% 0.7% 1.0% 1.1%
0.1% 0.4% 0.1%
8.4%
0.0%1.4%
0.4% 0.1%
7.0%
0.1% 0.1% 0.6%
20.2%
0.1% 0.2% 0.1% 0.3%
6.8%
0.1% 0.2% 0.8% 0.7%
43.1%
0%
5%
10%
15%
20%
25%
30%
35%
40%
45%
50%
1 2 3 4 5 6 7 8 9 10 11 12 13 14 15 16 17 18 20 21 22 23 24 25 26 27 28 29 30
Number of Hooks Usually Fished
Perc
enta
ge o
f Fis
hers
Usi
ng S
etlin
e G
ear
Figure 15. Alaska Subsistence Halibut Harvests by Place of Residence, 2003
0
20,000
40,000
60,000
80,000
100,000
120,000
140,000
160,000
180,000
Sitk
a
Kod
iak
Hoo
nah
Pete
rsbu
rg
Cra
ig
Ket
chik
an
Wra
ngel
l
Hai
nes
Kla
woc
k
Met
laka
tla
Toks
ook
Bay
Kak
e
Hyd
abur
g
Ang
oon
Sain
t Pau
l
Seld
ovia
Cor
dova
June
au
Thor
ne B
ay
Chi
gnik
Pelic
an
Port
Gra
ham
Anc
hora
ge
Una
lask
a/D
utch
Har
bor
Yaku
tat
Aku
tan
Kip
nuk
Nan
wal
ek
Kin
g C
ove
Oth
er A
lask
a
Non
-Ala
ska
Poun
ds N
et W
eigh
t
67
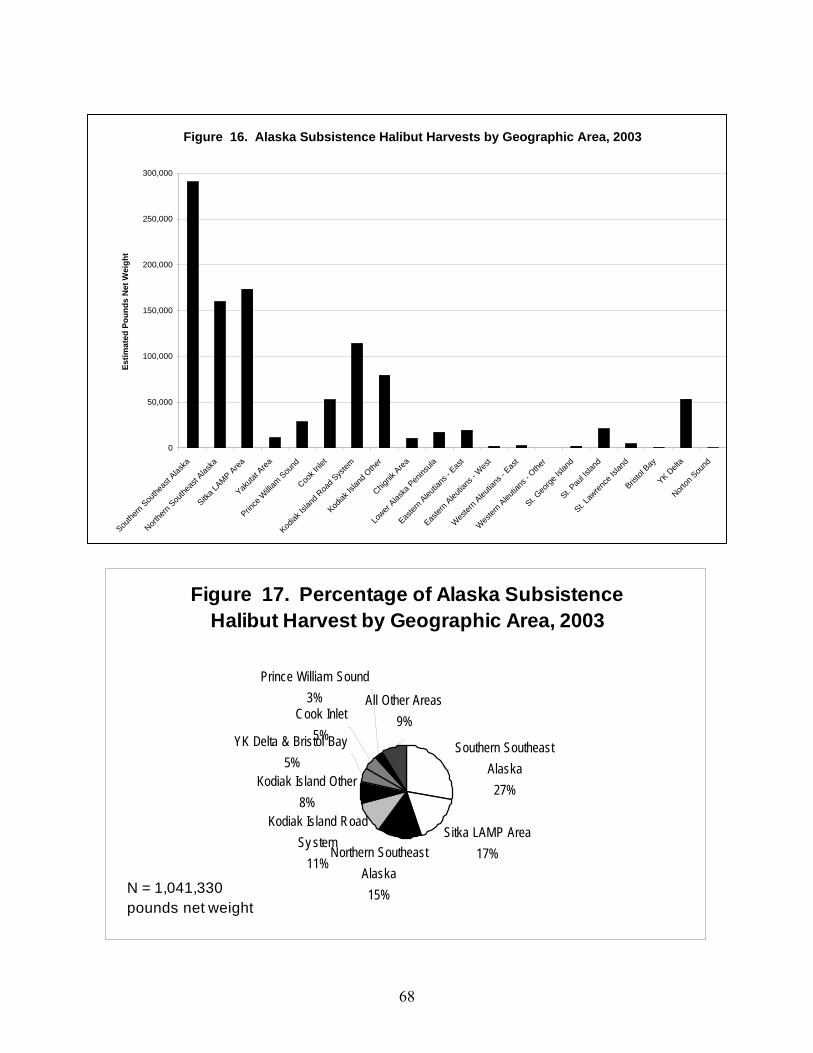
Figure 16. Alaska Subsistence Halibut Harvests by Geographic Area, 2003
0
50,000
100,000
150,000
200,000
250,000
300,000
Southe
rn Sou
theas
t Alas
ka
Northe
rn Sou
theas
t Alas
ka
Sitka L
AMP Area
Yakuta
t Area
Prince
Willia
m Sou
nd
Cook I
nlet
Kodiak
Islan
d Roa
d Sys
tem
Kodiak
Islan
d Othe
r
Chignik
Area
Lower
Alaska
Pen
insula
Easter
n Aleu
tians
- Eas
t
Easter
n Aleu
tians
- Wes
t
Wes
tern A
leutia
ns - E
ast
Wes
tern A
leutia
ns - O
ther
St. Geo
rge Is
land
St. Pau
l Islan
d
St. Law
rence
Islan
d
Bristol
Bay
YK Delt
a
Norton
Sou
nd
Estim
ated
Pou
nds
Net
Wei
ght
Figure 17. Percentage of Alaska Subsistence
Halibut Harvest by Geographic Area, 2003
Sitka LAMP Area17%Northern Southeast
Alaska15%
Kodiak Island Road Sy stem
11%
Kodiak Island Other8%
YK Delta & Bristol Bay5%
Cook Inlet5%
Prince William Sound3% All Other Areas
9%
Southern Southeast Alaska27%
N = 1,041,330 pounds net weight
68

Figure 18. Estimated Incidental Harvest of Rockfish in the Alaska Subsistence Halibut Fishery, 2003, by Regulatory Area
9,967
3,498
240
952
5 93 4 1110
2,000
4,000
6,000
8,000
10,000
12,000
Area 2C:Southeast
Alaska
Area 3A:Southcentral
Alaska
Area 3B: AlaskaPeninsula
Area 4A:Eastern
Aleutians
Area 4B:WesternAleutians
Area 4C: PribilofIslands
Area 4D: CentralBering Sea
Area 4E: EastBering Sea
Coast
Num
ber o
f Roc
kfis
h
Figure 19. Percentage of Incidental Harvest of
Rockfish by Regulatory Area, 2003
Area 2C 67.0%
Area 3A 23.5%
Areas 4B,4C,4D,4E
1.4%Area 4A
6.4%
Area 3B 1.6%
N = 14,870 rockfish
69
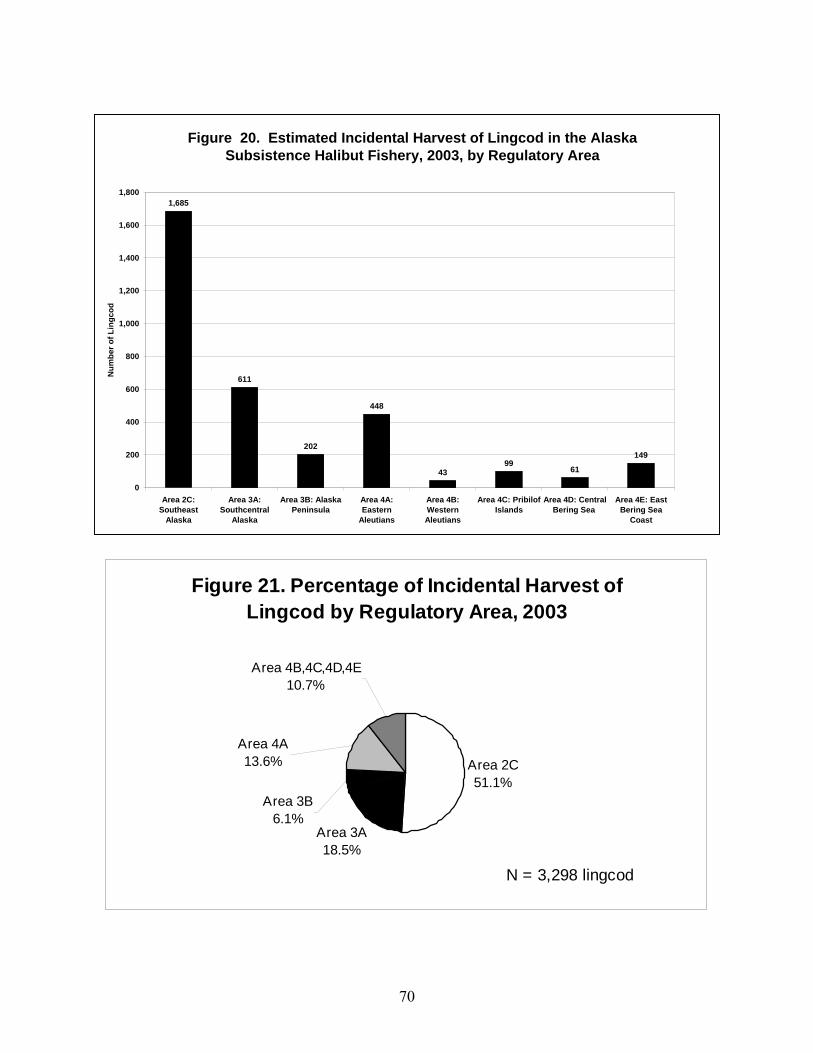
Figure 20. Estimated Incidental Harvest of Lingcod in the Alaska Subsistence Halibut Fishery, 2003, by Regulatory Area
1,685
611
202
448
4399
61
149
0
200
400
600
800
1,000
1,200
1,400
1,600
1,800
Area 2C:Southeast
Alaska
Area 3A:Southcentral
Alaska
Area 3B: AlaskaPeninsula
Area 4A:Eastern
Aleutians
Area 4B:WesternAleutians
Area 4C: PribilofIslands
Area 4D: CentralBering Sea
Area 4E: EastBering Sea
Coast
Num
ber o
f Lin
gcod
Figure 21. Percentage of Incidental Harvest of
Lingcod by Regulatory Area, 2003
Area 2C 51.1%
Area 3A 18.5%
Area 4B,4C,4D,4E10.7%
Area 4A 13.6%
Area 3B 6.1%
N = 3,298 lingcod
70

Figure 22. Comparison of Subsistence Halibut Harvest Estimates by Regulatory Area, 2000 and 2003
0
100,000
200,000
300,000
400,000
500,000
600,000
700,000
800,000
District 2C District 3A District 3B District 4A District 4B District 4C District 4D District 4EHalibut Regulatory Area
Poun
ds N
et W
eigh
t
"2000" Estimate 2003 Subsistence Harvest 2003 Subsistence & "Sport" Harvest
Figure 23. Percentage of Estimated Subsistence Halibut Harvests by Regulatory Area, 2000 and 2003
54.1%
19.0%
2.4%
12.2%
0.4%
4.4%
0.0%
7.5%
60.3%
26.9%
2.7% 2.0%0.2%
2.3%0.4%
5.2%
57.4%
29.8%
2.5% 2.1%0.3%
3.3%
0.3%
4.3%
0%
10%
20%
30%
40%
50%
60%
70%
District 2C District 3A District 3B District 4A District 4B District 4C District 4D District 4EHalibut Regulatory Area
Perc
enta
ge o
f Pou
nds
Net
Wei
ght
"2000" Estimate 2003 Subsistence Harvest 2003 Subsistence & "Sport" Harvest
71

Figure 24. Estimated Harvests of Halibut for Home Use, Port Graham
0
2,000
4,000
6,000
8,000
10,000
12,000
14,000
1987 1989 1990 1991 1992 1993 1997 2003
Tota
l Pou
nds,
Net
Wei
ght
Noncommercial Harvest Removed from Commercial Harvest
72

Figure 25. Halibut Removals, Alaska, 2003
Commercial73.0%
Subsistence1.3%
Wastage2.0%
Bycatch14.5%
Sport9.2%
N = 83.065 million lbs, net weight
Figure 26. Halibut Removals in Alaska by Regulatory Area and Removal Category, 2003
69.6% 71.2%
87.8%
62.8%
73.0%
21.4%
15.7%
0.1% 0.2%
9.2%5.2%
0.9% 0.1% 0.6% 1.3%1.1% 2.2% 3.2%0.9% 2.0%2.8%
10.0% 8.7%
35.4%
14.5%
0%
10%
20%
30%
40%
50%
60%
70%
80%
90%
100%
2C 3A 3B 4 AlaskaHalibut Regulatory Area
Perc
enta
ge o
f Tot
al R
emov
als,
Pou
nds
Net
Wei
ght
Commercial Sport Subsistence Wastage Bycatch
73

74
APPENDIX A:
List of Eligible Tribes and Rural Communities (from Federal Register)
A-1

A-2

A-3

A-4
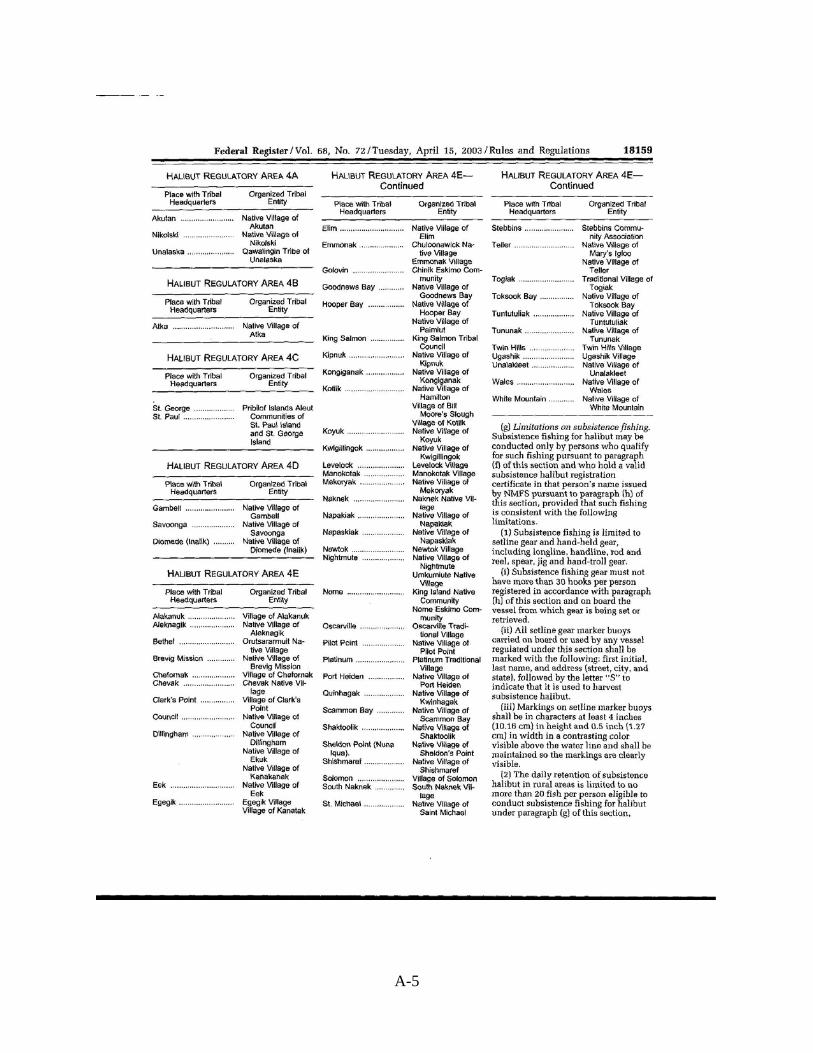
A-5

A-6

APPENDIX B:
LETTER SENT TO TRIBES ABOUT THE PROJECT
A- 7

A- 8

A- 9

A- 10

APPENDIX C: NEWS RELEASE
A-11

A-12

A-13

A-14

APPENDIX D: NEWSPAPER NOTICE
A-15

A-16

A-17

A-18

APPENDIX E: SURVEY FORM
A- 19

A- 20

A- 21

A- 22

APPENDIX F: SURVEY INSTRUCTIONS
A- 23

A- 24
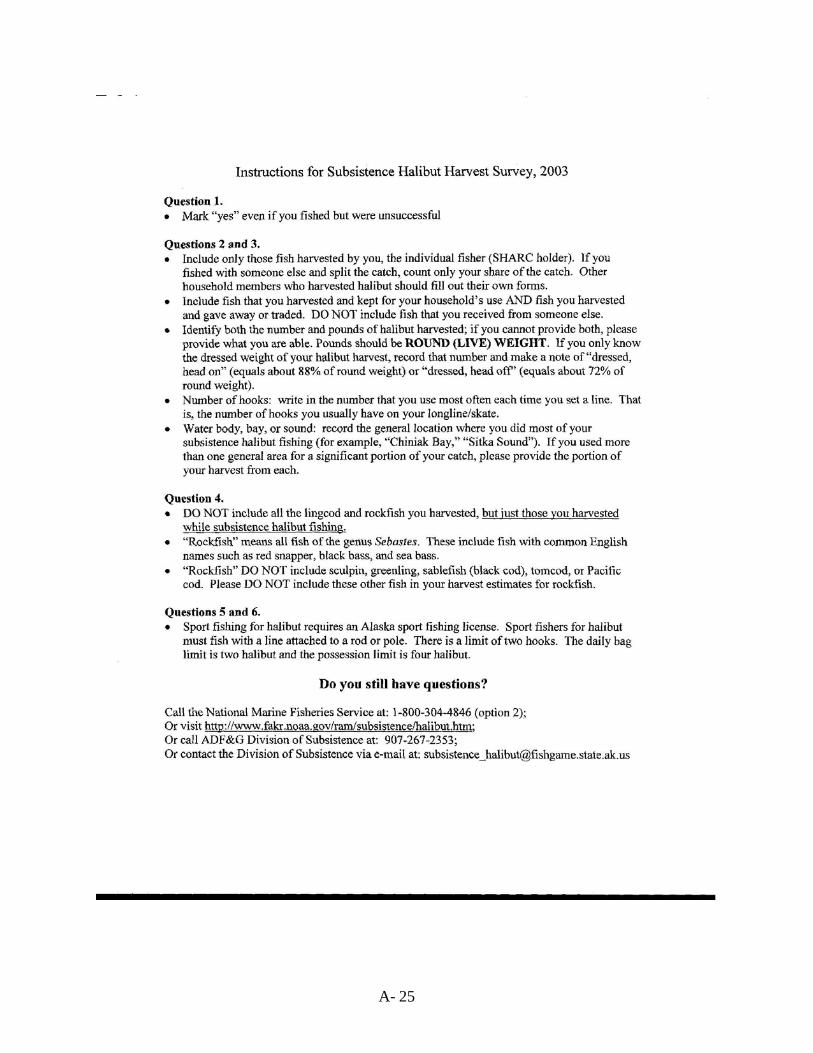
A- 25

A- 26

APPENDIX G:
LETTER FROM NMFS ADMINISTRATOR JAMES BALSIGER
A- 27

A- 28

A- 29

A- 30

APPENDIX H:
RESPONSES TO FREQUENTLY ASKED QUESTIONS
A- 31

A- 32

A- 33

A- 34

A- 35

A- 36

APPENDIX I: PROJECT SUMMARY
A- 37

A- 38

SUBSISTENCE HARVESTS OF PACIFIC HALIBUT IN ALASKA, 2003
Division of Subsistence, Alaska Department of Fish and Game
333 Raspberry Road, Anchorage, AK 99518 December 2004
Under contract to the National Marine Fisheries Service, the Division of Subsistence of the Alaska Department of Fish and Game conducted a study to estimate the subsistence harvests of Pacific halibut in Alaska in 2003. The full results of the study can be found in Division of Subsistence Technical Paper No. 288, “Subsistence Harvests of Pacific Halibut in Alaska, 2003” (December 2004). Key points in the report are the following: • In May 2003, the NMFS published final federal regulations for a subsistence halibut fishery
in Alaska. Residents of 117 rural communities and members of 123 tribes are eligible to participate. Fishers must obtain a subsistence halibut registration certificate (SHARC) from NMFS before fishing (www.fakr.noaa.gov/ram/subsistence/halibut.htm; 800-304-4846).
• A one-page survey form was mailed to 11,635 SHARC holders in early 2004. After three mailings and some supplemental community visits, 7,593 surveys (65.3%) were returned. Participation in the survey was voluntary.
• An estimated 4,942 individuals subsistence fished for halibut in 2003 (see Figure 6, below). • The estimated subsistence harvest was 43,926 fish for 1,041,330 pounds net weight. • Of this total, 72.3% was harvested with setline gear (longline or skate) and 27.7% was
harvested with hand-operated hear (handline or rod and reel). • The largest subsistence harvests occurred in southeast Alaska (Halibut Regulatory Area 2C),
at 60.3% of the total, followed by southcentral Alaska (Area 3A) at 26.9%. Table 4 and Figure 7 from the final report (below) give more details on harvests by gear type and area.
• SHARC holders also harvested an estimated 10,784 halibut (245,947 pounds net weight) while sport fishing in 2003.
• Based on place of residence of SHARC holders, communities with the largest subsistence halibut harvests in 2003 were Sitka and Kodiak (the eligible communities with the largest populations) (see Figure 15, below).
• An estimated 14,870 rockfish were harvested by 1,239 fishers in the subsistence halibut fishery in 2003. Most (67.0%) were harvested in southeast Alaska.
• An estimated 3,298 lingcod were harvested by 699 fishers in the subsistence halibut fishery in 2003. Most (51.1%) were harvested in southeast Alaska.
• Based on preliminary data from the International Pacific Halibut Commission and this study, the estimated halibut removal in Alaska in 2003 was 83.065 million pounds, net weight. Subsistence harvests accounted for 1.3% of this total (see Figure 25, below).
• The report concludes that the project was, overall, a success, with good public outreach, good response rates, and a reliable estimate of subsistence halibut harvests.
• The report recommends that harvest study continue for at least two more years in order to evaluate trends in the fishery.
For a copy of the full report, go to www.subsistence.adfg.state.ak.us, or call the Division of Subsistence of ADF&G at 907-267-2353 (Anchorage) or 907-465-4147 (Juneau).
A- 39

Table 4. Estimated Alaska Subsistence Harvests of Halibut by SHARC Type, Regulatory Area, and Gear Type, 20031
Estimated Number Fished
Estimated Number
Harvested
Estimated Pounds
Harvested
Estimated Number Fished
Estimated Number
Harvested
Estimated Pounds
Harvested
Estimated Number Fished
Estimated Number
Harvested
95% C.I. Percent
(Number)
Estimated Pounds
Harvested
95% C.I. Percent
(Pounds)
Tribal 2C 3,132 793 8,085 239,225 264 1,434 32,193 968 9,518 10.3% 271,416 11.8%Tribal 3A 936 208 2,102 51,085 191 1,727 35,477 358 3,828 8.3% 86,563 10.7%Tribal 3B 204 43 502 9,293 59 380 9,035 90 884 26.1% 18,328 26.6%Tribal 4A 70 9 31 376 42 323 11,269 45 353 52.7% 11,645 46.3%Tribal 4B 6 2 11 198 2 8 180 4 19 73.7% 378 79.1%Tribal 4C 277 44 707 11,698 73 504 11,690 101 1,211 60.2% 23,388 46.8%Tribal 4D 47 19 67 3,936 2 8 444 25 75 26.7% 4,380 24.6%Tribal 4E 906 69 803 10,116 183 2,244 36,528 245 3,046 17.0% 46,640 12.9%
Tribal All 5,578 1,187 12,308 325,927 816 6,628 136,816 1,836 18,934 7.3% 462,738 7.8%
Rural 2C 4,095 1,832 12,027 299,259 489 2,938 57,283 2,114 14,963 3.5% 356,543 3.7%Rural 3A 1,674 534 4,854 116,582 397 3,634 76,467 827 8,485 5.4% 193,050 5.5%Rural 3B 59 22 162 3,391 34 289 6,247 44 450 13.1% 9,637 18.3%Rural 4A 84 33 324 6,082 25 153 3,000 48 476 24.0% 9,082 20.4%Rural 4B 18 9 37 1,281 4 17 812 9 55 172.7% 2,094 194.6%Rural 4C 12 0 0 0 4 23 368 4 23 147.8% 368 140.4%Rural 4D 3 0 0 0 0 0 0 1 0 0.0% 0 0.0%Rural 4E 112 11 33 336 39 506 7,481 59 540 56.9% 7,818 62.7%
Rural All 6,057 2,441 17,437 426,931 992 7,560 151,658 3,106 24,992 3.1% 578,592 3.1%
All 2C 7,227 2,625 20,112 538,484 753 4,372 89,476 3,082 24,481 4.5% 627,959 5.5%All 3A 2,610 742 6,956 167,667 588 5,361 111,944 1,185 12,313 4.5% 279,613 5.0%All 3B 263 65 664 12,684 93 669 15,282 134 1,334 17.9% 27,965 18.5%All 4A 154 42 355 6,458 67 476 14,269 93 829 25.8% 20,727 26.9%All 4B 24 11 48 1,479 6 25 992 13 74 105.4% 2,472 134.8%All 4C 289 44 707 11,698 77 527 12,058 105 1,234 59.1% 23,756 46.1%All 4D 50 19 67 3,936 2 8 444 26 75 26.7% 4,380 24.6%All 4E 1,018 80 836 10,452 222 2,750 44,009 304 3,586 16.8% 54,458 14.2%
All All 11,635 3,628 29,745 752,858 1,808 14,188 288,474 4,942 43,926 3.6% 1,041,330 3.9%
1 SHARC = Subsistence halibut registration certificate.2 Pounds are net (dressed) weight. Net weight = 75% of round weight. Setline = longline or skate. Hand-operated gear = rod and reel or handline.
Source: Alaska Department of Fish and Game, Division of Subsistence Survey, 2004
SHARC Type
Halibut Regulatory
Area
Number of SHARCs Issued
Estimated Harvest by Gear Type2
Setline (Fixed) Gear Hand-Operated Gear All Gear
A-40
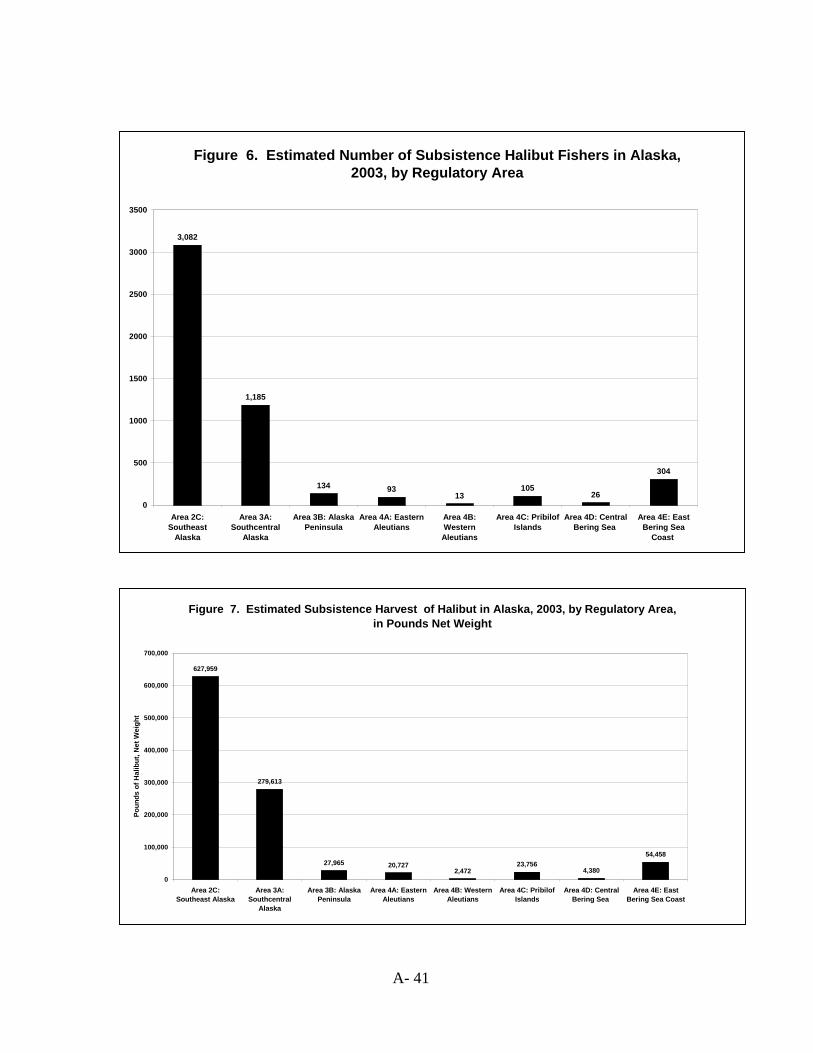
A- 41
Figure 7. Estimated Subsistence Harvest of Halibut in Alaska, 200in Pounds Net Weight
627,959
279,613
27,965 20,7272,472
23,756
0
100,000
200,000
300,000
400,000
500,000
600,000
700,000
Area 2C:Southeast Alaska
Area 3A:Southcentral
Alaska
Area 3B: AlaskaPeninsula
Area 4A: EasternAleutians
Area 4B: WesternAleutians
Area 4C: PribilofIslands
Poun
ds o
f Hal
ibut
, Net
Wei
ght
3, by Regulatory Area,
4,380
54,458
Area 4D: CentralBering Sea
Area 4E: EastBering Sea Coast
Figure 6. Estimated Number of Subsistence Halibut Fishers in Alaska, 2003, by Regulatory Area
3,082
26
304
2500
3000
3500
Area 4D: CentralBering Sea
Area 4E: EastBering Sea
Coast
1,185
134 9313
105
0
500
1000
1500
2000
Area 2C:Southeast
Alaska
Area 3A:Southcentral
Alaska
Area 3B: AlaskaPeninsula
Area 4A: EasternAleutians
Area 4B:WesternAleutians
Area 4C: PribilofIslands

Figure 15. Alaska Subsistence Halibut Harvests by Place of Residence, 2003
0
20,000
40,000
60,000
80,000
100,000
120,000
140,000
160,000
180,000Si
tka
Kod
iak
Hoo
nah
Pete
rsbu
rg
Cra
ig
Ket
chik
an
Wra
ngel
l
Hai
nes
Kla
woc
k
Met
laka
tla
Toks
ook
Bay
Kak
e
Hyd
abur
g
Ang
oon
Sain
t Pau
l
Seld
ovia
Cor
dova
June
au
Thor
ne B
ay
Chi
gnik
Pelic
an
Port
Gra
ham
Anc
hora
ge
Una
lask
a/D
utch
Har
bor
Yaku
tat
Aku
tan
Kip
nuk
Nan
wal
ek
Kin
g C
ove
Oth
er A
lask
a
Non
-Ala
ska
Poun
ds N
et W
eigh
t
Figure 25. Halibut Removals, Alaska, 2003
Commercial73.0%
Subsistence1.3%
Wastage2.0%
Bycatch14.5%
Sport9.2%
N = 83.065 million lbs, net weight
The Alaska Department of Fish and Game conducts all programs and activities free from discrimination on the basis of sex, color, race, religion, national origin, age, marital status, pregnancy, parenthood, or disability. For information on alternative formats available for this and other department publications, please contact the department ADA Coordinator at (voice) 907-465-4120, (TDD) 1-800-478=3648 or (FAX) 907-586-6595. Any person who believes s/he has been discriminated against should write to: ADF&G, PO Box 24426, Juneau, Alaska 99802-5526; or O.E.O., U.S. Department of the Interior, Washington, DC 20240.
A- 42

APPENDIX J: APPENDIX TABLES
A- 43

A- 44

A-45
Appendix Table 1. Results from Returned Surveys by Tribe and Rural Community, 2003
SHARCs2 Returned Percent Number Percent Number Pounds3 Number Percent Number Pounds Number with Harvest
Number of fish
Number with Harvest
Number of fish
AGDAAGUX TRIBE OF KING COVE 28 21 75.0% 14 66.7% 230 3,889 2 9.5% 14 285 1 40 1 100ANGOON COMMUNITY ASSOCIATION 118 57 48.3% 30 52.6% 456 7,992 9 15.8% 29 399 1 2 4 24AUKQUAN TRADITIONAL COUNCIL 2CENTRAL COUNCIL TLINGIT AND HAIDA INDIAN TRIBES 537 287 53.4% 90 31.4% 834 20,968 49 17.1% 147 3,414 10 30 24 197CHEVAK NATIVE VILLAGE (KASHUNAMIUT) 5CHIGNIK LAKE VILLAGE 4CHILKAT INDIAN VILLAGE 42 34 81.0% 13 38.2% 25 638 2 5.9% 4 127 1 4 1 9CHILKOOT INDIAN ASSOCIATION 41 33 80.5% 10 30.3% 34 1,006 5 15.2% 3 60 0 0 1 4CHINIK ESKIMO COMMUNITY 1CRAIG COMMUNITY ASSOCIATION 52 38 73.1% 14 36.8% 80 2,500 6 15.8% 8 179 0 0 3 25DOUGLAS INDIAN ASSOCIATION 22 13 59.1% 3 23.1% 40 540 0 0.0% 0 0 0 0 0 0EGEGIK VILLAGE 6 6 100.0% 0 0.0% 0 0 1 16.7% 6 112 0 0 0 0HOONAH INDIAN ASSOCIATION 199 122 61.3% 44 36.1% 864 25,884 14 11.5% 73 1,152 2 9 5 138HYDABURG COOPERATIVE ASSOCIATION 174 146 83.9% 48 32.9% 363 16,888 10 6.8% 20 1,941 12 86 22 451KENAITZE INDIAN TRIBE 48 35 72.9% 8 22.9% 66 1,168 6 17.1% 28 463 0 0 1 3KETCHIKAN INDIAN CORPORATION 639 292 45.7% 58 19.9% 490 13,834 52 17.8% 149 2,657 7 37 20 229KING ISLAND NATIVE COMMUNITY 2KLAWOCK COOPERATIVE ASSOCIATION 159 101 63.5% 36 35.6% 275 13,087 6 5.9% 19 557 4 31 7 84LESNOI VILLAGE (WOODY ISLAND) 259 123 47.5% 13 10.6% 36 956 9 7.3% 9 251 1 1 1 10METLAKATLA INDIAN COMMUNITY, ANNETTE ISLAND RESERVE 343 130 37.9% 42 32.3% 312 9,593 16 12.3% 11 358 7 13 17 98NAKNEK NATIVE VILLAGE 2NATIVE VILLAGE OF AFOGNAK 22 16 72.7% 6 37.5% 29 670 2 12.5% 4 108 1 1 0 0NATIVE VILLAGE OF AKHIOK 16 12 75.0% 11 91.7% 40 1,354 1 8.3% 0 0 2 11 0 0NATIVE VILLAGE OF AKUTAN 44 16 36.4% 12 75.0% 111 3,435 3 18.8% 6 149 3 150 6 288NATIVE VILLAGE OF ALEKNAGIK 2NATIVE VILLAGE OF ATKA 6 5 83.3% 3 60.0% 16 315 1 20.0% 2 37 0 0 0 0NATIVE VILLAGE OF BELKOFSKI 2NATIVE VILLAGE OF CHENEGA 27 15 55.6% 10 66.7% 65 2,797 4 26.7% 1 37 1 2 4 36NATIVE VILLAGE OF CHIGNIK 11 8 72.7% 5 62.5% 53 2,347 2 25.0% 25 1,125 2 5 0 0NATIVE VILLAGE OF CHIGNIK LAGOON 33 22 66.7% 19 86.4% 120 2,288 2 9.1% 6 119 0 0 0 0NATIVE VILLAGE OF DILLINGHAM (CURYUNG) 16 11 68.8% 3 27.3% 11 217 3 27.3% 10 194 0 0 0 0NATIVE VILLAGE OF EEK 21 8 38.1% 3 37.5% 6 231 0 0.0% 0 0 0 0 0 0NATIVE VILLAGE OF EKUK 3NATIVE VILLAGE OF ELIM 1NATIVE VILLAGE OF EYAK 46 32 69.6% 8 25.0% 93 1,650 12 37.5% 77 860 4 19 6 59NATIVE VILLAGE OF FALSE PASS 13 6 46.2% 2 33.3% 9 164 0 0.0% 0 0 0 0 0 0NATIVE VILLAGE OF GAMBELL 6 3 50.0% 3 100.0% 2 52 0 0.0% 0 0 1 30 1 2NATIVE VILLAGE OF GOODNEWS BAY (MUMTRAQ) 15 9 60.0% 7 77.8% 77 2,349 0 0.0% 0 0 0 0 0 0NATIVE VILLAGE OF HOOPER BAY 90 36 40.0% 10 27.8% 59 257 2 5.6% 2 37 2 5 0 0NATIVE VILLAGE OF KARLUK 4NATIVE VILLAGE OF KIPNUK 89 16 18.0% 12 75.0% 107 1,485 0 0.0% 0 0 2 5 1 1NATIVE VILLAGE OF KONGIGANAK 8 6 75.0% 6 100.0% 51 946 0 0.0% 0 0 0 0 0 0NATIVE VILLAGE OF KWIGILLINGOK 1NATIVE VILLAGE OF KWINHAGAK 10 5 50.0% 4 80.0% 16 407 0 0.0% 0 0 0 0 0 0NATIVE VILLAGE OF LARSEN BAY 25 16 64.0% 10 62.5% 96 2,042 7 43.8% 17 381 0 0 0 0NATIVE VILLAGE OF MEKORYUK 15 8 53.3% 5 62.5% 60 948 1 12.5% 2 52 2 8 0 0NATIVE VILLAGE OF NANWALEK 32 23 71.9% 18 78.3% 326 4,291 2 8.7% 12 240 2 14 3 212NATIVE VILLAGE OF NAPAKIAK 3NATIVE VILLAGE OF NIGHTMUTE 4NATIVE VILLAGE OF NIKOLSKI 12 6 50.0% 3 50.0% 14 843 1 16.7% 2 225 0 0 1 20
Continued
Sport Harvest Rockfish HarvestLingcod Harvest
Tribe/Community1
Return Rate Subsistence Fished? Subsistence Harvest Sport Fished?

A-46
Appendix Table 1. Results from Returned Surveys by Tribe and Rural Community, 2003
SHARCs2 Returned Percent Number Percent Number Pounds3 Number Percent Number Pounds Number with Harvest
Number of fish
Number with Harvest
Number of fish
NATIVE VILLAGE OF SAVOONGA 41 36 87.8% 17 47.2% 62 3,753 0 0.0% 0 0 1 1 0 0NATIVE VILLAGE OF SCAMMON BAY 5NATIVE VILLAGE OF SHAKTOOLIK 1NATIVE VILLAGE OF SHISHMAREF 1NATIVE VILLAGE OF TATITLEK 16 14 87.5% 11 78.6% 64 2,552 1 7.1% 2 60 1 10 5 54NATIVE VILLAGE OF TOKSOOK BAY (NUNAKAUYAK) 533 109 20.5% 51 46.8% 1,337 24,092 0 0.0% 0 0 13 45 5 41NATIVE VILLAGE OF TUNUNAK 1NATIVE VILLAGE OF UNALAKLEET 6 5 83.3% 0 0.0% 0 0 0 0.0% 0 0 0 0 0 0NATIVE VILLAGE OF UNGA 10 9 90.0% 3 33.3% 38 580 1 11.1% 2 60 0 0 0 0NATIVE VILLAGE OF WHITE MOUNTAIN 1NEWTOK VILLAGE 3NINILCHIK VILLAGE 78 53 67.9% 16 30.2% 134 2,648 17 32.1% 124 2,113 2 6 1 75NOME ESKIMO COMMUNITY 13 7 53.8% 2 28.6% 1 30 1 14.3% 2 52 0 0 1 15ORGANIZED VILLAGE OF KAKE 119 72 60.5% 24 33.3% 220 8,702 6 8.3% 9 277 3 15 5 32ORGANIZED VILLAGE OF KASAAN 3ORGANIZED VILLAGE OF SAXMAN 58 21 36.2% 7 33.3% 20 397 3 14.3% 7 86 1 4 3 17ORUTSARARMUIT NATIVE VILLAGE 6 4 66.7% 1 25.0% 12 315 1 25.0% 2 45 0 0 0 0PAULOFF HARBOR VILLAGE 57 19 33.3% 6 31.6% 70 1,365 4 21.1% 7 172 0 0 2 9PETERSBURG INDIAN ASSOCIATION 119 82 68.9% 31 37.8% 251 3,454 17 20.7% 41 703 0 0 5 28PLATINUM TRADITIONAL VILLAGE 2PRIBILOF ISLANDS ALEUT COMMUNITY OF ST GEORGE 26 12 46.2% 6 50.0% 63 770 0 0.0% 0 0 0 0 0 0PRIBILOF ISLANDS ALEUT COMMUNITY OF ST PAUL 251 42 16.7% 15 35.7% 184 3,718 3 7.1% 86 3,150 3 17 2 16QAGAN TOYAGUNGIN TRIBE OF SAND POINT VILLAGE 34 17 50.0% 2 11.8% 4 150 1 5.9% 0 0 0 0 0 0QAWALINGIN TRIBE OF UNALASKA 14 10 71.4% 4 40.0% 14 358 2 20.0% 4 150 1 4 1 10SELDOVIA VILLAGE TRIBE 35 28 80.0% 13 46.4% 229 5,205 6 21.4% 21 419 0 0 2 42SHOONAQ' TRIBE OF KODIAK 132 94 71.2% 51 54.3% 655 19,031 29 30.9% 141 5,331 9 21 11 156SITKA TRIBE OF ALASKA 409 283 69.2% 91 32.2% 1,155 31,673 45 15.9% 151 5,803 27 122 40 451SKAGWAY VILLAGE 1SOUTH NAKNEK VILLAGE 1TRADITIONAL VILLAGE OF TOGIAK 6 1 16.7% 1 100.0% 0 0 0 0.0% 0 0 0 0 0 0UGASHIK VILLAGE 4VILLAGE OF CHEFORNAK 16 2 12.5% 2 100.0% 55 412 0 0.0% 0 0 0 0 0 0VILLAGE OF CLARK'S POINT 2VILLAGE OF KANATAK 11 0 0.0% 0 0.0% 0 0 0 0.0% 0 0 0 0 0 0VILLAGE OF OLD HARBOR 16 14 87.5% 8 57.1% 37 1,069 2 14.3% 3 45 1 20 2 26VILLAGE OF SALAMATOFF 2WRANGELL COOPERATIVE ASSOCIATION 95 67 70.5% 17 25.4% 116 3,308 10 14.9% 12 303 0 0 2 37YAKUTAT TLINGIT TRIBE 53 37 69.8% 18 48.6% 204 4,270 3 8.1% 7 62 7 19 4 23
TRIBAL SUBTOTAL 5,578 2,896 51.9% 1,064 36.7% 11,301 281,795 406 14.0% 1,389 36,045 142 832 230 3,217
ADAK 5AKHIOK 1AKUTAN 5ALEKNAGIK 1ANGOON 24 19 79.2% 13 68.4% 138 2,605 6 31.6% 31 835 0 0 3 26ATKA 13 3 23.1% 1 33.3% 8 375 1 33.3% 4 187 1 10 0 0BETHEL 4
Continued
Tribe/Community1
Return Rate Subsistence Fished? Subsistence Harvest Sport Fished? Sport Harvest Lingcod Harvest Rockfish Harvest

Appendix Table 1. Results from Returned Surveys by Tribe and Rural Community, 2003
SHARCs2 Returned Percent Number Percent Number Pounds3 Number Percent Number Pounds Number with Harvest
Number of fish
Number with Harvest
Number of fish
CHIGNIK LAGOON 7 7 100.0% 5 71.4% 18 332 0 0.0% 0 0 0 0 0 0CHIGNIK LAKE 7 6 85.7% 5 83.3% 30 307 3 50.0% 12 179 2 8 1 2CHINIAK 5COFFMAN COVE 39 35 89.7% 27 77.1% 172 4,659 16 45.7% 75 1,472 3 4 8 59COLD BAY 18 15 83.3% 11 73.3% 77 1,886 7 46.7% 21 547 2 46 0 0CORDOVA 316 257 81.3% 76 29.6% 573 11,328 103 40.1% 476 8,352 19 65 24 239CRAIG 281 228 81.1% 114 50.0% 1,135 23,992 72 31.6% 352 5,802 17 39 60 594DILLINGHAM 22 21 95.5% 5 23.8% 6 75 5 23.8% 10 145 0 0 1 10EDNA BAY 43 41 95.3% 30 73.2% 144 4,626 14 34.1% 30 785 6 18 13 221EEK 1ELFIN COVE 16 13 81.3% 5 38.5% 30 697 1 7.7% 1 37 1 1 1 2ELLAMAR 1FALSE PASS 6 6 100.0% 5 83.3% 109 1,393 1 16.7% 2 37 1 60 1 35GAMBELL 1GOODNEWS BAY 2GUSTAVUS 52 40 76.9% 21 52.5% 188 3,357 14 35.0% 61 1,166 0 0 1 5HAINES 380 334 87.9% 206 61.7% 1,140 25,623 76 22.8% 95 2,148 11 36 31 181HOLLIS 41 37 90.2% 20 54.1% 97 2,469 12 32.4% 50 701 3 6 10 56HOONAH 120 83 69.2% 46 55.4% 467 12,980 24 28.9% 223 3,534 2 3 4 24HOOPER BAY 8 4 50.0% 4 100.0% 6 71 0 0.0% 0 0 0 0 0 0HYDABURG 11 11 100.0% 5 45.5% 18 675 3 27.3% 9 330 1 10 4 114HYDER 37 29 78.4% 10 34.5% 32 772 5 17.2% 12 254 0 0 0 0KAKE 61 45 73.8% 22 48.9% 162 5,427 8 17.8% 23 497 2 8 4 42KASAAN 16 11 68.8% 5 45.5% 37 930 0 0.0% 0 0 0 0 2 6KING COVE 11 8 72.7% 5 62.5% 74 2,211 0 0.0% 0 0 0 0 0 0KING SALMON 4KIPNUK 1KLAWOCK 115 80 69.6% 36 45.0% 332 8,623 23 28.7% 162 2,610 9 22 17 238KLUKWAN 3KODIAK 1,100 818 74.4% 423 51.7% 4,321 101,505 346 42.3% 2,060 49,583 42 138 75 800KONGIGANAK 4KOTLIK 1KOYUK 1LARSEN BAY 12 9 75.0% 9 100.0% 95 2,420 6 66.7% 31 576 0 0 2 22MEKORYUK 2METLAKATLA 31 16 51.6% 8 50.0% 31 643 7 43.8% 16 317 1 1 2 13MEYERS CHUCK 10 8 80.0% 6 75.0% 12 318 1 12.5% 1 13 0 0 0 0NAKNEK 4NANWALEK 7 6 85.7% 5 83.3% 99 1,800 0 0.0% 0 0 0 0 1 30NEWTOK 1NIGHTMUTE 25 7 28.0% 4 57.1% 104 1,718 0 0.0% 0 0 0 0 0 0NIKOLSKI 5NOME 7 5 71.4% 3 60.0% 0 0 0 0.0% 0 0 0 0 0 0OLD HARBOR 37 29 78.4% 20 69.0% 121 3,076 9 31.0% 16 516 1 4 1 200OUZINKIE 17 15 88.2% 9 60.0% 47 1,311 3 20.0% 9 149 2 2 3 23PELICAN 41 36 87.8% 21 58.3% 125 2,721 11 30.6% 8 220 5 12 12 156PETERSBURG 908 722 79.5% 293 40.6% 2,073 40,221 194 26.9% 644 14,734 9 36 44 300PLATINUM 2
Continued
Tribe/Community1
Return Rate Subsistence Fished? Subsistence Harvest Sport Fished? Sport Harvest Lingcod Harvest Rockfish Harvest
A-47

Appendix Table 1. Results from Returned Surveys by Tribe and Rural Community, 2003
SHARCs2 Returned Percent Number Percent Number Pounds3 Number Percent Number Pounds Number with Harvest
Number of fish
Number with Harvest
Number of fish
PT. BAKER 20 19 95.0% 11 57.9% 79 1,702 3 15.8% 1 22 1 1 4 46QUINHAGAK 4SAND POINT 5SAVOONGA 2SAXMAN 30 19 63.3% 6 31.6% 25 517 4 21.1% 46 697 0 0 1 1SCAMMON BAY 5SELDOVIA 89 79 88.8% 42 53.2% 702 12,680 32 40.5% 222 3,909 6 28 10 63SHELDON POINT 1SITKA 1,224 921 75.2% 511 55.5% 3,872 96,577 250 27.1% 868 18,071 165 615 219 2,789SKAGWAY 40 35 87.5% 17 48.6% 24 598 15 42.9% 23 676 1 2 2 14SOUTH NAKNEK 1ST GEORGE ISLAND 7 4 57.1% 2 50.0% 13 210 0 0.0% 0 0 0 0 0 0ST PAUL ISLAND 5STERLING 1TATITLEK 7 6 85.7% 6 100.0% 63 1,521 0 0.0% 0 0 1 1 5 55TENAKEE SPRINGS 36 31 86.1% 18 58.1% 113 3,022 20 64.5% 56 1,136 0 0 9 75THORNE BAY 97 83 85.6% 52 62.7% 331 11,341 34 41.0% 62 1,780 3 4 19 225TOKSOOK BAY 3UNALASKA 74 56 75.7% 30 53.6% 332 6,090 21 37.5% 134 3,507 2 22 4 61WHALE PASS 24 23 95.8% 7 30.4% 11 482 7 30.4% 40 860 1 1 2 20WRANGELL 362 278 76.8% 145 52.2% 863 21,282 75 27.0% 175 4,105 10 46 28 224YAKUTAT 36 24 66.7% 11 45.8% 135 3,381 9 37.5% 53 1,300 7 33 4 106
RURAL COMMUNITY SUBTOTAL 6,057 4,697 77.5% 2,412 51.4% 19,238 445,370 1,473 31.4% 6,296 134,885 353 1,338 659 7,419
SHARCs Returned Percent Number Percent Number Pounds Number Percent Number Pounds Number with Harvest
Number of fish
Number with Harvest
Number of fish
Tribal Subtotals 5,578 2,896 51.9% 1,064 36.7% 11,301 281,795 406 14.0% 1,389 36,045 142 832 230 3,217Rural Community Subtotals 6,057 4,697 77.5% 2,412 51.4% 19,238 445,370 1,473 31.4% 6,296 134,885 353 1,338 659 7,419
Grand Totals 11,635 7,593 65.3% 3,476 45.8% 30,539 727,165 1,879 45.4% 7,685 170,930 495 2,170 889 10,636
1 To protect confidentiality, data for tribes and communities with 5 or fewer SHARCs issued are not reported in this table. Tribal and community subtotals includes all tribes and communities.2 SHARC = subsistence halibut registration certificate3 Pounds net weight; converted from reported pounds round weight; net weight = 75% of round weight.
Lingcod Harvest Rockfish HarvestCommunity/Tribe Return Rate Subsistence Fished? Subsistence Harvest Sport Fished? Sport Harvest
Tribe/Community1
Return Rate Subsistence Fished? Subsistence Harvest Sport Fished? Sport Harvest Lingcod Harvest Rockfish Harvest
A-48

A-49

A-50

A-51

A-52
Appendix Table 3. Estimated Alaska Subsistence Harvests of Halibut by Tribe and Rural Community by Gear Type and Regulatory Area in Number of Fish and Pounds Net Weight, 2003.
Estimated Number Fished
Estimated Number
Harvested
Estimated Pounds
Harvested
Estimated Number Fished
Estimated Number
Harvested
Estimated Pounds
Harvested
Estimated Number Fished
Estimated Number
Harvested
95% C.I.Percent
(Number)
Estimated Pounds
Harvested
95% C.I.Percent
(Pounds)ANGOON COMMUNITY ASSOCIATION 2C 118 56 749 13,468 27 195 3,090 62 944 30.0% 16,557 32.1%AUKQUAN TRADITIONAL COUNCIL 2C 2CENTRAL COUNCIL TLINGIT AND HAIDA INDIAN TRIBES 2C 537 118 1,148 30,938 74 391 7,795 166 1,539 22.5% 38,733 25.7%CHILKAT INDIAN VILLAGE 2C 42 16 31 791 0 0 0 16 31 38.7% 791 37.1%CHILKOOT INDIAN ASSOCIATION 2C 41 10 39 1,179 1 4 75 12 42 33.3% 1,253 33.6%CRAIG COMMUNITY ASSOCIATION 2C 52 18 96 2,958 7 14 467 19 109 32.1% 3,425 33.7%DOUGLAS INDIAN ASSOCIATION 2C 22 3 47 457 2 20 457 5 68 92.6% 914 85.9%HOONAH INDIAN ASSOCIATION 2C 199 61 1,259 39,239 16 139 2,646 71 1,398 26.5% 41,885 31.2%HYDABURG COOPERATIVE ASSOCIATION 2C 174 56 379 16,909 14 54 3,228 57 433 20.3% 20,137 28.0%KETCHIKAN INDIAN CORPORATION 2C 639 94 808 23,607 26 265 6,680 127 1,072 31.4% 30,287 33.4%KLAWOCK COOPERATIVE ASSOCIATION 2C 159 43 398 19,548 13 35 1,063 57 433 32.1% 20,611 41.5%METLAKATLA INDIAN COMMUNITY, ANNETTE ISLAND RESERVE 2C 343 82 773 24,643 18 50 689 111 823 57.4% 25,332 69.3%ORGANIZED VILLAGE OF KAKE 2C 119 38 345 13,849 8 18 539 40 364 31.9% 14,388 35.8%ORGANIZED VILLAGE OF KASAAN 2C 3ORGANIZED VILLAGE OF SAXMAN 2C 58 14 55 1,098 0 0 0 19 55 90.9% 1,098 88.0%PETERSBURG INDIAN ASSOCIATION 2C 119 33 283 3,888 15 81 1,131 45 364 30.5% 5,019 27.0%SITKA TRIBE OF ALASKA 2C 409 123 1,513 41,779 38 156 4,017 132 1,669 28.6% 45,796 29.5%SKAGWAY VILLAGE 2C 1WRANGELL COOPERATIVE ASSOCIATION 2C 95 24 153 4,423 4 11 271 24 164 34.1% 4,694 40.1%
SubTotal 2C 3,132 793 8,085 239,225 264 1,434 32,193 968 9,518 10.3% 271,416 11.8%KENAITZE INDIAN TRIBE 3A 48 5 37 504 5 53 1,101 11 91 46.2% 1,605 51.6%LESNOI VILLAGE (WOODY ISLAND) 3A 259 7 12 306 11 35 956 17 47 36.2% 1,262 34.6%NATIVE VILLAGE OF AFOGNAK 3A 22 3 19 371 4 21 552 8 40 57.5% 923 54.0%NATIVE VILLAGE OF AKHIOK 3A 16 0 0 0 13 53 1,809 15 53 28.3% 1,809 33.3%NATIVE VILLAGE OF CHENEGA 3A 27 14 90 3,877 7 27 1,161 18 117 60.7% 5,038 69.8%NATIVE VILLAGE OF EYAK 3A 46 12 73 1,749 4 60 625 12 134 57.5% 2,374 57.1%NATIVE VILLAGE OF KARLUK 3A 4NATIVE VILLAGE OF LARSEN BAY 3A 25 8 45 1,066 9 105 2,127 16 150 42.0% 3,193 42.6%NATIVE VILLAGE OF NANWALEK 3A 32 6 127 2,259 25 327 3,718 25 454 26.4% 5,977 30.4%NATIVE VILLAGE OF OUZINKIE 3A 30 20 81 2,234 9 89 1,955 23 170 44.1% 4,190 43.5%NATIVE VILLAGE OF PORT GRAHAM 3A 42 8 292 5,067 19 272 3,168 27 564 17.7% 8,235 18.5%NATIVE VILLAGE OF PORT LIONS 3A 53 15 152 3,160 11 46 823 25 198 34.8% 3,983 33.5%NATIVE VILLAGE OF TATITLEK 3A 16 8 47 1,836 2 26 1,084 13 73 24.7% 2,920 25.1%NINILCHIK VILLAGE 3A 78 6 50 1,065 16 147 2,837 24 197 53.8% 3,902 52.7%SELDOVIA VILLAGE TRIBE 3A 35 9 153 3,150 10 134 3,359 16 286 31.8% 6,509 28.8%SHOONAQ' TRIBE OF KODIAK 3A 132 60 689 19,312 26 221 7,147 71 910 18.2% 26,459 26.4%VILLAGE OF OLD HARBOR 3A 16 3 14 446 9 29 778 9 42 21.4% 1,224 23.5%VILLAGE OF SALAMATOFF 3A 2YAKUTAT TLINGIT TRIBE 3A 53 24 221 4,683 9 72 1,437 26 292 29.1% 6,120 32.7%
SubTotal 3A 936 208 2,102 51,085 191 1,727 35,477 358 3,828 8.3% 86,563 10.7%AGDAAGUX TRIBE OF KING COVE 3B 28 7 173 1,718 13 133 3,470 19 307 60.3% 5,188 49.3%CHIGNIK LAKE VILLAGE 3B 4NATIVE VILLAGE OF BELKOFSKI 3B 2NATIVE VILLAGE OF CHIGNIK 3B 11 4 39 1,681 1 34 1,547 7 73 115.1% 3,228 117.5%
Continued
Community/Tribe1 Regulatory Area
Number of SHARCs2
Issued
Estimated Harvest by Gear TypeSet Hook Gear Hook & Line or Handline All Gear
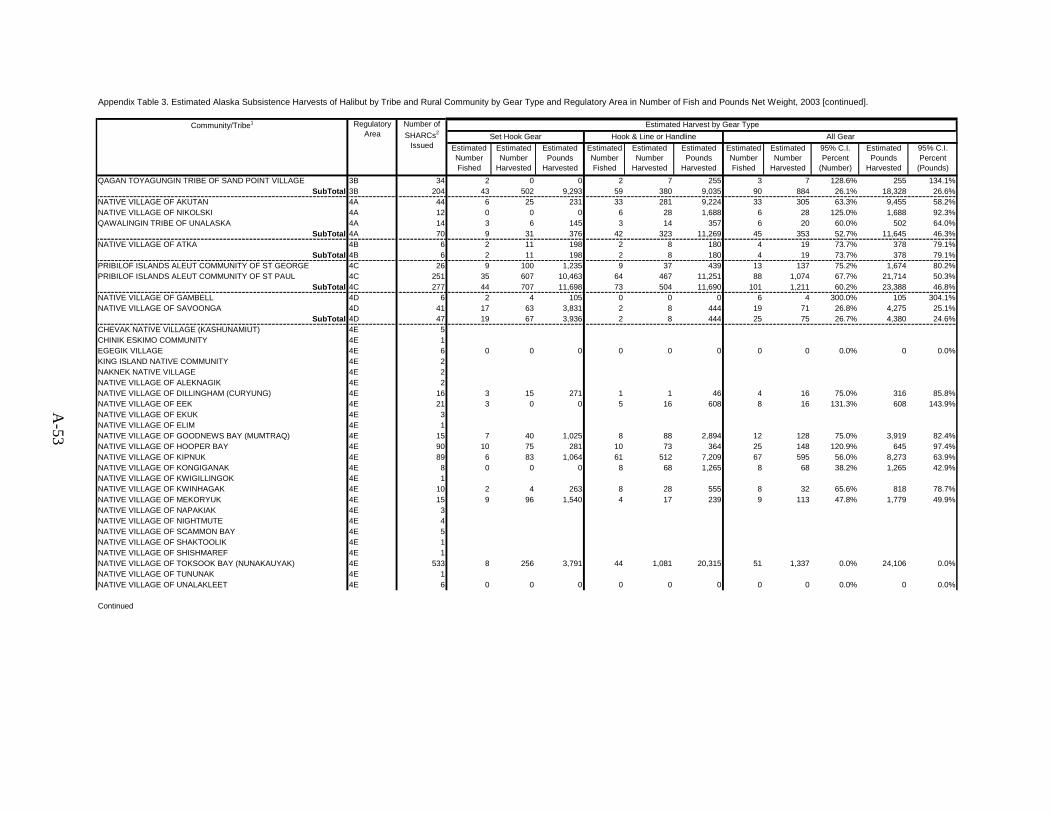
Appendix Table 3. Estimated Alaska Subsistence Harvests of Halibut by Tribe and Rural Community by Gear Type and Regulatory Area in Number of Fish and Pounds Net Weight, 2003 [continued].
Estimated Number Fished
Estimated Number
Harvested
Estimated Pounds
Harvested
Estimated Number Fished
Estimated Number
Harvested
Estimated Pounds
Harvested
Estimated Number Fished
Estimated Number
Harvested
95% C.I.Percent
(Number)
Estimated Pounds
Harvested
95% C.I.Percent
(Pounds)QAGAN TOYAGUNGIN TRIBE OF SAND POINT VILLAGE 3B 34 2 0 0 2 7 255 3 7 128.6% 255 134.1%
SubTotal 3B 204 43 502 9,293 59 380 9,035 90 884 26.1% 18,328 26.6%NATIVE VILLAGE OF AKUTAN 4A 44 6 25 231 33 281 9,224 33 305 63.3% 9,455 58.2%NATIVE VILLAGE OF NIKOLSKI 4A 12 0 0 0 6 28 1,688 6 28 125.0% 1,688 92.3%QAWALINGIN TRIBE OF UNALASKA 4A 14 3 6 145 3 14 357 6 20 60.0% 502 64.0%
SubTotal 4A 70 9 31 376 42 323 11,269 45 353 52.7% 11,645 46.3%NATIVE VILLAGE OF ATKA 4B 6 2 11 198 2 8 180 4 19 73.7% 378 79.1%
SubTotal 4B 6 2 11 198 2 8 180 4 19 73.7% 378 79.1%PRIBILOF ISLANDS ALEUT COMMUNITY OF ST GEORGE 4C 26 9 100 1,235 9 37 439 13 137 75.2% 1,674 80.2%PRIBILOF ISLANDS ALEUT COMMUNITY OF ST PAUL 4C 251 35 607 10,463 64 467 11,251 88 1,074 67.7% 21,714 50.3%
SubTotal 4C 277 44 707 11,698 73 504 11,690 101 1,211 60.2% 23,388 46.8%NATIVE VILLAGE OF GAMBELL 4D 6 2 4 105 0 0 0 6 4 300.0% 105 304.1%NATIVE VILLAGE OF SAVOONGA 4D 41 17 63 3,831 2 8 444 19 71 26.8% 4,275 25.1%
SubTotal 4D 47 19 67 3,936 2 8 444 25 75 26.7% 4,380 24.6%CHEVAK NATIVE VILLAGE (KASHUNAMIUT) 4E 5CHINIK ESKIMO COMMUNITY 4E 1EGEGIK VILLAGE 4E 6 0 0 0 0 0 0 0 0 0.0% 0 0.0%KING ISLAND NATIVE COMMUNITY 4E 2NAKNEK NATIVE VILLAGE 4E 2NATIVE VILLAGE OF ALEKNAGIK 4E 2NATIVE VILLAGE OF DILLINGHAM (CURYUNG) 4E 16 3 15 271 1 1 46 4 16 75.0% 316 85.8%NATIVE VILLAGE OF EEK 4E 21 3 0 0 5 16 608 8 16 131.3% 608 143.9%NATIVE VILLAGE OF EKUK 4E 3NATIVE VILLAGE OF ELIM 4E 1NATIVE VILLAGE OF GOODNEWS BAY (MUMTRAQ) 4E 15 7 40 1,025 8 88 2,894 12 128 75.0% 3,919 82.4%NATIVE VILLAGE OF HOOPER BAY 4E 90 10 75 281 10 73 364 25 148 120.9% 645 97.4%NATIVE VILLAGE OF KIPNUK 4E 89 6 83 1,064 61 512 7,209 67 595 56.0% 8,273 63.9%NATIVE VILLAGE OF KONGIGANAK 4E 8 0 0 0 8 68 1,265 8 68 38.2% 1,265 42.9%NATIVE VILLAGE OF KWIGILLINGOK 4E 1NATIVE VILLAGE OF KWINHAGAK 4E 10 2 4 263 8 28 555 8 32 65.6% 818 78.7%NATIVE VILLAGE OF MEKORYUK 4E 15 9 96 1,540 4 17 239 9 113 47.8% 1,779 49.9%NATIVE VILLAGE OF NAPAKIAK 4E 3NATIVE VILLAGE OF NIGHTMUTE 4E 4NATIVE VILLAGE OF SCAMMON BAY 4E 5NATIVE VILLAGE OF SHAKTOOLIK 4E 1NATIVE VILLAGE OF SHISHMAREF 4E 1NATIVE VILLAGE OF TOKSOOK BAY (NUNAKAUYAK) 4E 533 8 256 3,791 44 1,081 20,315 51 1,337 0.0% 24,106 0.0%NATIVE VILLAGE OF TUNUNAK 4E 1NATIVE VILLAGE OF UNALAKLEET 4E 6 0 0 0 0 0 0 0 0 0.0% 0 0.0%
Continued
Community/Tribe1 Regulatory Area
Number of SHARCs2
Issued
Estimated Harvest by Gear TypeSet Hook Gear Hook & Line or Handline All Gear
A-53

Appendix Table 3. Estimated Alaska Subsistence Harvests of Halibut by Tribe and Rural Community by Gear Type and Regulatory Area in Number of Fish and Pounds Net Weight, 2003 [continued].
Estimated Number Fished
Estimated Number
Harvested
Estimated Pounds
Harvested
Estimated Number Fished
Estimated Number
Harvested
Estimated Pounds
Harvested
Estimated Number Fished
Estimated Number
Harvested
95% C.I.Percent
(Number)
Estimated Pounds
Harvested
95% C.I.Percent
(Pounds)SOUTH NAKNEK VILLAGE 4E 1TRADITIONAL VILLAGE OF TOGIAK 4E 6 0 0 0 0 0 0 6 0 0.0% 0 0.0%UGASHIK VILLAGE 4E 4VILLAGE OF CHEFORNAK 4E 16 8 160 1,050 16 280 2,250 16 440 540.0% 3,300 324.0%VILLAGE OF CLARK'S POINT 4E 2VILLAGE OF KANATAK 4E 11 0 0 0 0 0 0 0 0 0.0% 0 0.0%
SubTotal 4E 906 69 803 10,116 183 2,244 36,528 245 3,046 17.0% 46,640 12.9%TRIBAL SUBTOTAL 5,578 1,187 12,308 325,927 816 6,628 136,816 1,836 18,934 7.3% 462,738 7.8%
ANGOON 2C 24 13 159 2,800 8 15 493 16 174 29.9% 3,292 26.9%COFFMAN COVE 2C 39 26 162 4,566 6 30 631 30 192 15.1% 5,197 13.5%CRAIG 2C 281 115 1,009 24,818 36 389 4,775 141 1,399 12.9% 29,593 11.8%EDNA BAY 2C 43 21 89 3,739 10 62 1,121 31 151 10.6% 4,860 8.4%ELFIN COVE 2C 16 4 22 582 2 15 277 6 37 40.5% 858 39.5%GUSTAVUS 2C 52 16 147 2,556 13 98 1,813 27 244 24.6% 4,369 23.1%HAINES 2C 380 218 1,204 27,133 25 93 2,067 234 1,297 6.7% 29,201 6.1%HOLLIS 2C 41 20 91 2,516 2 17 224 22 107 23.4% 2,740 17.1%HOONAH 2C 120 53 544 16,292 19 132 2,489 67 675 19.4% 18,781 32.7%HYDABURG 2C 11 3 12 375 1 6 300 5 18 0.0% 675 0.0%HYDER 2C 37 13 40 952 1 1 33 13 41 41.5% 986 39.0%KAKE 2C 61 24 188 6,822 7 31 539 30 220 26.8% 7,361 27.6%KASAAN 2C 16 7 54 1,353 0 0 0 7 54 53.7% 1,353 52.3%KLAWOCK 2C 115 37 231 8,211 32 246 4,199 52 477 22.9% 12,410 24.6%KLUKWAN 2C 3METLAKATLA 2C 31 14 37 945 4 23 305 16 60 61.7% 1,250 55.9%MEYERS CHUCK 2C 10 8 15 400 0 0 0 8 15 40.0% 400 32.8%PELICAN 2C 41 18 122 2,622 8 21 483 24 142 16.2% 3,105 14.6%PETERSBURG 2C 908 294 1,990 37,775 123 617 12,882 368 2,607 7.2% 50,657 6.5%PORT ALEXANDER 2C 20 7 32 850 2 8 188 8 40 62.5% 1,038 56.6%PORT PROTECTION 2C 13 8 36 719 6 21 658 9 56 17.9% 1,377 16.6%PT. BAKER 2C 20 12 83 1,795 0 0 0 12 83 15.7% 1,795 14.5%SAXMAN 2C 30 9 39 817 0 0 0 9 39 76.9% 817 67.3%SITKA 2C 1,224 626 4,358 112,558 120 788 15,931 679 5,146 6.9% 128,489 6.6%SKAGWAY 2C 40 18 27 686 0 0 0 19 27 37.0% 686 36.6%TENAKEE SPRINGS 2C 36 21 103 2,769 7 28 745 21 131 17.6% 3,514 18.1%THORNE BAY 2C 97 50 307 10,914 19 79 2,353 61 387 12.4% 13,268 13.3%WHALE PASS 2C 24 6 5 196 4 6 309 7 11 27.3% 505 22.8%WRANGELL 2C 362 168 912 23,284 34 212 4,468 189 1,124 15.4% 27,752 13.4%
SubTotal 2C 4,095 1,832 12,027 299,259 489 2,938 57,283 2,114 14,963 3.5% 356,543 3.7%
Continued
Community/Tribe1 Regulatory Area
Number of SHARCs2
Issued
Estimated Harvest by Gear TypeSet Hook Gear Hook & Line or Handline All Gear
A-54
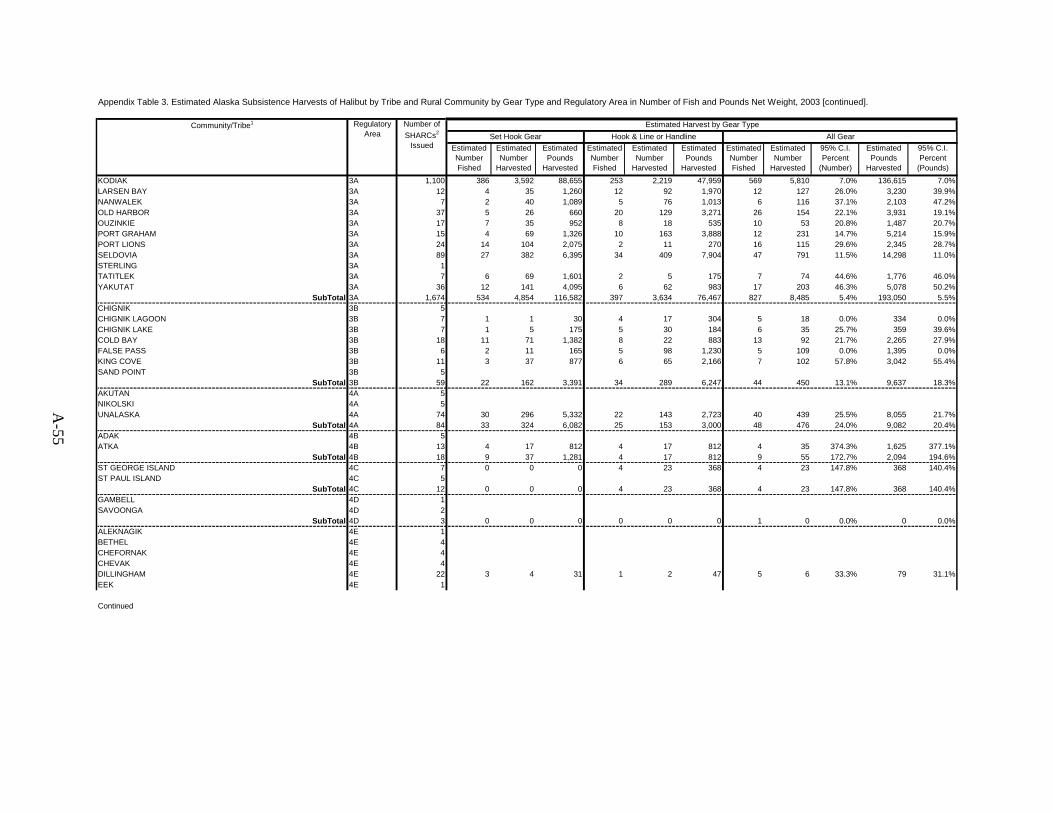
Appendix Table 3. Estimated Alaska Subsistence Harvests of Halibut by Tribe and Rural Community by Gear Type and Regulatory Area in Number of Fish and Pounds Net Weight, 2003 [continued].
Estimated Number Fished
Estimated Number
Harvested
Estimated Pounds
Harvested
Estimated Number Fished
Estimated Number
Harvested
Estimated Pounds
Harvested
Estimated Number Fished
Estimated Number
Harvested
95% C.I.Percent
(Number)
Estimated Pounds
Harvested
95% C.I.Percent
(Pounds)KODIAK 3A 1,100 386 3,592 88,655 253 2,219 47,959 569 5,810 7.0% 136,615 7.0%LARSEN BAY 3A 12 4 35 1,260 12 92 1,970 12 127 26.0% 3,230 39.9%NANWALEK 3A 7 2 40 1,089 5 76 1,013 6 116 37.1% 2,103 47.2%OLD HARBOR 3A 37 5 26 660 20 129 3,271 26 154 22.1% 3,931 19.1%OUZINKIE 3A 17 7 35 952 8 18 535 10 53 20.8% 1,487 20.7%PORT GRAHAM 3A 15 4 69 1,326 10 163 3,888 12 231 14.7% 5,214 15.9%PORT LIONS 3A 24 14 104 2,075 2 11 270 16 115 29.6% 2,345 28.7%SELDOVIA 3A 89 27 382 6,395 34 409 7,904 47 791 11.5% 14,298 11.0%STERLING 3A 1TATITLEK 3A 7 6 69 1,601 2 5 175 7 74 44.6% 1,776 46.0%YAKUTAT 3A 36 12 141 4,095 6 62 983 17 203 46.3% 5,078 50.2%
SubTotal 3A 1,674 534 4,854 116,582 397 3,634 76,467 827 8,485 5.4% 193,050 5.5%CHIGNIK 3B 5CHIGNIK LAGOON 3B 7 1 1 30 4 17 304 5 18 0.0% 334 0.0%CHIGNIK LAKE 3B 7 1 5 175 5 30 184 6 35 25.7% 359 39.6%COLD BAY 3B 18 11 71 1,382 8 22 883 13 92 21.7% 2,265 27.9%FALSE PASS 3B 6 2 11 165 5 98 1,230 5 109 0.0% 1,395 0.0%KING COVE 3B 11 3 37 877 6 65 2,166 7 102 57.8% 3,042 55.4%SAND POINT 3B 5
SubTotal 3B 59 22 162 3,391 34 289 6,247 44 450 13.1% 9,637 18.3%AKUTAN 4A 5NIKOLSKI 4A 5UNALASKA 4A 74 30 296 5,332 22 143 2,723 40 439 25.5% 8,055 21.7%
SubTotal 4A 84 33 324 6,082 25 153 3,000 48 476 24.0% 9,082 20.4%ADAK 4B 5ATKA 4B 13 4 17 812 4 17 812 4 35 374.3% 1,625 377.1%
SubTotal 4B 18 9 37 1,281 4 17 812 9 55 172.7% 2,094 194.6%ST GEORGE ISLAND 4C 7 0 0 0 4 23 368 4 23 147.8% 368 140.4%ST PAUL ISLAND 4C 5
SubTotal 4C 12 0 0 0 4 23 368 4 23 147.8% 368 140.4%GAMBELL 4D 1SAVOONGA 4D 2
SubTotal 4D 3 0 0 0 0 0 0 1 0 0.0% 0 0.0%ALEKNAGIK 4E 1BETHEL 4E 4CHEFORNAK 4E 4CHEVAK 4E 4DILLINGHAM 4E 22 3 4 31 1 2 47 5 6 33.3% 79 31.1%EEK 4E 1
Continued
Community/Tribe1 Regulatory Area
Number of SHARCs2
Issued
Estimated Harvest by Gear TypeSet Hook Gear Hook & Line or Handline All Gear
A-55

Appendix Table 3. Estimated Alaska Subsistence Harvests of Halibut by Tribe and Rural Community by Gear Type and Regulatory Area in Number of Fish and Pounds Net Weight, 2003 [continued].
Estimated Number Fished
Estimated Number
Harvested
Estimated Pounds
Harvested
Estimated Number Fished
Estimated Number
Harvested
Estimated Pounds
Harvested
Estimated Number Fished
Estimated Number
Harvested
95% C.I.Percent
(Number)
Estimated Pounds
Harvested
95% C.I.Percent
(Pounds)KOTLIK 4E 1KOYUK 4E 1MEKORYUK 4E 2NAKNEK 4E 4NEWTOK 4E 1NIGHTMUTE 4E 25 0 0 0 14 371 6,139 14 371 101.3% 6,139 97.6%NOME 4E 7 3 0 0 0 0 0 4 0 0.0% 0 0.0%PLATINUM 4E 2QUINHAGAK 4E 4SCAMMON BAY 4E 5SHELDON POINT 4E 1SOUTH NAKNEK 4E 1TOKSOOK BAY 4E 3
SubTotal 4E 112 11 33 336 39 506 7,481 59 540 56.9% 7,818 62.7%RURAL COMMUNITY SUBTOTAL 6,057 2,441 17,437 426,931 992 7,560 151,658 3,106 24,992 3.1% 578,592 3.1%
Tribal Subtotals 5,578 1,187 12,308 325,927 816 6,628 136,816 1,836 18,934 7.3% 462,738 7.8%Rural Community Subtotals 6,057 2,441 17,437 426,931 992 7,560 151,658 3,106 24,992 3.1% 578,592 3.1%
Grand Totals 11,635 3,628 29,745 752,858 1,808 14,188 288,474 4,942 43,926 3.6% 1,041,330 3.9%
Area 2C: Tribal and Rural Community Combined 2C 7,227 2,625 20,112 538,484 753 4,372 89,476 3,082 24,481 4.5% 627,959 5.5%Area 3A: Tribal and Rural Community Combined 3A 2,610 742 6,956 167,667 588 5,361 111,944 1,185 12,313 4.5% 279,613 5.0%Area 3B: Tribal and Rural Community Combined 3B 263 65 664 12,684 93 669 15,282 134 1,334 17.9% 27,965 18.5%Area 4A: Tribal and Rural Community Combined 4A 154 42 355 6,458 67 476 14,269 93 829 25.8% 20,727 26.9%Area 4B: Tribal and Rural Community Combined 4B 24 11 48 1,479 6 25 992 13 74 105.4% 2,472 134.8%Area 4C: Tribal and Rural Community Combined 4C 289 44 707 11,698 77 527 12,058 105 1,234 59.1% 23,756 46.1%Area 4D: Tribal and Rural Community Combined 4D 50 19 67 3,936 2 8 444 26 75 26.7% 4,380 24.6%Area 4E: Tribal and Rural Community Combined 4E 1,018 80 836 10,452 222 2,750 44,009 304 3,586 16.8% 54,458 14.2%
Grand Total Alaska 11,635 3,628 29,745 752,858 1,808 14,188 288,474 4,942 43,926 3.6% 1,041,330 3.9%
1 To protect confidentiality, data for tribes and communities with 5 or fewer SHARCs issued are not reported in this table. Area subtotals include all tribes and communities.2 SHARC = subsistence halibut registration certificate
Source: Alaska Department of Fish and Game, Division of Subsistence, SHARC survey, 2004
Community/Tribe1 Regulatory Area
Number of SHARCs2
Issued
Estimated Harvest by Gear TypeSet Hook Gear Hook & Line or Handline All Gear
A-56
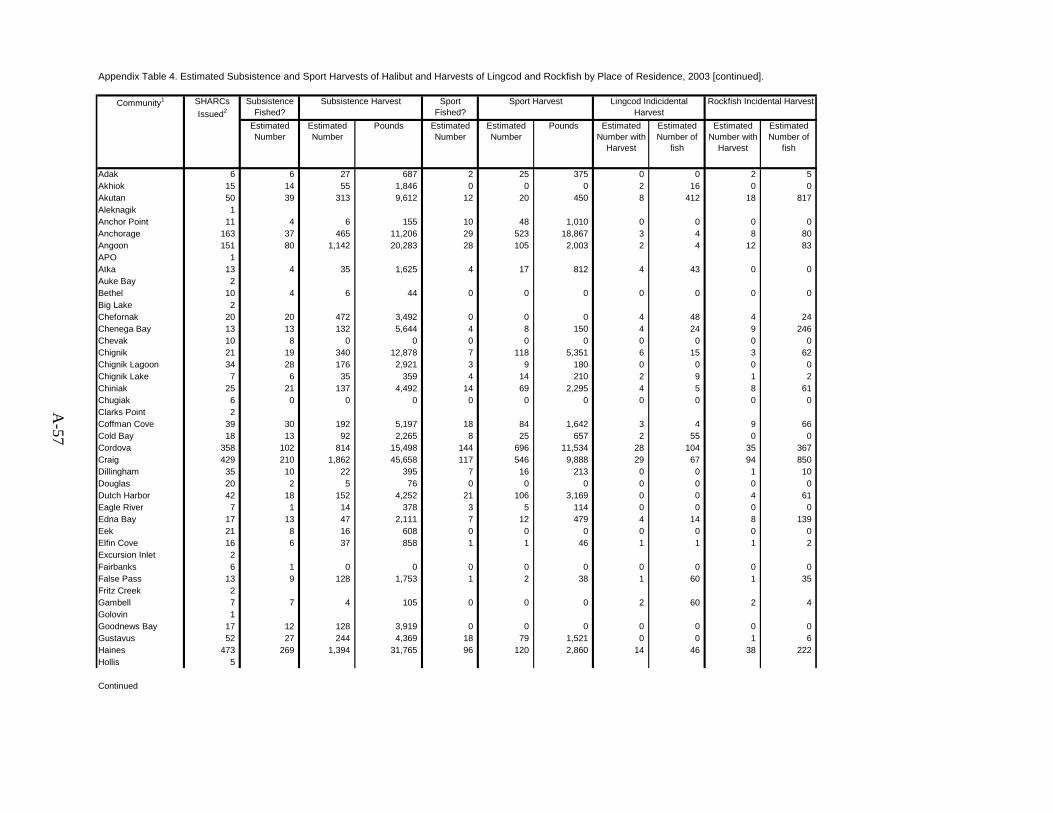
Appendix Table 4. Estimated Subsistence and Sport Harvests of Halibut and Harvests of Lingcod and Rockfish by Place of Residence, 2003 [continued].
Subsistence Fished?
Sport Fished?
Estimated Number
Estimated Number
Pounds Estimated Number
Estimated Number
Pounds Estimated Number with
Harvest
Estimated Number of
fish
Estimated Number with
Harvest
Estimated Number of
fish
Adak 6 6 27 687 2 25 375 0 0 2 5Akhiok 15 14 55 1,846 0 0 0 2 16 0 0Akutan 50 39 313 9,612 12 20 450 8 412 18 817Aleknagik 1Anchor Point 11 4 6 155 10 48 1,010 0 0 0 0Anchorage 163 37 465 11,206 29 523 18,867 3 4 8 80Angoon 151 80 1,142 20,283 28 105 2,003 2 4 12 83APO 1Atka 13 4 35 1,625 4 17 812 4 43 0 0Auke Bay 2Bethel 10 4 6 44 0 0 0 0 0 0 0Big Lake 2Chefornak 20 20 472 3,492 0 0 0 4 48 4 24Chenega Bay 13 13 132 5,644 4 8 150 4 24 9 246Chevak 10 8 0 0 0 0 0 0 0 0 0Chignik 21 19 340 12,878 7 118 5,351 6 15 3 62Chignik Lagoon 34 28 176 2,921 3 9 180 0 0 0 0Chignik Lake 7 6 35 359 4 14 210 2 9 1 2Chiniak 25 21 137 4,492 14 69 2,295 4 5 8 61Chugiak 6 0 0 0 0 0 0 0 0 0 0Clarks Point 2Coffman Cove 39 30 192 5,197 18 84 1,642 3 4 9 66Cold Bay 18 13 92 2,265 8 25 657 2 55 0 0Cordova 358 102 814 15,498 144 696 11,534 28 104 35 367Craig 429 210 1,862 45,658 117 546 9,888 29 67 94 850Dillingham 35 10 22 395 7 16 213 0 0 1 10Douglas 20 2 5 76 0 0 0 0 0 0 0Dutch Harbor 42 18 152 4,252 21 106 3,169 0 0 4 61Eagle River 7 1 14 378 3 5 114 0 0 0 0Edna Bay 17 13 47 2,111 7 12 479 4 14 8 139Eek 21 8 16 608 0 0 0 0 0 0 0Elfin Cove 16 6 37 858 1 1 46 1 1 1 2Excursion Inlet 2Fairbanks 6 1 0 0 0 0 0 0 0 0 0False Pass 13 9 128 1,753 1 2 38 1 60 1 35Fritz Creek 2Gambell 7 7 4 105 0 0 0 2 60 2 4Golovin 1Goodnews Bay 17 12 128 3,919 0 0 0 0 0 0 0Gustavus 52 27 244 4,369 18 79 1,521 0 0 1 6Haines 473 269 1,394 31,765 96 120 2,860 14 46 38 222Hollis 5
Continued
Sport Harvest Lingcod Indicidental Harvest
Rockfish Incidental HarvestCommunity1 Subsistence HarvestSHARCs Issued2
A-57
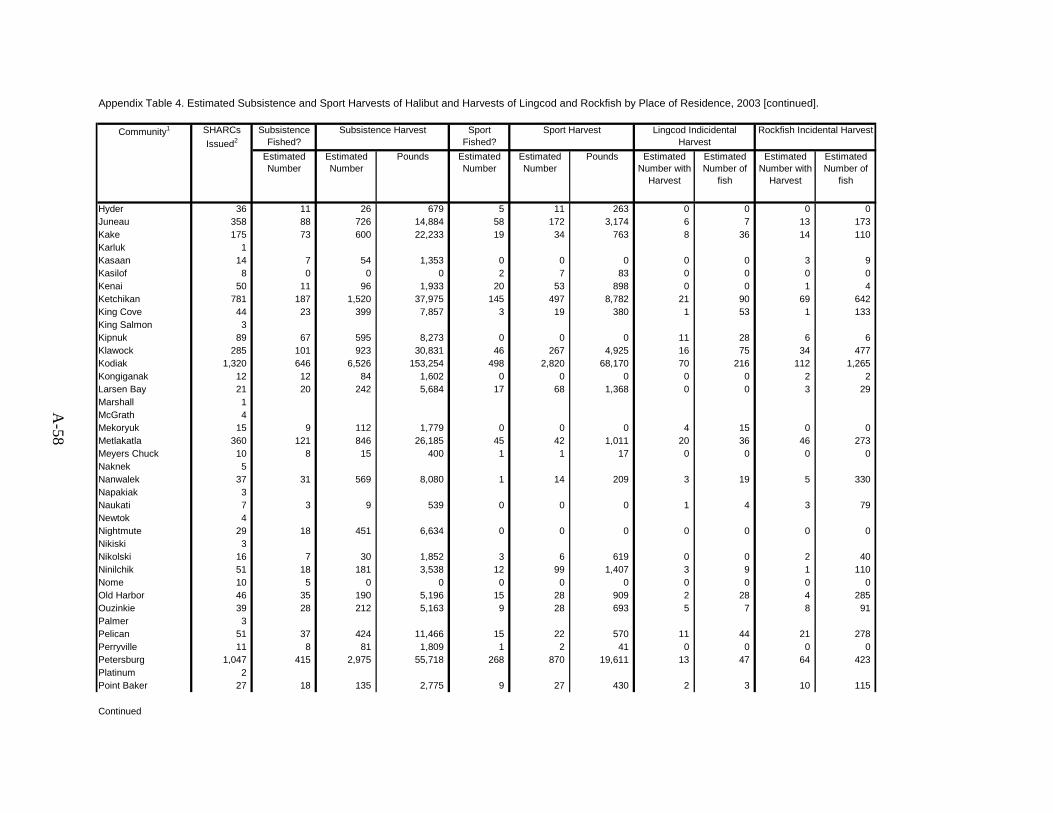
A-58
Appendix Table 4. Estimated Subsistence and Sport Harvests of Halibut and Harvests of Lingcod and Rockfish by Place of Residence, 2003 [continued].
Subsistence Fished?
Sport Fished?
Estimated Number
Estimated Number
Pounds Estimated Number
Estimated Number
Pounds Estimated Number with
Harvest
Estimated Number of
fish
Estimated Number with
Harvest
Estimated Number of
fish
Hyder 36 11 26 679 5 11 263 0 0 0 0Juneau 358 88 726 14,884 58 172 3,174 6 7 13 173Kake 175 73 600 22,233 19 34 763 8 36 14 110Karluk 1Kasaan 14 7 54 1,353 0 0 0 0 0 3 9Kasilof 8 0 0 0 2 7 83 0 0 0 0Kenai 50 11 96 1,933 20 53 898 0 0 1 4Ketchikan 781 187 1,520 37,975 145 497 8,782 21 90 69 642King Cove 44 23 399 7,857 3 19 380 1 53 1 133King Salmon 3Kipnuk 89 67 595 8,273 0 0 0 11 28 6 6Klawock 285 101 923 30,831 46 267 4,925 16 75 34 477Kodiak 1,320 646 6,526 153,254 498 2,820 68,170 70 216 112 1,265Kongiganak 12 12 84 1,602 0 0 0 0 0 2 2Larsen Bay 21 20 242 5,684 17 68 1,368 0 0 3 29Marshall 1McGrath 4Mekoryuk 15 9 112 1,779 0 0 0 4 15 0 0Metlakatla 360 121 846 26,185 45 42 1,011 20 36 46 273Meyers Chuck 10 8 15 400 1 1 17 0 0 0 0Naknek 5Nanwalek 37 31 569 8,080 1 14 209 3 19 5 330Napakiak 3Naukati 7 3 9 539 0 0 0 1 4 3 79Newtok 4Nightmute 29 18 451 6,634 0 0 0 0 0 0 0Nikiski 3Nikolski 16 7 30 1,852 3 6 619 0 0 2 40Ninilchik 51 18 181 3,538 12 99 1,407 3 9 1 110Nome 10 5 0 0 0 0 0 0 0 0 0Old Harbor 46 35 190 5,196 15 28 909 2 28 4 285Ouzinkie 39 28 212 5,163 9 28 693 5 7 8 91Palmer 3Pelican 51 37 424 11,466 15 22 570 11 44 21 278Perryville 11 8 81 1,809 1 2 41 0 0 0 0Petersburg 1,047 415 2,975 55,718 268 870 19,611 13 47 64 423Platinum 2Point Baker 27 18 135 2,775 9 27 430 2 3 10 115
Continued
Community1 SHARCs Issued2
Subsistence Harvest Sport Harvest Lingcod Indicidental Harvest
Rockfish Incidental Harvest

A-59
Appendix Table 4. Estimated Subsistence and Sport Harvests of Halibut and Harvests of Lingcod and Rockfish by Place of Residence, 2003 [continued].
Subsistence Fished?
Sport Fished?
Estimated Number
Estimated Number
Pounds Estimated Number
Estimated Number
Pounds Estimated Number with
Harvest
Estimated Number of
fish
Estimated Number with
Harvest
Estimated Number of
fish
Saint George Island 31 16 159 2,041 0 0 0 0 0 0 0Saint Paul Island 250 82 1,010 19,744 6 35 876 18 99 12 93Sand Point 73 21 225 4,819 11 17 410 1 10 6 29Savoonga 43 19 71 4,275 0 0 0 1 1 0 0Scammon Bay 7 4 25 181 0 0 0 0 0 0 0Seldovia 103 54 916 17,344 38 259 4,554 6 29 13 121Seward 10 0 0 0 0 0 0 0 0 0 0Shishmaref 1Sitka 1,639 821 6,621 174,880 401 1,379 32,408 259 984 352 4,354Skagway 44 21 42 963 18 29 831 3 21 2 16Soldotna 7 4 28 225 0 0 0 0 0 0 0South Naknek 1Sterling 4Sutton 1Tatitlek 19 17 127 4,516 1 2 69 1 11 9 122Tenakee Springs 36 21 131 3,514 23 65 1,323 0 0 10 87Thorne Bay 99 61 387 13,268 40 72 2,086 4 5 22 263Togiak 2Toksook Bay 532 54 1,397 24,500 0 0 0 13 45 5 41Trapper Creek 1Unalakleet 1Unalaska 50 32 377 6,608 12 93 2,350 4 35 4 41Valdez 22 16 65 1,611 7 0 0 3 4 9 38Ward Cove 25 4 4 246 8 6 138 0 0 0 0Wasilla 18 4 37 761 4 6 490 2 4 4 9Whale Pass 3White Mountain 1Whittier 1Willow 1Wrangell 466 223 1,351 33,006 112 252 5,895 13 60 38 302Yakutat 85 39 455 10,253 18 90 2,041 21 77 12 192
Non Alaska 170 5 6 122 4 5 103 0 0 0 0
Totals 11,635 4,932 43,924 1,041,322 2,576 10,793 245,941 703 3,295 1,241 14,868
1 To protect confidentiality, data for communities with 5 or fewer SHARCs issued are not reported in this table. Totals include all communities2 SHARC = subsistence halibut registration certificate.
Source: Alaska Department of Fish and Game, Division of Subsistence, 2004
Community1 SHARCs Issued2
Subsistence Harvest Sport Harvest Lingcod Indicidental Harvest
Rockfish Incidental Harvest

A-60
Appendix Table 5. Estimated Alaska Subsistence Harvests of Halibut by Gear Type and Place of Residence, 2003.
Estimated Number Fished
Estimated Number
Harvested
Estimated Pounds
Harvested
Estimated Number Fished
Estimated Number
Harvested
Estimated Pounds
Harvested
Estimated Number Fished
Estimated Number
Harvested
Estimated Pounds
Harvested
Adak 6 6 27 687 0 0 0 6 27 687Akhiok 15 0 0 0 14 55 1,846 14 55 1,846Akutan 50 7 25 231 36 288 9,381 39 313 9,612Aleknagik 1Anchor Point 11 0 0 0 1 6 155 4 6 155Anchorage 163 22 394 9,169 18 71 2,038 37 465 11,206Angoon 151 70 925 16,530 36 217 3,753 80 1,142 20,283APO 1Atka 13 4 17 812 4 17 812 4 35 1,625Auke Bay 2Bethel 10 0 0 0 2 6 44 4 6 44Big Lake 2Chefornak 20 8 160 1,050 20 312 2,442 20 472 3,492Chenega Bay 13 9 97 4,167 9 35 1,476 13 132 5,644Chevak 10 0 0 0 0 0 0 8 0 0Chignik 21 13 147 6,168 13 192 6,710 19 340 12,878Chignik Lagoon 34 7 49 1,183 25 126 1,738 28 176 2,921Chignik Lake 7 1 5 175 5 30 184 6 35 359Chiniak 25 19 101 3,422 8 36 1,069 21 137 4,492Chugiak 6 0 0 0 0 0 0 0 0 0Clarks Point 2Coffman Cove 39 26 162 4,566 6 30 631 30 192 5,197Cold Bay 18 11 71 1,382 8 22 883 13 92 2,265Cordova 358 68 347 7,613 40 467 7,885 102 814 15,498Craig 429 175 1,407 39,193 60 454 6,464 210 1,862 45,658Dillingham 35 6 19 302 2 4 93 10 22 395Douglas 20 2 5 76 0 0 0 2 5 76Dutch Harbor 42 12 82 2,388 12 70 1,863 18 152 4,252Eagle River 7 1 12 315 1 2 63 1 14 378Edna Bay 17 12 46 2,084 1 1 28 13 47 2,111Eek 21 3 0 0 5 16 608 8 16 608Elfin Cove 16 4 22 582 2 15 277 6 37 858Excursion Inlet 2Fairbanks 6 1 0 0 0 0 0 1 0 0
Continued
Hand-Operated Gear All GearEstimated Harvest by Gear TypeCommunity1 Number of
SHARCs2
IssuedSetline (fixed) Gear
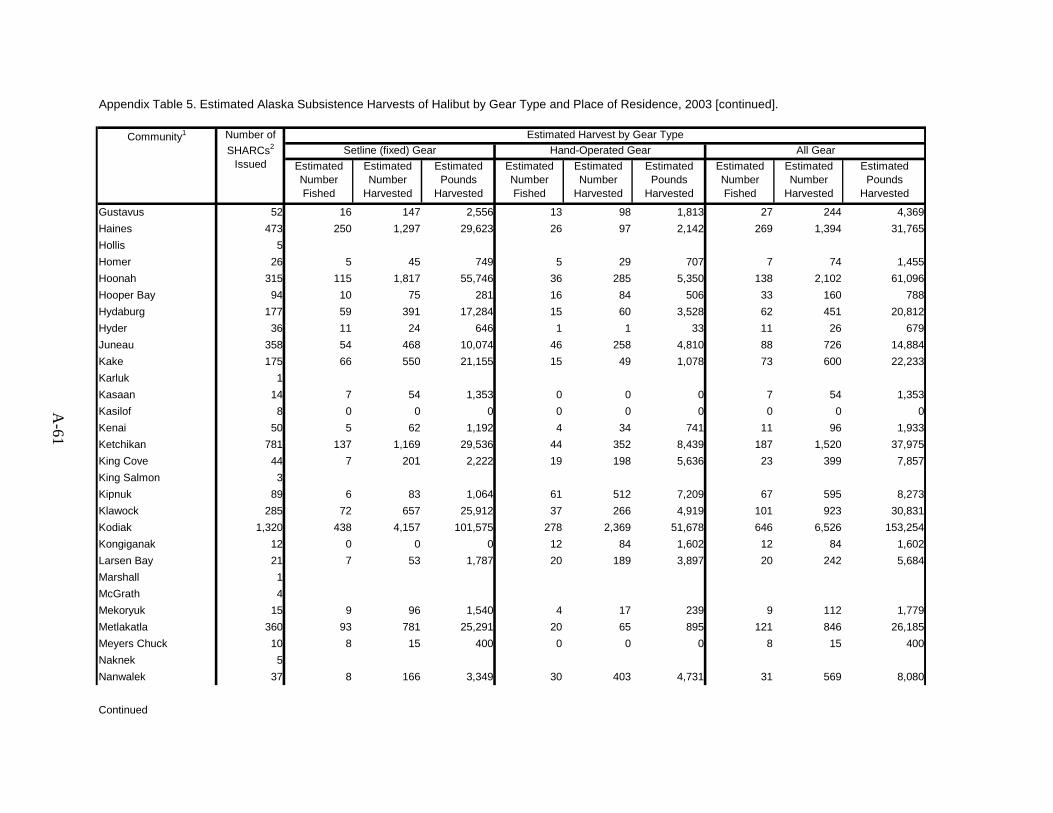
A-61
Appendix Table 5. Estimated Alaska Subsistence Harvests of Halibut by Gear Type and Place of Residence, 2003 [continued].
Estimated Number Fished
Estimated Number
Harvested
Estimated Pounds
Harvested
Estimated Number Fished
Estimated Number
Harvested
Estimated Pounds
Harvested
Estimated Number Fished
Estimated Number
Harvested
Estimated Pounds
Harvested
Gustavus 52 16 147 2,556 13 98 1,813 27 244 4,369Haines 473 250 1,297 29,623 26 97 2,142 269 1,394 31,765Hollis 5Homer 26 5 45 749 5 29 707 7 74 1,455Hoonah 315 115 1,817 55,746 36 285 5,350 138 2,102 61,096Hooper Bay 94 10 75 281 16 84 506 33 160 788Hydaburg 177 59 391 17,284 15 60 3,528 62 451 20,812Hyder 36 11 24 646 1 1 33 11 26 679Juneau 358 54 468 10,074 46 258 4,810 88 726 14,884Kake 175 66 550 21,155 15 49 1,078 73 600 22,233Karluk 1Kasaan 14 7 54 1,353 0 0 0 7 54 1,353Kasilof 8 0 0 0 0 0 0 0 0 0Kenai 50 5 62 1,192 4 34 741 11 96 1,933Ketchikan 781 137 1,169 29,536 44 352 8,439 187 1,520 37,975King Cove 44 7 201 2,222 19 198 5,636 23 399 7,857King Salmon 3Kipnuk 89 6 83 1,064 61 512 7,209 67 595 8,273Klawock 285 72 657 25,912 37 266 4,919 101 923 30,831Kodiak 1,320 438 4,157 101,575 278 2,369 51,678 646 6,526 153,254Kongiganak 12 0 0 0 12 84 1,602 12 84 1,602Larsen Bay 21 7 53 1,787 20 189 3,897 20 242 5,684Marshall 1McGrath 4Mekoryuk 15 9 96 1,540 4 17 239 9 112 1,779Metlakatla 360 93 781 25,291 20 65 895 121 846 26,185Meyers Chuck 10 8 15 400 0 0 0 8 15 400Naknek 5Nanwalek 37 8 166 3,349 30 403 4,731 31 569 8,080
Continued
Community1 Number of SHARCs2
Issued
Estimated Harvest by Gear TypeSetline (fixed) Gear Hand-Operated Gear All Gear

A-62
Appendix Table 5. Estimated Alaska Subsistence Harvests of Halibut by Gear Type and Place of Residence, 2003 [continued].
Estimated Number Fished
Estimated Number
Harvested
Estimated Pounds
Harvested
Estimated Number Fished
Estimated Number
Harvested
Estimated Pounds
Harvested
Estimated Number Fished
Estimated Number
Harvested
Estimated Pounds
Harvested
Nikolski 16 0 0 0 7 30 1,852 7 30 1,852Ninilchik 51 4 43 933 13 138 2,605 18 181 3,538Nome 10 5 0 0 0 0 0 5 0 0Old Harbor 46 7 35 1,003 30 156 4,193 35 190 5,196Ouzinkie 39 23 101 2,569 18 111 2,594 28 212 5,163Palmer 3Pelican 51 29 375 10,066 15 49 1,400 37 424 11,466Perryville 11 7 75 1,551 4 5 258 8 81 1,809Petersburg 1,047 330 2,276 41,704 138 699 14,013 415 2,975 55,718Platinum 2Point Baker 27 18 129 2,693 2 6 81 18 135 2,775Port Alexander 21 9 43 1,099 2 8 188 10 51 1,287Port Graham 52 10 254 4,398 28 435 7,056 35 689 11,454Port Lions 68 31 270 5,693 14 57 1,093 42 327 6,786Quinhagak 15 3 5 342 12 41 821 12 47 1,164Saint George Island 31 9 100 1,235 12 60 806 16 159 2,041Saint Paul Island 250 29 549 8,712 58 461 11,032 82 1,010 19,744Sand Point 73 15 175 3,409 11 50 1,410 21 225 4,819Savoonga 43 17 63 3,831 2 8 444 19 71 4,275Scammon Bay 7 2 10 62 4 15 119 4 25 181Seldovia 103 28 412 6,977 39 504 10,367 54 916 17,344Seward 10 0 0 0 0 0 0 0 0 0Shishmaref 1Sitka 1,639 760 5,691 155,276 160 930 19,604 821 6,621 174,880Skagway 44 18 27 686 2 15 277 21 42 963Soldotna 7 4 28 225 0 0 0 4 28 225South Naknek 1STERLING 4Sutton 1
Continued
Community1 Number of SHARCs2
Issued
Estimated Harvest by Gear TypeSetline (fixed) Gear Hand-Operated Gear All Gear

Appendix Table 5. Estimated Alaska Subsistence Harvests of Halibut by Gear Type and Place of Residence, 2003 [continued].
Estimated Number Fished
Estimated Number
Harvested
Estimated Pounds
Harvested
Estimated Number Fished
Estimated Number
Harvested
Estimated Pounds
Harvested
Estimated Number Fished
Estimated Number
Harvested
Estimated Pounds
Harvested
Trapper Creek 1Unalakleet 1Unalaska 50 27 264 4,325 19 113 2,283 32 377 6,608Valdez 22 13 56 1,395 1 9 216 16 65 1,611Ward Cove 25 0 0 0 2 4 246 4 4 246Wasilla 18 0 0 0 4 37 761 4 37 761Whale Pass 3White Mountain 1Whittier 1Willow 1Wrangell 466 200 1,107 27,762 44 244 5,245 223 1,351 33,006Yakutat 85 33 336 8,047 13 119 2,206 39 455 10,253
Non-Alaska 170 4 6 122 0 0 0 5 6 122
Totals 11,635 3,623 29,741 752,846 1,806 14,182 288,471 4,932 43,924 1,041,322
1 To protect confidentiality, data for communities with 5 or fewer SHARCs issued are not reported in this table. Totals include all communities2 SHARC = subsistence halibut registration certificate.
Community1 Number of SHARCs2
Issued
Estimated Harvest by Gear TypeSetline (fixed) Gear Hand-Operated Gear All Gear
A-63

Appendix Table 6. Estimated Number of SHARC Holders Who Either Subsistence or Sport Fished by Place of Residence, 2003
Community1 Number of SHARCs2
IssuedEstimated Number
Subsistence or Sport Fished for Halibut
Adak 6 6Akhiok 15 14Akutan 50 42Aleknagik 1Anchor Point 11 10Anchorage 163 60Angoon 151 84APO 1Atka 13 4Auke Bay 2Bethel 10 4Big Lake 2Chefornak 20 20Chenega Bay 13 15Chevak 10 8Chignik 21 19Chignik Lagoon 34 29Chignik Lake 7 6Chiniak 25 23Chugiak 6 0Clarks Point 2Coffman Cove 39 31Cold Bay 18 14Cordova 358 194Craig 429 262Dillingham 35 14Douglas 20 2Dutch Harbor 42 32Eagle River 7 3Edna Bay 17 14Eek 21 8Elfin Cove 16 6Excursion Inlet 2Fairbanks 6 1False Pass 13 9Fritz Creek 2Gambell 7 7Golovin 1Goodnews Bay 17 12Gustavus 52 34Haines 473 289Hollis 5Homer 26 8Hoonah 315 157Hooper Bay 94 36Hydaburg 177 63Hyder 36 14Juneau 358 114Kake 175 78Karluk 1Kasaan 14 7Kasilof 8 2Kenai 50 26Ketchikan 781 267King Cove 44 23King Salmon 3Kipnuk 89 67Klawock 285 116Kodiak 1,320 858Kongiganak 12 12Larsen Bay 21 23Marshall 1McGrath 4Mekoryuk 15 9
Continued
A-64
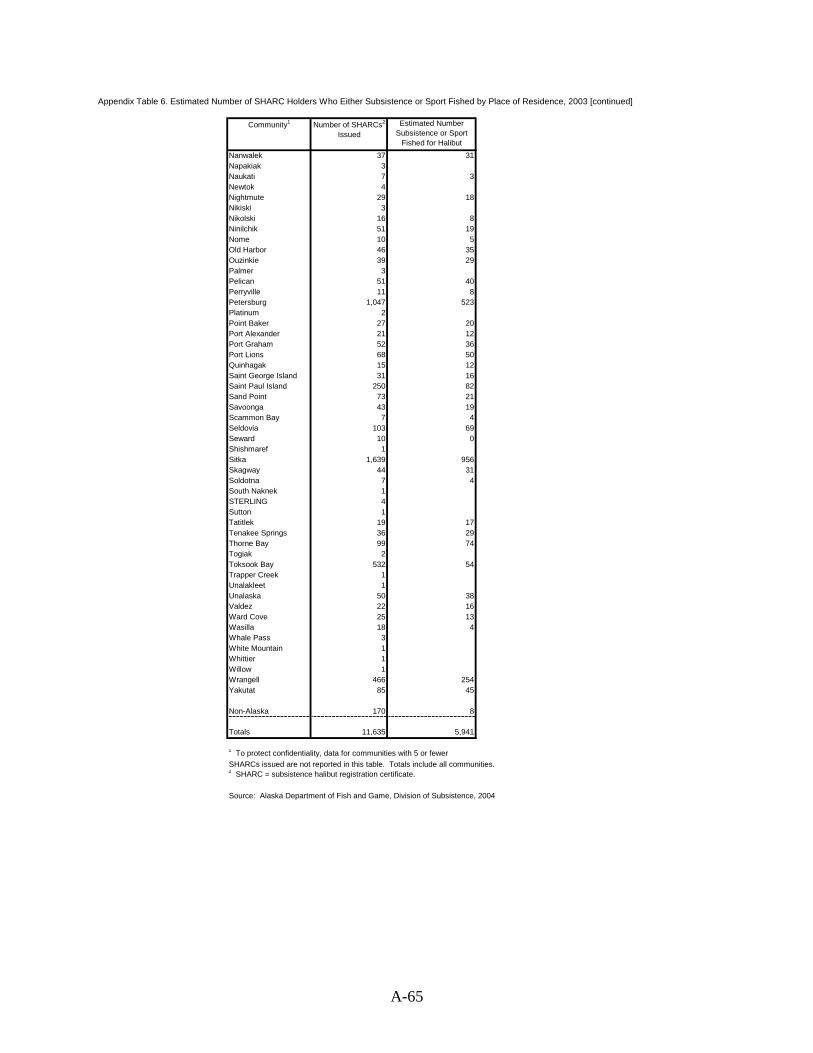
Appendix Table 6. Estimated Number of SHARC Holders Who Either Subsistence or Sport Fished by Place of Residence, 2003 [continued]
Community1 Number of SHARCs2
IssuedEstimated Number
Subsistence or Sport Fished for Halibut
Nanwalek 37 31Napakiak 3Naukati 7 3Newtok 4Nightmute 29 18Nikiski 3Nikolski 16 8Ninilchik 51 19Nome 10 5Old Harbor 46 35Ouzinkie 39 29Palmer 3Pelican 51 40Perryville 11 8Petersburg 1,047 523Platinum 2Point Baker 27 20Port Alexander 21 12Port Graham 52 36Port Lions 68 50Quinhagak 15 12Saint George Island 31 16Saint Paul Island 250 82Sand Point 73 21Savoonga 43 19Scammon Bay 7 4Seldovia 103 69Seward 10 0Shishmaref 1Sitka 1,639 956Skagway 44 31Soldotna 7 4South Naknek 1STERLING 4Sutton 1Tatitlek 19 17Tenakee Springs 36 29Thorne Bay 99 74Togiak 2Toksook Bay 532 54Trapper Creek 1Unalakleet 1Unalaska 50 38Valdez 22 16Ward Cove 25 13Wasilla 18 4Whale Pass 3White Mountain 1Whittier 1Willow 1Wrangell 466 254Yakutat 85 45
Non-Alaska 170 8
Totals 11,635 5,941
1 To protect confidentiality, data for communities with 5 or fewer SHARCs issued are not reported in this table. Totals include all communities.2 SHARC = subsistence halibut registration certificate.
Source: Alaska Department of Fish and Game, Division of Subsistence, 2004
A-65