subsector bottoming out - deloitte us | audit, consulting ... · 2016 global aerospace and defense...
TRANSCRIPT

2016 Global aerospace and defense sector financial performance study Sector returned to growth, with US defense subsector bottoming outJuly 2016

2
ContentsExecutive summary 1
Summary of key 2015 financial 6 performance measures
Scope of the study 10
Detailed 2015 global aerospace and 13 defense sector performance
US compared with European aerospace 30 and defense companies
US versus European defense subsector 34
Global commercial aerospace subsector compared 36 with defense subsector performance
Segment performance 38
Summary aerospace and defense sector 40 performance figures
Methodology 44
Endnotes 46
Contacts 47

1
2016 Global aerospace and defense sector financial performance study
Global aerospace and defense (A&D) sector revenues experienced growth in 2015 in constant US dollar (US$), adding US$24.8 billion in revenues to reach US$674.4 billion. After a decline in sector growth from 3.2 percent in 2013 to 1.9 percent in 2014, global A&D sector growth recovered to 3.8 percent in 2015, outperforming global gross domestic product (GDP) growth of 2.4 percent.1 This global A&D financial performance study is analyzed on a constant currency (US$) basis to remove exchange rate fluctuations led by the significant strengthening of the US$ in 2015 against all major currencies.
When measured in non-constant US$ basis, global A&D sector revenue actually experienced a 1.9 percent decline year on year in 2015, likely due to this US$ strength – the Euro (EUR): US$ weakened 16.4 percent in 2015; British pound (GBP):US$ was down 6.6 percent; Canadian dollar (CAD):US$ dipped 13.3 percent; and Japanese Yen (JPY):US$ decreased 12.6 percent. When measured on a non-constant foreign exchange (FX) basis in US$, European A&D sector revenues actually declined 6.6 percent in 2015, with both commercial and defense subsector revenue down more than 6.0 percent. Continued strength of
Executive summaryGlobal aerospace and defense revenues in constant currencies returned to growth, outpacing inflation, however, the sector experienced a decline when measured on a non-constant US dollar basis.
the US$ over time would likely promote sector growth in non-US$ denominated markets, especially the UK and the Euro-zone, making their products more price competitive.
Defense subsector is rebounding likely due to increased military spending by governments that are recapitalizing their defense infrastructure. The defense subsector experienced recovery after two consecutive years of decline, with 1.7 percent revenue growth, equating to US$5.8 billion of revenue, in constant currencies (US$). The key factor in this improved trend is that the magnitude of decline in the US defense subsector slowed down with a 0.9 percent decline in 2015, an improvement from a 2.2 percent decline in 2014. The US defense subsector appears to have bottomed out with a slowdown in the pace of decline in revenue and is expected to rebound in 2016 and 2017 as an increase in funding is expected by the US Department of Defense (DoD), the largest subsector customer. DoD budgets for 2016 increased by 3.6 percent.2
In the US, it is likely that even with sequestration in effect, the DoD base budget bottomed out in 2015, and consumer price inflation (CPI) adjusted
increases are starting to take effect from 2016 onward. On the other hand, the European defense subsector returned to growth, from a 2.7 percent decline in 2014, to strong growth of 6.8 percent in 2015. International demand for defense and military products is increasing likely due to regional tensions in the Middle East, Eastern Europe, the Korean peninsula, the Indian subcontinent, and the East and South China Seas. Both the US, as well as the European defense contractors are expected to increase foreign military sales to governments in these regions, and competition is expected to be significant for landmark sales orders.

2
2016 Global aerospace and defense sector financial performance study
Commercial aerospace deliveries and backlog reached record-highs with strong revenue growth in 2015, with future years of sector industrial stability expected.Global commercial aerospace companies achieved record high aircraft deliveries and backlogs in 2015, with deliveries up 3.3 percent in 2015, as aircraft backlog units reached an all-time high of 13,467 at the end of 2015, which continues to increase. As a reference point, global backlog stood at only 7,185 units as recently as 2010, growing 87.4 percent in the last five years. The backlog as of yearend 2015 was valued at a record high of approximately US$1.9 trillion at list prices. At the current production rate, this represents 9.6 years of backlog of future production, a significant increase from the 7.4 years of backlog at the end of 2010.
However, total new sales orders for commercial aircraft in 2015 declined 39.0 percent year on year (YoY) to reach 1,841 units, after experiencing a surge in new orders, especially over the last three years. Revenues for the commercial aerospace subsector grew 6.3 percent, from US$306.2 billion in 2014 to US$325.5 billion in 2015. Growth in travel demand, primarily in China, India, and the Middle East, as well as the need for more fuel-efficient aircraft continued to drive demand for new aircraft. Given the strong demand for new commercial aircraft, it is estimated that approximately 34,000 jets will be delivered from 2015 through 2034, with a value of over US$5.47 trillion at list prices.3
The European aerospace and defense sector is eclipsing the US sector in revenue growth, likely due to increased market competitiveness, increased defense spending and continued growth in commercial aircraft production. While the US A&D sector experienced marginal growth of 1.4 percent, the European A&D sector’s growth was very strong at 8.2 percent growth in 2015. This was made up of 9.6 percent growth in commercial aerospace, and 6.8 percent growth in defense. European company market competitiveness and defense spending in Europe is increasing, which has led to higher growth by companies in the region as compared to the US. The top three European companies – Airbus Group, BAE Systems, and Safran recorded strong revenue growth of 6.2 percent, 8.8 percent, and 20.3 percent respectively, in 2015. On the other hand, the top three A&D companies in the US, namely, The Boeing Company, and Lockheed Martin, and General Dynamics recorded 5.9 percent,4 1.2 percent, and 2.0 percent revenue growth, respectively, in 2015. With the continued strength of the US$, European company revenue growth is expected to accelerate as a pricing advantage should become more of a factor in competitive sales orders against US$ based products.
Sector operating margins have topped out, signaling continued challenges in program management, pricing pressure, and product affordability by key government customers. Historically, core operating margins for the sector improved from 9.7 percent in 2012 to 10.5 percent in 2013 and 10.8 percent in 2014. However, global sector operating margins were marginally down in 2015 at 10.4 percent. On the other hand, core operating earnings remained flat in 2015 at US$70.2 billion. Commercial aerospace subsector’s core operating earnings declined 3.7 percent, whereas, defense companies’ core operating earnings grew 2.9 percent, despite only a 1.7 percent revenue increase in 2015.
Commercial aerospace subsector core operating margins were 10.2 percent, while defense companies reported core operating margins of 10.7 percent in 2015. However, when measuring operating margins on a reported basis, the sector performance declined from 10.1 percent in 2014 to 8.9 percent in 2015. One time write-offs and impairments likely due to program losses reached US$10.3 billion in 2015.
Operating margins for the sector appear to have topped out and are expected to remain flat, as a result of continued program management challenges, pricing pressure, and affordability constraints with government customers. As new large scale commercial and defense platform programs reach maturity and deliveries to customers reach stable levels, it is expected that one time write-offs of development cost overruns will abate.
Sector productivity remains high, however, it has stabilized after experiencing improvement over the past, which was likely due to increased replacement of labor with process automation, efficiency initiatives, and lower overhead costs brought about through increased mergers and acquisitions activity. Although the sector productivity remained solid in 2015, it has stabilized at the current levels as the sector already experienced significant improvement in productivity in the past. Efficiency, defined as operating earnings per employee among global A&D companies decreased marginally by 0.7 percent to US$34,276 in 2015 compared to US$34,523 in 2014 as the employment growth for the sector in 2015 was essentially flat (0.4 percent growth) with 2.05 million employees, while operating margins declined. However, efficiency levels continue to differ between the US and Europe. While the US recorded operating earnings per employee at US$41,218 in 2015, it was much lower for the European A&D companies at US$28,521.

3
2016 Global aerospace and defense sector financial performance study
Efficiency initiatives by commercial aerospace companies, especially the larger companies, include increased concentration of their supplier base, risk sharing with suppliers, and factory automation have led to improved productivity levels. Also, a decrease in overhead costs experienced as a result of higher M&A activity, also contributed to higher productivity. Based on these positive trends in productivity, A&D sector customers, such as airlines and their paying passengers, as well as the defense departments of countries, are likely obtaining more for less, thus helping to create financial value for shareholders, taxpayers, and the global economy. Higher profitability over the long term should attract more resources in the capital markets needed for investments in innovative research and development to introduce next generation products.
Propulsion, avionics, and complex systems suppliers continue to experience higher operating margins and profitability, compared to aerostructures and services companies. As indicated earlier, the A&D sector’s average operating margin declined 3.9 percent to 10.4 percent. However, operating margins for propulsion, tier two, and electronics suppliers remained strong at 15.8 percent, 16.8 percent, and 13.1 percent in 2015, respectively, likely due to higher proprietary intellectual property content and delivery of better customer value, such as increased fuel efficiency. This is in contrast to aerostructures and services companies, which experienced lower operating performance, with margins at 10.1 percent and 6.8 percent, respectively. These segments of the A&D sector are more likely to be impacted by pricing pressures likely due to commoditization challenges. It is expected that lower margin segments would benefit from additional industry consolidation to create scale economies in overhead and back office costs, with evidence of this trend already occurring over the last few years.
US aerospace and defense (A&D) sector operating margins continue to remain higher than European A&D sector, with a 3.1 percent gap, however profitability of European A&D companies is increasing.Average core operating margins of the US A&D companies stood at 11.6 percent, down 6.1 percent in 2015. However, European A&D sector’s core operating earnings grew 11.1 percent in 2015, leading to a margin of 8.5 percent, versus 8.3 percent in 2014. Although, US margins remain higher, European A&D companies are experiencing improvements in operational performance. However, lower margins for European A&D companies bring into focus the challenge for these companies to gain efficiencies in the cost and asset base and their comparative ability to rationalize assets and reduce operating expenses, particularly labor expenses. In addition, within Europe, country specific defense budgets supporting the individual country industrial base may not be large enough to achieve competitive efficiencies and economies of scale in their cost structure. Efforts to gain scale with cross border European alliances and joint ventures have increased in pace over the last decade, and is expected to continue, as customer pricing pressure and new competition increases from China, Russia, and other nations for foreign military sales.
Sector is taking on more debt to finance stock buybacks, acquisitions, and product development, especially in the US, taking advantage of historically low interest rates. The global A&D sector experienced a strong interest coverage ratio of 16.4 times in 2015, up 15.3 percent from 14.2 times in 2014, led by strong operational performance. However, the debt-to-equity ratio for the sector has weakened to 1.26 times in 2015, deteriorating from 0.92 times in 2014. The sector, especially in the US, experienced an increase in debt levels in order to fund share buybacks, acquisitions, and product development as interest rates remained low. The US A&D sector’s debt-to-equity ratio stood at 1.42 times in 2015, whereas, for European A&D companies, the ratio was stronger
at 1.05 times. Should interest rates rise over the coming period, debt expense will likely start to weigh on the profitability of sector companies, and become a cause for concern. The ability to pay down debt with strong cash flows quickly, should interest rates rise suddenly, will likely be a factor in continuing to experience strong financial performance and resulting stock market performance.
Drivers of key financial performance metrics were driven by increased revenues from commercial aircraft original equipment manufacturers, and their key suppliers, as well as increased profits from European defense companies. Strong financial performance in the global A&D sector can be largely attributed to the sales growth at The Boeing Company, which added US$5.4 billion5 and Airbus Group, which contributed US$4.2 billion in additional revenues in 2015 as commercial aircraft deliveries were at an all-time high in 2015. Strong growth in revenues was also led by incremental revenues in the propulsion segment (US$5.3 billion), as well as by other original equipment manufacturers (OEMs) (US$4.9 billion), apart from The Boeing Company and Airbus Group. Core operating earnings growth in the global A&D sector was primarily driven by the European defense subsector, which experienced a healthy operational performance in 2015, adding US$2.1 billion in earnings in 2015. Figure 1 further illustrates the key drivers of sector financial performance in 2015.

4
2016 Global aerospace and defense sector financial performance study
Figure 1: Summary of key drivers of global aerospace and defense sector revenue and earnings performance
Revenue:
Growth from original equipment manufacturers segment US$14.4 billion
Growth from propulsion segment US$5.3 billion
Growth from electronics segment US$2.4 billion
Growth from aerostructures segment US$1.0 billion
Growth from services segment US$0.7 billion
Other* US$1.0 billion
Total revenue growth US$24.8 billion
Core operating earnings:
Increased performance of European defense subsector US$2.1 billion
Decreased performance of European commercial aerospace subsector (US$0.4 billion)
Decreased performance of the US defense subsector (US$1.1 billion)
Decreased performance of the US commercial aerospace subsector (US$1.3 billion)
Other* US$0.5 billion
Total decrease in operating earnings (US$0.2 billion)
Note: * For revenue, Other includes revenue growth from tier one, two, and three segment; For core operating earnings, Other include some companies from outside of US and Europe regions, such as, Brazil, Canada, Israel, Japan, Singapore, China, and South Korea. Companies from these regions are not included in the “US” and the “European” region totals, but have been included in “Other”.
Source: Deloitte Global group analysis of the 100 major global aerospace and defense companies using public company filings and press releases. See Methodology section for further information and definitions of financial metric, as well as company name, reports, and dates. Note that all figures are in US$.

5
2016 Global aerospace and defense sector financial performance study

6
2016 Global aerospace and defense sector financial performance study
6
Summary of key 2015 financial performance measuresRevenuesThe global A&D sector’s revenue grew 3.8 percent to US$674.4 billion in 2015 from US$649.7 billion in 2014. The growth was primarily driven by strong performance of the global commercial aerospace subsector, which grew 6.3 percent YoY in 2015. The Boeing Company and Airbus Group reported 5.9 percent and 6.2 percent growth in revenues, respectively, driven by an increase in commercial aircraft deliveries. While the US defense subsector experienced a marginal decline of 0.9 percent, the European defense subsector experienced strong growth of 6.8 percent in 2015. The Boeing Company declined 1.6 percent YoY, whereas the Airbus Group defense revenues grew 1.7 percent. The OEM segment experienced moderate revenue growth of 4.0 percent, led by the commercial aerospace subsector and the European defense subsector.
Core operating earningsCore operating earnings of the global A&D sector experienced a negligible decline of 0.3 percent to US$70.2 billion in 2015, versus US$70.4 billion in 2014. While the US companies reported a 4.7 percent decline in operating earnings, it was offset by the European A&D companies, which recorded strong growth of 11.1 percent in operating earnings to US$17.4 billion. While the tier one segment’s operating earnings decreased 18.8 percent and the OEM segment’s operating earnings were down 2.4 percent, it was partially offset by the propulsion and aerostructures segments, which reported 14.4 and 19.0 percent growth in core operating earnings, respectively.
Core operating marginsCore operating margins for the sector were down marginally to 10.4 percent in 2015, as compared to 10.8 percent in 2014. The aerostructures and propulsion segments experienced marginal growth in operating margins, which was more than offset by a decline in margins in all other segments, resulting in lower margins. US A&D companies reported a 6.1 percent decline in core operating margins to 11.6 percent in 2015, versus 12.4 percent in 2014. On the other hand, European A&D sector’s core operating margin improved 2.7 percent to 8.5 percent in 2015.
Return on invested capitalReturn on invested capital (ROIC) for the global A&D sector grew 13.4 percent to 24.5 percent in 2015, compared to 21.6 percent in 2014. This was mainly led by improved operational performance of the sector.
Free cash flowThe global A&D sector’s free cash flow (FCF) improved 5.8 percent to US$40.9 billion in 2015, compared to US$38.7 billion in 2014. This is likely due to A&D companies’ revenue and operating cash flow growth, especially in the commercial aerospace subsector, which was offset by decreases in government defense spending and redeployment of cash for acquisitions and growth plans.
Free cash marginFree cash margin (FCM) for the sector decreased 1.9 percent to 6.1 percent in 2015, compared to 6.0 percent in 2014, as a result of a 5.8 percent growth in FCF in 2015, while revenues were up 3.8 percent. The aerostructures segment added US$1.1 billion FCF in 2015, led by a strong operational performance.
Interest coverage ratioInterest coverage ratio, which reflects the company’s ability to pay its interest payments from its available earnings, increased 15.3 percent in 2015 to 16.4 times, compared to 14.2 times in 2014. This is likely led by an improvement in A&D sector’s operating performance.
Debt equity ratioThe global A&D sector’s debt equity ratio weakened to 1.26 times in 2015, down 36.2 percent from 0.92 times in 2014. This was led by increased debt levels in the sector, likely due to acquisition financing and expansion plans. The US A&D sector reported a debt equity ratio of 1.42 times in 2015, which declined from 0.90 times in 2014. On the other hand, debt equity ratio for the European A&D sector was at 1.05 times in 2015, relatively stronger as compared to US.

7
2016 Global aerospace and defense sector financial performance study
Book-to-bill ratioIn 2015, the sector book-to-bill ratio was down 13.4 percent to 1.24 times in 2015 from 1.43 times in 2014. The decrease in BTB was likely due to reduced sales orders at Bombardier, General Dynamics, and BAE Systems, partially offset by strong growth in Airbus Group’s sales orders. The sector backlog increased 8.9 percent in 2015 to US$2.71 trillion, driven by higher demand for commercial aircraft.
EmploymentThe global A&D sector’s total global employment was flat with a negligible increase of 0.4 percent to approximately 2.05 million in 2015. Flat growth in employment, as compared to moderate growth in revenues is likely due to the large staff reductions experienced over the last several years in US defense, as well as the increase of factory and process automation which is replacing higher cost labor at an increasing rate.
ProductivityReported operating earnings per employee in 2015 experienced a negligible decline of 0.7 percent to US$34,276 as the global A&D sector’s core operating earnings decreased 0.3 percent compared to sector employment being flat (+0.4 percent) as described above.
Summary of key performance metrics for top performersFigure 2 lists the companies that are ranked as the top performers in the 28 metrics among the top 100 global A&D companies in this study, according to the methodology used for this report (see Methodology section for more information). Although this is not a financial performance ranking, it does provide some visibility to the number of times a specific company has been ranked with the highest performance in a given financial metric category.

8
2016 Global aerospace and defense sector financial performance study
Figure 2: Top ranked company for each of the 29 key 2015 financial performance metrics
Metric Top ranked company 2015 result
Revenue The Boeing Company US$96,114 million6
Revenue growth Engility 52.5%
Core operating earnings The Boeing Company US$7,741 million7
Core operating earnings growth Smiths Detection 120.0%
Core operating margin Transdigm Group 39.7%
Core operating margin growth Smiths Detection 141.2%
Return on invested capital (ROIC) QinetiQ 72.0%
ROIC change Leonardo–Finmeccanica 685.7%
Free cash flow (FCF) Lockheed Martin US$4,162 million
FCF change Constellium 1037.3%
Free cash margin (FCM) DigitalGlobe Inc. 22.8%
FCM change Constellium 781.1%
Cash and cash equivalents change BBA Aviation 481.1%
Interest coverage ratio Fuji Aerospace 145.7x
Current ratio KLX Inc. 7.7x
Debt-to-equity ratio Elbit Systems 0.12x
Book-to-bill (BTB) Airbus Group 3.30x
BTB change Oshkosh Defense 334.9%
Backlog Airbus Group US$1,117,667 million
Backlog change SAAB 89.3%
Number of A&D employees The Boeing Company 161,4008
Employee additions Lockheed Martin 14,000
Employee additions growth Harris Corp. 59.3%
Revenue per employee Fuji Aerospace US$792,587
Revenue per employee growth IHI Aero Engine & Space 51.2%
Core operating earnings per employee Transdigm Group Inc. US$130,976
Core operating earnings per employee growth DigitalGlobe Inc. 138.2%
Share price change United Aircraft Corp. 152.6%
Source: Deloitte Global analysis of the 100 major global aerospace and defense companies using public company filings and press releases. See Methodology section for further information and definitions of financial metric, as well as company name, reports, and dates. Note that all figures are in US$.

9
2016 Global aerospace and defense sector financial performance study

10
2016 Global aerospace and defense sector financial performance study
Deloitte Global 2016 Global aerospace and defense sector financial performance study analyzes the top global 100 A&D companies or business units of industrial conglomerates with A&D businesses that reported revenue of more than US$500 million in 2015 with financial statements filed by 31 December 2015, unless otherwise specified. Figure 3 below lists the 100 companies and divisions that were analyzed. The study, however, does not include A&D organizations such as government-controlled entities, private companies that do not release public filings or public companies that do not report A&D business segment information. In addition, certain companies from the previous year’s study were excluded likely due to conformance with study criteria. That is, companies from previous years with 2015 revenues less than US$500 million in revenue, companies from previous years that have been subsequently acquired, and companies from previous years lists that have or are going private, were not included in the 2015 analysis. Please refer to the Methodology section for further information that includes the company information used to complete this study.
The study was conducted by assessing performance based on calculating 29 key financial metrics. These include key nominal and growth metrics for revenue, operating earnings, operating margin, ROIC, FCF, FCM, BTB ratio, employee productivity, and equity market
performance. All financial metrics in the study are based on a constant currency conversion method to eliminate the impact of foreign exchange fluctuations on companies’ or the global A&D sector’s performance. Where metrics were compared to previous years, the previous year numbers were restated to be consistent.
Financial performance metrics at the company level are cited throughout this study, especially for the top performing companies and selectively for the lower performers. However, unique metrics for a given company should not be viewed in isolation, as there typically are unique transactions for individual metrics by company, e.g., prior year acquisitions, special circumstances, etc. The combined metrics for a given company, taken as a whole, are more likely to form the basis for an overall assessment of the financial performance of the global A&D sector, as well as individual companies.
Summary of aerospace and defense sector performanceFigure 4 summarizes the key performance metrics of the global A&D sector in constant currency, thereby eliminating potential distortions caused by foreign currency fluctuations. All metrics are based on reported filings. Each performance metric is discussed in detail in this study.
Scope of the study

11
2016 Global aerospace and defense sector financial performance study
Figure 3: Global aerospace and defense companies included in the analysis
Global aerospace and defense companies or divisions included in this study ranked by 2015 sales revenue
1. The Boeing Company 26. Alcoa* 51. CSC* 76. HEICO Corporation
2. Airbus Group 27. Harris Corp. 52. BBA Aviation 77. Constellium*
3. Lockheed Martin 28. MTU Aero Engines 53. Meggitt 78. Ultra Electronics
4. General Dynamics29. Kawasaki Aerospace and Gas*
54. Engility 79. Oshkosh Defense*
5. United Technologies Corporation*
30. Babcock International55. ThyssenKrupp Marine Systems*
80. FACC AG*
6. BAE Systems plc 31. Dassault Aviation 56. Eaton Aerospace* 81. Amphenol*
7. GE Aviation* 32. Orbital ATK 57. CAE Inc. 82. Senior Aerospace
8. Northrop Grumman33. Singapore Technologies (ST) Engineering Ltd.
58. GenCorp/ Aerojet Rocketdyne Holdings
83. Cubic Corp.
9. Raytheon 34. SAIC59. MacDonald, Dettwiler and Associates
84. Ball Aerospace*
10. Safran 35. AviChina Industry & Tech. 60. Serco Defence* 85. OHB Technology
11. Leonardo-Finmeccanica 36. IHI Aero Engine & Space* 61. Hexcel 86. Magellan Aerospace
12. Thales Group 37. Triumph Group 62. MOOG 87. Smiths Detection*
13. Rolls-Royce 38. GKN Aerospace* 63. AAR Corp. 88. DigitalGlobe Inc*
14. Honeywell Aerospace* 39. SAAB 64. Esterline Technologies89. Crane Aerospace and Electronics*
15. L3 Communication 40. Leidos Holdings 65. Allegheny Technologies*90. Kratos Defense & Security Solutions
16. Bombardier Aerospace* 41. Cobham 66. Wesco Aircraft 91. JAMCO Corporation
17. Textron 42. Elbit Systems 67. ManTech Int'l Corp. 92. Indra Sistemas*
18. Mitsubishi Heavy Industries Aerospace*
43. Rheinmetall Defence* 68. KLX Inc* 93. Astronics Corp*
19. Huntington Ingalls Industries 44. B/E Aerospace 69. Curtiss Wright* 94. Kaman Aerospace*
20. Precision Castparts Corp. 45. Jacobs Engineering Group* 70. Fuji Aerospace* 95. Teledyne Technologies*
21. Spirit Aerosystems 46. Korea Aerospace Industries 71. Woodward Aerospace* 96. Chemring
22. Embraer 47. Transdigm Group 72. Fluor Corp.* 97. Latecoere
23. United Aircraft Corp. 48. Parker Hannifin Aerospace* 73. QinetiQ 98. SKF*
24. Zodiac Aerospace 49. CACI 74. LISI Aerospace* 99. Ducommun
25. Rockwell Collins 50. Hanwha Techwin 75. Solvay Group* 100. Kongsberg Defence Systems
Note: * Partial company results based on aerospace and defense (A&D) activity, identified by A&D specific business segment where possible.
Source: Deloitte Global analysis of the 100 major global aerospace and defense companies using public company filings and press releases. See Methodology section for further information and definitions of financial metric, as well as company name, reports, and dates.

12
2016 Global aerospace and defense sector financial performance study
Note: * Debt-to-equity ratio is lower the better, hence, the ratio has declined 36.6 percent in 2015, even though it has increased in absolute terms.
Source: Deloitte Global analysis of the 100 major global aerospace and defense companies using public company filings and press releases. See Methodology section for further information and definitions of financial metric, as well as company name, reports, and dates. Note that all figures are in US$.
Figure 4: Average performance of global aerospace and defense companies in 2015, as compared to 2014
Metric 2015 2014 Change (2015 versus 2014)
Revenues (US$ billion) US$674.4 US$649.7 3.8%
Core operating earnings (US$ billion) US$70.2 US$70.4 (0.3%)
Core operating margin (percent) 10.4% 10.8% (3.9%)
Return on invested capital (percent) 24.5% 21.6% 13.4%
free cash flow (FCF) (US$ billion) US$40.9 US$38.7 5.8%
FCF margin (percent) 6.1% 6.0% 1.9%
Interest coverage ratio (x) 16.40x 14.23x 15.3%
Current ratio (x) 1.38x 1.40x (1.1%)
Debt-to-equity ratio* (x) 1.26x 0.92x (36.2%)
Book-to-bill (BTB) ratio 1.24x 1.43x (13.4%)
Aerospace and defense (A&D) revenue/employee (US$) US$329,463 US$318,789 3.3%
A&D core operating earnings/employee (US$) US$34,276 US$34,523 (0.7%)
Number of A&D employees 2,047,092 2,037,975 0.4%
13
2016 Global aerospace and defense sector financial performance study
Detailed 2015 global aerospace and defense sector performanceThe following sections discuss the 2015 financial performance of the global A&D sector based on company type and geography, as well as on a consolidated basis:
• 2015 A&D sector performance details
• US and European A&D companies
• Commercial aerospace and defense subsector companies
• Sector performance comparisons
RevenueGlobal A&D sector revenues grew 3.8 percent to US$674.4 billion in 2015 from US$649.7 billion in 2014 (see Figure 5). The increase was mainly driven by strong growth in the commercial aerospace subsector, which experienced another year of strong aircraft deliveries, as well as a favorable mix. Both Airbus Group and The Boeing Company reported strong revenue growth of 6.2 percent and 5.9 percent YoY in 2015. The defense subsector experienced marginal growth of 1.7 percent YoY in 2015, which was primarily driven by strong growth in Europe. The US defense subsector revenues for the top 20 companies remained flat YoY, whereas, Europe’s top 20 defense contractors’ revenue increased 7.1 percent YoY in 2015. Weak performance in the US defense subsector was driven by the decrease in US DoD funding, whose budgets dipped by 3.6 percent in 2015.
Commercial aircraft delivery was at a record high of 1,397 aircraft in 2015. The continued increase in production is driving parallel revenue growth for tier one and tier two suppliers and the aerostructures and propulsion segment companies.
The Boeing Company, the largest global A&D company in terms of revenues, reported a 5.9 percent increase in revenues to US$96.1 billion in 2015 (see Figure 6) from US$90.8 billion in 2014. Boeing Commercial Airplanes’ revenues increased 10.1 percent as the company’s deliveries increased to 762 aircraft in 2015 (including 495 737s and 135 787s), compared to 723 aircraft in 2014. Boeing’s Defense, Space, and Security division reported revenues of US$30.4 billion, down 1.6 percent YoY as deliveries fell to 186 aircraft in 2015 as compared to 216 in 2014. The second largest global A&D company in terms of revenues, Airbus Group, increased revenues 6.2 percent in 2015 to US$71.6 billion. The company delivered 635 aircraft in 2015 including 491 of the A320 family, 27 A380s, and 14 A350 XWBs. The third largest company in terms of revenues, Lockheed Martin, experienced a revenue increase of 1.2 percent YoY to US$46.1 billion, as compared to US$45.6 billion in 2014. Product sales, which constitute 79 percent of the company’s net sales, declined 1.0 percent YoY in 2015 likely due to lower volumes of government satellite programs and air and missile defense system programs. However,
service revenue increased 8.0 percent, primarily likely due to higher sustainment activities, mainly on the F-35 program.
Revenues of the top 20 global A&D companies accounted for nearly 74.8 percent of the global A&D sector revenues in 2015 (compared to 75.6 percent in 2014), reflecting continued sector concentration.
In terms of rank order of revenues, General Dynamics moved up to the fourth position as United Technologies experienced a decline in revenue in 2015 and dropped to the fifth spot, which was largely due to the sale of Sikorsky to Lockheed Martin. Honeywell Aerospace moved down to the fourteenth spot, with Leonardo–Finmeccanica rising up to the eleventh position. Spirit AeroSystems moved out of the top 20 list as it experienced a 2.3 percent revenue decline in 2015 and instead, Precision Castparts made an entry to the top 20 list. These ranking movements reflect the rising fortunes of commercial aerospace subsector companies, including significant revenue increases in the supplier base, which has resulted from commercial aircraft production increases.
In terms of percentage growth as illustrated in Figure 7, Engility’s revenue grew 52.5 percent in 2015 to US$2,085 million. This increase in revenue is mostly likely due to the addition of US$907.0 million of revenue related to the acquisition of TASC in February, 2015. Excluding the acquisition, Engility’s revenue decreased by 13.8 percent.

14
2016 Global aerospace and defense sector financial performance study
Thirty four out of the 100 companies in this study, mostly defense, reported a decline in revenues in 2015, versus 36 that experienced negative growth in revenues in 2014. Decreases were primarily likely due to the impact of cancellations or reductions in contracts, as a result of lower defense budgets. Oshkosh Defense’s revenues decreased US$785 million, or 45.5 percent in 2015 primarily likely due to decline in sales of US$706 million to the US DoD and lower international sales of Mine Resistant Ambush Protected All-Terrain Vehicles.
On a non-constant US$ basis, global A&D sector revenues declined 1.9 percent YoY in 2015, primarily driven by a strong US$ against all the major currencies. In 2015, the EUR: US$ weakened 16 percent; GBP: US$ declined 7 percent; CAD: US$ fell 13 percent; and JPY: US$ was down 13 percent. The strengthening of the US$ over time is likely to stimulate sector growth in non-US$ denominated markets, especially the UK and the Euro-zone.
Note: The actual nominal aerospace and defense (A&D) sector revenues calculations will differ from previous years’ Deloitte Global A&D sector financial performance studies, as the set of companies included in this study is not directly comparable across the years. Also, 2014 and 2015 numbers are based on constant currency basis and 2011 to 2013 have been re-calculated using the growth rates for the respective period with 2014 revenues as the base.
Source: Deloitte Global analysis of the 100 major global aerospace and defense companies using public company filings and press releases. See Methodology section for further information and definitions of financial metric, as well as company name, reports, and dates.
Figure 5 illustrates a five year perspective on revenue growth, showing continued and consistent growth, but with a slowdown in the rate of growth starting in 2012, hitting a low in 2014, with a return to higher growth in 2015.
Figure 5: Five-year history of aerospace and defense sector revenue and growth performance
Revenue growth percentage
Rev
enue
gro
wth
per
cent
age
Rev
enue
(US$
bill
ion)
Global A&D sector revenues
Year
$700.0
$680.0
$660.0
$640.0
$620.0
$600.0
$580.0
$560.0
$540.0
$520.0
7.0%
6.0%
5.0%
4.0%
3.0%
2.0%
1.0%
0.0%
$583.9
2011 2012 2013 2014 2015
$617.8
$637.6$649.7
$674.45.8%
5.8%2.2%
3.2%
1.9%
3.8%

15
2016 Global aerospace and defense sector financial performance study
Source: Deloitte Global analysis of the 100 major global aerospace and defense companies using public company filings and press releases. See Methodology section for further information and definitions of financial metric, as well as company name, reports, and dates. Note that all figures are in US$.
Figure 6: Top 20 aerospace and defense companies by 2015 revenue (US$ million)
Figure 7: Top 20 aerospace and defense companies by 2015 revenue growth
1. The Boeing Company US$96,114
2. Airbus Group US$71,611
3. Lockheed Martin US$46,132
4. General Dynamics US$31,469
5. United Technologies US$27,797
6. BAE Systems US$25,826
7. GE Aviation US$24,660
8. Northrop Grumman US$23,526
9. Raytheon US$23,247
10. Safran US$20,111
11. Leonardo–Finmeccanica US$14,439
12. Thales Group US$13,850
13. Rolls-Royce US$13,797
14. Honeywell Aerospace US$12,276
15. L-3 Communication US$10,466
16. Bombardier Aerospace US$9,891
17. Textron US$9,796
18. Mitsubishi Heavy Industries Aerospace US$8,540
19. Huntington Ingalls Industries US$7,020
20. Precision Castparts Corp. US$6,877
1. Engility 52.5%
2. Orbital ATK 42.8%
3. Constellium 29.1%
4. Babcock International 28.6%
5. Korea Aerospace Industries 25.3%
6. Safran 20.3%
7. United Aircraft Corp. 19.5%
8. JAMCO Corporation 18.5%
9. Zodiac Aerospace 18.1%
10. LISI Aerospace 18.0%
11. Jacobs Engineering Group 15.8%
12. Rheinmetall Defence 15.7%
13. SAAB 15.6%
14. IHI Aero Engine & Space 15.0%
15. Fuji Aerospace 14.8%
16. Transdigm Group Inc. 14.1%
17. Dassault Aviation 13.5%
18. MTU Aero Engines 13.3%
19. Astronics Corp. 13.2%
20. Magellan Aerospace 12.9%

16
2016 Global aerospace and defense sector financial performance study
Figure 8: Top 10 aerospace and defense companies by revenues in 2015 and their movement in rank compared to 2014
Company 2015 Revenues (US$ million)
Rank in 2015
Movement in rank
2014 Revenues (US$ million)
Rank in 2014
The Boeing Company US$96,114 1 US$90,762 1
Airbus Group US$71,611 2 US$67,459 2
Lockheed Martin US$46,132 3 US$45,600 3
General Dynamics US$31,469 4 US$30,852 5
United Technologies* US$27,797 5 US$28,415 4
BAE Systems plc US$25,826 6 US$23,738 6
GE Aviation US$24,660 7 US$23,990 7
Northrop Grumman US$23,526 8 US$23,979 8
Raytheon US$23,247 9 US$22,826 9
Safran US$20,111 10 US$16,716 10
Note: * United Technologies experienced a decline in revenue in 2015 due to the sale of its Sikorsky business to Lockheed Martin.
Source: Deloitte Global analysis of the 100 major global aerospace and defense companies using public company filings and press releases. See Methodology section for further information and definitions of financial metric, as well as company name, reports, and dates. Note that all figures are in US$.
Operating earningsOverall, the global A&D sector’s reported earnings declined 8.4 percent in 2015. However, this was mainly likely due to non-recurring charges. For instance, The Boeing Company reported a dip in operating earnings primarily reflecting a fourth quarter charge of US$885 million related to the 747 program and higher charges of US$410 million (US$835 million in 2015, compared to US$425 million in 2014) related to the USAF KC-46A Tanker program in 2015. Bombardier posted an operating loss of US$5,303 million likely due to one-time program adjustments on the C-Series program. On an adjusted basis, core operating earnings for the sector were down only 0.3 percent YoY, led by the global defense subsector.
Commercial aerospace core earnings declined 3.7 percent, while the defense companies’ core earnings grew 2.9 percent. The decrease in core operating earnings for the commercial aerospace subsector was likely the result of overall increases in costs. In general, profitability is not uniform across the
different segment and supplier tiers, because OEMs and platform companies historically have experienced significantly lower margins than many of their suppliers do. Top performing engine and avionics tier one suppliers historically have earned close to 20 percent operating margins. Conversely, the services segment and tier three suppliers typically lag A&D sector averages in profitability.
About 56 percent of the companies analyzed reported positive YoY growth in core operating earnings. The top 20 companies, in terms of core operating earnings, accounted for US$55.2 billion, or 78.6 percent of the total sector core operating earnings, reflecting the sector concentration in profits.
As illustrated in Figure 10, The Boeing Company is the sector leader in terms of nominal profitability, with core operating earnings of US$7,741 million in 2015, down 12.6 percent YoY. In second place in terms of operating earnings is Lockheed Martin with 2015 core operating earnings
at US$5,538 million. GE Aviation was the third place company with US$5,507 million in core operating earnings in 2015, up 10.7 percent YoY. This strong increase in operating earnings was likely due to higher product volume and prices in its commercial engines and services businesses.
In terms of percent growth, Smiths Detection reported the highest growth rate in operating earnings at 120.0 percent likely a result of cost control measures and operational efficiency savings. The second highest gainer, Digital Globe Inc. grew reported operating earnings by 111.5 percent, as its labor related costs decreased likely due to lower headcount, given the company’s restructuring efforts. On the other hand, United Aircraft Corp. reported the highest decline in operating earnings in 2015 at minus 301.7 percent, primarily likely due to higher cost of sales in 2015.
Core operating earnings for the global A&D sector decreased 4.1 percent, on

17
2016 Global aerospace and defense sector financial performance study
Note: The actual nominal aerospace and defense (A&D) sector operating income calculations will differ from previous years’ Deloitte Global A&D sector financial performance studies, as the set of companies included in this study is not directly comparable across the years. Also, 2014 and 2015 numbers are based on constant currency basis and 2011 to 2013 have been re-calculated using the growth rates for the respective period with 2014 revenues as the base.
Source: Deloitte Global analysis of the 100 major global aerospace and defense companies using public company filings and press releases. See Methodology section for further information and definitions of financial metric, as well as company name, reports, and dates. Note that all figures are in US$.
Figure 9: Five-year history of aerospace and defense sector core earnings and growth performance metrics
Operating profit growth percentage
Ope
ratin
g pr
ofit g
row
th p
erce
ntag
e
Ope
ratin
g pr
ofits
(US$
bill
ion)
Global A&D sector core operating profit
Year
$80.0
$70.0
$60.0
$50.0
$40.0
$30.0
$20.0
$10.0
$0.0
14.0%
12.0%
10.0%
8.0%
6.0%
4.0%
2.0%
0.0%
-2.0%
-4.0%
-6.0%
-8.0%
$58.0
2011 2012 2013 2014 2015
$60.7$68.0
$70.4 $70.212.0%
-5.2%
4.7% 3.5%
-0.3%
a non-constant US$ basis. This was led by the weakening of global currencies against the US$ in 2015. When measured on a non-constant US$ basis, majority of the non-US denominated markets experienced a decline in operating earnings likely due to large exchange rate fluctuations.
Figure 9 illustrates the sector’s nominal and rate of growth in profit performance, showing flat performance in the last two years.

18
2016 Global aerospace and defense sector financial performance study
Figure 10: Top 20 aerospace and defense companies by 2015 core operating earnings (US$ million)
1. The Boeing Company US$7,741
2. Lockheed Martin US$5,538
3. GE Aviation US$5,507
4. Airbus Group US$4,513
5. General Dynamics US$4,178
6. United Technologies US$3,426
7. Northrop Grumman US$3,076
8. Raytheon US$3,013
9. Honeywell Aerospace US$2,594
10. BAE Systems US$2,471
11. Safran US$2,427
12. Rolls-Royce US$1,854
13. Thales Group US$1,420
14. Precision Castparts Corp. US$1,364
15. Leonardo-Finmeccanica US$1,233
16. Rockwell Collins US$1,106
17. Transdigm Group Inc. US$1,020
18. Textron US$929
19. L-3 Communication US$890
20. Spirit AeroSystems US$863
Figure 11: Top 20 aerospace and defense companies by 2015 core operating earnings growth
1. Smiths Detection 120.0%
2. DigitalGlobe Inc 111.5%
3. MacDonald, Dettwiler and Associates 95.8%
4. Korea Aerospace Industries 77.1%
5. Ultra Electronics 76.3%
6. JAMCO Corporation 58.2%
7. Orbital ATK 57.8%
8. Mitsubishi Heavy Industries Aerospace 54.5%
9. IHI Aero Engine & Space 47.8%
10. Babcock International 46.8%
11. Safran 45.6%
12. Kongsberg Defence Systems 35.6%
13. Fuji Aerospace 34.0%
14. Kawasaki Aerospace and Gas Turbine 31.6%
15. Engility 25.6%
16. Magellan Aerospace 25.4%
17. Leonardo-Finmeccanica 23.9%
18. Astronics Corp. 22.2%
19. AviChina Industry & Tech. 21.4%
20. Woodward Aerospace 17.9%
Source: Deloitte Global analysis of the 100 major global aerospace and defense companies using public company filings and press releases. See Methodology section for further information and definitions of financial metric, as well as company name, reports, and dates. Note that all figures are in US$.

19
2016 Global aerospace and defense sector financial performance study
Figure 12: Top 20 aerospace and defense companies by 2015 core operating margin
Figure 13: Top 20 aerospace and defense companies by 2015 core operating margin growth
1. Transdigm Group Inc. 39.7%
2. GE Aviation 22.3%
3. Crane Aerospace & Electronics 21.8%
4. Honeywell Aerospace 21.1%
5. Rockwell Collins 21.1%
6. Solvay Group 19.9%
7. Amphenol 19.8%
8. Precision Castparts Corp. 19.8%
9. Meggitt 19.8%
10. HEICO Corporation 19.3%
11. Kaman Aerospace 18.5%
12. Hexcel Corp. 17.9%
13. Eaton Aerospace 17.4%
14. B/E Aerospace 16.6%
15. Woodward Aerospace 16.2%
16. KLX Inc 16.1%
17. CAE Inc. 15.1%
18. QinetiQ 14.6%
19. Teledyne Tech 14.3%
20. Astronics Corp. 14.3%
1. Smiths Detection 141.2%
2. DigitalGlobe Inc 97.1%
3. MacDonald, Dettwiler and Associates 94.1%
4. Ultra Electronics 65.1%
5. Mitsubishi Heavy Industries Aerospace 51.5%
6. Korea Aerospace Industries 41.3%
7. Kongsberg Defence Systems 39.8%
8. JAMCO Corporation 33.4%
9. IHI Aero Engine & Space 28.5%
10. Leonardo-Finmeccanica 21.7%
11. Kawasaki Aerospace and Gas Turbine 21.6%
12. Safran 21.0%
13. CACI 20.9%
14. Ball Aerospace 19.4%
15. AviChina Industry & Tech. 18.2%
16. Fuji Aerospace 16.8%
17. Eaton Aerospace 15.5%
18. Babcock International 14.1%
19. Honeywell Aerospace 13.1%
20. Huntington Ingalls 13.0%
Operating marginCore operating margin for the global A&D sector declined to 10.4 percent in 2015, as compared to 10.8 percent in 2014. However, reported operating margin for the global A&D sector decreased 11.8 percent to 8.9 percent in 2015, as compared to 10.1 percent in 2014. This was likely due to a significant increase in one time write-offs, which reached US$10.3 billion in 2015, versus US$5.0 billion in 2014. In Figure 12, Transdigm Group retained its position as the top-ranked A&D company in terms of operating margin, as its margins improved marginally from 39.1 percent in 2014 to 39.7 percent in 2015. The company reported improvement
in operating margin likely due to an improvement in both commercial OEM and defense revenues, coupled with gains in operational efficiency. GE Aviation reported the second-highest operating margin of 22.3 percent in 2015, primarily likely driven by higher prices, favorable business mix, and cost efficiency.
In terms of percent gainers and in Figure 13, Smiths Detection reported the most significant improvement in operating margin growth at 141.2 percent, compared to 2014 driven by the company’s cost control measures and operating efficiency. Digital Globe Inc. reported the second highest operating margin increase of 97.1 percent YoY likely due to lower operating costs, primarily labor related expenses.
Out of the 100 companies analyzed, 49 showed an improvement in operating margins in 2015, compared to 2014. Allegheny Technologies’ operating margin fell 731 basis points (bps) in 2015, compared to 2014, which was the largest decline among A&D companies and was likely due to the weak selling prices of its products led by high competition from China.
On a non-constant US$ basis, core operating margins for the global A&D sector experienced a marginal fall, down 2.3 percent to 10.4 percent in 2015, versus 10.6 percent in 2014, mainly led by a 6.1 percent decline in the US A&D core operating margins in 2015.
Source: Deloitte Global analysis of the 100 major global aerospace and defense companies using public company filings and press releases. See Methodology section for further information and definitions of financial metric, as well as company name, reports, and dates.

20
2016 Global aerospace and defense sector financial performance study
Return on invested capitalThe global A&D sector’s reported ROIC was 24.5 percent in 2015, up 290 basis points YoY. In Figure 14, QinetiQ topped the list in terms of ROIC with a 72.0 percent return in 2015. This was likely the result of improved profitability and reduction in shareholder equity in 2015. Also, the company does not appear to have reported any debt obligations.
Figure 14: Top 20 aerospace and defense companies by 2015 return on invested capital
1. QinetiQ 72.0%
2. Airbus Group 36.7%
3. Spirit AeroSystems 33.9%
4. Fuji Aerospace 31.4%
5. BAE Systems 30.9%
6. Lockheed Martin 30.2%
7. General Dynamics 25.0%
8. MTU Aero Engines 24.9%
9. Thales Group 21.9%
10. Northrop Grumman 21.8%
11. Honeywell Aerospace 21.6%
12. Rockwell Collins 20.9%
13. Huntington Ingalls Industries 19.9%
14. Parker Hannifin Aerospace 18.9%
15. Rolls-Royce 18.7%
16. Fluor Corp.'s Government Segment 18.6%
17. GKN Aerospace 17.8%
18. Amphenol 17.6%
19. Astronics Corp. 16.6%
20. Raytheon 16.2%
Figure 15: Top 20 aerospace and defense companies by 2015 return on invested capital growth percentage
1. Leonardo-Finmeccanica 685.7%
2. Rheinmetall Defence 207.7%
3. Orbital ATK 154.1%
4. Spirit AeroSystems 67.8%
5. Safran 60.1%
6. MacDonald, Dettwiler and Associates 59.5%
7. QinetiQ 53.2%
8. B/E Aerospace 50.1%
9. Esterline Technologies 42.2%
10. JAMCO Corporation 39.2%
11. GE Aviation 24.9%
12. Crane Aerospace & Electronics 24.6%
13. Curtiss Wright 23.1%
14. Airbus Group 22.0%
15. General Dynamics 20.8%
16. Thales Group 20.8%
17. Huntington Ingalls Industries 19.9%
18. BAE Systems 16.5%
19. Fuji Aerospace 14.2%
20. Triumph Group 10.1%
Source: Deloitte Global analysis of the 100 major global aerospace and defense companies using public company filings and press releases. See Methodology section for further information and definitions of financial metric, as well as company name, reports, and dates.
Out of the 100 companies analyzed, 12 reported negative ROIC metrics, with Indra Sistemas recording the lowest metric with an ROIC of minus 52.0 percent in 2015, likely due to an operating loss.

21
2016 Global aerospace and defense sector financial performance study
Figure 16: Top 20 aerospace and defense companies by 2015 free cash flow (US$ million)
Figure 17: Top 20 aerospace and defense companies by 2015 free cash flow growth percentage
1. The Boeing Company $6,913
2. Lockheed Martin $4,162
3. Airbus Group $3,139
4. GE Aviation $2,785
5. United Technologies $2,422
6. Raytheon $1,953
7. General Dynamics $1,930
8. Northrop Grumman $1,691
9. Honeywell Aerospace $1,394
10. Thales Group $1,105
11. Safran $1,082
12. Spirit AeroSystems $930
13. L-3 Communication $845
14. Precision Castparts Corp. $821
15. Harris Corporation $706
16. Textron $670
17. Huntington Ingalls Industries $640
18. BAE Systems $603
19. Embraer $521
20. IHI Aero Engine & Space $494
1. Constellium 1037.3%
2. Spirit AeroSystems 557.4%
3. IHI Aero Engine & Space 443.6%
4. MacDonald, Dettwiler and Associates 416.5%
5. Wesco Aircraft 204.9%
6. Elbit Systems 175.2%
7. Embraer 162.3%
8. Thales Group 147.0%
9. Mitsubishi Heavy Industries Aerospace 120.2%
10. Fluor Corp.'s Government Segment 91.6%
11. BBA Aviation 72.7%
12. MTU Aero Engines 69.4%
13. GKN Aerospace 63.6%
14. Eaton Aerospace 57.1%
15. Babcock International 52.0%
16. Airbus Group 41.1%
17. Lockheed Martin 37.8%
18. Meggitt 35.6%
19. Safran 31.6%
20. MOOG 21.6%
Source: Deloitte Global analysis of the 100 major global aerospace and defense companies using public company filings and press releases. See Methodology section for further information and definitions of financial metric, as well as company name, reports, and dates.
Free cash flowGlobal A&D sector FCF increased 5.8 percent to US$40.9 billion in 2015, compared to 2014, driven by both revenue and operational cash flow growth. The top 10 companies in terms of FCF contributed 67.2 percent of the total sector free cash flows in 2015, compared to 65.9 percent in 2014. In Figure 16, the top three companies, The Boeing Company (US$6,913 million), Lockheed Martin (US$4,162 million), and Airbus Group (US$3,139 million) accounted for 34.7 percent of the total free cash flows, reflecting sector concentration.
The Boeing Company’s FCF increased 4.4 percent to US$6,913 million in 2015, recording the highest FCF in 2015. Lockheed Martin reported the second highest FCF of US$4,162 million in 2015, up 37.8 percent, driven by a strong operational performance. In third place, Airbus Group reported a 41.1 percent increase in FCF YoY, positively impacted by changes in working capital.
Of the 100 companies analyzed, 16 reported negative FCF with Bombardier Aerospace’s FCF at minus US$1.0 billion
in 2015, compared to minus US$0.6 billion in 2014, as the company reported a significant loss likely due to the impairment charges on its C-Series program.

22
2016 Global aerospace and defense sector financial performance study
Source: Deloitte Global analysis of the 100 major global aerospace and defense companies using public company filings and press releases. See Methodology section for further information and definitions of financial metric, as well as company name, reports, and dates.
Free cash marginIn 2015, the global A&D sector FCM was up to 6.1 percent from 6.0 percent in 2014. This was largely because global A&D sector FCF increased 5.8 percent in 2015, compared to 2014, whereas, global A&D revenue experienced a growth of 3.8 percent in the same year, leading to an improvement in FCM. Of the 100 companies analyzed, 42 reported FCM of more than 5.0 percent, while 14 companies reported FCM of 10.0 percent or more in 2015.
In Figure 18, DigitalGlobe Inc. topped the 2015 list with a 22.8 percent FCM as its FCF improved from minus US$4
million in 2014 to a positive cash flow of US$160 million in 2015. In second place was Transdigm Group whose FCM stood at 18.1 percent in 2015, although it was down from 22.5 percent in 2014. MOOG reported the third highest FCM metric of 15.7 percent, a 23.6 percent increase from 12.7 percent FCM in 2014, likely due to higher cash inflow from operational activities.
Overall, 16 of the 100 companies analyzed reported negative FCM in 2015. Some of these companies, however, made more
significant investments in property, plant and equipment (PP&E) and/or intangible assets resulting in negative FCF during 2015 as such investments likely negatively affected the FCFs for these companies. A few companies reported negative operating cash flows leading to negative FCM.
Figure 18: Top 20 aerospace and defense companies by 2015 free cash margin performance
1. DigitalGlobe Inc 22.8%
2. Transdigm Group Inc. 18.1%
3. MOOG 15.7%
4. HEICO Corporation 15.5%
5. Amphenol 15.4%
6. Meggitt 14.4%
7. Spirit AeroSystems 14.0%
8. Harris Corporation 13.9%
9. QinetiQ 12.8%
10. IHI Aero Engine & Space 12.0%
11. Precision Castparts Corp. 11.9%
12. Leidos Holdings, Inc. 11.6%
13. Honeywell Aerospace 11.4%
14. GE Aviation 11.3%
15. Elbit Systems 9.4%
16. CACI 9.3%
17. Rockwell Collins 9.2%
18. Triumph Group 9.2%
19. Huntington Ingalls Industries 9.1%
20. Lockheed Martin 9.0%
Figure 19: Top 20 aerospace and defense companies by 2015 free cash margin growth percentage
1. Constellium 781.1%
2. Spirit AeroSystems 572.8%
3. MacDonald, Dettwiler and Associates 412.1%
4. IHI Aero Engine & Space 372.6%
5. Embraer 178.3%
6. Wesco Aircraft 176.0%
7. Elbit Systems 161.9%
8. Fluor Corp.'s Government Segment 127.8%
9. Thales Group 127.7%
10. Mitsubishi Heavy Industries Aerospace 115.9%
11. BBA Aviation 85.6%
12. Eaton Aerospace 61.7%
13. GKN Aerospace 52.5%
14. MTU Aero Engines 49.5%
15. Lockheed Martin 36.2%
16. Airbus Group 32.9%
17. CACI 30.5%
18. Meggitt 25.9%
19. MOOG 23.6%
20. Amphenol 21.6%

23
2016 Global aerospace and defense sector financial performance study
Figure 20: Top 20 aerospace and defense companies by 2015 book-to-bill performance
Figure 21: Top 20 aerospace and defense companies by 2015 book-to-bill growth percentage
1. Airbus Group 3.30
2. Babcock International 2.99
3. SAAB 2.98
4. Dassault Aviation 2.43
5. Harris Corporation 1.98
6. GE Aviation 1.69
7. Oshkosh Defense 1.67
8. Leidos Holdings, Inc. 1.60
9. CACI 1.58
10. GenCorp/Aerojet Rocketdyne Holdings 1.54
11. ManTech Int'l Corp. 1.48
12. Lockheed Martin 1.41
13. Rolls-Royce 1.40
14. Thales Group 1.30
15. Jacobs Engineering Group 1.30
16. MTU Aero Engines 1.30
17. Kawasaki Aerospace and Gas Turbine 1.28
18. Embraer 1.26
19. Safran 1.24
20. SAIC 1.24
1. Oshkosh Defense 334.9%
2. Babcock International 256.4%
3. SAAB 194.3%
4. Leidos Holdings, Inc. 159.3%
5. ManTech Int'l Corp. 155.0%
6. Chemring 140.8%
7. Leonardo-Finmeccanica 129.2%
8. Dassault Aviation 97.7%
9. Harris Corporation 83.7%
10. QinetiQ 68.9%
11. CACI 57.7%
12. Lockheed Martin 48.2%
13. DigitalGlobe Inc 44.2%
14. Kaman Aerospace 42.6%
15. SAIC 41.2%
16. Ultra Electronics 33.7%
17. Jacobs Engineering Group 31.6%
18. Esterline Technologies 22.9%
19. GE Aviation 22.5%
20. AAR Corp. 14.9%
Source: Deloitte Global analysis of the 100 major global aerospace and defense companies using public company filings and press releases. See Methodology section for further information and definitions of financial metric, as well as company name, reports, and dates.
Book-to-bill ratioThe global A&D sector’s BTB ratio is a key indicator of future revenues, determined by comparing sales order bookings to company revenues. In 2015, the sector BTB ratio declined 13.4 percent to 1.24 times in 2015 from 1.43 times in 2014. The decrease in BTB was likely due to lower backlogs at Bombardier, General Dynamics, and BAE Systems, partially offset by Airbus Group, whose BTB ratio stood at 3.30 times, the highest in the sector, as seen in Figure 20. The sector backlog increased 8.9 percent in 2015 to US$2.71 trillion led by increased demand for commercial aircraft, where order backlogs are at an all-time high. Growth in topline revenues, coupled with a BTB ratio of 1.24 times in 2015, signal the potential for global A&D sector revenues to expand, with growth in the commercial
aerospace subsector and recovery in defense sales orders.
Figure 20 illustrates that Airbus Group had the highest BTB ratio at 3.30 times as indicated above, however, it was down 15.6 percent YoY in 2015. Its backlog increased to US$1.12 trillion in 2015, compared to US$952.8 billion in 2014. The increase in backlog is likely due to higher commercial aircraft orders. Babcock International reported a BTB ratio of 2.99 times in 2015, the second highest performance in this study, with a backlog of US$22.0 billion in 2015, compared to US$13.5 billion in 2014. The increased backlog is likely driven by major contract wins, including contracts for military vehicle support and the maritime support delivery framework, as well as by the acquisition of helicopter firm Avincis. In the third place, SAAB reported a BTB ratio
of 2.98 times in 2015, with its backlog increasing 89.3 percent YoY to US$13.5 billion in 2015, from US$7.1 billion in 2014. The increase in backlog at SAAB was likely driven by Gripen fighters sales to Brazil and the sale of a new-generation airborne early warning (AEW) systems to the UAE.
Out of the 100 companies in this study, 50 companies reported a BTB ratio of 1.0 times or more with a mix of companies in the commercial A&D subsector reflecting growth in commercial aerospace and recovery in defense. Lockheed Martin reported an increase in backlog to US$99.6 billion in 2015 from US$80.5 billion in 2014, up 23.7 percent YoY, primarily due to the Sikorsky acquisition, which contributed US$15.6 billion to the total backlog in 2015.

24
2016 Global aerospace and defense sector financial performance study
Source: Deloitte Global analysis of the 100 major global aerospace and defense companies using public company filings and press releases. See Methodology section for further information and definitions of financial metric, as well as company name, reports, and dates.
Interest coverage ratioThe interest coverage ratio indicates a company’s ability to pay its interest payments on debt from its available earnings. Globally, this increased 15.3 percent YoY in 2015 to 16.4 times, compared to 14.2 times in 2014. This is likely due to an improvement in global A&D sector’s operating performance.
In Figure 22, Fuji Aerospace topped the list with a 145.7 times interest coverage ratio likely due to negligible interest payments, coupled with a healthy operational performance. MTU Aero Engines and Safran placed second and third, with an interest coverage ratio of 110.2 times and 74.2 times, respectively.
Out of the 100 companies analyzed, 18 percent reported an interest coverage ratio below 1.0 times, indicating their inability to meet interest payments from their operating earnings. However, the percentage of companies reporting an interest coverage ratio of below 1.0 times remained unchanged when compared to 2014.
Figure 22: Top 20 aerospace and defense companies by 2015 interest coverage ratio
1. Fuji Aerospace 145.7
2. MTU Aero Engines 110.2
3. Safran 74.2
4. Thales Group 62.2
5. IHI Aero Engine & Space 58.4
6. HEICO Corporation 49.6
7. General Dynamics 42.6
8. The Boeing Company 27.1
9. JAMCO Corporation 26.4
10. Hexcel Corp. 23.7
11. Mitsubishi Heavy Industries Aerospace 23.2
12. Jacobs Engineering Group 22.8
13. Honeywell Aerospace 21.7
14. Astronics Corp. 20.8
15. QinetiQ 20.3
16. Dassault Aviation 20.2
17. Magellan Aerospace 20.0
18. LISI Aerospace 19.7
19. Rockwell Collins 18.1
20. Kawasaki Aerospace and Gas Turbine 17.2

25
2016 Global aerospace and defense sector financial performance study
Source: Deloitte Global analysis of the 100 major global aerospace and defense companies using public company filings and press releases. See Methodology section for further information and definitions of financial metric, as well as company name, reports, and dates.
Figure 23: Top 20 aerospace and defense companies by 2015 current ratio
1. KLX Inc 7.7
2. Wesco Aircraft 5.4
3. Precision Castparts Corp. 3.9
4. Amphenol 3.8
5. AAR Corp. 3.7
6. Ducommun 3.2
7. HEICO Corporation 3.0
8. BBA Aviation 3.0
9. Kaman Aerospace 2.9
10. Woodward Aerospace 2.8
11. Transdigm Group Inc. 2.8
12. Allegheny Technologies 2.7
13. Esterline Technologies 2.7
14. MOOG 2.7
15. Latecoere 2.5
16. Curtiss Wright 2.5
17. Astronics Corp. 2.4
18. Parker Hannifin Aerospace 2.4
19. Orbital ATK 2.3
20. Triumph Group 2.3
Current ratioThis ratio is a measure of the short-term liquidity position. The ratio for the sector fell 1.1 percent YoY to 1.38 times in 2015, versus 1.40 times in 2014. This current ratio is more than 1.0 times, and indicates the sector has a moderately heathy short-term liquidity position. KLX Inc, Wesco Aircraft, and Precision Castparts Corp. were the top three companies with the highest current ratio – 7.7 times, 5.4 times, and 3.9 times, respectively.
Out of the 100 companies in the study, only 6.0 percent reported a current ratio of below 1.0 times, being at a risk of meeting short-term financial commitments. The remainder of the companies in this study exhibited a relatively strong liquidity position, with a majority of them recording a current ratio above 1.0 times.

26
2016 Global aerospace and defense sector financial performance study
Source: Deloitte Global analysis of the 100 major global aerospace and defense companies using public company filings and press releases. See Methodology section for further information and definitions of financial metric, as well as company name, reports, and date
Debt equity ratioThe debt equity ratio for the sector deteriorated to 1.26 times in 2015, as compared to 0.92 times in 2014. Lockheed Martin, which had the highest debt equity ratio of 4.93 times, experienced an increase in debt from US$6.1 billion in 2014 to US$15.3 billion in 2015, as a result of debt incurred to fund the acquisition of Sikorsky and the issuance of new debt for general corporate purposes. Ball Aerospace’s long-term debt increased to US$5.1 billion in 2015 from US$3.0 billion in 2014 most likely in order to finance the company’s acquisition plans.
Elbit Systems, Jacobs Engineering, and Kongsberg Defence Systems were the top performers with relatively lower debt levels and recorded ratios of 0.12 times, 0.14 times, and 0.14 times in 2015.
Out of the 100 companies, 24 percent reported debt equity ratio of more than 1.0 times, indicating relatively high debt on their balance sheets.
Figure 24: Top 20 aerospace and defense companies by 2015 debt-equity ratio
1. Elbit Systems 0.12
2. Jacobs Engineering Group 0.14
3. Kongsberg Defence Systems 0.14
4. Singapore Technologies (ST) Engineering Ltd. 0.14
5. Thales Group 0.17
6. AAR Corp. 0.18
7. Fuji Aerospace 0.21
8. BBA Aviation 0.24
9. SAAB 0.24
10. Cubic Corp. 0.25
11. AviChina Industry & Tech. 0.30
12. Dassault Aviation 0.31
13. General Dynamics 0.32
14. Fluor Corp.'s Government Segment 0.32
15. LISI Aerospace 0.36
16. Latecoere 0.40
17. HEICO Corporation 0.41
18. Zodiac Aerospace 0.43
19. MTU Aero Engines 0.43
20. FACC AG 0.43

27
2016 Global aerospace and defense sector financial performance study
Source: Deloitte Global analysis of the 100 major global aerospace and defense companies using public company filings and press releases. See Methodology section for further information and definitions of financial metric, as well as company name, reports, and dates.
Figure 25: Top 20 aerospace and defense companies by 2015 employee additions
1. Lockheed Martin 14,000
2. Harris Corporation 8,300
3. Babcock International 3,553
4. Honeywell Aerospace 3,428
5. Engility 3,200
6. AviChina Industry & Tech. 3,049
7. Singapore Technologies (ST) Engineering Ltd. 2,742
8. Zodiac Aerospace 2,680
9. SAIC 2,000
10. Cobham 1,717
11. Precision Castparts Corp. 1,537
12. Triumph Group 1,325
13. Jacobs Engineering Group 1,272
14. Meggitt 1,143
15. Safran 1,142
16. GE Aviation 1,000
17. HEICO Corporation 994
18. GKN Aerospace 932
19. Transdigm Group Inc. 855
20. Embraer 749
Aerospace and defense sector employmentTotal global A&D sector employment increased 0.4 percent to 2.05 percent in 2015, compared to 2.04 percent in 2014. The number of companies increasing their headcount in 2015 were up, as compared to 2014, with 55 percent of the companies reporting an addition in the number of employees, compared to 44.0 percent in 2014. The increase in employment was driven by higher work volume. Regionally, employment at the US A&D companies increased slightly by 0.8 percent in 2015, from 1.18 million employees in 2014 to 1.19 million employees in 2015. On the other hand, the European A&D companies reported a 0.8 percent drop in employment in 2015, from 615 thousand employees in 2014, to 610 thousand employees in 2015.
With 48.3 percent of the total global A&D sector employees, the OEM segment is the single largest segment in the global A&D sector in terms of employment. However, employment at this segment declined a slight 0.8 percent YoY. The aerostructures, propulsion, tier one, and tier two segments, which together employ 27.7 percent of the total global workforce, added 6,206 more employees in 2015, mostly likely due to increased workload in delivery of commercial aircraft.
In 2015, Lockheed Martin reported an increase of 14,000 employees, or 12.5 percent, as seen in Figure 25. Harris Corp. reported a 59.3 percent increase in employment, adding 8,300 employees, which is the second highest increase in terms of net employee additions. UK-based Babcock International reported an increase of 3,553 employees
which translated into a double-digit employment growth of 16.4 percent in 2015. The increase in employees in these companies was mainly led by acquisitions. For instance, Lockheed Martin added about 15,000 employees from the acquisition of Sikorsky Aircraft Corp., while Harris Corp. added 10,000 employees from the Exelis acquisition.
Owing to low sales growth in the defense subsector, compared to commercial aerospace, many companies continued to reduce personnel. For US companies, this includes L-3 Communication, which reduced its workforce by 7,000 employees and United Technologies, which reduced 6,720 employees. For European companies, Leonardo–Finmeccanica and Serco Defence reduced their workforce by 7,224 and 3,408 employees, respectively.
Figure 26: Top 20 aerospace and defense companies by 2015 employee additions growth
1. Harris Corporation 59.3%
2. Engility 48.5%
3. HEICO Corporation 34.6%
4. Astronics Corp. 24.3%
5. JAMCO Corporation 19.3%
6. Singapore Technologies (ST) Engineering Ltd. 18.7%
7. Solvay Group 18.0%
8. Babcock International 16.4%
9. Cobham 15.7%
10. SAIC 15.4%
11. Constellium 13.5%
12. Jacobs Engineering Group 13.2%
13. Meggitt 12.9%
14. Allegheny Technologies 12.7%
15. Lockheed Martin 12.5%
16. Transdigm Group Inc. 12.3%
17. Korea Aerospace Industries 12.3%
18. Triumph Group 9.6%
19. Honeywell Aerospace 9.1%
20. Zodiac Aerospace 9.0%

28
2016 Global aerospace and defense sector financial performance study
Note: Companies analyzed on the basis of partial results based on aerospace and defense (A&D) activity have an advantage over others as they do not have corporate overheads
Source: Deloitte Global analysis of the 100 major global aerospace and defense companies using public company filings and press releases. See Methodology section for further information and definitions of financial metric, as well as company name, reports, and dates. Note that all figures are in US$.
Figure 27: Top 20 aerospace and defense companies by 2015 core operating profits per employee (US$)
1. Transdigm Group Inc. $130,976
2. GE Aviation $122,378
3. KLX Inc $111,368
4. Fuji Aerospace $104,901
5. IHI Aero Engine & Space $79,353
6. Solvay Group $75,851
7. Korea Aerospace Industries $72,014
8. Honeywell Aerospace $63,190
9. Rolls-Royce $62,630
10. Kaman Aerospace $62,264
11. Precision Castparts Corp. $60,347
12. DigitalGlobe Inc $58,705
13. Crane Aerospace & Electronics $57,650
14. Spirit AeroSystems $56,776
15. Rockwell Collins $56,718
16. Hexcel Corp. $56,331
17. Ball Aerospace $53,580
18. MTU Aero Engines $51,409
19. HEICO Corporation $49,925
20. Raytheon $49,393
Employee productivityEmployee productivity at the sector level, defined as core operating earnings per employee, decreased marginally by 0.7 percent to US$34,276 operating earnings per employee in 2015. The propulsion segment generated the highest operating earnings per employee at US$67,243 in 2015, compared to US$58,368 in 2014, for a 15.2 percent growth. The aerostructures segment’s operating earnings per employee grew 14.0 percent from US$33,704 in 2014 to US$38,340 in 2015. However, the operating earnings per employee in tier one and tier three segments decreased 18.2 percent and 28.3 percent YoY, respectively, in 2015.
Of the top 20 companies in employee productivity, only four companies including GE Aviation, Honeywell Aerospace, Rolls-Royce, and Raytheon generated revenue greater than US$10.0 billion. Twelve of the top 20 performers in this category are companies with revenue of less than US$5.0 billion.
Figure 27 shows Transdigm Group Inc., GE Aviation, and KLX Inc. ,as the top three companies in terms of employee productivity in the global A&D sector. Transdigm Group Inc. reported operating earnings per employee at US$130,976 in 2015, up 3.1 percent YoY. The company’s operating earnings increased 15.8
percent in 2015, while its number of employees increased only 12.3 percent. GE Aviation’s operating earnings per employee was US$122,378 in 2015, up 8.3 percent YoY, as its operating earnings grew 10.7 percent in 2015, while the employee base grew only 2.3 percent. KLX Inc.’s operating earnings per employee was US$111,368 in 2015, up 16.0 percent, compared to 2014. Its operating earnings grew by 10.2 percent, whereas employee headcount decreased 5.0 percent in 2015.
Figure 28: Top 20 aerospace and defense companies by 2015 core operating earnings per employee growth percentage
1. DigitalGlobe Inc 138.2%
2. Smiths Detection 130.2%
3. MacDonald, Dettwiler and Associates 95.8%
4. IHI Aero Engine & Space 94.3%
5. Ultra Electronics 66.0%
6. Orbital ATK 57.8%
7. Korea Aerospace Industries 57.8%
8. Mitsubishi Heavy Industries Aerospace 48.2%
9. Safran 43.2%
10. Leonardo-Finmeccanica 42.9%
11. QinetiQ 38.0%
12. Fuji Aerospace 33.6%
13. JAMCO Corporation 32.6%
14. Kongsberg Defence Systems 31.2%
15. Kawasaki Aerospace and Gas Turbine 29.3%
16. Babcock International 26.1%
17. Magellan Aerospace 25.4%
18. Huntington Ingalls Industries 20.4%
19. Curtiss Wright 18.0%
20. KLX Inc 16.0%

29
2016 Global aerospace and defense sector financial performance study
Source: Deloitte Global analysis of data from Bloomberg L.P., accessed in June 2016. Figure includes historical prices of the respective indices over the identified periods.
Source: Deloitte Global analysis of data from Bloomberg L.P., accessed in June 2016. Figure includes historical prices of the respective indices over the identified periods.
Figure 29: US equity market comparisons to US aerospace and defense sector performance (2010 to 2015)
Figure 30: European equity market comparisons to European aerospace and defense sector performance (2010 to 2015)
Equity marketsThe US A&D sector’s share price performance was the weakest in last five years, however, it outperformed the S&P 500 Index, which was down 0.7 percent, as compared to Dow Jones aerospace and defense Index, which recorded a growth of 2.8 percent (see Figure 29). The European A&D companies saw a strong performance, with a 14.3 percent growth in 2015, outperforming the STOXX 600 Index, which grew 7.2 percent (see Figure 30). However, the US defense companies continued to see downward pressure from the effects of US Government budget reductions in 2015, coupled with an operating environment characterized by both increasing complexity in global security and continuing economic pressures in the US and globally.
2015 2014 2013 2012 2011 2010
Dow Jones aerospace and defense Index 2.8% 10.0% 54.1% 11.2% 3.2% 10.6%
Standard & Poor 500 Index (0.7%) 11.4% 29.6% 13.4% 0.0% 12.8%
Basis point difference 350 (140) 2,450 (216) 322 (221)
2015 2014 2013 2012 2011 2010
STOXX Europe total market Index aerospace and defense 14.3% (8.5%) 41.6% 22.8% 0.8% 15.2%
STOXX Europe 600 7.2% 5.1% 17.4% 14.4% (11.3%) 8.6%
Basis point difference 710 (1,360) 2,420 843 1,213 656
Of the companies in this study, United Aircraft Corp. (152.6 percent), Korea Aerospace Industries (96.2 percent), and Leonardo–Finmeccanica (73.6 percent) increased share prices the most in 2015. However, superior increases in share prices did not necessarily correlate to financial performance. For example, United Aircraft Corp.’s revenue increased only 19.5 percent, while its share price grew 152.6 percent. Similarly, Leonardo–Finmeccanica’s revenue increased only 1.8 percent but its share price grew 73.6 percent in 2015.

30
2016 Global aerospace and defense sector financial performance study
US compared with European aerospace and defense companiesUS-based companies comprise a majority of the revenues for the global A&D sector. European headquartered companies represent about a third of total global revenues, while companies domiciled in Japan, Canada, Brazil, China, and other countries share the balance. Although this geographic makeup has been relatively constant for the past few years, over the longer term US dominance has declined, as the growth of non-US-based A&D companies continues.
The following analysis of US companies, compared to the European company’s uses the constant conversion approach to eliminate the effect of foreign currency fluctuations from year to year.
RevenueIn 2015 (see Figure 31), A&D companies headquartered in the US contributed 62.9 percent of the global A&D sector revenues, or US$424.1 billion to the global A&D sector’s revenue of US$674.4 billion. European companies accounted for 30.2 percent, or US$203.9 billion of the global A&D sector revenue. Other companies domiciled in Japan, Canada, Brazil, China, and other countries account for the remaining share of the sector revenue, approximately 7.0 percent. US companies’ 2015 revenue grew marginally by 1.4 percent, while European companies’ experienced strong revenue growth of 8.2 percent. The commercial aerospace subsector drove the growth in the US, whereas, in Europe, both commercial aerospace and defense subsectors experienced strong growth.
The Boeing Company continued to be the leading US-based A&D company with revenues of US$96.1 billion in 2015, up 5.9 percent YoY. Lockheed Martin, the second largest US A&D company, reported revenues of US$46.1 billion and YoY growth of 1.2 percent. The company experienced lower volumes of government satellite programs and air and missile defense system programs, however, this was partially offset by higher sustainment activities on F-35. General Dynamics’ revenues reached US$31.5 billion, up 2.0 percent YoY, as the company experienced an increase in ship construction and engineering activity, coupled with higher deliveries of G650 business jet aircraft.
Approximately 47 percent of US-based A&D companies reported a decline in revenues in 2015 with a majority likely experiencing the impact of subdued growth in defense spending contracts, mainly likely due to dependence on US government contracts. Oshkosh Defense’s revenues recorded the highest decline in revenues, which fell 45.5 percent in 2015, likely due to a decline in sales to the DoD and decrease in international sales of MRAP All-Terrain Vehicles (MATVs).
European A&D companies reported strong growth of 8.2 percent in revenues, as indicated earlier, with total revenues of US$203.9 billion in 2015. Airbus Group reported revenues of US$71.6 billion in
2015 driven by increased deliveries in Airbus Group’s commercial business. BAE Systems reported strong revenue growth of 8.8 percent with revenues at US$25.8 billion in 2015. This was primarily led by higher military aircraft deliveries to Saudi Arabia, and revenue from equipment trading on the European Typhoon program. In 2015, only 18.5 percent of the European A&D companies reported a decline in revenues, whereas, a majority of them experienced healthy growth in top line revenue.
However, with FX effect, European A&D companies measured on the basis of non-constant currency (US$) reported a 6.6 percent decline in revenues, as the EUR: US$ and GBP: US$ weakened 16.4 percent and 6.6 percent, respectively in 2015. The strengthening of the US$ is expected to support sector growth in the UK and the Euro-zone.
Core operating earnings/operating marginCore operating margin differences between the US and Europe continued to remain. The US experienced an operating margin of 11.6 percent in 2015 and 12.4 percent in 2014, as compared to Europe’s operating margin of 8.5 percent in 2015 and 8.3 percent in 2014. Europe’s largest A&D company, Airbus Group, reported core operating margins of 6.3 percent in 2015, while The Boeing Company recorded margins of 8.1 percent in 2015. This significant

31
2016 Global aerospace and defense sector financial performance study
difference between the US and Europe regarding the gap in profit margin performance has existed for many years. It brings into focus the efficiency of the cost and asset base and the comparative ability of the European A&D sector to rationalize assets and reduce operating expenses. However, core operating earnings for the US companies declined 4.7 percent in 2015, while the European companies reported an 11.1 percent increase in operating earnings. Continued improvements in financial performance by the European A&D companies, with slower improvements in the US, will likely continue to close the gap in operating margin performance.
Lockheed Martin’s operating margin stood at 12.0 percent, versus 12.5 percent in 2014, mainly due to a 3.0 percent decline in core operating earnings YoY. Transdigm Group, Woodward Aerospace, and GE Aviation reported the highest operating margins amongst the US companies, while Meggitt, QinetiQ, and Rolls-Royce had the highest operating margins amongst the European companies.
However, it should be noted that on a non-constant currency basis (US$), the European A&D sector experienced only a 3.5 percent improvement in core operating margins in 2015, from 8.2 percent in 2014 to 8.5 percent.
Return on invested capitalROIC for the US-headquartered companies increased 16.3 percent to 27.0 percent in 2015, as compared to 23.2 percent in 2014. Spirit AeroSystems’ ROIC stood at 33.9 percent in 2015 and Lockheed Martin reported a ROIC of 30.2 percent in 2015. Eight companies out of the 57 US companies in the study reported negative returns, with KLX Inc’s ROIC at minus 22.8 percent, Ducommun at minus 16.3 percent, and Wesco Aircraft at minus 15.7 percent.
The European companies reported a 24.0 percent ROIC in 2015, versus 21.3 percent in 2014, up 12.5 percent YoY, not a big gap compared to US performance. QinetiQ, Airbus Group, and BAE Systems represent
the top three ROIC performers at 71.6 percent, 36.7 percent, and 30.9 percent respectively. Three European companies experienced negative ROIC, namely, Indra Sistemas, Serco Defence*, and FACC AG, reporting minus 52.0 percent, minus 0.4 percent, and minus 4.5 percent ROIC, respectively.
Free cash flow/free cash marginUS A&D companies’ free cash flow increased 4.3 percent to US$32.7 billion, versus US$31.3 billion in 2014, led by a strong operational performance. Free cash flow margin stood at 7.7 percent in 2015. For the European companies, free cash flow was up 13.3 percent YoY to US$8.1 billion, with a margin of 3.9 percent, a significant negative gap compared to the US.
Among the US companies, DigitalGlobe Inc., Transdigm Group, and MOOG were the top performers with 22.8 percent, 18.1 percent, and 15.7 percent FCM respectively in 2015. In Europe, Meggit, QinetiQ, and Senior Aerospace were the top three European A&D companies with FCM of 14.4 percent, 12.8 percent, and 9.0 percent respectively.
Book-to-bill ratioThe European A&D companies’ BTB ratio decreased 9.4 percent to 1.84 times in 2015, compared to 2.03 times in 2014, with Airbus Group reporting the highest BTB ratio of 3.30 times, as indicated earlier. However, excluding Airbus Group, the European A&D sector’s BTB ratio stood at 1.05 times in 2015 and 0.95 times in 2014, reflecting the large impact of Airbus Group on the European A&D sector.
The US companies’ recorded a BTB ratio of 1.02 times in 2015, compared to 1.24 times in 2014. Harris Corp, GE Aviation, and Oshkosh Defense were the top performers with a BTB ratio of 1.98 times, 1.69 times, and 1.67 times respectively. The increase in the BTB ratio at Harris Corp. was primarily driven by the acquisition of Exelis. GE Aviation reported a strong BTB ratio, as it experienced an increase in services related backlog.
Interest coverage ratioThe global A&D sector’s interest coverage ratio was up 15.3 percent to 16.4 times in 2015, versus 14.2 times in 2014, as overall profitability levels improved. Although the interest coverage ratio for US companies remained strong at 15.2 times, it was down 3.1 percent YoY. Amongst US companies, Heico Corp and General Dynamics reported the highest interest coverage ratio.
On the other hand, the interest coverage ratio for Europe’s A&D sector experienced a very strong improvement of 64.8 percent YoY to 18.6 times in 2015 led by strong operational performance. MTU Aero Engines, Safran, and Thales Group were the top performers with interest coverage ratios of 110.2 times, 74.2 times, and 62.2 times respectively. Thus the European industry outpaced their US counterparts, 15.2 times to 18.6 times.
Current ratioThe US A&D companies’ current ratio was 1.54 times in 2015, a slight decrease of 1.6 percent from 1.57 times in 2014. KLX Inc, Wesco Aircraft, and Precision Castparts Corp. were the top US A&D players with the highest current ratio of 7.7 times, 5.4 times and 3.9 times respectively.
For the European A&D sector, the overall current ratio was significantly lower, as compared to the US A&D companies. However, it improved slightly by 1.8 percent YoY to 1.05 times in 2015. Latecoere, Smiths Detection, and FACC AG were the top three European A&D companies with current ratio of 2.5 times, 2.1 times, and 2.0 times, respectively.
Debt equity ratioOverall debt levels for the global A&D companies witnessed an increase in 2015, leading to deterioration in the sector’s debt equity ratio to 1.26 times, compared to 0.92 times in 2014. US A&D companies’ leverage ratio experienced a 57.9 percent YoY increase, deteriorating to 1.42 times whereas, for the European A&D sector, the ratio slightly weakened to 1.05 times in 2015. This was mainly
Note: *Serco reported a positive return on invested capital (ROIC) for 2015, which is based on its core operating profit. However, since our calculations use the reported operating profit, ROIC for 2015 is negative. The company reported an operating loss in 2015 due to exceptional items of £109.9 million (US$169 million), as a result of goodwill impairment and restructuring costs.

32
2016 Global aerospace and defense sector financial performance study
driven by increased leverage levels for US A&D companies, in order to finance acquisitions, as well as to fund expansion plans.
Employment and productivityGlobal A&D sector employment increased very slightly by 0.4 percent to 2.05 million in 2015, with employee productivity down 0.7 percent to US$34,276, as it stabilizes after experiencing improvement in the past. Operating earnings per employee in the European A&D sector increased 12.0 percent YoY, as its workforce was down 0.8 percent,
with operating earnings experiencing an 11.1 percent improvement YoY. For the US A&D sector, employee productivity declined marginally by 5.4 percent YoY to US$41,218, as operating earnings decreased 4.7 percent, while the workforce increased headcount by 0.7 percent to 1.19 million workers.
Figure 31 summarizes the financial performance of the US, compared to European A&D companies.
US Europe
2015 2014 Change (2015 versus
2014)
2015 2014 Change (2015 versus
2014)
Revenues (US$ billion) $424.1 $418.3 1.4% $203.9 $188.5 8.2%
Core operating earnings (US$ billion) $549.2 $51.7 (4.7%) $17.4 $15.7 11.1%
Core operating margin percentage 11.6% 12.4% (6.1%) 8.5% 8.3% 2.7%
Return on invested capital percentage 27.0% 23.2% 16.3% 24.0% 21.3% 12.5%
Free cash flow (US$ billion) $32.7 $31.4 4.3% $8.1 $7.1 13.3%
Free cash flow margin percentage 7.7% 7.5% 2.9% 3.9% 3.8% 4.8%
Book-to-bill ratio 1.02x 1.24x (18.3%) 1.84x 2.03x -9.4%
Interest coverage ratio 15.2x 15.6x (3.1%) 18.6x 11.3x 64.8%
Current ratio 1.5x 1.6 x (1.6%) 1.05 x 1.03 x 1.8%
Debt equity ratio 1.42x 0.9 x 57.9% 1.05 x 1.00 x 4.3%
Aerospace and defense (A&D) revenue/ employee (US$)
$355,058 $352,686 0.7% $334,433 $306,631 9.1%
A&D core operating earnings/ employee (US$) $41,218 $43,583 (5.4%) $28,521 $25,457 12.0%
Number of A&D employees 1,194,537 1,185,956 0.7% 609,826 614,882 (0.8%)
Source: Deloitte Global analysis of the 100 major global aerospace and defense companies using public company filings and press releases. See Methodology section for further information and definitions of financial metric, as well as company name, reports, and dates. Note that all figures are in US$.
Figure 31: US aerospace and defense (A&D) sector compared to European A&D sector (2014 to 2015)

33
2016 Global aerospace and defense sector financial performance study
34
2016 Global aerospace and defense sector financial performance study
The US defense subsector revenues marginally declined to US$229.9 billion in 2015 from US$231.9 billion in 2014 with the top 20 US defense companies reporting flat revenues in 2015 to US$206.4 billion. Of note, there is heavy sector concentration in the US, as the top 20 US companies accounted for 89 percent share of the total US defense subsector revenues, with the other companies accounting for the remaining 11 percent. However, European defense companies reported a strong YoY increase of 6.8 percent in revenues to US$96.9 billion in 2015 with 13 out of the top 20 defense companies reporting higher revenues in 2015. Figure 32 shows US defense subsector revenues from 2011 through 2015, illustrating its long-term decline. However, it should be noted that when measured on a non-constant US$ basis, European defense subsector declined 6.6 percent YoY in 2015, as the EUR and GBP weakened against the US$ in 2015.
Overall defense subsector core operating earnings increased 2.9 percent YoY in 2015 to US$37.4 billion from US$36.3 billion. The US defense subsector’s core earnings declined 4.1 percent YoY to US$26.9 billion, versus US$28.1 billion in 2014. Of note, the top 20 US A&D companies accounted for 93.0 percent of the subsector operating earnings, reflecting heavy sector concentration. Europe’s A&D companies experienced strong growth of 30.8 percent in core operating earnings to US$9.0 billion in 2015.
Over the last few years, US defense revenues have either declined or remained flat. The US defense subsector experienced 2.5 percent decline in 2011, flat growth in 2012 and 2013, 2.2 percent decline in 2014, and a 0.9 percent decrease in 2015. This has been primarily driven by the drawdown of large armed forces engaged in operations in the Middle East and continued decline in funding outlays by the DoD, the largest subsector customer, whose budget decreased by 3.6 percent in 2015. The Budget Control Act of 2011 mandated a reduction (sequestration) of defense spending by about US$490 billion between US government fiscal years 2012 and 2021.9
Although, the impact of sequestration cuts tapered in fiscal year 2014 and fiscal year 2015, following the enactment of The Bipartisan Budget Act (BBA) in December 2013, significant uncertainty remains concerning the overall levels of defense spending for the remaining years.10 Future sequestration cuts are mandated by law. Unless the US Congress enacts legislation similar to the recent BBA laws, procurement budgets could result in further program budget reallocations and changes, cancellations, and/or delays of existing contracts or programs. This is likely to adversely affect the revenues and cash flows of defense companies. However, it is expected that even with sequestration in effect, the DoD budget has bottomed out in 2015, with budgets for 2016 increasing by 3.6 percent.11
US versus European defense subsectorThe US defense subsector continued to decline in 2015, however, the magnitude of decline has abated, with recovery expected next year, as the defense budgets are likely to increase.
There was a large gap between average margins for the US and European defense companies. In total, the US defense companies recorded operating margins of 11.7 percent, while the European defense companies reported 9.3 percent operating margins in 2015. The gap in profit margin performance has existed for many years and brings into focus the efficiency of the cost and asset base and the comparative ability of the European A&D sector to rationalize assets and reduce operating expenses. In the European A&D sector, country specific defense budgets supporting the individual country industrial base may not be large enough to achieve competitive scale efficiencies. Thus, the European A&D sector may benefit from a certain level of regional consolidation in order to gain scale economies should that coincide with company financial goals, national employment, and defense policies.
It should be noted that when measured on a non-constant currency basis (US$), global defense subsector core operating earnings remained flat with margins up 3.1 percent YoY in 2015, despite a 3.1 percent dip in subsector revenue.
Figure 33 summarizes the performances of the US and European defense subsectors, showing the improving performance of Europe.
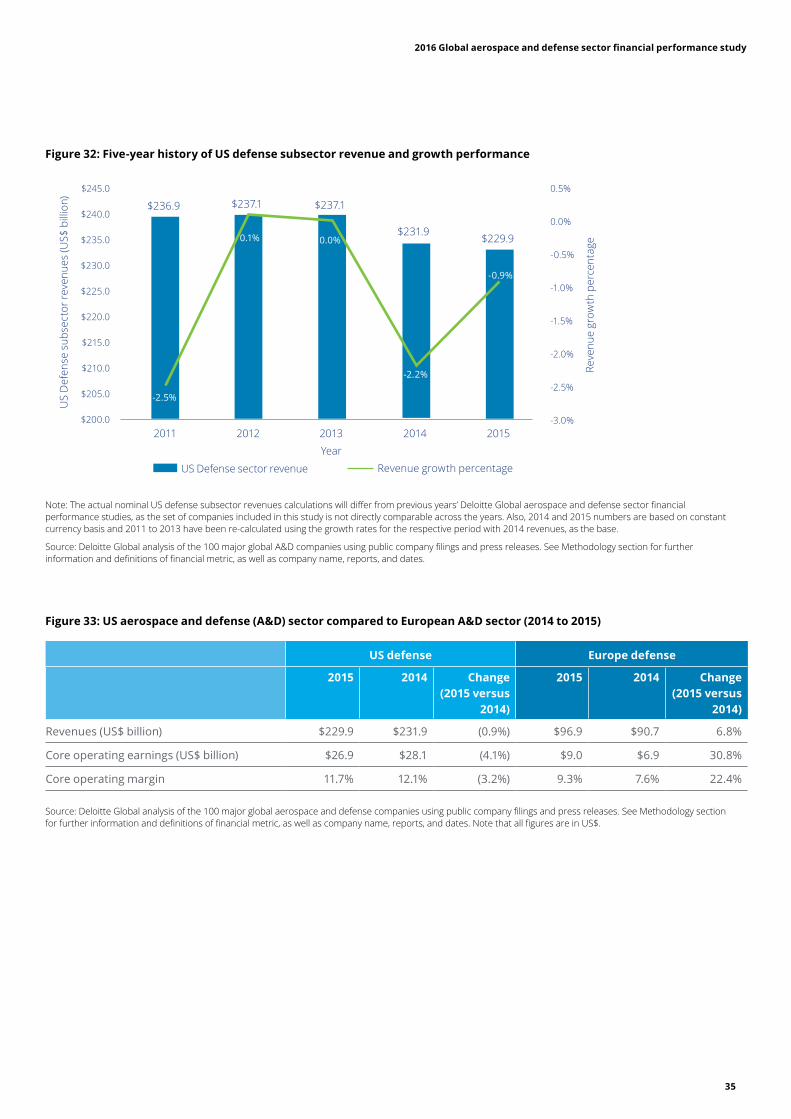
35
2016 Global aerospace and defense sector financial performance study
Note: The actual nominal US defense subsector revenues calculations will differ from previous years’ Deloitte Global aerospace and defense sector financial performance studies, as the set of companies included in this study is not directly comparable across the years. Also, 2014 and 2015 numbers are based on constant currency basis and 2011 to 2013 have been re-calculated using the growth rates for the respective period with 2014 revenues, as the base.
Source: Deloitte Global analysis of the 100 major global A&D companies using public company filings and press releases. See Methodology section for further information and definitions of financial metric, as well as company name, reports, and dates.
Source: Deloitte Global analysis of the 100 major global aerospace and defense companies using public company filings and press releases. See Methodology section for further information and definitions of financial metric, as well as company name, reports, and dates. Note that all figures are in US$.
US defense Europe defense
2015 2014 Change (2015 versus
2014)
2015 2014 Change (2015 versus
2014)
Revenues (US$ billion) $229.9 $231.9 (0.9%) $96.9 $90.7 6.8%
Core operating earnings (US$ billion) $26.9 $28.1 (4.1%) $9.0 $6.9 30.8%
Core operating margin 11.7% 12.1% (3.2%) 9.3% 7.6% 22.4%
Figure 33: US aerospace and defense (A&D) sector compared to European A&D sector (2014 to 2015)
Figure 32: Five-year history of US defense subsector revenue and growth performance
Revenue growth percentage
Reve
nue
grow
th p
erce
ntag
e
US
Def
ense
sub
sect
or re
venu
es (U
S$ b
illio
n)
US Defense sector revenue
Year
$245.0
$240.0
$235.0
$230.0
$225.0
$220.0
$215.0
$210.0
$205.0
$200.0
0.5%
0.0%
-0.5%
-1.0%
-1.5%
-2.0%
-2.5%
-3.0%
$236.9
2011 2012 2013 2014 2015
$237.1 $237.1
$231.9$229.9
-2.5%
0.1% 0.0%
-2.2%
-0.9%

36
2016 Global aerospace and defense sector financial performance study
Figure 34 illustrates the global commercial aerospace subsector performance, which shows revenue growth of 6.3 percent, with both Airbus Group and The Boeing Company reaching record aircraft deliveries of 635 and 762 respectively in 2015.
The commercial aerospace subsector continued growth momentum from the previous year, with Airbus Group and The Boeing Company reaching record revenues in 2015. Backlogs of commercial aircraft reached an all-time high, as airlines updated their fleet plans with orders for new aircraft to remain competitive and meet the increasing travel demands from emerging markets. Given the strong demand for new commercial aircraft, it is estimated that approximately 34,000 jets will be delivered from 2015 through 2034, valued at approximately US$5.47 trillion at list prices.12
Global commercial aerospace subsector compared with defense subsector performanceThe increase of 3.8 percent YoY in global A&D sector revenues was driven by the strong growth in the commercial aerospace subsector, coupled with recovery in the defense subsector revenues.
Figure 34 compares the performance of the commercial aerospace and defense subsectors in 2015 and 2014. Airbus Commercial revenues increased 8.2 percent likely due to the strong order books for commercial aerospace, while Airbus Defence & Space experienced only a 1.7 percent increase YoY. On the other hand, The Boeing Company experienced increased commercial and decreased defense revenues. The Boeing Company’s commercial aerospace revenues increased 10.1 percent in 2015, while its defense revenues decreased 1.6 percent YoY.
However, with effect for FX, the commercial aerospace subsector measure on an actual US$ basis was flat (minus 0.3 percent) in 2015, with the native currency growth being offset by weakness in global currencies against the US$.
On the other hand, the global defense subsector experienced a slight recovery with revenues up 1.7 percent YoY, mainly driven by the European defense subsector. Going forward, some recovery is expected in the US defense subsector, led by higher defense budgets by the US DoD and to non-domestic markets are likely to offer some upside potential as well.
Of note, on a non-constant US$ basis, the global defense subsector experienced a 3.1 percent decline in 2015, led by weak performance of European defense companies likely due to the negative impact of a strong US$. However, these companies experienced strong growth on a native currency basis.

37
2016 Global aerospace and defense sector financial performance study
Note: The total aerospace and defense (A&D) sector revenues will not match when we add commercial aerospace and defense revenues together. The reason is certain large A&D companies have corporate eliminations/others as input in their total revenues, which cannot be distributed among commercial aerospace and defense subsectors.
Source: Deloitte Global analysis of the 100 major global aerospace and defense companies using public company filings and press releases. See Methodology section for further information and definitions of financial metric, as well as company name, reports, and dates. Note that all figures are in US$.
Commercial aerospace Defense
2015 2014 Change (2015 versus
2014)
2015 2014 Change (2015 versus
2014)
Revenues (US$ billion) $325.5 $306.2 6.3% $348.9 $343.1 1.7%
Core operating earnings (US$ billion) $33.1 $34.4 (3.7%) $37.4 $36.3 2.9%
Core operating margin 10.2% 11.2% (9.4%) 10.7% 10.6% 1.2%
Figure 34: Commercial aerospace, as compared to defense subsector performance comparison (2014 to 2015)

38
2016 Global aerospace and defense sector financial performance study
Segment performance
Revenues for the OEM segment increased 4.0 percent in 2015 (see Figure 35) to US$370.8 billion, up from US$356.4 billion in 2014. This is marginally above the global A&D sector’s overall revenue growth of 3.8 percent. Recovery in the defense subsector and growth in commercial aerospace led to the growth for the OEM group. Revenue growth of the OEM segment leaders, The Boeing Company and Airbus Group, remained strong and helped offset the low growth in defense-related declines. The propulsion segment companies generated relatively stronger revenue growth of 8.5 percent YoY. Revenue growth for the tier one, tier two suppliers, aerostructures, and services segment was lower compared to the global A&D sector overall in 2015. Only the tier three suppliers experienced negative growth of 2.9 percent YoY.
The OEM segment’s core operating earnings decreased 2.4 percent to US$32.4 billion in 2015 from US$33.2 billion in 2014. The aerostructures and propulsion segments reported 19.0 percent and 14.4 percent growth YoY, outperforming the global A&D sector overall. However, tier one suppliers with 18.8 percent decline and tier three with 26.2 percent decrease in core operating
earnings were the segments with weak operating earnings performance, underperforming the overall global A&D sector.
The global A&D sector’s average operating margin declined 3.9 percent at 10.4 percent with aerostructures (15.5 percent increase) and propulsion (5.5 percent increase) performing relatively better than the sector. This was offset by OEMs (6.2 percent decline), tier one suppliers (19.7 percent decline), tier two suppliers (4.5 percent decline), tier three suppliers (24.0 percent decline), electronics (2.1 percent decline), and services (2.6 percent decline). Although the tier two supplier segment reported the highest operating margins of 16.8 percent in 2015, it experienced a YoY decline of 5.2 percent. Lowest margins were recorded for the tier three suppliers in 2015 at 5.9 percent, down 24.0 percent YoY.
ROIC for the global A&D sector increased 2.9 percent in 2015 with the OEM segment experiencing a 6.6 percent increase in its ROIC, up from 22.9 percent in 2014 to 35.2 percent in 2015. Inversely, tier one supplier segment’s ROIC dipped by 30.5 percent to 9.8 percent. FCF for the OEM segment reported a 0.3 percent YoY decline to US$19.2 billion in 2015, versus the global A&D sector, which experienced
Original equipment manufacturers and supplier companies
a growth of 5.8 percent. The decline in FCF was primarily driven by lower FCF at BAE Systems, Bombardier, and General Dynamics. With order backlog of aircraft at an all-time high, the BTB ratio for the OEMs reached 1.42 times, compared to the global A&D sector’s BTB ratio of 1.24 times. However, OEMs BTB ratio was down 20.5 percent YoY, as backlog at The Boeing Company, Bombardier, BAE Systems, and General Dynamics decreased in 2015. The OEM segment’s higher BTB ratio also reiterates the strong outlook for commercial aerospace, as this subsector continues to be a key factor in global A&D sector revenue, profit, and backlog growth.
Figure 35 summarizes the segment financial performance metrics, as described above.

39
2016 Global aerospace and defense sector financial performance study
Revenues (US$ billion) Core operating earnings (US$ billion)
Core operating margin
Segment 2015 2014 Change (2015 versus
2014)
2015 2014 Change (2015 versus
2014)
2015 2014 Change (2015 versus
2014)
Original equipment manufacturers
$370.8 $356.4 4.0% $32.4 $33.2 (2.4%) 8.7% 9.3% (6.2%)
Tier one $40.6 $40.1 1.2% $4.3 $5.3 (18.8%) 10.7% 13.3% (19.7%)
Tier two $33.7 $32.9 2.5% $5.7 $5.8 (2.9%) 16.8% 17.7% (5.2%)
Tier three $7.2 $7.4 (2.9%) $0.4 $0.6 (26.2%) 5.9% 7.8% (24.0%)
Electronics $80.2 $77.8 3.1% $10.5 $10.4 0.9% 13.1% 13.4% (2.1%)
Aerostructures $32.7 $31.8 3.0% $3.3 $2.8 19.0% 10.1% 8.8% 15.5%
Propulsion $67.6 $62.3 8.5% $10.7 $9.3 14.4% 15.8% 15.0% 5.5%
Services $41.5 $40.8 1.7% $2.8 $2.9 (0.9%) 6.8% 7.0% (2.6%)
Source: Deloitte Global analysis of the 100 major global aerospace and defense companies using public company filings and press releases. See Methodology section for further information and definitions of financial metric, as well as company name, reports, and dates.
Figure 35: Segment performance comparison (2014 to 2015)

40
2016 Global aerospace and defense sector financial performance study
Summary of aerospace and defense sector performance figures The following figures provide the growth rate for each of the key performance metrics used in this study.
Revenue growth
Core operating
earnings growth
Core operating
margin growth
Return on invested
capital growth
Free cash flow
growth
Free cash margin growth
Book-to-bill
growth
Number of aerospace
and defense employees
growth
Revenue per
employee growth
Operating earnings
per employee
growth
Global aerospace and defense (A&D) sector
3.8% (0.3%) (3.9%) 13.4% 5.8% (1.9%) (13.4%) 0.4% 3.3% (0.7%)
US A&D sector 1.4% (4.7%) (6.1%) 16.3% 4.3% 2.9% (18.3%) 0.7% 0.7% (5.4%)
Europe A&D sector
8.2% 11.1% 2.7% 12.5% 13.3% 4.8% (9.4%) (0.8%) 9.1% 12.0%
Original equipment manufacturers
4.0% (2.4%) (0.6%) 22.9% (0.3%) (4.2%) (20.5%) (0.8%) 4.9% (1.6%)
Tier one 1.2% (18.8%) (19.7%) (30.5%) (14.5%) (15.5%) (24.6%) (0.7%) 1.9% (18.2%)
Tier two 2.5% (2.9%) (5.2%) (9.2%) (3.2%) (5.5%) 2.2% 3.7% (1.2%) (6.3%)
Tier three (2.9%) (26.4%) (24.2%) n/a n/a n/a (0.2%) 2.7% (5.4%) (28.3%)
Electronics 3.1% 0.9% (2.1%) (6.1%) 19.2% 15.6% 5.2% 2.8% 0.3% (1.8%)
Aerostructures 3.0% 18.9% 15.5% 19.2% 124.9% 118.3% (30.4%) 4.6% (1.5%) 13.8%
Propulsion 8.5% 14.4% 5.5% (6.1%) 18.2% 9.0% 0.6% (0.7%) 9.2% 15.2%
Services 1.7% (0.9%) (2.6%) (46.3%) (6.4%) (7.9%) 58.9% 1.6% 0.1% (2.5%)
Growth represents the difference between 2015 and 2014 performance. Growth across the different segments including original equipment manufacturers, tier one, tier two, tier three, electronics, aerostructures, propulsion, and services are calculated on constant conversion rates.
Source: Deloitte Global analysis of the 100 major global aerospace and defense companies using public company filings and press releases. See Methodology section for further information and definitions of financial metric, as well as company name, reports, and dates.
Figure 36: 2015 Aerospace and defense sector performance growth

41
2016 Global aerospace and defense sector financial performance study
Revenue (US$
billion)
Core operating
earnings (US$
billion)
Operating margin
ROIC FCF (US$ billion)
FCM BTB ratio
Number of A&D
employees (million)
A&D revenue/
employee (US$ ‘000)
A&D operating earnings/employee (US$ ‘000)
Global aerospace and defense (A&D) sector
$674.4 $70.2 10.4% 24.5% $40.9 6.1% 1.24 2.05 $329.46 $34.28
US A&D sector $424.1 $49.2 11.6% 27.0% $32.7 7.7% 1.02 1.19 $355.06 $41.22
Europe A&D sector
$203.9 $17.4 8.5% 24.0% $8.1 3.9% 1.84 0.61 $334.43 $28.52
Original equipment manufacturers
$370.8 $32.4 8.7% 35.2% $19.2 5.2% 1.42 0.99 $375.00 $32.73
Tier one $40.6 $4.3 10.7% 9.8% $2.3 5.6% 0.83 0.18 $220.20 $23.45
Tier two $33.7 $5.7 16.8% 8.9% $3.1 9.3% 1.00 0.14 $246.33 $41.41
Tier three $7.2 $0.4 5.9% (1.1%) ($0.02) (0.3%) 1.02 0.02 $357.97 $21.26
Electronics $80.2 $10.5 13.1% 15.6% $7.2 9.0% 1.12 0.27 $291.99 $38.29
Aerostructures $32.7 $3.3 10.1% 15.9% $2.1 6.3% 1.12 0.09 $378.27 $38.34
Propulsion $67.6 $10.7 15.8% 11.6% $4.7 7.0% 1.43 0.16 $425.06 $67.24
Services $41.5 $2.8 6.8% 5.9% $2.3 5.6% 1.17 0.19 $211.32 $14.45
Revenue (US$ billion) 2011 2012 2013 2014 2015 2011 to 2015 Compound annual
growth rate percentage
Original equipment manufacturers
$309.4 $327.2 $350.6 $356.4 $370.8 3.7%
Tier one $29.9 $34.2 $37.2 $40.1 $40.6 6.3%
Tier two $31.8 $35.1 $31.0 $32.9 $33.7 1.2%
Tier three $8.5 $9.8 $7.2 $7.4 $7.2 -3.1%
Electronics $78.2 $79.5 $78.3 $77.8 $80.2 0.5%
Aerostructures $24.7 $26.9 $30.7 $31.8 $32.7 5.8%
Propulsion $51.3 $56.6 $59.6 $62.3 $67.6 5.7%
Services $50.1 $48.4 $43.0 $40.8 $41.5 -3.7%
Total aerospace and defense sector
$583.9 $617.8 $637.6 $649.7 $674.4 2.9%
Source: Deloitte Global analysis of the 100 major global aerospace and defense companies using public company filings and press releases. See Methodology section for further information and definitions of financial metric, as well as company name, reports, and dates. Note that all figures are in US$.
Source: Deloitte Global analysis of the 100 major global aerospace and defense companies using public company filings and press releases. See Methodology section for further information and definitions of financial metric, as well as company name, reports, and dates. Note that all figures are in US$.
Figure 37: Aerospace and defense sector nominal performance
Figure 38: Segment revenue performance comparison (2011 to 2015)

42
2016 Global aerospace and defense sector financial performance study
Core operating margin 2011 2012 2013 2014 2015 2011 to 2015 Compound annual
growth rate percentage
Original equipment manufacturers
7.7% 7.4% 9.1% 9.3% 8.7% 2.6%
Tier one 15.1% 14.1% 14.3% 13.3% 10.7% -6.7%
Tier two 17.7% 17.5% 17.8% 17.4% 16.7% -1.2%
Tier three 13.8% 11.9% 4.1% 7.8% 5.9% -15.6%
Electronics 14.7% 14.7% 12.6% 13.4% 13.1% -2.3%
Aerostructures 5.9% 5.8% 6.2% 8.8% 10.1% 11.5%
Propulsion 13.0% 13.1% 15.2% 15.0% 15.8% 4.0%
Services 7.9% 9.1% 9.2% 7.0% 6.8% -2.8%
Total Global aerospace and defense
9.9% 9.8% 10.7% 10.8% 10.4% 0.9%
Core operating earnings (US$ billion)
2011 2012 2013 2014 2015 2011 to 2015 Compound annual
growth rate percentage
Original equipment manufacturers
$23.8 $24.1 $32.0 $33.2 $32.4 6.4%
Tier one $4.5 $4.8 $5.3 $5.3 $4.3 -0.9%
Tier two $5.6 $6.2 $5.5 $5.8 $5.7 0.1%
Tier three $1.2 $1.2 $0.3 $0.6 $0.4 -18.1%
Electronics $11.5 $11.7 $9.9 $10.4 $10.5 -1.8%
Aerostructures $1.5 $1.6 $1.9 $2.8 $3.3 18.0%
Propulsion $6.7 $7.4 $9.1 $9.3 $10.7 9.9%
Services $3.9 $4.4 $3.9 $2.9 $2.8 -6.4%
Total global aerospace and defense sector
$58.0 $60.7 $68.0 $70.4 $70.2 3.9%
Source: Deloitte Global analysis of the 100 major global aerospace and defense companies using public company filings and press releases. See Methodology section for further information and definitions of financial metric, as well as company name, reports, and dates. Note that all figures are in US$.
Source: Deloitte Global analysis of the 100 major global aerospace and defense companies using public company filings and press releases. See Methodology section for further information and definitions of financial metric, as well as company name, reports, and dates.
Figure 39: Segment operating earnings performance comparison (2011 to 2015)
Figure 40: Segment operating margin performance comparison (2011 to 2015)

43
2016 Global aerospace and defense sector financial performance study

44
2016 Global aerospace and defense sector financial performance study
Methodology This study is based on the key financial performance metrics for 100 global A&D companies or segments of industrial conglomerates with A&D businesses, which generated global A&D revenues greater than US$500 million in 2015. By using the data from the companies’ respective 10-Ks, annual reports, and other official financial releases in the calculation framework, Deloitte Global analyzed the global A&D sector’s 2015 performance. The study used audited results for all companies. The study highlights specific companies that had a positive or negative impact on the A&D sector’s performance and analyzed categorical performance based on business types and geographic identifications.
The presentation of the companies’ 2015 financial performance data is based on the companies’ respective 2015 fiscal year ending. Similar treatment applies to the presentation of the companies’ 2014 financial performance data.
Certain companies were excluded from the analysis including government-controlled entities, private companies that do not release public filings, or public companies that do not report A&D segment information. Additionally, certain companies from the previous year’s study were excluded likely due to conformance with study criteria; i.e., lower threshold of US$500 million in global revenues, companies that were acquired, and companies going private.
All data in this study is presented in US$ currency. Forty three percent of the 100 companies under analysis in this study are headquartered in countries other than the US. For such companies, the study applied a constant currency conversion rate to remove the impact of exchange rate fluctuations in the analysis (2015 average exchange rate). The conversion rates used for Euro/US$ include 2015 average conversion rate of 1.111.13 Embraer, Elbit Systems, BBA Aviation, and Bombardier
Aerospace are four non-US companies that report financials in US$.
The study used the standard constant approach to eliminate the effect of significant currency fluctuations from year to year. For instance, Airbus Group’s revenue in native currency increased from €60.7 billion in 2014, to €64.4 billion in 2015, up 6.2 percent. However, Airbus Group's foreign exchange hedging policy affects significantly the theoretical foreign exchange conversion performed in this study. As a result, the study used the 2015 average exchange rate for converting both 2014 and 2015 data for non-US denominated companies.
In the commercial versus defense subsector section, the study compares and contrasts the performance of the 100 global A&D companies analyzed in the study. Revenues, operating earnings, operating margins, have been calculated for commercial and defense businesses of these companies.
Many companies provided their commercial versus defense revenues. However, there were only a few companies which explicitly stated commercial versus defense operating earnings; in absence of explicit detail, the study used the commercial and defense percentage of revenue, as a proxy to estimate the respective operating earnings.
1. Aerospace and defense sector revenue• To calculate the A&D revenue for a
company, the percentage of revenue associated with A&D activities was determined. In calculating this percentage, it was first checked to see if the company explicitly stated an A&D revenue figure. In such a case, the explicitly stated percentage was directly used. If the percentage was not explicitly stated, the company’s various business segments or end-markets were analyzed and considered only those, which were related to A&D in estimating the revenue percentage.
• In determining A&D sector revenue, a calculated summation of the revenue was included of the constituent 100 companies.
2. Operating earnings/margin • Examined in the study were the
operating earnings as stated, if reported by the company. If the operating earnings were not published by the company, they were calculated, as the following: Operating earnings = Sales – Cost of goods sold – SG&A expenses – Research and development expenses – Restructuring/ acquisition costs – Impairments/amortizations.
• The companies’ respective A&D operating margins were calculated by dividing their respective A&D operating earnings by their respective A&D revenues.
• Operating earnings for the A&D sector is a summation of operating earnings of the constituent companies.
• Operating margin for the A&D sector was calculated as the total sector operating earnings as a percentage of total sector revenue.
3. Return on invested capital • ROIC was calculated for the entire
company, as companies report it at the company level and not at the segmental level. ROIC was calculated based on component values in home currencies to eliminate the impact of currency conversion.
• The ROIC value was included if the company reported it. If the company did not publish the ROIC value, it was calculated as the following: ROIC = (Net operating earnings after tax) / (Average shareholder equity + Average net financial debt).
– Net operating earnings after tax (NOPAT) is calculated as NOPAT = Operating earnings*(1– Effective tax rate)

45
2016 Global aerospace and defense sector financial performance study
– A company’s 2015 average shareholder equity is calculated as the simple averages of its 2015 and 2014 fiscal year end shareholder equity values. A company’s 2014 average shareholder equity is calculated as the simple averages of its 2014 and 2013 fiscal year end shareholder equity values. Analogous treatment applies to the calculation of a company’s 2015 and 2014 average net financial debt values.
– Net financial debt is calculated as Net financial debt = Short-term interest-bearing liabilities + Long-term interest-bearing liabilities – ((0.8*(Cash and cash equivalents)).
– Eighty percent of cash and cash equivalents is used in the calculation of net financial debt and assumed that 20 percent of a company’s cash is reserved for running the operations of the company and, thus, not available for investment, for the purposes of this study.
• ROIC for the A&D sector is a revenue, weighted average. It was calculated as the following: A&D sector ROIC = Σ (Company ROIC*company A&D revenue) / Total A&D sector revenue. ROIC stated in the study differs from return on capital employed.
4. Free cash flow/Free case margin• FCF was calculated for the A&D
business based on the A&D revenues of the company
• If the company published the FCF value, it was used directly. If the company did not publish the FCF value, it was calculated as FCF = Operating cash flow – Net capital expenditures.
– Net capital expenditures are calculated as Net capital expenditure = Purchase of property, plant, and equipment (PP&E) - Proceeds from the sale of PP&E.
– A&D sector FCF was calculated as a summation of the FCFs of the constituent companies.
– FCM was calculated the A&D business based on the A&D revenues of the company. FCM for a company was calculated as A&D FCM = A&D FCF / A&D revenue.
– FCM for the A&D sector is a revenue-weighted average. It was calculated as: A&D sector FCM = Σ (Company FCM*Company A&D revenue) / Total A&D sector revenue.
5. Interest coverage ratio • Interest coverage ratio was calculated
for the entire company, as it is not practical to allocate interest expense to a company’s A&D and non-A&D segments.
– Interest coverage ratio = Operating earnings / Interest expenses
– Interest coverage ratio for the A&D sector is a revenue, weighted average. It was calculated as the following: A&D sector Interest coverage ratio = Σ (Company Interest coverage ratio*Company A&D revenue) / Total A&D sector revenue
6. Current ratio • Current ratio was calculated for the
entire company, as it is not practical to allocate current assets and current liabilities to a company’s A&D and non-A&D segments.
– Current ratio = Current assets / Current liabilities
– Current ratio for the A&D sector is a revenue, weighted average. It was calculated as the following: A&D sector current ratio = Σ (Company current ratio*Company A&D revenue) / Total A&D sector revenue
7. Debt equity ratio • Debt-to-equity ratio was calculated for
the entire company, as it is not practical to allocate total debt and equity to a company’s A&D and non-A&D segments.
– Debt-to-equity ratio = Total debt / Total shareholders’ equity
– Debt-to-equity ratio for the A&D sector is a revenue, weighted average. It was
calculated as the following: A&D sector Debt-to-equity ratio = Σ (Company debt-to-equity ratio*Company A&D revenue) / Total A&D sector revenue
8. Book-to-bill ratio• BTB ratio was taken as stated if reported
by the company. If the BTB ratio was not published by the company, it was calculated as BTB = 1+ ((Current fiscal year total backlog - Previous fiscal year total backlog) / (Current fiscal year revenue)).
• The BTB ratio for the A&D sector is a revenue-weighted average. It was calculated as the following: A&D sector BTB = Σ (Company BTB*Company A&D revenue) / Total sector A&D revenue.
• BTB ratio was calculated based on component values as reported in home currencies to eliminate the impact of currency conversion.
9. Number of aerospace and defense employees• Where reported by the companies,
the average employee numbers for the respective fiscal years were used. If average employee numbers were not available, employee figures were factored in as of the end of the respective fiscal years.
10. Employee productivity • Employee productivity was measured
for individual companies and the A&D sector including A&D operating earnings per employee.
• The number of employees associated with the A&D business was used as reported by the company if so stated explicitly. However, if the same is not explicitly stated, the number of employees associated with the A&D business was estimated based on revenues.
• Operating earnings per employee for the sector are calculated as: Operating earnings per employee in the A&D sector = Total operating earnings of the sector/ Total number of employees in the sector.
Note: i) Likely due to rounding, numbers presented throughout this report may not add up precisely to the totals provided and percentages may not precisely reflect the absolute figures. Also, the total aerospace and defense (A&D) sector revenues will not precisely match when commercial A&D subsector revenues are added together. This is because many large A&D companies have corporate eliminations/others as input in their total revenues, which cannot be distributed among commercial A&D subsectors.
ii) "Non-constant currency/US$ basis" refers to currency conversion using average exchange rates for 2014 and 2015

46
2016 Global aerospace and defense sector financial performance study
46
1. The World Bank, Global Economic Prospects, June 2016, http://www.worldbank.org/en/publication/global-economic-prospects.
2. The United States Office of the Under Secretary of Defense (Comptroller)/Chief Financial Officer, “Fiscal Year 2017 Budget Request,” February 2016, http://comptroller.defense.gov/Portals/45/Documents/defbudget/fy2017/FY2017_Budget_Request_Overview_Book.pdf.
3. The Boeing Company, Pg 5, Current Market Outlook (2015-2034), June 2015, http://www.boeing.com/resources/boeingdotcom/commercial/about-our-market/assets/downloads/Boeing_Current_Market_Outlook_2015.pdf.
4. Boeing 2015 10-K report (Pg 20), http://investors.boeing.com/investors/financial-reports/default.aspx.
5. Boeing 2015 10-K report (Pg 20), http://investors.boeing.com/investors/financial-reports/default.aspx.
6. Boeing 2015 10-K report (Pg 20), http://investors.boeing.com/investors/financial-reports/default.aspx.
7. Boeing 2015 10-K report (Pg 19), http://investors.boeing.com/investors/financial-reports/default.aspx.
8. Boeing 2015 10-K report (Pg 4), http://investors.boeing.com/investors/financial-reports/default.aspx.
9. Office of the Under Secretary of Defense (Comptroller)/Chief Financial Officer, “Fiscal Year 2014 Budget Request and FY2013 Update,” April 2013, http://comptroller.defense.gov/Portals/45/Documents/defbudget/fy2014/FY2014_Budget_Request_Overview_Book.pdf.
10. Ibid.
11. Office of the Under Secretary of Defense (Comptroller)/Chief Financial Officer, “Fiscal Year 2017 Budget Request,” February 2016, http://comptroller.defense.gov/Portals/45/Documents/defbudget/fy2017/FY2017_Budget_Request_Overview_Book.pdf.
12. The Boeing Company, Current Market Outlook (2015-2034), June 2015, http://www.boeing.com/resources/boeingdotcom/commercial/about-our-market/assets/downloads/Boeing_Current_Market_Outlook_2015.pdf.
13. OANDA, Currency converter, accessed in July 2016, https://www.oanda.com/currency/average.
Endnotes

47
2016 Global aerospace and defense sector financial performance study
Tom CaptainGlobal Aerospace & Defense Leader Deloitte Touche Tohmatsu Limited +1 206 716 6452 [email protected]
Aijaz Hussain Aerospace & Defense Sector Research Leader Deloitte US Center for Industry Insights (Deloitte Services LLP) [email protected]
AcknowledgmentsThank you to Siddhant Mehra from the Deloitte US Center for Industry Insights (Deloitte Services LLP) for his significant contribution towards the research and analysis of this study.
Author
Co-Author
Contacts

About Deloitte
Deloitte refers to one or more of Deloitte Touche Tohmatsu Limited, a UK private company limited by guarantee (“DTTL”), its network of member firms, and their related entities. DTTL and each of its member firms are legally separate and independent entities. DTTL (also referred to as “Deloitte Global”) does not provide services to clients. Please see www.deloitte.com/about for a more detailed description of DTTL and its member firms.
Deloitte provides audit, consulting, financial advisory, risk management, tax and related services to public and private clients spanning multiple industries. With a globally connected network of member firms in more than 150 countries, Deloitte brings world-class capabilities and high-quality service to clients, delivering the insights they need to address their most complex business challenges. Deloitte’s more than 225,000 professionals are committed to making an impact that matters. Deloitte serves 4 out of 5 Fortune Global 500® companies.
About this publication
This communication contains general information only, and none of Deloitte Touche Tohmatsu Limited, its member firms, or their related entities (collectively, the “Deloitte Network”) is, by means of this communication, rendering professional advice or services. Before making any decision or taking any action that may affect your finances or your business, you should consult a qualified professional adviser. No entity in the Deloitte Network shall be responsible for any loss whatsoever sustained by any person who relies on this communication.
© 2016. For information, contact Deloitte Touche Tohmatsu Limited.