submitted to: office of citizen corps department of homeland security submitted by: 11785 beltsville...
Post on 21-Dec-2015
220 views
TRANSCRIPT
Submitted to:
Office of Citizen Corps Department of Homeland Security
Submitted by:
11785 Beltsville DriveCalverton, MD 20705
2003 Citizen Corps Survey of U.S. Households
FINAL SURVEY REPORT

2
Table of Contents
Summary of Methodology
Conclusions and Recommendations
Survey Analysis
Findings
Household Preparedness
Training
Neighborhood Preparedness
Volunteer Service
Awareness
Appendix A: Region Profiles
Appendix B: Demographic Profiles
3
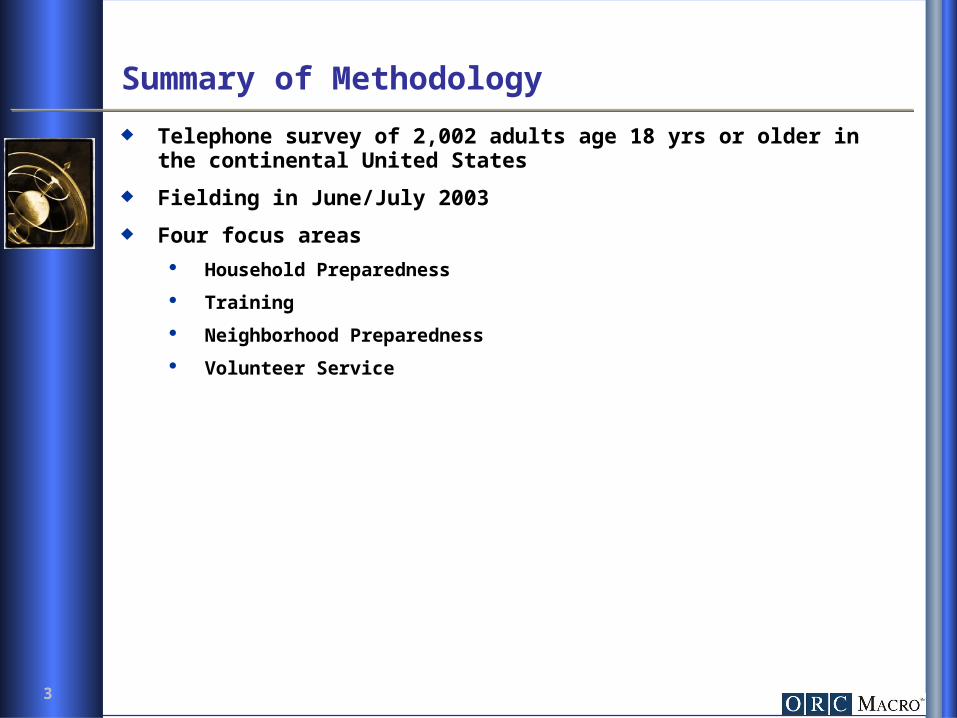
Telephone survey of 2,002 adults age 18 yrs or older in the continental United States
Fielding in June/July 2003
Four focus areas
Household Preparedness
Training
Neighborhood Preparedness
Volunteer Service
Summary of Methodology

4
Conclusions
5
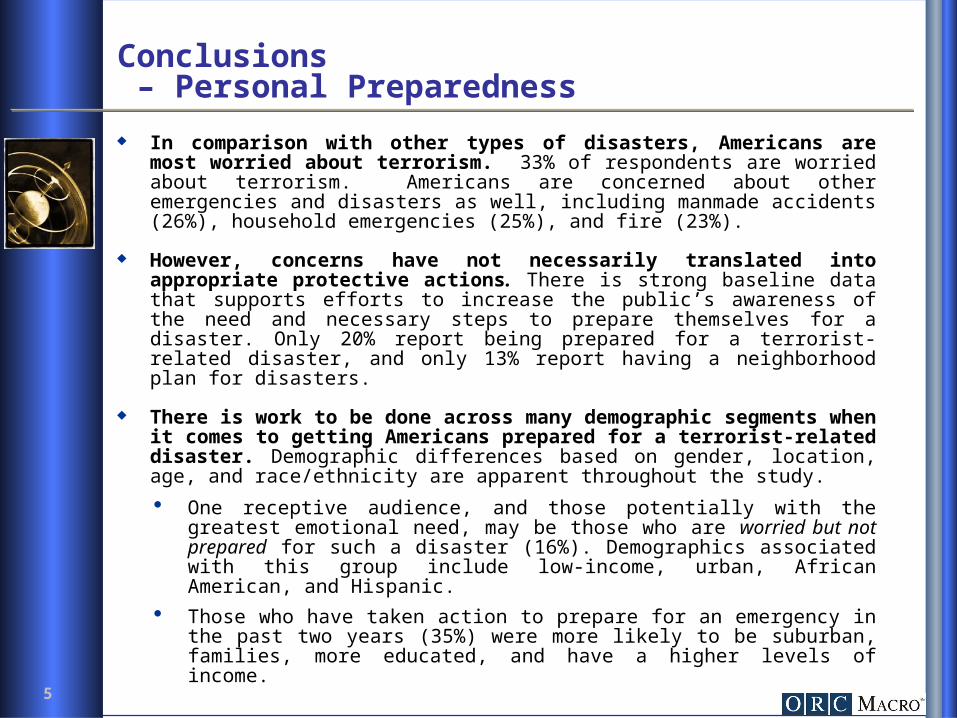
Conclusions – Personal Preparedness
In comparison with other types of disasters, Americans are most worried about terrorism. 33% of respondents are worried about terrorism. Americans are concerned about other emergencies and disasters as well, including manmade accidents (26%), household emergencies (25%), and fire (23%).
However, concerns have not necessarily translated into appropriate protective actions. There is strong baseline data that supports efforts to increase the public’s awareness of the need and necessary steps to prepare themselves for a disaster. Only 20% report being prepared for a terrorist-related disaster, and only 13% report having a neighborhood plan for disasters.
There is work to be done across many demographic segments when it comes to getting Americans prepared for a terrorist-related disaster. Demographic differences based on gender, location, age, and race/ethnicity are apparent throughout the study.
One receptive audience, and those potentially with the greatest emotional need, may be those who are worried but not prepared for such a disaster (16%). Demographics associated with this group include low-income, urban, African American, and Hispanic.
Those who have taken action to prepare for an emergency in the past two years (35%) were more likely to be suburban, families, more educated, and have a higher levels of income.

6
Conclusions – Personal Preparedness (cont’d)
12% of the population report being prepared for all three types of disasters while 39% report not being prepared for any disaster. Interestingly, neither of these groups appear associated with defined demographic characteristics.
Fewer than half of respondents have both an emergency plan and at least one emergency supply kit (48%). But the survey did not identify any real barriers to creating an emergency supply kit. Instead, the most common responses (62%) about why people did not have a kit at home tended to be vague, such as “never thought about it” and “no reason” and “don’t know.”
While half of Americans report having an emergency supply kit, most are incomplete. Beyond a first aid kit and bottled water, fewer than half of respondents indicated that they have packaged food, a flashlight, batteries, or a radio. Very few report having items such as copies of important documents or cash. Of those who do not have kits, many do not think it is important to have one or are not worried about it.

7
Conclusions – Personal Preparedness (cont’d)
Those who have kits are less likely to feel that events will overtake their preparations. This demonstrates that, for a segment of the population, being prepared may reduce the stress of worrying about disasters and increase one’s sense of well-being.
Many respondents have indicated a willingness to take action. In each topic area, there is a healthy percentage of the population that indicates a willingness to act─ who have increased their preparedness in the past two years (35%), would be more likely to develop a neighborhood plan if support was provided (70%), or would volunteer if opportunities were available (40%).
8
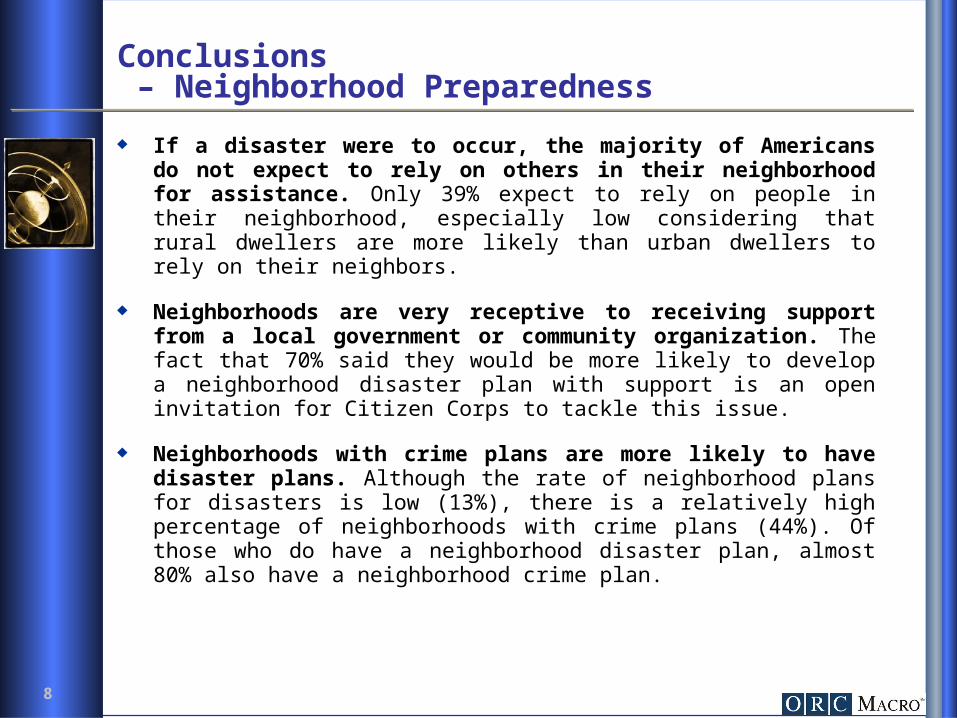
Conclusions – Neighborhood Preparedness
If a disaster were to occur, the majority of Americans do not expect to rely on others in their neighborhood for assistance. Only 39% expect to rely on people in their neighborhood, especially low considering that rural dwellers are more likely than urban dwellers to rely on their neighbors.
Neighborhoods are very receptive to receiving support from a local government or community organization. The fact that 70% said they would be more likely to develop a neighborhood disaster plan with support is an open invitation for Citizen Corps to tackle this issue.
Neighborhoods with crime plans are more likely to have disaster plans. Although the rate of neighborhood plans for disasters is low (13%), there is a relatively high percentage of neighborhoods with crime plans (44%). Of those who do have a neighborhood disaster plan, almost 80% also have a neighborhood crime plan.
9
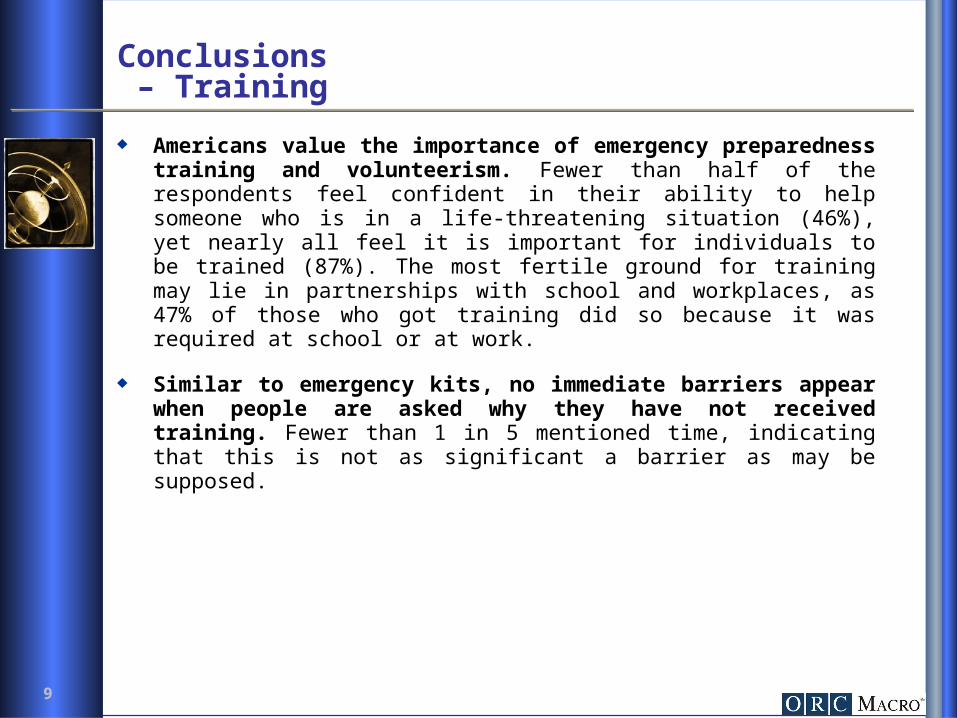
Conclusions – Training
Americans value the importance of emergency preparedness training and volunteerism. Fewer than half of the respondents feel confident in their ability to help someone who is in a life-threatening situation (46%), yet nearly all feel it is important for individuals to be trained (87%). The most fertile ground for training may lie in partnerships with school and workplaces, as 47% of those who got training did so because it was required at school or at work.
Similar to emergency kits, no immediate barriers appear when people are asked why they have not received training. Fewer than 1 in 5 mentioned time, indicating that this is not as significant a barrier as may be supposed.
10
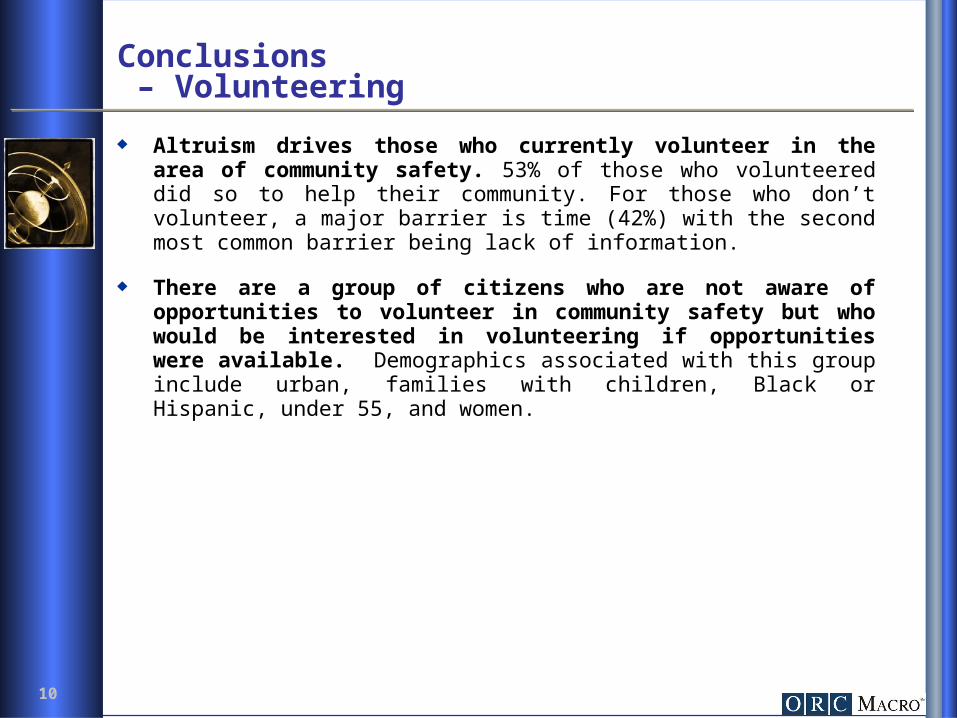
Conclusions – Volunteering
Altruism drives those who currently volunteer in the area of community safety. 53% of those who volunteered did so to help their community. For those who don’t volunteer, a major barrier is time (42%) with the second most common barrier being lack of information.
There are a group of citizens who are not aware of opportunities to volunteer in community safety but who would be interested in volunteering if opportunities were available. Demographics associated with this group include urban, families with children, Black or Hispanic, under 55, and women.
11
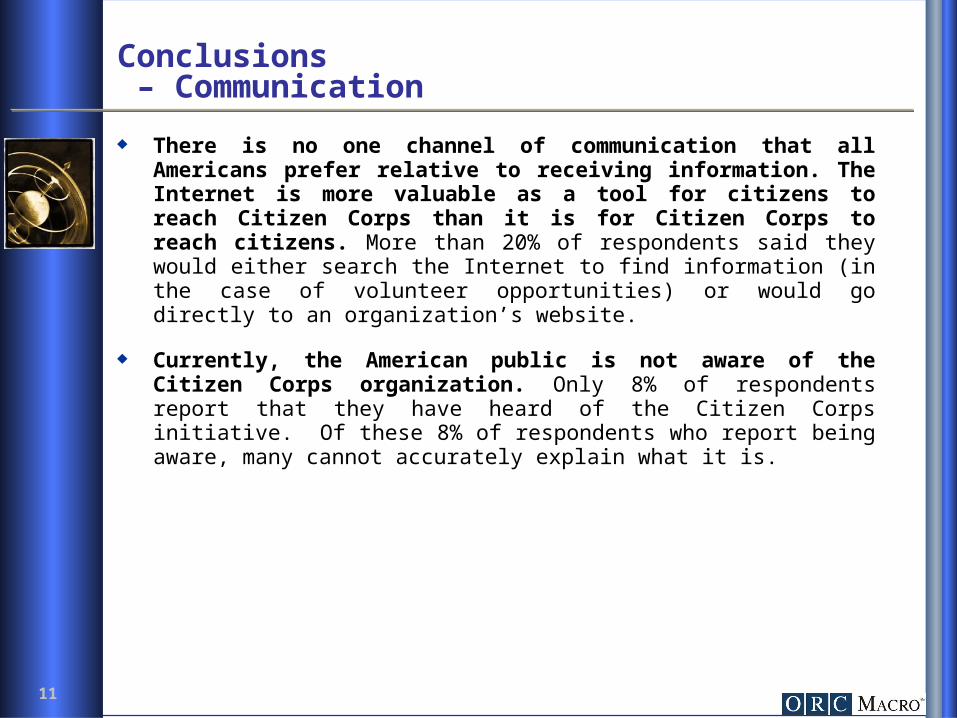
Conclusions – Communication
There is no one channel of communication that all Americans prefer relative to receiving information. The Internet is more valuable as a tool for citizens to reach Citizen Corps than it is for Citizen Corps to reach citizens. More than 20% of respondents said they would either search the Internet to find information (in the case of volunteer opportunities) or would go directly to an organization’s website.
Currently, the American public is not aware of the Citizen Corps organization. Only 8% of respondents report that they have heard of the Citizen Corps initiative. Of these 8% of respondents who report being aware, many cannot accurately explain what it is.

12
Survey Analysis
Three types of questions
Yes/no
Anchored 5-point scale
- Very worried (5)/Not worried at all (1)
- Very prepared (5)/Not prepared at all (1)
- Very important (5)/Not important at all (1)
Open-end questions: Respondents were not prompted and were allowed to provide more than one response. Interviewers then coded responses into pre-determined categories. Responses that did not fit within one of the categories were coded as “other” and recorded verbatim.
Reporting is done by grouping:“Top 2” (4 or 5) “Bottom 2” (1 or 2)
13
Survey Analysis (cont.)
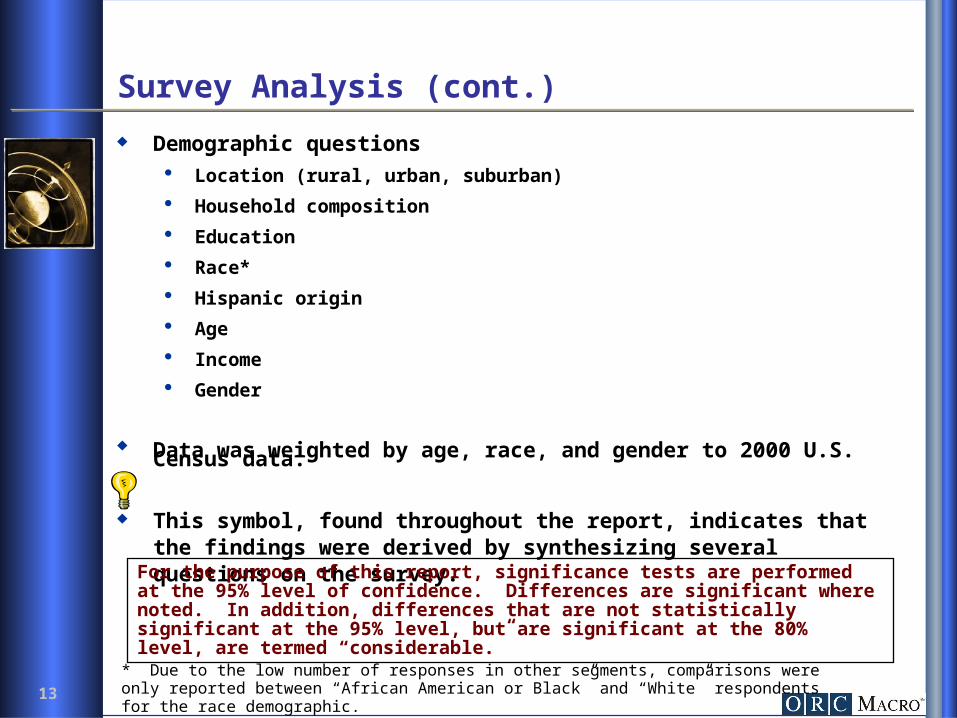
Demographic questions Location (rural, urban, suburban)
Household composition
Education
Race*
Hispanic origin
Age
Income
Gender
Data was weighted by age, race, and gender to 2000 U.S. Census data.
This symbol, found throughout the report, indicates that the findings were derived by synthesizing several questions on the survey.
For the purpose of this report, significance tests are performed at the 95% level of confidence. Differences are significant where noted. In addition, differences that are not statistically significant at the 95% level, but are significant at the 80% level, are termed “considerable.”
* Due to the low number of responses in other segments, comparisons were only reported between “African American or Black” and “White” respondents for the race demographic.
14
Household Preparedness
15
What people worry about
33%
26% 25% 23% 23%21%
18%13% 12% 11%
0%
10%
20%
30%
40%
50%
Worried (4 or 5)
* Using a scale of 1 to 5, with 5 being “very worried” and 1 being “not worried at all”, please rate how worried you are about the following.
How worried are you about the following?*
16
What people worry about (demographic differences)
As both education and income increase, the percentage of respondents worried about disasters decreases.
African Americans or Black respondents are significantly more likely than White respondents to be worried about disasters.
Respondents of Hispanic origin are significantly more likely than non-Hispanics to be worried about disasters.
Women are significantly more likely than men to be worried about disasters.
General themes present across all or most types of disasters:
17
Terrorism Respondents from urban areas are considerably more likely than suburban and
rural respondents to be worried about terrorism.
Manmade accident, like chemical spill or nuclear power plant failure
Other than the “general themes” previously mentioned, no specific differences exist for this disaster situation
A household emergency, such as choking or severe injury
Households with children under 18 are significantly more likely than other household compositions to be worried about household emergencies.
Respondents under age 35 are significantly more likely than respondents 35 and older to be worried about household emergencies.
Fire Respondents from urban areas are considerably more likely than suburban and
rural respondents to be worried about fire.
Global Warming Respondents age 35 and older are significantly more likely than respondents
under 35 to be worried about global warming.
What people worry about (demographic differences)
Demographic differences unique to specific disaster situations:

18
What people worry about (demographic differences) Neighborhood crime
Respondents from urban areas are significantly more likely than suburban and rural respondents to be worried about neighborhood crime.
Hurricanes or violent storms Respondents from urban areas are considerably more likely and respondents
from rural areas are significantly more likely than suburban respondents to be worried about hurricanes or violent storms.
Households with children under 18 are considerably less likely than other household compositions to be worried about hurricanes or violent storms.
Respondents age 35 and older are significantly more likely than respondents under 35 to be worried about hurricanes or violent storms.
Mass Transit Disasters Respondents from urban areas are considerably more likely than suburban and
rural respondents to be worried about mass transit disasters.
Floods Respondents from urban areas are significantly more likely than rural
respondents to be worried about floods.
Earthquakes Respondents from urban areas are significantly more likely than suburban and
rural respondents to be worried about earthquakes.
19
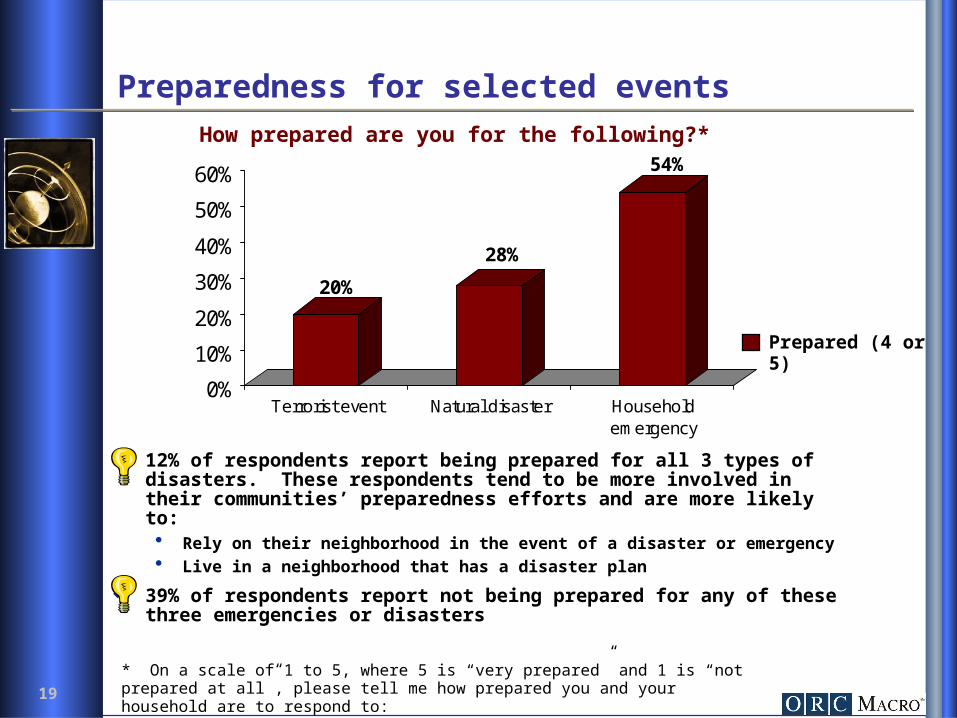
Preparedness for selected events
20%
28%
54%
0%
10%
20%
30%
40%
50%
60%
Terrorist event Natural disaster Householdemergency
12% of respondents report being prepared for all 3 types of disasters. These respondents tend to be more involved in their communities’ preparedness efforts and are more likely to: Rely on their neighborhood in the event of a disaster or emergency Live in a neighborhood that has a disaster plan
39% of respondents report not being prepared for any of these three emergencies or disasters
How prepared are you for the following?*
Prepared (4 or 5)
* On a scale of 1 to 5, where 5 is “very prepared” and 1 is “not prepared at all”, please tell me how prepared you and your household are to respond to:

20
Preparedness (demographic differences) Terrorist event
Respondents from rural areas are significantly more likely than urban and suburban respondents to be prepared for a terrorist event.
Respondents with a 4 yr college degree or more are significantly more likely than respondents with less than a 4 yr degree to be prepared for a terrorist event.
Respondents 55 yrs and older are significantly more likely than respondents under 55 to be prepared for a terrorist event.
Natural Disaster Respondents from rural and suburban areas are significantly more likely than
urban respondents to be prepared for a natural disaster.
As education increases, the percentage of respondents prepared for natural disasters decreases.
Men are considerably more likely than women to be prepared for a natural disaster.
21
Preparedness (demographic differences) Household emergency
Respondents from rural and suburban areas are considerably more likely than urban respondents to be prepared for a household emergency.
Respondents who live with family members are significantly more likely than respondents with roommates or respondents who live alone to be prepared for a household emergency.
Respondents with a high school degree or more are significantly more likely than respondents with less than a high school degree to be prepared for a household emergency.
As age increases, the percentage of respondents prepared for a household emergency decreases.
Respondents who earn $50K or more are significantly more likely than respondents who earn less than $25K to be prepared for a household emergency.
22
A closer look at being “very prepared”The following is a further analysis of individuals who felt they were “very prepared” (5)
Terrorism Respondents who report they are “very prepared” for terrorism tend to have
polar responses on how worried they are.
Specifically, 72% of respondents who reported that they are “very prepared” (5), reported that they were either “very worried” (5) or “not worried at all” (1).
This seems to indicate that being prepared for terrorism can, but does not necessarily alleviate the worry of terrorism.
Household emergencies Respondents who report they are “very prepared” for household emergencies
tend to be less worried about household emergencies.
While there are some “very prepared” respondents who still report being “very worried” (5) about household emergencies, the largest percentage (32%) report that they are “not worried at all” (1).
This seems to indicate that considering oneself to be “very prepared,” in the case of household emergencies, is more likely to alleviate worry.
23
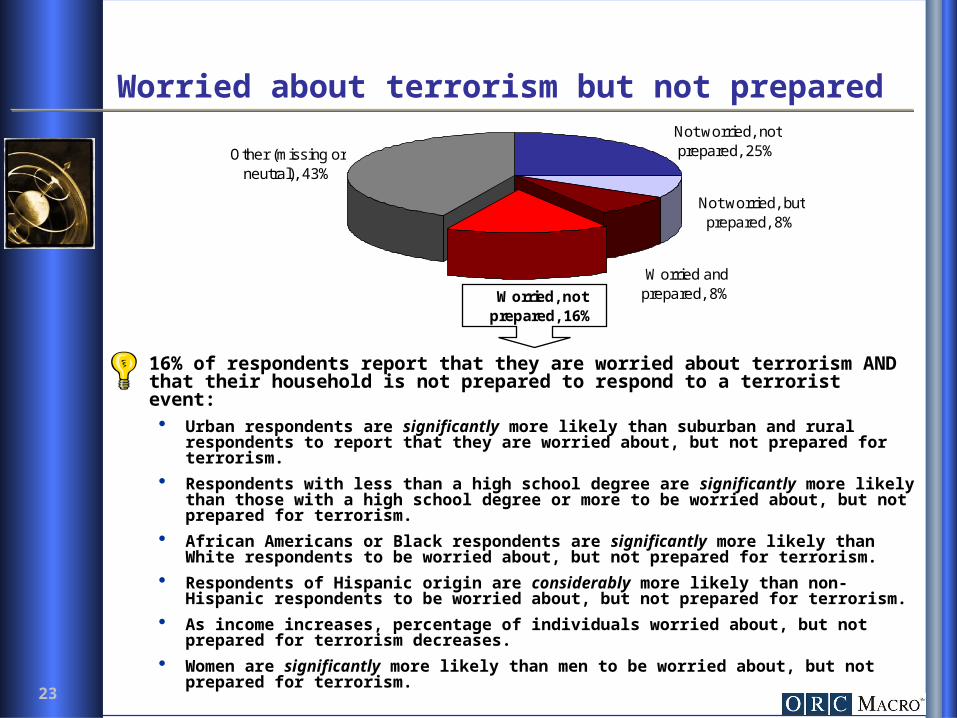
Worried about terrorism but not prepared
16% of respondents report that they are worried about terrorism AND that their household is not prepared to respond to a terrorist event: Urban respondents are significantly more likely than suburban and rural
respondents to report that they are worried about, but not prepared for terrorism.
Respondents with less than a high school degree are significantly more likely than those with a high school degree or more to be worried about, but not prepared for terrorism.
African Americans or Black respondents are significantly more likely than White respondents to be worried about, but not prepared for terrorism.
Respondents of Hispanic origin are considerably more likely than non-Hispanic respondents to be worried about, but not prepared for terrorism.
As income increases, percentage of individuals worried about, but not prepared for terrorism decreases.
Women are significantly more likely than men to be worried about, but not prepared for terrorism.
Other (missing or neutral), 43%
Worried, not prepared, 16%
Not worried, not prepared, 25%
Not worried, but prepared, 8%
Worried and prepared, 8%

24
Likelihood that events of a disaster will overtake an individual’s preparations
29% of respondents agree that in a disaster situation, the events will likely overtake any preparations they have made*
Respondents from urban and suburban areas are significantly more likely than rural respondents to feel that a disaster will overtake their preparations.
African Americans or Black respondents are considerably more likely than White respondents to feel that a disaster will overtake their preparations.
Respondents 55 yrs and older are significantly more likely than respondents under 55 to feel that a disaster will overtake their preparations.
Women are significantly more likely than men to feel that a disaster will overtake their preparations.
Whether or not a respondent is prepared for all or none of the three types of disasters has no effect on their likelihood to feel that the events of a disaster will overtake their preparations.
* To what extent do you agree or disagree with the following statement. Please use a scale of 1 to 5, with 5 being “agree to a great extent” and 1 being “do not agree at all”. In a disaster, the events will likely overtake any preparations you and your household have made.
25
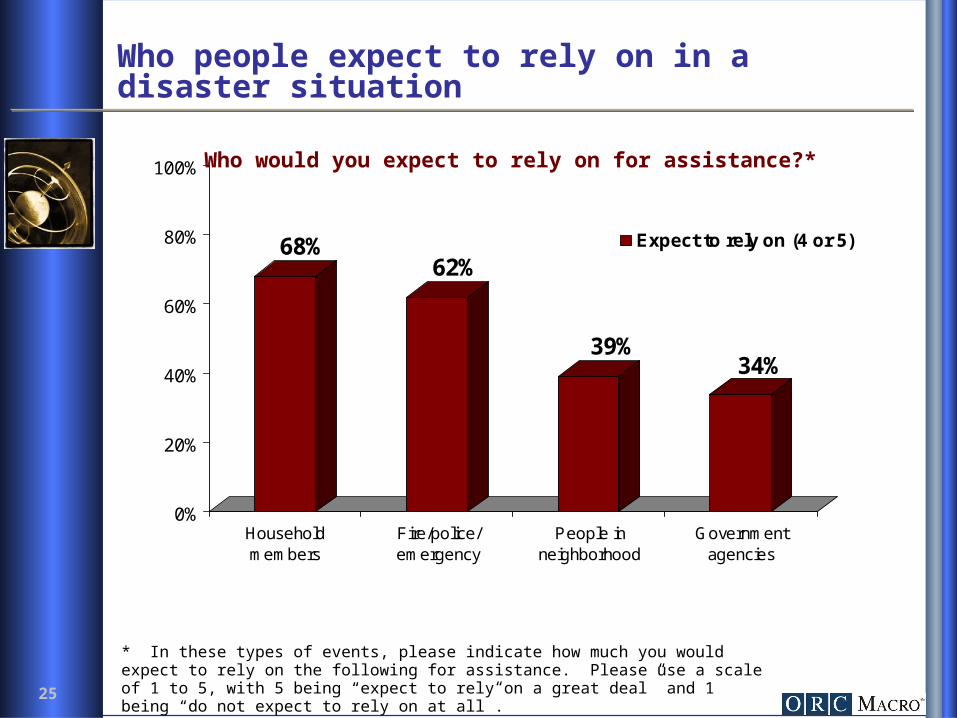
68%62%
39%34%
0%
20%
40%
60%
80%
100%
Householdmembers
Fire/police/emergency
People inneighborhood
Governmentagencies
Expect to rely on (4 or 5)
Who people expect to rely on in a disaster situation
Who would you expect to rely on for assistance?*
* In these types of events, please indicate how much you would expect to rely on the following for assistance. Please use a scale of 1 to 5, with 5 being “expect to rely on a great deal” and 1 being “do not expect to rely on at all”.
26
Who people expect to rely on in a disaster situation(demographic differences)
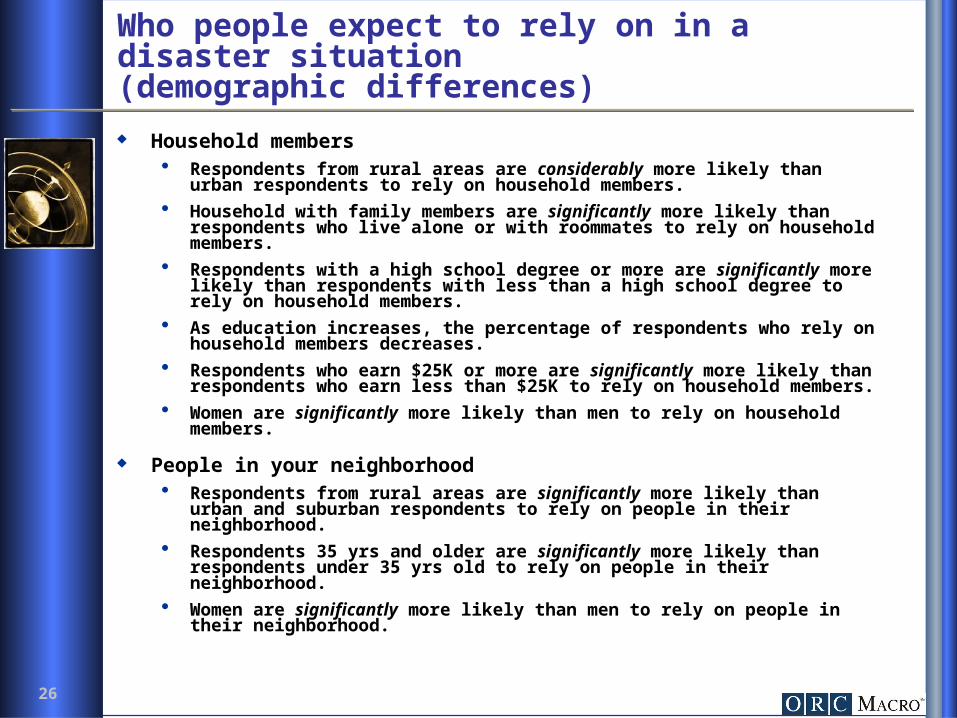
Household members Respondents from rural areas are considerably more likely than urban
respondents to rely on household members. Household with family members are significantly more likely than
respondents who live alone or with roommates to rely on household members.
Respondents with a high school degree or more are significantly more likely than respondents with less than a high school degree to rely on household members.
As education increases, the percentage of respondents who rely on household members decreases.
Respondents who earn $25K or more are significantly more likely than respondents who earn less than $25K to rely on household members.
Women are significantly more likely than men to rely on household members.
People in your neighborhood Respondents from rural areas are significantly more likely than urban and
suburban respondents to rely on people in their neighborhood. Respondents 35 yrs and older are significantly more likely than respondents
under 35 yrs old to rely on people in their neighborhood. Women are significantly more likely than men to rely on people in their
neighborhood.

27
Who people expect to rely on in a disaster situation(demographic differences)
Fire, police, and emergency personnel Respondents from urban and suburban areas are significantly more likely than
rural respondents to rely on fire, police, and emergency personnel.
Respondents with a high school degree or more are significantly more likely than respondents with less than a high school degree to rely fire, police, and emergency personnel.
African American or Black respondents are considerably more likely than White respondents to rely on fire, police, and emergency personnel.
Women are significantly more likely than men to rely on fire, police, and emergency personnel.
State and Federal government agencies, including FEMA Respondents from urban and suburban areas are significantly more likely than
rural respondents to rely on state and Federal government agencies.
Respondents with a high school degree or less are significantly more likely than respondents with more than a high school degree to rely on state and Federal agencies.
African American or Black respondents are significantly more likely than White respondents to rely on state and Federal agencies.
Respondents who earn less than $25K are significantly more likely than respondents who earn $25K or more to rely on state and Federal agencies.
Women are significantly more likely than men to rely on state and Federal agencies.
28
Emergency plan and emergency supply kits
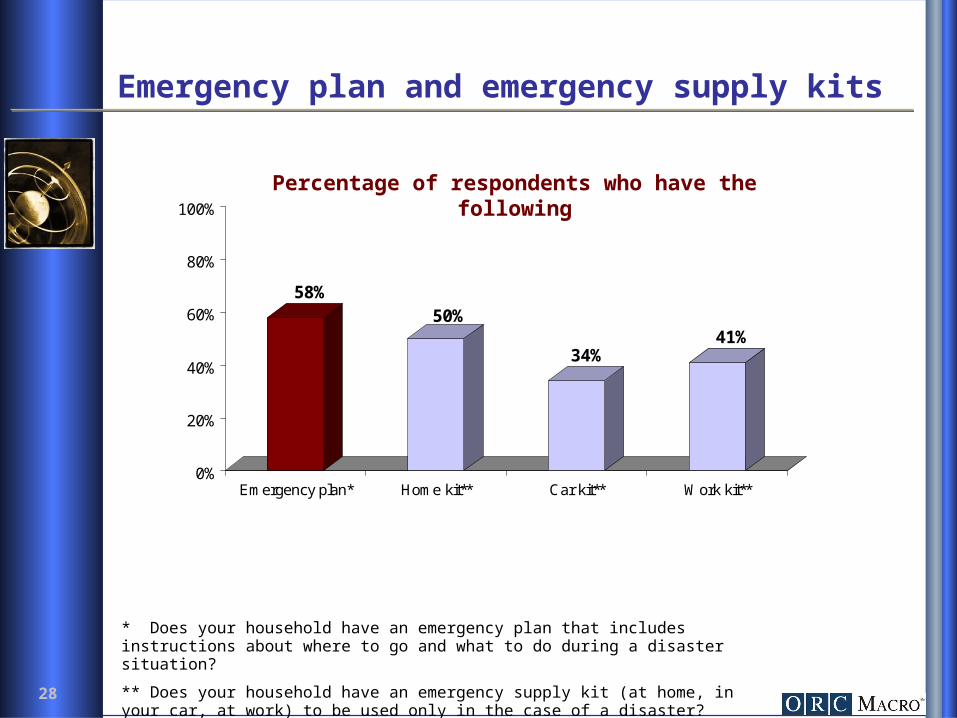
58%50%
34%41%
0%
20%
40%
60%
80%
100%
Emergency plan* Home kit** Car kit** Work kit**
Percentage of respondents who have the following
* Does your household have an emergency plan that includes instructions about where to go and what to do during a disaster situation?
** Does your household have an emergency supply kit (at home, in your car, at work) to be used only in the case of a disaster?

29
Emergency plan (demographic differences)
Emergency plan
Respondents from rural areas are significantly more likely than suburban and urban respondents to have an emergency plan.
Household with family members are significantly more likely than respondents who live alone or with roommates to have an emergency plan.
Respondents with a high school degree or more are significantly more likely than respondents with less than a high school degree to have an emergency plan.
White respondents are significantly more likely than African American or Black respondents to have an emergency plan.
Respondents 25 yrs and older are significantly more likely than respondents under 25 yrs old to have an emergency plan.

30
Home kit
Respondents from rural areas are significantly more likely than suburban and urban respondents to have an emergency supply kit at home.
Household with family members are significantly more likely than respondents who live alone or with roommates to have an emergency supply kit at home.
Respondents with a high school degree or more are significantly more likely than respondents with less than a high school degree to have an emergency supply kit at home.
White respondents are significantly more likely than African American or Black respondents to have an emergency supply kit at home.
Respondents of Hispanic origin are considerably more likely than non-Hispanic respondents to have an emergency supply kit at home.
Respondents who earn $25K or more are significantly more likely than respondents who earn less than $25K to have an emergency supply kit at home.
Men are considerably more likely than women to have an emergency supply kit at home.
Emergency supply kits (demographic differences)
31
Emergency supply kits (demographic differences)
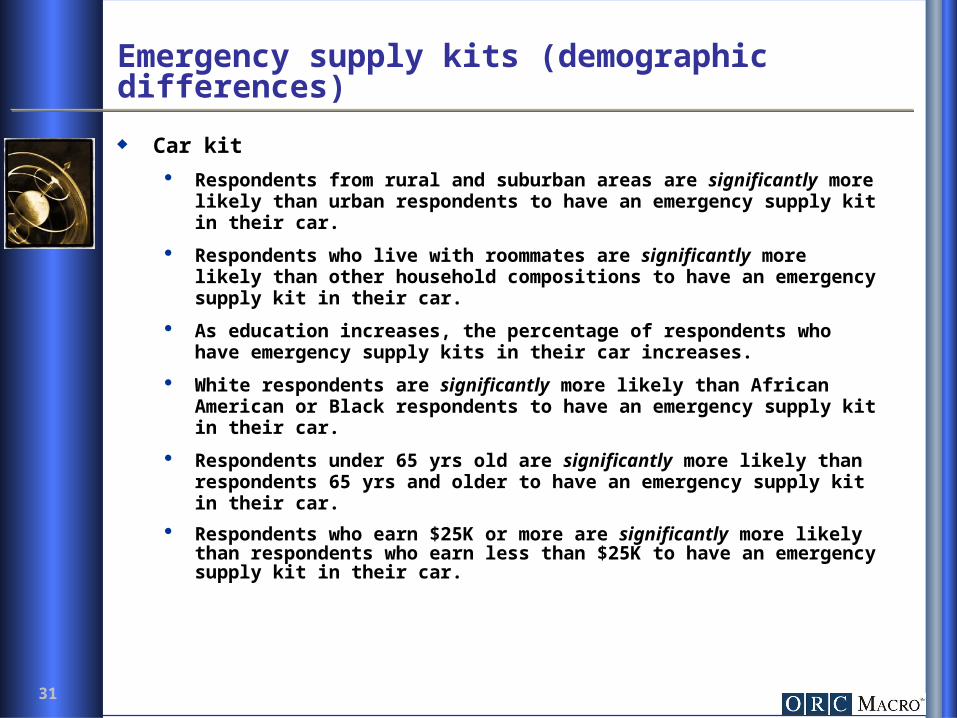
Car kit
Respondents from rural and suburban areas are significantly more likely than urban respondents to have an emergency supply kit in their car.
Respondents who live with roommates are significantly more likely than other household compositions to have an emergency supply kit in their car.
As education increases, the percentage of respondents who have emergency supply kits in their car increases.
White respondents are significantly more likely than African American or Black respondents to have an emergency supply kit in their car.
Respondents under 65 yrs old are significantly more likely than respondents 65 yrs and older to have an emergency supply kit in their car.
Respondents who earn $25K or more are significantly more likely than respondents who earn less than $25K to have an emergency supply kit in their car.
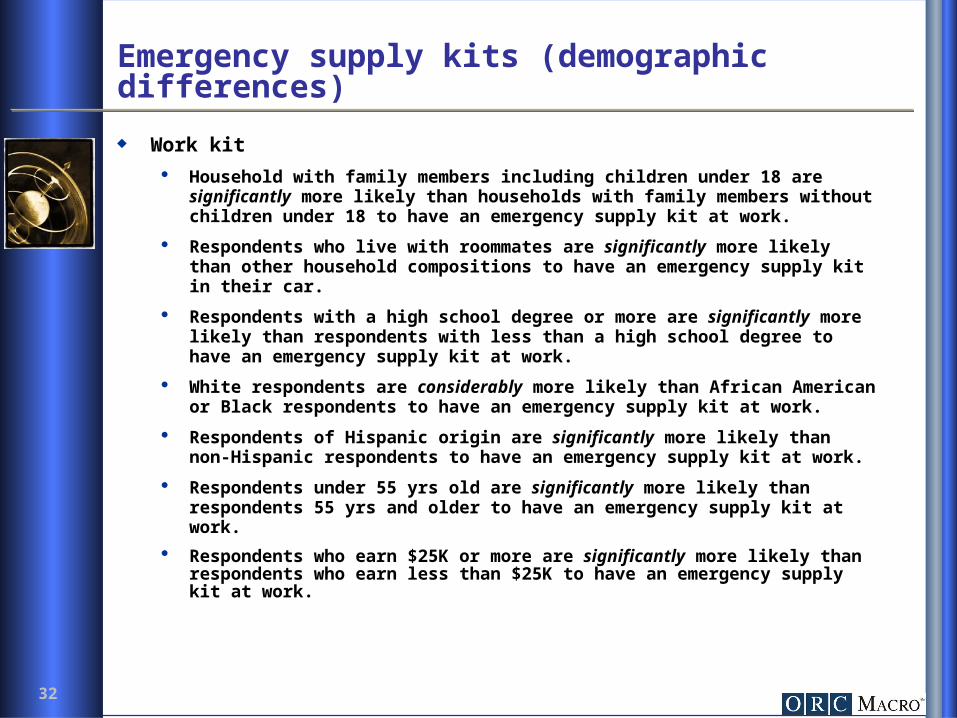
32
Work kit
Household with family members including children under 18 are significantly more likely than households with family members without children under 18 to have an emergency supply kit at work.
Respondents who live with roommates are significantly more likely than other household compositions to have an emergency supply kit in their car.
Respondents with a high school degree or more are significantly more likely than respondents with less than a high school degree to have an emergency supply kit at work.
White respondents are considerably more likely than African American or Black respondents to have an emergency supply kit at work.
Respondents of Hispanic origin are significantly more likely than non-Hispanic respondents to have an emergency supply kit at work.
Respondents under 55 yrs old are significantly more likely than respondents 55 yrs and older to have an emergency supply kit at work.
Respondents who earn $25K or more are significantly more likely than respondents who earn less than $25K to have an emergency supply kit at work.
Emergency supply kits (demographic differences)
33
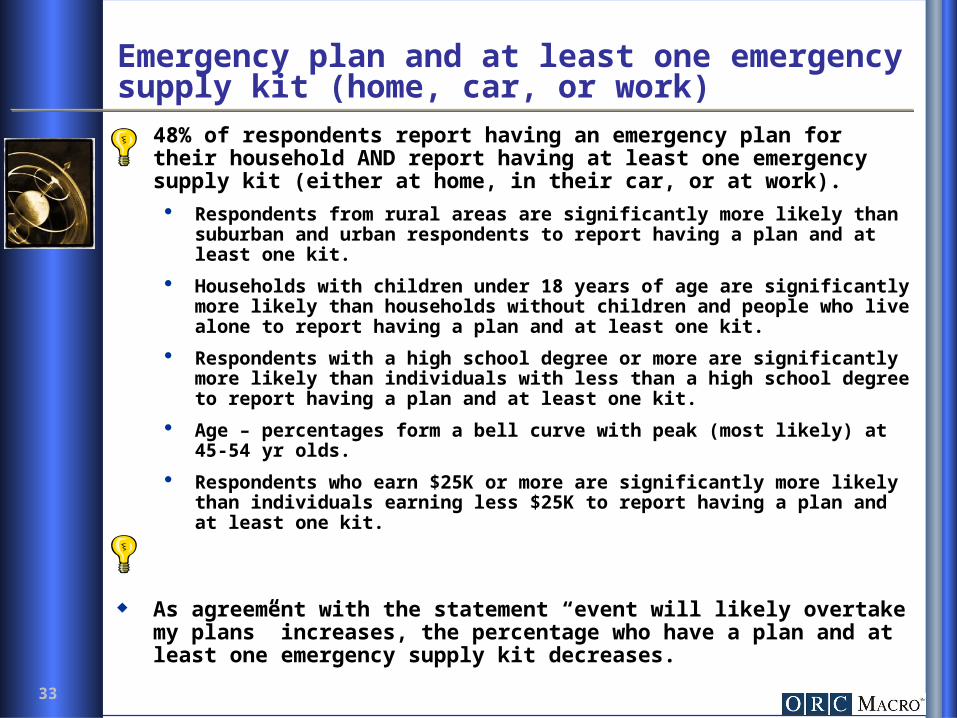
Emergency plan and at least one emergency supply kit (home, car, or work) 48% of respondents report having an emergency plan for their household
AND report having at least one emergency supply kit (either at home, in their car, or at work). Respondents from rural areas are significantly more likely than suburban and
urban respondents to report having a plan and at least one kit.
Households with children under 18 years of age are significantly more likely than households without children and people who live alone to report having a plan and at least one kit.
Respondents with a high school degree or more are significantly more likely than individuals with less than a high school degree to report having a plan and at least one kit.
Age – percentages form a bell curve with peak (most likely) at 45-54 yr olds.
Respondents who earn $25K or more are significantly more likely than individuals earning less $25K to report having a plan and at least one kit.
As agreement with the statement “event will likely overtake my plans” increases, the percentage who have a plan and at least one emergency supply kit decreases.
34
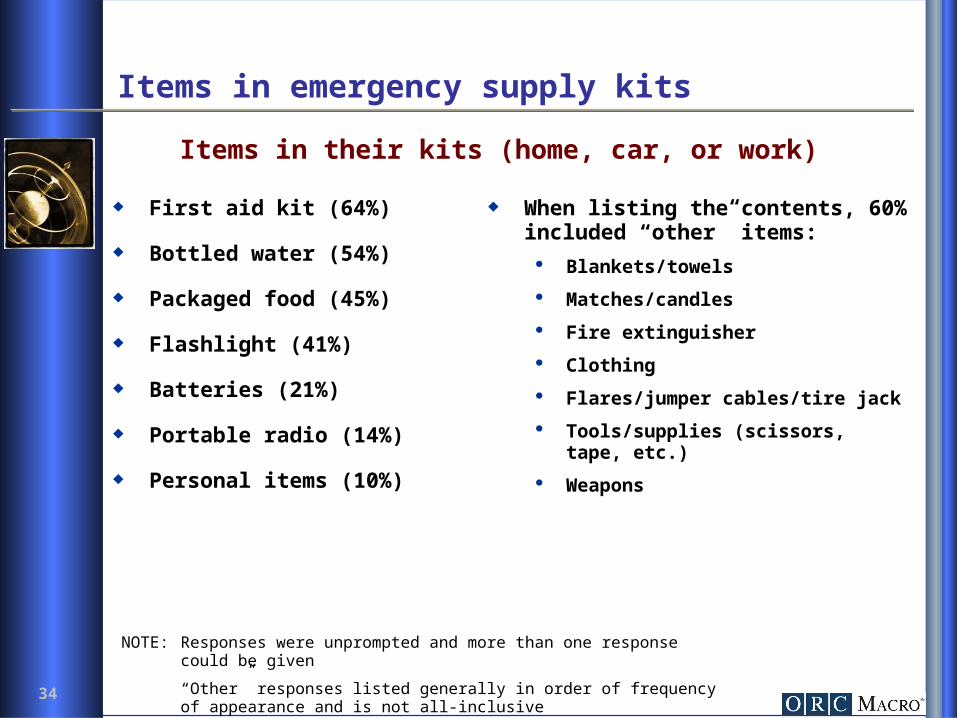
Items in emergency supply kits
First aid kit (64%)
Bottled water (54%)
Packaged food (45%)
Flashlight (41%)
Batteries (21%)
Portable radio (14%)
Personal items (10%)
NOTE: Responses were unprompted and more than one response could be given
“Other” responses listed generally in order of frequency of appearance and is not all-inclusive
Items in their kits (home, car, or work)
When listing the contents, 60% included “other” items:
Blankets/towels
Matches/candles
Fire extinguisher
Clothing
Flares/jumper cables/tire jack
Tools/supplies (scissors, tape, etc.)
Weapons

35
Reasons for not having an emergency supply kit 49% do not have supply kits at home*
24% don’t think it’s important
7% don’t know how to put one together
6% haven’t had time
4% think it’s too expensive
Of the 62% that said “other”, common responses included- Never thought of it/not worried about it- Apathy/procrastination/laziness- No reason/don’t know
NOTE: Only respondents who reported that they did not have an emergency supply kit at home were asked this question.
Responses were unprompted and more than one response could be given
* What is the main reason you do not have an emergency supply kit at home?
36
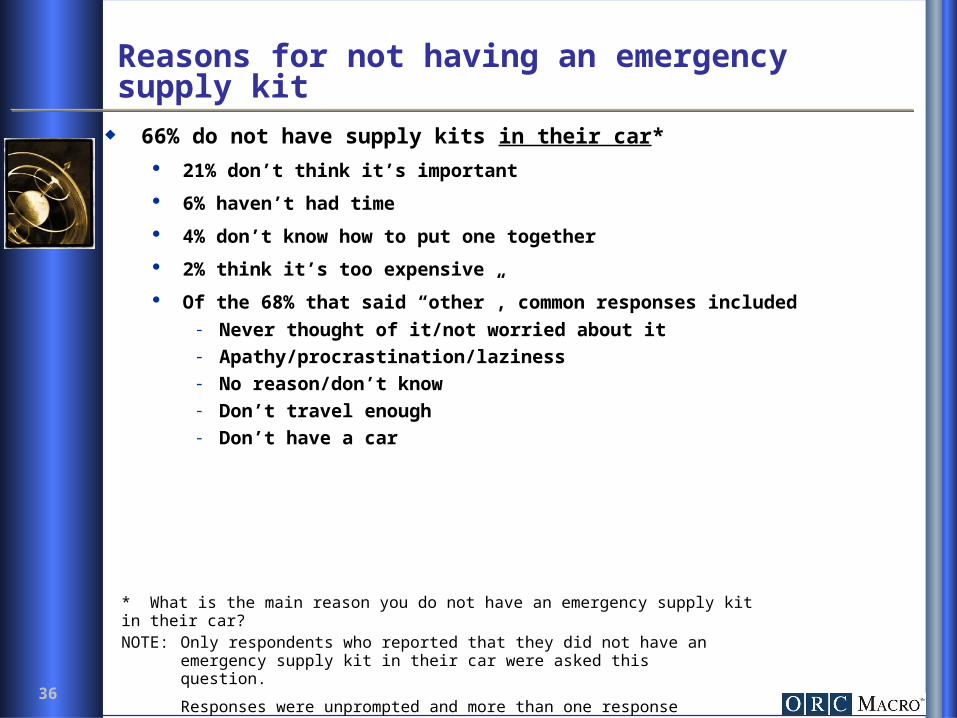
Reasons for not having an emergency supply kit 66% do not have supply kits in their car*
21% don’t think it’s important
6% haven’t had time
4% don’t know how to put one together
2% think it’s too expensive
Of the 68% that said “other”, common responses included- Never thought of it/not worried about it- Apathy/procrastination/laziness- No reason/don’t know- Don’t travel enough- Don’t have a car
NOTE: Only respondents who reported that they did not have an emergency supply kit in their car were asked this question.
Responses were unprompted and more than one response could be given
* What is the main reason you do not have an emergency supply kit in their car?

37
Reasons for not having an emergency supply kit 41% do not have supply kits at work*
11% don’t think it’s important
3% don’t know how to put one together
3% haven’t had time
1% think it’s too expensive
Of the 83% that said “other”, common responses included- Never thought of it/not worried about it- Apathy/procrastination/laziness- No reason/don’t know- Employer should supply it- Work from home
18% were retired or no longer working
NOTE: Only respondents who reported that they did not have an emergency supply kit at work were asked this question.
Responses were unprompted and more than one response could be given
* What is the main reason you do not have an emergency supply kit at work?

38
Action taken in the past 2 years
35% have done something in the past 2 years to increase their household’s preparedness for disaster*
Respondents from suburban areas are significantly more likely than rural respondents and considerably more likely than urban respondents to have done something to increase their preparedness in the past 2 years.
Households with children under 18 are significantly more likely than any other household composition to have done something in the past 2 years.
As education and income increase, the percentage of respondents who have done something in the past 2 years increases.
Respondents 55 yrs and older are significantly more likely than respondents under 55 to have done something in the past 2 years.
Women are considerably more likely than men to have done something in the past 2 years.
* Have you done anything in the past 2 years to increase your household’s preparedness for disaster?

39
Action taken in the past 2 years
Of those that have taken action in the past 2 years*:
58% have assembled disaster supplies
18% have put together/practiced a disaster plan
6% have become more aware of their surroundings
4% have held a household evacuation or other drill
Of the 30% that said “other”, common responses included- Added smoke detectors/fire alarms- New windows
NOTE: Only respondents who reported that they had taken action in the past 2 years were asked this question.
Responses were unprompted and more than one response could be given
* What kinds of action have you taken?
40
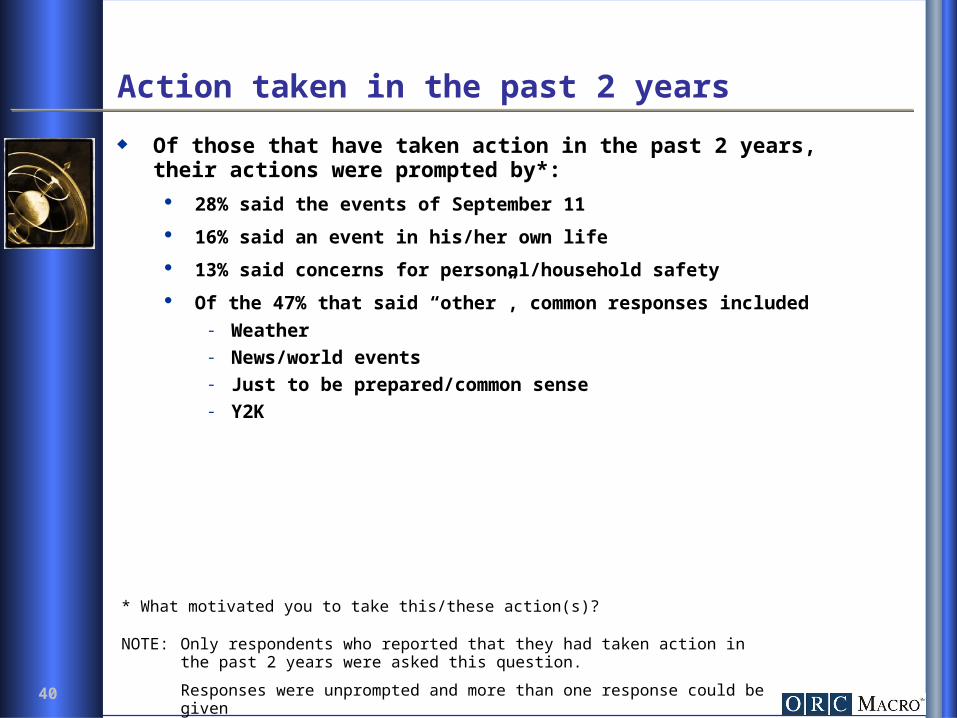
Action taken in the past 2 years
Of those that have taken action in the past 2 years, their actions were prompted by*:
28% said the events of September 11
16% said an event in his/her own life
13% said concerns for personal/household safety
Of the 47% that said “other”, common responses included- Weather- News/world events- Just to be prepared/common sense- Y2K
NOTE: Only respondents who reported that they had taken action in the past 2 years were asked this question.
Responses were unprompted and more than one response could be given
* What motivated you to take this/these action(s)?
41
Training
42
Confidence in ability to help someone
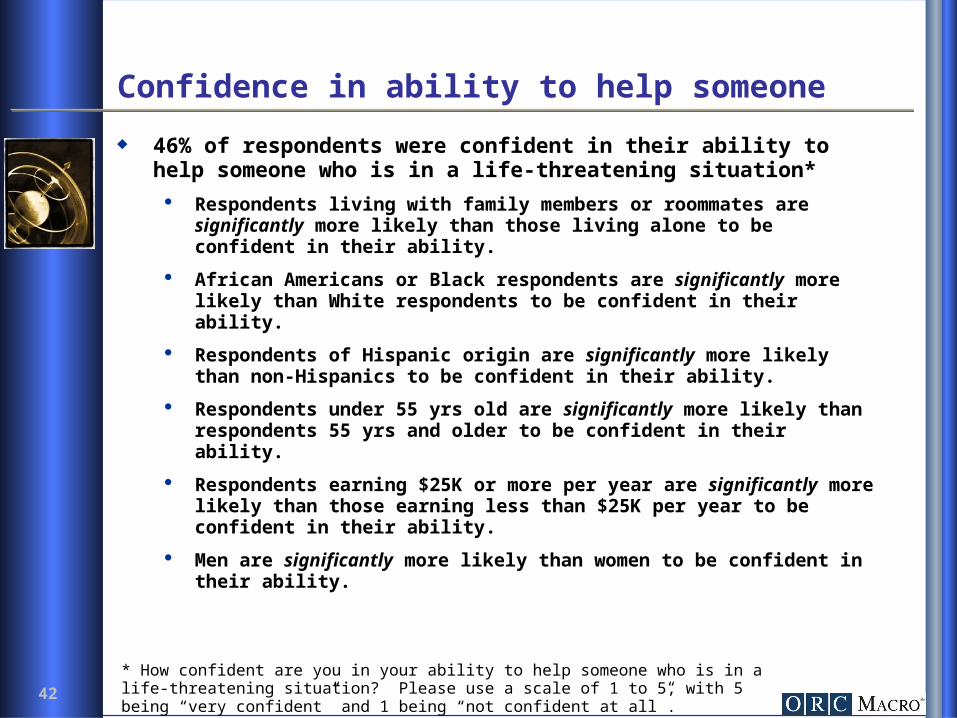
46% of respondents were confident in their ability to help someone who is in a life-threatening situation*
Respondents living with family members or roommates are significantly more likely than those living alone to be confident in their ability.
African Americans or Black respondents are significantly more likely than White respondents to be confident in their ability.
Respondents of Hispanic origin are significantly more likely than non-Hispanics to be confident in their ability.
Respondents under 55 yrs old are significantly more likely than respondents 55 yrs and older to be confident in their ability.
Respondents earning $25K or more per year are significantly more likely than those earning less than $25K per year to be confident in their ability.
Men are significantly more likely than women to be confident in their ability.
* How confident are you in your ability to help someone who is in a life-threatening situation? Please use a scale of 1 to 5, with 5 being “very confident” and 1 being “not confident at all”.
43
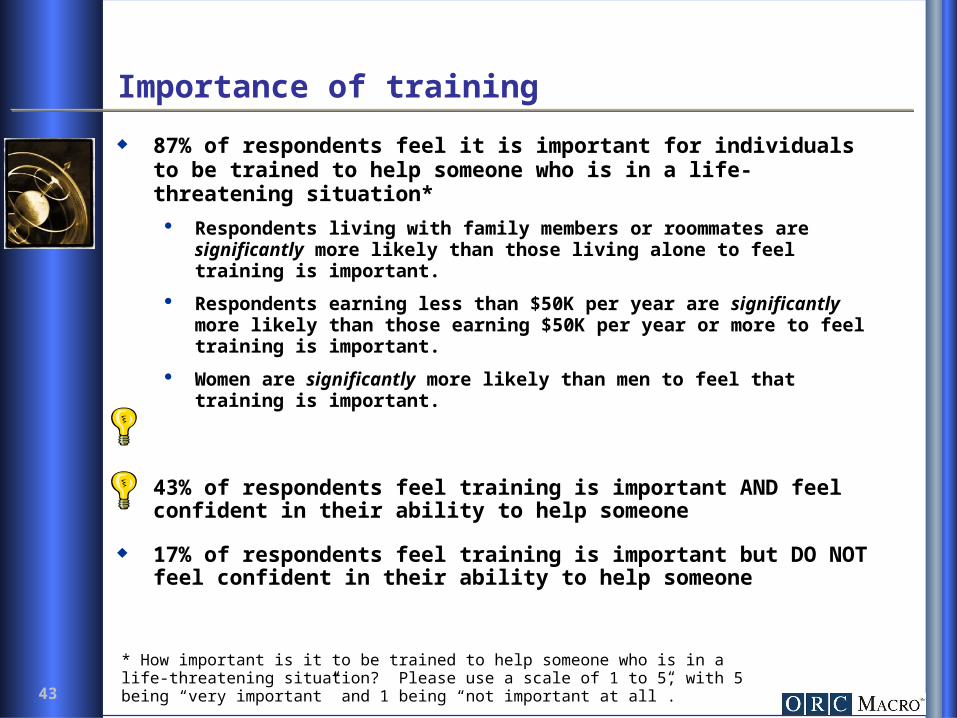
Importance of training
87% of respondents feel it is important for individuals to be trained to help someone who is in a life-threatening situation*
Respondents living with family members or roommates are significantly more likely than those living alone to feel training is important.
Respondents earning less than $50K per year are significantly more likely than those earning $50K per year or more to feel training is important.
Women are significantly more likely than men to feel that training is important.
43% of respondents feel training is important AND feel confident in their ability to help someone
17% of respondents feel training is important but DO NOT feel confident in their ability to help someone
* How important is it to be trained to help someone who is in a life-threatening situation? Please use a scale of 1 to 5, with 5 being “very important” and 1 being “not important at all”.
44
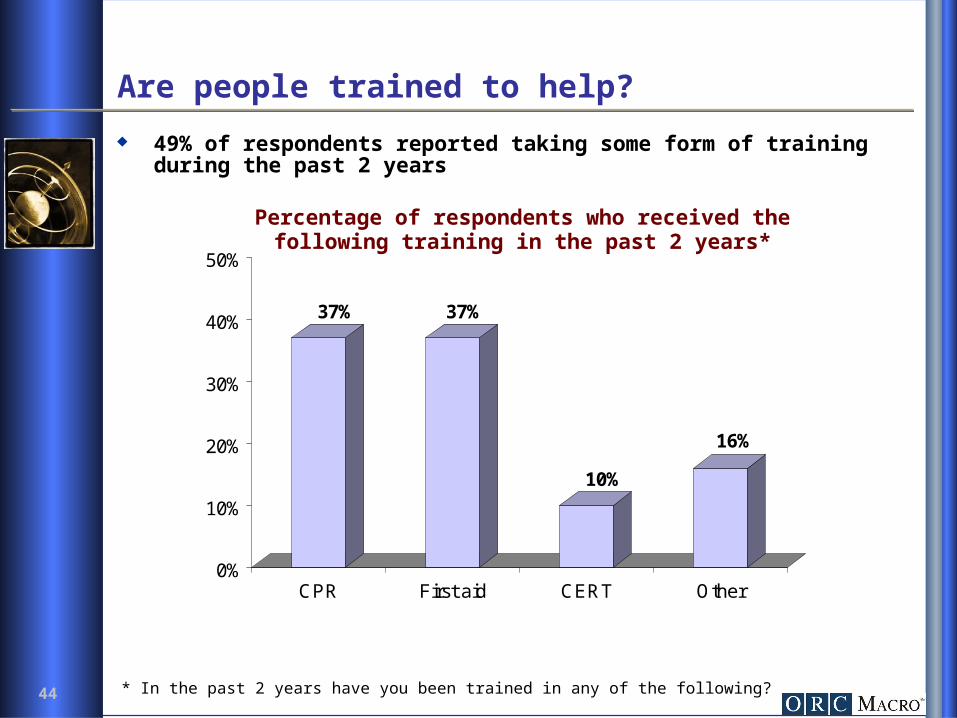
Are people trained to help?
49% of respondents reported taking some form of training during the past 2 years
37% 37%
10%
16%
0%
10%
20%
30%
40%
50%
CPR First aid CERT Other
Percentage of respondents who received the following training in the past 2 years*
* In the past 2 years have you been trained in any of the following?
45
Reason for getting or not getting training Reason for getting training*
Mandatory- job/school (47%) Out of concern (20%) General interest (11%) Of the 20% that said “other”, common responses included
- To be prepared/to help people- Because other family members did- Events in the world or personal life
Reason for not getting training** Lack of time (19%) Lack of interest (16%) Difficult to find (14%) Of the 53% that said “other”, common responses included
- Too old/retired- Never thought of it- Apathy/procrastination/laziness- Had training, but more than 2 yrs ago
NOTE: Responses were unprompted and more than one response could be given
* What motivated you to take the training?
** What is the main reason you have not received any training?
46
Neighborhood Preparedness
47
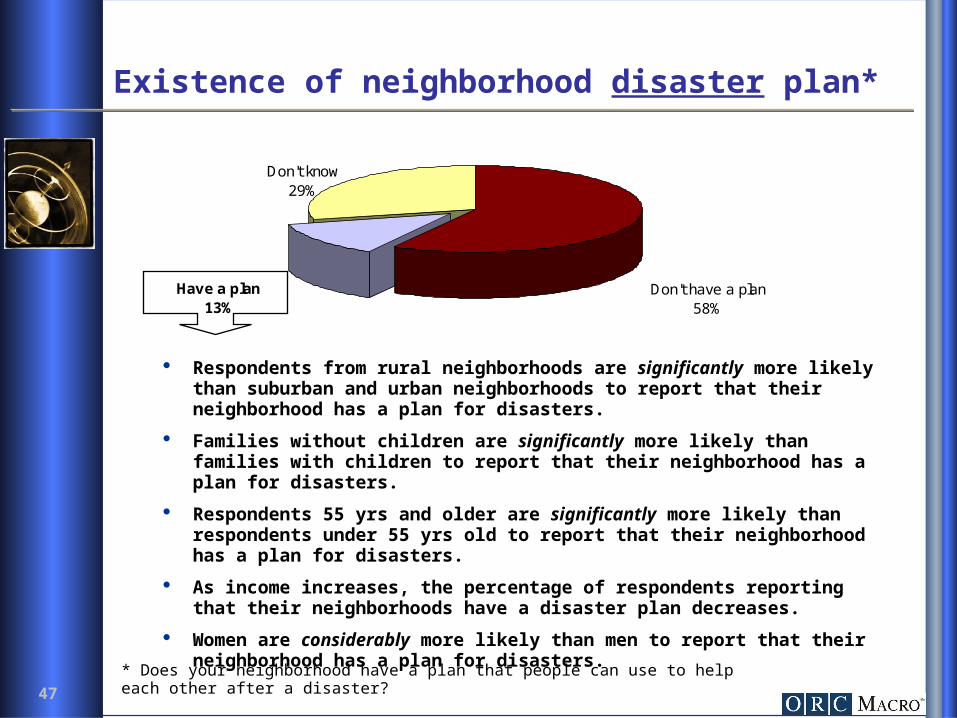
Existence of neighborhood disaster plan*
Respondents from rural neighborhoods are significantly more likely than suburban and urban neighborhoods to report that their neighborhood has a plan for disasters.
Families without children are significantly more likely than families with children to report that their neighborhood has a plan for disasters.
Respondents 55 yrs and older are significantly more likely than respondents under 55 yrs old to report that their neighborhood has a plan for disasters.
As income increases, the percentage of respondents reporting that their neighborhoods have a disaster plan decreases.
Women are considerably more likely than men to report that their neighborhood has a plan for disasters.
* Does your neighborhood have a plan that people can use to help each other after a disaster?
Don't have a plan58%
Have a plan13%
Don't know29%
48
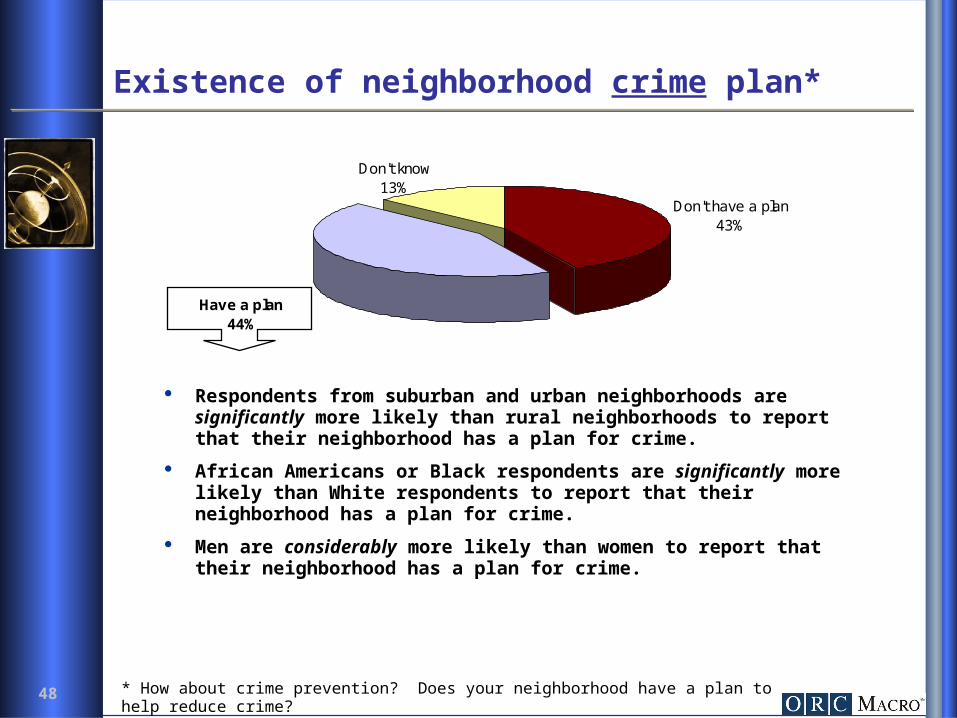
Existence of neighborhood crime plan*
Respondents from suburban and urban neighborhoods are significantly more likely than rural neighborhoods to report that their neighborhood has a plan for crime.
African Americans or Black respondents are significantly more likely than White respondents to report that their neighborhood has a plan for crime.
Men are considerably more likely than women to report that their neighborhood has a plan for crime.
* How about crime prevention? Does your neighborhood have a plan to help reduce crime?
Don't have a plan43%
Have a plan44%
Don't know13%
49
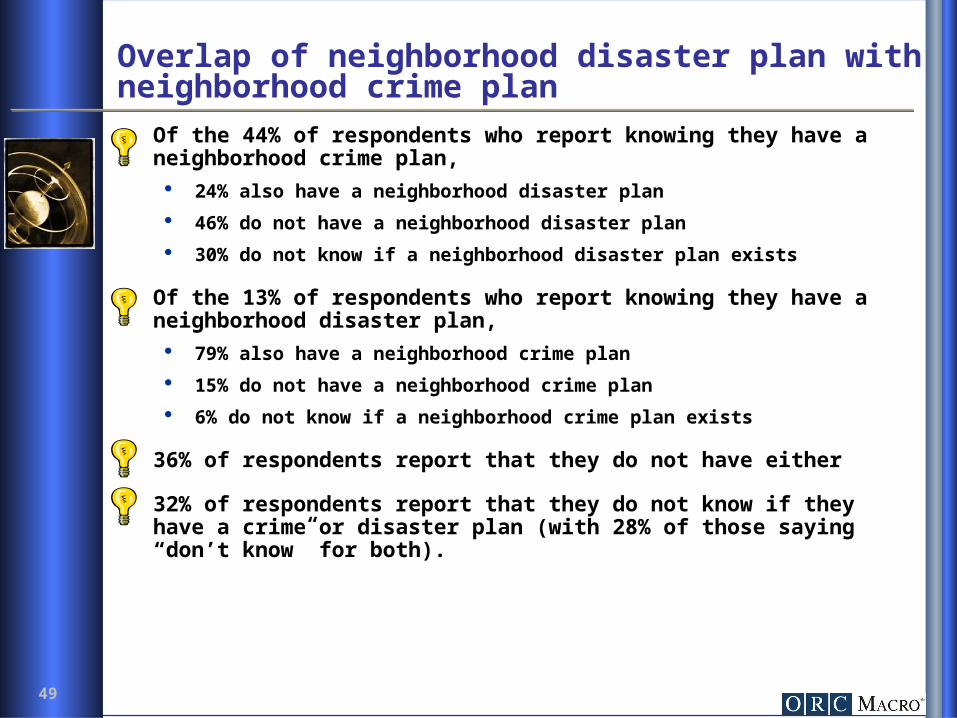
Overlap of neighborhood disaster plan with neighborhood crime plan Of the 44% of respondents who report knowing they have a neighborhood
crime plan, 24% also have a neighborhood disaster plan
46% do not have a neighborhood disaster plan
30% do not know if a neighborhood disaster plan exists
Of the 13% of respondents who report knowing they have a neighborhood disaster plan, 79% also have a neighborhood crime plan
15% do not have a neighborhood crime plan
6% do not know if a neighborhood crime plan exists
36% of respondents report that they do not have either
32% of respondents report that they do not know if they have a crime or disaster plan (with 28% of those saying “don’t know” for both).

50
Overlap of neighborhood plans (disaster and crime) with household emergency plans Respondents who report that they have neighborhood disaster plans are
almost 4 times more likely to report also having household emergency plans.
Respondents who report that they have neighborhood crime plans are almost twice as likely to report having a household emergency plan.
People who don’t have neighborhood plans or don’t know whether they exist (either disaster or crime), are no more or less likely to have a household emergency plan.

51
Importance of a neighborhood working together
63% feel that it is important that their neighborhood has a way to work together on these issues*
Respondents from urban neighborhoods are significantly more likely than rural and suburban neighborhoods to feel that neighborhoods working together is important.
As education and income increase, the percentage of respondents who feel that neighborhoods working together is important decreases.
African Americans or Black respondents are significantly more likely than White respondents to feel that neighborhoods working together is important.
Respondents of Hispanic origin are significantly more likely than non-Hispanics to feel that neighborhoods working together is important.
Women are significantly more likely than men to feel that neighborhoods working together is important.
* How important is it to you that your neighborhood has a way to work together on these issues? Please use a scale of 1 to 5, with 5 being “very important” and 1 being “not important at all”.
52
Likelihood to develop a neighborhood plan if government provided support
70% said that their neighborhood would be more likely to develop a neighborhood plan or group if a local government or community organization provided support*
Respondents from urban and suburban neighborhoods are significantly more likely than rural neighborhoods to develop a neighborhood plan if support was provided.
African Americans or Black respondents are significantly more likely than White respondents to develop a neighborhood plan if support was provided.
Respondents of Hispanic origin are considerably more likely than non-Hispanics to develop a neighborhood plan if support was provided.
Women are considerably more likely than men to develop a neighborhood plan if support was provided.
* Would your neighborhood be more likely to develop a neighborhood plan or group if a local government or community organization provided support?

53
Best way for an organization to provide information
According to respondents, the best ways for an organization to provide respondents with information on disaster preparedness or crime prevention are*: Regular mail (41%)
TV or radio (24%)
Local newspaper (15%)
Community events (14%)
Personal contact (10%)
The Web (6%)
E-mail (6%)
Of the 29% that said “other”, common responses included- Town meetings- Through police and local authorities- Brochures/flyers/pamphlets
NOTE: Responses were unprompted and more than one response could be given
* What would be the best way for an organization to provide you with information about disaster preparedness and crime prevention?
54
Volunteer Service
55
Volunteerism in the past 2 years
22% of respondents have volunteered time to help support emergency personnel, such as fire, police, or medical services, or with an organization that focuses on community safety, such as the Red Cross or Neighborhood Watch in the past 2 years* Respondents from rural neighborhoods are significantly more likely than
respondents from urban and suburban neighborhoods to have volunteered in the past 2 years.
Respondents with more than a high school degree are significantly more likely than respondents with a high school degree or less to have volunteered in the past 2 years.
Respondents earning $25K or more are significantly more likely than respondents earning less than $25K to have volunteered in the past 2 years.
Men are considerably more likely than women to have volunteered in the past 2 years.
* During the past 2 years, have you volunteered any time to help support emergency personnel, such as fire, police, or medical services, or with an organization that focuses on community safety, such as the Red Cross or Neighborhood Watch?
56
Reason for volunteering or not volunteering Motivation for volunteering*
Want to help community (53%) Relative or friend volunteers (10%) A disaster situation (8%) Of the 28% that said “other”, common responses included
- Because they needed help/they asked- Because of work
Reason for not volunteering** Lack of time (42%) Lack of information about how to volunteer (11%) Already volunteering for other causes (8%) Do not want to volunteer (6%) Of the 39% that said “other”, common responses included
- Age/health concerns- Never thought of it/never asked- No organizations near me/help not needed in my area
NOTE: Responses were unprompted and more than one response could be given
* What motivated you to volunteer?
** What are the main reasons why you have not volunteered in these areas?
57
Volunteerism after disasters
28% of respondents have volunteered in the past after a disaster* Respondents from rural neighborhoods are significantly more likely than
respondents from urban and suburban neighborhoods to have volunteered after a disaster.
As education increases, the percentage of respondents who have volunteered after a disaster increases.
White respondents are significantly more likely than African American or Black respondents to have volunteered after a disaster.
Respondents 35 yrs and older are significantly more likely than respondents under 35 yrs old to have volunteered after a disaster.
Respondents earning $25K or more are significantly more likely than respondents earning less than $25K to have volunteered after a disaster.
Men are significantly more likely than women to have volunteered after a disaster.
* Have you volunteered in the past after a disaster?
58
Awareness of opportunities to volunteer
30% of respondents are aware of opportunities in their community to volunteer to provide general support to emergency personnel or with community safety and preparedness programs.
As education increases, the percentage of respondents who are aware of opportunities to volunteer increases.
White respondents are considerably more likely than African American or Black respondents to be aware of opportunities to volunteer.
Respondents 35 yrs and older are significantly more likely than respondents under 35 yrs old to be aware of opportunities to volunteer.
Respondents earning $25K or more are significantly more likely than respondents earning less than $25K to have volunteered after a disaster.
* Are you aware of any opportunities in your community to volunteer to provide general support to emergency personnel or with community safety and preparedness programs?
59
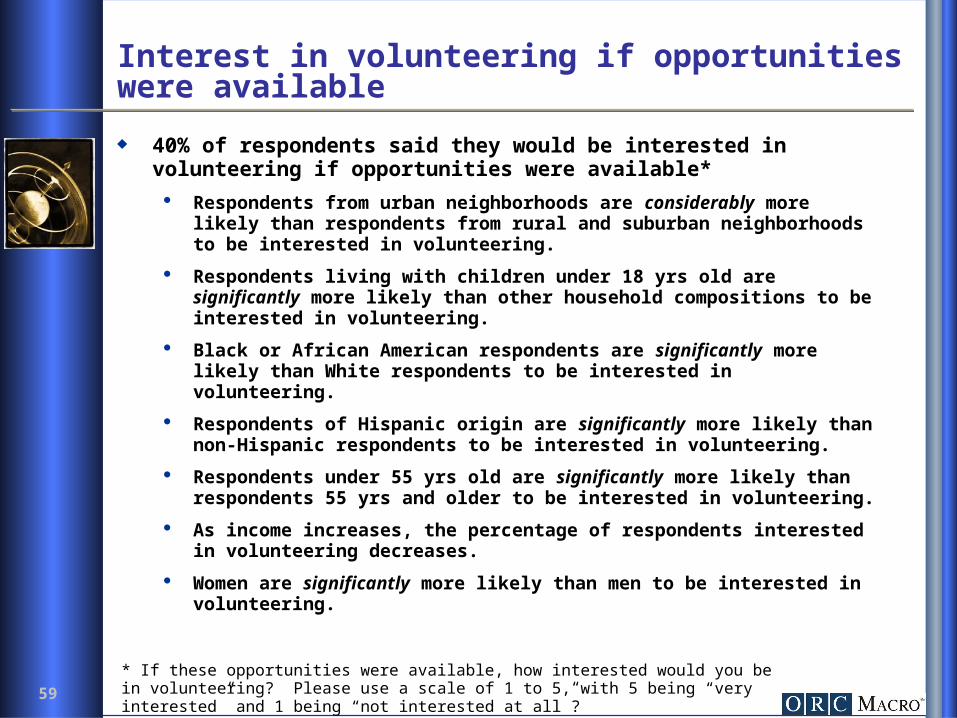
Interest in volunteering if opportunities were available
40% of respondents said they would be interested in volunteering if opportunities were available*
Respondents from urban neighborhoods are considerably more likely than respondents from rural and suburban neighborhoods to be interested in volunteering.
Respondents living with children under 18 yrs old are significantly more likely than other household compositions to be interested in volunteering.
Black or African American respondents are significantly more likely than White respondents to be interested in volunteering.
Respondents of Hispanic origin are significantly more likely than non-Hispanic respondents to be interested in volunteering.
Respondents under 55 yrs old are significantly more likely than respondents 55 yrs and older to be interested in volunteering.
As income increases, the percentage of respondents interested in volunteering decreases.
Women are significantly more likely than men to be interested in volunteering.
* If these opportunities were available, how interested would you be in volunteering? Please use a scale of 1 to 5, with 5 being “very interested” and 1 being “not interested at all”?
60
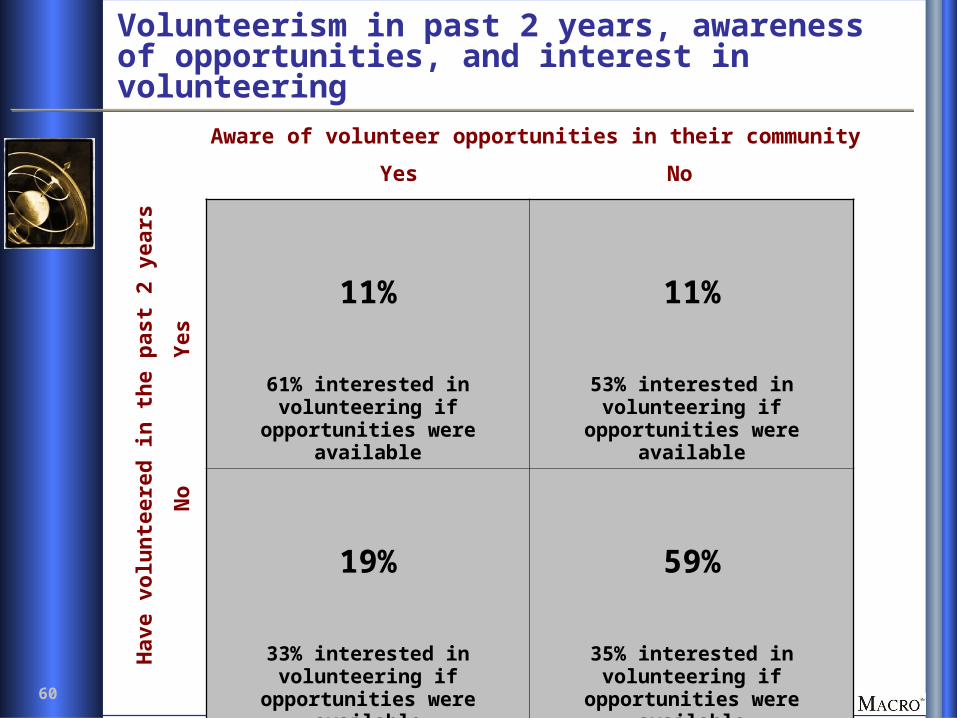
Volunteerism in past 2 years, awareness of opportunities, and interest in volunteering
11%
61% interested in volunteering if opportunities were available
11%
53% interested in volunteering if opportunities were available
19%
33% interested in volunteering if opportunities were available
59%
35% interested in volunteering if opportunities were available
Aware of volunteer opportunities in their community
Yes NoH
ave
volu
nte
ered
in t
he
pas
t 2
year
s
N
oY
es

61
Finding information on volunteer opportunities
If respondents wanted to find more information on volunteering opportunities, they said they would*: Search the Internet (17%)
Contact the organization directly (16%)
Contact state or local government (16%)
Contact police or fire department (15%)
Talk to friends or family (8%)
Go directly to organization’s website (6%)
Of the 38% that said “other”, common responses included:- TV, radio, newspapers- Contact Red Cross specifically- Word of mouth
* If you wanted to participate in these volunteer activities, how would you find more information about specific opportunities?
NOTE: Responses were unprompted and more than one response could be given

62
Awareness of Citizen Corps
63
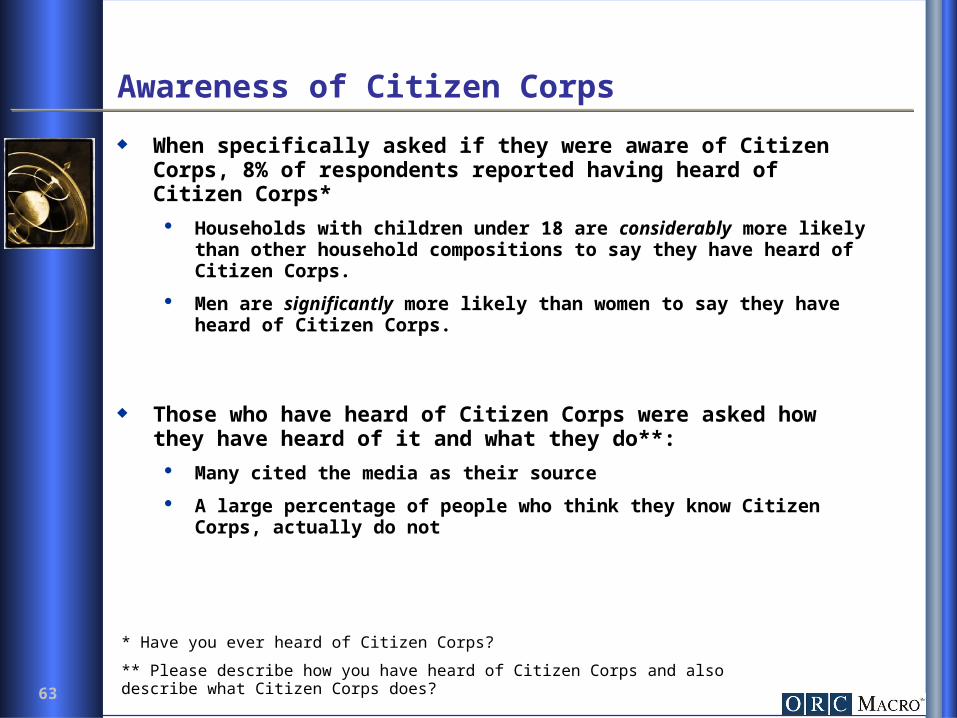
Awareness of Citizen Corps
When specifically asked if they were aware of Citizen Corps, 8% of respondents reported having heard of Citizen Corps*
Households with children under 18 are considerably more likely than other household compositions to say they have heard of Citizen Corps.
Men are significantly more likely than women to say they have heard of Citizen Corps.
Those who have heard of Citizen Corps were asked how they have heard of it and what they do**:
Many cited the media as their source
A large percentage of people who think they know Citizen Corps, actually do not
* Have you ever heard of Citizen Corps?
** Please describe how you have heard of Citizen Corps and also describe what Citizen Corps does?

64
Appendices
65
Appendix A: Region Profiles
66
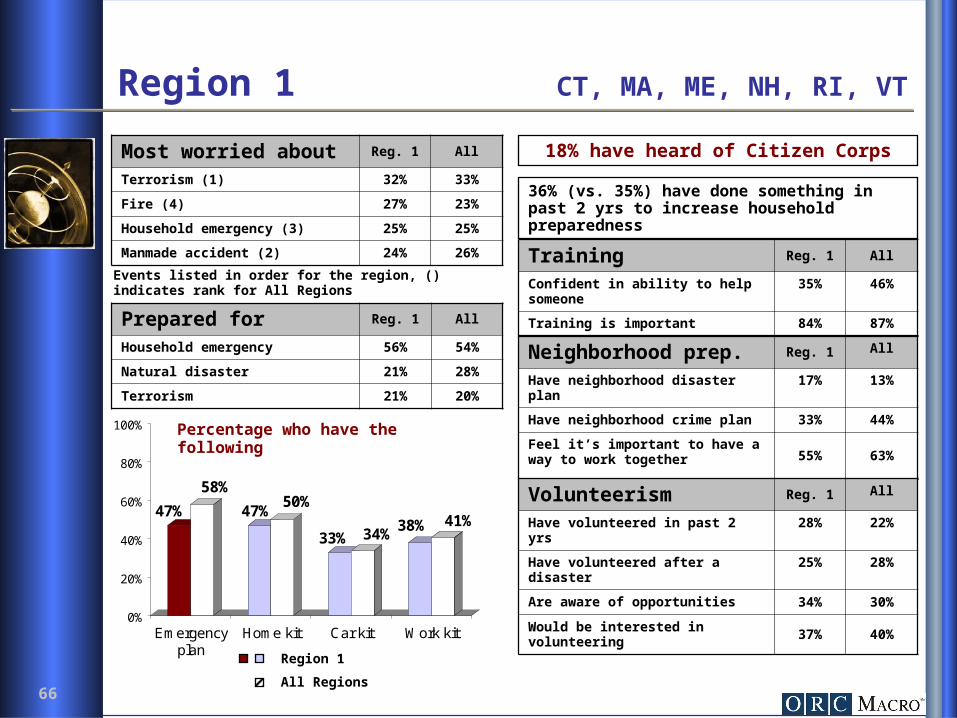
Region 1 CT, MA, ME, NH, RI, VT
Prepared for Reg. 1 All
Household emergency 56% 54%
Natural disaster 21% 28%
Terrorism 21% 20%
36% (vs. 35%) have done something in past 2 yrs to increase household preparedness
Most worried about Reg. 1 All
Terrorism (1) 32% 33%
Fire (4) 27% 23%
Household emergency (3) 25% 25%
Manmade accident (2) 24% 26%
47%
58%
47%50%
33% 34%38% 41%
0%
20%
40%
60%
80%
100%
Emergencyplan
Home kit Car kit Work kit
Percentage who have the following
Region 1
All Regions
Training Reg. 1 All
Confident in ability to help someone 35% 46%
Training is important 84% 87%
Neighborhood prep. Reg. 1 All
Have neighborhood disaster plan 17% 13%
Have neighborhood crime plan 33% 44%
Feel it’s important to have a way to work together 55% 63%
Volunteerism Reg. 1 All
Have volunteered in past 2 yrs 28% 22%
Have volunteered after a disaster 25% 28%
Are aware of opportunities 34% 30%
Would be interested in volunteering 37% 40%
18% have heard of Citizen Corps
Events listed in order for the region, () indicates rank for All Regions
67
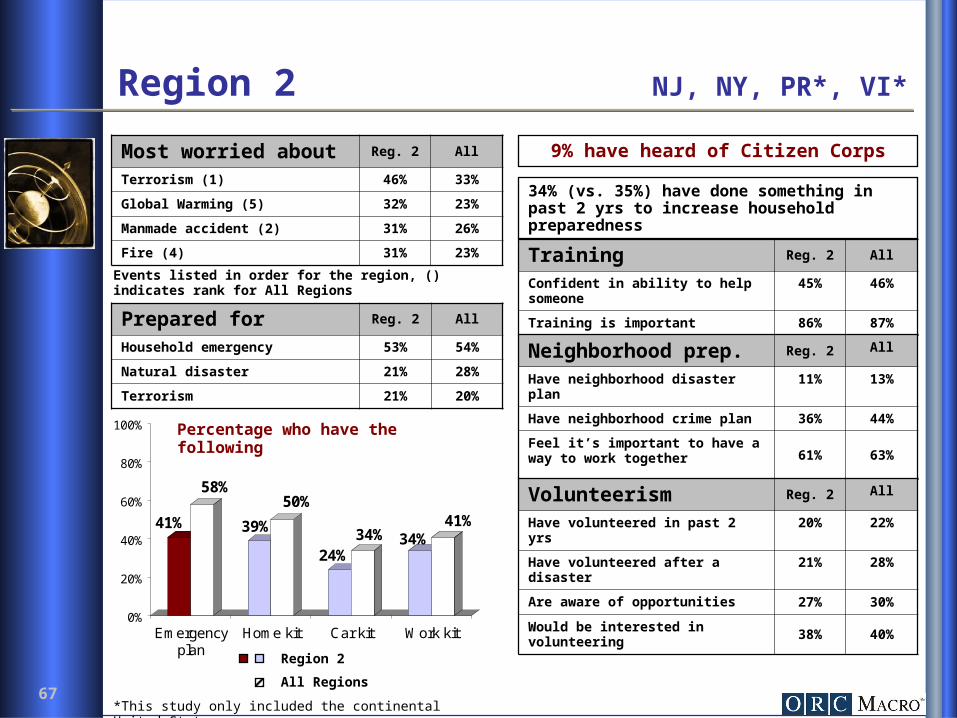
Region 2 NJ, NY, PR*, VI*
Prepared for Reg. 2 All
Household emergency 53% 54%
Natural disaster 21% 28%
Terrorism 21% 20%
34% (vs. 35%) have done something in past 2 yrs to increase household preparedness
Most worried about Reg. 2 All
Terrorism (1) 46% 33%
Global Warming (5) 32% 23%
Manmade accident (2) 31% 26%
Fire (4) 31% 23%
41%
58%
39%
50%
24%34% 34%
41%
0%
20%
40%
60%
80%
100%
Emergencyplan
Home kit Car kit Work kit
Percentage who have the following
Region 2
All Regions
Training Reg. 2 All
Confident in ability to help someone 45% 46%
Training is important 86% 87%
Neighborhood prep. Reg. 2 All
Have neighborhood disaster plan 11% 13%
Have neighborhood crime plan 36% 44%
Feel it’s important to have a way to work together 61% 63%
Volunteerism Reg. 2 All
Have volunteered in past 2 yrs 20% 22%
Have volunteered after a disaster 21% 28%
Are aware of opportunities 27% 30%
Would be interested in volunteering 38% 40%
9% have heard of Citizen Corps
*This study only included the continental United States.
Events listed in order for the region, () indicates rank for All Regions
68
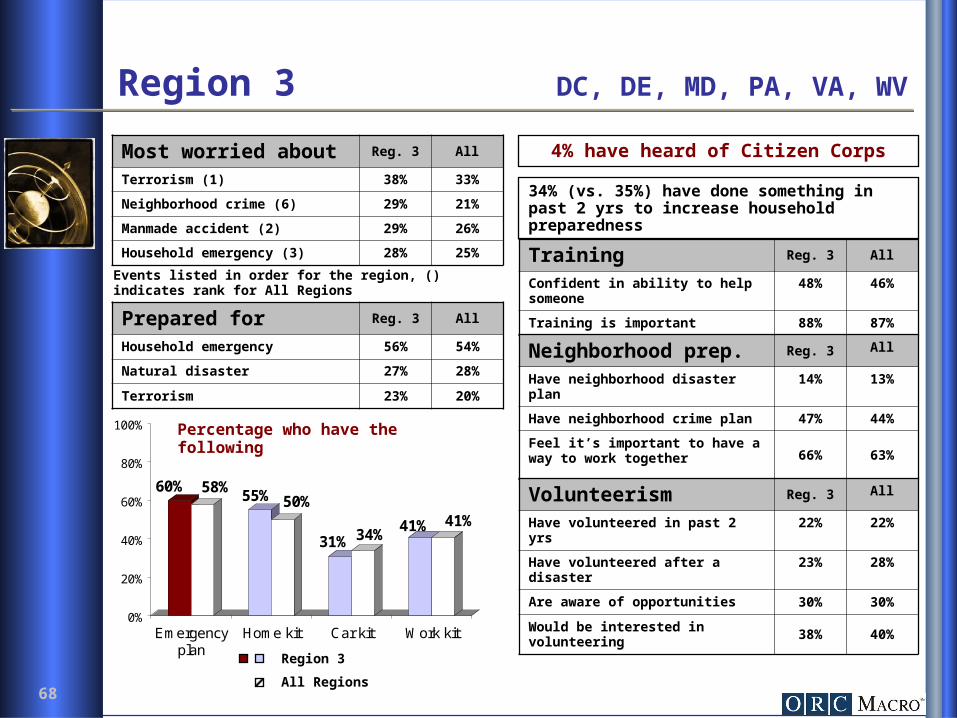
Region 3 DC, DE, MD, PA, VA, WV
Prepared for Reg. 3 All
Household emergency 56% 54%
Natural disaster 27% 28%
Terrorism 23% 20%
34% (vs. 35%) have done something in past 2 yrs to increase household preparedness
Most worried about Reg. 3 All
Terrorism (1) 38% 33%
Neighborhood crime (6) 29% 21%
Manmade accident (2) 29% 26%
Household emergency (3) 28% 25%
60% 58%55% 50%
31% 34%41% 41%
0%
20%
40%
60%
80%
100%
Emergencyplan
Home kit Car kit Work kit
Percentage who have the following
Region 3
All Regions
Training Reg. 3 All
Confident in ability to help someone 48% 46%
Training is important 88% 87%
Neighborhood prep. Reg. 3 All
Have neighborhood disaster plan 14% 13%
Have neighborhood crime plan 47% 44%
Feel it’s important to have a way to work together 66% 63%
Volunteerism Reg. 3 All
Have volunteered in past 2 yrs 22% 22%
Have volunteered after a disaster 23% 28%
Are aware of opportunities 30% 30%
Would be interested in volunteering 38% 40%
4% have heard of Citizen Corps
Events listed in order for the region, () indicates rank for All Regions
69
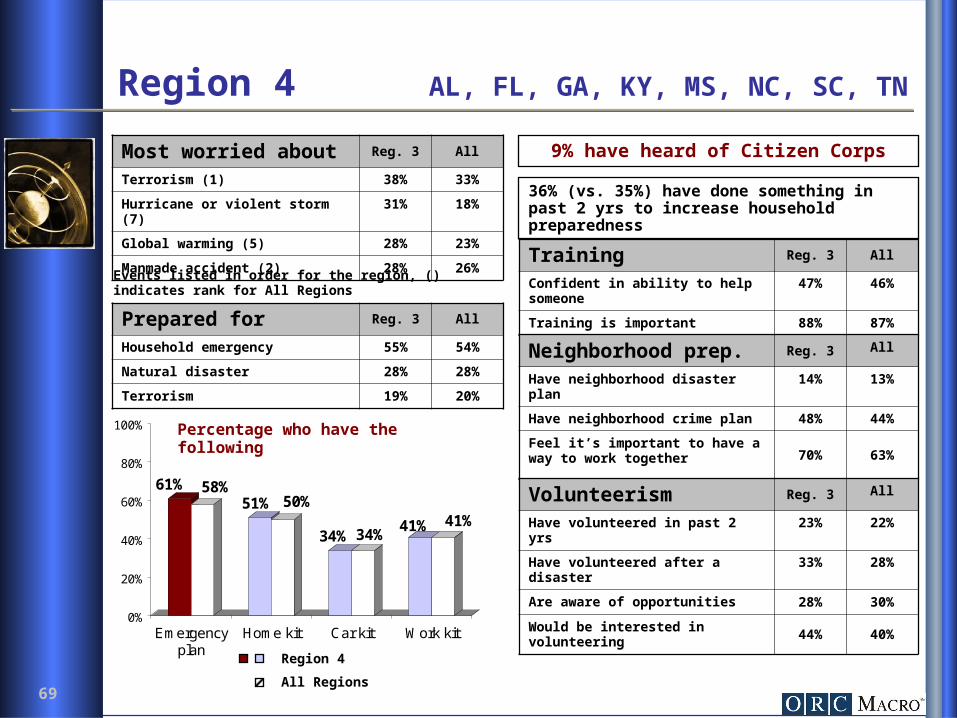
Region 4 AL, FL, GA, KY, MS, NC, SC, TN
Prepared for Reg. 3 All
Household emergency 55% 54%
Natural disaster 28% 28%
Terrorism 19% 20%
36% (vs. 35%) have done something in past 2 yrs to increase household preparedness
Most worried about Reg. 3 All
Terrorism (1) 38% 33%
Hurricane or violent storm (7) 31% 18%
Global warming (5) 28% 23%
Manmade accident (2) 28% 26%
61% 58%51% 50%
34% 34%41% 41%
0%
20%
40%
60%
80%
100%
Emergencyplan
Home kit Car kit Work kit
Percentage who have the following
Region 4
All Regions
Training Reg. 3 All
Confident in ability to help someone 47% 46%
Training is important 88% 87%
Neighborhood prep. Reg. 3 All
Have neighborhood disaster plan 14% 13%
Have neighborhood crime plan 48% 44%
Feel it’s important to have a way to work together 70% 63%
Volunteerism Reg. 3 All
Have volunteered in past 2 yrs 23% 22%
Have volunteered after a disaster 33% 28%
Are aware of opportunities 28% 30%
Would be interested in volunteering 44% 40%
9% have heard of Citizen Corps
Events listed in order for the region, () indicates rank for All Regions
70
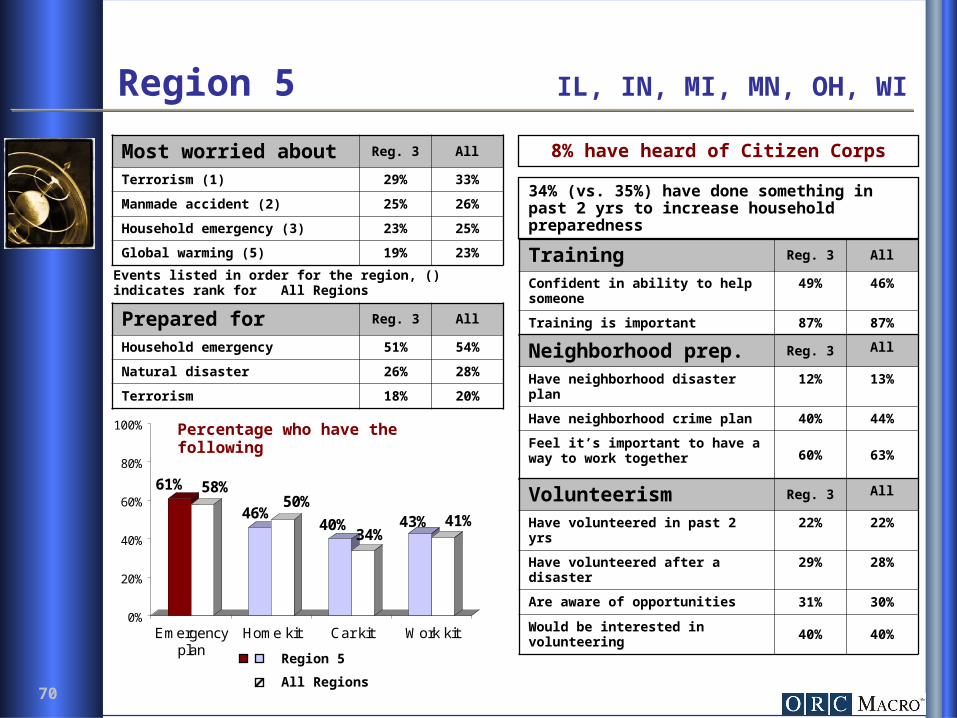
Region 5 IL, IN, MI, MN, OH, WI
Prepared for Reg. 3 All
Household emergency 51% 54%
Natural disaster 26% 28%
Terrorism 18% 20%
34% (vs. 35%) have done something in past 2 yrs to increase household preparedness
Most worried about Reg. 3 All
Terrorism (1) 29% 33%
Manmade accident (2) 25% 26%
Household emergency (3) 23% 25%
Global warming (5) 19% 23%
61% 58%
46%50%
40%34%
43% 41%
0%
20%
40%
60%
80%
100%
Emergencyplan
Home kit Car kit Work kit
Percentage who have the following
Region 5
All Regions
Training Reg. 3 All
Confident in ability to help someone 49% 46%
Training is important 87% 87%
Neighborhood prep. Reg. 3 All
Have neighborhood disaster plan 12% 13%
Have neighborhood crime plan 40% 44%
Feel it’s important to have a way to work together 60% 63%
Volunteerism Reg. 3 All
Have volunteered in past 2 yrs 22% 22%
Have volunteered after a disaster 29% 28%
Are aware of opportunities 31% 30%
Would be interested in volunteering 40% 40%
8% have heard of Citizen Corps
Events listed in order for the region, () indicates rank for All Regions

71
Region 6 AR, LA, NM, OK, TX
Prepared for Reg. 3 All
Household emergency 51% 54%
Natural disaster 34% 28%
Terrorism 23% 20%
35% (vs. 35%) have done something in past 2 yrs to increase household preparedness
Most worried about Reg. 3 All
Hurricane or violent storm (7) 29% 18%
Manmade accident (2) 26% 26%
Household emergency (3) 26% 25%
Terrorism (1) 25% 33%
64% 58%53% 50%
35% 34% 38%41%
0%
20%
40%
60%
80%
100%
Emergencyplan
Home kit Car kit Work kit
Percentage who have the following
Region 6
All Regions
Training Reg. 3 All
Confident in ability to help someone 45% 46%
Training is important 83% 87%
Neighborhood prep. Reg. 3 All
Have neighborhood disaster plan 16% 13%
Have neighborhood crime plan 46% 44%
Feel it’s important to have a way to work together 63% 63%
Volunteerism Reg. 3 All
Have volunteered in past 2 yrs 25% 22%
Have volunteered after a disaster 29% 28%
Are aware of opportunities 34% 30%
Would be interested in volunteering 42% 40%
6% have heard of Citizen Corps
Events listed in order for the region, () indicates rank for All Regions

72
Region 7 IA, KS, MO, NE
Prepared for Reg. 3 All
Household emergency 58% 54%
Natural disaster 31% 28%
Terrorism 18% 20%
27% (vs. 35%) have done something in past 2 yrs to increase household preparedness
Most worried about Reg. 3 All
Terrorism (1) 28% 33%
Household emergency (3) 21% 25%
Fire (4) 19% 23%
Global Warming (5) 19% 23%
67%58%
43%50%
25%34% 37%
41%
0%
20%
40%
60%
80%
100%
Emergencyplan
Home kit Car kit Work kit
Percentage who have the following
Region 7
All Regions
Training Reg. 3 All
Confident in ability to help someone 45% 46%
Training is important 91% 87%
Neighborhood prep. Reg. 3 All
Have neighborhood disaster plan 9% 13%
Have neighborhood crime plan 41% 44%
Feel it’s important to have a way to work together 60% 63%
Volunteerism Reg. 3 All
Have volunteered in past 2 yrs 19% 22%
Have volunteered after a disaster 36% 28%
Are aware of opportunities 24% 30%
Would be interested in volunteering 39% 40%
5% have heard of Citizen Corps
Events listed in order for the region, () indicates rank for All Regions
73
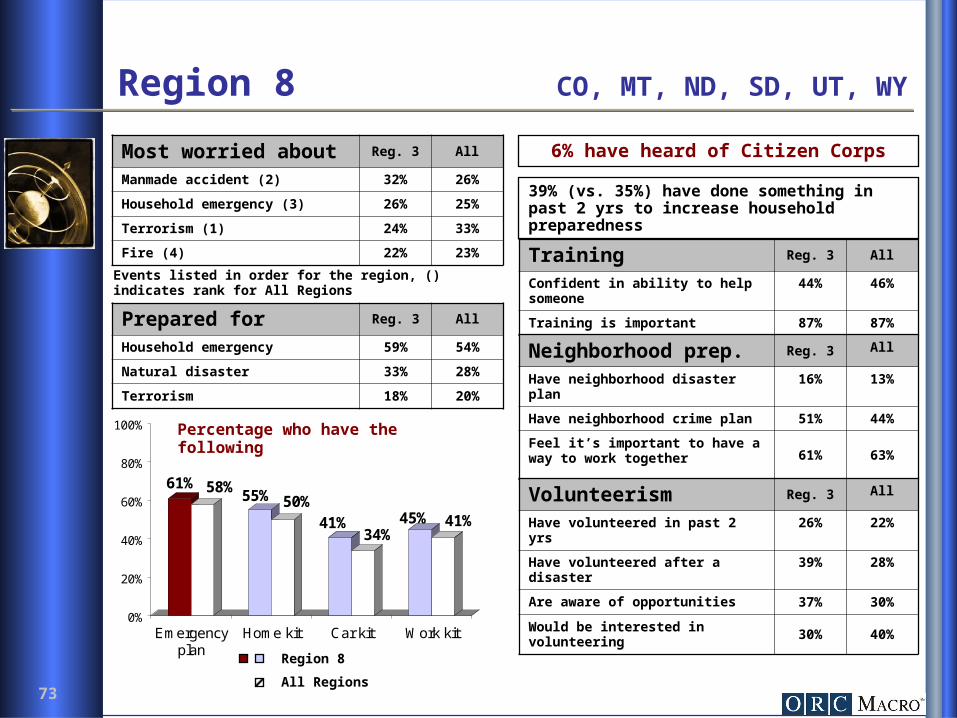
Region 8 CO, MT, ND, SD, UT, WY
Prepared for Reg. 3 All
Household emergency 59% 54%
Natural disaster 33% 28%
Terrorism 18% 20%
39% (vs. 35%) have done something in past 2 yrs to increase household preparedness
Most worried about Reg. 3 All
Manmade accident (2) 32% 26%
Household emergency (3) 26% 25%
Terrorism (1) 24% 33%
Fire (4) 22% 23%
61% 58%55% 50%
41%34%
45% 41%
0%
20%
40%
60%
80%
100%
Emergencyplan
Home kit Car kit Work kit
Percentage who have the following
Region 8
All Regions
Training Reg. 3 All
Confident in ability to help someone 44% 46%
Training is important 87% 87%
Neighborhood prep. Reg. 3 All
Have neighborhood disaster plan 16% 13%
Have neighborhood crime plan 51% 44%
Feel it’s important to have a way to work together 61% 63%
Volunteerism Reg. 3 All
Have volunteered in past 2 yrs 26% 22%
Have volunteered after a disaster 39% 28%
Are aware of opportunities 37% 30%
Would be interested in volunteering 30% 40%
6% have heard of Citizen Corps
Events listed in order for the region, () indicates rank for All Regions

74
Region 9 AZ, CA, Guam*, HI*, NV
Prepared for Reg. 3 All
Household emergency 51% 54%
Natural disaster 30% 28%
Terrorism 17% 20%
39% (vs. 35%) have done something in past 2 yrs to increase household preparedness
Most worried about Reg. 3 All
Terrorism (1) 32% 33%
Earthquake (10) 29% 11%
Household emergency (3) 27% 25%
Neighborhood crime (6) 25% 21%
56% 58% 58%50%
37% 34%47% 41%
0%
20%
40%
60%
80%
100%
Emergencyplan
Home kit Car kit Work kit
Percentage who have the following
Region 9
All Regions
Training Reg. 3 All
Confident in ability to help someone 50% 46%
Training is important 89% 87%
Neighborhood prep. Reg. 3 All
Have neighborhood disaster plan 8% 13%
Have neighborhood crime plan 48% 44%
Feel it’s important to have a way to work together 64% 63%
Volunteerism Reg. 3 All
Have volunteered in past 2 yrs 18% 22%
Have volunteered after a disaster 24% 28%
Are aware of opportunities 33% 30%
Would be interested in volunteering 39% 40%
6% have heard of Citizen Corps
*This study only included the continental United States.
Events listed in order for the region, () indicates rank for All Regions
75
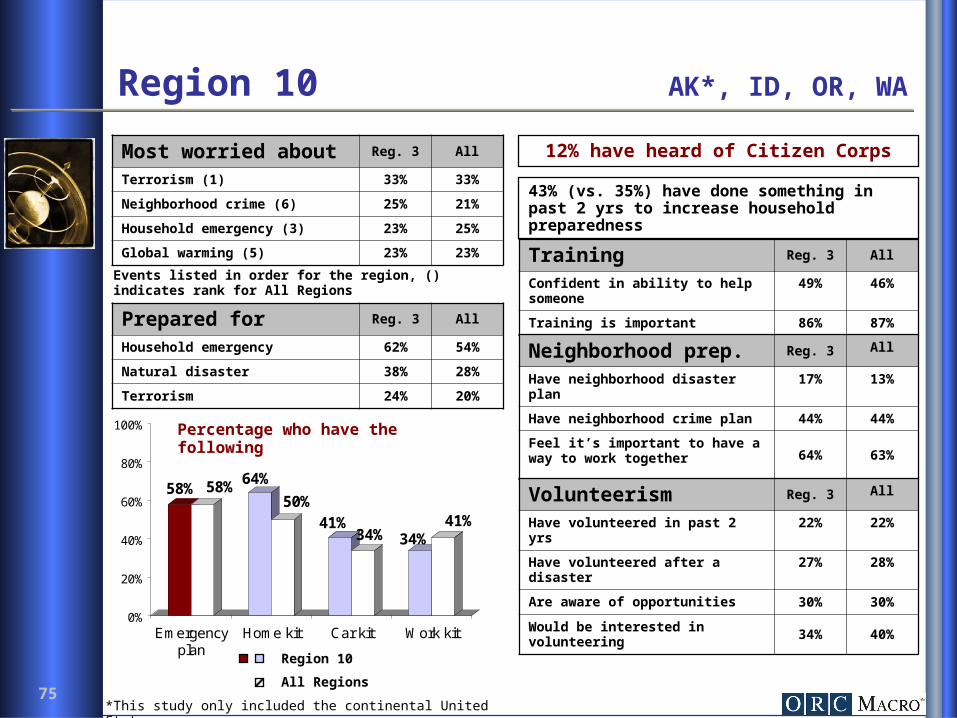
Region 10 AK*, ID, OR, WA
Prepared for Reg. 3 All
Household emergency 62% 54%
Natural disaster 38% 28%
Terrorism 24% 20%
43% (vs. 35%) have done something in past 2 yrs to increase household preparedness
Most worried about Reg. 3 All
Terrorism (1) 33% 33%
Neighborhood crime (6) 25% 21%
Household emergency (3) 23% 25%
Global warming (5) 23% 23%
58% 58% 64%
50%41%
34% 34%41%
0%
20%
40%
60%
80%
100%
Emergencyplan
Home kit Car kit Work kit
Percentage who have the following
Region 10
All Regions
Training Reg. 3 All
Confident in ability to help someone 49% 46%
Training is important 86% 87%
Neighborhood prep. Reg. 3 All
Have neighborhood disaster plan 17% 13%
Have neighborhood crime plan 44% 44%
Feel it’s important to have a way to work together 64% 63%
Volunteerism Reg. 3 All
Have volunteered in past 2 yrs 22% 22%
Have volunteered after a disaster 27% 28%
Are aware of opportunities 30% 30%
Would be interested in volunteering 34% 40%
12% have heard of Citizen Corps
*This study only included the continental United States.
Events listed in order for the region, () indicates rank for All Regions

76
Appendix B: Selected Demographic Profiles

77
Rural (vs. General Population)
Prepared for Rural Pop
Household emergency 54% 54%
Natural disaster 30% 28%
Terrorism 23% 20%
31% (vs. 35%) have done something in past 2 yrs to increase household preparedness
Most worried about Rural Pop
Terrorism 33% 33%
Household emergency 26% 25%
Manmade accident 25% 26%
Fire 22% 23%
63%58% 54%50%
39% 34%42% 41%
0%
20%
40%
60%
80%
100%
Emergencyplan
Home kit Car kit Work kit
Percentage who have the following
Rural
General Population
Training Rural Pop
Confident in ability to help someone 49% 46%
Training is important 89% 87%
Neighborhood prep. Rural Pop
Have neighborhood disaster plan 16% 13%
Have neighborhood crime plan 37% 44%
Feel it’s important to have a way to work together 61% 63%
Volunteerism Rural Pop
Have volunteered in past 2 yrs 25% 22%
Have volunteered after a disaster 36% 28%
Are aware of opportunities 32% 30%
Would be interested in volunteering 39% 40%
Training motivators Rural Pop
Mandatory for job/school 48% 47%
Concern for safety of family/others 18% 20%
Volunteerism motivators Rural Pop
Help community 54% 53%
Relative or friend volunteers 11% 10%
78
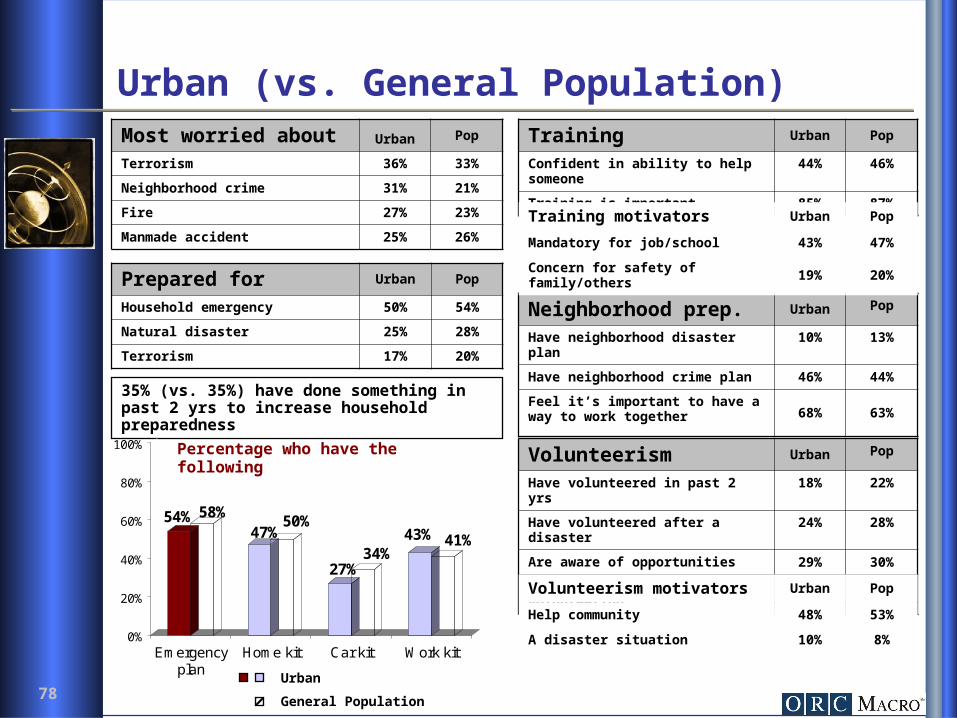
Urban (vs. General Population)
Prepared for Urban Pop
Household emergency 50% 54%
Natural disaster 25% 28%
Terrorism 17% 20%
35% (vs. 35%) have done something in past 2 yrs to increase household preparedness
Most worried about Urban Pop
Terrorism 36% 33%
Neighborhood crime 31% 21%
Fire 27% 23%
Manmade accident 25% 26%
54% 58%47%
50%
27%34%
43% 41%
0%
20%
40%
60%
80%
100%
Emergencyplan
Home kit Car kit Work kit
Percentage who have the following
Urban
General Population
Training Urban Pop
Confident in ability to help someone 44% 46%
Training is important 85% 87%
Neighborhood prep. Urban Pop
Have neighborhood disaster plan 10% 13%
Have neighborhood crime plan 46% 44%
Feel it’s important to have a way to work together 68% 63%
Volunteerism Urban Pop
Have volunteered in past 2 yrs 18% 22%
Have volunteered after a disaster 24% 28%
Are aware of opportunities 29% 30%
Would be interested in volunteering 42% 40%
Training motivators Urban Pop
Mandatory for job/school 43% 47%
Concern for safety of family/others 19% 20%
Volunteerism motivators Urban Pop
Help community 48% 53%
A disaster situation 10% 8%

79
Women (vs. General Population)
Prepared for Women Pop
Household emergency 54% 54%
Natural disaster 26% 28%
Terrorism 19% 20%
43% (vs. 35%) have done something in past 2 yrs to increase household preparedness
Most worried about Women Pop
Terrorism 38% 33%
Manmade accident 29% 26%
Household emergency 29% 25%
Fire 27% 23%
60% 58%48%
50%
35% 34%41% 41%
0%
20%
40%
60%
80%
100%
Emergencyplan
Home kit Car kit Work kit
Percentage who have the following
Women
General Population
Training Women Pop
Confident in ability to help someone 40% 46%
Training is important 91% 87%
Neighborhood prep. Women Pop
Have neighborhood disaster plan 14% 13%
Have neighborhood crime plan 41% 44%
Feel it’s important to have a way to work together 69% 63%
Volunteerism Women Pop
Have volunteered in past 2 yrs 20% 22%
Have volunteered after a disaster 24% 28%
Are aware of opportunities 30% 30%
Would be interested in volunteering 42% 40%
Training motivators Women Pop
Mandatory for job/school 51% 47%
Concern for safety of family/others 23% 20%
Volunteerism motivators Women Pop
Help community 54% 53%
Relative or friend volunteers 11% 10%

80
African American or Black (vs. General Population)
Prepared for AA/Black Pop
Household emergency 57% 54%
Natural disaster 34% 28%
Terrorism 21% 20%
34% (vs. 35%) have done something in past 2 yrs to increase household preparedness
Most worried about AA/Black Pop
Terrorism 53% 33%
Neighborhood crime 41% 21%
Fire 40% 23%
Manmade accident 40% 26%
53% 58%
46%50%
28%34%
43% 41%
0%
20%
40%
60%
80%
100%
Emergencyplan
Home kit Car kit Work kit
Percentage who have the following
African American or Black
General Population
Training AA/Black Pop
Confident in ability to help someone 53% 46%
Training is important 91% 87%
Neighborhood prep. AA/Black Pop
Have neighborhood disaster plan 9% 13%
Have neighborhood crime plan 47% 44%
Feel it’s important to have a way to work together 81% 63%
Volunteerism AA/Black Pop
Have volunteered in past 2 yrs 21% 22%
Have volunteered after a disaster 18% 28%
Are aware of opportunities 23% 30%
Would be interested in volunteering 64% 40%
Training motivators AA/Black Pop
Mandatory for job/school 58% 47%
Concern for safety of family/others 19% 20%
Volunteerism motivators AA/Black Pop
Help community 55% 53%
I was helped by first responders or community organization
7% 3%
81
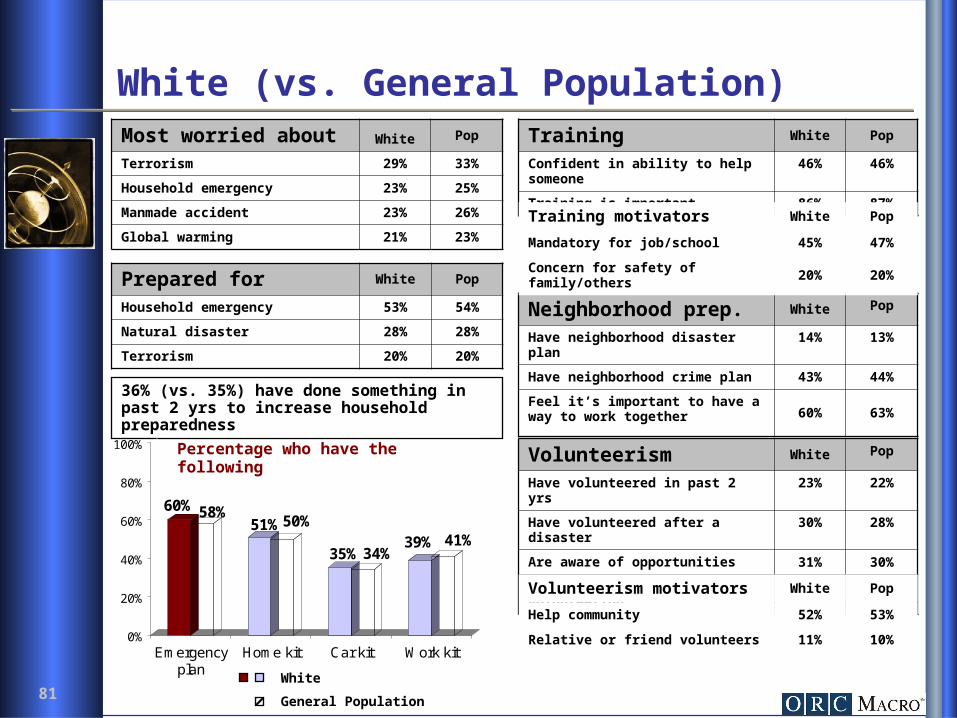
White (vs. General Population)
Prepared for White Pop
Household emergency 53% 54%
Natural disaster 28% 28%
Terrorism 20% 20%
36% (vs. 35%) have done something in past 2 yrs to increase household preparedness
Most worried about White Pop
Terrorism 29% 33%
Household emergency 23% 25%
Manmade accident 23% 26%
Global warming 21% 23%
60% 58%51%50%
35% 34%39% 41%
0%
20%
40%
60%
80%
100%
Emergencyplan
Home kit Car kit Work kit
Percentage who have the following
White
General Population
Training White Pop
Confident in ability to help someone 46% 46%
Training is important 86% 87%
Neighborhood prep. White Pop
Have neighborhood disaster plan 14% 13%
Have neighborhood crime plan 43% 44%
Feel it’s important to have a way to work together 60% 63%
Volunteerism White Pop
Have volunteered in past 2 yrs 23% 22%
Have volunteered after a disaster 30% 28%
Are aware of opportunities 31% 30%
Would be interested in volunteering 36% 40%
Training motivators White Pop
Mandatory for job/school 45% 47%
Concern for safety of family/others 20% 20%
Volunteerism motivators White Pop
Help community 52% 53%
Relative or friend volunteers 11% 10%

82
Hispanic (vs. General Population)
Prepared for Hispanic Pop
Household emergency 61% 54%
Natural disaster 29% 28%
Terrorism 25% 20%
37% (vs. 35%) have done something in past 2 yrs to increase household preparedness
Most worried about Hispanic Pop
Terrorism 45% 33%
Fire 34% 23%
Household emergency 33% 25%
Manmade accident 32% 26%
61%58% 60%
50%
37% 34%
53%
41%
0%
20%
40%
60%
80%
100%
Emergencyplan
Home kit Car kit Work kit
Percentage who have the following
Hispanic
General Population
Training Hispanic Pop
Confident in ability to help someone 56% 46%
Training is important 90% 87%
Neighborhood prep. Hispanic Pop
Have neighborhood disaster plan 10% 13%
Have neighborhood crime plan 44% 44%
Feel it’s important to have a way to work together 71% 63%
Volunteerism Hispanic Pop
Have volunteered in past 2 yrs 21% 22%
Have volunteered after a disaster 23% 28%
Are aware of opportunities 29% 30%
Would be interested in volunteering 47% 40%
Training motivators Hispanic Pop
Mandatory for job/school 47% 47%
Concern for safety of family/others 25% 20%
Volunteerism motivators Hispanic Pop
Help community 54% 53%
Relative or friend volunteers 19% 10%
83
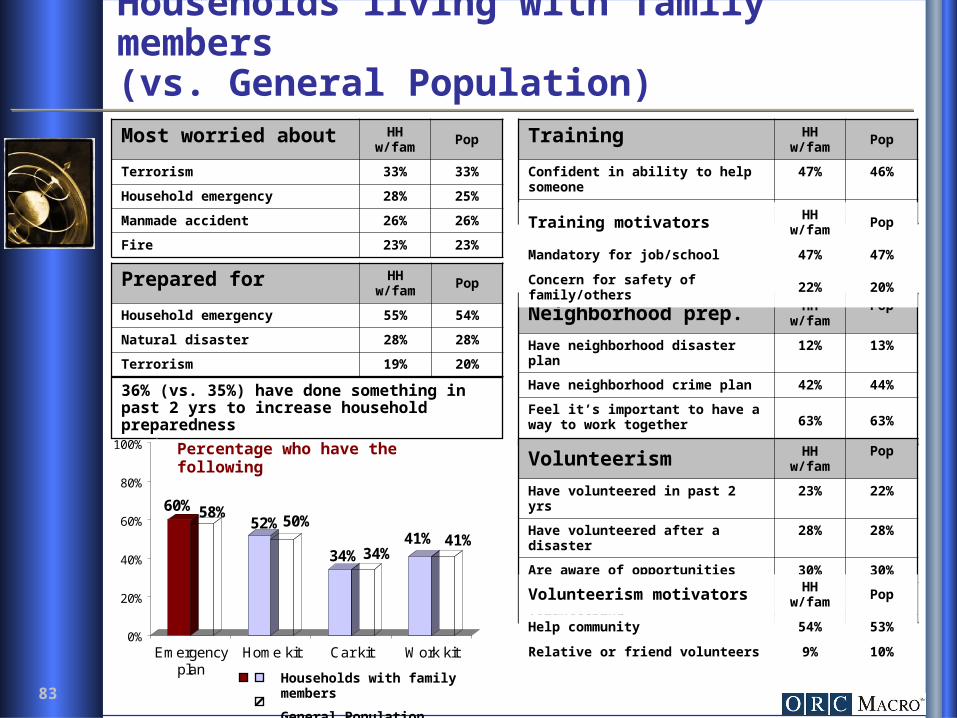
Households living with family members(vs. General Population)
Prepared for HH w/fam Pop
Household emergency 55% 54%
Natural disaster 28% 28%
Terrorism 19% 20%
36% (vs. 35%) have done something in past 2 yrs to increase household preparedness
Most worried about HH w/fam Pop
Terrorism 33% 33%
Household emergency 28% 25%
Manmade accident 26% 26%
Fire 23% 23%
60% 58%52%50%
34% 34%41% 41%
0%
20%
40%
60%
80%
100%
Emergencyplan
Home kit Car kit Work kit
Percentage who have the following
Households with family members
General Population
Training HH w/fam Pop
Confident in ability to help someone 47% 46%
Training is important 88% 87%
Neighborhood prep. HH w/fam Pop
Have neighborhood disaster plan 12% 13%
Have neighborhood crime plan 42% 44%
Feel it’s important to have a way to work together 63% 63%
Volunteerism HH w/fam Pop
Have volunteered in past 2 yrs 23% 22%
Have volunteered after a disaster 28% 28%
Are aware of opportunities 30% 30%
Would be interested in volunteering 42% 40%
Training motivators HH w/fam Pop
Mandatory for job/school 47% 47%
Concern for safety of family/others 22% 20%
Volunteerism motivators HH w/fam Pop
Help community 54% 53%
Relative or friend volunteers 9% 10%
84
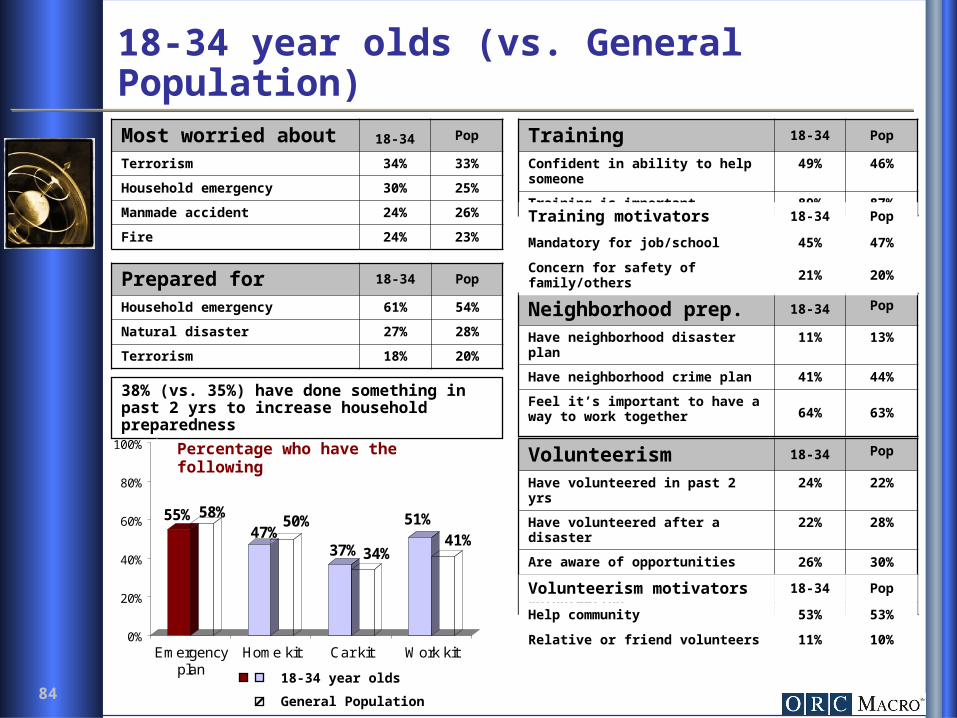
18-34 year olds (vs. General Population)
Prepared for 18-34 Pop
Household emergency 61% 54%
Natural disaster 27% 28%
Terrorism 18% 20%
38% (vs. 35%) have done something in past 2 yrs to increase household preparedness
Most worried about 18-34 Pop
Terrorism 34% 33%
Household emergency 30% 25%
Manmade accident 24% 26%
Fire 24% 23%
55% 58%47%
50%
37% 34%
51%41%
0%
20%
40%
60%
80%
100%
Emergencyplan
Home kit Car kit Work kit
Percentage who have the following
18-34 year olds
General Population
Training 18-34 Pop
Confident in ability to help someone 49% 46%
Training is important 89% 87%
Neighborhood prep. 18-34 Pop
Have neighborhood disaster plan 11% 13%
Have neighborhood crime plan 41% 44%
Feel it’s important to have a way to work together 64% 63%
Volunteerism 18-34 Pop
Have volunteered in past 2 yrs 24% 22%
Have volunteered after a disaster 22% 28%
Are aware of opportunities 26% 30%
Would be interested in volunteering 42% 40%
Training motivators 18-34 Pop
Mandatory for job/school 45% 47%
Concern for safety of family/others 21% 20%
Volunteerism motivators 18-34 Pop
Help community 53% 53%
Relative or friend volunteers 11% 10%

85
35-54 year olds (vs. General Population)
Prepared for 35-54 Pop
Household emergency 55% 54%
Natural disaster 28% 28%
Terrorism 20% 20%
38% (vs. 35%) have done something in past 2 yrs to increase household preparedness
Most worried about 35-54 Pop
Terrorism 32% 33%
Manmade accident 27% 26%
Global warming 25% 23%
Household emergency 24% 25%
62%58%
52%50%
35% 34%
45%41%
0%
20%
40%
60%
80%
100%
Emergencyplan
Home kit Car kit Work kit
Percentage who have the following
35-54 year olds
General Population
Training 35-54 Pop
Confident in ability to help someone 52% 46%
Training is important 87% 87%
Neighborhood prep. 35-54 Pop
Have neighborhood disaster plan 12% 13%
Have neighborhood crime plan 46% 44%
Feel it’s important to have a way to work together 63% 63%
Volunteerism 35-54 Pop
Have volunteered in past 2 yrs 24% 22%
Have volunteered after a disaster 32% 28%
Are aware of opportunities 33% 30%
Would be interested in volunteering 43% 40%
Training motivators 35-54 Pop
Mandatory for job/school 49% 47%
Concern for safety of family/others 20% 20%
Volunteerism motivators 35-54 Pop
Help community 55% 53%
Relative or friend volunteers 10% 10%

86
55 years and older (vs. General Population)
Prepared for 55+ Pop
Household emergency 45% 54%
Natural disaster 30% 28%
Terrorism 22% 20%
28% (vs. 35%) have done something in past 2 yrs to increase household preparedness
Most worried about 55+ Pop
Terrorism 33% 33%
Manmade accident 27% 26%
Global warming 25% 23%
Hurricane or violent storm 24% 18%
57% 58%51%50%
31% 34%24%
41%
0%
20%
40%
60%
80%
100%
Emergencyplan
Home kit Car kit Work kit
Percentage who have the following
55 years and older
General Population
Training 55+ Pop
Confident in ability to help someone 35% 46%
Training is important 84% 87%
Neighborhood prep. 55+ Pop
Have neighborhood disaster plan 16% 13%
Have neighborhood crime plan 44% 44%
Feel it’s important to have a way to work together 63% 63%
Volunteerism 55+ Pop
Have volunteered in past 2 yrs 17% 22%
Have volunteered after a disaster 31% 28%
Are aware of opportunities 32% 30%
Would be interested in volunteering 32% 40%
Training motivators 55+ Pop
Mandatory for job/school 46% 47%
Concern for safety of family/others 12% 20%
Volunteerism motivators 55+ Pop
Help community 51% 53%
Relative or friend volunteers 8% 10%