sub-saharan africa class 1. approximately 600 million people
Post on 22-Dec-2015
215 views
TRANSCRIPT

Sub-Saharan AfricaClass 1

Approximately 600 million people


IndicatorEast Asia &
PacificLatin
America &Caribbean
Middle East& NorthAfrica
South Asia Sub-SaharanAfrica
Total Population, 1996(millions)
1,732 486 276 1,266 596
Per capita GNP, 1996 (PPP) $3,370 $6,530 $4,530 $1,520 $1,450Per Capita GNP Growth,
1965-96 (annual averagepercent)
5.5 1.1 -1.8 2.2 -0.2
Life expectancy at birth, men,1996
67 66 66 61 51
Life expectancy at birth,women, 1996
70 73 68 63 54
Infant mortality per 1,000 livebirths, 1996
39 33 50 73 91
Infant mortality per 1,000 livebirths, 1970
79 84 134 139 137
Under 5 mortality per 1,000,1996
47 41 63 93 147
Under 5 mortality per 1,000,1980
75 82 141 174 193

0 2000 4000 6000 8000
Angola
Burkina Faso
Central African Rep
Congo
Gambia, The
Guinea-Bissau
Madagascar
Mozambique
Nigeria
Sierra Leone
Uganda
1996 per capita GNP (PPP)
South Africa
Namibia
Gabon
Botswana

annual p
er
capita
incom
e c
hange 1
965-9
6
-4.0 - -3.0
-3.0 - -2.0
-2.0 - -1.0
-1.0 - 0.0
0.0 - 1.0
1.0 - 2.0
2.0 - 3.0
3.0 - 4.0
4.0 - 5.0
5.0 - 6.0
6.0 - 7.0
7.0 - 8.0
8.0 - 9.0
9.0 - 10.0
121086420
Std. Dev = 2.23
Mean = .2
N = 29.00
Annual per capita GNP Growth rates, 1965-96
Botswana
Lesotho

ECONOMIC GROWTH BY MAJOR DEVELOPING REGION, 1965-89.
GROWTH OF REAL PER CAPITA GDP1965-73 1973-80 1980-89
SUB-SAHARAN AFRICA 3.2 0.1 -2.2EAST ASIA 5.1 4.7 6.7SOUTH ASIA 1.2 1.7 3.2EASTERN EUROPE 4.8 5.3 6.8MIDDLE EAST/NORTH AFRICA 5.5 2.1 0.8LATIN AMERICA & CARIBBEAN 3.7 2.6 -0.6Auty 1995:31.

Per capita GNP--average annual growth 1985-94.
SUB-SAHARAN AFRICA -1.2EAST ASIA 6.9SOUTH ASIA 2.7EUROPE AND CENTRAL ASIA -3.2MIDDLE EAST/NORTH AFRICA -0.4LATIN AMERICA & CARIBBEAN 0.6
-2
0
2
4
6
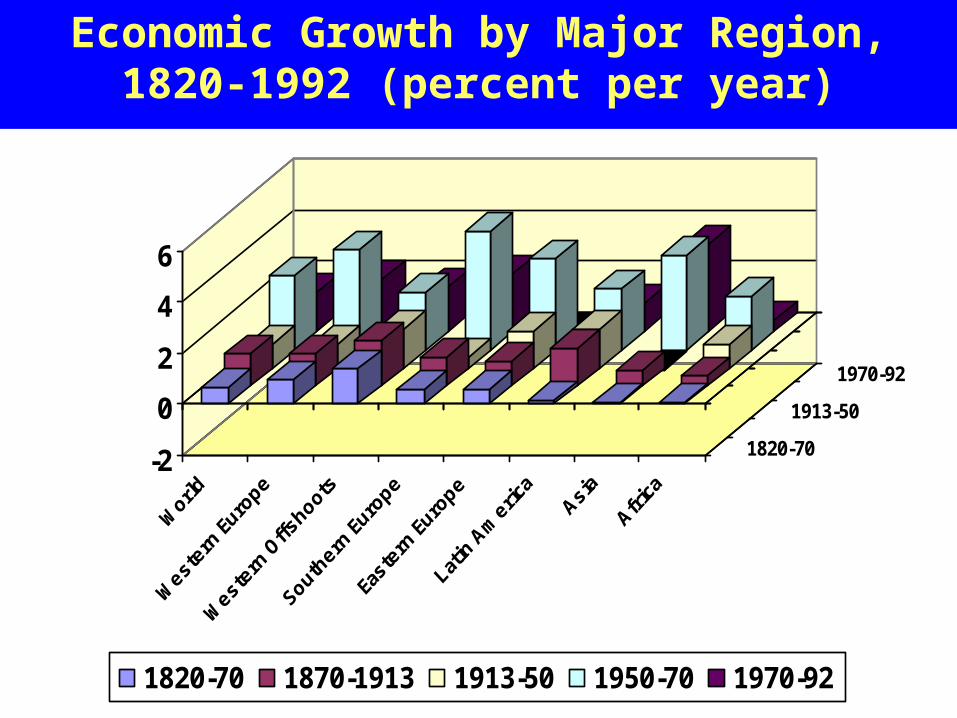
1820-70
1913-50
1970-92
1820-70 1870-1913 1913-50 1950-70 1970-92
Economic Growth by Major Region, 1820-1992 (percent per year)

0 10 20 30 40 50
Angola
Burkina Faso
Central Afr. Rep.
Gambia, The
Kenya
Mozambique
Rwanda
Tanzania
Zambia
1990-96
Percent children (under 5) malnourished, 1990-96

Agricultural decline
Food security problem Drought conditions of early 1970s
within Sahel demonstrated:– no reserve productive capacity– no financial capacity to import
significant food Food security problem actually
began in 1960s

Decline of export-oriented agriculture
Significance– demonstrates declines in per
capita food production are not just due to substitution of export-oriented crops
– most countries are seriously dependent on these commodities for export earnings

Marginalization in world trade
1950---3.1% of global exports 1990---1.2% of global exports (implied annual trade loss of
$65 billion in 1990)

Ng and Yeats. 1997. Open economies work
better... Close look at export trends
between 1962-64 and 1991-93 to OECD countries (3 year averages)
to overcome trade data problems for African countries
OECD countries account for approx. 82% of all African exports

Central questions
What happened to demand for the traditional exports of the region over time?
What happened to the competitive position of the region as exporters of these products over time?
How well was the region able to diversify its exports over time?

Factor influence on current exports(% change)Country group
Demand CompetitionAll Sub-Saharan Africa 572.1 -41.7Low income Asia 778.6 383.4Middle income Asia 740.1 724.9Latin America/Carib 658.5 77.7North Africa 1058.4 -19.1Middle East 1020.8 36.7Other Europe and Asia 1386.4 30.7
Impact of demand and competition on Sub-Saharan African and other regions’
exports, 1962-64 to 1991-93
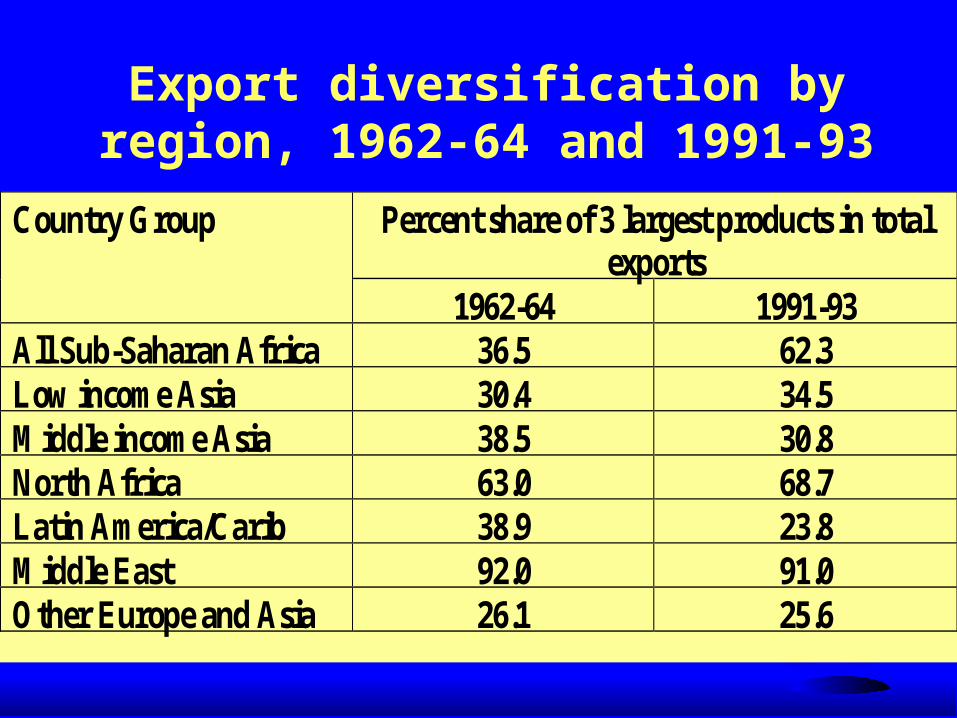
Percent share of 3 largest products in totalexports
Country Group
1962-64 1991-93All Sub-Saharan Africa 36.5 62.3Low income Asia 30.4 34.5Middle income Asia 38.5 30.8North Africa 63.0 68.7Latin America/Carib 38.9 23.8Middle East 92.0 91.0Other Europe and Asia 26.1 25.6
Export diversification by region, 1962-64 and 1991-93

Alternative Perspectives on Poor Economic
PerformanceDemographic factorsEnvironmental factorsExternal factors--
relationships with developed economies
internal policy factors
1. Demographic Factors
Rapid population growth–2.6 percent per year--1950-1995–doubling time of 27 years
attributable to declining mortality and continued high fertility (delayed demographic transition)– TFRs from 4.1 to 7.4 well above
replacement levels

Reasons for high fertility
Low level of contraceptive use
high level of “wanted” fertility rates


Factors underlying high “wanted” fertility rates
Source of old age insurance important source of labor in rural settings various social structures promote high fertility
– children are often raised in other households which reduces costs of raising
– communal-based land tenure systems with land distributed according to family “need”
– polygyny with each wife and her children forming a discrete economic unit

Economic consequences of rapid
population growth Age structure skewed toward young ages
– working age population is only half of total population compared to 60-70% elsewhere
reduces labor force participation, productivity and savings
high burden of providing basic education– data suggest primary school enrollment rates
fell from 1980 to 1993

Excessive pressure on agricultural resource base leading to degradation of the resource base

2. Environmental Factors
Good source:–Bloom and Sachs. 1998.
Geography, demography and economic growth in Africa, Brookings Papers on Economic Activity 2:207-295.

1. Tropical environment and agricultural productivity
Unfavorable soil-water balance (precipitation - potential evapotranspiration) creates problems of aridity and drought in various regions
lack of variation in day-length and lack of dry season create induction of flowering problem for many temperate-zone species in humid tropics

Basic biological factors limit agricultural yields of other species– concept of net photosynthesis
(energy net of the energy plant uses to stay alive)
–where temperatures remain very high at night losses of net photosynthetic potential are especially high

Problem of tropical soils– High precipitation leaches nutrients– makes permanent agriculture
difficult
veterinary disease vectors– lack of cold weather barriers to
vector reproduction and survival
plant pests--e.g. locustscrop damage due to massive
rodent populations

2. Tropical environment and infectious disease
Very high burdens of infectious and parasitic diseases– account for 42.5% of lost Disability-
Adjusted Life Years (DALYs)– Compare
India--28.9% Western Europe--2.8%

Traditional problem--Malaria
Caused by the protozoan plasmodium transmitted by anopheles mosquito
disease ecology depends on– density of mosquitoes relative to humans– mosquito longevity relative to life cycle of
plasmodium key variable: latency period of
plasmodium in mosquito relative to life span of mosquito
Economic costs of malaria
Medical care costs for the individual--medicines, treatment fees, transportation, bednets, insecticides etc.
public health expenditures loss of productivity due to illness and care of the sick impacts on long-term cognitive performance constraints on technical diffusion, foreign investment
and population exchange (including tourism) in endemic malarial regions

Strategy to avoid malaria?
Settlement and development in tropical highland areas
Problem--generally distant from coastline– result is high transportation
costs poor transport systems

Contemporary late 20th C problem--HIV/AIDS