study to assess the impacts of different classification...
TRANSCRIPT

Study to assess the
impacts of different
classification
approaches for
hazard property "HP
14" on selected
waste streams
Final report
October 2015
2 Study to assess the impacts of different classification approaches for hazard property "HP 14"
on selected waste streams – Final report
Document information
CLIENT European Commission – DG ENV
REPORT TITLE Final report
PROJECT NAME Study to assess the impacts of different classification approaches for
hazard property "HP 14" on selected waste streams
DATE 16 October 2015
PROJECT TEAM BIO by Deloitte (BIO), INERIS
AUTHORS Ms Mariane Planchon (BIO)
Ms Nada Saïdi (BIO)
Mr Pascal Pandard (INERIS)
Mr Adrien Troise (INERIS)
KEY CONTACTS Mariane Planchon
+33 1 55 61 67 56
DISCLAIMER The information and views set out in this report are those of the author(s)
and do not necessarily reflect the official opinion of the Commission.
The Commission does not guarantee the accuracy of the data included
in this study. Neither the Commission nor any person acting on the
Commission’s behalf may be held responsible for the use which may be
made of the information contained therein.
Please cite this publication as:
BIO by Deloitte (2015). Study to assess the impacts of different classification approaches for
hazard property "HP 14" on selected waste streams – Final report. Prepared for the European
Commission (DG ENV), in collaboration with INERIS.
BIO by Deloitte is a commercial brand of the legal entity BIO Intelligence Service. Since
26 June 2013 the legal entity BIO Intelligence Service is a 100% owned subsidiary of
Société Fiduciaire Internationale d’Audit which is owned by Deloitte.
All the employees referred to in this proposal therefore remain available for the execution
of the project, via the legal entity BIO Intelligence Service or Deloitte.
3 Study to assess the impacts of different classification approaches for hazard property "HP 14"
on selected waste streams – Final report
Table of contents
ABSTRACT 9
EXECUTIVE SUMMARY __________________________________________________ 11
1. INTRODUCTION _____________________________________________________ 23
1.1. Background _______________________________________________________ 23
1.2. Objectives _________________________________________________________ 26
2. METHODOLOGY ____________________________________________________ 27
2.1. Collecting data on how a sample of Member States perform the assessment of
HP 14 _____________________________________________________________ 27
2.1.1. Selection of countries and data collection by survey ____________________ 27 2.1.2. Data collection by desk study _____________________________________ 29 2.1.3. Reporting data in factsheets ______________________________________ 29
2.2. Selecting mirror pairs for the assessment _______________________________ 31
2.2.1. Selection process ______________________________________________ 31 2.2.2. Selection criteria _______________________________________________ 32 2.2.3. Global score and selection of mirror pairs ____________________________ 37 2.2.4. Taking into account the Commission and Member States’ inputs __________ 38
2.3. Collecting experimental data on selected waste codes ____________________ 38
2.4. Running the calculation methods ______________________________________ 39
2.4.1. Reporting collected data _________________________________________ 39 2.4.2. Worst-case selection ____________________________________________ 40 2.4.3. Calculation tool ________________________________________________ 40
2.5. Impact assessment _________________________________________________ 42
2.5.1. Scope of the impact assessment __________________________________ 42 2.5.2. Assessment steps ______________________________________________ 42
2.6. Workshops and conferences _________________________________________ 44
3. RESULTS: STRATEGIES OF SELECTED MEMBER STATES TO ASSESS HP 14 _________ 45
3.1. Member States survey _______________________________________________ 45
3.2. Full country factsheets ______________________________________________ 45
3.3. Description of the approaches ________________________________________ 45
3.3.1. General information ____________________________________________ 45 3.3.2. Approaches using chemical analysis _______________________________ 48 3.3.3. Approaches using biotests _______________________________________ 55 3.3.4. Combined approaches __________________________________________ 58
3.4. Costs associated with implementing HP 14 approaches ___________________ 59
3.5. Advantages and limits of the approaches _______________________________ 60
3.5.1. Approaches based on chemical analysis ____________________________ 60

4 Study to assess the impacts of different classification approaches for hazard property "HP 14"
on selected waste streams – Final report
3.5.2. Approaches based on biotests ____________________________________ 61 3.5.3. Combined approaches __________________________________________ 61
4. RESULTS: SELECTION OF WASTE CODES FOR THE ASSESSMENT _________________ 63
4.1. Scores obtained for the selection criteria _______________________________ 63
4.1.1. SC1: Preference of experts _______________________________________ 63 4.1.2. SC2: Availability and quality of data ________________________________ 63 4.1.3. SC3: Quantity of produced waste __________________________________ 64 4.1.4. SC4: Economic importance_______________________________________ 67 4.1.5. SC5: Potential presence of hazardous substances _____________________ 67 4.1.6. SC6: Criticality of waste classification _______________________________ 70
4.2. Selected waste codes _______________________________________________ 71
5. CALCULATION METHODS: RESULTS AND COMPARATIVE ASSESSMENT _____________ 85
5.1. Presentation of the calculation methods ________________________________ 85
5.1.1. Introduction to the calculation methods ______________________________ 85 5.1.2. Theoretical consideration of the four calculation methods _______________ 86 5.1.3. Comparison of concentration limit values of the four calculation methods, M-factor
and generic cut-off values consideration _____________________________ 87
5.2. Data collected on the selected waste codes _____________________________ 88
5.2.1. Overview _____________________________________________________ 88 5.2.1. Chemical analyses _____________________________________________ 89 5.2.2. Biotests ______________________________________________________ 89
5.3. Determination of the classification of waste types according to the different
methodologies proposed ____________________________________________ 90
5.3.1. Classification of wastes types according to the calculation methods _______ 90 5.3.2. Classification of wastes types based on ecotoxicological data ____________ 91
5.4. Limitations ________________________________________________________ 91
5.4.1. Limitations due to characterisation data available ______________________ 91 5.4.2. Limitations of calculation methods _________________________________ 92 5.4.3. Limitations related to ecotoxicological data available ___________________ 92
5.5. Comparative assessment of the different methodologies __________________ 93
5.5.1. Comparison of the four calculation methods __________________________ 93 5.5.2. Comparison between calculation methods and ecotoxicological data ______ 97 5.5.3. Feasability of the different methods ________________________________ 99
5.6. Conclusion and potential orientations for a combined approach ___________ 100
6. IMPACT ASSESSMENT OF THE CHANGE OF CLASSIFICATION ____________________ 103
6.1. Principles ________________________________________________________ 103
6.2. Indicators for the baseline scenario and the impact assessment ___________ 104
6.3. Current situation and trends _________________________________________ 104
6.3.1. Soil and stones waste (17 05 03*/17 05 04) _________________________ 105 6.3.2. Incinerator bottom ash (19 01 11*/19 01 12) _________________________ 109 6.3.3. Fly ash from incinerators (19 01 13* / 19 01 14) ______________________ 113 6.3.4. Fluff-light fraction and dust from shredding of metal-containing waste (19 10
03*/19 10 04) ________________________________________________ 115 6.3.5. Other types of waste ___________________________________________ 117
6.4. Potential impacts of a change of classification __________________________ 117

5 Study to assess the impacts of different classification approaches for hazard property "HP 14"
on selected waste streams – Final report
6.4.1. Overview ____________________________________________________ 117 6.4.2. Soil and stones waste (17 05 03*/17 05 04) _________________________ 119 6.4.3. Incinerator bottom ash (19 01 11*/19 01 12) _________________________ 121 6.4.4. Fly ash from incinerators (19 01 13* / 19 01 14) ______________________ 124 6.4.5. Fluff-light fraction and dust from shredding of metal-containing waste (19 10
03*/19 10 04) ________________________________________________ 125
6.5. Conclusion _______________________________________________________ 126
7. CONCLUSIONS AND RECOMMENDATIONS _________________________________ 129
7.1. Lack of harmonisation of current approaches for assessing HP 14 _________ 129
7.2. Conclusion on the most relevant calculation method for the assessment of HP14:
Method 1 seems to be the most relevant for waste classification ___________ 129
7.3. Recommendations on next steps _____________________________________ 130
8. ANNEXES 131
Annex 1. First Questionnaire sent to Competent Authorities _________________ 132
Annex 2. Factsheets __________________________________________________ 136
Annex 3. Second questionnaire sent to Competent Authorities ______________ 175
Annex 4. Questionnaire sent to industrial stakeholders for the impact
assessment _______________________________________________________ 187
Annex 5. Application of the calculation methods __________________________ 195
Annex 6. Study from the French Ministry of Ecology _______________________ 196

6 Study to assess the impacts of different classification approaches for hazard property "HP 14"
on selected waste streams – Final report
List of Tables
Table 1: Waste production of the EU-28 Member States in 2012, extracted from Eurostat (Generation of waste [env_wasgen], WASTE: Total Waste, HAZARD: Total, Last update: 26/11/2014, Extracted on: 14/01/2015) ................................................................................... 27 Table 2: Example of publications in the waste classification topic of selected Member States (non-exhaustive)...................................................................................................................... 28 Table 3: Template for the country factsheets .......................................................................... 30 Table 4: Attribution of weights according to biases in data on quantity ................................... 35 Table 5: Score per Member State and weighted average score for SC3 - waste code 06 03 16 ............................................................................................................................................ 35 Table 6: Example of input in the calculation tool (Ref: sample 1, pair 06 05 02*/06 05 03) ..... 41 Table 7: National legislation or guidelines for the H14 assessment methods and protocols ... 45 Table 8: Generic concentration limits for individual ecotoxic substances, according to their classification (DPD-based approaches) .................................................................................. 50 Table 9: Concentration thresholds for ecotoxic substances, according to their classification ((DPD-based approaches) ...................................................................................................... 50 Table 10: Conditions rendering the waste hazardous by HP 14 during Step 4, per Member State adapting the DPD for HP 14 assessment ................................................................................ 51 Table 11: Hazard classes considered in the Italian HP 14 assessment .................................. 53 Table 12: Hydrocarbon fractions to be considered as substances in the assessment of HP 14 ...................................................................................................................................... 54 Table 13: Concentration thresholds for ecotoxic substances, according to their classification (ADR-based approach) ........................................................................................................... 54 Table 14: Conditions rendering the waste hazardous by HP 14 in Italy .................................. 54 Table 15: French additivity rules.............................................................................................. 55 Table 16: Standards for preparing waste samples .................................................................. 55 Table 17: Batteries of tests used in Member States using biotests to assess HP 14 .............. 56 Table 18: Tests on Daphnia magna, as used in Member States relying on biotests for the assessment of HP 14 .............................................................................................................. 57 Table 19: Comparison between France and Germany regarding calculation methods ........... 58 Table 20: Batteries of tests used in Germany and Italy ........................................................... 58 Table 21: Most produced waste types in the studied Member States ..................................... 65 Table 22: Preliminary selected mirror pairs ............................................................................. 71 Table 23: Wastes suggested by Member States and the corresponding mirror pairs ............. 73 Table 24: Pre-selected pairs which are in the original list of the Commission, and different from the 14 pairs selected earlier .................................................................................................... 81 Table 25: Final selection of Member States-suggested waste streams ................................... 81 Table 26: Final list of selected codes ...................................................................................... 82 Table 27: Hazard classes and statements considered for HP 14 assessment ........................ 85 Table 28: Comparison of the different concentration limit values (assuming all M-factors are equal to 1) ............................................................................................................................... 87 Table 29: Amount of data collected per mirror pair.................................................................. 88 Table 30: Biotests used to assess ecotoxicological hazard in the collected samples.............. 90 Table 31: Harmonised approach for hazard assessment with biotests ................................... 91 Table 32: Concordance of results with current classifications ................................................. 94 Table 33: False positives defined by taking the baseline classification as a reference, i.e. non-hazardous according to the baseline, assessed as hazardous by the calculation method ...... 94 Table 34: False negatives defined by taking the baseline classification as a reference, i.e. hazardous according to the baseline, assessed as non-hazardous by the calculation method .................................................................................................................................... 95 Table 35: Concordance of results with biotests results ........................................................... 97 Table 36: False positives (determined with regards to biotest results), i.e. non-hazardous according to the biotests, assessed as hazardous by the calculation method ........................ 98 Table 37: False negatives (determined with regards to biotest results), i.e. hazardous according to the biotests, assessed as non-hazardous by the calculation method .................................. 98 Table 38: Costs per sample (€) for assessing HP 14 with the proposed methods on some mirror pairs ...................................................................................................................................... 100 Table 39: The studied mirror pairs, classified by nature and by source ................................. 103

7 Study to assess the impacts of different classification approaches for hazard property "HP 14"
on selected waste streams – Final report
Table 40: Hazard of 17 05 03*/17 05 04 waste streams ........................................................ 105 Table 41: Costs of managing soil & stones waste in a few Member States .......................... 108 Table 42: Hazard of 19 01 11* / 19 01 12 waste streams ...................................................... 110 Table 43: Estimation of the number of workers needed for managing IBA in landfills and for recovery, considering the amounts of IBA generated in France and in Germany (per year) . 113 Table 44: Hazard of 19 01 13* / 19 01 14 waste streams ...................................................... 113 Table 45: Hazard of 19 10 03*/19 10 04 waste streams ........................................................ 115 Table 46: Shifts of classification caused by the four calculation methods ............................. 118 Table 47: 17 05 03*/17 05 04 – Shifts of classification caused by the four calculation methods ................................................................................................................................ 119 Table 48: 17 05 03*/17 05 04 – Status quo and impacts of the four calculation methods ..... 121 Table 49: 19 01 11*/19 01 12 – Shifts of classification caused by the four calculation methods ................................................................................................................................ 122 Table 50: 19 01 11*/19 01 12 – Impacts of the four calculation methods .............................. 123 Table 51: 19 01 13* / 19 01 14 – Shifts of classification caused by the four calculation methods .............................................................................................................................................. 124 Table 52: 19 01 13* / 19 01 14 – Impacts of the four calculation methods ............................ 125 Table 53: 19 10 03*/19 10 04 – Shifts of classification caused by the four calculation methods ................................................................................................................................ 126 Table 54: Experts who contributed (in grey: Member States who did not contribute) ............ 132 Table 55: Mirror pairs selected in the study (in bold: priority) ................................................ 192

8 Study to assess the impacts of different classification approaches for hazard property "HP 14"
on selected waste streams – Final report
List of Figures
Figure 1 : the 4 calculation methods for HP 14 assessment which have been assessed in this study ........................................................................................................................................ 12 Figure 2: Waste quantities in Germany and attribution of scores ............................................ 34 Figure 3: Approaches for the assessment of HP 14 in the nine studied Member States ......... 48 Figure 4: Decision tree for the assessment of HP 14 using chemical analyses (based on the DPD) ....................................................................................................................................... 49 Figure 5: Decision tree for the assessment of HP 14 in Italy ................................................... 53 Figure 6: Ranges of costs in Member States for which the information is available ................ 60 Figure 7: Extract from the Excel sheet which reports results for SC1 ...................................... 63 Figure 8: Extract from the Excel sheet which reports results for SC2 ...................................... 64 Figure 9: Extract from the Excel sheet which reports results for SC3 (the percentage of waste is indicated as compared to total waste produced in the Member State) ................................ 67 Figure 10: Extract from the Excel sheet which reports results for SC4 .................................... 67 Figure 11: Extract from the Excel sheet which reports EC50 values of potentially ecotoxic substances .............................................................................................................................. 68 Figure 12: EC50 of some of the most hazardous pesticides authorised in the EU .................. 69 Figure 13: Extract from the Excel sheet which reports results for SC5 .................................... 70 Figure 14: Extract from the Excel sheet which reports results for SC6 .................................... 70 Figure 15: Proposed calculation methods ............................................................................... 86 Figure 16: Source of samples with current classification available – (a) per Member States; (b) per type of approach ............................................................................................................... 96 Figure 17: Fate of soil & stones waste in Germany in 2012 .................................................. 106
9 Study to assess the impacts of different classification approaches for hazard property "HP 14"
on selected waste streams – Final report
Abstract
No guidelines or recommendations currently exist at EU level for a specific methodology
for the assessment of the ecotoxic property of waste HP 14. As a result, HP 14 assessment
is performed in different ways throughout EU Member States. The revised waste
legislation, which entered into force in June 2015, did not include amendments to the HP
14 property because no satisfactory methodology could be developed and assessed in
time. This study aimed to assess the impacts for Member States and industry of the
implementation of four different options of calculation methods for assessing HP 14. The
comparative assessment of the four calculation methods on a selected sample of mirror
pairs was restricted by limitations in data availability and quality. Nevertheless, results
suggest that the method based on the CLP regulation and considering all relevant H-
phrases, but including neither M-factors nor generic cut-off values, was the most suitable
for assessing HP 14. This method showed good concordance with current classification
(baseline) and classification based on biotest results, as well as reasonable environmental,
social and economic impacts of its implementation.
Il n’existe actuellement pas de lignes directrices ou de recommandations au niveau
européen concernant une méthodologie spécifique pour évaluer la propriété écotoxique
des déchets HP 14. Par conséquent, HP 14 est actuellement évaluée différemment selon
les Etats Membres. Néanmoins, les provisions sur HP 14 de la législation européenne sur
les déchets n’ont pas été amendées lors de la révision récente de cette législation, car il
n’a pas été possible de développer une méthodologie faisant consensus. Dans ce
contexte, cette étude visait à évaluer les impacts sur les Etats Membres et l’industrie, de
l’application de quatre options de calculs pour la détermination de HP 14. Cette étude
comparative, effectuée sur un échantillon de paires-miroir, a été limitée par un manque de
disponibilité et de qualité des données. Cependant, les résultats obtenus suggèrent que la
méthode basée sur le CLP et considérant toutes les phrases de danger pertinentes, mais
pas de facteurs M ni de valeurs seuil, était la plus adaptée pour évaluer HP 14. Cette
méthode a montré une bonne concordance avec la classification actuelle et celle obtenue
avec des biotests, ainsi que des impacts environnementaux, économiques et sociaux
modérés.
10 Study to assess the impacts of different classification approaches for hazard property "HP 14"
on selected waste streams – Final report
This page was left intentionally blank

11 Study to assess the impacts of different classification approaches for hazard property "HP 14"
on selected waste streams – Final report
Executive Summary
Background
The European List of Waste1 (LoW) is meant to be a reference nomenclature for
classification of waste, providing a common terminology throughout the European Union,
with the purpose to improve the efficiency of waste management activities. The assignment
of waste codes and hazardous/non-hazardous classification have a major impact on the
transport of waste, installation permits and decisions about recyclability of the waste.
The LoW comprises 839 waste codes, split into 20 waste chapters including about 200
wastes in so-called “mirror pairs”. A mirror pair consists of a pair of entries of which one
waste may be classified either as hazardous or non-hazardous according to the type and
concentration of the pollutants it contains. The unique basis for differentiating between
hazardous and non-hazardous wastes in mirror pairs is Annex III to the WFD2, which lists
the 15 properties (HP 1 to HP 15) which, if displayed by a waste, renders it hazardous.
Among them, HP 14 describes the ecotoxicological potential of waste, by indicating
whether the waste presents or may present immediate or delayed hazard for one or more
sectors of the environment.
No guidelines or recommendations currently exist at EU-wide level for a specific
methodology for the assessment of HP 14. As a result, assessment of HP 14 is performed
in different ways throughout EU Member States. The lack of harmonisation of methods for
assessing hazardous properties in Member States, including HP 14, is one aspect calling
for a revision of the legislation relevant to those hazardous properties. In particular, it
seems necessary to provide, in the legislation, a specific methodology for assessing the
ecotoxicity of waste, coherent with the methods recommended in the CLP3 and REACH 4regulations.
The revised waste legislation, which entered into force on June 1st 20155, did not include
amendments to the HP 14 property because no satisfactory methodology could be
developed and assessed in time.
Objectives
The study aimed to assess the impacts of changing the criteria for the definition of
ecotoxicity for waste, and especially to assess the implications for Member States and
industry of the implementation of four different options of calculation methods for HP 14
assessment and waste classification.
1 Decision 2014/955/EU, repealing Decision 2000/532/EC from 1 June 2015 and establishing the List of Waste (LoW) 2 Commission Regulation (EU) No 1357/2014 of 18 December 2014 replacing Annex III to Directive 2008/98/EC of the European Parliament and of the Council on waste and repealing certain Directives, http://eur-lex.europa.eu/legal-content/EN/TXT/PDF/?uri=CELEX:32014D0955&from=EN 3 Regulation 1272/2008 on classification, labelling and packaging of substances and mixtures (CLP) 4 Regulation 1907/2006 on Registration, Evaluation, Authorisation and Restriction of Chemicals (REACH) 5 Decision 2014/955/EU, repealing Decision 2000/532/EC from 1 June 2015 and establishing the List of Waste (LoW); and Regulation 1357/2014, repealing Annex III to Directive 2008/98/EC on waste – Waste Framework Directive, or WFD, and defining the properties that render waste hazardous.

12 Study to assess the impacts of different classification approaches for hazard property "HP 14"
on selected waste streams – Final report
Figure 1 : the 4 calculation methods for HP 14 assessment which have been assessed in this study
A diversity of approaches in Member States
The assessment of HP 14 is currently performed in different ways throughout Member
States. When the composition of the waste is known, the attribution of the “ecotoxic”
property is often made on the basis of the criteria of the CLP or DPD6 using the summation
method, thanks to which the classification of a mixture can be derived from the
classification of its components. However, it is difficult to implement this approach for
complex mixtures of mainly unknown composition, which is a common situation for wastes:
the analytical determination of the composition of waste could be both expensive and
technically difficult. In this case, the performance of biotests on the mixture itself is
generally considered as a relevant approach because it allows integrating the effects of all
contaminants including additive, synergistic and antagonistic toxic effects. In addition,
reference data (i.e. EC50, LC50, M-factors) are only available for a limited number of
chemicals, which can significantly impede using the calculation method described in the
CLP regulation. Some Member States evaluate ecotoxicity by biotest or physicochemical
analysis, although there is no standardised battery of biotests for waste at EU level. Other
Member States use formulae or criteria adapted from other assessment methods, for
instance described in their national regulations, in order to determine HP 14. As an
example of diversity of HP14 assessment methods actually implemented in EU MS,
descriptive factsheets have been elaborated for a sample of 9 MS.
Application of the four calculation methods
The assessment of HP 14 according to the four classification methods under study was
performed on a restricted list of mirror pairs selected from an extended list provided by the
Commission and according to the following criteria:
Preference of experts
Availability and quality of data
Tonnage of waste production
6 Directive 1999/45/EC (the Dangerous Preparations Directive)

13 Study to assess the impacts of different classification approaches for hazard property "HP 14"
on selected waste streams – Final report
Economic importance
Potential presence of hazardous substances
Criticality of waste classification
However, limited data availability lead to the different mirror entries originally selected for
the study to not be well represented. After collection of the necessary data (waste
composition, etc.), the calculations using the 4 classification methods were run on the
following pairs:
Mirror pair Description
06 05 02* 06 05 03 sludges from on-site effluent treatment (inorganic chemical processes)
08 01 13* 08 01 14 sludges from paint or varnish (manufacture, formulation, supply and use)
10 01 14* 10 01 15 Bottom ash, slag and boiler dust from co-incineration wastes from power stations
and other combustion plants (except 19)
10 03 19* 10 03 20 flue-gas dust (from aluminium thermal metallurgy)
11 01 09* 11 01 10 sludges and filter cakes (from chemical surface treatment and coating of metals
and other materials)
12 01 14* 12 01 15 machining sludges from shaping and physical and mechanical surface treatment
of metals and plastics
15 01 10* 15 01 01 15
01 02
paper and cardboard packaging, plastic packaging (including separately
collected municipal packaging waste)
17 05 03* 17 05 04 soil and stones (construction and demolition waste, including excavated soil
from contaminated sites)
17 05 05* 17 05 06 dredging spoil (construction and demolition waste)
19 01 11* 19 01 12 bottom ash and slag (from incineration or pyrolysis of waste)
19 01 13* 19 01 14 fly ash (from incineration or pyrolysis of waste)
19 08 11* 19 08 12 sludges from biological treatment of industrial waste water
19 08 13* 19 08 14 sludges from other treatment of industrial waste water
19 10 03* 19 10 04 fluff-light fraction and dust (from shredding of metal-containing waste)
19 12 11* 19 12 12 other wastes (including mixtures of materials) from mechanical treatment of
waste
Results
According to the comparative assessment of the different calculation methods with the
current classification or the classification based on biotest results7, there are some
indications that suggest that Methods 1 and 3 could be the most relevant for waste
classification based on characterisation data. Indeed, even if these methods are associated
to a potential overestimation of waste classification (13% of sample for method 1 and 18%
for method 3), that lead to a good concordance with current classification or classification
based on biotest results, and the false negative rate is very low.
In addition to these observations, Method 1 seems to be more relevant because the same
criteria as those defined in the Regulation 1272/2008 for classification of mixture are
applied (whereas Method 3 is based on the old classification system of mixture, directive
1994/45/EC, that is very different to the concept of CLP regulation because summation of
7 Proposed threshold of 10% for EC50 of all tests in the battery
14 Study to assess the impacts of different classification approaches for hazard property "HP 14"
on selected waste streams – Final report
components classified for different hazard categories is not considered). The only two
differences of Method 1 with CLP are the non-consideration of M-factors and generic cut-
off values. The non-consideration of M-factor has a lesser impact on calculation because
this factor is available only on very few compounds with a harmonised classification.
Regarding the non-consideration of generic cut-off values, this is relevant because some
compounds could be present in waste and could contribute to its toxicity even at low
concentration due to additivity of hazards. This means that the application of this method
could then be consistent with the CLP regulation and allows industrials not to apply other
additional methods.
In the context of a combined approach, an alternative two-step strategy could be envisaged
for waste classification in relation to HP 14. The first step would consist into applying a
summation method (the one ultimately selected for HP 14 assessment). In a second step,
if the waste cannot be adequately classified according to step 1 (e.g. due to very limited
information on its composition), an experimental approach using one or several biotests
(perhaps also in a tiered approach) could be applied.
An experimental approach could also be directly considered if the composition of the waste
is unknown or complex.
Limitations
Several limitations are associated to available data:
In most cases, characterisation data only report elemental compound
concentrations, presence of organic compounds is rarely reported at all;
a significant fraction of the waste is not identified;
worst-case assumptions (based on highest toxicity values) are made in the
selection of the identity compounds used for subsequent classification of the
waste; and
the applicability of the calculation methods is limited by the availability of
harmonised classifications for the substances.
Impact assessment
The implementation of any of the four calculation methods is likely to lead to changes in
the classification of some waste, and thus affect the quantities of waste classified as
hazardous and non-hazardous for each individual mirror pair. This, in turn, would lead to
environmental, economic and social impacts.
The impact assessment conducted in this study aims at roughly estimating the
consequences of the implementation of each of the four methods on the waste streams
corresponding to the selected mirror pairs against a baseline scenario (i.e. the current
situation, and further development excluding the implementation of the 4 calculation
methods). The baseline scenario was determined at EU level, with no distinction between
Member States. This distinction would have been relevant (different Member States apply
different criteria), but lack of data prevents such a detailed assessment (not enough
collected samples).
The environmental, social and economic impacts of this implementation were investigated,
with the following indicators:
Environmental aspects:
o Recovery schemes (includes percentages of waste recycled vs
landfilled)
o Benefits of recovering the waste
15 Study to assess the impacts of different classification approaches for hazard property "HP 14"
on selected waste streams – Final report
o Pollution due to contaminated fractions of the waste
Economic aspects
o Costs of disposal
o Costs of recycling
Social aspects
o Employment
o Public Health
For data availability reasons, the full impact assessment could only be performed on four
mirror pairs:
Soil and stones waste (17 05 03*/17 05 04)
Incinerator bottom ash (19 01 11*/19 01 12)
Fly ash from incinerators (19 01 13* / 19 01 14)
Fluff-light fraction and dust from shredding of metal-containing waste (19 10
03*/19 10 04)
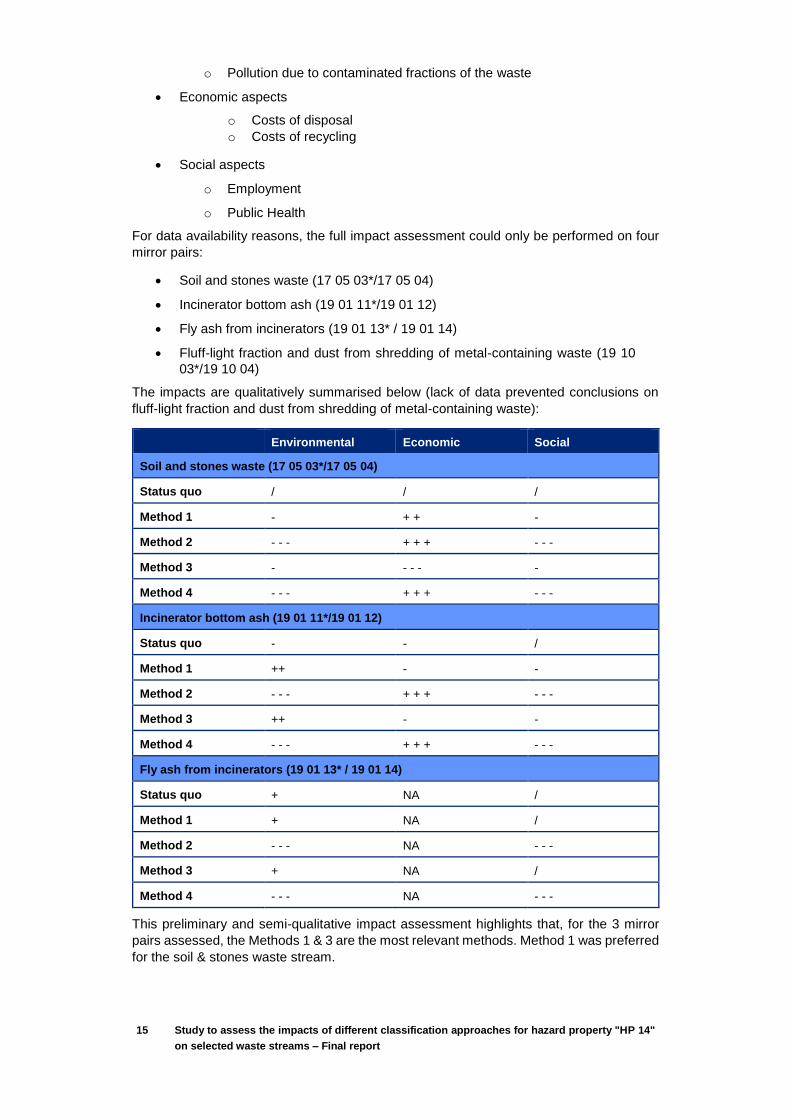
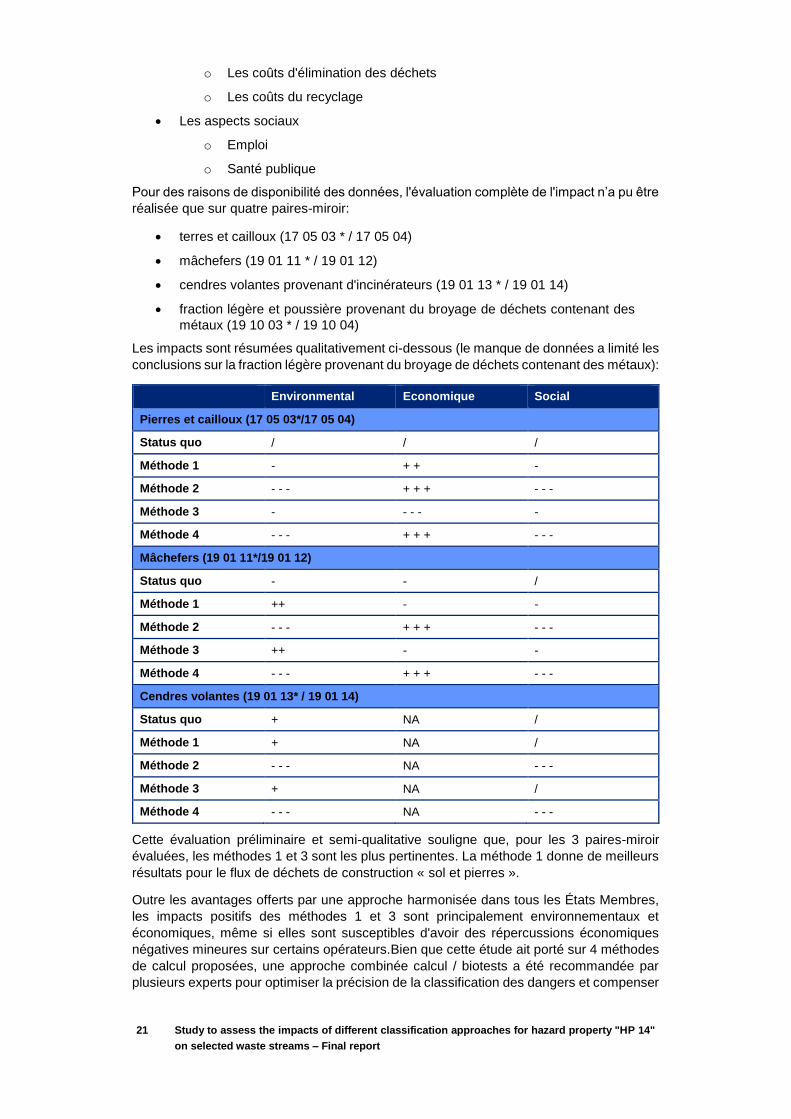
The impacts are qualitatively summarised below (lack of data prevented conclusions on
fluff-light fraction and dust from shredding of metal-containing waste):
Environmental Economic Social
Soil and stones waste (17 05 03*/17 05 04)
Status quo / / /
Method 1 - + + -
Method 2 - - - + + + - - -
Method 3 - - - - -
Method 4 - - - + + + - - -
Incinerator bottom ash (19 01 11*/19 01 12)
Status quo - - /
Method 1 ++ - -
Method 2 - - - + + + - - -
Method 3 ++ - -
Method 4 - - - + + + - - -
Fly ash from incinerators (19 01 13* / 19 01 14)
Status quo + NA /
Method 1 + NA /
Method 2 - - - NA - - -
Method 3 + NA /
Method 4 - - - NA - - -
This preliminary and semi-qualitative impact assessment highlights that, for the 3 mirror
pairs assessed, the Methods 1 & 3 are the most relevant methods. Method 1 was preferred
for the soil & stones waste stream.
16 Study to assess the impacts of different classification approaches for hazard property "HP 14"
on selected waste streams – Final report
Apart from the benefits provided by a harmonised approach across Member States,
positive impacts from Methods 1 & 3 are mainly environmental and economic, although
they are likely to have minor negative economic impacts on some operators.
Conclusions
The comparative assessment of the four calculation methods on a selected sample of
mirror pairs was restricted by limitations in data availability and quality. Nevertheless,
results of the comparison between the 4 calculation methods give some indication that
Method 1 is the most relevant:
Good concordance with current classification (baseline) and classification
based on biotest results;
Aligned with the CLP regulation;
Reasonable environmental, social and economic impacts of its
implementation.
Although this study focused on calculation methods, a combined approach has been
recommended by several experts to optimise the accuracy of hazard classification and
offset limitations of both calculation and biotests methods alone. Nevertheless, there will
be a need to derive a harmonised threshold value for use biotests in waste classification
for code HP 14, as well as the definition of a minimum test battery. Further to this, political
agreement on the proposal would have to be sought. Some work is currently performed in
some MS to build threshold values using non-hazardous absolute entries.

17 Study to assess the impacts of different classification approaches for hazard property "HP 14"
on selected waste streams – Final report
Contexte
La liste européenne des déchets (List of Waste ou « LoW »)8 est destinée à servir de
nomenclature de référence pour la classification des déchets, fournissant une terminologie
commune dans toute l'Union européenne, dans le but d'améliorer l'efficacité des activités
de gestion des déchets. L’attribution de codes de déchets dangereux et la classification en
dangereux / non dangereux ont un impact majeur sur le transport des déchets, les permis
d’installation et les décisions relatives au recyclage.
La LoW comprend 839 codes de déchets, répartis en 20 chapitres incluant environ 200
déchets caractérisés par des « paires-miroir ». Un déchet caractérisé par une paire-miroir
peut être classé soit comme dangereux (selon une entrée de la paire) ou non dangereux
(selon l’autre entrée) selon le type et la concentration des polluants qu'il contient. L'annexe
III de la Directive Cadre sur les Déchets9 est la référence unique pour déterminer si un
déchet caractérisé par une paire-miroir est dangereux ou non. L’attribution à un déchet de
une ou plusieurs des propriétés (HP 1 à 15) énumérées dans cette annexe entraîne la
classification de ce déchet sous l’entrée « dangereuse » de la paire-miroir. Parmi ces
propriétés, HP 14 décrit le potentiel écotoxique des déchets, en indiquant s’ils présentent
ou peuvent présenter un danger à court ou long terme pour un ou plusieurs compartiments
environnementaux.
Il n’existe actuellement pas de lignes directrices ou de recommandations au niveau
européen concernant une méthodologie spécifique pour évaluer la propriété écotoxique
des déchets HP 14. Par conséquent, HP 14 est actuellement évaluée différemment selon
les Etats Membres. Ce manque d'harmonisation des méthodes d'évaluation des propriétés
dangereuses HP dans les États membres, y compris HP 14, est l’un des aspects ayant
appelé à une révision de la législation relative à ces propriétés. En particulier, il semble
nécessaire de prévoir, dans la loi, une méthodologie spécifique pour évaluer l'écotoxicité
des déchets, cohérente avec les méthodes recommandées dans les réglementations
CLP10 et REACH11.
Néanmoins, les provisions de la législation européenne sur les déchets concernant HP 14,
n’ont pas été amendées lors de la révision récente de cette législation12, car il n’a pas été
possible de développer une méthodologie faisant consensus.
Objectifs
L'étude vise à évaluer les impacts de la modification des critères de la définition de
l'écotoxicité des déchets, et en particulier à évaluer les implications pour les Etats Membres
et l'industrie de la mise en œuvre de quatre options différentes de méthodes de calcul pour
HP 14.
8 Décision 2014/955 / UE, abrogeant la décision 2000/532 / CE à partir du 1er Juin 2015 et établissant la liste des déchets 9 Règlement (UE) n ° 1357/2014 de la Commission du 18 Décembre 2014 remplaçant l'annexe III de la directive 2008/98 / CE du Parlement européen et du Conseil relative aux déchets et abrogeant certaines directives, http://eur-lex.europa.eu/ juridique-content / FR / TXT / PDF / uri = CELEX: 32014D0955 & from = FR 10 Règlement 1272/2008 relatif à la classification, l'étiquetage et l'emballage des substances et des mélanges (CLP) 11 Règlement 1907/2006 sur l'enregistrement, évaluation, autorisation et restriction des produits chimiques (REACH) 12 Décision 2014/955 / UE, abrogeant la décision 2000/532 / CE à partir du 1er Juin 2015 et établissant la liste des déchets ; et le règlement 1357/2014, abrogeant l'annexe III de la directive 2008/98 / CE relative aux déchets - Directive cadre sur les déchets, et définissant les propriétés qui rendent les déchets dangereux

18 Study to assess the impacts of different classification approaches for hazard property "HP 14"
on selected waste streams – Final report
Figure : les quatre méthodes de calcul évaluées dans cette étude
Une diversité des approches dans les Etats Membres
L'évaluation de HP 14 est actuellement réalisée de différentes façons à travers les États
membres. Lorsque la composition des déchets est connu, l'attribution de la propriété
"écotoxique" est souvent effectuée sur la base des critères de la CLP ou DPD13 en utilisant
les méthodes de sommation, grâce auxquelles la classification d’un mélange peuvent être
dérivée de la classification de ses composants. Cependant, il est difficile de mettre en
œuvre cette approche pour des mélanges complexes de composition essentiellement
inconnue, ce qui est une situation courante pour les déchets: la détermination analytique
de la composition des déchets pourrait être à la fois coûteuse et techniquement difficile.
Dans ce cas, la mise en œuvre de bio-essais sur le mélange lui-même est généralement
considérée comme une approche pertinente, car elle permet d'intégrer les effets de tous
les contaminants, y compris additifs, synergiques et antagonistes. En outre, des données
de référence (par exemple CE50, CL50, facteurs M) ne sont disponibles que pour un
nombre limité de produits chimiques, ce qui peut entraver de manière significative
l'utilisation de la méthode de calcul décrite dans le règlement CLP. Certains États membres
évaluent l'écotoxicité par biotest, bien qu'il n'y ait pas de batterie standardisée de tests
biologiques pour les déchets au niveau de l'UE. D'autres États membres utilisent des
formules ou des critères adaptés à partir d'autres méthodes d'évaluation, par exemple
décrit dans leurs réglementations nationales, afin de déterminer HP 14. A titre d'exemple
de la diversité des méthodes d'évaluation effectivement mises en œuvre dans d’UE, des
fiches descriptives ont été élaborées pour un échantillon de 9 Etats Membres.
Calculs avec les quatre méthodes proposées
L'évaluation de HP 14 selon les quatre méthodes de classification étudiée a été réalisée
sur une liste restreinte de paires-miroir sélectionnées à partir d'une liste fournie par la
Commission et selon les critères suivants:
La préférence des experts
Disponibilité et qualité des données
Le tonnage de la production de déchets
Importance économique
Présence possible de substances dangereuses
13 Directive 1999/45/EC (Directive Préparations Dangereuses)

19 Study to assess the impacts of different classification approaches for hazard property "HP 14"
on selected waste streams – Final report
Criticité de la classification des déchets
Cependant, les paires-miroir ainsi sélectionnés n’ont pas pu être bien représentés par la
disponibilité effective des données. Après collecte des données nécessaires (composition
des déchets, etc.), les calculs correspondant aux quatre méthodes de classification à
l’étude ont été effectués sur les paires suivantes :
Paire-miroir Description
06 05 02* 06 05 03 boues provenant du traitement in situ des effluents (procédés de la chimie minérale )
08 01 13* 08 01 14 boues provenant de peintures ou vernis (fabrication, formulation, distribution et utilisation)
10 01 14* 10 01 15 mâchefers, scories et cendres sous chaudière provenant de la co-incinération (déchets provenant de centrales électriques et autres installations de combustion (sauf chapitre 19))
10 03 19* 10 03 20 poussières de filtration des fumées (pyrométallurgie de l'aluminium)
11 01 09* 11 01 10 boues et gâteaux de filtration (du traitement chimique de surface et du revêtement des métaux et autres matériaux)
12 01 14* 12 01 15 boues d'usinage de la mise en forme et du traitement physique et mécanique de surface des métaux et matières plastiques
15 01 10* 15 01 01 15 01 02
emballages en papier/carton et emballages en matière plastique (y compris les déchets d'emballages municipaux collectés séparément)
17 05 03* 17 05 04 terres et cailloux (déchets de construction et de démolition, y compris déblais provenant de sites contaminés)
17 05 05* 17 05 06 boues de dragage (déchets de construction et de démolition, construction and demolition waste)
19 01 11* 19 01 12 mâchefers (provenant des installations de gestion des déchets)
19 01 13* 19 01 14 cendres volantes (provenant des installations de gestion des déchets)
19 08 11* 19 08 12 boues provenant du traitement biologique des eaux usées industrielles
19 08 13* 19 08 14 boues provenant d'autres traitements des eaux usées industrielles
19 10 03* 19 10 04 fraction légère des résidus de broyage et poussières (provenant du broyage de déchets contenant des métaux
19 12 11* 19 12 12 autres déchets (y compris mélanges) provenant du traitement mécanique des déchets
Résultats
L'étude comparative des différentes méthodes de calcul avec la classification actuelle et
celle basée sur les résultats de biotests suggèrent que les méthodes 1 et 3 pourrait être
les plus pertinentes pour la classification des déchets sur la base de données de
caractérisation. En effet, même si ces méthodes sont associées à une surestimation
potentielle de la classification des déchets (13% de l'échantillon pour la méthode 1 et 18%
pour la méthode 3), elles mènent à une bonne concordance avec la classification actuelle
et celle basé sur les résultats de biotests. De plus, le taux de faux négatif est très faible.
Par ailleurs, la méthode 1 semble être plus pertinente car elle intègre les mêmes critères
que ceux définis dans le règlement CLP pour la classification du mélange (alors que la
méthode 3 est basé sur l'ancien système de classification du mélange DPD, dont l’esprit
est différent de celui du règlement CLP, car la somme des composants classés pour les
différentes catégories de danger ne sont pas considérés). Les deux seules différences de
la méthode 1 avec le CLP sont la non-considération des facteurs M et l’inclusion de valeurs
seuils génériques. La non prise en compte des facteurs M a un impact moindre sur le
calcul, car ce facteur est disponible uniquement sur très peu de composés ayant une
classification harmonisée. Il aurait cependant été pertinent d’inclure des valeurs seuils
20 Study to assess the impacts of different classification approaches for hazard property "HP 14"
on selected waste streams – Final report
génériques, car certains composés pourraient être présents dans les déchets et pourraient
contribuer à sa toxicité, même à faible concentration, en raison de l'additivité des risques.
Ainsi, la méthode 1 pourrait alors être compatible avec le règlement CLP et permettrait aux
industriels de ne pas appliquer des méthodes supplémentaires.
Dans le contexte d'une approche combinée, une stratégie alternative en deux étapes
pourrait être envisagée pour la classification des déchets selon HP 14. La première étape
consisterait en l'application d'une méthode de sommation (celle finalement retenue pour
l’évaluation de HP 14). Dans un deuxième temps, si les déchets ne peuvent être classés
de manière adéquate selon l'étape 1 (par exemple en raison de très peu d'informations sur
sa composition), une approche expérimentale en utilisant un ou plusieurs tests biologiques
(peut-être aussi dans une approche à plusieurs niveaux) pourrait être appliquée.
Une approche expérimentale pourrait également être directement envisagée si la
composition des déchets est inconnue ou complexe.
Limites
Plusieurs limites sont associées aux données disponibles:
Dans la plupart des cas, les données de caractérisation ne rapportent que les
concentrations de composés élémentaires, la présence de composés
organiques sont rarement signalés du tout;
Une fraction importante des déchets n’est pas identifiée ;
Des hypothèses pire-cas (basées sur les valeurs de toxicité les plus élevés)
sont réalisées dans la sélection des composés utilisés pour la classification
des déchets; et
L'applicabilité des méthodes de calcul est limitée par la disponibilité des
classifications harmonisées pour les substances.
Etude d’impact
La mise en œuvre de l'une des quatre méthodes de calcul est susceptible de conduire à
des changements dans la classification de certains déchets, et donc affecter les quantités
de déchets classés comme dangereux et non dangereux pour chaque paire-miroir. Ceci,
à son tour, conduirait à des impacts environnementaux, économiques et sociaux.
L'évaluation d'impact réalisée dans cette étude vise à estimer les conséquences de la mise
en œuvre de chacune des quatre méthodes sur les flux de déchets correspondant aux
paires-miroir sélectionnées par rapport à un scénario de référence (c’est-à-dire de
développement de la situation actuelle excluant l'application de l’une des 4 méthodes de
calcul). Le scénario de référence a été déterminé au niveau de l'UE, sans distinction entre
les États membres. Cette distinction aurait été pertinent (différents États membres
appliquent des critères différents), mais le manque de données empêche une telle
évaluation détaillée.
Les impacts environnementaux, sociaux et économiques ont été caractérisés par les
indicateurs suivants:
Les aspects environnementaux:
o systèmes de récupération des déchets (y compris les pourcentages
de déchets recyclés vs enfouis)
o les avantages de la récupération des déchets
o la pollution due à des fractions des déchets contaminés
Les aspects économiques
21 Study to assess the impacts of different classification approaches for hazard property "HP 14"
on selected waste streams – Final report
o Les coûts d'élimination des déchets
o Les coûts du recyclage
Les aspects sociaux
o Emploi
o Santé publique
Pour des raisons de disponibilité des données, l'évaluation complète de l'impact n’a pu être
réalisée que sur quatre paires-miroir:
terres et cailloux (17 05 03 * / 17 05 04)
mâchefers (19 01 11 * / 19 01 12)
cendres volantes provenant d'incinérateurs (19 01 13 * / 19 01 14)
fraction légère et poussière provenant du broyage de déchets contenant des
métaux (19 10 03 * / 19 10 04)
Les impacts sont résumées qualitativement ci-dessous (le manque de données a limité les
conclusions sur la fraction légère provenant du broyage de déchets contenant des métaux):
Environmental Economique Social
Pierres et cailloux (17 05 03*/17 05 04)
Status quo / / /
Méthode 1 - + + -
Méthode 2 - - - + + + - - -
Méthode 3 - - - - -
Méthode 4 - - - + + + - - -
Mâchefers (19 01 11*/19 01 12)
Status quo - - /
Méthode 1 ++ - -
Méthode 2 - - - + + + - - -
Méthode 3 ++ - -
Méthode 4 - - - + + + - - -
Cendres volantes (19 01 13* / 19 01 14)
Status quo + NA /
Méthode 1 + NA /
Méthode 2 - - - NA - - -
Méthode 3 + NA /
Méthode 4 - - - NA - - -
Cette évaluation préliminaire et semi-qualitative souligne que, pour les 3 paires-miroir
évaluées, les méthodes 1 et 3 sont les plus pertinentes. La méthode 1 donne de meilleurs
résultats pour le flux de déchets de construction « sol et pierres ».
Outre les avantages offerts par une approche harmonisée dans tous les États Membres,
les impacts positifs des méthodes 1 et 3 sont principalement environnementaux et
économiques, même si elles sont susceptibles d'avoir des répercussions économiques
négatives mineures sur certains opérateurs.Bien que cette étude ait porté sur 4 méthodes
de calcul proposées, une approche combinée calcul / biotests a été recommandée par
plusieurs experts pour optimiser la précision de la classification des dangers et compenser

22 Study to assess the impacts of different classification approaches for hazard property "HP 14"
on selected waste streams – Final report
à la fois les limites des méthodes de calcul et celles des méthodes biotests seules.
Néanmoins, il faudrait définir une valeur seuil harmonisée pour pouvoir utiliser les biotests
dans la classification des déchets selon HP 14, ainsi que la définition d'une batterie d'essai
minimale. Suite à cela, il faudrait trouver un accord politique sur la proposition. A noter que
certains travaux sont actuellement en cours dans certains États Membres pour construire
des valeurs de seuil.
23 Study to assess the impacts of different classification approaches for hazard property "HP 14"
on selected waste streams – Final report
1. Introduction
1.1. Background
In the EU, classification of waste is based on two regulatory texts:
Decision 2014/955/EU14, repealing Decision 2000/532/EC15 from 1 June 2015
and establishing the List of Waste (LoW); and
Regulation 1357/201416, repealing Annex III to Directive 2008/98/EC17 on
waste – Waste Framework Directive, or WFD, and defining the properties that
render waste hazardous.
The LoW is meant to be a reference nomenclature providing a common terminology
throughout the European Union, with the purpose to improve the efficiency of waste
management activities. Assignment of waste codes has a major impact on the transport of
waste, installation permits (which are usually granted for the processing of specific waste
codes) or decisions about recyclability of the waste. The LoW thus serves as a common
encoding of waste characteristics in a broad variety of purposes, including classification of
hazardous wastes.
Wastes classified as hazardous are those considered to display one or more of the 15
properties (H1 to H15) listed in Annex III to the WFD (now named HP 1 to HP 15 in
Regulation 1357/2014). Among them, HP 14 describes the ecotoxicological potential or
environmental hazards, as an intrinsic property of waste, by indicating whether the waste
presents or may present immediate or delayed risks for one or more sectors of the
environment.
The LoW comprises 839 waste codes in 20 waste chapters including 405 wastes marked
as hazardous (absolute entries) and about 200 wastes in so-called “mirror pairs”. Mirror
pairs consist of pairs of entries of which one waste may be classified as hazardous or non-
hazardous according to the type and concentration of the pollutants it contains. The unique
basis for differentiating between hazardous and non-hazardous wastes in mirror pairs is
Annex III to the WFD (i.e. the list of 15 hazardous properties). Wastes classified as
hazardous are marked with an asterisk “*” in the LoW. The majority of mirror pairs refer to
the term “hazardous” substances with no further description, while some describe
hazardous properties or the specific hazardous waste component.
The legislation framework for classifying waste in the EU is closely linked to
chemicals legislation. Prior to June 2015, the attribution of any of the hazardous
properties listed in Annex III of the WFD were to be done in accordance with the criteria
laid down by Annex VI to Directive 67/548/EEC18 (the Dangerous Substance Directive, or
DSD) regarding the terms ‘toxic’ (and ‘very toxic’), ‘harmful’, ‘corrosive’, ‘irritant’,
14 Commission Decision of 18 December 2014 amending Decision 2000/532/EC on the list of waste pursuant to Directive 2008/98/EC of the European Parliament and of the Council, http://eur-lex.europa.eu/legal-content/EN/TXT/PDF/?uri=CELEX:32014D0955&from=EN 15 2000/532/EC: Commission Decision of 3 May 2000 replacing Decision 94/3/EC establishing a list of wastes pursuant to Article 1(a) of Council Directive 75/442/EEC on waste and Council Decision 94/904/EC establishing a list of hazardous waste pursuant to Article 1(4) of Council Directive 91/689/EEC on hazardous waste (notified under document number C(2000) 1147), http://eur-lex.europa.eu/legal-content/EN/TXT/PDF/?uri=CELEX:32000D0532&from=EN 16 Commission Regulation (EU) No 1357/2014 of 18 December 2014 replacing Annex III to Directive 2008/98/EC of the European Parliament and of the Council on waste and repealing certain Directives, http://eur-lex.europa.eu/legal-content/EN/TXT/PDF/?uri=CELEX:32014D0955&from=EN 17 Directive 2008/98/EC of the European Parliament and of the Council of 19 November 2008 on waste, http://eur-lex.europa.eu/legal-content/EN/TXT/PDF/?uri=CELEX:32008L0098&from=EN 18 Council Directive 67/548/EEC of 27 June 1967 on the approximation of laws, regulations and administrative provisions relating to the classification, packaging and labelling of dangerous substances, http://eur-lex.europa.eu/legal-content/EN/TXT/PDF/?uri=CELEX:31967L0548&from=en
24 Study to assess the impacts of different classification approaches for hazard property "HP 14"
on selected waste streams – Final report
‘carcinogenic’, ‘toxic to reproduction’, ‘mutagenic’ and ‘eco-toxic’, used for the definition of
the DSD R-phrases. If relevant, the limit values listed in Annex II and III to Directive
1999/45/EC (the Dangerous Preparations Directive, or DPD) were to apply. However, the
DSD and the DPD were repealed on 1 June 2015 by Regulation 1272/200819 on
classification, labelling and packaging of substances and mixtures (CLP) and Regulation
1907/200620 on Registration, Evaluation, Authorisation and Restriction of Chemicals
(REACH). In particular, R-phrases do not exist under the CLP Regulation and are replaced
by the naming of a hazard class and a signal word.
According to Annex III of the WFD (repealed on June 2015 by Regulation 1357/2014), tests
for assessing the H1 to H15 properties must be done following the methods in Annex V to
the DSD and in other relevant CEN-notes. However, the REACH Regulation refers to Test
Method Regulation (EC) 440/2008, which has taken over all test methods from the Annex
V to the DSD. In practice, assessing some of the hazardous properties listed in Annex III
has not been straightforward. This is particularly true for H 14: although Part C of Annex V
to the DSD and Part C of Regulation (EC) No 440/2008 lay down the test methods for the
determination of ecotoxicity, no guidelines or recommendations exist at EU-wide level for
a specific methodology for the assessment of H 14. This is can be explained – at least
partly – by the fact that it is only relatively recently that the relevant pieces of legislation
have considered ecotoxic properties: in 1999 for the DPD and in 2008 for the WFD.
As a result, assessment of H 14 is performed in different ways throughout Member
States. When the composition of the waste is known, the attribution of the “ecotoxic”
property is often made on the basis of the criteria of the CLP using the summation method,
thanks to which the classification of a mixture can be derived from the classification of its
components. However, it is difficult to implement this approach for complex mixtures of
mainly unknown composition, which is a common situation for wastes: the analytical
determination of the composition of waste could be both expensive and technically difficult.
In this case, the performance of bio-tests on the mixture itself is generally considered as a
relevant approach because it allows integrating the effects of all contaminants including
additive, synergistic and antagonistic toxic effects. In addition, reference data (i.e. EC50,
LC50, M-factors) are only available for a limited number of chemicals, which can
significantly impede using the summation method described in the CLP regulation21. Some
Member States evaluate eco-toxicity by biotest or physicochemical analysis, although there
is no standardised battery of biotests for waste at EU level. Other Member States use
formulae or criteria adapted from other assessment methods, for instance described in their
national regulations, in order to determine H 14 properties of waste. The lack of
harmonisation of methods for assessing hazardous properties in Member States, including
H 14, is one aspect calling for a revision of the legislation relevant to those hazardous
properties. In particular, it seems necessary to provide, in the legislation, a specific
methodology for assessing the ecotoxicity of waste, coherent with the methods
recommended in the CLP and REACH regulations.
Reflecting scientific and technical progress and ensuring coherence with chemical
legislation was the main driver for the launch, in 2008, of the review of the LoW and
of the WFD22, which led to the amendment of Decision 2000/532/EC and of Annex III
to the WFD, by – respectively – Decision 2014/955/EU and Regulation 1357/2014.
19 Regulation (EC) No 1272/2008 of the European Parliament and of the Council of 16 December 2008 on classification, labelling and packaging of substances and mixtures, amending and repealing Directives 67/548/EEC and 1999/45/EC, and amending Regulation (EC) No 1907/2006, http://eur-lex.europa.eu/legal-content/EN/TXT/PDF/?uri=CELEX:32008R1272&from=en 20 Regulation (EC) No 1907/2006 of the European Parliament and of the Council of 18 December 2006 concerning the Registration, Evaluation, Authorisation and Restriction of Chemicals (REACH), establishing a European Chemicals Agency, amending Directive 1999/45/EC and repealing Council Regulation (EEC) No 793/93 and Commission Regulation (EC) No 1488/94 as well as Council Directive 76/769/EEC and Commission Directives 91/155/EEC, 93/67/EEC, 93/105/EC and 2000/21/EC, http://eur-lex.europa.eu/legal-content/EN/TXT/PDF/?uri=CELEX:32006R1907&from=en 21J. Römbke, R. Ketelhut& J. Wuttke (2013) Scientific Position Paper: For the European Commission Ecotoxicological Classification of Wastes (Criterion HP 14) 22 http://ec.europa.eu/environment/waste/framework/pdf/Technical_proposal.pdf

25 Study to assess the impacts of different classification approaches for hazard property "HP 14"
on selected waste streams – Final report
Indeed, a Member State stakeholders’ consultation performed by the EU Committee for
the Adaptation to Scientific and Technical Progress and Implementation (TAC), identified
the following issues:
Problems resulting from the structure of the LoW and the classification
procedure;
Problems concerning the classification of hazardous waste and the application
of mirror pairs;
Problems resulting from the lack of suitable waste codes;
Ambiguous classification on account of two or more possible codes;
Problems resulting from unclear or imprecise definitions.
The Commission constituted a dedicated Working Group in order to address these issues,
“the Working Group for the amendment of the European waste list” (WG). Work conducted
by the WG relates to the review of the hazardous properties listed in Annex III to the WSD
(including H 14) and the definition to be included in Article 2 of Decision 2000/532/EC.
During their meeting of June 201123, the Working Group agreed that the H-Criteria shall be
renamed HP1 to 15 in order to avoid confusions with the H-statements of the CLP
Regulation. Therefore, “H 14” will be named “HP 14” from this line on.
Although the governing principle of the review was an alignment with CLP, it was agreed
that a strict alignment, including concentration limits, may not in all cases be appropriate
for wastes and could lead to unpredictable changes in the amount of wastes being
classified as hazardous. This issue concerns HPs 4, 6, 8 13 and 14 and caused
disagreements within the Working Group.
In November 2011, it was proposed that specific concentration limits/M-factors according
to CLP Annex VI should not be used for waste classification24, but rather that generic
concentration limits be provided directly in Article 2 of the LoW. However, in the specific
case of HP 14, some Member States were not in favour of deleting the M-factors from the
CLP summation method and proposed keeping the M-factors but deleting the categories
chronic categories 3 and 4 in the summation.
As no agreement was reached, two options for the assessment of HP 14 were proposed
in the Technical Proposal on the review of the Hazardous Properties25. Option 1 is based
on aquatic toxicity and does not include M-factors, while Option 2 also relies on aquatic
toxicity but includes M-factors. The proposal was submitted for consultation and triggered
reactions from the industry, notably regarding the issue of the change of classification of
some types of waste.
Scientific and technical work is ongoing to refine and analyse the options for
assessing HP 14 under a revised legislation. In 2013, four options were designed on
the basis of the work conducted by the Working Group for the amendment of the European
waste list. These options take into account proposals from the Commission, France and
Austria and aim at fulfilling four criteria for the assessment of HP 14:
Smooth transition to CLP possible;
User-friendly;
Changes compared to status quo; and
Sufficient environmental protection level.
23 Working Group For The Amendment Of The European Waste List, Summary Record Of The Meeting Held On 15 -16 June 2011 24 Working Group For The Amendment Of The European Waste List, Summary Record Of The Meeting Held On 28 -29 November 2011 25 http://ec.europa.eu/environment/waste/framework/pdf/Technical_proposal_tc.pdf

26 Study to assess the impacts of different classification approaches for hazard property "HP 14"
on selected waste streams – Final report
Based on these options, the Commission designed four calculation methods for further
evaluation of the impact of a revision of the assessment of HP 14, with regards to the
technical feasibility of such a revision, as well as its economic, social and environmental
impacts. The potential use of biotests in combination with those methods is also an issue
to be addressed for the assessment of HP 14. However, there was a consensus in the
working group that further work was needed to formulate a definition of ‘ecotoxicity’.
Therefore, it was decided to amend the waste classification legislation without changing
the definition of ecotoxicity. The amendment of this hazardous property should be
postponed until a satisfactory proposal could be developed and assessed.
Based on the proposals developed by the working group, legislative proposals to amend
Decision 2000/532/EC and Annex III to Directive 2008/98/EC were drafted and adopted,
being published in the OJ in December 2014 as Decision 2014/955/EU and Regulation
1357/2014, respectively. They entered into force on 1 June 2015.
1.2. Objectives
The objective of this study is to assist the Commission to assess the impacts of changing
the criteria for the definition of eco-toxicity for waste, and especially to assess the
implications for Member States and industry of the implementation of four different options
of calculation methods for HP 14 assessment and waste classification. The following
aspects will be studied:
The ability to apply the methodology as a function of the nature and amount of
analytical information available;
The degree of correlation with biotest results;
The workability of the methodology;
The cost of implementation of the methodology;
The impact of the classification method chosen for HP 14 with respect to the
other methods and with respect to the current baseline;
The nature and estimation of costs of possible waste management options for
high volume waste streams for which a significant change in the fraction of
waste classified as hazardous is to be expected based on the application of
the different methods.
The identification of the potential limits of the proposed methodologies is another objective
of this study.
27 Study to assess the impacts of different classification approaches for hazard property "HP 14"
on selected waste streams – Final report
2. Methodology
The impact assessment of changing the criteria for the definition of ecotoxicity for waste
involves the following tasks:
Task 1: Data collection on how 8 Member States perform the assessment of
HP 14 in practice;
Task 2: Identification and data-collection relative to waste codes to be selected for the assessment;
Task 3: Determining the classification of waste types according to the different methodologies proposed;
Task 4: Comparative assessment of the technical, economical and practical impacts of the different methodologies;
Task 5: A stakeholder consultation and a workshop.
The next sections detail the methodology used to perform these tasks.
2.1. Collecting data on how a sample of Member States perform the assessment of HP 14
The current strategies implemented in different Member States to assess HP 14, including
relevant legislation and details about the approaches, were reported in country factsheets
thanks to a survey of Member States and a desk study.
2.1.1. Selection of countries and data collection by survey
Ten Member States were contacted with the aim to gather data on their strategies to assess
HP 14:
Austria
France
Belgium
Germany
Italy
Finland
Czech
Republic
United
Kingdom
Spain
Poland
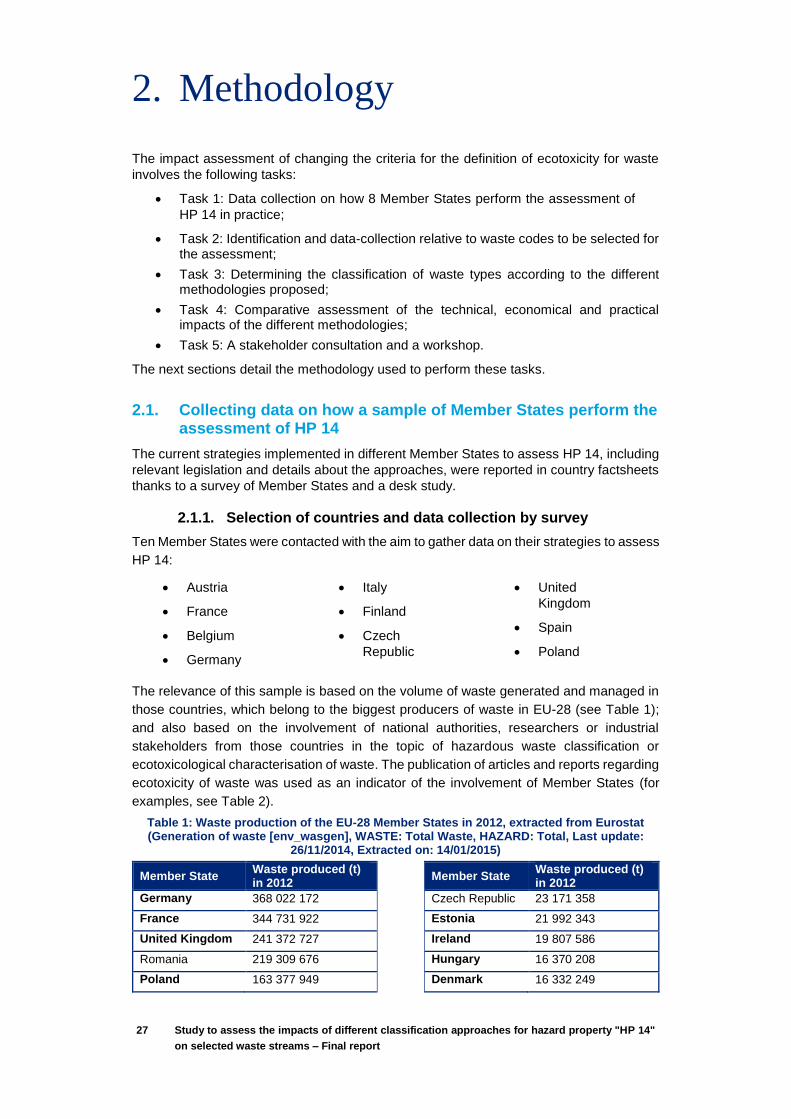
The relevance of this sample is based on the volume of waste generated and managed in
those countries, which belong to the biggest producers of waste in EU-28 (see Table 1);
and also based on the involvement of national authorities, researchers or industrial
stakeholders from those countries in the topic of hazardous waste classification or
ecotoxicological characterisation of waste. The publication of articles and reports regarding
ecotoxicity of waste was used as an indicator of the involvement of Member States (for
examples, see Table 2).
Table 1: Waste production of the EU-28 Member States in 2012, extracted from Eurostat (Generation of waste [env_wasgen], WASTE: Total Waste, HAZARD: Total, Last update:
26/11/2014, Extracted on: 14/01/2015)
Member State Waste produced (t) in 2012
Member State
Waste produced (t) in 2012
Germany 368 022 172 Czech Republic 23 171 358
France 344 731 922 Estonia 21 992 343
United Kingdom 241 372 727 Ireland 19 807 586
Romania 219 309 676 Hungary 16 370 208
Poland 163 377 949 Denmark 16 332 249

28 Study to assess the impacts of different classification approaches for hazard property "HP 14"
on selected waste streams – Final report
Member State Waste produced (t) in 2012
Member State
Waste produced (t) in 2012
Italy 162 764 633 Portugal 14 184 456
Bulgaria 161 252 166 Slovakia 8 425 384
Sweden 156 366 579 Luxembourg 8 397 228
Netherlands 123 612 767 Lithuania 5 583 082
Spain 118 561 669 Slovenia 4 546 505
Finland 91 824 193 Croatia 3 378 638
Greece 72 328 280 Latvia 2 309 581
Belgium 66 932 665 Cyprus 2 086 469
Austria 34 047 465 Malta 1 496 464
Table 2: Example of publications in the waste classification topic of selected Member States (non-exhaustive)
Member State Example of publication
UK University of Birmingham (2014) Health and Safety Guidance Hazardous
Waste: Guidance on Assessment GUIDANCE/11/HWGA/14
Hazardous waste Interpretation of the definition and classification of
hazardous waste (3rd Edition 2013)
Finland Kati Vaajasaari (2005) Leaching and Biotests as Methods for Classification
and Assessment of Environmental Hazard of Solid Wastes. Tempere
University of Technology
France Pascal Pandard and Jörg Römbke (2013) Proposal for a “Harmonized”
Strategy for the Assessment of the HP 14 Property; Integrated
Environmental Assessment and Management — Volume 9, Number 4—
pp. 665–672
Pandard P et al. (2006) Selecting a Battery of Biotests for Ecotoxicological
Characterization of Wastes. Science of the Total Environment 363:114-
125.
Germany J. Römbke et al. (2009) Ecotoxicological characterisation of 12 incineration
ashes using 6 laboratory tests; Waste Management 29 2475–2482
H. Moser et al. (2011) Evaluation of biological methods for a future
methodological implementation of the Hazard criterion H14 ‘ecotoxic’ in
the European waste list (2000/532/EC); Waste Management & Research,
29(2) 180–187
H. Moser and J. Römbke (2009) Ecotoxicological Characterization of
Waste- Results and Experiences of an International Ring Test.
UbA (2013) Recommendations for the Ecotoxicological Characterization
of Wastes
Austria Participation in the Working Group for the amendment of the European
Waste List
Czech Republic Vasahlova et al. (2012) The proposal for changes in evaluation of
ecotoxicity of wastes in the Czech legislation
29 Study to assess the impacts of different classification approaches for hazard property "HP 14"
on selected waste streams – Final report
Member State Example of publication
Italy Participation in the Working Group for the amendment of the European
Waste List
Belgium Participation in the Working Group for the amendment of the European
Waste List
Spain Perez Dueñas et al. for ATEGRUS (2008) Guia de caracterizacion de
residuos peligrosos
The contact points in the relevant Competent Authorities of the ten selected Member States
were provided by the Commission. They were sent a cover letter from the Commission and
a questionnaire aiming at gathering the approaches used in their country to assess the
ecotoxicity of representative samples of waste streams. The questionnaire asked the
stakeholders to describe the HP 14 approaches implemented in their country, provide some
case studies (i.e. examples of application of their method on 1-2 waste streams) and
indicate the relevant national legislation about waste hazard classification and HP 14
ecotoxicology assessment. The experts were also asked to provide their preference(s)
concerning the waste codes of the LoW to focus the impact assessment on, in order to
help in the selection of waste codes for in-depth data collection (see section 2.1.2 and 2.3).
The full questionnaire is reported in Annex 1.
A second questionnaire was sent to those Member States in order to address data gaps
identified during the selection of mirror pairs for further assessment (the selection process
and criteria are detailed in section 2.2). This questionnaire, available in Annex 3, also
included a section on the collection of experimental data for the next steps of the study
(see section 2.3 and 5.2).
2.1.2. Data collection by desk study
In parallel, the project team conducted a desk-based search and merged the results of this
search with the results of the consultation. The aim of the desk-based search was to gather
data on the approaches used in the 10 Member States to assess the ecotoxicity of
representative samples of waste streams.
In order to find data about tonnages of hazardous waste, research on websites of
Competent Authorities was performed. As such tonnages were often split into
categories/codes of waste that were based on the Eurostat EWC-Stat classification system,
research has been carried out to convert quantities registered under EWC-Stat categories
to LoW categories. Such estimation was used if the consultation does not provide data on
hazardous waste tonnage.
Research has also been carried out using keywords in the different national languages to
seek document about the approaches used to assess HP 14, and examples of results of
such assessments. Literature previously identified was used as primary source of
information but also was a starting point to identify new documents relevant for our study
(through the listed references). Competent Authorities and national agencies websites
have been consulted to find the official documentation on methodology for waste
classification (guidelines, pieces of legislation, etc.). Scientific databases – such as Web of
Knowledge, PubMed, Science Direct – have been explored using keywords rings to gather
scientific articles dealing with biotests on waste.
2.1.3. Reporting data in factsheets
The data collected on HP 14 assessment by Member States survey and by a desk study
was reported in country factsheets. The template for those factsheets is presented below
(Table 3).

30 Study to assess the impacts of different classification approaches for hazard property "HP 14"
on selected waste streams – Final report
Table 3: Template for the country factsheets
NAME OF COUNTRY
National approach to assess H14 (ecotoxicity) of wastes
Type of approach(es) used in the country to assess H14 property of waste
Calculation method with limit value Calculation method without limit value – Biotests Combined approach Other (choose one or more, please specify)
Name of the method(s)
Variability in H14 assessment methods depending on the waste nature
Specify if some categories of waste are assessed with different approaches
Related legislation and guidelines
Legislation Name of national regulations, decree, etc.
Guidelines Name of national guidance (if available)
Stakeholders involved in the H14 assessment
Name of the institution(s) + type of the institution+ role (funding/performing assessment, etc.)
Waste with highest tonnage
Waste with highest tonnage Name or code of waste + tonnage + share (%)
Hazardous waste with highest tonnage
Name or code of waste + tonnage+ share (%)
Chapter of List of waste with the highest share of hazardous waste
Name or code of waste + tonnage+ share (%)
Percentage of waste considered as hazardous by H14
Share of waste assessed as positive for H14 (% of waste classified as ecotoxic - globally and by category)
Protocol used
If biotests are applied (complete if relevant)
Prioritisation of tests (aquatic vs terrestrial)
What kind of tests are used in your country
Terrestrial tests
Test organism
Endpoint Test method
Test duration
Expression of results
Threshold value
Leaching/extraction test used
Aquatic tests
Test organism
Endpoint Test method
Test duration
Expression of results
Threshold value
31 Study to assess the impacts of different classification approaches for hazard property "HP 14"
on selected waste streams – Final report
If calculation methods are used (complete if relevant)
Concentration limits, thresholds, as well as relevant equations
Illustrative examples
Results of the method on X types of waste, to show the diversity of approaches (if relevant)
Qualitative assessment of the method(s)
Advantages
Limits and uncertainties
Approximate cost of the method(s) Variability depending on waste types (%)
Other MS using the same approach (if known)
Additional comments
Expert contacted to elaborate this factsheet
Name of experts (if agree)
References Name of documents used to elaborate the factsheet
Additional information
Links to websites to have additional information, stakeholders websites, etc.
The full factsheets containing all information collected for each country are reported in
Annex 2.
2.2. Selecting mirror pairs for the assessment
The assessment of HP 14 according to the four classification methods chosen by the
Commission is to be performed on a restricted list of mirror pairs (not on absolute entries).
The next sections explain how those mirror pairs were selected.
2.2.1. Selection process
The selection of mirror pairs is based on an extended list provided by the Commission and
containing 133 waste codes. Among them, 124 mirror pairs have been identified and the
selection process is performed on these 124 waste codes.
The selection process is based on six selection criteria (SC):
SC 1 - Preference of experts
SC 2 - Availability and quality of data
SC 3 - Tonnage of waste production
SC 4 - Economic importance
SC 5 - Potential presence of hazardous substances
SC 6 - Criticality of waste classification
For each SC, waste codes were assigned a qualitative or quantitative value (depending on
the criterion). For instance, under SC1, waste codes were assigned the number of experts
which expressed their preference. Under SC2, waste codes were assigned sources and
various information regarding calculations and biotests. Furthermore, values for each SC
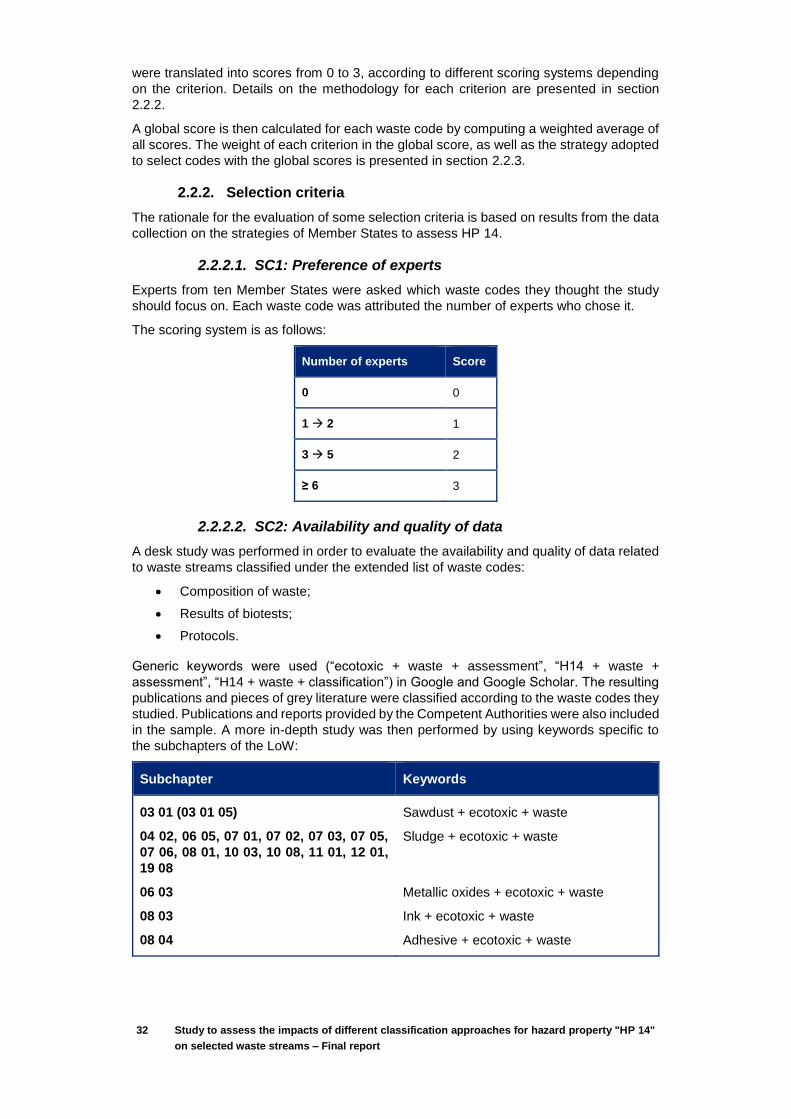
32 Study to assess the impacts of different classification approaches for hazard property "HP 14"
on selected waste streams – Final report
were translated into scores from 0 to 3, according to different scoring systems depending
on the criterion. Details on the methodology for each criterion are presented in section
2.2.2.
A global score is then calculated for each waste code by computing a weighted average of
all scores. The weight of each criterion in the global score, as well as the strategy adopted
to select codes with the global scores is presented in section 2.2.3.
2.2.2. Selection criteria
The rationale for the evaluation of some selection criteria is based on results from the data
collection on the strategies of Member States to assess HP 14.
2.2.2.1. SC1: Preference of experts
Experts from ten Member States were asked which waste codes they thought the study
should focus on. Each waste code was attributed the number of experts who chose it.
The scoring system is as follows:
Number of experts Score
0 0
1 2 1
3 5 2
≥ 6 3
2.2.2.2. SC2: Availability and quality of data
A desk study was performed in order to evaluate the availability and quality of data related
to waste streams classified under the extended list of waste codes:
Composition of waste;
Results of biotests;
Protocols.
Generic keywords were used (“ecotoxic + waste + assessment”, “H14 + waste +
assessment”, “H14 + waste + classification”) in Google and Google Scholar. The resulting
publications and pieces of grey literature were classified according to the waste codes they
studied. Publications and reports provided by the Competent Authorities were also included
in the sample. A more in-depth study was then performed by using keywords specific to
the subchapters of the LoW:
Subchapter Keywords
03 01 (03 01 05)
04 02, 06 05, 07 01, 07 02, 07 03, 07 05,
07 06, 08 01, 10 03, 10 08, 11 01, 12 01,
19 08
06 03
08 03
08 04
Sawdust + ecotoxic + waste
Sludge + ecotoxic + waste
Metallic oxides + ecotoxic + waste
Ink + ecotoxic + waste
Adhesive + ecotoxic + waste

33 Study to assess the impacts of different classification approaches for hazard property "HP 14"
on selected waste streams – Final report
Subchapter Keywords
10 01
10 02
10 03
10 05
10 06, 10 08
10 08, 10 10, 10 11
10 09, 10 10
10 11, 10 12, 10 13
16 11
17 01
17 03
17 05
17 06
17 08
19 01
19 07
19 10
19 13
Bottom ash + ecotoxic + waste
Fly ash + ecotoxic + waste
Gas cleaning + ecotoxic + waste
Filter cakes + ecotoxic + waste
cooling water treatment + ecotoxic + waste
Flue gas dust + ecotoxic + waste
Slag + ecotoxic + waste
Dross + ecotoxic + waste
cooling water treatment + ecotoxic + waste
Flue gas dust + ecotoxic + waste
Moulds + ecotoxic + waste
Gas treatment + ecotoxic + waste
Lining + ecotoxic + waste
Refractories + ecotoxic + waste
Concrete + ecotoxic + waste
Bituminous + ecotoxic + waste
Soil + ecotoxic + waste
Spoil + ecotoxic + waste
Insulation + ecotoxic + waste
Gypsum + ecotoxic + waste
Bottom ash + ecotoxic + waste
Fly ash + ecotoxic + waste
Boiler dust + ecotoxic + waste
Landfill leachate + ecotoxic + waste
Dust + ecotoxic + waste
Soil + ecotoxic + waste
The collected documents were attributed one or more waste codes depending on the waste
samples analysed. A few pieces of information (for instance, the name of the samples of
interest, or the fact that the protocols were performed according to ISO standards) were
also collected.
Although the desk study was not a formal systematic search, it should be representative of
the amount of literature (scientific and grey) publically available on the waste codes of the
list.
The scoring system is as follows:
Number of publications Score
0 0
1 1
2 3 2
≥ 4 3
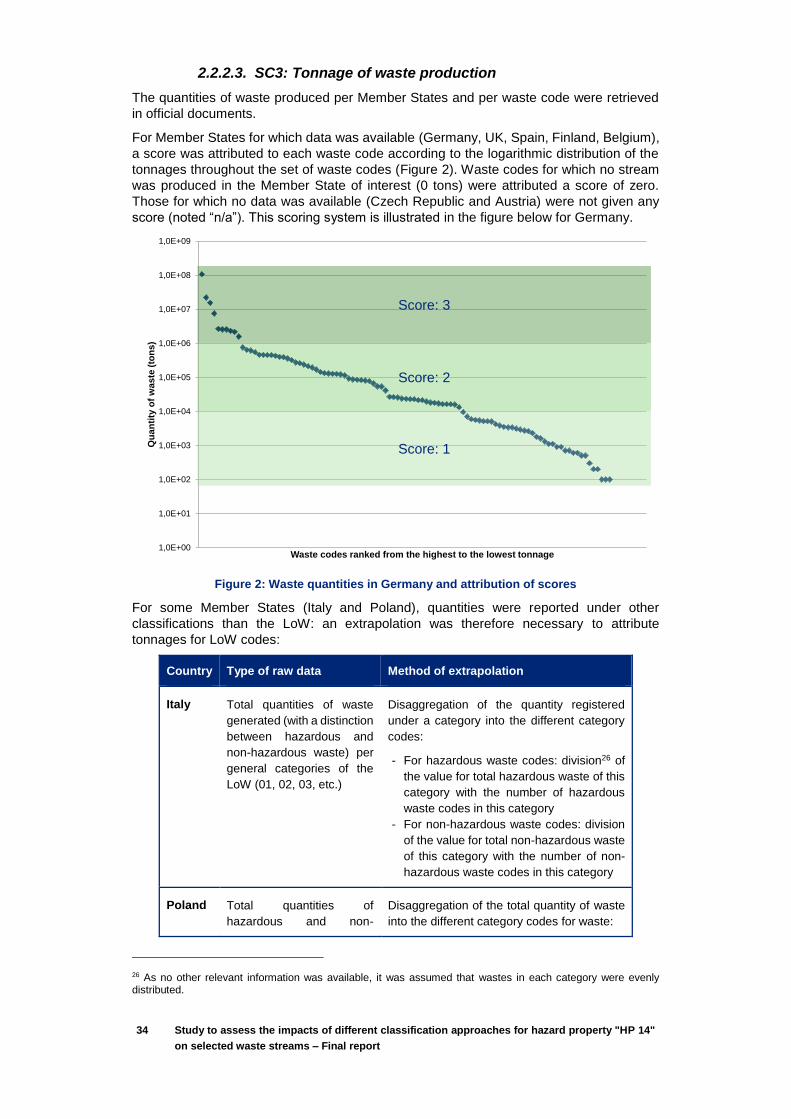
34 Study to assess the impacts of different classification approaches for hazard property "HP 14"
on selected waste streams – Final report
2.2.2.3. SC3: Tonnage of waste production
The quantities of waste produced per Member States and per waste code were retrieved
in official documents.
For Member States for which data was available (Germany, UK, Spain, Finland, Belgium),
a score was attributed to each waste code according to the logarithmic distribution of the
tonnages throughout the set of waste codes (Figure 2). Waste codes for which no stream
was produced in the Member State of interest (0 tons) were attributed a score of zero.
Those for which no data was available (Czech Republic and Austria) were not given any
score (noted “n/a”). This scoring system is illustrated in the figure below for Germany.
Figure 2: Waste quantities in Germany and attribution of scores
For some Member States (Italy and Poland), quantities were reported under other
classifications than the LoW: an extrapolation was therefore necessary to attribute
tonnages for LoW codes:
Country Type of raw data Method of extrapolation
Italy Total quantities of waste
generated (with a distinction
between hazardous and
non-hazardous waste) per
general categories of the
LoW (01, 02, 03, etc.)
Disaggregation of the quantity registered
under a category into the different category
codes:
- For hazardous waste codes: division26 of
the value for total hazardous waste of this
category with the number of hazardous
waste codes in this category
- For non-hazardous waste codes: division
of the value for total non-hazardous waste
of this category with the number of non-
hazardous waste codes in this category
Poland Total quantities of
hazardous and non-
Disaggregation of the total quantity of waste
into the different category codes for waste:
26 As no other relevant information was available, it was assumed that wastes in each category were evenly distributed.
1,0E+00
1,0E+01
1,0E+02
1,0E+03
1,0E+04
1,0E+05
1,0E+06
1,0E+07
1,0E+08
1,0E+09
Qu
an
tity
of
wa
ste
(to
ns)
Waste codes ranked from the highest to the lowest tonnage
Score: 3
Score: 2
Score: 1
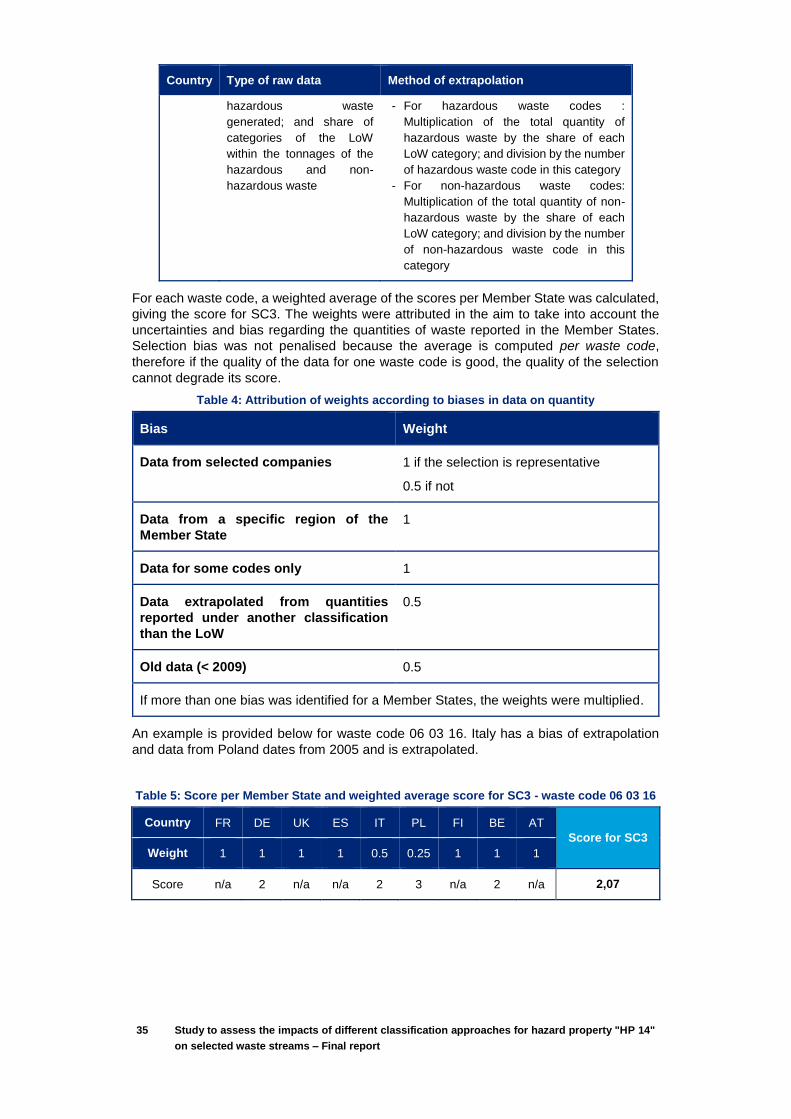
35 Study to assess the impacts of different classification approaches for hazard property "HP 14"
on selected waste streams – Final report
Country Type of raw data Method of extrapolation
hazardous waste
generated; and share of
categories of the LoW
within the tonnages of the
hazardous and non-
hazardous waste
- For hazardous waste codes :
Multiplication of the total quantity of
hazardous waste by the share of each
LoW category; and division by the number
of hazardous waste code in this category
- For non-hazardous waste codes:
Multiplication of the total quantity of non-
hazardous waste by the share of each
LoW category; and division by the number
of non-hazardous waste code in this
category
For each waste code, a weighted average of the scores per Member State was calculated,
giving the score for SC3. The weights were attributed in the aim to take into account the
uncertainties and bias regarding the quantities of waste reported in the Member States.
Selection bias was not penalised because the average is computed per waste code,
therefore if the quality of the data for one waste code is good, the quality of the selection
cannot degrade its score.
Table 4: Attribution of weights according to biases in data on quantity
Bias Weight
Data from selected companies 1 if the selection is representative
0.5 if not
Data from a specific region of the
Member State
1
Data for some codes only 1
Data extrapolated from quantities
reported under another classification
than the LoW
0.5
Old data (< 2009) 0.5
If more than one bias was identified for a Member States, the weights were multiplied.
An example is provided below for waste code 06 03 16. Italy has a bias of extrapolation
and data from Poland dates from 2005 and is extrapolated.
Table 5: Score per Member State and weighted average score for SC3 - waste code 06 03 16
Country FR DE UK ES IT PL FI BE AT
Score for SC3
Weight 1 1 1 1 0.5 0.25 1 1 1
Score n/a 2 n/a n/a 2 3 n/a 2 n/a 2,07
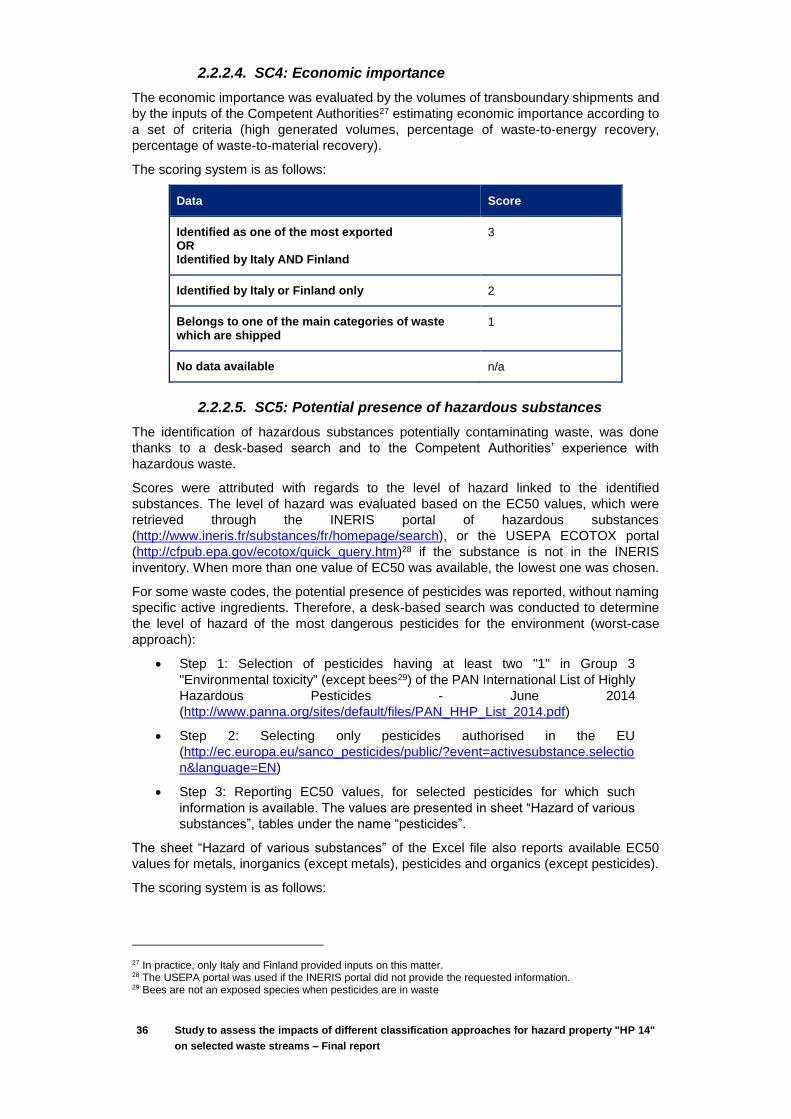
36 Study to assess the impacts of different classification approaches for hazard property "HP 14"
on selected waste streams – Final report
2.2.2.4. SC4: Economic importance
The economic importance was evaluated by the volumes of transboundary shipments and
by the inputs of the Competent Authorities27 estimating economic importance according to
a set of criteria (high generated volumes, percentage of waste-to-energy recovery,
percentage of waste-to-material recovery).
The scoring system is as follows:
Data Score
Identified as one of the most exported OR Identified by Italy AND Finland
3
Identified by Italy or Finland only 2
Belongs to one of the main categories of waste which are shipped
1
No data available n/a
2.2.2.5. SC5: Potential presence of hazardous substances
The identification of hazardous substances potentially contaminating waste, was done
thanks to a desk-based search and to the Competent Authorities’ experience with
hazardous waste.
Scores were attributed with regards to the level of hazard linked to the identified
substances. The level of hazard was evaluated based on the EC50 values, which were
retrieved through the INERIS portal of hazardous substances
(http://www.ineris.fr/substances/fr/homepage/search), or the USEPA ECOTOX portal
(http://cfpub.epa.gov/ecotox/quick_query.htm)28 if the substance is not in the INERIS
inventory. When more than one value of EC50 was available, the lowest one was chosen.
For some waste codes, the potential presence of pesticides was reported, without naming
specific active ingredients. Therefore, a desk-based search was conducted to determine
the level of hazard of the most dangerous pesticides for the environment (worst-case
approach):
Step 1: Selection of pesticides having at least two "1" in Group 3
"Environmental toxicity" (except bees29) of the PAN International List of Highly
Hazardous Pesticides - June 2014
(http://www.panna.org/sites/default/files/PAN_HHP_List_2014.pdf)
Step 2: Selecting only pesticides authorised in the EU
(http://ec.europa.eu/sanco_pesticides/public/?event=activesubstance.selectio
n&language=EN)
Step 3: Reporting EC50 values, for selected pesticides for which such
information is available. The values are presented in sheet “Hazard of various
substances”, tables under the name “pesticides”.
The sheet “Hazard of various substances” of the Excel file also reports available EC50
values for metals, inorganics (except metals), pesticides and organics (except pesticides).
The scoring system is as follows:
27 In practice, only Italy and Finland provided inputs on this matter. 28 The USEPA portal was used if the INERIS portal did not provide the requested information. 29 Bees are not an exposed species when pesticides are in waste
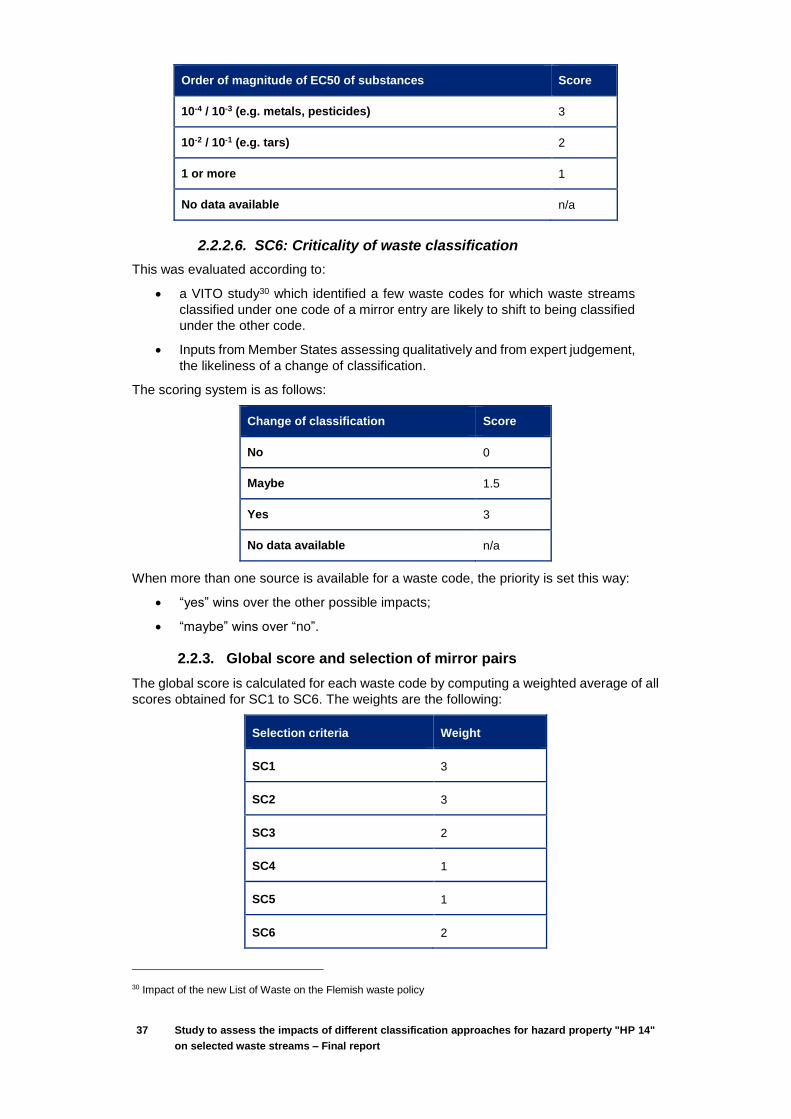
37 Study to assess the impacts of different classification approaches for hazard property "HP 14"
on selected waste streams – Final report
Order of magnitude of EC50 of substances Score
10-4 / 10-3 (e.g. metals, pesticides) 3
10-2 / 10-1 (e.g. tars) 2
1 or more 1
No data available n/a
2.2.2.6. SC6: Criticality of waste classification
This was evaluated according to:
a VITO study30 which identified a few waste codes for which waste streams
classified under one code of a mirror entry are likely to shift to being classified
under the other code.
Inputs from Member States assessing qualitatively and from expert judgement,
the likeliness of a change of classification.
The scoring system is as follows:
Change of classification Score
No 0
Maybe 1.5
Yes 3
No data available n/a
When more than one source is available for a waste code, the priority is set this way:
“yes” wins over the other possible impacts;
“maybe” wins over “no”.
2.2.3. Global score and selection of mirror pairs
The global score is calculated for each waste code by computing a weighted average of all
scores obtained for SC1 to SC6. The weights are the following:
Selection criteria Weight
SC1 3
SC2 3
SC3 2
SC4 1
SC5 1
SC6 2
30 Impact of the new List of Waste on the Flemish waste policy
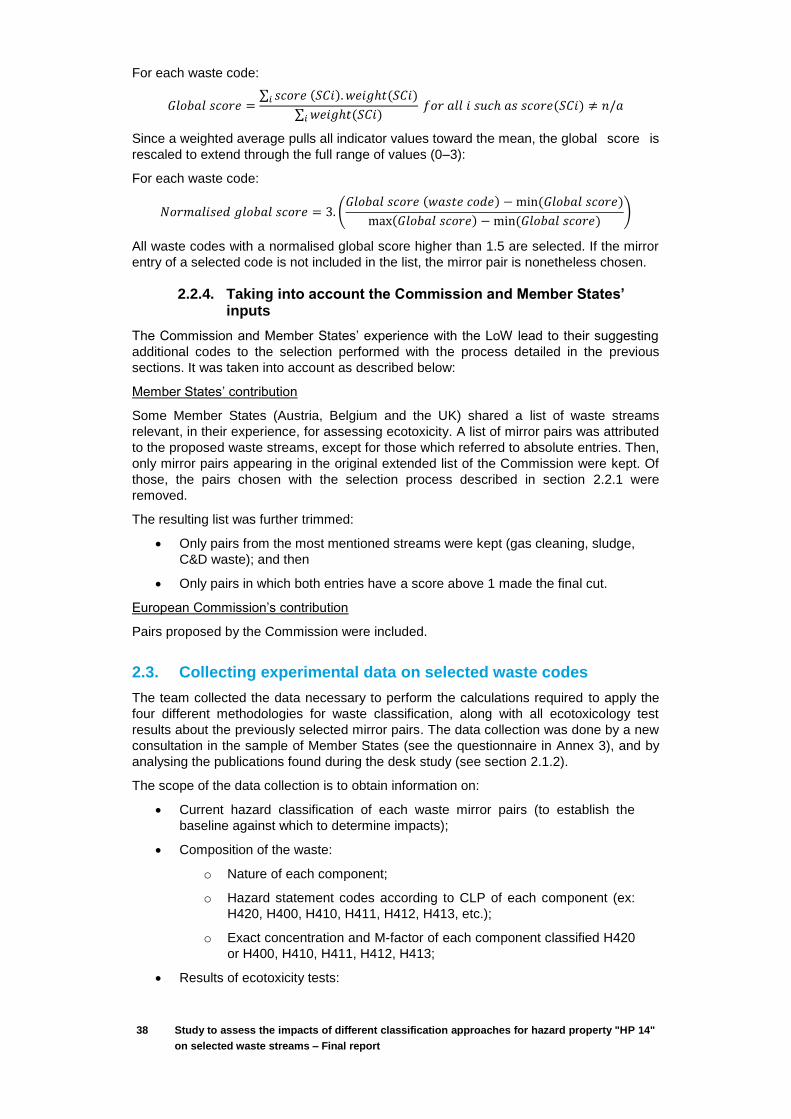
38 Study to assess the impacts of different classification approaches for hazard property "HP 14"
on selected waste streams – Final report
For each waste code:
𝐺𝑙𝑜𝑏𝑎𝑙 𝑠𝑐𝑜𝑟𝑒 =∑ 𝑠𝑐𝑜𝑟𝑒 (𝑆𝐶𝑖). 𝑤𝑒𝑖𝑔ℎ𝑡(𝑆𝐶𝑖)𝑖
∑ 𝑤𝑒𝑖𝑔ℎ𝑡(𝑆𝐶𝑖)𝑖
𝑓𝑜𝑟 𝑎𝑙𝑙 𝑖 𝑠𝑢𝑐ℎ 𝑎𝑠 𝑠𝑐𝑜𝑟𝑒(𝑆𝐶𝑖) ≠ 𝑛/𝑎
Since a weighted average pulls all indicator values toward the mean, the global score is
rescaled to extend through the full range of values (0–3):
For each waste code:
𝑁𝑜𝑟𝑚𝑎𝑙𝑖𝑠𝑒𝑑 𝑔𝑙𝑜𝑏𝑎𝑙 𝑠𝑐𝑜𝑟𝑒 = 3. (𝐺𝑙𝑜𝑏𝑎𝑙 𝑠𝑐𝑜𝑟𝑒 (𝑤𝑎𝑠𝑡𝑒 𝑐𝑜𝑑𝑒) − min (𝐺𝑙𝑜𝑏𝑎𝑙 𝑠𝑐𝑜𝑟𝑒)
max(𝐺𝑙𝑜𝑏𝑎𝑙 𝑠𝑐𝑜𝑟𝑒) − min (𝐺𝑙𝑜𝑏𝑎𝑙 𝑠𝑐𝑜𝑟𝑒))
All waste codes with a normalised global score higher than 1.5 are selected. If the mirror
entry of a selected code is not included in the list, the mirror pair is nonetheless chosen.
2.2.4. Taking into account the Commission and Member States’ inputs
The Commission and Member States’ experience with the LoW lead to their suggesting
additional codes to the selection performed with the process detailed in the previous
sections. It was taken into account as described below:
Member States’ contribution
Some Member States (Austria, Belgium and the UK) shared a list of waste streams
relevant, in their experience, for assessing ecotoxicity. A list of mirror pairs was attributed
to the proposed waste streams, except for those which referred to absolute entries. Then,
only mirror pairs appearing in the original extended list of the Commission were kept. Of
those, the pairs chosen with the selection process described in section 2.2.1 were
removed.
The resulting list was further trimmed:
Only pairs from the most mentioned streams were kept (gas cleaning, sludge,
C&D waste); and then
Only pairs in which both entries have a score above 1 made the final cut.
European Commission’s contribution
Pairs proposed by the Commission were included.
2.3. Collecting experimental data on selected waste codes
The team collected the data necessary to perform the calculations required to apply the
four different methodologies for waste classification, along with all ecotoxicology test
results about the previously selected mirror pairs. The data collection was done by a new
consultation in the sample of Member States (see the questionnaire in Annex 3), and by
analysing the publications found during the desk study (see section 2.1.2).
The scope of the data collection is to obtain information on:
Current hazard classification of each waste mirror pairs (to establish the
baseline against which to determine impacts);
Composition of the waste:
o Nature of each component;
o Hazard statement codes according to CLP of each component (ex:
H420, H400, H410, H411, H412, H413, etc.);
o Exact concentration and M-factor of each component classified H420
or H400, H410, H411, H412, H413;
Results of ecotoxicity tests:
39 Study to assess the impacts of different classification approaches for hazard property "HP 14"
on selected waste streams – Final report
o Test strategy (number of tests, prioritisation, etc.);
o Way of expressing results (ECx, LID, etc.);
o Threshold values for classifying wastes as hazardous;
Protocols of sampling, preparation of samples, analyses and test:
o For composition:
Specify whether chemical analysis was performed on the solid
material itself or on its leachates;
Sampling time;
Sample preservation ;
Transport and storage of samples (including time of
conservation);
Pre-treatment of samples;
Preparation of waste eluates (including pH adjustment if
performed);
Storage of waste eluates ;
Leachant;
Analytical methods.
o For ecotoxicity tests:
Sampling date;
Sample preservation ;
Transport and storage of samples (including Time of
conservation);
Pre-treatment of samples ;
Preparation of waste eluates (including pH adjustment if
performed);
Storage of waste eluates ;
Organism [e.g. Daphnia magna];
Time of conservation before performing test;
Preparation of waste eluates (including pH adjustment if
appropriate);
Storage of waste eluates (including time and conditions);
Test method;
Control/dilution medium.
2.4. Running the calculation methods
2.4.1. Reporting collected data
The data collected were reported in an Excel file which contains the following information:
The current hazard classification of each waste mirror sample (to establish the
baseline against which to determine impacts),
The known composition of the waste,
The results of ecotoxicity tests, and,
40 Study to assess the impacts of different classification approaches for hazard property "HP 14"
on selected waste streams – Final report
The protocols of sampling, preparation of samples, analyses and test.
The protocols and methods followed for chemical analyses are also reported in the Excel
file.
2.4.2. Worst-case selection
The four calculation methods were applied using the collected characterisation data.
To perform the calculations, the specific compounds present in the sample must be known.
However, an important difficulty was identified: to perform the calculations, the specific
compounds present in the sample must be known. Indeed, in order to classify the waste, it
is necessary to identify the hazard properties of each constituent and the mass percentage
concentration associated. However, collected information only reports concentrations of
elemental constituents. Therefore, plausible worst case compounds were selected
according to the relevance of their presence in waste and reported in the table “Worst case
compounds selected for calculation” in Annex 5. In the absence of any other information,
the preference was given to simple compounds like oxides or chlorides, for which the
presence in the waste seems to be more relevant. As specified by Note 1 of Section 1.1.3.2
of Annex VI of the CLP regulation31, the molar mass of metallic compounds was not
considered for worst case selection. In case of presence of generic entries in the
harmonised classification (as for example, for lead compounds), this classification is
considered. Among simple compounds, those which have the most severe classification
according to the harmonised classification of the Regulation 1272/2008/EC (CLP) are used
for calculation.
For each worst case compound selected, the following information is extracted from the
harmonised classification for environmental hazards and reported in the table in Annex 5:
index number, EC number, CAS number, hazard class and categories, hazard statement
and M-factor. In this table, compounds underlined in green do not have a harmonised
classification for environmental hazard properties according to Regulation 1272/2008/EC
(CLP).
Tools for selecting worst case compounds are currently in development but not validated
and not yet review by a group of experts. For example, France has developed a tool that
allows the consideration of speciation and different parameters of the waste like the pH,
the stoichiometric ratio and the molar mass of compounds32. The tool was published as a
French standard: AFNOR FD X30-494 “Characterization of waste - Specification of
elements present in waste (May 2015)” and is currently being considered for a CEN
standard. As this tool was not yet fully finalised at the time of redaction, the simple default
approach described above is applied.
2.4.3. Calculation tool
An Excel file was created for the classification of waste samples from the selected mirror
pairs (see example in Table 6). Input data is the following: the element (to be selected in a
drop-down list) and the concentration in mg/kg of this element. In case of specific
substances like organic compounds, the most frequently detected ones present in wastes
are included in the drop-down list. Information regarding the classification of compounds
not appearing in the tool must be entered manually. For each hazard statement, the value
“1” corresponds to the classification of the compound for this hazard otherwise, the “0”
value corresponds to the non-classification. It is also necessary to fill the columns
corresponding to the M-factor (if no M-factor is available, the value “1” has to be filled).
31 The concentration stated or, in the absence of such concentrations, the generic concentrations of this Regulation (Table 3.1) or the generic concentrations of Directive 1999/45/EC (Table 3.2), are the percentages by weight of the metallic element calculated with reference to the total weight of the mixture 32 INERIS (2011) - Reconstitution d’une spéciation des éléments totaux en minéraux dans les déchets en vue de la détermination d’un potentiel de danger dans un objectif de classement SEVESO - Principes et mode d’emploi de l’outil de calcul (DRC-11-118157-06170A) - Tool still under development

41 Study to assess the impacts of different classification approaches for hazard property "HP 14"
on selected waste streams – Final report
Table 6: Example of input in the calculation tool (Ref: sample 1, pair 06 05 02*/06 05 03)
H420 H400 H410 H411 H412 H413M factor
(acute)
M factor
(chronic)
As 11
arsenic acid and its salts
with the exception of those
specified elsewhere in this
Annex 1 - 74.9216 74.9216 0.0011% 1 1 0 0 0 1 1
Pb 21
lead compounds with the
exception of those specified
elsewhere in this Annex 1 - 207.2 207.2 0.0021% 1 1 0 0 0 1 1
Cd 0.29
cadmium oxide (non-
pyrophoric) 1 1306-19-0 112.411 112.414 0.0000% 1 1 0 0 0 1 1
Cr 11 chromium (VI) trioxide 1 1333-82-0 51.9961 99.9 0.0021% 1 1 0 0 0 1 1
Cu 114
dicopper oxide
copper (I) oxide 2 1317-39-1 63.546 143.09 0.0128% 1 1 0 0 0 1 1
Ni 190 nickel sulfate 1 7786-81-4 58.6934 154.75 0.0501% 1 1 0 0 0 1 1
Hg 0.09 mercury 1 7439-97-6 200.59 200.59 0.0000% 1 1 0 0 0 1 1
Zn 1000 zinc oxide 1 1314-13-2 65.39 81.408 0.1245% 1 1 0 0 0 1 1
_Benzene 0.01 Benzene 1 71-43-2 #N/A 78.11 0.0000% 0 0 0 0 0 1 1
Worst case classification
CompoundConcentration
(mg/kg)Compound worst case
MM
element
(g/mol)
MM
compound
(g/mol)
Concentration
(% w/w)CAS
Number of element in
worst case
(e.g. dicopper oxide = 2)
(default value = 1)
Element/
Specific
Compoun
ds
(drop-
down list)
42 Study to assess the impacts of different classification approaches for hazard property "HP 14"
on selected waste streams – Final report
2.5. Impact assessment
The implementation of any of the four calculation methods is likely to lead to changes in
the classification of some waste, and thus affect the quantities of waste classified as
hazardous and non-hazardous for each individual mirror pair. This, in turn, would lead to
environmental, economic and social impacts.
The impact assessment conducted in this study aims at estimating the consequences of
the implementation of each of the four methods on the waste streams corresponding to the
selected mirror pairs against a baseline scenario (i.e. the current situation, and further
development excluding the implementation of the 4 calculation methods). The baseline
scenario was determined using EU-level data on the environmental, economic and social
aspects, with no distinction between Member States. This distinction would have been
relevant (different Member States apply different criteria), but lack of data prevents such a
detailed assessment (not enough collected samples).
The environmental, social and economic impacts of this implementation were investigated.
2.5.1. Scope of the impact assessment
The ideal scope would have been the whole list of selected mirror pairs. However, the
impact assessment can only be performed on pairs whose samples had both:
Characterisation data of enough quality for the calculations to be performed,
and
Their current classification (baseline) available.
This necessary requirement restricted the list of mirror pairs (see section 6.3) on which the
socio-economic impact was performed.. However, in order to maximise the number of
samples considered for each pair, the current classification of some samples was
determined “manually” by the project team, by applying the HP 14 assessment methods of
the Member State from which the sample originated. This determination was done for
samples which:
Were not assigned a current classification (samples extracted from scientific
publications or from other documents which did not mention the classification
for example); and
Originated from countries implementing a chemical approach (otherwise the
classification cannot be deducted from characterisation data).
2.5.2. Assessment steps
The impact assessment was conducted according to the following steps:
Setting indicators describing key factors of impact assessment, the variation of
which may affect the management of waste, the environment, public health,
recycling companies, etc.;
Evaluating the current “value” of those indicators (baseline), i.e. documenting
the current situation and trends of the generation and management of waste
streams classified under the codes included in the scope;
Estimating the likely “value” of those indicators linked to the implementation of
either one of the four methods of calculation, i.e. assessing the environmental
and socio-economic impacts of each of the four methods, considering the
proportion of waste that would change classification due to new HP 14
assessment.
43 Study to assess the impacts of different classification approaches for hazard property "HP 14"
on selected waste streams – Final report
2.5.2.1. Indicators
The aspects of interest for the impact assessment are described by the following indicators:
Environmental aspects:
o Recovery schemes (includes percentages of waste recycled vs
landfilled)
o Benefits of recovering the waste
o Pollution due to contaminated fractions of the waste
Economic aspects
o Costs of disposal
o Costs of recycling
Social aspects
o Employment
o Public Health
2.5.2.2. Data collection on the current situation and potential impacts
Information on the environmental, economic and social aspects of managing the selected
waste streams was collected thanks to a desk study and a dedicated stakeholder
consultation.
The desk study involved an Internet search in grey and scientific literature. For each waste
stream, key words including the name of the stream and of the indicator of interest were
used in Google and Google Scholar. Searches in specific websites were also performed:
Eurostat33, the ADEME website34, the Defra35 and WRAP36 websites.
As the desk study was not expected to yield sufficient results, a consultation targeting
industrial stakeholders was launched in parallel. Participants of the workshops in which the
study was presented in April and May 2015 (see section 2.6) were sent a questionnaire
aiming at gathering their inputs on the potential impacts of a change of classification for
their industry. The respondents were surveyed on the expected economic feasibility of the
four methods and were prompted to fill in one or more case studies on the potential impacts
of the changes of classification for one or more mirror pairs. The questionnaire is available
in Annex 4.
2.5.2.3. Establishment of the baseline
The current situation of waste management for the studied waste streams is described
based upon the chosen indicators and the data collection.
For each studied waste stream, the current situation in the EU according to environmental,
economic and social aspects are described. The baseline was not established per Member
States, because the determination of impacts (relying on calculation on collected samples)
cannot be done per Member State (lack of data).
2.5.2.4. Determination of impacts
The proportion of waste changing classification (for each mirror pair) was estimated
considering the samples collected for the purpose of running the calculation methods.
33 http://ec.europa.eu/ 34 www.ademe.fr/ 35 https://www.gov.uk/government/organisations/department-for-environment-food-rural-affairs 36 www.wrap.org.uk/

44 Study to assess the impacts of different classification approaches for hazard property "HP 14"
on selected waste streams – Final report
For each pair:
𝑃𝑟𝑜𝑝𝑜𝑟𝑡𝑖𝑜𝑛 𝑜𝑓 𝑐ℎ𝑎𝑛𝑔𝑒 𝑓𝑟𝑜𝑚 ℎ𝑎𝑧𝑎𝑟𝑑𝑜𝑢𝑠 𝑡𝑜 𝑛𝑜𝑛 ℎ𝑎𝑧𝑎𝑟𝑑𝑜𝑢𝑠 𝑑𝑢𝑒 𝑡𝑜 𝑀𝑒𝑡ℎ𝑜𝑑 𝑖 =𝑁𝑢𝑚𝑏𝑒𝑟 (𝐻 → 𝑁𝐻)𝑀𝑖
𝑁𝑢𝑚𝑏𝑒𝑟 (𝐻)𝐶𝑢𝑟𝑟𝑒𝑛𝑡𝑙𝑦
𝑃𝑟𝑜𝑝𝑜𝑟𝑡𝑖𝑜𝑛 𝑜𝑓 𝑐ℎ𝑎𝑛𝑔𝑒 𝑓𝑟𝑜𝑚 𝑛𝑜𝑛 ℎ𝑎𝑧𝑎𝑟𝑑𝑜𝑢𝑠 𝑡𝑜 ℎ𝑎𝑧𝑎𝑟𝑑𝑜𝑢𝑠 𝑑𝑢𝑒 𝑡𝑜 𝑀𝑒𝑡ℎ𝑜𝑑 𝑖 =𝑁𝑢𝑚𝑏𝑒𝑟 (𝑁𝐻 → 𝐻)𝑀𝑖
𝑁𝑢𝑚𝑏𝑒𝑟 (𝑁𝐻)𝐶𝑢𝑟𝑟𝑒𝑛𝑡𝑙𝑦
With:
𝐻 = 𝑠𝑎𝑚𝑝𝑙𝑒 𝑐𝑙𝑎𝑠𝑠𝑖𝑓𝑖𝑒𝑑 𝑎𝑠 ℎ𝑎𝑧𝑎𝑟𝑑𝑜𝑢𝑠
𝑁𝐻 = 𝑠𝑎𝑚𝑝𝑙𝑒 𝑐𝑙𝑎𝑠𝑠𝑖𝑓𝑖𝑒𝑑 𝑎𝑠 𝑛𝑜𝑛 ℎ𝑎𝑧𝑎𝑟𝑑𝑜𝑢𝑠
(𝐻 → 𝑁𝐻)𝑀𝑖 , 𝑟𝑒𝑠𝑝𝑒𝑐𝑡𝑖𝑣𝑒𝑙𝑦 (𝑁𝐻 → 𝐻)𝑀𝑖
= 𝑠𝑎𝑚𝑝𝑙𝑒 𝑠ℎ𝑖𝑓𝑡𝑖𝑛𝑔 𝑓𝑟𝑜𝑚 ℎ𝑎𝑧𝑎𝑟𝑑𝑜𝑢𝑠 𝑖𝑛 𝑏𝑎𝑠𝑒𝑙𝑖𝑛𝑒 𝑡𝑜 𝑛𝑜𝑛 ℎ𝑎𝑧𝑎𝑟𝑑𝑜𝑢𝑠 (𝑟𝑒𝑠𝑝𝑒𝑐𝑡𝑖𝑣𝑒𝑙𝑦 𝑛𝑜𝑛 ℎ𝑎𝑧𝑎𝑟𝑑𝑜𝑢𝑠 𝑖𝑛 𝑏𝑎𝑠𝑒𝑙𝑖𝑛𝑒 𝑡𝑜 ℎ𝑎𝑧𝑎𝑟𝑑𝑜𝑢𝑠) 𝑑𝑢𝑒 𝑡𝑜 𝑀𝑒𝑡ℎ𝑜𝑑 𝑖
(𝐻)𝑐𝑢𝑟𝑟𝑒𝑛𝑡𝑙𝑦 , 𝑟𝑒𝑠𝑝𝑒𝑐𝑡𝑖𝑣𝑒𝑙𝑦 (𝑁𝐻)𝑐𝑢𝑟𝑟𝑒𝑛𝑡𝑙𝑦
= 𝑠𝑎𝑚𝑝𝑙𝑒 𝑐𝑙𝑎𝑠𝑠𝑖𝑓𝑖𝑒𝑑 𝑎𝑠 ℎ𝑎𝑧𝑎𝑟𝑑𝑜𝑢𝑠 (𝑟𝑒𝑠𝑝𝑒𝑐𝑡𝑖𝑣𝑒𝑙𝑦 𝑛𝑜𝑛 ℎ𝑎𝑧𝑎𝑟𝑑𝑜𝑢𝑠) 𝑖𝑛 𝑡ℎ𝑒 𝑏𝑎𝑠𝑒𝑙𝑖𝑛𝑒
The impacts of these changes are estimated by considering the baseline and determining
how the indicators have changed due to the shift in proportion. For instance, environmental
impacts include the proportion of waste which would not be recycled anymore, following
the implementation of any of the four methods.
A brief description of the impacts of the status quo (i.e. the way the baseline situation would
evolve if none of the 4 calculation methods was implemented) is also provided.
2.6. Workshops and conferences
Interim results were presented in a workshop organised by the European Commission in
April 2015. The workshop was the opportunity to further clarify some points in the
factsheets and to gather the participants’ opinions on the four calculation methods and on
the relevance of an experimental approach based on biotests.
Those results were also shared within a workshop organised by the VTT institute in Espoo,
Finland.
The study was presented during the Technical Adaptation Committee (TAC meeting) held
in June 2015 in Brussels.

45 Study to assess the impacts of different classification approaches for hazard property "HP 14"
on selected waste streams – Final report
3. Results: strategies of selected
Member States to assess HP
14
3.1. Member States survey
Ten Member States (Austria, Belgium, the Czech Republic, Finland, France, Germany,
Italy, Poland, Spain and the United Kingdom) were sent a questionnaire via email (see
Annex 1), with the aim to document the approaches used in their country to assess the
ecotoxicity of waste streams. The list of contacts and their contribution is also reported in
Annex 1.
3.2. Full country factsheets
Factsheets were drafted for the following countries and are available in Annex 2:
Austria
France
Belgium
Germany
Italy
Finland
Czech Republic
United Kingdom
Spain
The next sections detail and analyse the information reported in the factsheets.
3.3. Description of the approaches
3.3.1. General information
The nine Member States have either national legislation, guidelines or both, describing
methods to assess HP 14 in their jurisdictions (Table 7). Italy and Austria passed laws
introducing the criteria assigning HP 14 to waste but did not issue guidelines37. In Spain,
the Ordinance determining the methods for assessing HP 14 is accompanied by
appendices providing guidance. In the other countries (France, Germany, Finland, UK and
Belgium), where no legislative instruments exist, guidelines are however available.
Table 7: National legislation or guidelines for the H14 assessment methods and protocols
Member State Legal instrument Guidelines
Austria Fed. Law Gaz No. 522/1973 as
amended by Fed Law Gaz III No.
36/2001
Belgium OVAM (2004) Europese
afvalstoffenlijst EURAL Handleiding
37 In Italy, although there are no official guidelines or specific protocols, studies detailing the assessment of HP 14 were published (see the “References” section of the Italian factsheet)
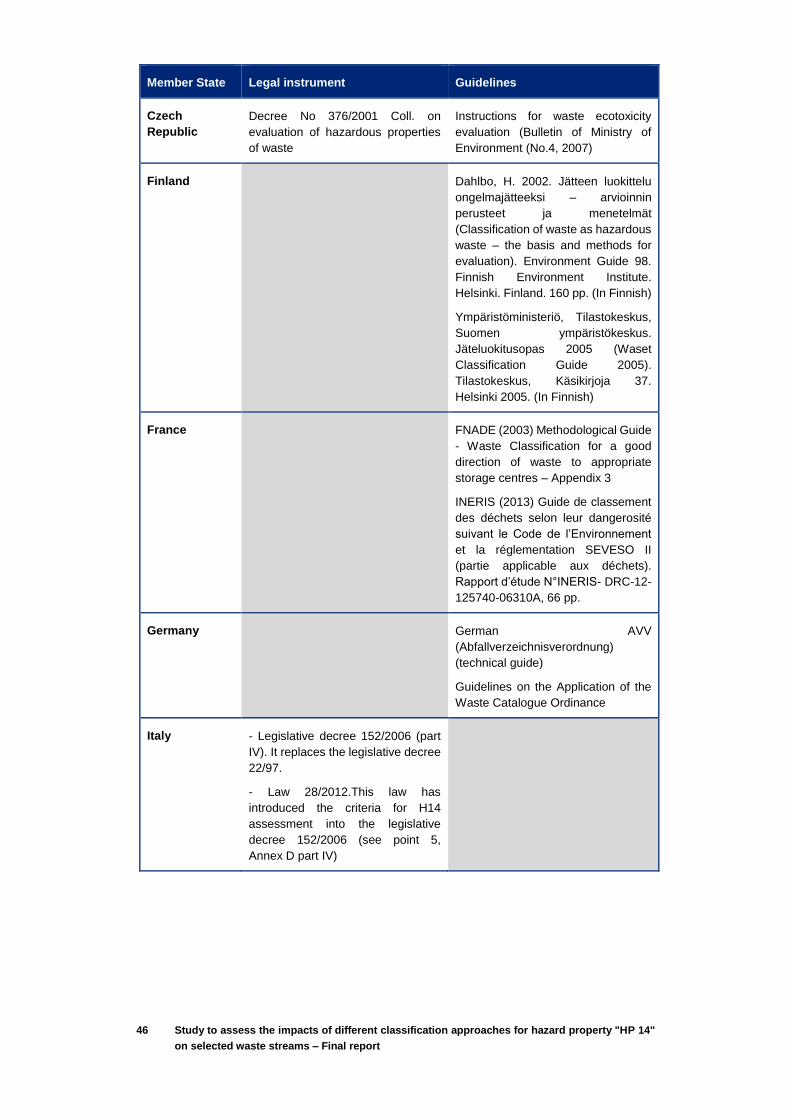
46 Study to assess the impacts of different classification approaches for hazard property "HP 14"
on selected waste streams – Final report
Member State Legal instrument Guidelines
Czech
Republic
Decree No 376/2001 Coll. on
evaluation of hazardous properties
of waste
Instructions for waste ecotoxicity
evaluation (Bulletin of Ministry of
Environment (No.4, 2007)
Finland Dahlbo, H. 2002. Jätteen luokittelu
ongelmajätteeksi – arvioinnin
perusteet ja menetelmät
(Classification of waste as hazardous
waste – the basis and methods for
evaluation). Environment Guide 98.
Finnish Environment Institute.
Helsinki. Finland. 160 pp. (In Finnish)
Ympäristöministeriö, Tilastokeskus,
Suomen ympäristökeskus.
Jäteluokitusopas 2005 (Waset
Classification Guide 2005).
Tilastokeskus, Käsikirjoja 37.
Helsinki 2005. (In Finnish)
France FNADE (2003) Methodological Guide
- Waste Classification for a good
direction of waste to appropriate
storage centres – Appendix 3
INERIS (2013) Guide de classement
des déchets selon leur dangerosité
suivant le Code de l’Environnement
et la réglementation SEVESO II
(partie applicable aux déchets).
Rapport d’étude N°INERIS- DRC-12-
125740-06310A, 66 pp.
Germany German AVV
(Abfallverzeichnisverordnung)
(technical guide)
Guidelines on the Application of the
Waste Catalogue Ordinance
Italy - Legislative decree 152/2006 (part
IV). It replaces the legislative decree
22/97.
- Law 28/2012.This law has
introduced the criteria for H14
assessment into the legislative
decree 152/2006 (see point 5,
Annex D part IV)
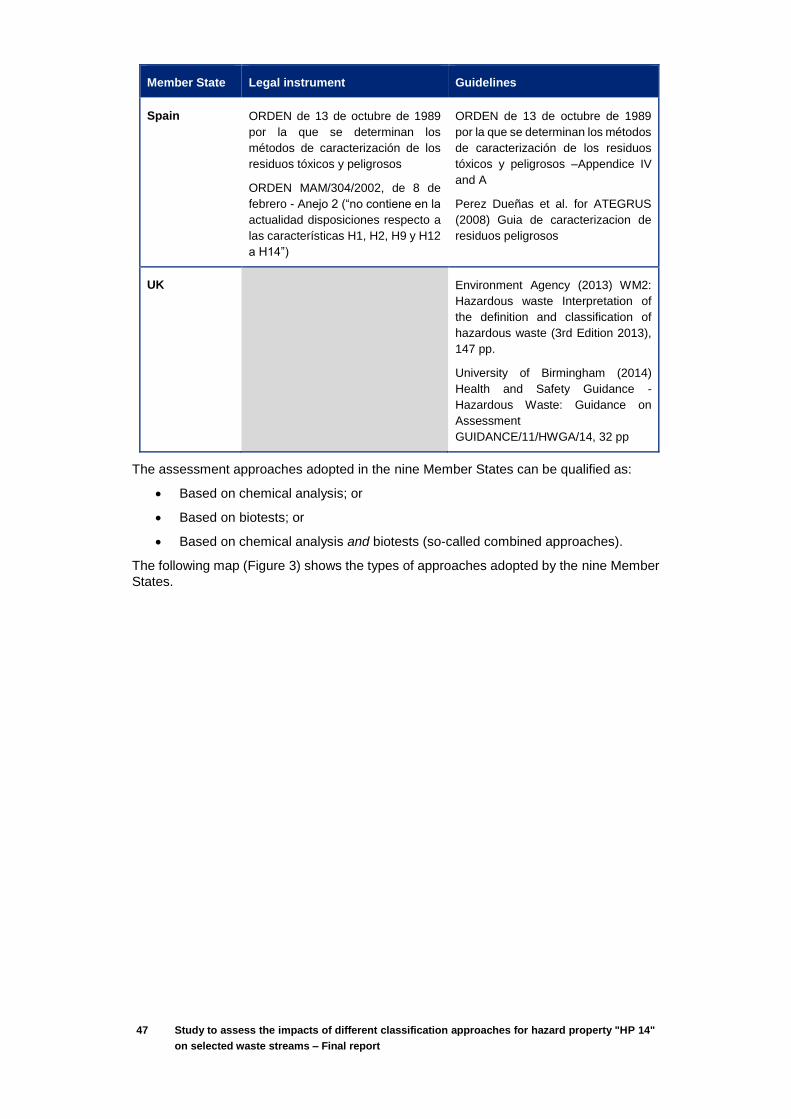
47 Study to assess the impacts of different classification approaches for hazard property "HP 14"
on selected waste streams – Final report
Member State Legal instrument Guidelines
Spain ORDEN de 13 de octubre de 1989
por la que se determinan los
métodos de caracterización de los
residuos tóxicos y peligrosos
ORDEN MAM/304/2002, de 8 de
febrero - Anejo 2 (“no contiene en la
actualidad disposiciones respecto a
las características H1, H2, H9 y H12
a H14”)
ORDEN de 13 de octubre de 1989
por la que se determinan los métodos
de caracterización de los residuos
tóxicos y peligrosos –Appendice IV
and A
Perez Dueñas et al. for ATEGRUS
(2008) Guia de caracterizacion de
residuos peligrosos
UK Environment Agency (2013) WM2:
Hazardous waste Interpretation of
the definition and classification of
hazardous waste (3rd Edition 2013),
147 pp.
University of Birmingham (2014)
Health and Safety Guidance -
Hazardous Waste: Guidance on
Assessment
GUIDANCE/11/HWGA/14, 32 pp
The assessment approaches adopted in the nine Member States can be qualified as:
Based on chemical analysis; or
Based on biotests; or
Based on chemical analysis and biotests (so-called combined approaches).
The following map (Figure 3) shows the types of approaches adopted by the nine Member
States.

48 Study to assess the impacts of different classification approaches for hazard property "HP 14"
on selected waste streams – Final report
Figure 3: Approaches for the assessment of HP 14 in the nine studied Member States
Austria, Belgium, Italy, Finland and the UK rely solely on chemical analysis to determine
the ecotoxic property of waste. It is worth mentioning that Finland and the UK allow biotests
in some cases, but discourage the use of such methods. Their position is discussed in
section 3.4. In Czech Republic and Spain, the assessment of HP 14 is performed thanks
to biotests only, while in France and Germany a tiered approach including chemical
analysis is in place.
The following sections (3.3.2 and 3.3.3) describe and compare the approaches based on
chemical analysis (whether used alone or in combination with biotests) and those based
on biotests (whether used alone or in combination with chemical analysis), respectively.
Section 3.3.3 focuses on the analysis of combined approaches.
3.3.2. Approaches using chemical analysis
Belgium, Finland, Germany, and the UK base their approach on the DPD, but did not adapt
it the same way. In Austria and Italy, the HP14 strategy is based on classification according
to the European Agreement concerning the International Carriage of Dangerous Goods by
Road (ADR)38, while France adapts the CLP regulation.
3.3.2.1. Approaches based on the DPD
The process for assessing HP 14 is common to all Member States adapting the DPD for
this purpose and is described in the decision tree below (Figure 4). These Member States
rely on the first versions of the DPD, which do not include M-factors.
38 http://www.unece.org/trans/danger/publi/adr/adr_e.html
Type of approach
Not included in the sample
Biotests
Chemical analysis
Combined
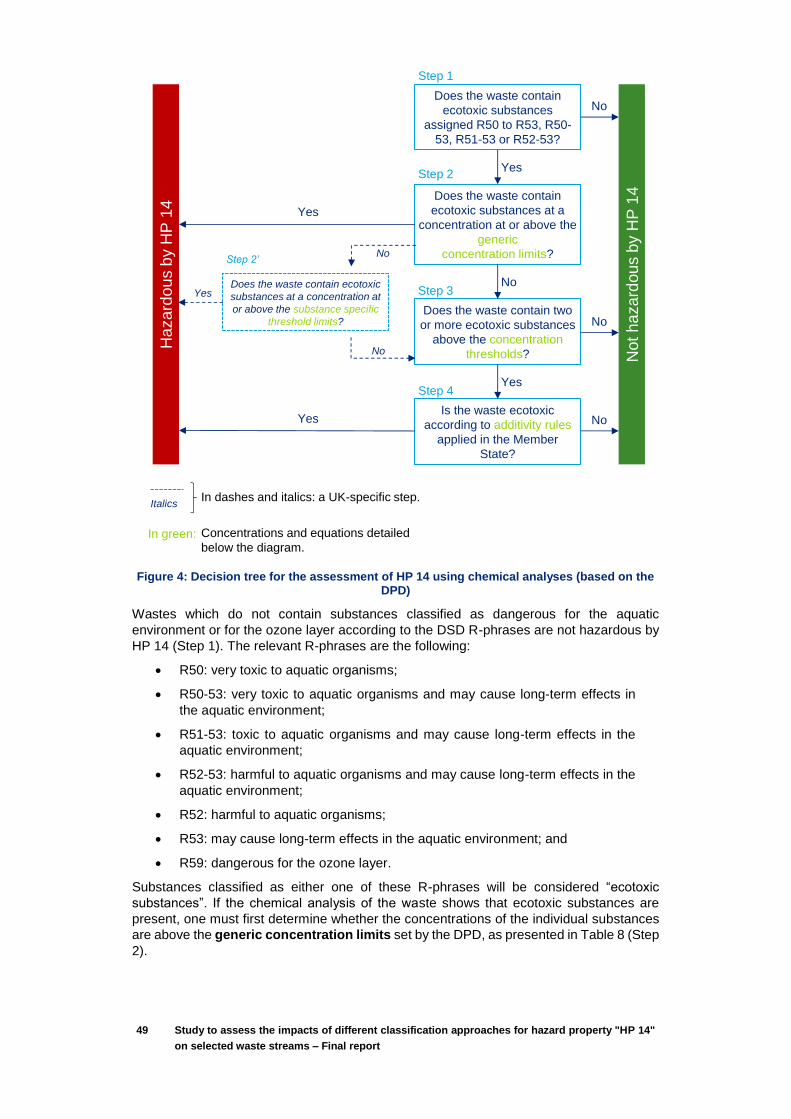
49 Study to assess the impacts of different classification approaches for hazard property "HP 14"
on selected waste streams – Final report
Figure 4: Decision tree for the assessment of HP 14 using chemical analyses (based on the DPD)
Wastes which do not contain substances classified as dangerous for the aquatic
environment or for the ozone layer according to the DSD R-phrases are not hazardous by
HP 14 (Step 1). The relevant R-phrases are the following:
R50: very toxic to aquatic organisms;
R50-53: very toxic to aquatic organisms and may cause long-term effects in
the aquatic environment;
R51-53: toxic to aquatic organisms and may cause long-term effects in the
aquatic environment;
R52-53: harmful to aquatic organisms and may cause long-term effects in the
aquatic environment;
R52: harmful to aquatic organisms;
R53: may cause long-term effects in the aquatic environment; and
R59: dangerous for the ozone layer.
Substances classified as either one of these R-phrases will be considered “ecotoxic
substances”. If the chemical analysis of the waste shows that ecotoxic substances are
present, one must first determine whether the concentrations of the individual substances
are above the generic concentration limits set by the DPD, as presented in Table 8 (Step
2).
Does the waste contain
ecotoxic substances
assigned R50 to R53, R50-
53, R51-53 or R52-53?
Does the waste contain
ecotoxic substances at a
concentration at or above the
generic
concentration limits?
Does the waste contain two
or more ecotoxic substances
above the concentration
thresholds?
Is the waste ecotoxic
according to additivity rules
applied in the Member
State?
Does the waste contain ecotoxic
substances at a concentration at
or above the substance specific
threshold limits?
Ha
za
rdo
us b
y H
P 1
4
No
t h
aza
rdou
s b
y H
P 1
4
No
Yes
No
Yes
No
No
Yes
Yes
No
No
Yes
In dashes and italics: a UK-specific step.Italics
In green: Concentrations and equations detailed
below the diagram.
Step 1
Step 2
Step 4
Step 3
Step 2’
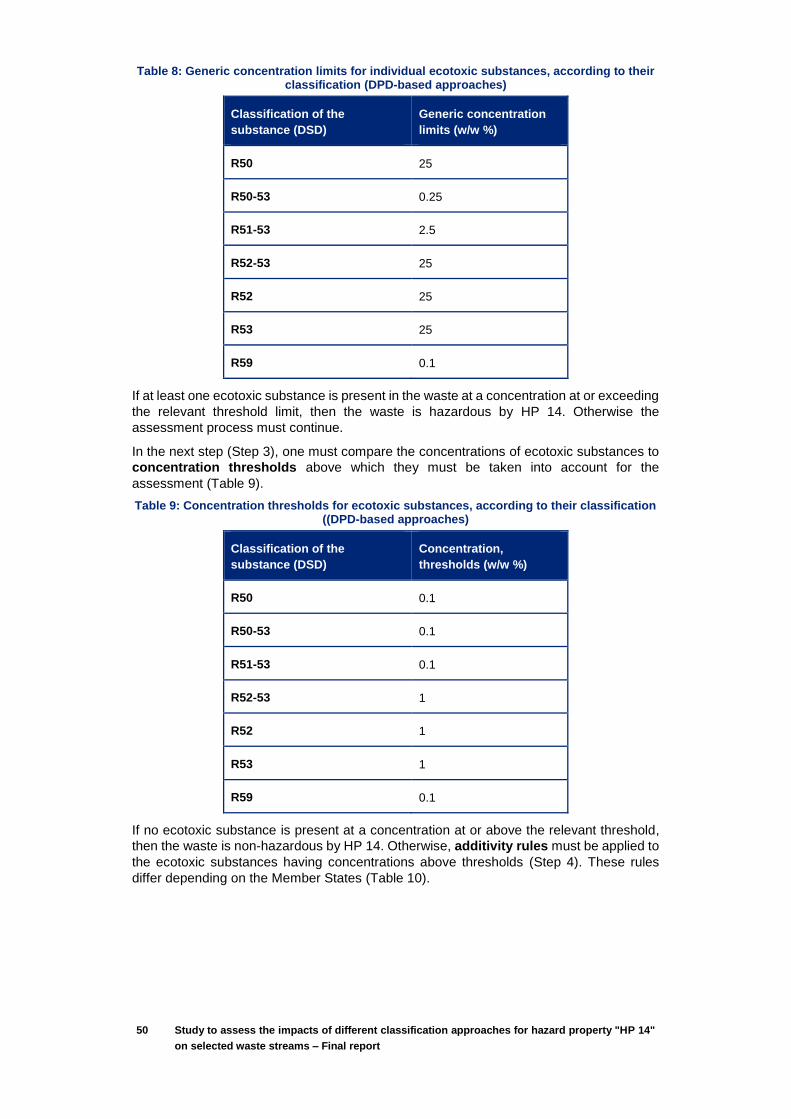
50 Study to assess the impacts of different classification approaches for hazard property "HP 14"
on selected waste streams – Final report
Table 8: Generic concentration limits for individual ecotoxic substances, according to their classification (DPD-based approaches)
Classification of the
substance (DSD)
Generic concentration
limits (w/w %)
R50 25
R50-53 0.25
R51-53 2.5
R52-53 25
R52 25
R53 25
R59 0.1
If at least one ecotoxic substance is present in the waste at a concentration at or exceeding
the relevant threshold limit, then the waste is hazardous by HP 14. Otherwise the
assessment process must continue.
In the next step (Step 3), one must compare the concentrations of ecotoxic substances to
concentration thresholds above which they must be taken into account for the
assessment (Table 9).
Table 9: Concentration thresholds for ecotoxic substances, according to their classification ((DPD-based approaches)
Classification of the
substance (DSD)
Concentration,
thresholds (w/w %)
R50 0.1
R50-53 0.1
R51-53 0.1
R52-53 1
R52 1
R53 1
R59 0.1
If no ecotoxic substance is present at a concentration at or above the relevant threshold,
then the waste is non-hazardous by HP 14. Otherwise, additivity rules must be applied to
the ecotoxic substances having concentrations above thresholds (Step 4). These rules
differ depending on the Member States (Table 10).
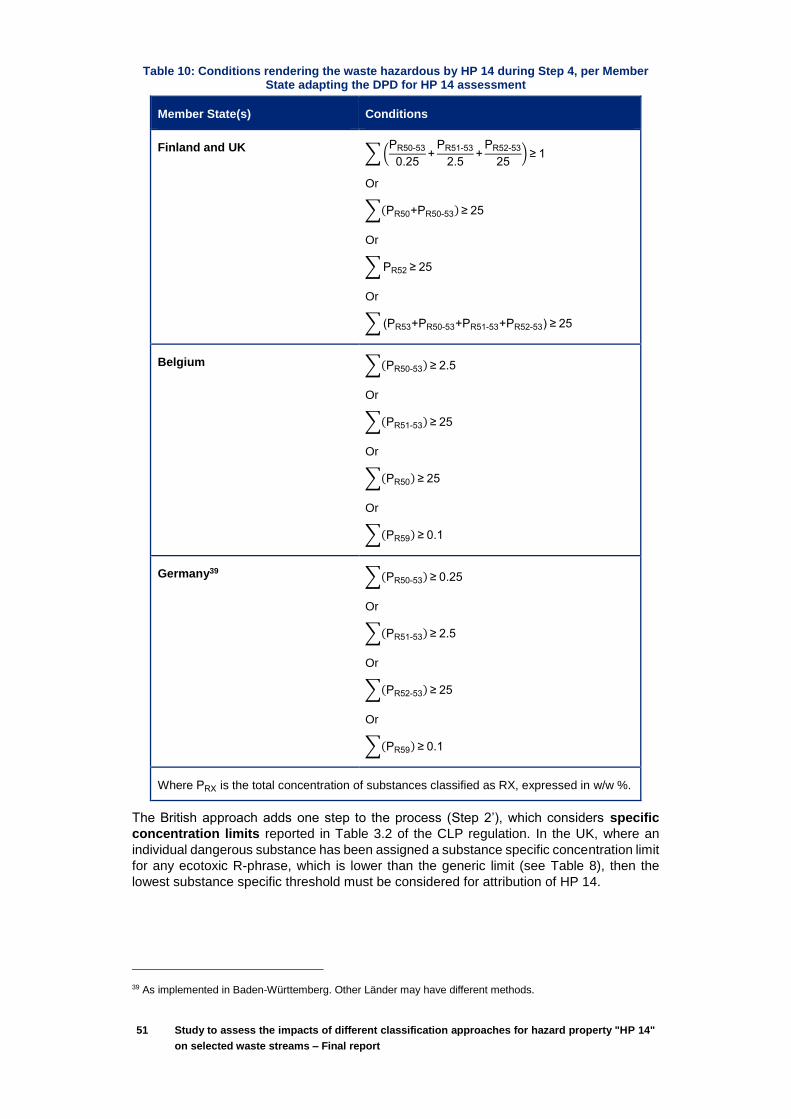
51 Study to assess the impacts of different classification approaches for hazard property "HP 14"
on selected waste streams – Final report
Table 10: Conditions rendering the waste hazardous by HP 14 during Step 4, per Member State adapting the DPD for HP 14 assessment
Member State(s) Conditions
Finland and UK ∑ (
PR50-53
0.25+
PR51-53
2.5+
PR52-53
25) ≥ 1
Or
∑(PR50+PR50-53) ≥ 25
Or
∑ PR52 ≥ 25
Or
∑ (PR53+PR50-53+PR51-53+PR52-53) ≥ 25
Belgium ∑(PR50-53) ≥ 2.5
Or
∑(PR51-53) ≥ 25
Or
∑(PR50) ≥ 25
Or
∑(PR59) ≥ 0.1
Germany39 ∑(PR50-53) ≥ 0.25
Or
∑(PR51-53) ≥ 2.5
Or
∑(PR52-53) ≥ 25
Or
∑(PR59) ≥ 0.1
Where PRX is the total concentration of substances classified as RX, expressed in w/w %.
The British approach adds one step to the process (Step 2’), which considers specific
concentration limits reported in Table 3.2 of the CLP regulation. In the UK, where an
individual dangerous substance has been assigned a substance specific concentration limit
for any ecotoxic R-phrase, which is lower than the generic limit (see Table 8), then the
lowest substance specific threshold must be considered for attribution of HP 14.
39 As implemented in Baden-Württemberg. Other Länder may have different methods.
52 Study to assess the impacts of different classification approaches for hazard property "HP 14"
on selected waste streams – Final report
3.3.2.2. Approaches based on the ADR
The ADR is applied differently by the two Member States (Italy and Austria) taking it as
reference.
Austria
Ecotoxic classification of waste is performed with reference to the ADR for aquatoxicity and
on the content of some hydrocarbons and halons for ozone depletion. A waste is classified
as hazardous by HP 14 if:
The waste in an environmental hazardous material according to Class 9, M6
and M7 of the ADR; or
It contains CFCs, CFHCs, HCFCs, HFHCs, FHCs, or halons in amount of more
than 2000 mg/kg dry matter.
The approach adopted in Austria does not rely on calculations. In the first case, it relies on
the conclusions of the assessment performed for ADR classification and in the second
case, a chemical analysis is enough.
Italy
HP 14 is attributed to the waste according to the processes of the ADR for Class 9, M6 and
M7, under Italian law 28/2012. This law adapts to waste classification the procedures for
the classification of mixtures. It calls for HP 14 to be attributed by applying “conventional”
ADR calculation methods, which are coherent with the limit values laid out in the CLP &
the DPD.
The process for assessing HP 14 in Italy is described in the decision tree below (Figure 5),
which follows a similar procedure as done in DPD-based approach (see Figure 4).

53 Study to assess the impacts of different classification approaches for hazard property "HP 14"
on selected waste streams – Final report
Figure 5: Decision tree for the assessment of HP 14 in Italy
Substances considered in the Italian assessment are those classified as Acute 1, Chronic
1 and Chronic 2 according to the GHS (Table 11).
Table 11: Hazard classes considered in the Italian HP 14 assessment
Hazard category DSD phrase CLP phrase
Acute 1 R50 H400
Chronic 1 R50-53 H410
Chronic 2 R51-53 H411
The Chronic 3 & 4 categories are not taken into account, as they are not considered in the
ADR. Therefore, ADR-based approaches encompass a narrower range of toxic properties
than DPD-based approaches.
In addition to classified substances, the Italian ISS (Higher Institute of Health) identified
four groups of hydrocarbons (listed in Table 12) which are to be considered just like
substances, that is to say, like individual components that participate in the calculation in a
cumulative way with the other ecotoxic substances present.
Is the waste ecotoxic
according to additivity rule 2
regarding R50-53 (H410)?
Does the waste contain
ecotoxic substances
assigned R50 (H400), R50-
53 (H410), or R51-53
(H411)?
Does the waste contain two
or more ecotoxic substances
above the concentration
thresholds?
Is the waste ecotoxic
according to additivity rule 1
regarding R50 (H400)?
Hazard
ous b
y H
P 1
4
Not hazard
ous b
y H
P 1
4
No
Yes
Yes
No
In green: Concentrations and equations detailed
below the diagram
Step 1
Step 4
Step 3
No
Is the waste ecotoxic
according to the additivity
rule 3 regarding R50-53
(H410) and R52-53 (H411)?
No
Step 2
Step 5
Yes
Yes
Yes No
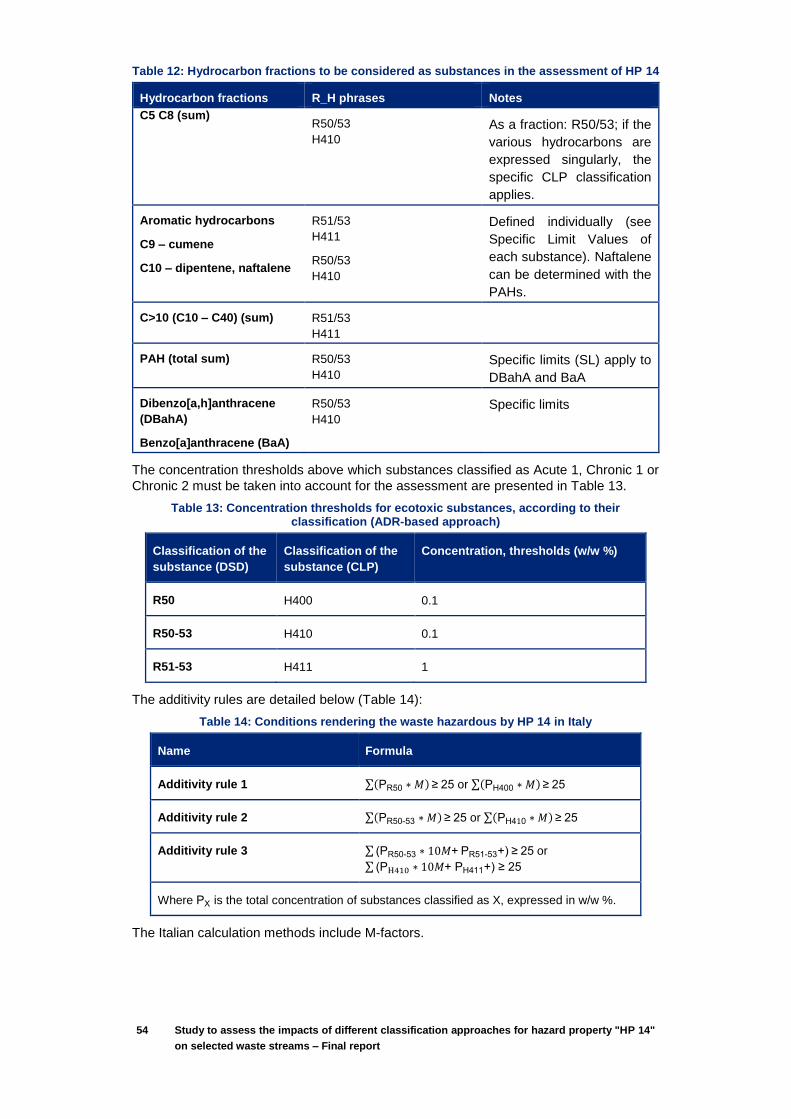
54 Study to assess the impacts of different classification approaches for hazard property "HP 14"
on selected waste streams – Final report
Table 12: Hydrocarbon fractions to be considered as substances in the assessment of HP 14
Hydrocarbon fractions R_H phrases Notes
C5 C8 (sum) R50/53
H410
As a fraction: R50/53; if the
various hydrocarbons are
expressed singularly, the
specific CLP classification
applies.
Aromatic hydrocarbons
C9 – cumene
C10 – dipentene, naftalene
R51/53
H411
R50/53
H410
Defined individually (see
Specific Limit Values of
each substance). Naftalene
can be determined with the
PAHs.
C>10 (C10 – C40) (sum) R51/53
H411
PAH (total sum) R50/53
H410
Specific limits (SL) apply to
DBahA and BaA
Dibenzo[a,h]anthracene
(DBahA)
Benzo[a]anthracene (BaA)
R50/53
H410
Specific limits
The concentration thresholds above which substances classified as Acute 1, Chronic 1 or
Chronic 2 must be taken into account for the assessment are presented in Table 13.
Table 13: Concentration thresholds for ecotoxic substances, according to their classification (ADR-based approach)
Classification of the
substance (DSD)
Classification of the
substance (CLP)
Concentration, thresholds (w/w %)
R50 H400 0.1
R50-53 H410 0.1
R51-53 H411 1
The additivity rules are detailed below (Table 14):
Table 14: Conditions rendering the waste hazardous by HP 14 in Italy
Name Formula
Additivity rule 1 ∑(PR50 ∗ 𝑀) ≥ 25 or ∑(PH400 ∗ 𝑀) ≥ 25
Additivity rule 2 ∑(PR50-53 ∗ 𝑀) ≥ 25 or ∑(PH410 ∗ 𝑀) ≥ 25
Additivity rule 3 ∑ (PR50-53 ∗ 10𝑀+ PR51-53+) ≥ 25 or
∑ (PH410 ∗ 10𝑀+ PH411+) ≥ 25
Where PX is the total concentration of substances classified as X, expressed in w/w %.
The Italian calculation methods include M-factors.

55 Study to assess the impacts of different classification approaches for hazard property "HP 14"
on selected waste streams – Final report
3.3.2.3. Approach based on the CLP regulation
The French approach is based on a proposal that was formulated to the TAC in 2012. The French additivity rules consider only the Acute 1, Chronic 1 and Chronic 2 categories (but not the categories Chronic 3 and Chronic 4) for assessing HP 14 and include M-factors.
Table 15: French additivity rules
∑(PH400 ∗ 𝑀) ≥ 25
∑ (PH410 ∗ 10𝑀+ PH411+) ≥ 25
The restricted list of hazard classes compared to DPD-based approaches, as well as the inclusion of M-factors and the structure of the formulas, makes the French approach quite similar to the Italian one.
The M-factors used in the calculations are those mentioned in the CLP and additional ones
are used as required, calculated from EC50s and NOECs. The calculated M-factors are
not harmonised at EU-level.
3.3.3. Approaches using biotests
Czech Republic, France, Spain and Germany use biotests for the assessment of HP 14;
the Czech Republic and Spain rely exclusively on them for the assessment, while Germany
and France use them in a combined approach with chemical analyses.
Approaches based on biotests involve assays on aquatic and soil organisms in order to
directly evaluate the ecotoxicity of waste. Preparing waste samples is a key step for the
assessment of ecotoxicity, as test results can be highly variable depending on the protocol.
All studied Member States follow standardised protocols (Table 16).
Table 16: Standards for preparing waste samples
Member State Standard Scope Description
Czech
Republic
EN 14735 raw wastes
or water
extracts
Necessary steps to be performed
before carrying out ecotoxicity tests
on wastes: taking of the sample,
transport, storage of wastes and to
define preparation.
France EN 12457 - 2 water
extracts
Leaching - Compliance test for
leaching of granular waste
materials and sludge. One stage
batch test at a liquid to solid ratio of
10 l/kg for materials with particle
size below 4 mm (without or with
size reduction)
Germany EN 12457 – 2
water
extracts
See France
DIN 19528 water
extracts
Leaching of solid materials -
Percolation method for the joint
examination of the leaching
behaviour of inorganic and organic
substances
Spain EN 12457 - 2 water
extracts
See France
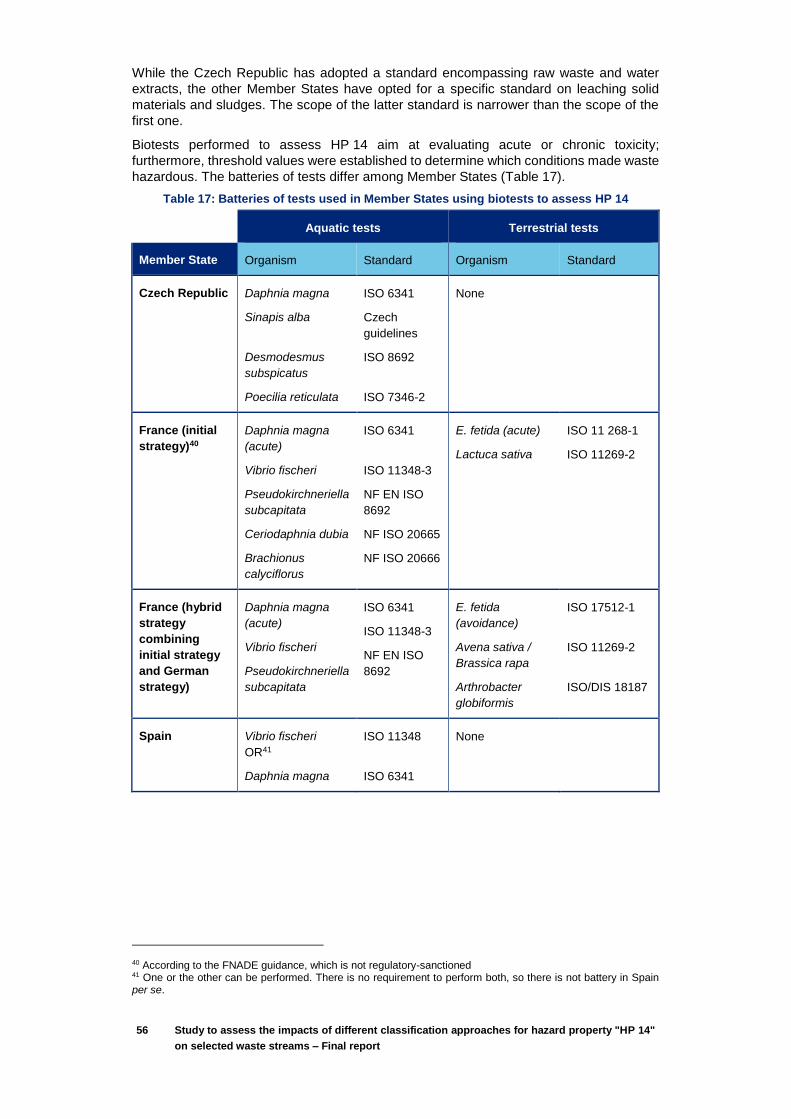
56 Study to assess the impacts of different classification approaches for hazard property "HP 14"
on selected waste streams – Final report
While the Czech Republic has adopted a standard encompassing raw waste and water
extracts, the other Member States have opted for a specific standard on leaching solid
materials and sludges. The scope of the latter standard is narrower than the scope of the
first one.
Biotests performed to assess HP 14 aim at evaluating acute or chronic toxicity;
furthermore, threshold values were established to determine which conditions made waste
hazardous. The batteries of tests differ among Member States (Table 17).
Table 17: Batteries of tests used in Member States using biotests to assess HP 14
Aquatic tests Terrestrial tests
Member State Organism Standard Organism Standard
Czech Republic Daphnia magna
Sinapis alba
Desmodesmus
subspicatus
Poecilia reticulata
ISO 6341
Czech
guidelines
ISO 8692
ISO 7346-2
None
France (initial
strategy)40
Daphnia magna
(acute)
Vibrio fischeri
Pseudokirchneriella
subcapitata
Ceriodaphnia dubia
Brachionus
calyciflorus
ISO 6341
ISO 11348-3
NF EN ISO
8692
NF ISO 20665
NF ISO 20666
E. fetida (acute)
Lactuca sativa
ISO 11 268-1
ISO 11269-2
France (hybrid
strategy
combining
initial strategy
and German
strategy)
Daphnia magna
(acute)
Vibrio fischeri
Pseudokirchneriella
subcapitata
ISO 6341
ISO 11348-3
NF EN ISO
8692
E. fetida
(avoidance)
Avena sativa /
Brassica rapa
Arthrobacter
globiformis
ISO 17512-1
ISO 11269-2
ISO/DIS 18187
Spain Vibrio fischeri
OR41
Daphnia magna
ISO 11348
ISO 6341
None
40 According to the FNADE guidance, which is not regulatory-sanctioned 41 One or the other can be performed. There is no requirement to perform both, so there is not battery in Spain per se.

57 Study to assess the impacts of different classification approaches for hazard property "HP 14"
on selected waste streams – Final report
Aquatic tests Terrestrial tests
Member State Organism Standard Organism Standard
Germany Daphnia magna
(acute)
Daphnia magna
(chronic)
Vibrio fischeri
Pseudokirchneriella
subcapitata /
Desmodesmus
subspicatus
Lemna minor
ISO 6341
ISO 10706
ISO 11348-
1/2/3
NF EN ISO
8692
ISO 20079
First version
E. fetida (chronic)
Brassica rapa
Arthrobacter
globiformis
Second version
E. fetida (chronic)
Brassica rapa
Arthrobacter
globiformis
Folsomia candida
(chronic)
ISO 12 268-1
ISO 11269-2
ISO/DIS 18187
ISO 12 268-1
ISO 11269-2
ISO/DIS 18187
ISO 11267
France and Germany consider both aquatic and terrestrial organisms for assessing waste
ecotoxicity. In those countries, a tiered approach is used, where aquatic tests are prioritised
and terrestrial tests are performed only if aquatic tests are inconclusive. In Spain and the
Czech Republic, only aquatic tests are performed. Nevertheless, in the Czech Republic,
members of the scientific community recommend the use of terrestrial tests in the
assessment of HP 1442.
Among all biotests summarised in Table 17, standardised test on Daphnia magna (acute)
is the only test which is performed in all Member States. Nevertheless, others tests are
used by more than two Members States such as: the inhibition of light emission of Vibrio
fischeri and the algal growth inhibition test. Regarding Daphnia magna, threshold values
differ among Member States (as shown in Table 18).
Table 18: Tests on Daphnia magna, as used in Member States relying on biotests for the assessment of HP 14
Standard Test duration Expression of results Threshold value
France
ISO 6341
24h or 48h
EC50
10% (v/v)
Spain 750 mg/L43
Germany
48h
10% (v/v)
Czech
Republic
10mL/L43 (i.e. 1%
v/v)
Spain set values in mg/L and the Czech Republic in mL/L, while the other countries prefer
% (v/v).
42 D. Sirotková, M. Kulovaná, S. Vosáhlová, J. Hofman, V. Kočí, M. Záleská, Novelization of Czech approaches to ecotoxicity evaluation of hazardous wastes 43 Thresholds set in mg/L and mL/L are inseparable from the waste preparation protocols. They are associated to the L/S ratio of the leaching procedure and have only a meaning expressed in terms of the leachate itself

58 Study to assess the impacts of different classification approaches for hazard property "HP 14"
on selected waste streams – Final report
The overall description of strategies using biotests, as well as the focus on the one test the
studied countries have in common (Daphnia magna), clearly show the heterogeneity of
approaches based on biotests.
3.3.4. Combined approaches
In Germany and France, assessment of HP 14 follows a tiered approach and is dependent
upon the type of information available for the waste itself and for its components. If the
composition of the waste sample can be sufficiently known through chemical analysis, then
classification according to HP 14 is done following the methods described in section 3.3.2
(see Figure 3, Table 10 and Table 15). If the composition of the waste is unknown or
complex, biotests are applied. The testing strategy includes a test battery with terrestrial
and aquatic tests, as described in section 3.3.3 (see Table 17 and Table 18).
Germany and France adopted different strategies for assessing HP 14 with chemical
analysis. Germany follows the DPD, while France developed methods consistent with the
CLP regulation. The methods are reported in Table 19.
Table 19: Comparison between France and Germany regarding calculation methods
France Germany39
∑(PH400 ∗ 𝑴) ≥ 25
∑ (P𝐇𝟒𝟏𝟎 ∗ 𝟏𝟎𝑴+ PH411+) ≥ 25
∑(PR50-53) ≥ 0.25
Or
∑(PR51-53) ≥ 2.5
Or
∑(PR52-53) ≥ 25
Or
∑(PR59) ≥ 0.1
Where PRX is the total concentration of substances classified as RX, expressed in w/w %.
However, the German and French batteries of biotests are very similar (Table 20).
Table 20: Batteries of tests used in Germany and Italy
Aquatic tests Terrestrial tests
Member State Organism Standard Organism Standard
France (initial
strategy)44
Daphnia magna
(acute)
Vibrio fischeri
Pseudokirchneriella
subcapitata
Ceriodaphnia dubia
Brachionus
calyciflorus
ISO 6341
ISO 11348-3
NF EN ISO
8692
NF ISO 20665
NF ISO 20666
E. fetida (acute)
Lactuca sativa
ISO 11 268-1
ISO 11269-2
44 According to the FNADE guidance, which is not regulatory-sanctioned
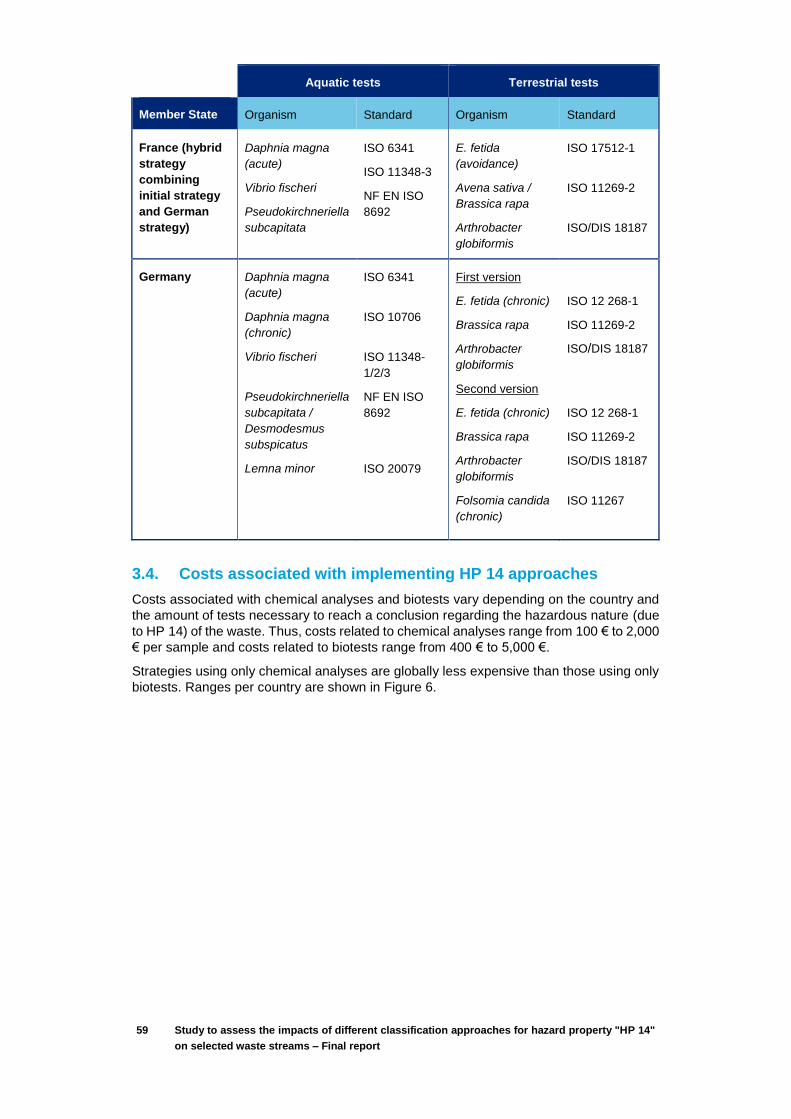
59 Study to assess the impacts of different classification approaches for hazard property "HP 14"
on selected waste streams – Final report
Aquatic tests Terrestrial tests
Member State Organism Standard Organism Standard
France (hybrid
strategy
combining
initial strategy
and German
strategy)
Daphnia magna
(acute)
Vibrio fischeri
Pseudokirchneriella
subcapitata
ISO 6341
ISO 11348-3
NF EN ISO
8692
E. fetida
(avoidance)
Avena sativa /
Brassica rapa
Arthrobacter
globiformis
ISO 17512-1
ISO 11269-2
ISO/DIS 18187
Germany Daphnia magna
(acute)
Daphnia magna
(chronic)
Vibrio fischeri
Pseudokirchneriella
subcapitata /
Desmodesmus
subspicatus
Lemna minor
ISO 6341
ISO 10706
ISO 11348-
1/2/3
NF EN ISO
8692
ISO 20079
First version
E. fetida (chronic)
Brassica rapa
Arthrobacter
globiformis
Second version
E. fetida (chronic)
Brassica rapa
Arthrobacter
globiformis
Folsomia candida
(chronic)
ISO 12 268-1
ISO 11269-2
ISO/DIS 18187
ISO 12 268-1
ISO 11269-2
ISO/DIS 18187
ISO 11267
3.4. Costs associated with implementing HP 14 approaches
Costs associated with chemical analyses and biotests vary depending on the country and
the amount of tests necessary to reach a conclusion regarding the hazardous nature (due
to HP 14) of the waste. Thus, costs related to chemical analyses range from 100 € to 2,000
€ per sample and costs related to biotests range from 400 € to 5,000 €.
Strategies using only chemical analyses are globally less expensive than those using only
biotests. Ranges per country are shown in Figure 6.

60 Study to assess the impacts of different classification approaches for hazard property "HP 14"
on selected waste streams – Final report
Figure 6: Ranges of costs in Member States for which the information is available
France is the Member State in which assessing HP 14 is the most expensive if the whole
test battery is performed, followed by Belgium (Flanders) where chemical analyses using
AFNOR XP X30-489 are 1,900 € per sample. The Member States where assessing HP 14
is the least expensive are Austria and the UK. In Austria, no specific costs are associated
with assessing HP 14 because it relies on conclusions from assessments conducted for
transportation of waste (and on identification of ozone depleting substances in the waste).
3.5. Advantages and limits of the approaches
3.5.1. Approaches based on chemical analysis
Approaches based on chemical analyses are easy and satisfactory for well-defined waste
samples. In particular, strategies based on the DPD are clear and align directly with
chemical risk phrase classification systems. Non-inclusion of M-factors makes it possible
to apply concentration threshold cut-off values of 0.1% and 1% and thus exclude minor
concentrations of substances from the assessment: if M-factors are applied, thresholds
would be of 0.1%/M or 1%/M and would be exceeded by a lot of substances, then raising
concerns that it might be impossible to prove that a waste is not ecotoxic using this
approach. The Austrian strategy, partly based on classification according to the ADR, is
easier to apply than DPD-based approaches and costs less because it relies on
conclusions from assessments conducted for transportation of waste. Among Member
States which base their approaches on chemical analysis only, the British strategy is the
most complete. It extends concentration limits to specific values reported in the CLP
regulation, thus including more recent legislation and providing a more finely tuned
approach to waste classification with chemical analysis. An additional advantage of
approaches based on chemical analysis is their lower cost compared to approaches based
on biotests, which may involve batteries with several tests.
Limited information and uncertainties regarding the composition of waste is the main limit
of approaches based on chemical analysis. Methodologies provided in the DPD and the
CLP are meant for mixtures with known composition and their applicability for the
assessment of waste, which generally requires the assessment of a mixture with partially
unknown composition (to variable extents), is therefore limited. In particular, the
heterogeneity of waste samples, with high content of anions, alkaline earth metals and
silica, can make determination of composition difficult. Furthermore, there are only a few
suitable methods to identify many organic substances in waste (which are not widely
applied); as a result, approaches based on chemical analysis often do not take into account
Range of costs (€) – Biotests
Not included in the sample, or no
information
100 – 500
Range of costs (€) – Chemical analyses
500 – 1,000
1,000 – 3,000
3,000 – 5,000
100 – 500
500 – 1,000
1,000 – 3,000
3,000 – 5,000
61 Study to assess the impacts of different classification approaches for hazard property "HP 14"
on selected waste streams – Final report
the organic share of waste (as organic substances are not identified), thus underestimating
the share of potentially ecotoxic organic components. Additionally, the application of worst-
case scenarios when the composition of waste is not sufficiently known can lead to an
overestimation of the waste hazard. Thus, assessments using chemical analyses may not
reflect the actual ecotoxicity of waste.
3.5.2. Approaches based on biotests
Biotests are used to directly measure the effects of the bioavailable constituents, including
their potential interactions (additive, synergistic and antagonistic), and are useful in
assessing very complex matrices, having many constituents, which are very difficult or
impossible to be determined by chemical analysis. Furthermore, aquatic ecotoxicity tests
are known to be sensitive to many water soluble substances, thus being relevant to the
assessment of wastes and addressing the main limitation of ecotoxicity assessment with
chemical analysis, i.e. uncertainties regarding the composition of waste.
The lack of legally-fixed and harmonised threshold values is perhaps the main drawback
and barrier to assessing HP 14 using biotests. There is a need to collect sufficient
experimental data to conclude definitely on the suitability of the different proposed
threshold values to discriminate between “ecotoxic” and non-classified wastes.
Furthermore, threshold values set in mg/L or mL/L can lead to confusion in the
interpretation, as it can be unclear whether concentrations are expressed in terms of the
amount of residue of departure or in terms of the leachate (an order of magnitude difference
between the two interpretations [x 10]). Finland, which allows biotests as a means for
assessing HP 14 if information on the chemical composition of the waste is insufficient,
highlights that they are not applied in practice because no threshold values have been set.
In the UK, the scope for assessing waste with biotests is also very limited, for another
reason: UK holds the view that animal testing of solid wastes is of little or no scientific value
and raises ethical concerns. Those concerns are also stressed by Italy as a limit to biotests.
Nevertheless, it should be highlighted that test species are not in the scope of the Directive
2010/63/EU on the protection of animals used for scientific purposes45, with the exception
of fish (Poecilia reticulata, used in Czech Republic).
Another limit exists when the battery of biotests only includes aquatic tests (Spain and the
Czech Republic): toxicity on soil ecosystems is not evaluated when assessing HP 1446.
There is a number of reasons legitimating the use of terrestrial tests42, the main one being
that using only aquatic tests means that toxic effects of substances (poorly or totally)
insoluble in water might be underestimated.
One last limit is the high cost of the most complete test batteries: for instance, costs are of
3,000 – 5,000 € in France. However, it should be stressed that these costs could be
significantly reduced by performing limit tests at the threshold concentration.
3.5.3. Combined approaches
Combined approaches address some limitations of the two individual approaches
(chemical analysis and biotests) and have a good complementarity. When determining the
composition of the waste is possible, conclusions on ecotoxicity can be drawn from
chemical analysis, so that testing on biological organisms is not necessary. If the waste
sample is too complex, or the preliminary process related information is not available, for
its relevant constituents´composition to be well-defined , the use of biotests can
nevertheless allow the assessment of its ecotoxicity. Furthermore, combined approaches
have recently been investigated by researchers as a promising alternative to the status quo
(i.e. no official requirement or guidance) regarding the assessment of HP 14 in the EU47.
45 http://eur-lex.europa.eu/legal-content/EN/TXT/PDF/?uri=CELEX:32010L0063&from=EN 46 This is also the case for chemical approaches 47 Pascal Pandard and Jörg Römbke (2013) Proposal for a “Harmonized” Strategy for the Assessment of the HP 14 Property, Integrated Environmental Assessment and Management — Volume 9, Number 4—pp. 665–672
62 Study to assess the impacts of different classification approaches for hazard property "HP 14"
on selected waste streams – Final report
However, as indicated above, some disadvantages remain. There are no harmonised
threshold or limit values to define the border between an “ecotoxic” and a non-ecotoxic
waste (for the purposes of classification) and there is no agreement on the minimum test
battery, as shown in Table 19 and Table 20 in section 3.3.4. Furthermore, it has been
noticed that the results of the two approaches (chemical analysis and biotests) are often
different (mainly because they do not apply on the same fraction of waste, i.e. biotests
apply on the whole sample whereas chemical analyses account for only the analysed mass
fraction of the sample, which is usually less than 15% of the sample weight) and therefore
can lead to different classification of the waste.
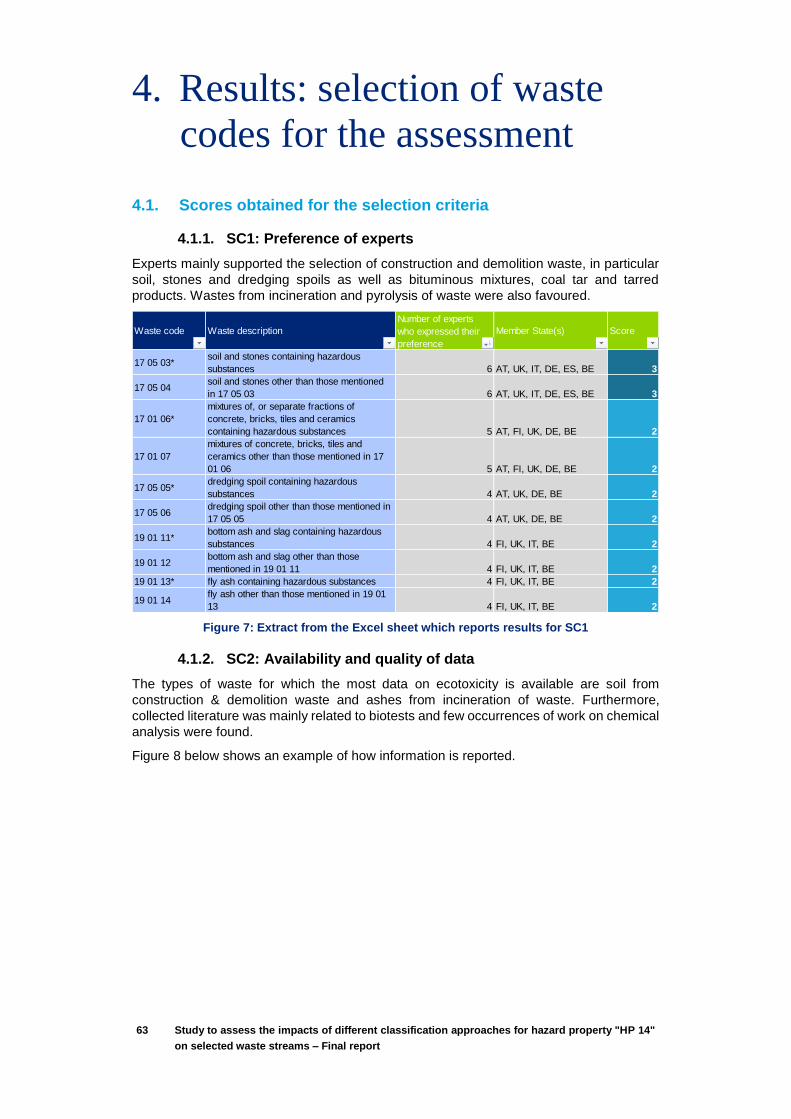
63 Study to assess the impacts of different classification approaches for hazard property "HP 14"
on selected waste streams – Final report
4. Results: selection of waste
codes for the assessment
4.1. Scores obtained for the selection criteria
4.1.1. SC1: Preference of experts
Experts mainly supported the selection of construction and demolition waste, in particular
soil, stones and dredging spoils as well as bituminous mixtures, coal tar and tarred
products. Wastes from incineration and pyrolysis of waste were also favoured.
Figure 7: Extract from the Excel sheet which reports results for SC1
4.1.2. SC2: Availability and quality of data
The types of waste for which the most data on ecotoxicity is available are soil from
construction & demolition waste and ashes from incineration of waste. Furthermore,
collected literature was mainly related to biotests and few occurrences of work on chemical
analysis were found.
Figure 8 below shows an example of how information is reported.
Waste code Waste description
Number of experts
who expressed their
preference
Member State(s) Score
17 05 03* soil and stones containing hazardous
substances 6 AT, UK, IT, DE, ES, BE 3
17 05 04 soil and stones other than those mentioned
in 17 05 03 6 AT, UK, IT, DE, ES, BE 3
17 01 06*
mixtures of, or separate fractions of
concrete, bricks, tiles and ceramics
containing hazardous substances 5 AT, FI, UK, DE, BE 2
17 01 07
mixtures of concrete, bricks, tiles and
ceramics other than those mentioned in 17
01 06 5 AT, FI, UK, DE, BE 2
17 05 05* dredging spoil containing hazardous
substances 4 AT, UK, DE, BE 2
17 05 06 dredging spoil other than those mentioned in
17 05 05 4 AT, UK, DE, BE 2
19 01 11* bottom ash and slag containing hazardous
substances 4 FI, UK, IT, BE 2
19 01 12 bottom ash and slag other than those
mentioned in 19 01 11 4 FI, UK, IT, BE 2
19 01 13* fly ash containing hazardous substances 4 FI, UK, IT, BE 2
19 01 14 fly ash other than those mentioned in 19 01
13 4 FI, UK, IT, BE 2
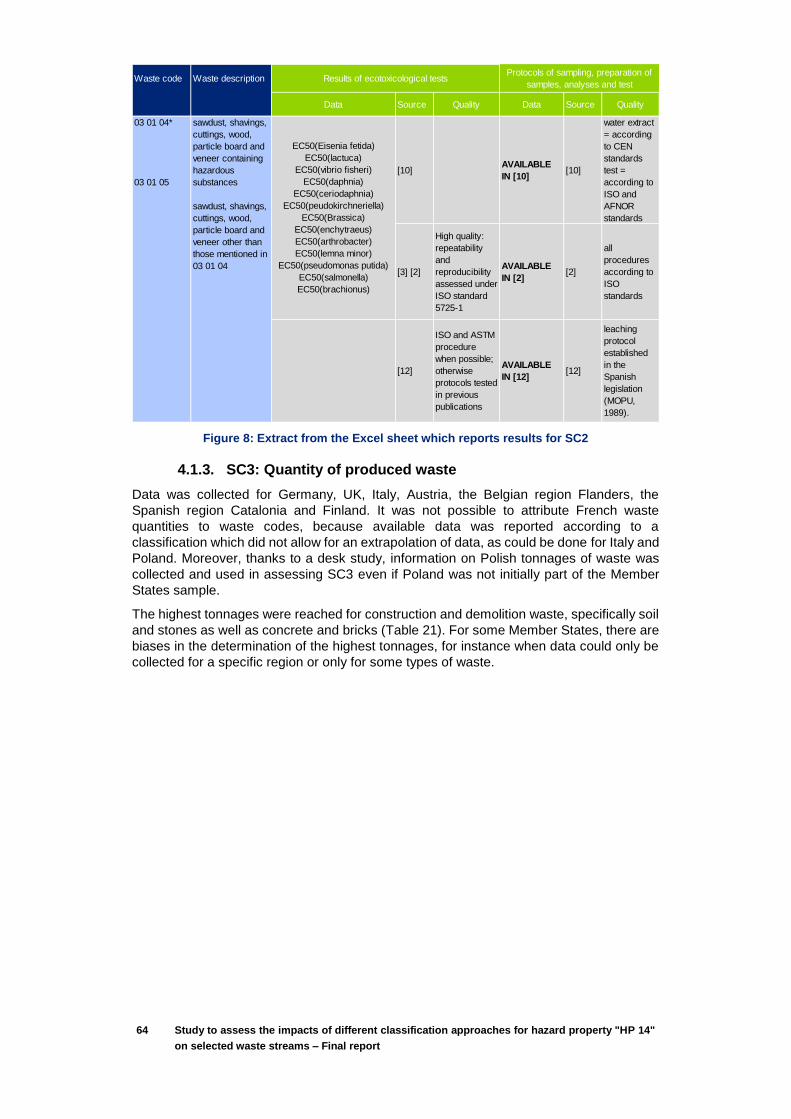
64 Study to assess the impacts of different classification approaches for hazard property "HP 14"
on selected waste streams – Final report
Figure 8: Extract from the Excel sheet which reports results for SC2
4.1.3. SC3: Quantity of produced waste
Data was collected for Germany, UK, Italy, Austria, the Belgian region Flanders, the
Spanish region Catalonia and Finland. It was not possible to attribute French waste
quantities to waste codes, because available data was reported according to a
classification which did not allow for an extrapolation of data, as could be done for Italy and
Poland. Moreover, thanks to a desk study, information on Polish tonnages of waste was
collected and used in assessing SC3 even if Poland was not initially part of the Member
States sample.
The highest tonnages were reached for construction and demolition waste, specifically soil
and stones as well as concrete and bricks (Table 21). For some Member States, there are
biases in the determination of the highest tonnages, for instance when data could only be
collected for a specific region or only for some types of waste.
Waste code Waste description
Waste code Waste description Data Source Quality Data Source Quality
[10]AVAILABLE
IN [10][10]
water extract
= according
to CEN
standards
test =
according to
ISO and
AFNOR
standards
[3] [2]
High quality:
repeatability
and
reproducibility
assessed under
ISO standard
5725‐1
AVAILABLE
IN [2][2]
all
procedures
according to
ISO
standards
[12]
ISO and ASTM
procedure
when possible;
otherwise
protocols tested
in previous
publications
AVAILABLE
IN [12][12]
leaching
protocol
established
in the
Spanish
legislation
(MOPU,
1989).
Results of ecotoxicological testsProtocols of sampling, preparation of
samples, analyses and test
EC50(Eisenia fetida)
EC50(lactuca)
EC50(vibrio fisheri)
EC50(daphnia)
EC50(ceriodaphnia)
EC50(peudokirchneriella)
EC50(Brassica)
EC50(enchytraeus)
EC50(arthrobacter)
EC50(lemna minor)
EC50(pseudomonas putida)
EC50(salmonella)
EC50(brachionus)
03 01 04*
03 01 05
sawdust, shavings,
cuttings, wood,
particle board and
veneer containing
hazardous
substances
sawdust, shavings,
cuttings, wood,
particle board and
veneer other than
those mentioned in
03 01 04
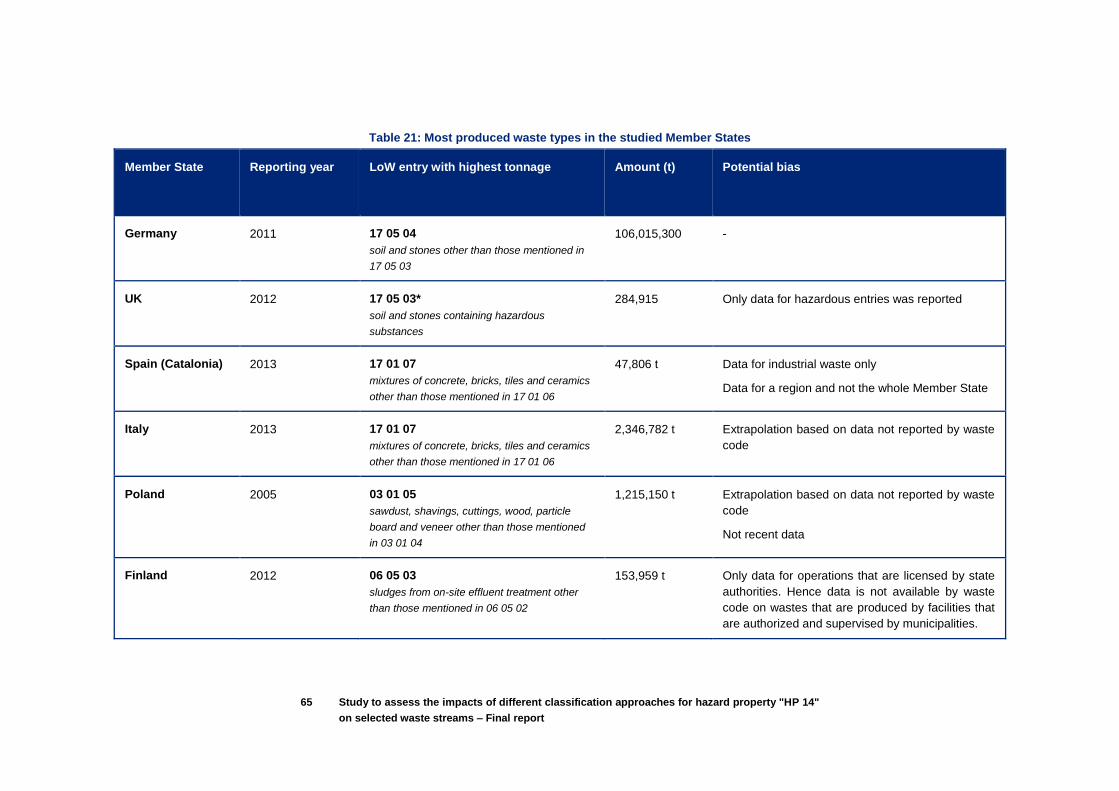
65 Study to assess the impacts of different classification approaches for hazard property "HP 14"
on selected waste streams – Final report
Table 21: Most produced waste types in the studied Member States
Member State Reporting year LoW entry with highest tonnage Amount (t) Potential bias
Germany 2011 17 05 04
soil and stones other than those mentioned in
17 05 03
106,015,300 -
UK 2012 17 05 03*
soil and stones containing hazardous
substances
284,915 Only data for hazardous entries was reported
Spain (Catalonia) 2013 17 01 07
mixtures of concrete, bricks, tiles and ceramics
other than those mentioned in 17 01 06
47,806 t Data for industrial waste only
Data for a region and not the whole Member State
Italy 2013 17 01 07
mixtures of concrete, bricks, tiles and ceramics
other than those mentioned in 17 01 06
2,346,782 t Extrapolation based on data not reported by waste
code
Poland 2005 03 01 05
sawdust, shavings, cuttings, wood, particle
board and veneer other than those mentioned
in 03 01 04
1,215,150 t Extrapolation based on data not reported by waste
code
Not recent data
Finland 2012 06 05 03
sludges from on-site effluent treatment other
than those mentioned in 06 05 02
153,959 t Only data for operations that are licensed by state
authorities. Hence data is not available by waste
code on wastes that are produced by facilities that
are authorized and supervised by municipalities.

66 Study to assess the impacts of different classification approaches for hazard property "HP 14"
on selected waste streams – Final report
Member State Reporting year LoW entry with highest tonnage Amount (t) Potential bias
Belgium
(Flanders)
2012 17 05 04
soil and stones other than those mentioned in
17 05 03
960,826 t Data per waste code of selected companies: every
two years, OVAM selects about 8000 companies
(statistically relevant selection per economic sector
and dimension) who are obliged to report the
amount and type of waste produced.
Data for a region and not the whole Member State
Austria 2009 17 05 04
soil and stones other than those mentioned in
17 05 03
23,500,000 t -

67 Study to assess the impacts of different classification approaches for hazard property "HP 14"
on selected waste streams – Final report
The biases highlighted in Table 21 were taken into account when scoring: this is explained
in section 2.2.2.3, Table 4.
Figure 9 below shows an example of how information is reported in the Excel file:
Figure 9: Extract from the Excel sheet which reports results for SC3 (the percentage of waste is indicated as compared to total waste produced in the Member State)
4.1.4. SC4: Economic importance
Waste types identified as the most economically important with the methodology presented
in section 2.2.2.4 (taking into account volumes of transboundary shipments, inputs of the
Competent Authorities regarding high generated volumes, percentage of waste-to-energy
recovery, percentage of waste-to-material recovery). are soil and stones from construction
or demolition activities, as well as solid waste resulting from the iron and steel industry, and
fly ashes from incineration or pyrolysis of waste.
Figure 10 below shows an example of how information is reported in the Excel file:
Figure 10: Extract from the Excel sheet which reports results for SC4
4.1.5. SC5: Potential presence of hazardous substances
Appendix B “Wastes and Potential Hazards for Absolute and Mirror Entries in the European
Waste Catalogue” of the UK EA report “Hazardous Waste: Interpretation of the definition
Waste code Waste descriptionQuantity (t) or
qualitative indication
Percentage of
wasteSource Score
04 02 19* sludges from on-site effluent treatment
containing hazardous substances
04 02 20 sludges from on-site effluent treatment other
than those mentioned in 04 02 19 104,80 0,000584007
[34) 2
06 03 15* metallic oxides containing heavy metals
06 03 16 metallic oxides other than those mentioned in
06 03 15
06 05 02* sludges from on-site effluent treatment
containing hazardous substances 990,59 0,005520145
[34) 2
06 05 03 sludges from on-site effluent treatment other
than those mentioned in 06 05 02 153958,600,85794706
[34) 3
07 01 11* sludges from on-site effluent treatment
containing hazardous substances 20,640,000115018
[34) 1
07 01 12 sludges from on-site effluent treatment other
than those mentioned in 07 01 11 158,300,00088214
[34) 2
Tonnage in Finland
Waste code Waste description Info Source Score
19 01 11* bottom ash and slag containing hazardous
substances
Economically important
in IT Q-IT 1
19 01 12 bottom ash and slag other than those
mentioned in 19 01 11
Economically important
in IT Q-IT 1
10 02 07* solid wastes from gas treatment containing
hazardous substances
Second most exported
hazardous waste in the
EU (282 098 tonnes) [9] p.19 3
17 05 03* soil and stones containing hazardous
substances
First most exported
hazardous waste in the
EU (686 640 tonnes)
Economically important
in IT
[9] p.19
Q-IT 3
19 01 13* fly ash containing hazardous substances
Fifth most exported
hazardous waste in the
EU (207 736 tonnes)
Economically important
in IT
[9] p.19
Q-IT 3
03 01 04*
sawdust, shavings, cuttings, wood, particle
board and veneer containing hazardous
substances n/a
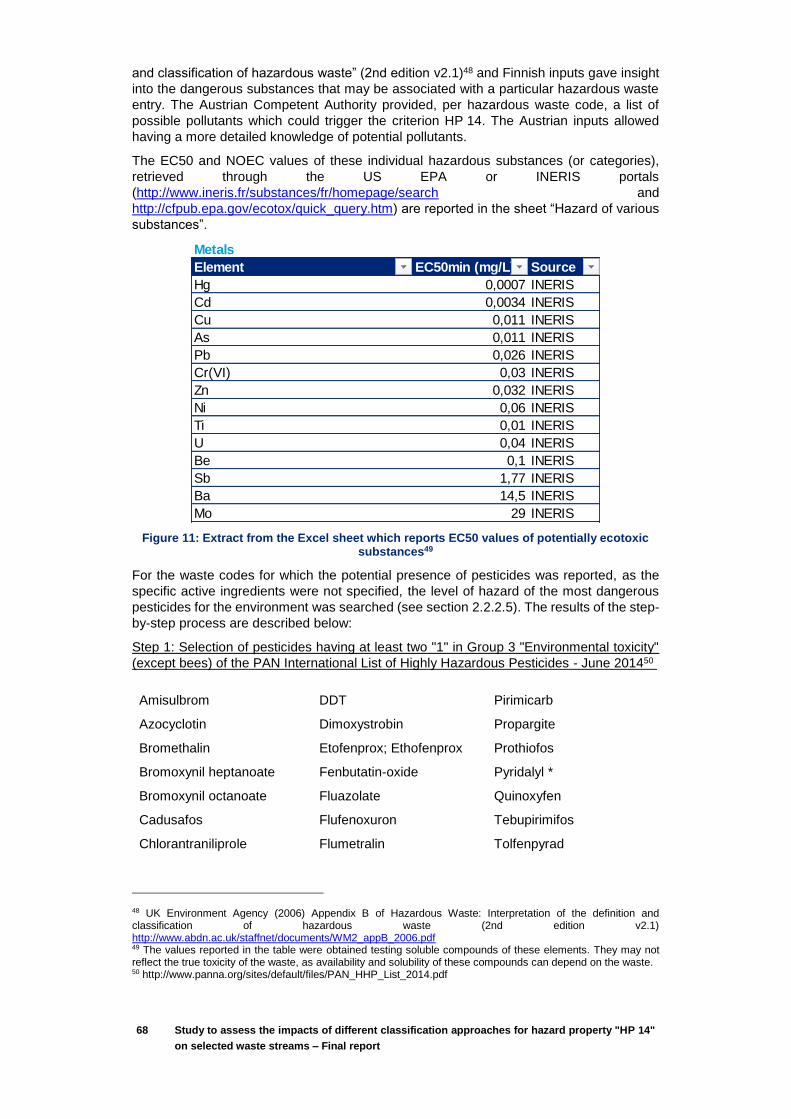
68 Study to assess the impacts of different classification approaches for hazard property "HP 14"
on selected waste streams – Final report
and classification of hazardous waste” (2nd edition v2.1)48 and Finnish inputs gave insight
into the dangerous substances that may be associated with a particular hazardous waste
entry. The Austrian Competent Authority provided, per hazardous waste code, a list of
possible pollutants which could trigger the criterion HP 14. The Austrian inputs allowed
having a more detailed knowledge of potential pollutants.
The EC50 and NOEC values of these individual hazardous substances (or categories),
retrieved through the US EPA or INERIS portals
(http://www.ineris.fr/substances/fr/homepage/search and
http://cfpub.epa.gov/ecotox/quick_query.htm) are reported in the sheet “Hazard of various
substances”.
Figure 11: Extract from the Excel sheet which reports EC50 values of potentially ecotoxic substances49
For the waste codes for which the potential presence of pesticides was reported, as the
specific active ingredients were not specified, the level of hazard of the most dangerous
pesticides for the environment was searched (see section 2.2.2.5). The results of the step-
by-step process are described below:
Step 1: Selection of pesticides having at least two "1" in Group 3 "Environmental toxicity"
(except bees) of the PAN International List of Highly Hazardous Pesticides - June 201450
48 UK Environment Agency (2006) Appendix B of Hazardous Waste: Interpretation of the definition and classification of hazardous waste (2nd edition v2.1) http://www.abdn.ac.uk/staffnet/documents/WM2_appB_2006.pdf 49 The values reported in the table were obtained testing soluble compounds of these elements. They may not reflect the true toxicity of the waste, as availability and solubility of these compounds can depend on the waste. 50 http://www.panna.org/sites/default/files/PAN_HHP_List_2014.pdf
Metals
Element EC50min (mg/L) Source
Hg 0,0007 INERIS
Cd 0,0034 INERIS
Cu 0,011 INERIS
As 0,011 INERIS
Pb 0,026 INERIS
Cr(VI) 0,03 INERIS
Zn 0,032 INERIS
Ni 0,06 INERIS
Ti 0,01 INERIS
U 0,04 INERIS
Be 0,1 INERIS
Sb 1,77 INERIS
Ba 14,5 INERIS
Mo 29 INERIS
PbO2 0,01 INERIS
Amisulbrom
Azocyclotin
Bromethalin
Bromoxynil heptanoate
Bromoxynil octanoate
Cadusafos
Chlorantraniliprole
DDT
Dimoxystrobin
Etofenprox; Ethofenprox
Fenbutatin-oxide
Fluazolate
Flufenoxuron
Flumetralin
Pirimicarb
Propargite
Prothiofos
Pyridalyl *
Quinoxyfen
Tebupirimifos
Tolfenpyrad
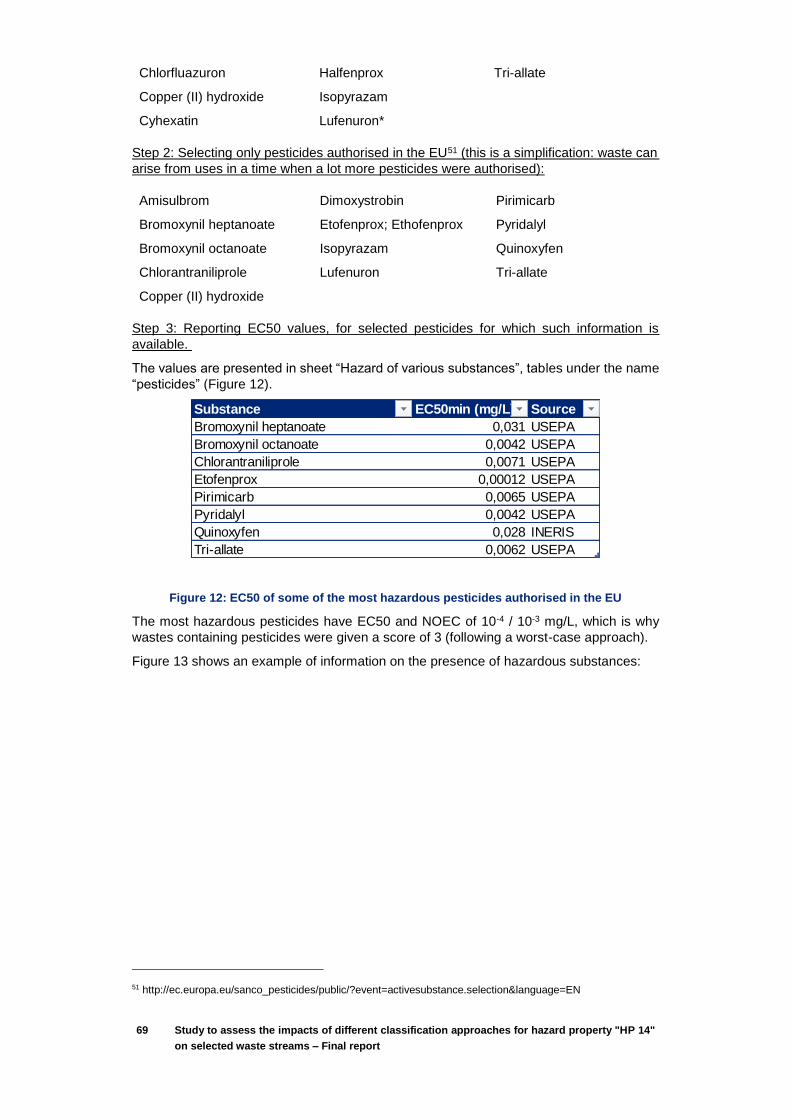
69 Study to assess the impacts of different classification approaches for hazard property "HP 14"
on selected waste streams – Final report
Step 2: Selecting only pesticides authorised in the EU51 (this is a simplification: waste can
arise from uses in a time when a lot more pesticides were authorised):
Step 3: Reporting EC50 values, for selected pesticides for which such information is
available.
The values are presented in sheet “Hazard of various substances”, tables under the name
“pesticides” (Figure 12).
Figure 12: EC50 of some of the most hazardous pesticides authorised in the EU
The most hazardous pesticides have EC50 and NOEC of 10-4 / 10-3 mg/L, which is why
wastes containing pesticides were given a score of 3 (following a worst-case approach).
Figure 13 shows an example of information on the presence of hazardous substances:
51 http://ec.europa.eu/sanco_pesticides/public/?event=activesubstance.selection&language=EN
Substance EC50min (mg/L) Source
Bromoxynil heptanoate 0,031 USEPA
Bromoxynil octanoate 0,0042 USEPA
Chlorantraniliprole 0,0071 USEPA
Etofenprox 0,00012 USEPA
Pirimicarb 0,0065 USEPA
Pyridalyl 0,0042 USEPA
Quinoxyfen 0,028 INERIS
Tri-allate 0,0062 USEPA
Chlorfluazuron
Copper (II) hydroxide
Cyhexatin
Halfenprox
Isopyrazam
Lufenuron*
Tri-allate
Amisulbrom
Bromoxynil heptanoate
Bromoxynil octanoate
Chlorantraniliprole
Copper (II) hydroxide
Dimoxystrobin
Etofenprox; Ethofenprox
Isopyrazam
Lufenuron
Pirimicarb
Pyridalyl
Quinoxyfen
Tri-allate
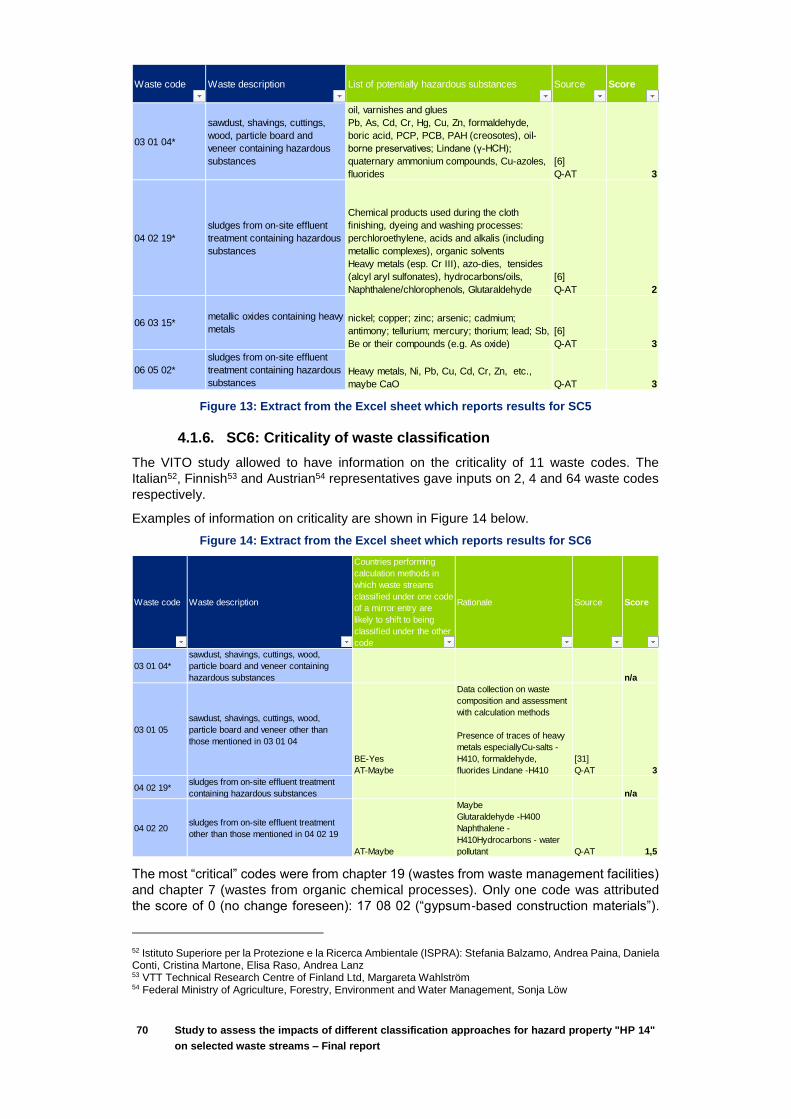
70 Study to assess the impacts of different classification approaches for hazard property "HP 14"
on selected waste streams – Final report
Figure 13: Extract from the Excel sheet which reports results for SC5
4.1.6. SC6: Criticality of waste classification
The VITO study allowed to have information on the criticality of 11 waste codes. The
Italian52, Finnish53 and Austrian54 representatives gave inputs on 2, 4 and 64 waste codes
respectively.
Examples of information on criticality are shown in Figure 14 below.
Figure 14: Extract from the Excel sheet which reports results for SC6
The most “critical” codes were from chapter 19 (wastes from waste management facilities)
and chapter 7 (wastes from organic chemical processes). Only one code was attributed
the score of 0 (no change foreseen): 17 08 02 (“gypsum-based construction materials”).
52 Istituto Superiore per la Protezione e la Ricerca Ambientale (ISPRA): Stefania Balzamo, Andrea Paina, Daniela Conti, Cristina Martone, Elisa Raso, Andrea Lanz 53 VTT Technical Research Centre of Finland Ltd, Margareta Wahlström 54 Federal Ministry of Agriculture, Forestry, Environment and Water Management, Sonja Löw
Waste code Waste description List of potentially hazardous substances Source Score
03 01 04*
sawdust, shavings, cuttings,
wood, particle board and
veneer containing hazardous
substances
oil, varnishes and glues
Pb, As, Cd, Cr, Hg, Cu, Zn, formaldehyde,
boric acid, PCP, PCB, PAH (creosotes), oil-
borne preservatives; Lindane (γ-HCH);
quaternary ammonium compounds, Cu-azoles,
fluorides
[6]
Q-AT 3
04 02 19*
sludges from on-site effluent
treatment containing hazardous
substances
Chemical products used during the cloth
finishing, dyeing and washing processes:
perchloroethylene, acids and alkalis (including
metallic complexes), organic solvents
Heavy metals (esp. Cr III), azo-dies, tensides
(alcyl aryl sulfonates), hydrocarbons/oils,
Naphthalene/chlorophenols, Glutaraldehyde
[6]
Q-AT 2
06 03 15* metallic oxides containing heavy
metals nickel; copper; zinc; arsenic; cadmium;
antimony; tellurium; mercury; thorium; lead; Sb,
Be or their compounds (e.g. As oxide)
[6]
Q-AT 3
06 05 02*
sludges from on-site effluent
treatment containing hazardous
substances
Heavy metals, Ni, Pb, Cu, Cd, Cr, Zn, etc.,
maybe CaO Q-AT 3
Waste code Waste description
Countries performing
calculation methods in
which waste streams
classified under one code
of a mirror entry are
likely to shift to being
classified under the other
code
Rationale Source Score
03 01 04*
sawdust, shavings, cuttings, wood,
particle board and veneer containing
hazardous substances n/a
03 01 05
sawdust, shavings, cuttings, wood,
particle board and veneer other than
those mentioned in 03 01 04
BE-Yes
AT-Maybe
Data collection on waste
composition and assessment
with calculation methods
Presence of traces of heavy
metals especiallyCu-salts -
H410, formaldehyde,
fluorides Lindane -H410
[31]
Q-AT 3
04 02 19* sludges from on-site effluent treatment
containing hazardous substances n/a
04 02 20 sludges from on-site effluent treatment
other than those mentioned in 04 02 19
AT-Maybe
Maybe
Glutaraldehyde -H400
Naphthalene -
H410Hydrocarbons - water
pollutant Q-AT 1,5
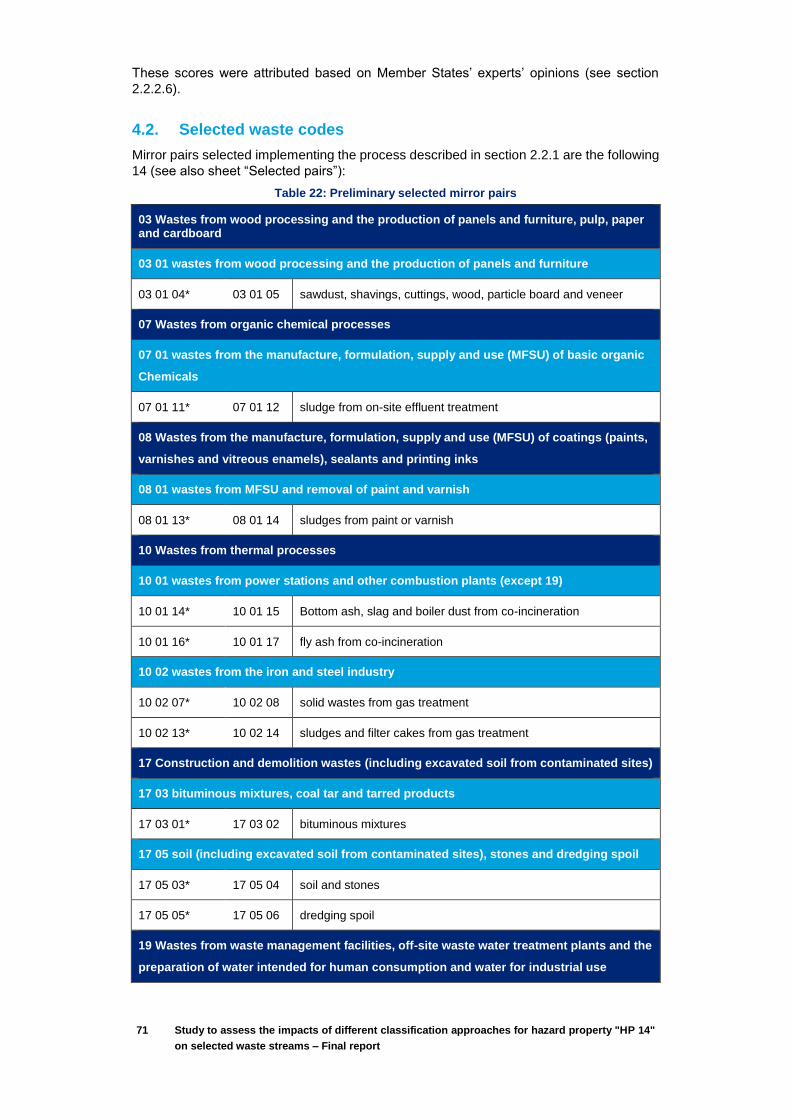
71 Study to assess the impacts of different classification approaches for hazard property "HP 14"
on selected waste streams – Final report
These scores were attributed based on Member States’ experts’ opinions (see section
2.2.2.6).
4.2. Selected waste codes
Mirror pairs selected implementing the process described in section 2.2.1 are the following
14 (see also sheet “Selected pairs”):
Table 22: Preliminary selected mirror pairs
03 Wastes from wood processing and the production of panels and furniture, pulp, paper and cardboard
03 01 wastes from wood processing and the production of panels and furniture
03 01 04* 03 01 05 sawdust, shavings, cuttings, wood, particle board and veneer
07 Wastes from organic chemical processes
07 01 wastes from the manufacture, formulation, supply and use (MFSU) of basic organic
Chemicals
07 01 11* 07 01 12 sludge from on-site effluent treatment
08 Wastes from the manufacture, formulation, supply and use (MFSU) of coatings (paints,
varnishes and vitreous enamels), sealants and printing inks
08 01 wastes from MFSU and removal of paint and varnish
08 01 13* 08 01 14 sludges from paint or varnish
10 Wastes from thermal processes
10 01 wastes from power stations and other combustion plants (except 19)
10 01 14* 10 01 15 Bottom ash, slag and boiler dust from co-incineration
10 01 16* 10 01 17 fly ash from co-incineration
10 02 wastes from the iron and steel industry
10 02 07* 10 02 08 solid wastes from gas treatment
10 02 13* 10 02 14 sludges and filter cakes from gas treatment
17 Construction and demolition wastes (including excavated soil from contaminated sites)
17 03 bituminous mixtures, coal tar and tarred products
17 03 01* 17 03 02 bituminous mixtures
17 05 soil (including excavated soil from contaminated sites), stones and dredging spoil
17 05 03* 17 05 04 soil and stones
17 05 05* 17 05 06 dredging spoil
19 Wastes from waste management facilities, off-site waste water treatment plants and the
preparation of water intended for human consumption and water for industrial use
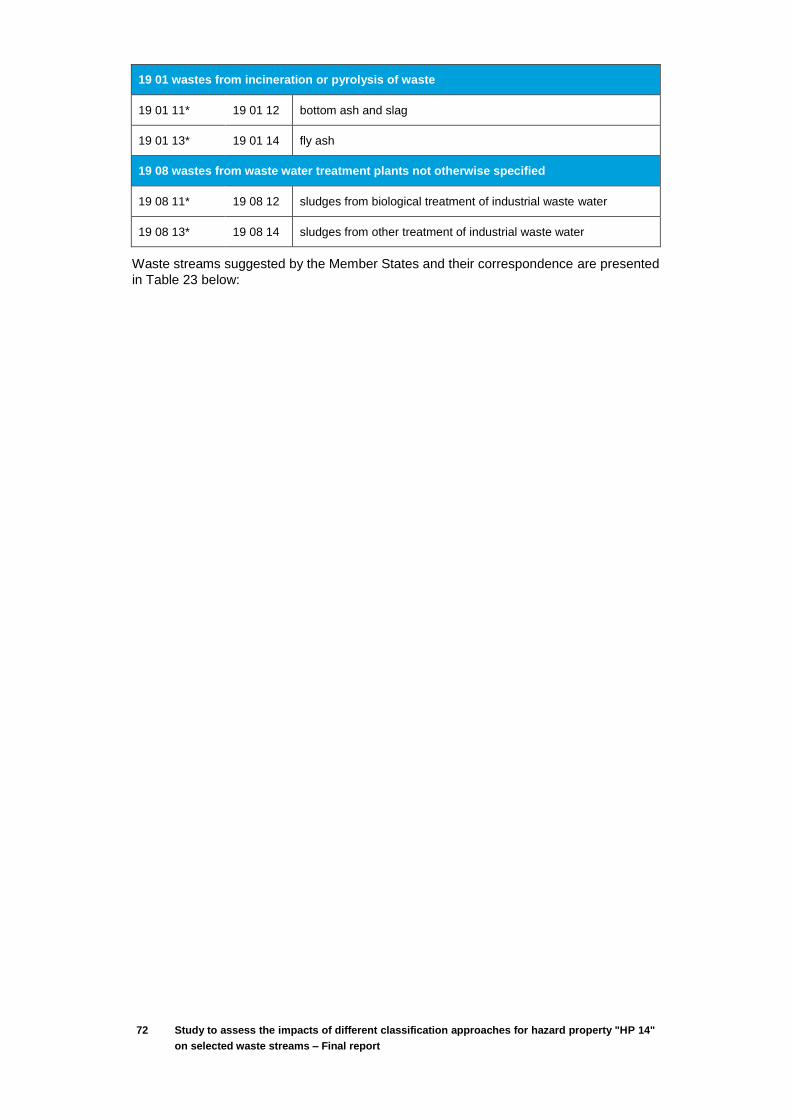
72 Study to assess the impacts of different classification approaches for hazard property "HP 14"
on selected waste streams – Final report
19 01 wastes from incineration or pyrolysis of waste
19 01 11* 19 01 12 bottom ash and slag
19 01 13* 19 01 14 fly ash
19 08 wastes from waste water treatment plants not otherwise specified
19 08 11* 19 08 12 sludges from biological treatment of industrial waste water
19 08 13* 19 08 14 sludges from other treatment of industrial waste water
Waste streams suggested by the Member States and their correspondence are presented
in Table 23 below:
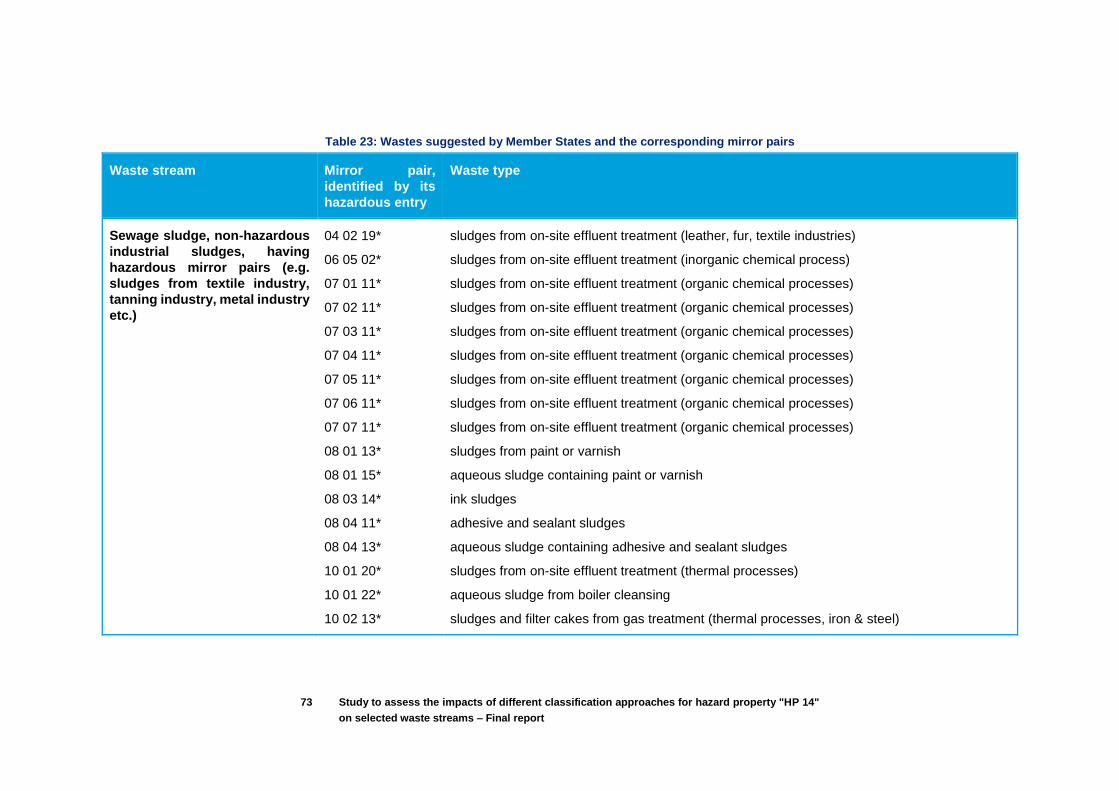
73 Study to assess the impacts of different classification approaches for hazard property "HP 14"
on selected waste streams – Final report
Table 23: Wastes suggested by Member States and the corresponding mirror pairs
Waste stream Mirror pair,
identified by its
hazardous entry
Waste type
Sewage sludge, non-hazardous
industrial sludges, having
hazardous mirror pairs (e.g.
sludges from textile industry,
tanning industry, metal industry
etc.)
04 02 19*
06 05 02*
07 01 11*
07 02 11*
07 03 11*
07 04 11*
07 05 11*
07 06 11*
07 07 11*
08 01 13*
08 01 15*
08 03 14*
08 04 11*
08 04 13*
10 01 20*
10 01 22*
10 02 13*
sludges from on-site effluent treatment (leather, fur, textile industries)
sludges from on-site effluent treatment (inorganic chemical process)
sludges from on-site effluent treatment (organic chemical processes)
sludges from on-site effluent treatment (organic chemical processes)
sludges from on-site effluent treatment (organic chemical processes)
sludges from on-site effluent treatment (organic chemical processes)
sludges from on-site effluent treatment (organic chemical processes)
sludges from on-site effluent treatment (organic chemical processes)
sludges from on-site effluent treatment (organic chemical processes)
sludges from paint or varnish
aqueous sludge containing paint or varnish
ink sludges
adhesive and sealant sludges
aqueous sludge containing adhesive and sealant sludges
sludges from on-site effluent treatment (thermal processes)
aqueous sludge from boiler cleansing
sludges and filter cakes from gas treatment (thermal processes, iron & steel)

74 Study to assess the impacts of different classification approaches for hazard property "HP 14"
on selected waste streams – Final report
Waste stream Mirror pair,
identified by its
hazardous entry
Waste type
Sewage sludge, non-hazardous
industrial sludges, having
hazardous mirror pairs,
continued
10 03 25*
10 08 17*
10 11 13*
10 11 17*
11 01 09*
11 02 02*
12 01 14*
19 08 11*
19 08 13*
sludges and filter cakes from gas treatment (thermal processes, aluminium)
sludges and filter cakes from flue-gas treatment (non-ferrous thermal)
glass-polishing and –grinding sludge
sludges and filter cakes from gas treatment (glass manufacture)
sludges and filter cakes (chemical surface treatement)
sludges from zinc hydrometallurgy
machining sludges
sludges from biological treatment of industrial waste water
sludges from other treatment of industrial waste water
Wastes from gas cleaning (filter
dusts from metal industries,
where there are mirror pairs)
10 01 18*
10 03 19*
10 05 03*
10 06 03*
10 08 15*
10 08 17*
10 09 09*
10 10 09*
10 11 17*
wastes from gas cleaning (thermal processes)
flue-gas dust (thermal processes, aluminium)
flue-gas dust (thermal processes, zinc)
flue-gas dust (thermal processes, copper)
flue-gas dust (non-ferrous thermal)
sludges and filter cakes from flue-gas treatment (non-ferrous thermal)
flue-gas dust (casting of ferrous pieces)
flue-gas dust (casting of non-ferrous pieces)
sludges and filter cakes from flue-gas treatment (glass manufacture)
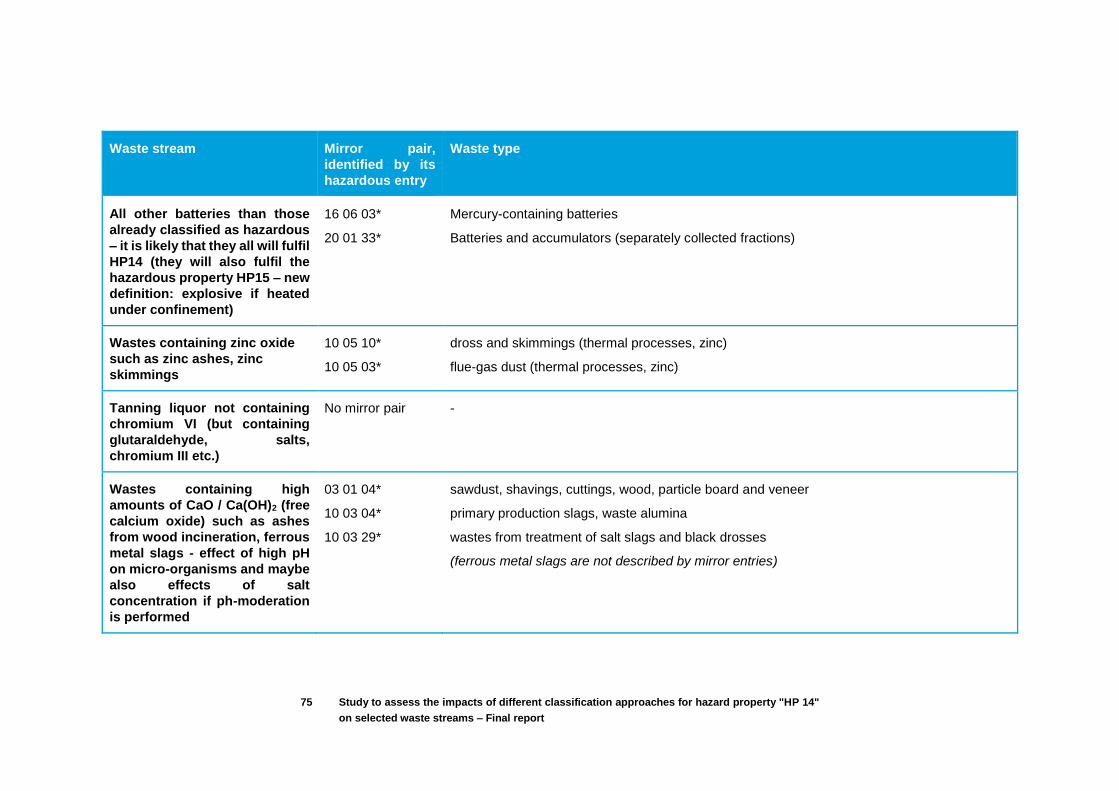
75 Study to assess the impacts of different classification approaches for hazard property "HP 14"
on selected waste streams – Final report
Waste stream Mirror pair,
identified by its
hazardous entry
Waste type
All other batteries than those
already classified as hazardous
– it is likely that they all will fulfil
HP14 (they will also fulfil the
hazardous property HP15 – new
definition: explosive if heated
under confinement)
16 06 03*
20 01 33*
Mercury-containing batteries
Batteries and accumulators (separately collected fractions)
Wastes containing zinc oxide
such as zinc ashes, zinc
skimmings
10 05 10*
10 05 03*
dross and skimmings (thermal processes, zinc)
flue-gas dust (thermal processes, zinc)
Tanning liquor not containing
chromium VI (but containing
glutaraldehyde, salts,
chromium III etc.)
No mirror pair -
Wastes containing high
amounts of CaO / Ca(OH)2 (free
calcium oxide) such as ashes
from wood incineration, ferrous
metal slags - effect of high pH
on micro-organisms and maybe
also effects of salt
concentration if ph-moderation
is performed
03 01 04*
10 03 04*
10 03 29*
sawdust, shavings, cuttings, wood, particle board and veneer
primary production slags, waste alumina
wastes from treatment of salt slags and black drosses
(ferrous metal slags are not described by mirror entries)
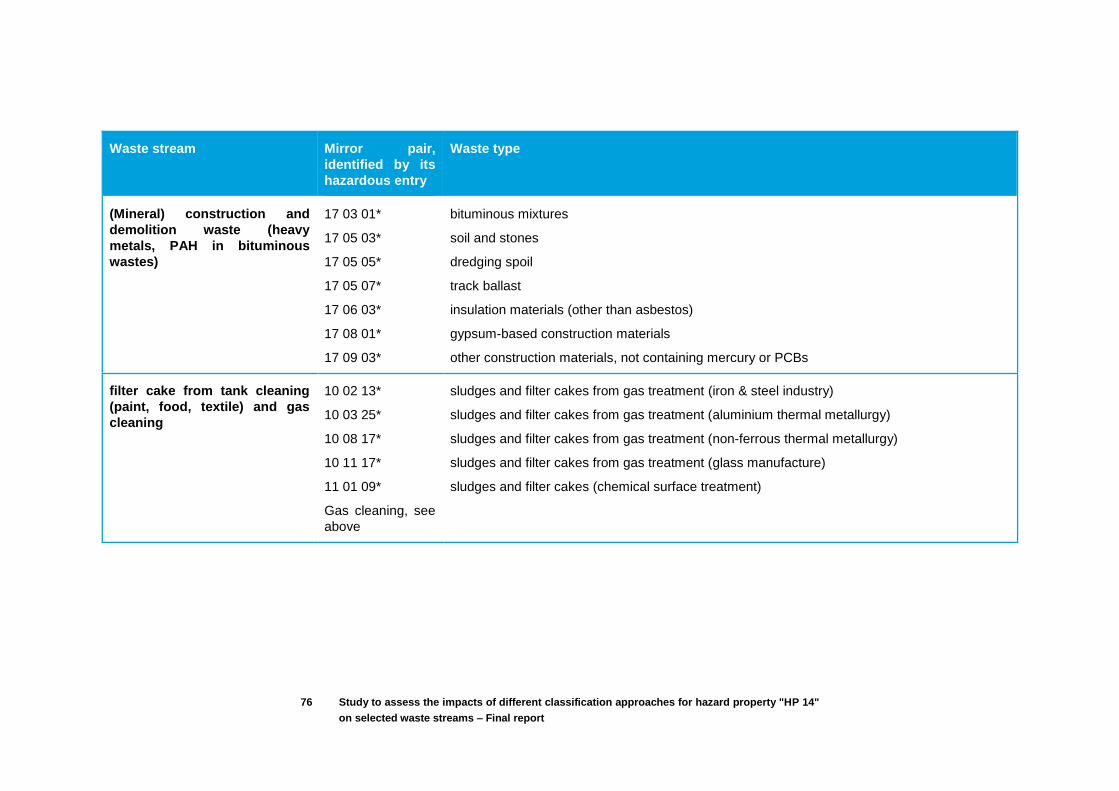
76 Study to assess the impacts of different classification approaches for hazard property "HP 14"
on selected waste streams – Final report
Waste stream Mirror pair,
identified by its
hazardous entry
Waste type
(Mineral) construction and
demolition waste (heavy
metals, PAH in bituminous
wastes)
17 03 01*
17 05 03*
17 05 05*
17 05 07*
17 06 03*
17 08 01*
17 09 03*
bituminous mixtures
soil and stones
dredging spoil
track ballast
insulation materials (other than asbestos)
gypsum-based construction materials
other construction materials, not containing mercury or PCBs
filter cake from tank cleaning
(paint, food, textile) and gas
cleaning
10 02 13*
10 03 25*
10 08 17*
10 11 17*
11 01 09*
Gas cleaning, see
above
sludges and filter cakes from gas treatment (iron & steel industry)
sludges and filter cakes from gas treatment (aluminium thermal metallurgy)
sludges and filter cakes from gas treatment (non-ferrous thermal metallurgy)
sludges and filter cakes from gas treatment (glass manufacture)
sludges and filter cakes (chemical surface treatment)

77 Study to assess the impacts of different classification approaches for hazard property "HP 14"
on selected waste streams – Final report
Waste stream Mirror pair,
identified by its
hazardous entry
Waste type
sludge (sewage, domestic, Cu,
Co, food)
See above, and
additionally:
Municipal: 19 02
05*
Food: no mirror
entry with sludge
Sludges from physico/chemical treatment
Refuse derived fuel No mirror entry
Car shredder (fluff, light
fraction)
19 10 03* fluff-light fraction and dust (from shredding of metal containing wastes)
Soil and residues from soil
cleaning
17 05 03*
17 05 05*
17 05 07*
19 13 01*
19 13 03*
19 13 05*
soil and stones
dredging spoil
track ballast
solid wastes from soil remediation
sludges from soil remediation
sludges from groundwater remediation
fly ash (wood, sludge) 10 01 16*
19 01 13*
fly ash from co-incineration
fly ash (from incineration or pyrolysis of waste)
waste blasting material 12 01 16* waste blasting material

78 Study to assess the impacts of different classification approaches for hazard property "HP 14"
on selected waste streams – Final report
Waste stream Mirror pair,
identified by its
hazardous entry
Waste type
kettel ashes Not found in the
LoW
-
construction & demolition
waste (asphalt, with and wihout
tar, concrete, bitumen,
minerals)
See above -
Digestate No mirror pairs -
biodegradable (kitchen, garden)
waste
No mirror pairs -
sand (from C&D waste) No mirror pairs -
Most wastes, having hazardous
mirror pairs - General toxicity of
heavy metals : Hg > Ag > Cu >
Zn > Ni > Pb > Cd > As > Cr(III)
Not specific
enough for pairs to
be attributed
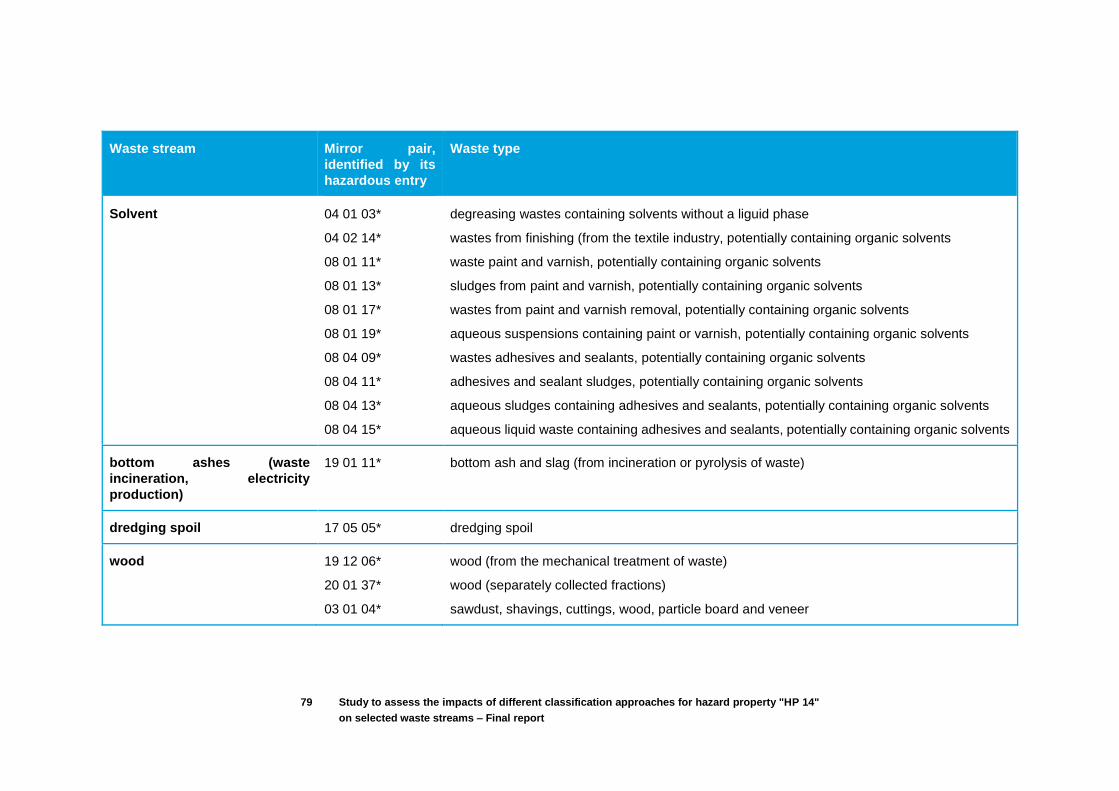
79 Study to assess the impacts of different classification approaches for hazard property "HP 14"
on selected waste streams – Final report
Waste stream Mirror pair,
identified by its
hazardous entry
Waste type
Solvent 04 01 03*
04 02 14*
08 01 11*
08 01 13*
08 01 17*
08 01 19*
08 04 09*
08 04 11*
08 04 13*
08 04 15*
degreasing wastes containing solvents without a liguid phase
wastes from finishing (from the textile industry, potentially containing organic solvents
waste paint and varnish, potentially containing organic solvents
sludges from paint and varnish, potentially containing organic solvents
wastes from paint and varnish removal, potentially containing organic solvents
aqueous suspensions containing paint or varnish, potentially containing organic solvents
wastes adhesives and sealants, potentially containing organic solvents
adhesives and sealant sludges, potentially containing organic solvents
aqueous sludges containing adhesives and sealants, potentially containing organic solvents
aqueous liquid waste containing adhesives and sealants, potentially containing organic solvents
bottom ashes (waste
incineration, electricity
production)
19 01 11* bottom ash and slag (from incineration or pyrolysis of waste)
dredging spoil 17 05 05* dredging spoil
wood 19 12 06*
20 01 37*
03 01 04*
wood (from the mechanical treatment of waste)
wood (separately collected fractions)
sawdust, shavings, cuttings, wood, particle board and veneer

80 Study to assess the impacts of different classification approaches for hazard property "HP 14"
on selected waste streams – Final report
Waste stream Mirror pair,
identified by its
hazardous entry
Waste type
Metal-containing wastes such
as metal treatment sludges and
incinerator bottom ashes (from
a variety of incinerators)
See above -

81 Study to assess the impacts of different classification approaches for hazard property "HP 14"
on selected waste streams – Final report
The list of Member States-suggested mirror pairs which are in the original list of the
Commission, and different from the 14 pairs selected earlier, are presented in Table 24.
The second column shows which pairs belong to the three main categories proposed by
the Member States: gas cleaning, sludge and C&D waste.
Table 24: Pre-selected pairs which are in the original list of the Commission, and different from the 14 pairs selected earlier
Mirror pair, identified by its hazardous entry
Waste type Gas cleaning, sludge or C&D waste? (x=yes)
04 02 19* sludges from on-site effluent treatment (leather, fur, textile industries)
x
06 05 02* sludges from on-site effluent treatment (inorganic chemical process)
x
07 02 11* sludges from on-site effluent treatment (organic chemical processes)
x
07 03 11* sludges from on-site effluent treatment (organic chemical processes)
x
07 05 11* sludges from on-site effluent treatment (organic chemical processes)
x
07 06 11* sludges from on-site effluent treatment (organic chemical processes)
x
08 03 14* ink sludges x
08 04 11* adhesive and sealant sludges x
10 01 18* wastes from gas cleaning (thermal processes) x
10 03 19* flue-gas dust (thermal processes, aluminium) x
10 03 25* sludges and filter cakes from gas treatment (thermal processes, aluminium)
x
10 03 29* wastes from treatment of salt slags and black drosses
10 05 10* dross and skimmings (thermal processes, zinc)
10 08 15* flue-gas dust (non-ferrous thermal) x
10 08 17* sludges and filter cakes from flue-gas treatment (non-ferrous thermal)
x
10 10 09* flue-gas dust (casting of non-ferrous pieces) x
11 01 09* sludges and filter cakes (chemical surface treatement)
x
12 01 14* machining sludges x
12 01 16* waste blasting material
17 06 03* insulation materials (other than asbestos) x
17 08 01* gypsum-based construction materials x
19 10 03* fluff-light fraction and dust (from shredding of metal containing wastes)
19 13 01* solid wastes from soil remediation
As described in section 2.2.4, only pairs in which both entries have a score above 1 make
the final cut (Table 25).
Table 25: Final selection of Member States-suggested waste streams
Mirror pair, identified by its hazardous entry
Score of hazardous entry
Score of non-hazardous entry
Final selection
04 02 19* 0,97 1,19
06 05 02* 1,35 1,30 X

82 Study to assess the impacts of different classification approaches for hazard property "HP 14"
on selected waste streams – Final report
Mirror pair, identified by its hazardous entry
Score of hazardous entry
Score of non-hazardous entry
Final selection
07 02 11* 0,78 1,19
07 03 11* 0,75 1,14
07 05 11* 0,87 1,23
07 06 11* 0,70 1,14
08 03 14* 0,86 0,74
08 04 11* 0,73 0,74
10 01 18* 0,93 0,86
10 03 19* 1,28 1,47 X
10 03 25* 0,74 1,03
10 08 15* 0,85 0,78
10 08 17* 0,92 1,03
10 10 09* 0,78 0,70
11 01 09* 1,36 1,21 X
12 01 14* 1,31 1,19 X
17 06 03* 1,31 1,25 X
17 08 01* 0,93 0,97
The 10 selected codes are completed with the following entries proposed by the
Commission:
The pair 19 10 03* / 19 10 04
The pair 19 12 11* / 19 12 12
The triplet 15 01 10* / 15 01 01 / 15 01 02
Therefore, the final list of selected codes is the following (45 codes):
Table 26: Final list of selected codes
03 Wastes from wood processing and the production of panels and furniture, pulp, paper and cardboard
03 01 wastes from wood processing and the production of panels and furniture
03 01 04* 03 01 05 sawdust, shavings, cuttings, wood, particle board and veneer
06 Wastes from inorganic chemical processes
06 05 sludges from on-site effluent treatment
06 05 02* 06 05 03 sludges from on-site effluent treatment
07 Wastes from organic chemical processes
07 01 wastes from the manufacture, formulation, supply and use (MFSU) of basic organic
Chemicals
07 01 11* 07 01 12 sludge from on-site effluent treatment
08 Wastes from the manufacture, formulation, supply and use (MFSU) of coatings (paints,
varnishes and vitreous enamels), sealants and printing inks
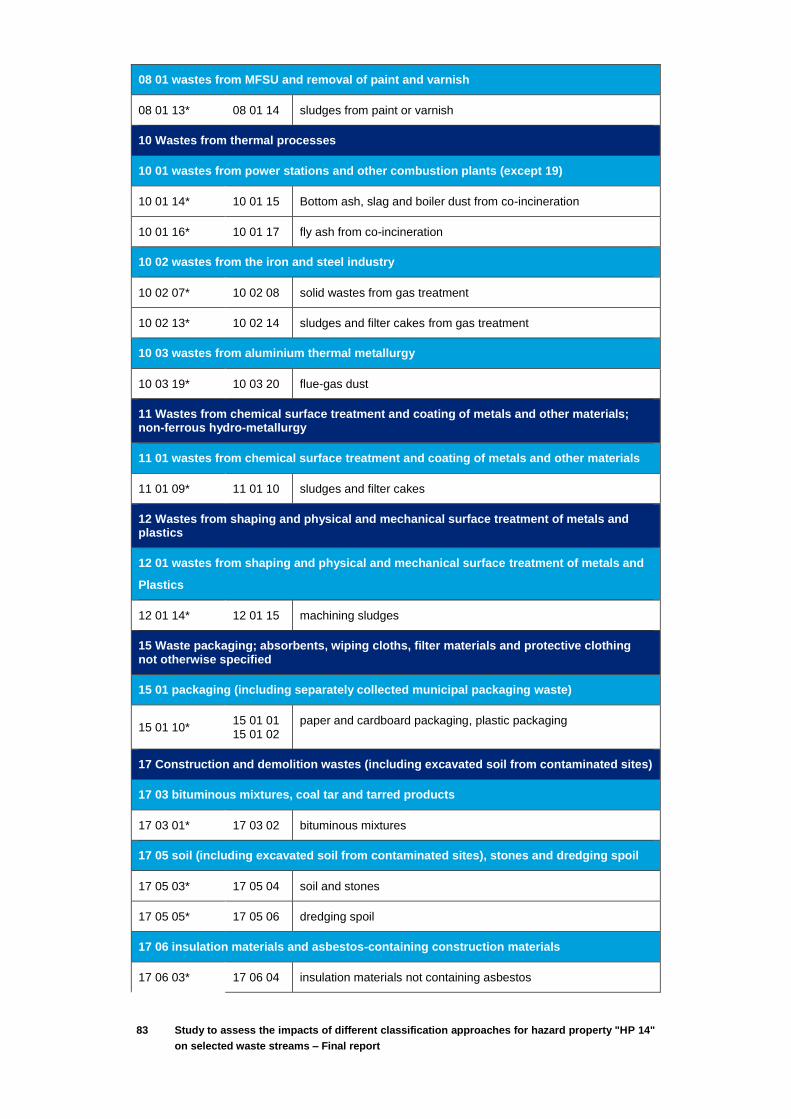
83 Study to assess the impacts of different classification approaches for hazard property "HP 14"
on selected waste streams – Final report
08 01 wastes from MFSU and removal of paint and varnish
08 01 13* 08 01 14 sludges from paint or varnish
10 Wastes from thermal processes
10 01 wastes from power stations and other combustion plants (except 19)
10 01 14* 10 01 15 Bottom ash, slag and boiler dust from co-incineration
10 01 16* 10 01 17 fly ash from co-incineration
10 02 wastes from the iron and steel industry
10 02 07* 10 02 08 solid wastes from gas treatment
10 02 13* 10 02 14 sludges and filter cakes from gas treatment
10 03 wastes from aluminium thermal metallurgy
10 03 19* 10 03 20 flue-gas dust
11 Wastes from chemical surface treatment and coating of metals and other materials; non-ferrous hydro-metallurgy
11 01 wastes from chemical surface treatment and coating of metals and other materials
11 01 09* 11 01 10 sludges and filter cakes
12 Wastes from shaping and physical and mechanical surface treatment of metals and plastics
12 01 wastes from shaping and physical and mechanical surface treatment of metals and
Plastics
12 01 14* 12 01 15 machining sludges
15 Waste packaging; absorbents, wiping cloths, filter materials and protective clothing not otherwise specified
15 01 packaging (including separately collected municipal packaging waste)
15 01 10* 15 01 01 15 01 02
paper and cardboard packaging, plastic packaging
17 Construction and demolition wastes (including excavated soil from contaminated sites)
17 03 bituminous mixtures, coal tar and tarred products
17 03 01* 17 03 02 bituminous mixtures
17 05 soil (including excavated soil from contaminated sites), stones and dredging spoil
17 05 03* 17 05 04 soil and stones
17 05 05* 17 05 06 dredging spoil
17 06 insulation materials and asbestos-containing construction materials
17 06 03* 17 06 04 insulation materials not containing asbestos

84 Study to assess the impacts of different classification approaches for hazard property "HP 14"
on selected waste streams – Final report
19 Wastes from waste management facilities, off-site waste water treatment plants and the
preparation of water intended for human consumption and water for industrial use
19 01 wastes from incineration or pyrolysis of waste
19 01 11* 19 01 12 bottom ash and slag
19 01 13* 19 01 14 fly ash
19 08 wastes from waste water treatment plants not otherwise specified
19 08 11* 19 08 12 sludges from biological treatment of industrial waste water
19 08 13* 19 08 14 sludges from other treatment of industrial waste water
19 10 wastes from shredding of metal-containing wastes
19 10 03* 19 10 04 fluff-light fraction and dust
19 12 wastes from the mechanical treatment of waste (for example sorting, crushing,
compacting, pelletising) not otherwise specified
19 12 11* 19 12 12 other wastes (including mixtures of materials) from mechanical treatment of waste
It should be mentioned that construction and demolition wastes (Chapter 17) and entries
such as 19 08 11*/12 can be very complex to characterise, both chemically and via biotests,
due to their heterogeneity (and often rather massive form, for C&D waste). High variability
in any analytical data collected in following work (see sections 5 and 0), is to be expected.

85 Study to assess the impacts of different classification approaches for hazard property "HP 14"
on selected waste streams – Final report
5. Calculation methods: results
and comparative assessment
5.1. Presentation of the calculation methods
5.1.1. Introduction to the calculation methods
The Commission proposed four different calculation methods to determine the
classification of waste, based on the comparison of the concentration of hazardous
components with limit concentrations. If the concentration of the hazardous component
(individually or in summation with other hazardous components) exceeds the concentration
limit, the waste has to be classified as hazardous for the H14 criterion, if not, there is no
need for classification.
According to the CLP Regulation and its adaptations to technical progress, the hazard
classes/categories and hazard statements considered for HP 14 assessment are
presented in Table 27.
Table 27: Hazard classes and statements considered for HP 14 assessment
Hazard Category Hazard statement
Acute (short-term)
aquatic hazard
Acute
Category 1 H400: Very toxic to aquatic life
Chronic (long term)
aquatic hazard
Chronic
Category 1
H410: Very toxic to aquatic life with
long lasting effects
Chronic
Category 2
H411: Toxic to aquatic life with long
lasting effects
Chronic
Category 3
H412: Harmful to aquatic life with
long lasting effects
Chronic
Category 4
H413: May cause long lasting harmful
effects to aquatic life
Hazardous to the
ozone layer
Ozone
Category 1
H420: Harms public health and the
environment by destroying ozone in
the upper atmosphere
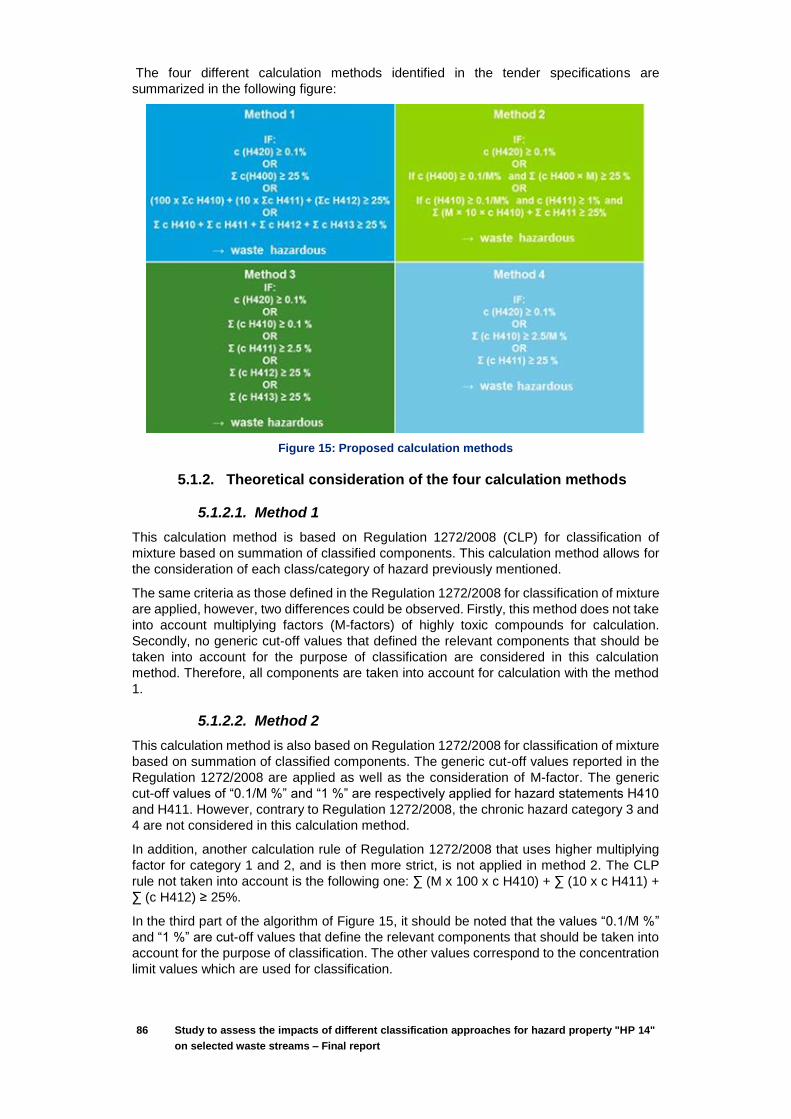
86 Study to assess the impacts of different classification approaches for hazard property "HP 14"
on selected waste streams – Final report
The four different calculation methods identified in the tender specifications are
summarized in the following figure:
Figure 15: Proposed calculation methods
5.1.2. Theoretical consideration of the four calculation methods
5.1.2.1. Method 1
This calculation method is based on Regulation 1272/2008 (CLP) for classification of
mixture based on summation of classified components. This calculation method allows for
the consideration of each class/category of hazard previously mentioned.
The same criteria as those defined in the Regulation 1272/2008 for classification of mixture
are applied, however, two differences could be observed. Firstly, this method does not take
into account multiplying factors (M-factors) of highly toxic compounds for calculation.
Secondly, no generic cut-off values that defined the relevant components that should be
taken into account for the purpose of classification are considered in this calculation
method. Therefore, all components are taken into account for calculation with the method
1.
5.1.2.2. Method 2
This calculation method is also based on Regulation 1272/2008 for classification of mixture
based on summation of classified components. The generic cut-off values reported in the
Regulation 1272/2008 are applied as well as the consideration of M-factor. The generic
cut-off values of “0.1/M %” and “1 %” are respectively applied for hazard statements H410
and H411. However, contrary to Regulation 1272/2008, the chronic hazard category 3 and
4 are not considered in this calculation method.
In addition, another calculation rule of Regulation 1272/2008 that uses higher multiplying
factor for category 1 and 2, and is then more strict, is not applied in method 2. The CLP
rule not taken into account is the following one: ∑ (M x 100 x c H410) + ∑ (10 x c H411) +
∑ (c H412) ≥ 25%.
In the third part of the algorithm of Figure 15, it should be noted that the values “0.1/M %”
and “1 %” are cut-off values that define the relevant components that should be taken into
account for the purpose of classification. The other values correspond to the concentration
limit values which are used for classification.
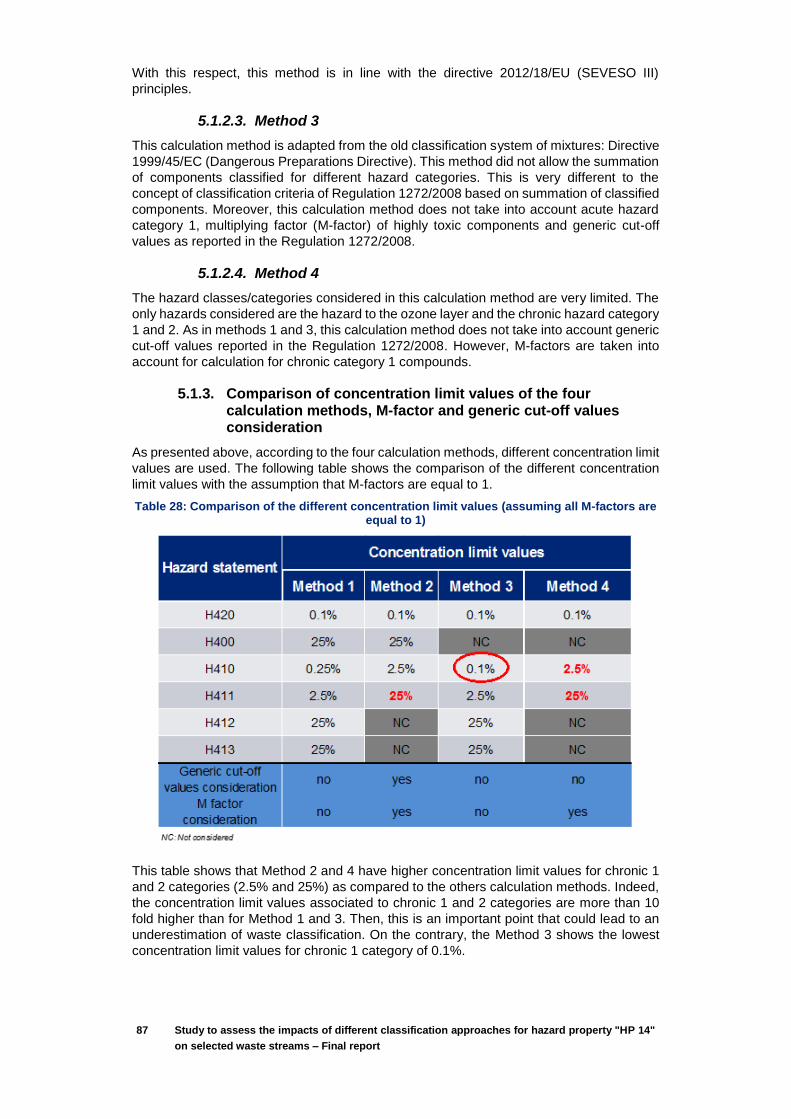
87 Study to assess the impacts of different classification approaches for hazard property "HP 14"
on selected waste streams – Final report
With this respect, this method is in line with the directive 2012/18/EU (SEVESO III)
principles.
5.1.2.3. Method 3
This calculation method is adapted from the old classification system of mixtures: Directive
1999/45/EC (Dangerous Preparations Directive). This method did not allow the summation
of components classified for different hazard categories. This is very different to the
concept of classification criteria of Regulation 1272/2008 based on summation of classified
components. Moreover, this calculation method does not take into account acute hazard
category 1, multiplying factor (M-factor) of highly toxic components and generic cut-off
values as reported in the Regulation 1272/2008.
5.1.2.4. Method 4
The hazard classes/categories considered in this calculation method are very limited. The
only hazards considered are the hazard to the ozone layer and the chronic hazard category
1 and 2. As in methods 1 and 3, this calculation method does not take into account generic
cut-off values reported in the Regulation 1272/2008. However, M-factors are taken into
account for calculation for chronic category 1 compounds.
5.1.3. Comparison of concentration limit values of the four calculation methods, M-factor and generic cut-off values consideration
As presented above, according to the four calculation methods, different concentration limit
values are used. The following table shows the comparison of the different concentration
limit values with the assumption that M-factors are equal to 1.
Table 28: Comparison of the different concentration limit values (assuming all M-factors are equal to 1)
This table shows that Method 2 and 4 have higher concentration limit values for chronic 1
and 2 categories (2.5% and 25%) as compared to the others calculation methods. Indeed,
the concentration limit values associated to chronic 1 and 2 categories are more than 10
fold higher than for Method 1 and 3. Then, this is an important point that could lead to an
underestimation of waste classification. On the contrary, the Method 3 shows the lowest
concentration limit values for chronic 1 category of 0.1%.

88 Study to assess the impacts of different classification approaches for hazard property "HP 14"
on selected waste streams – Final report
Based on this observation, if M-factor is equal to 1, Methods 1 and 3 seem to be the
methods leading to the most severe classification whereas Methods 2 and 4 are less
conservative.
5.2. Data collected on the selected waste codes
5.2.1. Overview
Data was collected from 21 documents from survey or provided by Member States and 42
bibliographic sources identified by the project team. The following countries have provided
data: Belgium, Denmark, Finland, France, Germany, Italy, Sweden and the United
Kingdom. The list of all sources identified and the associated mirror pair are presented in
Annex 5.
The following table shows the number of samples for each mirror entry and available data
(characterisation data, biotests, or both of them).
Table 29: Amount of data collected per mirror pair
As shown in Table 29, data was available for 15 of the 22 selected mirror pairs. The most
represented entries are soil and stones (17 05 03* / 17 05 04), bottom ash and slag (19 01
11* / 19 01 12), fly ash (19 01 13* / 19 01 14) and fluff-light fraction and dust (19 10 03* /
19 10 04): they represent 83% of available data.
A total of 169 samples were collected for mirror pairs of interest. Among this data, 29% of
samples contain both characterisation data and results of biotests; these samples are the
most useful for comparing the four calculation methods. 60% of samples contain only
characterisation data and 11% only biotest results. For the latter, the calculation methods
could then not be applied and therefore, these data are not considered in this project.
Thus, the assessment of H14 by the 4 calculation methods has been carried out on
149 samples.
Among sources identified, several data could not be taken into account because the waste
code was not mentioned. However, in some cases, it has been possible to identify the most

89 Study to assess the impacts of different classification approaches for hazard property "HP 14"
on selected waste streams – Final report
probable waste code according to waste characteristic and origin (these sources are
underlined in yellow in tables given in Annex 5).
5.2.1. Chemical analyses
Chemical analyses were available for 149 different samples. The characterisation data
were obtained for solid matrices, except for some samples for which both solid matrices
and leachates are considered.
In almost every case, characterisation data only report concentrations of inorganic
compounds, mostly as elements in mg/kg of waste: neither chemical speciation nor specific
compounds or salts are identified. In most cases, no information on organic compounds
was available. As a result the mass balance of the sample composition is often incomplete,
with a significant fraction of the waste not identified. For 80% of the samples, the unknown
fraction is greater than 85%.
All these shortcomings could lead to a potential underestimation of the waste classification.
This will be discussed thereafter in the section dedicated to the limitations.
It should also be highlighted that current hazard classifications (baseline) for each waste
sample were not always mentioned in the source of data. This will be discussed thereafter
and could be a limitation for calculation methods comparison, and also impact assessment.
The protocols and methods followed for chemical analyses are reported in the Excel file for
data collection. This information was not always mentioned or only briefly described, which
did not allow for a consistent comparison.
5.2.2. Biotests
Biotest results were available for 66 samples. However, as discussed previously, only
samples which report both characterisation data and biotest results can be taken into
account. A total of 47 samples is therefore considered.
Ecotoxicological tests are usually performed on a set of selected species and according to
standardised protocols. The main tests performed on aquatic and terrestrial organisms and
the protocols associated are indicated in Table 30.
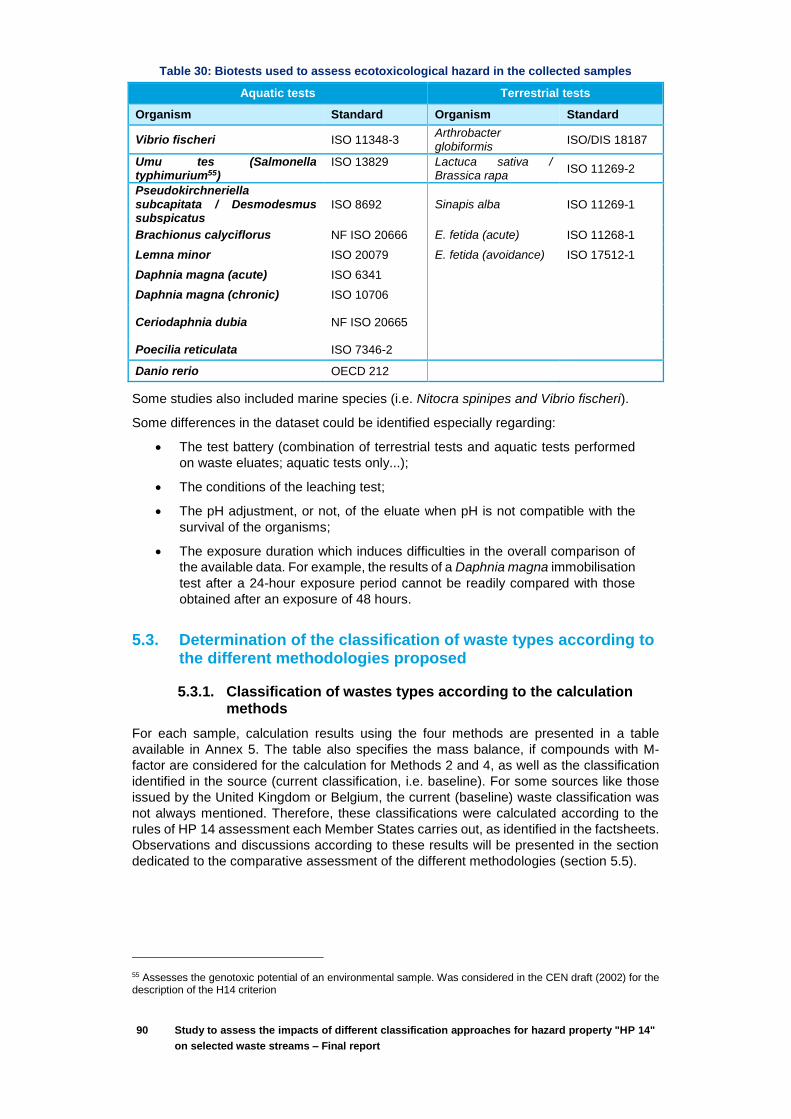
90 Study to assess the impacts of different classification approaches for hazard property "HP 14"
on selected waste streams – Final report
Table 30: Biotests used to assess ecotoxicological hazard in the collected samples
Aquatic tests Terrestrial tests
Organism Standard Organism Standard
Vibrio fischeri ISO 11348-3 Arthrobacter globiformis
ISO/DIS 18187
Umu tes (Salmonella typhimurium55)
ISO 13829 Lactuca sativa / Brassica rapa
ISO 11269-2
Pseudokirchneriella subcapitata / Desmodesmus subspicatus
ISO 8692 Sinapis alba ISO 11269-1
Brachionus calyciflorus NF ISO 20666 E. fetida (acute) ISO 11268-1
Lemna minor ISO 20079 E. fetida (avoidance) ISO 17512-1
Daphnia magna (acute) ISO 6341
Daphnia magna (chronic) ISO 10706
Ceriodaphnia dubia NF ISO 20665
Poecilia reticulata ISO 7346-2
Danio rerio OECD 212
Some studies also included marine species (i.e. Nitocra spinipes and Vibrio fischeri).
Some differences in the dataset could be identified especially regarding:
The test battery (combination of terrestrial tests and aquatic tests performed
on waste eluates; aquatic tests only...);
The conditions of the leaching test;
The pH adjustment, or not, of the eluate when pH is not compatible with the
survival of the organisms;
The exposure duration which induces difficulties in the overall comparison of
the available data. For example, the results of a Daphnia magna immobilisation
test after a 24-hour exposure period cannot be readily compared with those
obtained after an exposure of 48 hours.
5.3. Determination of the classification of waste types according to the different methodologies proposed
5.3.1. Classification of wastes types according to the calculation methods
For each sample, calculation results using the four methods are presented in a table
available in Annex 5. The table also specifies the mass balance, if compounds with M-
factor are considered for the calculation for Methods 2 and 4, as well as the classification
identified in the source (current classification, i.e. baseline). For some sources like those
issued by the United Kingdom or Belgium, the current (baseline) waste classification was
not always mentioned. Therefore, these classifications were calculated according to the
rules of HP 14 assessment each Member States carries out, as identified in the factsheets.
Observations and discussions according to these results will be presented in the section
dedicated to the comparative assessment of the different methodologies (section 5.5).
55 Assesses the genotoxic potential of an environmental sample. Was considered in the CEN draft (2002) for the description of the H14 criterion

91 Study to assess the impacts of different classification approaches for hazard property "HP 14"
on selected waste streams – Final report
5.3.2. Classification of wastes types based on ecotoxicological data
As presented in section 5.2.2, for almost 50 samples, both biotest results and
characterisation data are available, that will allows comparison between these two
approaches. A similar methodology (see below) was applied to classify waste according to
ecotoxicological test results:
The threshold values presented in Table 31 were used. These values reflect
unequivocal adverse effects on selected organisms and end-points. They have
partly been established from experience gained on wastes in France and
Germany47;
One positive result was considered to be sufficient to classify a waste; and
Regarding the leaching tests, only results with an L/S ratio of 10 were
considered.
Table 31: Harmonised approach for hazard assessment with biotests
Test Proposal of threshold values
Duration Standard
Inhibition of the mobility of Daphnia magna (Dap)
EC50 ≤ 10% 48 h ISO 6341
Inhibition of the light emission of Vibrio fischeri (Luminescent bacteria test) (Vib)
EC50 ≤ 10% 30 min ISO 11348-3
Fresh water algal growth inhibition test with unicellular green algae (Alg)
EC50 ≤ 10% 72 h ISO 8692
Solid contact test using the dehydrogenase activity of Arthrobacter globiformis (Art)
EC50 ≤ 10% 2 h ISO/DIS 18187
Effects on the emergence and early growth of higher plants (Avena sativa, Brassica napus) (Ave, Bra)
EC50 ≤ 10% 14 d ISO 11269-2
Avoidance test with earthworms (Eisenia andrei/fetida) (Ear)
EC50 ≤ 10% 48 h ISO 17512-1
For each sample, results according to the harmonised approach (Table 31) are presented
in the table in Annex 5. A waste is considered hazardous if the EC50 of at least one test is
greater than or equal to 10% (see above for details on the choice of this threshold. For
some samples, ecotoxicological data is incomplete or ambiguous and does not allow waste
classification. These samples were identified in the table in Annex 5 with the mention
“further information needed”. The samples for which no data is available were identified
with the mention “No Data (ND)”.
Observations and discussions on these results are presented in section 5.5.
5.4. Limitations
5.4.1. Limitations due to characterisation data available
The lack of availability of characterisation data from chemical analyses can lead to
underestimation or overestimation of the waste classification:
As characterisation data, most of the time, only reported concentrations of elemental
compounds (mainly metallic compounds) and specific compounds or salts were not
identified, a worst case selection was performed as described previously. This worst case
selection is based the most severe classification (and on the most relevant compounds).
Therefore, the worst-case approach can lead to an overestimation of the classification.
92 Study to assess the impacts of different classification approaches for hazard property "HP 14"
on selected waste streams – Final report
However, the molar mass of compounds was not considered in the worst-case approach,
and this could have an impact in the mass concentration percentage used for calculation
(see section 2.4.2), thus leading to an underestimation of waste classification.
Moreover, in most cases no information on organic compounds was available and a
significant fraction of the waste was not identified (for 80% of the sample, the unknown
fraction is greater than 85%). This means that hazardous compounds at potentially relevant
concentrations were left out of calculations. This would lead to an underestimation of the
waste classification.
5.4.2. Limitations of calculation methods
The applicability of the calculation methods is limited by the availability of harmonised
classifications. Regarding the worst case selection, all compounds were associated to a
harmonised classification. However, other specific compounds that could be analysed in
the waste could not have harmonised classification available and then could lead to a
potential underestimation of the waste classification.
Another limitation is linked to the availability of M-factors. Only 13% of the 1,232
compounds classified in category 1 for acute and chronic hazard are assigned an M-factor,
70% of which are pesticides – making their presence in waste unlikely. Therefore, only a
few relevant substances had available M-factors; thus calculation methods relying on M-
factors (namely methods 2 & 4) were unsuitable for determining HP 14. This point will be
further discussed thereafter during the comparative assessment of the different
methodologies.
The lack of available M-factors is mainly due to the fact that they were not determined
during the transposition to CLP regulation. Nevertheless, a few M-factors will be updated
progressively with the publication of new Adaptations to Technical Progress (ATP). In the
meantime, M-factoran alternative approach proposed by some Member States is to realise
a self-determination of M-factor from ecotoxicological data. This approach is very complex
because the selection of M-factor needs an assessment of the quality of the value/study
and could imply different expert judgments and also a harmonisation among the different
countries (which is done in harmonised classification). Moreover, the assessment and
validation of M-factors is done at European level. Therefore, only M-factors identified in
harmonised classification are considered. For the worst case compounds identified in the
table in Annex 5, only two compounds have an M-factor (cobalt oxide and sodium cyanide).
Lack of information regarding the current hazard classification (baseline) for each waste
sample is another limitation. It must be noted that results for different samples originate
from multiple sources, sometimes in different Member States, and where the baseline
classification may be different as a function of the different national methodologies applied
to determine the HP 14 classification. In almost 35% of the cases, the source did not
indicate what the current classifications for the samples were (and a fortiori not for property
HP 14). This is a limitation for comparing the methods because no baseline is available to
provide a reference.
5.4.3. Limitations related to ecotoxicological data available
A main limitation on the use of experimental data is the availability of biotest results. Indeed,
among all samples identified, only 40% of them include ecotoxicological data (29% include
both characterisation and ecotoxicological data and 11% include only ecotoxicological
data). Therefore, comparing classifications obtained with calculations and classifications
obtained with biotests can only be considered for 29% of samples (47 samples).
Moreover, comparison of results is further limited by, for some samples:
the heterogeneity of the test battery applied and the protocol of eluate
preparation; and

93 Study to assess the impacts of different classification approaches for hazard property "HP 14"
on selected waste streams – Final report
The incompleteness of some results: for 4 samples, essential parameters like
the units in which the toxicity values are expressed or exposure duration were
not reported.
These samples were therefore not considered for comparing results. The full comparison
is presented in section 5.5.2.
It should also be stressed that, although the limit threshold value for waste classification is
fixed at 10% in the proposed approach described above, there is currently no regulatory
acceptance in this regard. This could then be inducing a bias for the comparison of
calculation and experimental approaches, as presented in section 5.5.2. Indeed, a
sensitivity analysis would be necessary to determine how the concordance (or lack thereof)
between calculations and ecotoxicological results, shown in section 5.5.2, would be
impacted by different thresholds.
5.5. Comparative assessment of the different methodologies
5.5.1. Comparison of the four calculation methods
The different calculation methods are based on harmonised classification and worst case
selection as discussed above. However, calculation Methods 2 and 4, which consider M-
factors, seems to be inadequate for waste classification:
As presented in section 5.1.3, Methods 2 and 4 have higher concentration limit
values if M-factor is equal to 1 (which is the default value of M-factors when
they are not available), thus leading to an unforeseen underestimation of waste
ecotoxicity, compared to what it would have been, if the method could be
applied properly;
These two methods do not take into account chronic 3 and 4 compounds.
The comparison of each calculation methods with the current hazard classification for each
waste sample identified in the different sources is presented in the following tables (Table
32, Table 33 and Table 34). For each mirror entry and calculation method, the percentage
of samples having the same classification as the baseline is reported, as well as the
number of sources for which the current (baseline) hazard classification is available. The
percentage represent the concordance of results with current classifications. This is an
important element to take into account when considering new classification methods;
nevertheless it should be kept in mind that a change in classification can be necessary if
new scientific evidence suggests so.
The values highlighted in green represent, for each mirror entry, methods that lead to a
good prediction (percentage upper than 90%) of waste classification as compared to the
current classification. The methods that induce a percentage lower than 50% are
highlighted in red.
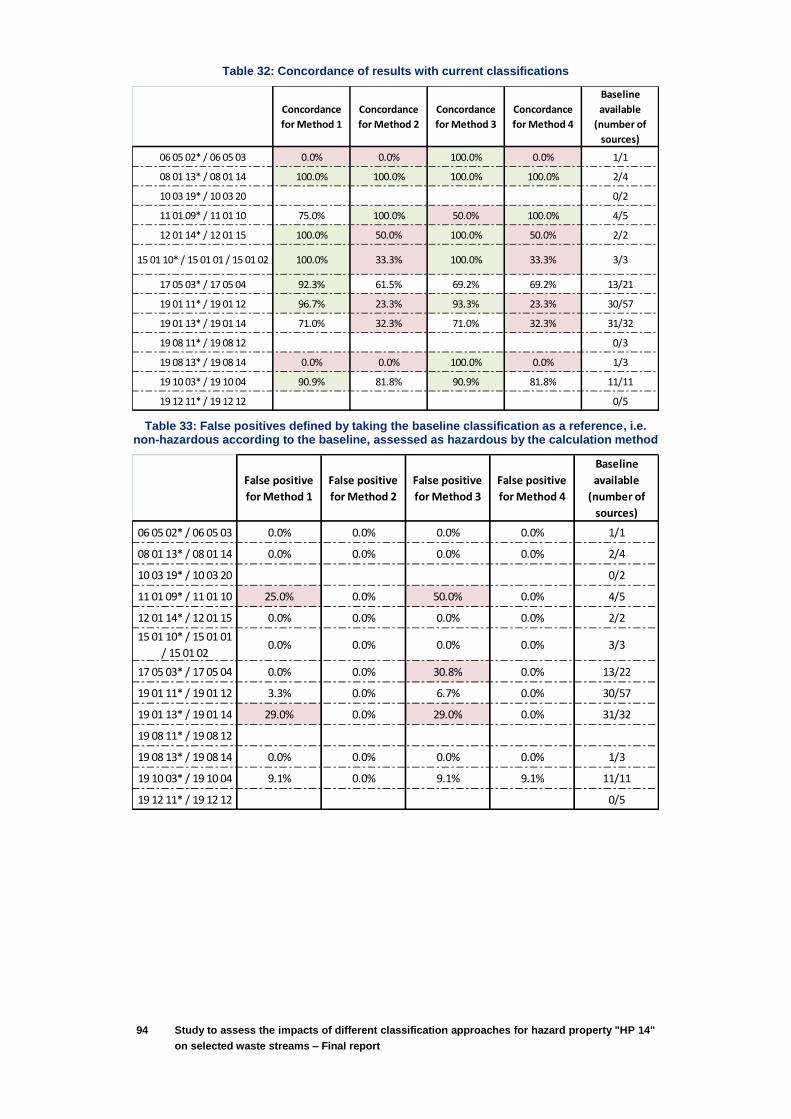
94 Study to assess the impacts of different classification approaches for hazard property "HP 14"
on selected waste streams – Final report
Table 32: Concordance of results with current classifications
Table 33: False positives defined by taking the baseline classification as a reference, i.e. non-hazardous according to the baseline, assessed as hazardous by the calculation method
Concordance
for Method 1
Concordance
for Method 2
Concordance
for Method 3
Concordance
for Method 4
Baseline
available
(number of
sources)
06 05 02* / 06 05 03 0.0% 0.0% 100.0% 0.0% 1/1
08 01 13* / 08 01 14 100.0% 100.0% 100.0% 100.0% 2/4
10 03 19* / 10 03 20 0/2
11 01 09* / 11 01 10 75.0% 100.0% 50.0% 100.0% 4/5
12 01 14* / 12 01 15 100.0% 50.0% 100.0% 50.0% 2/2
15 01 10* / 15 01 01 / 15 01 02 100.0% 33.3% 100.0% 33.3% 3/3
17 05 03* / 17 05 04 92.3% 61.5% 69.2% 69.2% 13/21
19 01 11* / 19 01 12 96.7% 23.3% 93.3% 23.3% 30/57
19 01 13* / 19 01 14 71.0% 32.3% 71.0% 32.3% 31/32
19 08 11* / 19 08 12 0/3
19 08 13* / 19 08 14 0.0% 0.0% 100.0% 0.0% 1/3
19 10 03* / 19 10 04 90.9% 81.8% 90.9% 81.8% 11/11
19 12 11* / 19 12 12 0/5
False positive
for Method 1
False positive
for Method 2
False positive
for Method 3
False positive
for Method 4
Baseline
available
(number of
sources)
06 05 02* / 06 05 03 0.0% 0.0% 0.0% 0.0% 1/1
08 01 13* / 08 01 14 0.0% 0.0% 0.0% 0.0% 2/4
10 03 19* / 10 03 20 0/2
11 01 09* / 11 01 10 25.0% 0.0% 50.0% 0.0% 4/5
12 01 14* / 12 01 15 0.0% 0.0% 0.0% 0.0% 2/2
15 01 10* / 15 01 01
/ 15 01 020.0% 0.0% 0.0% 0.0% 3/3
17 05 03* / 17 05 04 0.0% 0.0% 30.8% 0.0% 13/22
19 01 11* / 19 01 12 3.3% 0.0% 6.7% 0.0% 30/57
19 01 13* / 19 01 14 29.0% 0.0% 29.0% 0.0% 31/32
19 08 11* / 19 08 12
19 08 13* / 19 08 14 0.0% 0.0% 0.0% 0.0% 1/3
19 10 03* / 19 10 04 9.1% 0.0% 9.1% 9.1% 11/11
19 12 11* / 19 12 12 0/5
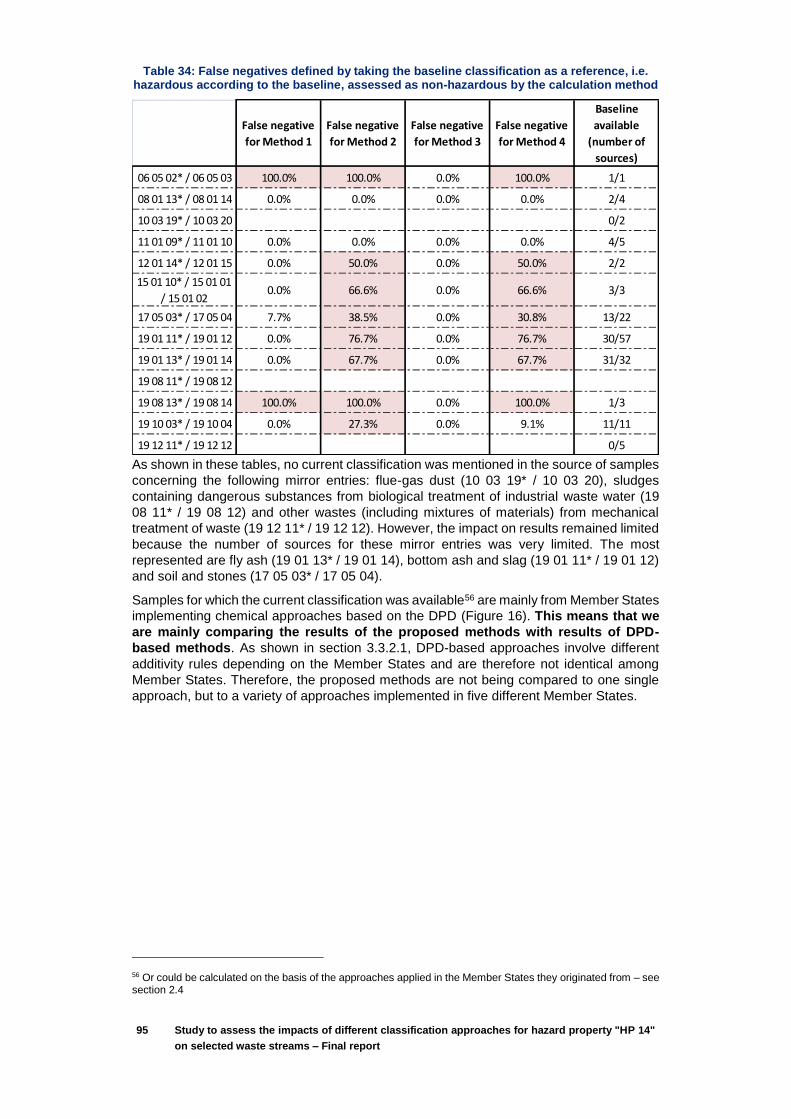
95 Study to assess the impacts of different classification approaches for hazard property "HP 14"
on selected waste streams – Final report
Table 34: False negatives defined by taking the baseline classification as a reference, i.e. hazardous according to the baseline, assessed as non-hazardous by the calculation method
As shown in these tables, no current classification was mentioned in the source of samples
concerning the following mirror entries: flue-gas dust (10 03 19* / 10 03 20), sludges
containing dangerous substances from biological treatment of industrial waste water (19
08 11* / 19 08 12) and other wastes (including mixtures of materials) from mechanical
treatment of waste (19 12 11* / 19 12 12). However, the impact on results remained limited
because the number of sources for these mirror entries was very limited. The most
represented are fly ash (19 01 13* / 19 01 14), bottom ash and slag (19 01 11* / 19 01 12)
and soil and stones (17 05 03* / 17 05 04).
Samples for which the current classification was available56 are mainly from Member States
implementing chemical approaches based on the DPD (Figure 16). This means that we
are mainly comparing the results of the proposed methods with results of DPD-
based methods. As shown in section 3.3.2.1, DPD-based approaches involve different
additivity rules depending on the Member States and are therefore not identical among
Member States. Therefore, the proposed methods are not being compared to one single
approach, but to a variety of approaches implemented in five different Member States.
56 Or could be calculated on the basis of the approaches applied in the Member States they originated from – see section 2.4
False negative
for Method 1
False negative
for Method 2
False negative
for Method 3
False negative
for Method 4
Baseline
available
(number of
sources)
06 05 02* / 06 05 03 100.0% 100.0% 0.0% 100.0% 1/1
08 01 13* / 08 01 14 0.0% 0.0% 0.0% 0.0% 2/4
10 03 19* / 10 03 20 0/2
11 01 09* / 11 01 10 0.0% 0.0% 0.0% 0.0% 4/5
12 01 14* / 12 01 15 0.0% 50.0% 0.0% 50.0% 2/2
15 01 10* / 15 01 01
/ 15 01 020.0% 66.6% 0.0% 66.6% 3/3
17 05 03* / 17 05 04 7.7% 38.5% 0.0% 30.8% 13/22
19 01 11* / 19 01 12 0.0% 76.7% 0.0% 76.7% 30/57
19 01 13* / 19 01 14 0.0% 67.7% 0.0% 67.7% 31/32
19 08 11* / 19 08 12
19 08 13* / 19 08 14 100.0% 100.0% 0.0% 100.0% 1/3
19 10 03* / 19 10 04 0.0% 27.3% 0.0% 9.1% 11/11
19 12 11* / 19 12 12 0/5

96 Study to assess the impacts of different classification approaches for hazard property "HP 14"
on selected waste streams – Final report
Figure 16: Source of samples with current classification available – (a) per Member States; (b) per type of approach
It appears clearly from Table 32 that Method 1 and 3 lead to a high level of concordance
with the current classification identified in the source (or calculated according to the rules
of each Member States as identified in Annex 5). The level of confidence of these
approaches is upper than 90%, except for some mirror entries (06 05 02* / 06 05 03, 11 01
09* / 11 01 10, 19 08 13* / 19 08 14) for which very few sample is available. For the mirror
entry “19 01 13* / 19 01 14” (fly ash, UK data), a correspondence of 71% is observed for
these two methods. This difference is mainly due to fact that these methods have lower
cut-off values than the UK calculation method. Furthermore, the relevance of these two
methods is enhanced by the observation of false positive/negative rate. The very low rate
of false negative shows that these methods are conservative and usually do not lead to an
underestimation of waste classification. However, the false positive rate shows that these
methods could lead to on overestimation of waste classification and especially for Method
3. Indeed, as it is presented in the table thereafter, almost 30% of overestimation is
observed for Method 1 for fly ashes and almost 30% for Method 3 for fly ashes and soil
and stones. Therefore, according to the concordance of results with the current
classification and the false positive rate, Method 1 seems to be the most relevant. Although
the false negative rate is equal to zero, the Method 3 could lead to an over estimation of
waste classification, the concentration limit for chronic 1 category being probably too low.
Regarding Methods 2 and 4, the level of concordance is very low, around to 20% to 30%.
Moreover, according to the false negative rate, this misclassification is mostly due to an
underestimation of waste classification. This means that around 25% to 75% of the wastes
are not considered as hazardous whereas there are currently classified as hazardous.
Based on these observations, these methods do not seem reliable for waste classification.
The overall concordance (Methods 1 & 3) and discrepancies (Methods 2 & 4) with current
classification can be explained by two factors:
Although the proposed methods differ from the DPD-based approaches in
many ways – no generic concentration limits other than for H420 (also H100
for Methods 1 & 2 and H411 for Method 2), cut-off values only applied in
Methods 2 & 4 (and different from the ones applied in DPD-based approaches)
and different additivity rules – Method 1 (and 3, to a lesser extent) are still quite
similar to the DPD approaches.
Higher concentration limit values for Methods 2 & 4 (when M-factors are not
available – which is frequent) than those generally applied in DPD approaches
leads to an underestimation of waste classification for these methods.

97 Study to assess the impacts of different classification approaches for hazard property "HP 14"
on selected waste streams – Final report
5.5.2. Comparison between calculation methods and ecotoxicological data
The comparison of each calculation methods with the classification based on
ecotoxicological data (biotests) according to the proposed threshold values of the approach
(thresholds of 10% for EC50s) is presented in the following tables (Table 35, Table 36 and
Table 37). For each mirror entry and calculation method, the percentage of sample which
shows the same classification as the one based on biotest results is reported, as well as
the number of sources for which ecotoxicological data is available. The values in green
represent, for each mirror entry, methods that lead to a good prediction (percentage upper
than 90%) of waste classification as compared to classification based on biotest results.
The methods that induce a percentage lower than 50% are in red.
Table 35: Concordance of results with biotests results
Concordance
for Method 1
Concordance
for Method 2
Concordance
for Method 3
Concordance
for Method 4
Biotests
available
(number of
sources)
06 05 02* / 06 05 03 0.0% 0.0% 100.0% 0.0% 1/1
08 01 13* / 08 01 14 100.0% 100.0% 100.0% 100.0% 2/4
10 03 19* / 10 03 20 0/2
11 01 09* / 11 01 10 75.0% 100.0% 50.0% 100.0% 4/5
12 01 14* / 12 01 15 100.0% 50.0% 100.0% 50.0% 2/2
15 01 10* / 15 01 01 / 15 01 02 0/3
17 05 03* / 17 05 04 100.0% 50.0% 100.0% 50.0% 2/22
19 01 11* / 19 01 12 40.7% 44.4% 44.4% 44.4% 27/57
19 01 13* / 19 01 14 20.0% 80.0% 20.0% 80.0% 5/32
19 08 11* / 19 08 12
19 08 13* / 19 08 14 0.0% 0.0% 100.0% 0.0% 1/3
19 10 03* / 19 10 04 100.0% 0.0% 100.0% 100.0% 1/11
19 12 11* / 19 12 12 100.0% 100.0% 100.0% 100.0% 1/5
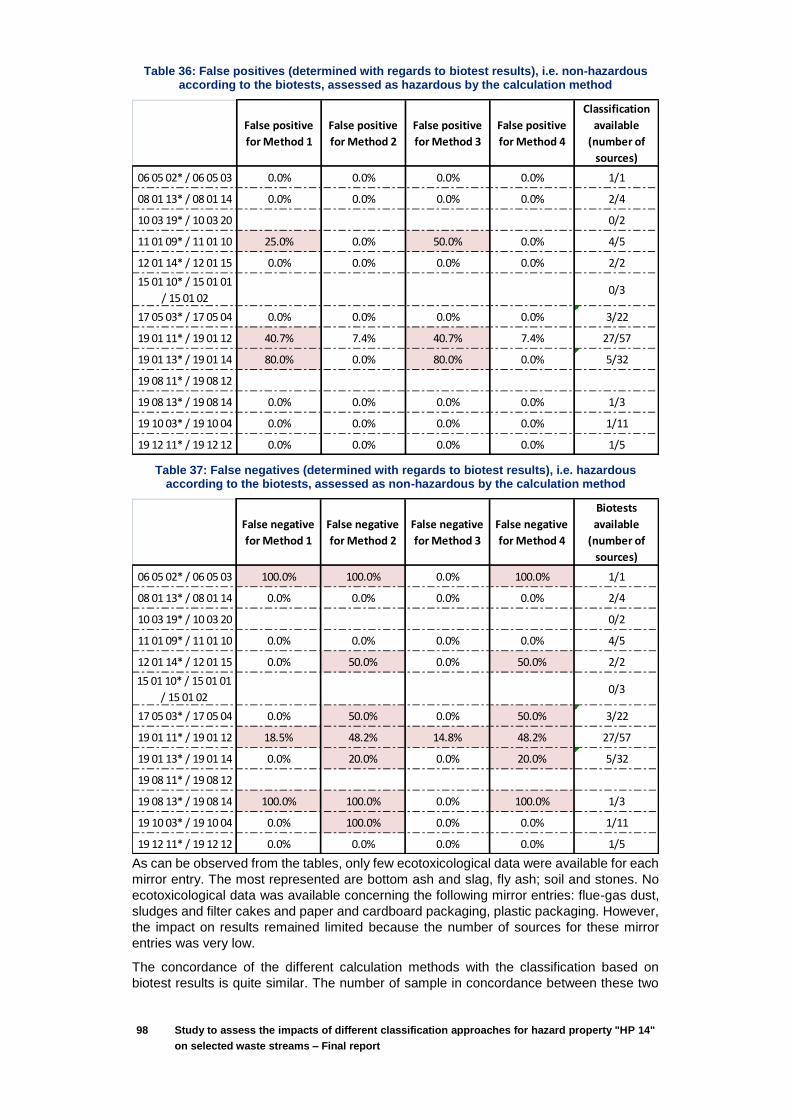
98 Study to assess the impacts of different classification approaches for hazard property "HP 14"
on selected waste streams – Final report
Table 36: False positives (determined with regards to biotest results), i.e. non-hazardous according to the biotests, assessed as hazardous by the calculation method
Table 37: False negatives (determined with regards to biotest results), i.e. hazardous according to the biotests, assessed as non-hazardous by the calculation method
As can be observed from the tables, only few ecotoxicological data were available for each
mirror entry. The most represented are bottom ash and slag, fly ash; soil and stones. No
ecotoxicological data was available concerning the following mirror entries: flue-gas dust,
sludges and filter cakes and paper and cardboard packaging, plastic packaging. However,
the impact on results remained limited because the number of sources for these mirror
entries was very low.
The concordance of the different calculation methods with the classification based on
biotest results is quite similar. The number of sample in concordance between these two
False positive
for Method 1
False positive
for Method 2
False positive
for Method 3
False positive
for Method 4
Classification
available
(number of
sources)
06 05 02* / 06 05 03 0.0% 0.0% 0.0% 0.0% 1/1
08 01 13* / 08 01 14 0.0% 0.0% 0.0% 0.0% 2/4
10 03 19* / 10 03 20 0/2
11 01 09* / 11 01 10 25.0% 0.0% 50.0% 0.0% 4/5
12 01 14* / 12 01 15 0.0% 0.0% 0.0% 0.0% 2/2
15 01 10* / 15 01 01
/ 15 01 020/3
17 05 03* / 17 05 04 0.0% 0.0% 0.0% 0.0% 3/22
19 01 11* / 19 01 12 40.7% 7.4% 40.7% 7.4% 27/57
19 01 13* / 19 01 14 80.0% 0.0% 80.0% 0.0% 5/32
19 08 11* / 19 08 12
19 08 13* / 19 08 14 0.0% 0.0% 0.0% 0.0% 1/3
19 10 03* / 19 10 04 0.0% 0.0% 0.0% 0.0% 1/11
19 12 11* / 19 12 12 0.0% 0.0% 0.0% 0.0% 1/5
False negative
for Method 1
False negative
for Method 2
False negative
for Method 3
False negative
for Method 4
Biotests
available
(number of
sources)
06 05 02* / 06 05 03 100.0% 100.0% 0.0% 100.0% 1/1
08 01 13* / 08 01 14 0.0% 0.0% 0.0% 0.0% 2/4
10 03 19* / 10 03 20 0/2
11 01 09* / 11 01 10 0.0% 0.0% 0.0% 0.0% 4/5
12 01 14* / 12 01 15 0.0% 50.0% 0.0% 50.0% 2/2
15 01 10* / 15 01 01
/ 15 01 020/3
17 05 03* / 17 05 04 0.0% 50.0% 0.0% 50.0% 3/22
19 01 11* / 19 01 12 18.5% 48.2% 14.8% 48.2% 27/57
19 01 13* / 19 01 14 0.0% 20.0% 0.0% 20.0% 5/32
19 08 11* / 19 08 12
19 08 13* / 19 08 14 100.0% 100.0% 0.0% 100.0% 1/3
19 10 03* / 19 10 04 0.0% 100.0% 0.0% 0.0% 1/11
19 12 11* / 19 12 12 0.0% 0.0% 0.0% 0.0% 1/5
99 Study to assess the impacts of different classification approaches for hazard property "HP 14"
on selected waste streams – Final report
approaches for each calculation method is, out of 47 samples: 10 for Method 1, 12 for
Method 2, 12 for Method 3 and 12 for Method 4. Furthermore, there is an overall higher
number of false negatives than false positives, which means biotests are more likely to
classify wastes as hazardous than calculation methods. This is an indication that some
hazardous substances are not taken into account (because not detected or not analysed)
in calculation approaches.
However, regarding false negative/positive rate, a significant difference is observed. As
seen for comparison with current waste classification (section 5.5.1), Methods 1 and 3
show a very low rate of false negative. These methods are then conservative and do not
lead to an underestimation of waste classification, when considering thresholds of 10% for
EC50s. However, the false positive rate shows that these methods could lead to an
overestimation of waste classification. These results indicate that the proposed biotest
approach has a similar level of stringency compared to Methods 1 & 3 (the false positive
rate indicating it is slightly less strict).
Regarding Methods 2 and 4, according to the false negative rate, the misclassification
observed is mostly due to an underestimation of waste classification. This means that
around 10% to 50% of the wastes are not considered hazardous whereas they are
classified as hazardous according to biotests. Based on these observations, and
considering the proposed thresholds, these two methods do not seem reliable for waste
classification.
The modification of the classification rules (i.e. the selection of two positive results to
classify a waste), increased the correlation between test results and calculation methods 2
and 4 (66.7% for both methods) for the most representative mirror pair (i.e.19 01 11*/19 01
12). Nevertheless, these correlations should be interpreted cautiously due to the limitations
detailed above.
5.5.3. Feasability of the different methods
Industrial stakeholders were consulted on the technical and economic feasibility of the four
methods (see questionnaire in Annex 4). This section is a synthesis of their inputs.
5.5.3.1. Technical feasability
Individuals performing the calculations with Methods 1 or 3 must have a good knowledge
of chemicals, but a high level of specialist training is not necessary. However, Methods 2
& 4 can be challenging because of the inclusion of M-factors in the formulae. It was reported
by industry that one must be trained in order to know how to choose the relevant M-factors,
if they were to be self-derived. Required skills would include modelling for assessing the
speciation of inorganic substances.
Furthermore, it appears that consultancy work may be necessary, especially for SMEs
which lack specific skills for the interpretation of results. The need for consultancy would
be all the more important for Methods 2 & 4, as help would be required with M-factors.
5.5.3.2. Economic feasability
The costs for assessing HP 14 would be similar with any of the four methods, as it depends
on the type of waste. Indeed, the costs for sample preparation and chemical analysis
depend on the level of heterogeneity of the waste and on its complexity:
If the waste is rather homogeneous, a limited number of samples will be
needed to get a representative classification. The sampling costs would then
be low compared to an heterogeneous waste;
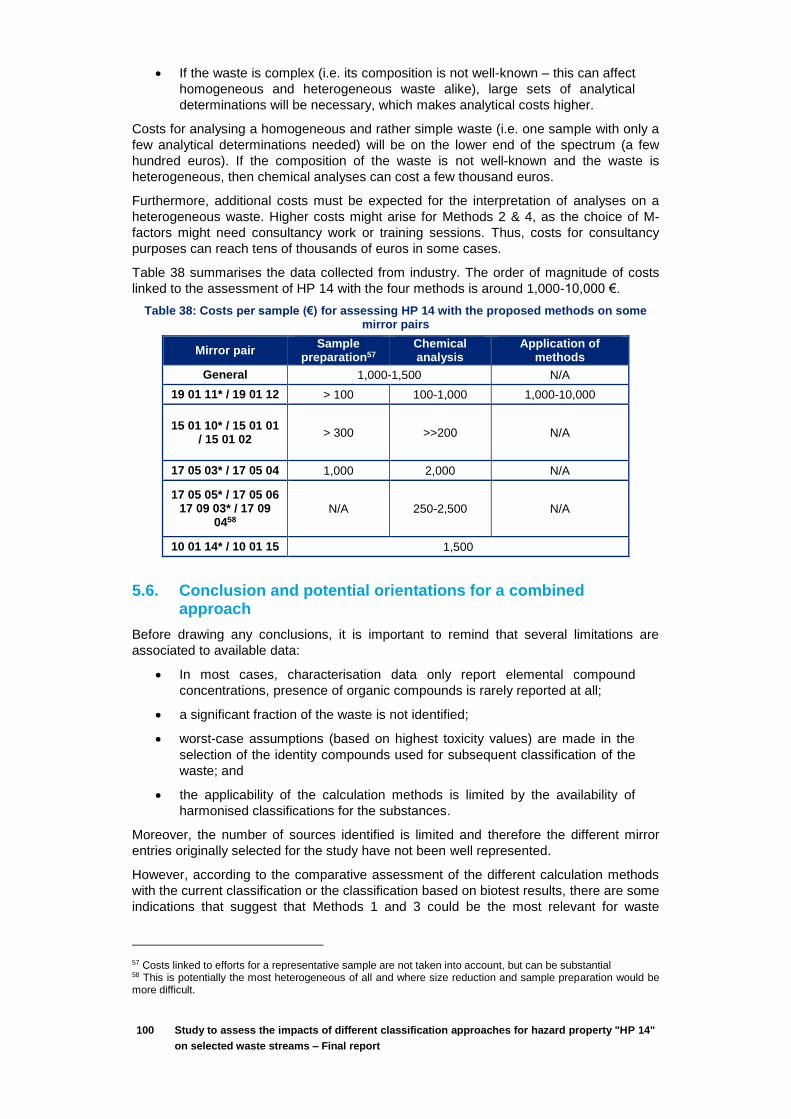
100 Study to assess the impacts of different classification approaches for hazard property "HP 14"
on selected waste streams – Final report
If the waste is complex (i.e. its composition is not well-known – this can affect
homogeneous and heterogeneous waste alike), large sets of analytical
determinations will be necessary, which makes analytical costs higher.
Costs for analysing a homogeneous and rather simple waste (i.e. one sample with only a
few analytical determinations needed) will be on the lower end of the spectrum (a few
hundred euros). If the composition of the waste is not well-known and the waste is
heterogeneous, then chemical analyses can cost a few thousand euros.
Furthermore, additional costs must be expected for the interpretation of analyses on a
heterogeneous waste. Higher costs might arise for Methods 2 & 4, as the choice of M-
factors might need consultancy work or training sessions. Thus, costs for consultancy
purposes can reach tens of thousands of euros in some cases.
Table 38 summarises the data collected from industry. The order of magnitude of costs
linked to the assessment of HP 14 with the four methods is around 1,000-10,000 €.
Table 38: Costs per sample (€) for assessing HP 14 with the proposed methods on some mirror pairs
Mirror pair Sample
preparation57 Chemical analysis
Application of methods
General 1,000-1,500 N/A
19 01 11* / 19 01 12 > 100 100-1,000 1,000-10,000
15 01 10* / 15 01 01 / 15 01 02
> 300 >>200 N/A
17 05 03* / 17 05 04 1,000 2,000 N/A
17 05 05* / 17 05 06 17 09 03* / 17 09
0458 N/A 250-2,500 N/A
10 01 14* / 10 01 15 1,500
5.6. Conclusion and potential orientations for a combined approach
Before drawing any conclusions, it is important to remind that several limitations are
associated to available data:
In most cases, characterisation data only report elemental compound
concentrations, presence of organic compounds is rarely reported at all;
a significant fraction of the waste is not identified;
worst-case assumptions (based on highest toxicity values) are made in the
selection of the identity compounds used for subsequent classification of the
waste; and
the applicability of the calculation methods is limited by the availability of
harmonised classifications for the substances.
Moreover, the number of sources identified is limited and therefore the different mirror
entries originally selected for the study have not been well represented.
However, according to the comparative assessment of the different calculation methods
with the current classification or the classification based on biotest results, there are some
indications that suggest that Methods 1 and 3 could be the most relevant for waste
57 Costs linked to efforts for a representative sample are not taken into account, but can be substantial 58 This is potentially the most heterogeneous of all and where size reduction and sample preparation would be more difficult.

101 Study to assess the impacts of different classification approaches for hazard property "HP 14"
on selected waste streams – Final report
classification based on characterisation data. Indeed, even if these methods are associated
to a potential overestimation of waste classification (13% of sample for method 1 and 18%
for method 3), that lead to a good concordance with current classification or classification
based on biotest results, and the false negative rate is very low.
In addition to these observations, as discussed in the presentation of the calculation
methods, Method 1 seems to be more relevant because the same criteria as those defined
in the Regulation 1272/2008 for classification of mixture are applied (whereas Method 3 is
based on the old classification system of mixture, directive 1994/45/EC, that is very
different to the concept of CLP regulation because summation of components classified for
different hazard categories is not considered). The only two differences of Method 1 with
CLP are the non-consideration of M-factors and generic cut-off values59. The non-
consideration of M-factor has a lesser impact on calculation because this factor is available
only on very few compounds with a harmonised classification. Regarding the non-
consideration of generic cut-off values, this is relevant because some compounds could be
present in waste and could contribute to its toxicity even at low concentration due to
additivity of hazards. This means that the application of this method could then be
consistent with the CLP regulation and allows industrials not to apply other additional
methods.
In the context of a combined approach, an alternative two-step strategy could be envisaged
for waste classification in relation to HP 14.. The first step would consist into applying a
summation method (the one ultimately selected for HP 14 assessment). In a second step,
if the waste cannot be adequately classified according to step 1 (e.g. due to very limited
information on its composition), an experimental approach using one or several biotests
(perhaps also in a tiered approach) could be applied.
An experimental approach could also be directly considered if the composition of the waste
is unknown or complex.
59 These could nevertheless be considered in a methodology to make calculations somewhat easier for those classifying waste. The drawback would be that some very toxic substances may be excluded.

102 Study to assess the impacts of different classification approaches for hazard property "HP 14"
on selected waste streams – Final report
This page was left intentionally blank

103 Study to assess the impacts of different classification approaches for hazard property "HP 14"
on selected waste streams – Final report
6. Impact assessment of the
change of classification
6.1. Principles
In this chapter, the terms “studied mirror pairs” (respectively “studied (waste) codes”) refer
to the selected mirror pairs (respectively “selected (waste) codes”) on which the calculation
methods were applied. Table 39 below reports and classifies those pairs. The codes having
the most robust calculation results (see Chapter 6) are highlighted in bold.
Table 39: The studied mirror pairs, classified by nature and by source
Nature
Source
Sludge Dust Ash Spoil, Soil
& stones
Packaging Other
Inorganic
chemical
processes
06 05 02*/
06 05 03
MFSU and
removal of
paint and
varnish
08 01 13*/
08 01 14
Thermal
processes
10 03 19*/
10 03 20
Chemical
surface
treatment of
materials
11 01 09*/
11 01 10
Shaping,
physical and
mechanical
treatment of
materials
12 01 14*/
12 01 15
Construction
and
demolition
17 05 03*/
17 05 04
17 05 05*/
17 05 06
Incineration
or pyrolysis
of waste
19 08 11*/
19 08 12
19 08 13*/
19 08 14
19 10 03*/
19 10 04
19 01 11*/
19 01 12
19 01 13*/
19 01 14
Other 15 01 10*/
15 01 01/
15 01 02
19 12 11*/
19 12 12
104 Study to assess the impacts of different classification approaches for hazard property "HP 14"
on selected waste streams – Final report
There are only four pairs for which calculations were robust: the following impact
assessment is therefore impeded by lack of data regarding other pairs.
As mentioned in section 2.5, the impact assessment was conducted according to the
following steps:
Setting indicators describing key factors of the impact assessment, the
variation of which may affect the management of waste, the environment,
public health, recycling companies, etc.;
Evaluating the current “value” of those indicators (baseline), i.e. documenting
the current situation and trends of the generation and management of waste
streams classified under the studied codes.
o a more detailed description was drafted for the codes having the most
robust calculation results: 17 05 03*/17 05 04, 19 01 11*/19 01 12, 19
01 13*/19 01 14 and 19 10 03*/19 10 04;
Estimating the likely “value” of those indicators linked to the implementation of
either one of the four methods, i.e. assessing the environmental and socio-
economic impacts of each of the four methods, considering the proportion of
waste that would change classification (as determined in Chapter 5).
More details on these steps can be found in the methodology chapter, section 2.5.
6.2. Indicators for the baseline scenario and the impact assessment
The aspects of interest are described by the following indicators (see also section 2.5.2.1):
Environmental aspects:
o Recovery schemes (includes percentages of waste recycled vs
landfilled)
o Benefits of recovering the waste (including saving of raw materials)
o Pollution due to contaminated fractions of the waste (in case of
improper management)
Economic aspects
o Costs of disposal
o Costs of recycling (for hazardous and non-hazardous waste, and
including revenues for recyclers)
Social aspects
o Employment
o Public Health
6.3. Current situation and trends
This section documents the economic, social and environmental aspects of the current
waste generation and management practices, for waste streams classified under either of
the entries of the studied mirror pairs (Table 22).

105 Study to assess the impacts of different classification approaches for hazard property "HP 14"
on selected waste streams – Final report
Note on the quantities of waste reported for the studied waste streams:
The next sections report the percentage of waste classified as hazardous and non-
hazardous for each waste stream, according to two sources:
Quantities reported by Member States surveyed for the benchmark (see
section 3); and
The current classification of the samples collected for the calculation
exercise (see section 5).
Discrepancies between both estimations are to be expected, if only because collected
samples are not necessary representative of all generated waste.
6.3.1. Soil and stones waste (17 05 03*/17 05 04)
This waste stream refers to excavated soil and stones from construction and demolition
work. Although it is referenced in the LoW under the heading “waste from construction and
demolition”, experts’ opinions vary on whether to include it in the definition of Construction
& Demolition (C&D) waste60. Therefore, studies on excavated soil and stones are often
limited by aggregation of data at C&D waste level and lack of information on the specific
stream.
Soil and stones represent a large part of C&D waste (if one chooses to include it in the
definition): for instance, it makes up to 74% of all waste in Austria, 66% of C&D waste in
France and Ireland, and 57% in Germany61.
A large majority (97% when considering quantities reported in the Member States
studied in this project) of excavated soil and stones streams are considered non-
hazardous in their country of origin.
The baseline classifications of the collected experimental samples for the mirror pair 17 05
03* / 17 05 04, although they also show a majority of non-hazardous fractions among the
soil & stones stream, do not exactly reflect the volume proportion in the studied Member
States (Table 40).
Table 40: Hazard of 17 05 03*/17 05 04 waste streams
Hazard
Source Non-hazardous Hazardous Not determined
Quantities reported by
surveyed Member States
97% 3% n/a
Current classification of
the samples collected for
the calculation exercise
38%
(8 samples)
24%
(5 samples)
38%
(8 samples)
6.3.1.1. Environmental aspects
Current recovery schemes
Because soil & stones are mainly non-hazardous (97% when considering quantities
reported in the Member States studied in this project), environmental challenges focus on
the recovery of this waste in order to preserve virgin materials (aggregates extracted from
quarries and metals embedded in construction materials). Furthermore, seeing that landfills
60 Simon Magnusson, Kristina Lundberg, Bo Svedberg, Sven Knutsson, Sustainable management of excavated soil and rock in urban areas, A literature review Journal of Cleaner Production 93 (2015) 18 e 25 61 BIO by Deloitte (2015) Resource efficient use of mixed waste (to be published)

106 Study to assess the impacts of different classification approaches for hazard property "HP 14"
on selected waste streams – Final report
are attaining full capacity in the EU and that the European strategy is to divert waste from
landfills62, there is a need to foster the recovery of soil & stone waste.
In terms of recovery, soil & stones can be either recycled after going through a dedicated
facility, or used as backfilling. Some also consider the use of soil & stones as cover for
landfills as a method of recovery; however, as the European strategy is focused on the
closing of landfills62, it could be questioned if the accumulation of excavated soil and rock
at landfill due to covering purposes should be labelled as recovery60. The main product
generated from the recycling of soil & stones is recycled aggregate (used in the
construction of roads, for instance)
In Austria and France, around half of soil & stones waste is sent to landfills (53% in Austria
and 44% in France)61, and only 13.2% in Germany. Recovered soil & stones are mainly
using in backfilling activities, as illustrated for Germany below:
Figure 17: Fate of soil & stones waste in Germany in 201263
Few data exist regarding the recycling of soil & stones. Figure 17 shows that 10% of soil &
stones are recycled in Germany and research work undertaken by Hiete et al in 201164
showed that 8.5% of soil & stones are recycled in Baden-Württemberg. Based on these
few numbers, one can say that recycling activities do not account for a big part in the way
soil & stones waste is managed. Nevertheless, seeing the high volumes generated, this
could still account for a substantial amount of waste.
Benefits of recycling soil & stones waste
A 2015 literature review conducted by Magnusson et al60 outlined the various
environmental benefits of reusing and recycling soil and stones. In the paper, the authors
divide reuse and recycling activities as follows:
Reuse on-site: Several studies describe the environmental gains with reusing
excavated soil and rock at the construction site656667. Eras et al.66 showed that
by planning for mass balance of earthworks in an industrial construction
project, it was possible to relocate and reuse 44% of the excavated materials,
i.e. about 700 000 m3, and hence reduce earthwork and transports to landfill
as well as the production and use of quarry materials. However, it is very
62 European Environment Agency, 2009. Diverting Waste from Landfill e Effectiveness of Waste-management Policies in the European Union. 63 Kreislaufwirtschaft Bau, 2012 Monitoring Report: http://www.kreislaufwirtschaft-bau.de/daten.html 64 Hiete, M., Stengel, J., Ludwig, J., Schultmann, F., 2011. Matching construction and demolition waste supply to recycling demand: a regional management chain model. Build. Res. Inf. 39, 333 e 351. 65 Chittoori, B., Puppala, A.J., Reddy, R., Marshall, M., 2012. Sustainable reutilization of excavated trench material. GeoCongress 2012, 4280 e 4289. 66 Eras, C.J.J., Gutierrez, A.S., Capote, D.H., Hens, L., Vandecasteele, C., 2013. Improving the environmental performance of an earthwork project using cleaner production strategies. J. Clean. Prod. 47, 368 e 376. 67 Kenley, R., Harfield, T., 2011. Greening procurement: a research agenda for optimizing mass-haul during linear infrastructure construction. In: Sixth International Conference on Construction in the 21st Century (CITC-VI), pp. 235 e 240.
107 Study to assess the impacts of different classification approaches for hazard property "HP 14"
on selected waste streams – Final report
difficult to estimate the quantity of excavated material reused on site, because
there is no reporting on it. It is supposed to be a low figure because there is
often not enough space on building sites to enable reuse.
Reuse on other projects: Reuse of excavated soil and rock directly in other
projects means that materials are transported between construction sites.
Such reuse is possible when there are several construction projects going on
in the same region and when cooperation has previously been achieved. The
authors found no data regarding this uptake of this type of reuse.
Recycling through a recycling facility: The environmental potential for recycling
excavated soil and stones waste in such way has been studied by some
authors. For example, for 13 out of 14 environmental aspects studied by
Blengini and Garbarino68, there were environmental gains. Indeed, the CO2
emissions were reduced by about 14 kg CO2 equivalents per ton when
recycling C&D waste, compared to using quarry primary materials. Simion et
al69studied the climate effects of producing natural aggregates compared to
recycling C&D waste. Climate impact from natural aggregate production was
about 103 kg CO2 per ton, compared to about 16 kg per ton for recycled C&D
waste.
The first reuse activities can be included in the backfilling category. It is clear that reusing
soil & stones on site in more environmentally beneficial than using it in other projects,
because no emissions from transport are involved. The only recovery method the benefits
of which were quantified is recycling through dedicated channels.
Drivers and barriers to an increase of soil & stones recycling
A survey in a few Member States conducted for the a study on C&D waste61 showed that
the main driver for higher recycling rates of soil & stones – and C&D waste in general – is
a high landfill tax coupled with an exemption for the use of C&D material for recovery
purposes. For instance, the main Austrian incentive that drives recycling of CDW is the law
for Remediation of Contaminated Sites (Altlastensanierungsgesetz (ALSAG)), which
charges 9.20 € for every ton that is not recovered in proper and structurally engineered
way. In Flanders, the combination of stimulating both practical and technical solutions (use
of granulates in road construction) with economic benefits (landfill taxes) drove the stony-
fraction recycling rate at 90%.
Conversely, low taxes regarding landfills and virgin materials is a barrier to fostering the
recycling of C&D waste, including soil & stones. In France, the low General Tax on Polluting
Activities (0.2 € per ton) does not encourage building firms to favour recycling and recovery
over landfill. Furthermore, a few Member States stressed a strong competition coming from
low prices of primary raw material, making secondary building materials unattractive (e.g.
Austria, Germany and Finland)61. For instance, primary raw materials are abundant in most
of the regions in Germany and therefore cheap when compared to recycled materials,
which can sometimes be even more expensive. Since no subsidies or other economic
incentives exist that could drive the use of secondary materials, the choice to opt for primary
materials is most of the time price related. Another barrier to the recycling of soil & stones
waste is the illegal disposal of waste, which is a problem mainly for countries like Spain or
Portugal70.
Pollution due to contaminated soil & stones waste
68 Blengini, G.A., Garbarino, Elena, 2010. Resources and waste management in Turin (Italy): the role of recycled aggregates in the sustainable supply mix. J. Clean.Prod. 18, 1021 e 1030. 69 Simion, I.M., Fortuna, M.E., Bonoli, A., Gavrilescu, M., 2013. Comparing environmental impacts of natural inert and recycled construction and demolition waste processing using LCA. J. Environ. Eng. Landsc. Manag. 21, 273 e 287. 70 BIO Intelligence Service, Arcadis & IEEP (2011) Management of Construction and Demolition Waste in Europe – Final Report
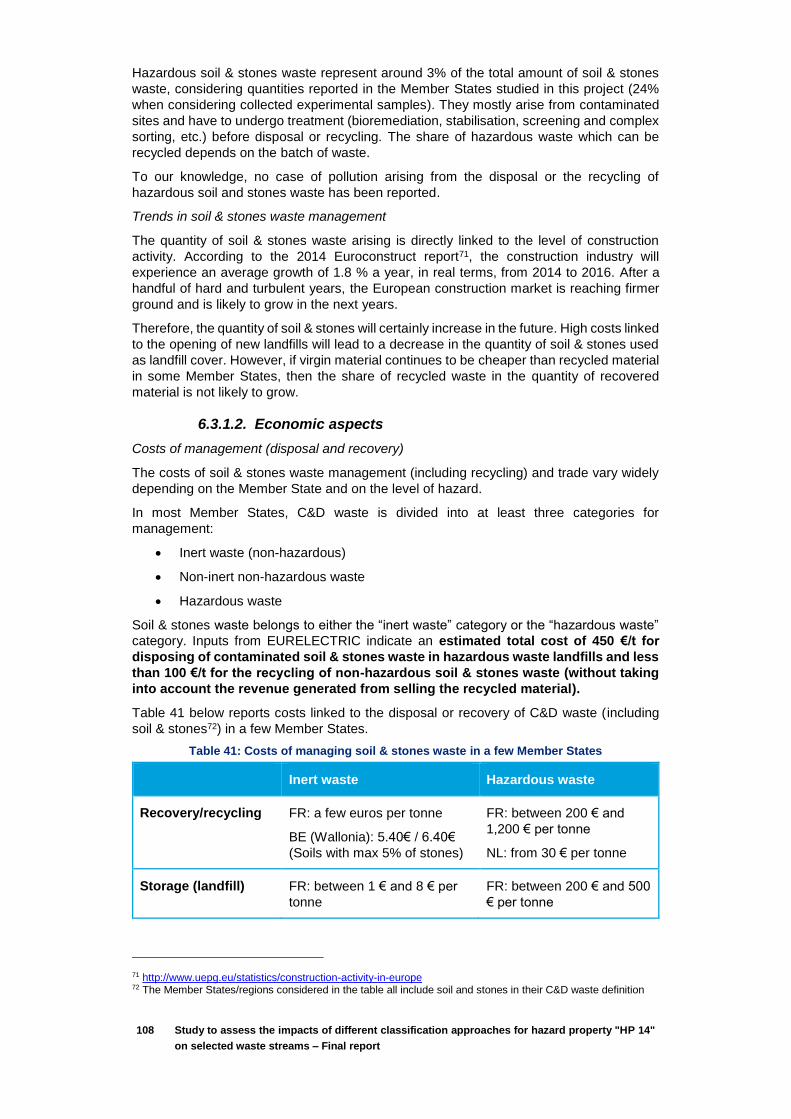
108 Study to assess the impacts of different classification approaches for hazard property "HP 14"
on selected waste streams – Final report
Hazardous soil & stones waste represent around 3% of the total amount of soil & stones
waste, considering quantities reported in the Member States studied in this project (24%
when considering collected experimental samples). They mostly arise from contaminated
sites and have to undergo treatment (bioremediation, stabilisation, screening and complex
sorting, etc.) before disposal or recycling. The share of hazardous waste which can be
recycled depends on the batch of waste.
To our knowledge, no case of pollution arising from the disposal or the recycling of
hazardous soil and stones waste has been reported.
Trends in soil & stones waste management
The quantity of soil & stones waste arising is directly linked to the level of construction
activity. According to the 2014 Euroconstruct report71, the construction industry will
experience an average growth of 1.8 % a year, in real terms, from 2014 to 2016. After a
handful of hard and turbulent years, the European construction market is reaching firmer
ground and is likely to grow in the next years.
Therefore, the quantity of soil & stones will certainly increase in the future. High costs linked
to the opening of new landfills will lead to a decrease in the quantity of soil & stones used
as landfill cover. However, if virgin material continues to be cheaper than recycled material
in some Member States, then the share of recycled waste in the quantity of recovered
material is not likely to grow.
6.3.1.2. Economic aspects
Costs of management (disposal and recovery)
The costs of soil & stones waste management (including recycling) and trade vary widely
depending on the Member State and on the level of hazard.
In most Member States, C&D waste is divided into at least three categories for
management:
Inert waste (non-hazardous)
Non-inert non-hazardous waste
Hazardous waste
Soil & stones waste belongs to either the “inert waste” category or the “hazardous waste”
category. Inputs from EURELECTRIC indicate an estimated total cost of 450 €/t for
disposing of contaminated soil & stones waste in hazardous waste landfills and less
than 100 €/t for the recycling of non-hazardous soil & stones waste (without taking
into account the revenue generated from selling the recycled material).
Table 41 below reports costs linked to the disposal or recovery of C&D waste (including
soil & stones72) in a few Member States.
Table 41: Costs of managing soil & stones waste in a few Member States
Inert waste Hazardous waste
Recovery/recycling FR: a few euros per tonne
BE (Wallonia): 5.40€ / 6.40€
(Soils with max 5% of stones)
FR: between 200 € and
1,200 € per tonne
NL: from 30 € per tonne
Storage (landfill) FR: between 1 € and 8 € per
tonne
FR: between 200 € and 500
€ per tonne
71 http://www.uepg.eu/statistics/construction-activity-in-europe 72 The Member States/regions considered in the table all include soil and stones in their C&D waste definition

109 Study to assess the impacts of different classification approaches for hazard property "HP 14"
on selected waste streams – Final report
BE (Wallonia): 7.23 € (soils)
Logistics FR: Renting costs of a truck is around 90 €/hour. Skips can
be charged up to 50 € per month if the number of rotations is
not high enough.
NL: As an indication, the cost of the rental of a 9M2 CDW
container (including transport and treatment of the waste) is
329 €.
NB: France and Netherlands: total costs (excluding logistics); Wallonia: landfill tax excluding VAT
France is admittedly at the low end of the landfill costs compared to other Member States.
Therefore, in other countries (for which data was not readily available), costs for landfilling
soil & stones waste are likely to be higher. The costs of managing hazardous waste, based
on French data, are estimated at being in the order of magnitude of 200 – 500 €.
Table 41 shows that managing hazardous soil & stones can be as high as a hundred times
more expensive than managing non-hazardous waste. Because high volumes of soil &
stones waste are generated each year, mostly of a non-hazardous nature, a change of
classification from non-hazardous to hazardous would lead to soaring costs.
Trade
Value of the recovered material varies greatly depending on the regions. As mentioned in
the previous section, recycled soil & stones can sometimes be more expensive than virgin
materials if those are abundant. In other cases, the price of recycled soil & stones is at
least 20% lower compared to the price of natural aggregates73.
The exports/imports of CDW (including soil and stones waste) are marginal in France. In
Austria, less than 2% of CDW and soil & stones waste are exported.
6.3.1.3. Social aspects
Public health
No issues regarding public health have been reported regarding the management of soils
& stones waste.
Employment
No quantitative data estimating the number of jobs generated by the management of soil
& stones (landfill, backfill, recycling) was found.
6.3.2. Incinerator bottom ash (19 01 11*/19 01 12)
Incinerator bottom ash (IBA) is the ash that is left over after waste is burnt in an incinerator.
Municipal energy from waste plants that use incineration burn a wide range of municipal
wastes and therefore the term ‘ash’ is slightly misleading because it is not all powdery but
contains glass, brick, rubble, sand, grit, ferrous and non-ferrous metals, stone, concrete,
ceramics and fused clinker as well as combusted products such as ash and slag. Bottom
ash is generated at a rate of approximately 200-300 kg/t of waste incinerated. In the EU,
20 million tons of IBA is produced annually (2013)74, with France producing 3 million tons
per year and Germany 5 million75.
A large majority (92% when considering quantities reported in the Member States
studied in this project) of IBA streams are classified as non-hazardous in their
country of origin.
73 SARMa (2011) The Production of Recycled Aggregates from Inert Waste 74 https://resourcesandrecycling.wordpress.com/incinerator-bottom-ash/ 75 Communication from CEWEP
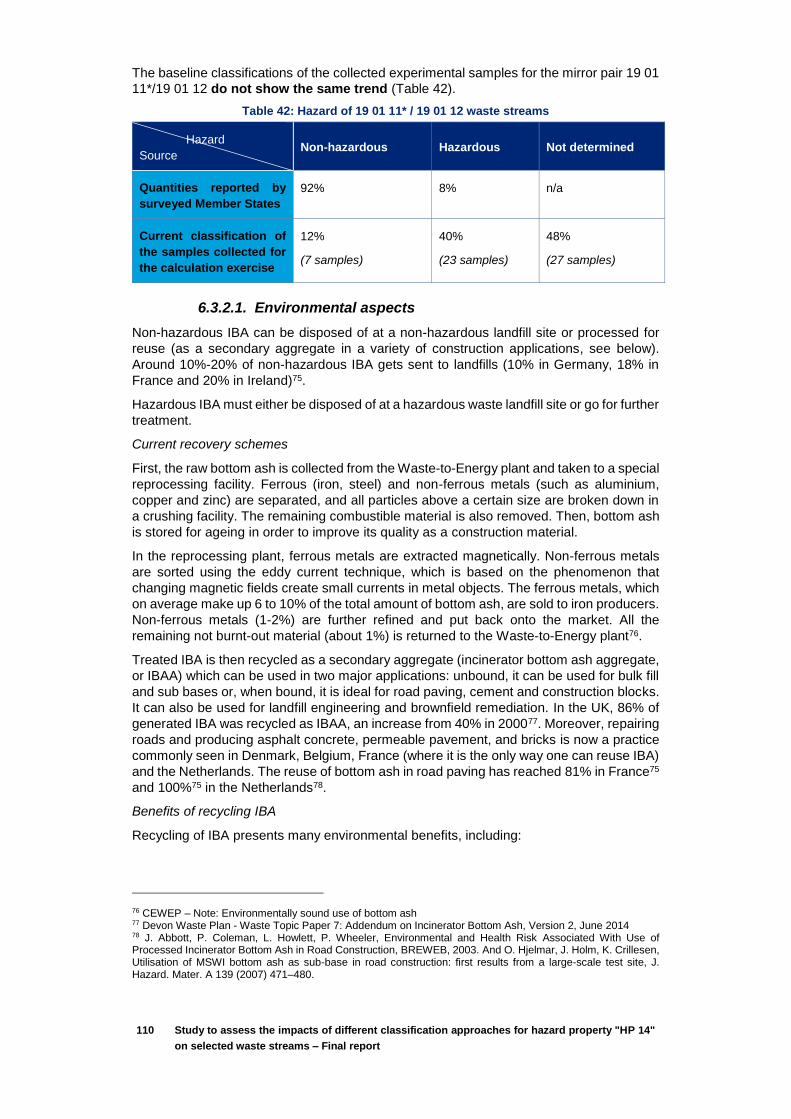
110 Study to assess the impacts of different classification approaches for hazard property "HP 14"
on selected waste streams – Final report
The baseline classifications of the collected experimental samples for the mirror pair 19 01
11*/19 01 12 do not show the same trend (Table 42).
Table 42: Hazard of 19 01 11* / 19 01 12 waste streams
Hazard
Source Non-hazardous Hazardous Not determined
Quantities reported by
surveyed Member States
92% 8% n/a
Current classification of
the samples collected for
the calculation exercise
12%
(7 samples)
40%
(23 samples)
48%
(27 samples)
6.3.2.1. Environmental aspects
Non-hazardous IBA can be disposed of at a non-hazardous landfill site or processed for
reuse (as a secondary aggregate in a variety of construction applications, see below).
Around 10%-20% of non-hazardous IBA gets sent to landfills (10% in Germany, 18% in
France and 20% in Ireland)75.
Hazardous IBA must either be disposed of at a hazardous waste landfill site or go for further
treatment.
Current recovery schemes
First, the raw bottom ash is collected from the Waste-to-Energy plant and taken to a special
reprocessing facility. Ferrous (iron, steel) and non-ferrous metals (such as aluminium,
copper and zinc) are separated, and all particles above a certain size are broken down in
a crushing facility. The remaining combustible material is also removed. Then, bottom ash
is stored for ageing in order to improve its quality as a construction material.
In the reprocessing plant, ferrous metals are extracted magnetically. Non-ferrous metals
are sorted using the eddy current technique, which is based on the phenomenon that
changing magnetic fields create small currents in metal objects. The ferrous metals, which
on average make up 6 to 10% of the total amount of bottom ash, are sold to iron producers.
Non-ferrous metals (1-2%) are further refined and put back onto the market. All the
remaining not burnt-out material (about 1%) is returned to the Waste-to-Energy plant76.
Treated IBA is then recycled as a secondary aggregate (incinerator bottom ash aggregate,
or IBAA) which can be used in two major applications: unbound, it can be used for bulk fill
and sub bases or, when bound, it is ideal for road paving, cement and construction blocks.
It can also be used for landfill engineering and brownfield remediation. In the UK, 86% of
generated IBA was recycled as IBAA, an increase from 40% in 200077. Moreover, repairing
roads and producing asphalt concrete, permeable pavement, and bricks is now a practice
commonly seen in Denmark, Belgium, France (where it is the only way one can reuse IBA)
and the Netherlands. The reuse of bottom ash in road paving has reached 81% in France75
and 100%75 in the Netherlands78.
Benefits of recycling IBA
Recycling of IBA presents many environmental benefits, including:
76 CEWEP – Note: Environmentally sound use of bottom ash 77 Devon Waste Plan - Waste Topic Paper 7: Addendum on Incinerator Bottom Ash, Version 2, June 2014 78 J. Abbott, P. Coleman, L. Howlett, P. Wheeler, Environmental and Health Risk Associated With Use of Processed Incinerator Bottom Ash in Road Construction, BREWEB, 2003. And O. Hjelmar, J. Holm, K. Crillesen, Utilisation of MSWI bottom ash as sub-base in road construction: first results from a large-scale test site, J. Hazard. Mater. A 139 (2007) 471–480.
111 Study to assess the impacts of different classification approaches for hazard property "HP 14"
on selected waste streams – Final report
it avoids landfilling, therefore leaving void space available for other wastes
which cannot be treated further up the waste hierarchy;
It reduces the carbon footprint of the production of cement, metals, etc. through
recycling:
o Metals: Recovering fine non-ferrous metals from 1 ton of IBA saves 40
kg of CO2 emission. Furthermore, in order to produce 1 ton of
aluminium, the primary process generates 10.6 t CO2 while the
recycling process generates only 0.73 t CO279.
o Cement: reusing IBA in the production of cements allows for a
reduction of the impact on global warming. As a large amount of
energy is used in the cement production process to decompose the
calcium carbonate (CaCO3) into lime (CaO), a huge amount of carbon
dioxide is emitted during the process. Due to the fact that IBA is
composed of lime instead of calcium carbonate, it can reduce the
carbon dioxide emission80.
It reduces the use of natural resources such as quarried aggregates.
o It is possible to use IBA as concrete aggregate. The results show that
treated (immersion in sodium hydroxide for 15 days) bottom ash can
replace up to 50% of gravel in concrete without affecting the durability.
o A possible way to reuse IBA is to replace the materials in the base
course and sub-base of road pavement. This provides a simple and
direct method for reuse of the incineration ash and several road
sections have utilised IBA in road construction80.
It must be mentioned that some raise concerns over supporting the recycling of IBA. In
France, the National Centre for Independent Information on Waste (Centre national
d'information indépendante sur les déchets, or Cniid) fears that encouraging IBA recycling
can be seen as supporting incineration and thus going against waste prevention actions81.
Drivers and barriers to an increase of IBA recycling
The main motivation for recycling IBA is an increasing shortage of suitable natural
aggregate and lack of available landfill space82. The fact that IBA can be used directly as
a replacement of gravel for road pavement is also a plus.
However, ISWA reports that the different legislations regarding IBA across Member States
(limit values of leaching tests, for instance) hinders trade of bottom ash and that there is a
need of a level-playing field. Furthermore, a general barrier in most countries is that people
worry due to the fact that IBA originates from waste.
In France, it appeared that the economic model of companies recycling IBA is fragile, as
they strongly depend on the quantities of waste being incinerated. The success of waste
prevention campaigns lead to a stagnation and even a decrease of waste quantities, thus
locally producing less IBA in some cases81.
Pollution due to contaminated IBA
No case of pollution due to the utilisation or disposal of IBA seems to be reported. Notably,
a three-year study on the utilisation of IBA in road pavement in France, showed the
concentrations of heavy metals, fluorides and pH values in the leachate were below the
79 TU Delft (2013) Recycling of Incinerator Bottom Ash, Resources & Recycling (Presentation) 80 Charles H. K. Lam, Alvin W. M. Ip, John Patrick Barford and Gordon McKay, Use of Incineration MSW Ash: A Review, Sustainability 2010, 2, 1943-1968 81 http://mondeacplanete.blog.lemonde.fr/2014/04/21/le-machefer-des-ordures-incinerees-sous-le-bitume/ 82 ISWA (2006) Management of Bottom Ash from WTE Plants: An overview of management options and treatment methods
112 Study to assess the impacts of different classification approaches for hazard property "HP 14"
on selected waste streams – Final report
limits authorised for potable water83. Nevertheless, a more recent environmental
assessment of IBA utilisation performed with the Life Cycle Assessment method84 found
that, although the utilisation of IBA saves natural resources and energy, the consequences
on the trace element leaching are more uncertain and may depend on the specific
materials. The study modelled leaching in a time perspective of 100 years with scenarios
involving different amounts of infiltrated water and showed a potential for toxic effects due
to leaching of trace elements (copper, in particular).
However, local environmental NGOs stress the scarce independent literature on the toxicity
of recycled IBA and are advocating the use of the precautionary principle.
Trends in IBA management
Innovative techniques are currently being developed for a better recovery of IBA and IBA
components: deep metal recovery85, steel scrap upgrading, more effective recycling for
concrete and cement production79.
6.3.2.2. Economic aspects
By reducing landfill and saving primary aggregate, recycling IBA reduces costs both to the
incinerator operator and to the user (assuming proper market values). For instance, the
cost of disposal is at least twice (generally more) greater than recovery in France. In
Germany, it costs less than 5 €/ton to recover IBA and around 25-50 €/ton to landfill
hazardous IBA.
The UK Environment Agency estimates that using 469,000 tonnes of IBA each year can
save businesses over £47,350,000 each year, largely due to landfill charges, and creates
markets worth over £5.8 million a year.
There are numerous case studies of companies reducing their costs by using recycled
IBA86. For instance, a UK Infrastructure team used a mix of 30% IBA and recycled asphalt
containing IBA to surface 4,000 car park spaces at a new long stay facility at Stansted
Airport (UK). Approximately 54,000 tonnes of primary aggregate were replaced and cost
savings of £20,000 achieved. Another example is the use of processed IBA as a protection
liner at Burnhills landfill site in 2000, which allowed to avoid the Landfill Tax at £2 per tonne
for the suppliers of the IBA (the tax is the same today) totalling £12,000 of savings.
Furthermore, this project took place before the implementation of the Aggregates Levy:
had it been in place, a further £12,800 would have been saved by using secondary
aggregates87.
However, the market for utilising IBA in construction business is difficult due to
environmental demands and is becoming increasingly crowded, with more and more
recycled demolition waste and cleaned (former polluted) soil coming into the market82.
6.3.2.3. Social aspects
Public health
Recycling IBA in road construction can pose a risk due to the potential leaching of
hazardous substances such as dioxins, after percolation of storm water88. However,
recently-generated IBA contain fewer hazardous substances than in the past, and undergo
83 Bruder-Hubscher, C.; Lagarde, F.; Leroy, M.J.F.; Couganowr, C.; Enguehard, F. Utilisation of bottom ash in road construction: Evaluation of the environmental impact. Waste Manag. Res. 2001, 19, 545-556. 84 S. Toller, E. Kärrman, J.P. Gustafsson, Y. Magnusson, Environmental assessment of incinerator residue utilization, Waste Manage. 29 (2009) 2071–2077. 85 For instance, the ADR process: dry removal of fines from the IBA in a jet stream, for a high recovery of non-ferrous metals 86 See for instance http://www2.wrap.org.uk/applications/aggregain/casestudysearch/index.rm 87 WRAP, Factsheet AggRegain: The use of processed Incinerator bottom ash as a protection liner at Burnhills landfill site 88 Badreddine R, Bartet B, Francois D, Pepin G. Impact sur les sols des dioxines de MIOM utilisés en technique routière. Déchets Sci. Tech., 2003, 29, 1621

113 Study to assess the impacts of different classification approaches for hazard property "HP 14"
on selected waste streams – Final report
severe treatment before being reused. Furthermore, the use of appropriate materials (e.g.
geotextile liner) and soils (e.g. silt-clayey soil) allows for retention of those hazardous
substances, thus avoiding water contamination and potential adverse effects for humans89.
Therefore, the use of IBA in road construction, which is common in many countries such
as France or the Netherlands, does not seem to lead to public health issues.
Employment
According to CEWEP, 8-10 jobs are needed to produce 100kt/y of IBAA and to operate a
400kt/y quarry of natural aggregate. Managing 100kt/y of IBA in landfills requires less than
8-10 jobs. The current number of jobs for landfilling and recovery in France and Germany90
can be estimated thanks to CEWEP inputs (Table 43):
Table 43: Estimation of the number of workers needed for managing IBA in landfills and for recovery, considering the amounts of IBA generated in France and in Germany (per year)
Landfill Recovery
France Max 43 jobs 195 – 243 jobs
Germany Max 44 jobs 396 – 495 jobs
Recovering IBA generates much more jobs than landfilling, as the number of workers for
landfilling is lower per ton and the quantities of non-hazardous IBA landfilled are lower.
6.3.3. Fly ash from incinerators (19 01 13* / 19 01 14)
Fly ash is the lightest, finest and thermo-labile waste from municipal waste incineration
collected by a filtration system and it represents more than 1% by weight of the total waste.
The characteristics of fly ash are very variable, because they depend on the burnt material,
the combustion type and the temperature. Generally, fly ash is a highly soluble and reactive
material that contains significant quantities of heavy metals (Zn, Pb, Cd, Cr, etc.). Often
the heavy metals are present as anionic salts (chlorides and sulphates), and alkaline
anionic salts represent one of the main components of this waste (up to 25% of Cl in some
samples). In this inorganic fraction, which is very variable in composition, we find an organic
fraction relatively rich in unburnt elements, aromatic compounds and often also rich in
dioxins and furans91.
A large part (66% when considering quantities reported in the Member States studied
in this project) of MSWI fly ash streams are classified as hazardous.
The baseline classifications of the collected samples for the mirror pair 19 01 13* / 19 01
14 also show a majority of hazardous fractions among the fly ash stream (Table 44).
Table 44: Hazard of 19 01 13* / 19 01 14 waste streams
Hazard
Source Non-hazardous Hazardous Not determined
Quantities reported by
surveyed Member States
44% 66% n/a
Current classification of
the samples collected for
the calculation exercise
31%
(10 samples)
66%
(21 samples)
3%
(1 samples)
89 RECORD (2007) Risques sanitaires engendrés par la valorisation des déchets (recyclage et réutilisation) 90 Member States for which data was provided by CEWEP 91 Ebook on LIFE + projects regarding fly ash disposal, http://cosmos.csmt.eu/newsite/cosmos.csmt.eu/files_up/ebook_Fly%20ash%20disposal.pdf

114 Study to assess the impacts of different classification approaches for hazard property "HP 14"
on selected waste streams – Final report
6.3.3.1. Environmental aspects
Current recovery schemes
Recovery of MSWI fly ash as a second-hand raw material, for example in cement or in
other building materials, is not widespread in Europe. A scientific and grey literature search
showed no evidence of recovery of the non-hazardous streams, as available information
mainly focuses on the management of hazardous MSWI fly ash and deals with treatment
previous to landfilling or potential recovery. Indeed, a large part of available documentation
describes research on the technical and environment feasibility of fly ash reuse:
stabilisation for reuse in construction (buildings and roads), investigation of leaching from
the product using pre-treated (or “washed”) fly ash, mechanical properties of the materials
built from fly ash, etc. However, no evidence of large-scale industrial projects using reused
fly ash was found.
Benefits of recycling MSWI fly ash
Developing MSWI fly ash recycling and therefore treatment of fly ash for recycling, allows
to avoid sending it in hazardous and non-hazardous waste landfills. Thus, it diminishes the
need for virgin materials in construction and reduces
Furthermore, some studies highlight the interesting mechanical properties given by fly ash
to cement or other building materials.
Drivers and barriers to an increase of fly ash recycling
The main barrier to reusing or recycling fly ash is finding a suitable way to manage risks
linked to the hazardous properties of this waste. Although effective washing processes
have been developed to treat fly ash prior to reuse, it seems that the high costs of such
treatments, along with a negative perception of ashes, have prevented an uptake of fly ash
recycling in Europe. Another factor hindering reuse of fly ash is the highly variable
composition of this waste, which makes a burden of the need for characterisation and
regular analysis for the purpose of recovery.
The amount of research work on the optimal conditions and on the impact of reusing ash
– some of it funded by the EU under FPs or LIFE(+) projects – drives the development of
economical and environmentally-sound ways to reuse or recycle MSWI fly ash.
Pollution due to contaminated MSWI fly ash
The main risk of pollution from MSWI fly ash is the leaching of hazardous substances such
as heavy metals. Leaching can occur in landfills and in reuse applications.
One of the most common stabilisation process prior to landfilling has been the solidification
of fly ash using a hydraulic binder, most of the times Portland cement (for instance in
France and Italy92)91. The Belgian LIFE + project “REFIOM – Assessment of the long term
behaviour of the fine residues of municipal waste incineration process treated with
hydraulic binders” studied the fate of this material after a long period. The samples
analysed are the raw fly ash from MSWI, blocs of stabilised fly ash in cement and naturally
aged in their stocking sites and fresh solidified fly ash. The conclusions of this project are
clear and important:
The solidification process with hydraulic binder for fly ash from MSWI isn’t
effective, as on long term period, not all the pollutants are immobilised.
Analysis on test-bars do not always give information on the behaviour of the
material at long term, a multidisciplinary approach is necessary to understand
the evolution of this material, including, for instance, mineralogy.
92 Knut Jøssang, Michael Becidan (2013) Aske fra avfallsforbrenning: fra et problem til en ressurs? (Presentation)

115 Study to assess the impacts of different classification approaches for hazard property "HP 14"
on selected waste streams – Final report
Although the use of cement-solidified MSWI fly ash has been proved to be suitable for
safety reuse as artificial aggregate in Portland cement mortars93, it has also been reported
that the use of fly ash stabilised by cement, which would be used as a road base
construction material, did not meet the leaching standards for construction material80.
Therefore, it appears that there is not enough proof of the safety of using cement-solidified
MSWI fly ash, although a lot of effort has been devoted in last years to develop new
stabilisation and washing processes.
Trends in MSWI fly ash management
Seeing the amount of research regarding safe ways to reuse fly ash and avoid landfilling,
it seems that fly ash management in going towards the applications processes allowing fly
ashes to be reused or at least landfilled as inert waste at a low cost.
6.3.3.2. Economic aspects
6.3.3.3. Fly ash disposal costs vary in Europe from 150 to 500 €/ton92 (when sent to hazardous landfills) and the cost of pre-processing, before disposal in standard landfills, is also very high.Social aspects
Public health
No issues regarding public health have been reported regarding the management of soils
& stones waste.
Employment
No quantitative data estimating the number of jobs generated by the management of soil
& stones (landfill, backfill, recycling) was found.
6.3.4. Fluff-light fraction and dust from shredding of metal-containing waste (19 10 03*/19 10 04)
End-of-life vehicles and household appliances, as well as mixed scrap, undergo a
shredding process, carried out by a hammer mill pulverising the waste, followed by a step
separating a heavy and a light fraction. The heavy fraction includes steel scrap and a non-
magnetic shredder fraction, while the light fraction is constituted of fluff and dust. This light
fraction, classified under the mirror pair “19 10 03*/19 10 04”, constitutes 25% (w/w) of
output waste streams of the shredding process. It is a complex mixture of non-ferrous
materials including plastics, foam, textiles, rubber, glass, sand and dust, as well as other
organic compounds and metals in varying proportions.
A majority (68% when considering quantities reported in the Member States studied
in this project) of the light fraction from shredding of metal-containing waste are
classified as non-hazardous in their country of origin.
The baseline classifications of the collected experimental samples for the mirror pair 19 10
03*/19 10 04 do not show the same trend (Table 45).
Table 45: Hazard of 19 10 03*/19 10 04 waste streams
Hazard
Source Non-hazardous Hazardous Not determined
Quantities reported by
surveyed Member States
68% 32% n/a
93 Cinquepalmi, M.A.; Mangialardi, T.; Panei, L.; Paolini, A.E.; Piga, L. Reuse of cement-solidified municipal incinerator fly ash in cement mortars: Physico-mechanical and leaching characteristics. J. Hazard. Mater. 2008, 151, 585-593

116 Study to assess the impacts of different classification approaches for hazard property "HP 14"
on selected waste streams – Final report
Hazard
Source Non-hazardous Hazardous Not determined
Current classification of
the samples collected for
the calculation exercise
9%
(7 samples)
91%
(10 samples)
0%
(0 samples)
6.3.4.1. Environmental aspects
The light fraction from shredding of metal-containing waste is mainly non-hazardous
because European legislation (for instance the End-of-Life Vehicles (ELV) Directive)
requires the depollution of end-of-life products prior to shredding.
Hazardous fractions include foam fluff contaminated with organic compounds (such as
polybrominated diphenyl ethers used as flame retardant and classified as POPs)94.
Current recovery schemes
The light fraction (fluff and dust) is currently not well recovered. For instance, in France, no
more than 18% of fluff from car-shredding is recovered, from which less than 1% is recycled
(the remaining being used for energy recovery)95. Plastics are the fluff fraction which is the
most recycled. Fine fractions benefit from recycling in construction work, as they are mostly
constituted of minerals.
Thus, the large majority of fluff and dust is being landfilled.
Drivers and barriers to an increase of fluff and dust recycling
With 2015 set to see the tightening of EU legislation governing recycling quotas for end-of-
life vehicles, it is becoming important to recycle fractions that have previously been
discarded96. The Landfill Directive also contributes to the pressure to minimise this waste
through recycling and recovery. Therefore, techniques are under development in order to
increase recycling rates of fluff and dust (see the “Trends” section below)
The main barrier to fluff and dust recycling is the variability of its composition, which differs
depending on the input material and the separation technique. For instance, the proportion
of ELV treated by shredder companies typically ranges between 27% and 85%.
Furthermore, the composition of passenger cars is changing over the time96. This hinders
the development of consistent and widely-applicable recycling techniques.
Pollution due to contaminated fluff and dust
There is no evidence of pollution with contaminated fluff and dust.
Trends in fluff & dust management
In an effort to achieve better fuel economy and reduce emissions, automobile
manufacturers are using lighter weight, non-metallic materials. Newer automobiles are
manufactured using less metal, while the use of plastics and other non-ferrous components
is increasing. The net effect leaves shredders with lower volumes of recyclable metal and
greater volumes of auto fluff for disposal or recycling97.
There is potential for improving the recycling rate of the fluff fraction. Since this material
contains a significant portion of fibres, further usage of the material should be considered.
Indeed, fibres exhibit specific properties such as high surface area at low mass, and are
94 http://ec.europa.eu/environment/pops/pdf/Interim_POP_Waste_2010.pdf 95 ADEME (2013) Rapport annuel de la mise en œuvre des dispositions réglementaires relatives aux véhicules hors d'usage : situation en 2012 96 http://www.waste-management-world.com/articles/print/volume-12/issue-2/features/from-fluff-to-stuff-an-economic-solution.html 97 http://autorecyclers.blogspot.fr/2007/07/auto-fluff-what-to-do-with-remaining-25_16.html

117 Study to assess the impacts of different classification approaches for hazard property "HP 14"
on selected waste streams – Final report
thus frequently used as a viscosity modifier or reinforcement agent for several construction
materials96.
6.3.4.2. Economic aspects
No recent data on costs linked to fluff and dust management was found.
6.3.4.3. Social aspects
No data on employment was found.
No public health issue was reported.
6.3.5. Other types of waste
The current classification (baseline) of more than 4 samples of the remaining studied waste
codes could not be determined. These codes are the following: 06 05 02* / 06 05 03, 08
01 13* / 08 01 14, 10 03 19* / 10 03 20, 11 01 09* / 11 01 10, 12 01 14* / 12 01 15, 15 01
10* / 15 01 01 / 15 01 02, 19 08 11* / 19 08 12, 19 08 13* / 19 08 14, 19 12 11* / 19 12 12
(see also Table 46, grey, orange and red cells). This means that the impact assessment
cannot be performed on those codes. There is then no need to describe the current
situation.
6.4. Potential impacts of a change of classification
6.4.1. Overview
The impacts of the different methods depend on three factors:
The percentages of samples changing classification, either from hazardous to
non-hazardous or from non-hazardous to hazardous, among the samples
currently classified under one or the other entry;
The quantities of waste involved in the change of classification;
The environmental, economic and social importance of the waste.
The proportion of samples changing classification was calculated with the number of
samples classified under the source classification as a reference. For instance, a 50% shift
from hazardous to non-hazardous means that 50% of hazardous waste changed their
original classification to non-hazardous with our calculations. This is more relevant than
taking the total number of samples as a reference, because hazardous and non-hazardous
waste are managed in very different ways and would undergo very different impacts98.
Table 46 shows the shifts of classification for the mirror pairs for which data was available
(ten pairs). The most robust results are highlighted in green and are obtained for the four
pairs studied in detail in the previous section. Less robust results include pairs for which
only 2 to 3 samples were available with source classification (in orange) and pairs for which
only 1 sample was available with source classification (in red).
The pair 19 10 03* / 19 10 04 has several samples with a baseline classification, the
majority of them being hazardous. Only one sample of this pair had a baseline classification
as non-hazardous so the shift results corresponding to this sample are highlighted in red
in the table as they are less reliable because of low representativeness.
98 See also the Methodology section.

118 Study to assess the impacts of different classification approaches for hazard property "HP 14"
on selected waste streams – Final report
Table 46: Shifts of classification caused by the four calculation methods
Pair Number of samples
Number of samples with baseline classification
Method 1 Method 2 Method 3 Method 4
Non-haz to haz
Haz to non-haz
Non-haz to haz
Haz to non-haz
Non-haz to haz
Haz to non-haz
Non-haz to haz
Haz to non-haz
06 05 02* / 06 05 03 1 1 0% 100% 0% 100% 0% 0% 0% 100%
08 01 13* / 08 01 14 4 2 0% 0% 0% 0% 0% 0% 0% 0%
10 03 19* / 10 03 20 2 0 ND ND ND ND ND ND ND ND
11 01 09* / 11 01 10 5 4 50.0% 0% 0% 0% 100.0% 0% 0% 0%
12 01 14* / 12 01 15 2 2 0% 0% 0% 50.0% 0% 0% 0% 50.0%
15 01 10* / 15 01 01 / 15 01 02 3 3 0% 0% 0% 66.7% 0% 0% 0% 66.7%
17 05 03* / 17 05 04 21 13 0% 20.0% 0% 100.0% 50.0% 0% 0% 80.0%
19 01 11* / 19 01 12 57 30 14.3% 0% 0% 100.0% 14.3% 0% 0% 87.0%
19 01 13* / 19 01 14 32 31 90.0% 0% 0% 100.0% 90.0% 0% 0% 100.0%
19 08 11* / 19 08 12 3 0 ND ND ND ND ND ND ND ND
19 08 13* / 19 08 14 3 1 0% 100% 0% 100% 0% 0% 0% 100%
19 10 03* / 19 10 04 11 11 100.0% 0% 0% 20.0% 100.0% 0% 100.0% 10.0%
19 12 11* / 19 12 12 4 0 ND ND ND ND ND ND ND ND
Legend
No samples with baseline classification Changes calculated on 1 sample only
Only 1 sample with baseline classification Changes calculated on 2-3 sample only
2-4 samples with baseline classification Changes calculated on more than 5 samples
> 10 samples with baseline classification
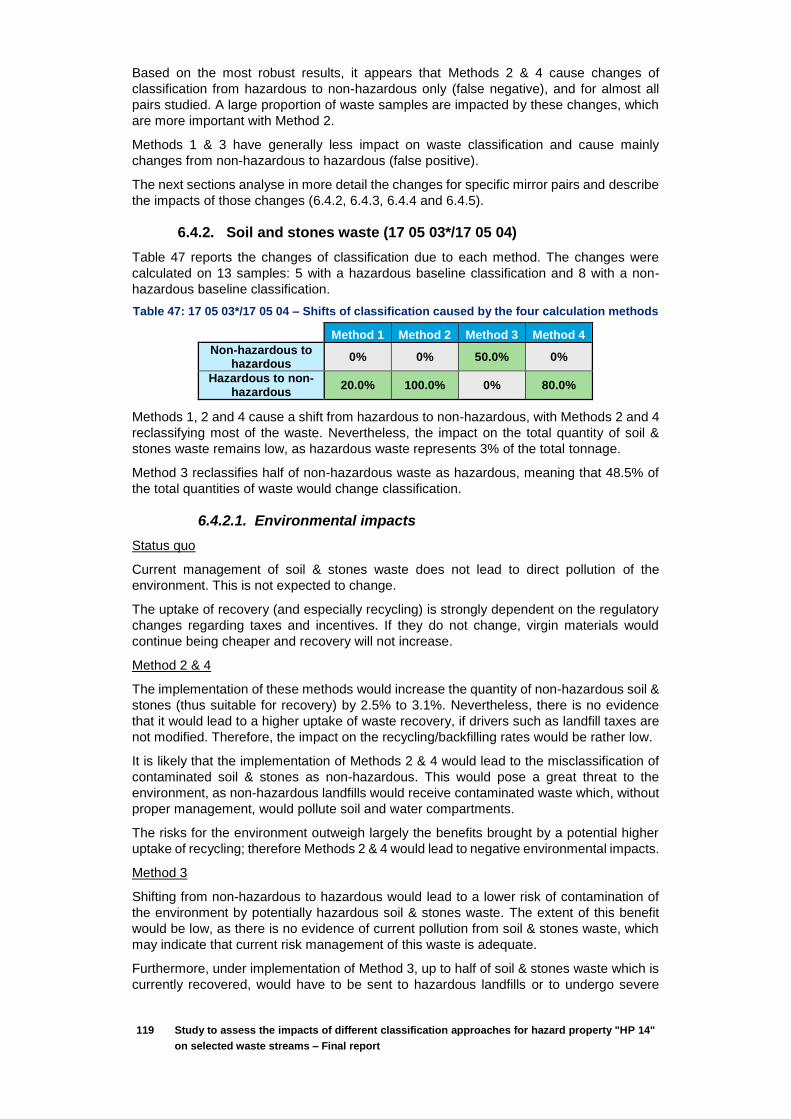
119 Study to assess the impacts of different classification approaches for hazard property "HP 14"
on selected waste streams – Final report
Based on the most robust results, it appears that Methods 2 & 4 cause changes of
classification from hazardous to non-hazardous only (false negative), and for almost all
pairs studied. A large proportion of waste samples are impacted by these changes, which
are more important with Method 2.
Methods 1 & 3 have generally less impact on waste classification and cause mainly
changes from non-hazardous to hazardous (false positive).
The next sections analyse in more detail the changes for specific mirror pairs and describe
the impacts of those changes (6.4.2, 6.4.3, 6.4.4 and 6.4.5).
6.4.2. Soil and stones waste (17 05 03*/17 05 04)
Table 47 reports the changes of classification due to each method. The changes were
calculated on 13 samples: 5 with a hazardous baseline classification and 8 with a non-
hazardous baseline classification.
Table 47: 17 05 03*/17 05 04 – Shifts of classification caused by the four calculation methods
Method 1 Method 2 Method 3 Method 4
Non-hazardous to hazardous
0% 0% 50.0% 0%
Hazardous to non-hazardous
20.0% 100.0% 0% 80.0%
Methods 1, 2 and 4 cause a shift from hazardous to non-hazardous, with Methods 2 and 4
reclassifying most of the waste. Nevertheless, the impact on the total quantity of soil &
stones waste remains low, as hazardous waste represents 3% of the total tonnage.
Method 3 reclassifies half of non-hazardous waste as hazardous, meaning that 48.5% of
the total quantities of waste would change classification.
6.4.2.1. Environmental impacts
Status quo
Current management of soil & stones waste does not lead to direct pollution of the
environment. This is not expected to change.
The uptake of recovery (and especially recycling) is strongly dependent on the regulatory
changes regarding taxes and incentives. If they do not change, virgin materials would
continue being cheaper and recovery will not increase.
Method 2 & 4
The implementation of these methods would increase the quantity of non-hazardous soil &
stones (thus suitable for recovery) by 2.5% to 3.1%. Nevertheless, there is no evidence
that it would lead to a higher uptake of waste recovery, if drivers such as landfill taxes are
not modified. Therefore, the impact on the recycling/backfilling rates would be rather low.
It is likely that the implementation of Methods 2 & 4 would lead to the misclassification of
contaminated soil & stones as non-hazardous. This would pose a great threat to the
environment, as non-hazardous landfills would receive contaminated waste which, without
proper management, would pollute soil and water compartments.
The risks for the environment outweigh largely the benefits brought by a potential higher
uptake of recycling; therefore Methods 2 & 4 would lead to negative environmental impacts.
Method 3
Shifting from non-hazardous to hazardous would lead to a lower risk of contamination of
the environment by potentially hazardous soil & stones waste. The extent of this benefit
would be low, as there is no evidence of current pollution from soil & stones waste, which
may indicate that current risk management of this waste is adequate.
Furthermore, under implementation of Method 3, up to half of soil & stones waste which is
currently recovered, would have to be sent to hazardous landfills or to undergo severe
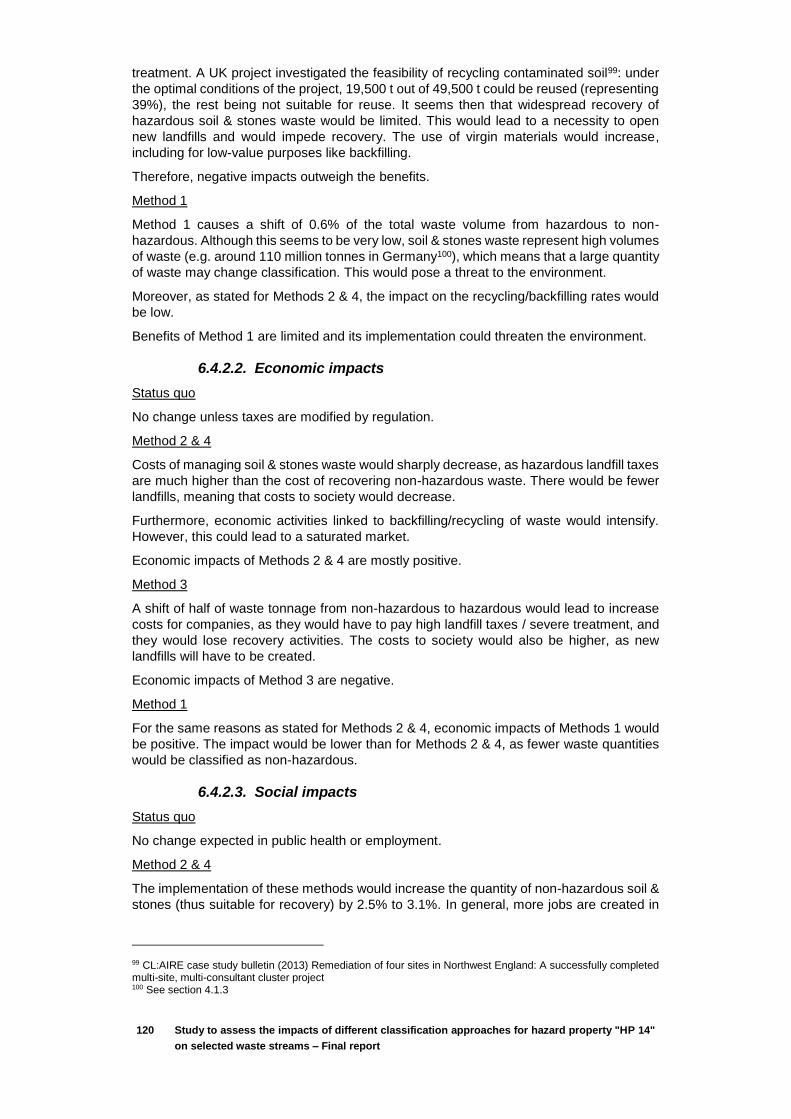
120 Study to assess the impacts of different classification approaches for hazard property "HP 14"
on selected waste streams – Final report
treatment. A UK project investigated the feasibility of recycling contaminated soil99: under
the optimal conditions of the project, 19,500 t out of 49,500 t could be reused (representing
39%), the rest being not suitable for reuse. It seems then that widespread recovery of
hazardous soil & stones waste would be limited. This would lead to a necessity to open
new landfills and would impede recovery. The use of virgin materials would increase,
including for low-value purposes like backfilling.
Therefore, negative impacts outweigh the benefits.
Method 1
Method 1 causes a shift of 0.6% of the total waste volume from hazardous to non-
hazardous. Although this seems to be very low, soil & stones waste represent high volumes
of waste (e.g. around 110 million tonnes in Germany100), which means that a large quantity
of waste may change classification. This would pose a threat to the environment.
Moreover, as stated for Methods 2 & 4, the impact on the recycling/backfilling rates would
be low.
Benefits of Method 1 are limited and its implementation could threaten the environment.
6.4.2.2. Economic impacts
Status quo
No change unless taxes are modified by regulation.
Method 2 & 4
Costs of managing soil & stones waste would sharply decrease, as hazardous landfill taxes
are much higher than the cost of recovering non-hazardous waste. There would be fewer
landfills, meaning that costs to society would decrease.
Furthermore, economic activities linked to backfilling/recycling of waste would intensify.
However, this could lead to a saturated market.
Economic impacts of Methods 2 & 4 are mostly positive.
Method 3
A shift of half of waste tonnage from non-hazardous to hazardous would lead to increase
costs for companies, as they would have to pay high landfill taxes / severe treatment, and
they would lose recovery activities. The costs to society would also be higher, as new
landfills will have to be created.
Economic impacts of Method 3 are negative.
Method 1
For the same reasons as stated for Methods 2 & 4, economic impacts of Methods 1 would
be positive. The impact would be lower than for Methods 2 & 4, as fewer waste quantities
would be classified as non-hazardous.
6.4.2.3. Social impacts
Status quo
No change expected in public health or employment.
Method 2 & 4
The implementation of these methods would increase the quantity of non-hazardous soil &
stones (thus suitable for recovery) by 2.5% to 3.1%. In general, more jobs are created in
99 CL:AIRE case study bulletin (2013) Remediation of four sites in Northwest England: A successfully completed multi-site, multi-consultant cluster project 100 See section 4.1.3
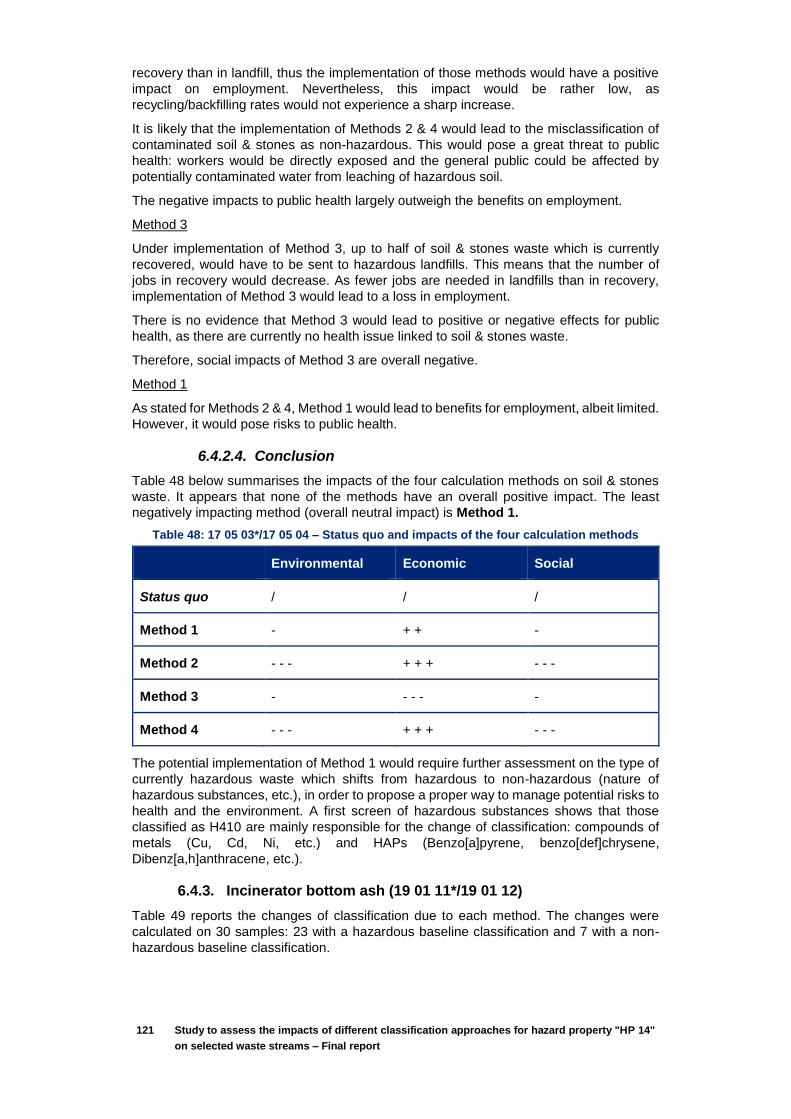
121 Study to assess the impacts of different classification approaches for hazard property "HP 14"
on selected waste streams – Final report
recovery than in landfill, thus the implementation of those methods would have a positive
impact on employment. Nevertheless, this impact would be rather low, as
recycling/backfilling rates would not experience a sharp increase.
It is likely that the implementation of Methods 2 & 4 would lead to the misclassification of
contaminated soil & stones as non-hazardous. This would pose a great threat to public
health: workers would be directly exposed and the general public could be affected by
potentially contaminated water from leaching of hazardous soil.
The negative impacts to public health largely outweigh the benefits on employment.
Method 3
Under implementation of Method 3, up to half of soil & stones waste which is currently
recovered, would have to be sent to hazardous landfills. This means that the number of
jobs in recovery would decrease. As fewer jobs are needed in landfills than in recovery,
implementation of Method 3 would lead to a loss in employment.
There is no evidence that Method 3 would lead to positive or negative effects for public
health, as there are currently no health issue linked to soil & stones waste.
Therefore, social impacts of Method 3 are overall negative.
Method 1
As stated for Methods 2 & 4, Method 1 would lead to benefits for employment, albeit limited.
However, it would pose risks to public health.
6.4.2.4. Conclusion
Table 48 below summarises the impacts of the four calculation methods on soil & stones
waste. It appears that none of the methods have an overall positive impact. The least
negatively impacting method (overall neutral impact) is Method 1.
Table 48: 17 05 03*/17 05 04 – Status quo and impacts of the four calculation methods
Environmental Economic Social
Status quo / / /
Method 1 - + + -
Method 2 - - - + + + - - -
Method 3 - - - - -
Method 4 - - - + + + - - -
The potential implementation of Method 1 would require further assessment on the type of
currently hazardous waste which shifts from hazardous to non-hazardous (nature of
hazardous substances, etc.), in order to propose a proper way to manage potential risks to
health and the environment. A first screen of hazardous substances shows that those
classified as H410 are mainly responsible for the change of classification: compounds of
metals (Cu, Cd, Ni, etc.) and HAPs (Benzo[a]pyrene, benzo[def]chrysene,
Dibenz[a,h]anthracene, etc.).
6.4.3. Incinerator bottom ash (19 01 11*/19 01 12)
Table 49 reports the changes of classification due to each method. The changes were
calculated on 30 samples: 23 with a hazardous baseline classification and 7 with a non-
hazardous baseline classification.

122 Study to assess the impacts of different classification approaches for hazard property "HP 14"
on selected waste streams – Final report
Table 49: 19 01 11*/19 01 12 – Shifts of classification caused by the four calculation methods
Method 1 Method 2 Method 3 Method 4
Non-hazardous to hazardous 14.3% 0% 14.3% 0%
Hazardous to non-hazardous 0% 100.0% 0% 87.0%
Methods 2 and 4 cause a shift from hazardous to non-hazardous, reclassifying most of
hazardous waste. Nevertheless, the impact on the total quantity of IBA remains quite low,
as hazardous waste represents 8% of the total.
Method 1 and 3 reclassifies 14.3% of non-hazardous waste as hazardous, meaning that
around 13% of the total quantities of waste would change classification.
6.4.3.1. Environmental impacts
Status quo
The lack of harmonisation of Member State regulations and the expected stagnation of the
production of IBA would lead to a decrease in the use of recovered IBA in construction
purposes.
Method 2 & 4
The implementation of these methods would increase the quantity of non-hazardous IBA
(thus suitable for recovery) by 7.6% to 8.7%. As IBA currently experiences high rates of
recovery, Methods 2 & 4 would allow for an increase of around 5% of recovered material.
The benefits would then remain limited.
Furthermore, the implementation of Methods 2 & 4 would lead to the misclassification of
contaminated IBA as non-hazardous (as compared to the baseline). This would increase
the risk of leaching of trace elements from IBA used as aggregate in road construction.
The risks for the environment outweigh largely the benefits brought by a potential higher
uptake of recycling; therefore Methods 2 & 4 would lead to negative environmental impacts.
Method 1 & 3
Shifting from non-hazardous to hazardous would lead to a lower risk of contamination of
the environment by potentially hazardous IBA. The extent of this benefit would be low, as
there is no evidence of current pollution from IBA, which may indicate that current risk
management of this waste is adequate. However, Methods 1 & 3 would allow for a
preservation of the current satisfactory state.
Furthermore, under implementation of Methods 1 & 3, around 14% of IBA which is currently
recovered, would have to be sent to hazardous landfills or undergo further treatment. The
low percentage of IBA changing classification would lead to a limited impact on IBA
recovery and landfilling.
Therefore, environmental impacts of Methods 1 & 3 are limited.
6.4.3.2. Economic impacts
Status quo
Trade would continue being hindered by the lack of harmonisation of regulations across
Member States and by the stagnation of quantities of IBA. Furthermore, the fragile
economic models of companies recycling IBA and the reluctance of some Member States
to encourage this activity would likely lead to a decrease of economic activities linked to
IBA recovery.
Method 2 & 4
Costs of managing soil & stones waste would sharply decrease, as IBA disposal costs are
more than twice as much high as recovery costs. There would be fewer landfills, meaning
that costs to society would decrease.

123 Study to assess the impacts of different classification approaches for hazard property "HP 14"
on selected waste streams – Final report
Furthermore, economic activities linked to recovery of IBA (mainly production of IBAA for
road construction) would intensify. However, this could lead to a saturated market.
Economic impacts of Methods 2 & 4 are positive.
Method 1 & 3
A shift of around 14% of waste tonnage from non-hazardous to hazardous would lead to
increase costs for companies, as they would have to pay high landfill taxes / severe
treatment, and they would lose part of recovery activities. The costs to society would also
be higher, as new landfills will have to be created.
Economic impacts of Method 1 & 3 are negative, although rather limited because of the
low percentage of waste involved.
6.4.3.3. Social impacts
Status quo
No significant changes expected
Method 2 & 4
The implementation of Methods 2 & 4 would allow for an increase of around 5% of
recovered material. In general, more jobs are created in recovery than in landfill, thus the
implementation of those methods would have a positive impact on employment.
Nevertheless, this impact would be remain limited, seeing the low percentage of recovered
material.
Furthermore, the implementation of Methods 2 & 4 would lead to the misclassification of
contaminated IBA as non-hazardous. This would pose a great threat to public health:
workers would be directly exposed and the general public could be affected by potentially
contaminated water from hazardous soil.
The negative impacts to public health largely outweigh the benefits on employment.
Method 1 & 3
Under implementation of Methods 1 or 3, around 14% of IBA which is currently recovered,
would have to be sent to hazardous landfills. This means that the number of jobs in
recovery would slightly decrease. As fewer jobs are needed in landfills than in recovery,
implementation of Method 1 or 3 would lead to a loss in employment, albeit limited.
There is no evidence that Method 1 or 3 would lead to benefits for public health, as there
are currently no health issue linked to IBA.
Therefore, social impacts of Methods 1 & 3 are slightly negative.
6.4.3.4. Conclusion
Table 50 below summarises the impacts of the four calculation methods on IBA101. It
appears that none of the methods have an overall positive impact; however, Methods 1 &
3 have better impacts than the status quo.
Table 50: 19 01 11*/19 01 12 – Impacts of the four calculation methods
Environmental Economic Social
Status quo - - /
Method 1 ++ - -
101 Positive impacts of methods 1 & 3 have been heightened by one cross in the limit of three, in order to take into account the benefits of harmonising classification (as this was identified as a driver in section 6.3.2.
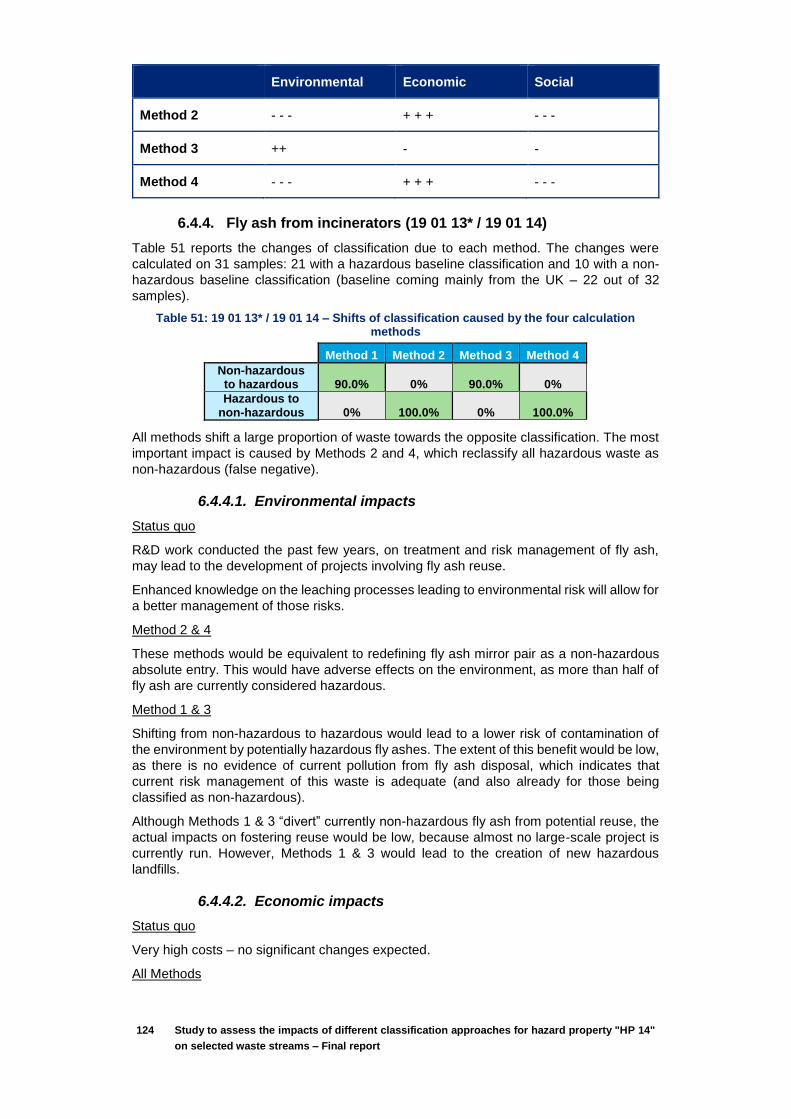
124 Study to assess the impacts of different classification approaches for hazard property "HP 14"
on selected waste streams – Final report
Environmental Economic Social
Method 2 - - - + + + - - -
Method 3 ++ - -
Method 4 - - - + + + - - -
6.4.4. Fly ash from incinerators (19 01 13* / 19 01 14)
Table 51 reports the changes of classification due to each method. The changes were
calculated on 31 samples: 21 with a hazardous baseline classification and 10 with a non-
hazardous baseline classification (baseline coming mainly from the UK – 22 out of 32
samples).
Table 51: 19 01 13* / 19 01 14 – Shifts of classification caused by the four calculation methods
Method 1 Method 2 Method 3 Method 4
Non-hazardous to hazardous 90.0% 0% 90.0% 0%
Hazardous to non-hazardous 0% 100.0% 0% 100.0%
All methods shift a large proportion of waste towards the opposite classification. The most
important impact is caused by Methods 2 and 4, which reclassify all hazardous waste as
non-hazardous (false negative).
6.4.4.1. Environmental impacts
Status quo
R&D work conducted the past few years, on treatment and risk management of fly ash,
may lead to the development of projects involving fly ash reuse.
Enhanced knowledge on the leaching processes leading to environmental risk will allow for
a better management of those risks.
Method 2 & 4
These methods would be equivalent to redefining fly ash mirror pair as a non-hazardous
absolute entry. This would have adverse effects on the environment, as more than half of
fly ash are currently considered hazardous.
Method 1 & 3
Shifting from non-hazardous to hazardous would lead to a lower risk of contamination of
the environment by potentially hazardous fly ashes. The extent of this benefit would be low,
as there is no evidence of current pollution from fly ash disposal, which indicates that
current risk management of this waste is adequate (and also already for those being
classified as non-hazardous).
Although Methods 1 & 3 “divert” currently non-hazardous fly ash from potential reuse, the
actual impacts on fostering reuse would be low, because almost no large-scale project is
currently run. However, Methods 1 & 3 would lead to the creation of new hazardous
landfills.
6.4.4.2. Economic impacts
Status quo
Very high costs – no significant changes expected.
All Methods

125 Study to assess the impacts of different classification approaches for hazard property "HP 14"
on selected waste streams – Final report
Costs for treating fly ash and costs for sending them to hazardous landfills are both very
high. The cost for treating hazardous ashes being higher, Methods 1 & 3 would surely lead
to a great increase of costs.
6.4.4.3. Social impacts
Status quo
No change expected in public health or employment.
Method 2 & 4
The implementation of these methods would increase the quantity of fly ash (thus suitable
for recovery) by 150%. However, as recovery of fly ash is not developed, the impact on
recovery jobs would be very low.
The implementation of Methods 2 & 4 would lead to the misclassification of contaminated
fly ash as non-hazardous. This could potentially increase the risks for public health: workers
would be directly exposed and the general public could be affected by potentially
contaminated water by leaching of ill-managed fly ash.
The negative impacts to public health largely outweigh the benefits on employment.
Method 1 & 3
Under implementation of Method 1 or 3, a large majority of fly ash which is currently
disposed in non-hazardous landfills, would have to be sent to hazardous landfills. This
would not have any significant impact of employment.
There is no evidence that Methods 1 or 3 would lead to benefits for public health, but they
would preserve the current situation.
6.4.4.4. Conclusion
Table 52 below summarises the impacts of the four calculation methods on fly ash. In light
of the few data available, it appears that all would be detrimental compared to the status
quo. Nevertheless, Methods 1 & 3 would be the methods with the most beneficial impacts.
Table 52: 19 01 13* / 19 01 14 – Impacts of the four calculation methods
Environmental Economic Social
Status quo + / /
Method 1 + - - - /
Method 2 - - - - - - -
Method 3 + - - - /
Method 4 - - - - - - -
6.4.5. Fluff-light fraction and dust from shredding of metal-containing waste (19 10 03*/19 10 04)
Table 53 reports the changes of classification due to each method. The changes were
calculated on 11 samples: 10 with a hazardous baseline classification and only 1 with a
non-hazardous baseline classification. Therefore, no valid assessment can be conducted
for changes from non-hazardous to hazardous.

126 Study to assess the impacts of different classification approaches for hazard property "HP 14"
on selected waste streams – Final report
Table 53: 19 10 03*/19 10 04 – Shifts of classification caused by the four calculation methods
Method 1 Method 2 Method 3 Method 4
Non-hazardous to hazardous n/a n/a n/a n/a
Hazardous to non-hazardous 0% 20.0% 0% 10.0%
Method 1 and 3 do not impact the classification of hazardous streams: thus, their impact
cannot be assessed (see above). Methods 2 and 4 lead to a reclassification of 20% and
10% (respectively) of waste from hazardous to non-hazardous.
Status quo
With the relevant EU directives setting targets for recycling, the uptake of recovery of fluff
and dust is expected to increase. This will reduce the amount of this waste being sent to
landfills and thus benefit the environment.
Method 2 & 4
The implementation of those methods would likely increase the quantities of waste to be
recycled by a few percent. However, it would pose a risk for the environment and public
health (potentially hazardous substances could contaminate soil & water).
No conclusion can be reached regarding the impacts of the four calculations methods on
fluff and dust; mainly because of lack of data on non-hazardous samples and lack of data
on economic and social aspects.
6.5. Conclusion
This semi-qualitative, preliminary impact assessment, highlights that, for the 3 mirror pairs
assessed, the same relevant methods were identified: Methods 1 & 3. Method 1 was
preferred for the soil & stones waste stream.
Environmental Economic Social
Soil and stones waste (17 05 03*/17 05 04)
Status quo / / /
Method 1 - + + -
Method 2 - - - + + + - - -
Method 3 - - - - -
Method 4 - - - + + + - - -
Incinerator bottom ash (19 01 11*/19 01 12)
Status quo - - /
Method 1 ++ - -
Method 2 - - - + + + - - -
Method 3 ++ - -
Method 4 - - - + + + - - -

127 Study to assess the impacts of different classification approaches for hazard property "HP 14"
on selected waste streams – Final report
Environmental Economic Social
Soil and stones waste (17 05 03*/17 05 04)
Fly ash from incinerators (19 01 13* / 19 01 14)
Status quo + NA /
Method 1 + NA /
Method 2 - - - NA - - -
Method 3 + NA /
Method 4 - - - NA - - -
Apart from the benefits provided by a harmonised approach across Member States,
positive impacts from Methods 1 & 3 are mainly environmental and economic., although
they are likely to have negative economic impacts on some operators.

128 Study to assess the impacts of different classification approaches for hazard property "HP 14"
on selected waste streams – Final report
This page was left intentionally blank
129 Study to assess the impacts of different classification approaches for hazard property "HP 14"
on selected waste streams – Final report
7. Conclusions and
recommendations
7.1. Lack of harmonisation of current approaches for assessing HP 14
The study of a sample of nine Member States showed the lack of
harmonisation in the EU regarding the methods for assessment of HP 14.
o Even within Member States that apply calculation methods, calculation
approaches vary and are based on different regulatory texts (based on
the DPD, the ADR or the CLP);
o Similarly, biotest protocols differ within Member States that carry out
this approach: different batteries of tests are applied (some are only
aquatic, other both aquatic and terrestrial, test organisms vary) and
different thresholds are used;
o 2 Member States carry out combined approaches, using calculation
methods when the composition of the waste is known and biotests if
not.
Based on declarations of competent authorities and stakeholders, Member
States seem to be committed to their approaches.
Therefore it would seem that the use of very different approaches to waste
classification leads, for mirror entries where an investigation is required to
discriminate between hazardous and non-hazardous waste, to a situation
where wastes may be classified differently depending on the Member State
where the waste is produced. This has negative consequences upon the
transfrontier movement of waste and creates a distortion of the internal market,
not only as regards the trading in waste itself, but also as regards the waste
management costs associated to the industrial activities associated (and
therefore potentially affecting the competitiveness of the affected sectors).
7.2. Conclusion on the most relevant calculation method for the assessment of HP14: Method 1 seems to be the most relevant for waste classification
Four calculation methods were proposed by the European Commission to be
compared in terms of changes of classifications and impacts:
o 2 calculation methods including M-factors (Methods 2 & 4)
o 2 calculation methods based on the CLP regulation (Methods 1 & 4)
The comparative assessment of the four calculation methods on a selected
sample of mirror pairs was limited by limitations in data availability and quality.
Nevertheless, results of the comparison between the 4 calculation methods
give some indication that Method 1 is the most relevant:

130 Study to assess the impacts of different classification approaches for hazard property "HP 14"
on selected waste streams – Final report
o Good concordance with current classification (baseline) and
classification based on biotest results – with a proposed threshold of
10% for EC50s102;
o Aligned with the CLP;
o Reasonable environmental, social and economic impacts of its
implementation.
7.3. Recommendations on next steps
In compliance with the Terms of Reference, this study focused on calculation
methods; however, a combined approach has been recommended by several
experts to optimise the accuracy of hazard classification and offset limitations
of both calculation and biotests methods alone. Nevertheless, there will be a
need to derive a harmonised threshold value for use biotests in waste
classification for code HP 14, as well as the definition of a minimum test
battery. Further to this, political agreement on the proposal would have to be
sought. Some work is currently performed in some MS to propose threshold
values using test results obtained on non-hazardous absolute entries as a
benchmark.
In compliance with the Terms of Reference, this study was focussed on mirror
pair entries to carry out the comparison of the 4 calculation methods. However,
some similar work has been carried out in parallel by the French Ministry of
Ecology, but included also absolutes entries. This additional study is
interesting and complementary to our study, as absolute entries could be used
in support of a model (and more especially non-hazardous absolute entries103).
The French study, presented in Annex 6, used the same 4 calculation
methods, plus an additional one: “Method 2 with extended M-factors”, using
not only M-factors from the Table 3.1 of Annex VI of the CLP regulation, but
also those calculated by Hennebert and Rebischung (2013)104. The results of
both studies are consistent, with Method 1 having the best results of the 4
proposed calculation methods.
The potential use of M-factors not listed in the Table 3.1 of Annex VI of the
CLP regulation has triggered a lot of debates during the workshops. Pros and
cons have been expressed and particular emphasis was placed on the lack of
harmonised methods to calculate new M-factors.
102 Please note that this threshold is not agreed yet at European level. 103 Absolute hazardous entries could have been classified as hazardous because of other HP criterion, and not necessarily for HP 14. 104 Hennebert P, Rebischung F. 2013. Waste Hazardousness Assessment - Proposition of methods. Report INERIS- DRC-13-136159-04172A- 69 pp. http://www.ineris.fr/centredoc/drc-13-136159-04172ahazardous- waste-assessment-f3-1379929842.pdf
131 Study to assess the impacts of different classification approaches for hazard property "HP 14"
on selected waste streams – Final report
8. Annexes
ANNEX 1. FIRST QUESTIONNAIRE SENT TO COMPETENT AUTHORITIES __________ 132
1.1. List of contacts ____________________________________________________ 132
1.2. The Questionnaire _________________________________________________ 132
ANNEX 2. FACTSHEETS ____________________________________________ 136
ANNEX 3. SECOND QUESTIONNAIRE SENT TO COMPETENT AUTHORITIES ________ 175
ANNEX 4. QUESTIONNAIRE SENT TO INDUSTRIAL STAKEHOLDERS FOR THE IMPACT
ASSESSMENT 187
ANNEX 5. APPLICATION OF THE CALCULATION METHODS ____________________ 195
ANNEX 6. STUDY FROM THE FRENCH MINISTRY OF ECOLOGY ________________ 196

132 Study to assess different approaches for H14 | Questionnaire
Annex 1. First Questionnaire
sent to Competent Authorities
1.1. List of contacts
Table 54: Experts who contributed (in grey: Member States who did not contribute)
Member State Expert(s) who contributed
Austria Sonja Loew
Belgium Evi Rossi
Czech Republic Jaromir Manhart
Finland Eevaleena Häkkinen
Germany Joachim Wuttke
Walter Adebahr
Spain Margarita Ruiz Sáiz-Aja (and colleagues)
UK Robert McIntyre
France Pauline Ardaine Langeron
Italy Daniela Conti
Andrea Paina
Stefania Balzamo
1.2.The Questionnaire
1. General information
1.1 Your full name and your email address:
_______________________________________________________________________
1.2 Please provide the name of the organisation to which you belong:
______________________________________________________________________
And its type (bold the right answer):
o National authority
o Research institute
o Industry
o Other (please specify):
________________________________________________________________
1.3 Your country (bold the right answer):
o AT – Austria
o BE – Belgium
o CZ – Czech Republic
o FI – Finland
o FR – France
o IT - Italy

133 Study to assess different approaches for H14 | Questionnaire
o DE – Germany
o ES – Spain
o PL - Poland
o UK - United Kingdom
1.4 Type of waste your expertise covers (bold the right answer):
o All
o Specific
Provide a general description of waste categories you cover or waste codes
when relevant:
_____________________________________________________________
2. Approaches for assessing the H14 property of waste in your country
2.1 Type of approach (bold the right answer):
o Calculation method
Approach based on limit values (based on CLP or DPD limits)
Specify protocol details and applicable limit values:
__________________________________________________________
Approach not based on limit values
Specify details of the protocol:
___________________________________________________________
o Approach based on biotesting
Specify protocol details for the approach based on biotesting and
applicable limit values:
___________________________________________________________
Type of test
Test organism
Endpoint Test method Test duration
Expression of results
Threshold value
Terrestrial
Aquatic
o Combined approach
Specify protocol details and applicable limit values (e.g. priority given to
calculation method or experimental approach? Systematic or partial
implementation of biotests? Ecotoxicity based approach applied to all type
of waste or to some of them?):
___________________________________________________________
o Other
Specify protocol details:
________________________________________________________

134 Study to assess different approaches for H14 | Questionnaire
2.2. Please provide sources of information (for example guidelines) for the H14
assessment methods and protocols (a preliminary list – to be reviewed and completed - is
available in the attached document named Attachment 1 - Preliminary list of relevant
legislation and guidelines):
______________________________________________________________________
2.3. Please provide examples of application of your H14 assessment method on 1 or 2
waste types / waste codes (to be chosen from the list available in the attached document
named Attachment 2 - List of waste codes):
______________________________________________________________________
2.4 According to your knowledge, what are the limits and uncertainties of the approach?
______________________________________________________________________
2.5. What are the advantages?
______________________________________________________________________
2.6. Please provide relevant national legislation or guidelines for the H14 assessment
methods and protocols (a preliminary list – to be reviewed and completed - is available in
the attached document named Attachment 1 - Preliminary list of relevant legislation and
guidelines):
______________________________________________________________________
2.7. Please indicate the stakeholders involved in the assessment:
Stakeholder role Name of stakeholder Type of stakeholder (national authority, research institute, etc.)
Funding Performing the test(s), Providing waste samples Other (please specify in comments)
2.8. Please provide examples of costs linked to the H14 assessment methods used in your
country:
______________________________________________________________________
3. Proposal for the selection of waste streams
The project team will test four calculation options on a set of 50 pairs of mirror waste codes
(mirror pairs), to be selected from the list in the attached document. The following questions
aim at prioritising the waste streams to select.
3.1 On which specific waste streams do you think the present study comparing assessing
methods for H14 should focus on?
_______________________________________________________________________
3.2 Why? Choose one or more reasons below (bold the right answer):
o Availability and quality of existing data
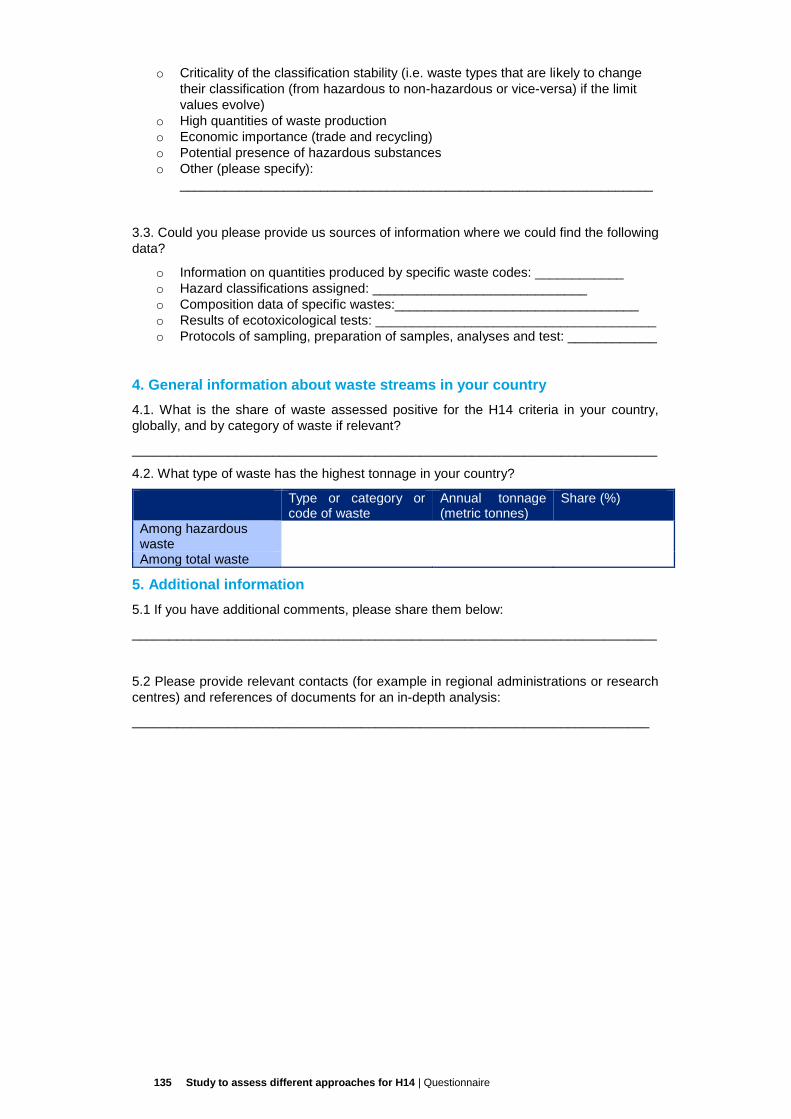
135 Study to assess different approaches for H14 | Questionnaire
o Criticality of the classification stability (i.e. waste types that are likely to change
their classification (from hazardous to non-hazardous or vice-versa) if the limit
values evolve)
o High quantities of waste production
o Economic importance (trade and recycling)
o Potential presence of hazardous substances
o Other (please specify):
________________________________________________________________
3.3. Could you please provide us sources of information where we could find the following
data?
o Information on quantities produced by specific waste codes: ____________
o Hazard classifications assigned: _____________________________
o Composition data of specific wastes:_________________________________
o Results of ecotoxicological tests: ______________________________________
o Protocols of sampling, preparation of samples, analyses and test: ____________
4. General information about waste streams in your country
4.1. What is the share of waste assessed positive for the H14 criteria in your country,
globally, and by category of waste if relevant?
_______________________________________________________________________
4.2. What type of waste has the highest tonnage in your country?
Type or category or code of waste
Annual tonnage (metric tonnes)
Share (%)
Among hazardous waste
Among total waste
5. Additional information
5.1 If you have additional comments, please share them below:
_______________________________________________________________________
5.2 Please provide relevant contacts (for example in regional administrations or research
centres) and references of documents for an in-depth analysis:
______________________________________________________________________

136 Study to assess different approaches for H14 | Questionnaire
Annex 2. Factsheets
AUSTRIA
National approach to assess H14 (ecotoxicity) of wastes
Type of approach(es)
used in the country to
assess H14 property of
waste
Combined approach
Refer to the ADR (UN classification of dangerous goods for road transport) for
ecotoxic substances class 9 : M6 and M7, AND have a limit for ozone depleting
substances (2000 mg/kg in total)
Variability in H14
assessment methods
depending on the waste
nature
-
Related legislation and
guidelines
Legislation Fed. Law Gaz No. 522/1973 as amended by Fed
Law Gaz III No. 36/2
Annex 3 of Abfallverzeichnisverordnung BGBl II
(Austrian Ordinance of Waste Classification)
2003/570 idgF
Guidelines None
Stakeholders involved
in the H14 assessment
Waste with highest
tonnage
Waste with highest tonnage 17 05 04 excav. Soil 23,5 Mio t
17 09 04 C&D waste 6,6 Mio t
19 01 14 filter dust -
10 02 08 gas cleaning(Fe) –
Approx. 53,6 million tons of waste are generated in
Austria, thereof approx. 1 million ton of hazardous
waste (Data 2009)
From Eurostat:
Waste from construction : 57%, 19.5 Mt
Hazardous waste with
highest tonnage
17 05 03*excav, soil haz. 128.260 t
10 02 07 gas cleaning(Fe) 82.823 t
19 01 13* filter dust haz 48.141 t
17 09 03* C&D waste haz -
From Eurostat:
10-11-12 : Inorganic wastes from thermal
processes + Inorganic metal-containing wastes
from metal treatment and the coating of metals, and
non-ferrous hydrometallurgy + Wastes from
shaping and surface treatment of metals and
plastics (32%, 272.7 kt)
19 : Waste from waste treatment facilities, off-site
waste water treatment plants and the water
industry (23%, 200.7 kt)
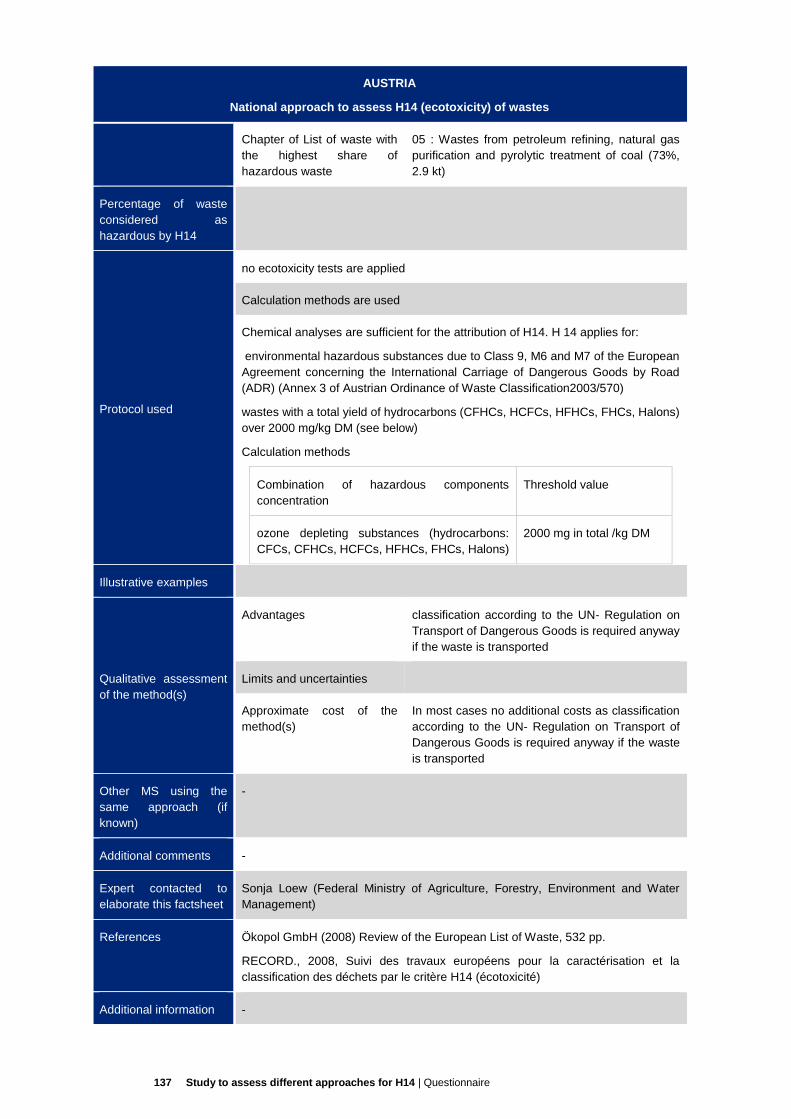
137 Study to assess different approaches for H14 | Questionnaire
AUSTRIA
National approach to assess H14 (ecotoxicity) of wastes
Chapter of List of waste with
the highest share of
hazardous waste
05 : Wastes from petroleum refining, natural gas
purification and pyrolytic treatment of coal (73%,
2.9 kt)
Percentage of waste
considered as
hazardous by H14
Protocol used
no ecotoxicity tests are applied
Calculation methods are used
Chemical analyses are sufficient for the attribution of H14. H 14 applies for:
environmental hazardous substances due to Class 9, M6 and M7 of the European
Agreement concerning the International Carriage of Dangerous Goods by Road
(ADR) (Annex 3 of Austrian Ordinance of Waste Classification2003/570)
wastes with a total yield of hydrocarbons (CFHCs, HCFCs, HFHCs, FHCs, Halons)
over 2000 mg/kg DM (see below)
Calculation methods
Combination of hazardous components
concentration
Threshold value
ozone depleting substances (hydrocarbons:
CFCs, CFHCs, HCFCs, HFHCs, FHCs, Halons)
2000 mg in total /kg DM
Illustrative examples
Qualitative assessment
of the method(s)
Advantages classification according to the UN- Regulation on
Transport of Dangerous Goods is required anyway
if the waste is transported
Limits and uncertainties
Approximate cost of the
method(s)
In most cases no additional costs as classification
according to the UN- Regulation on Transport of
Dangerous Goods is required anyway if the waste
is transported
Other MS using the
same approach (if
known)
-
Additional comments -
Expert contacted to
elaborate this factsheet
Sonja Loew (Federal Ministry of Agriculture, Forestry, Environment and Water
Management)
References Ökopol GmbH (2008) Review of the European List of Waste, 532 pp.
RECORD., 2008, Suivi des travaux européens pour la caractérisation et la
classification des déchets par le critère H14 (écotoxicité)
Additional information -
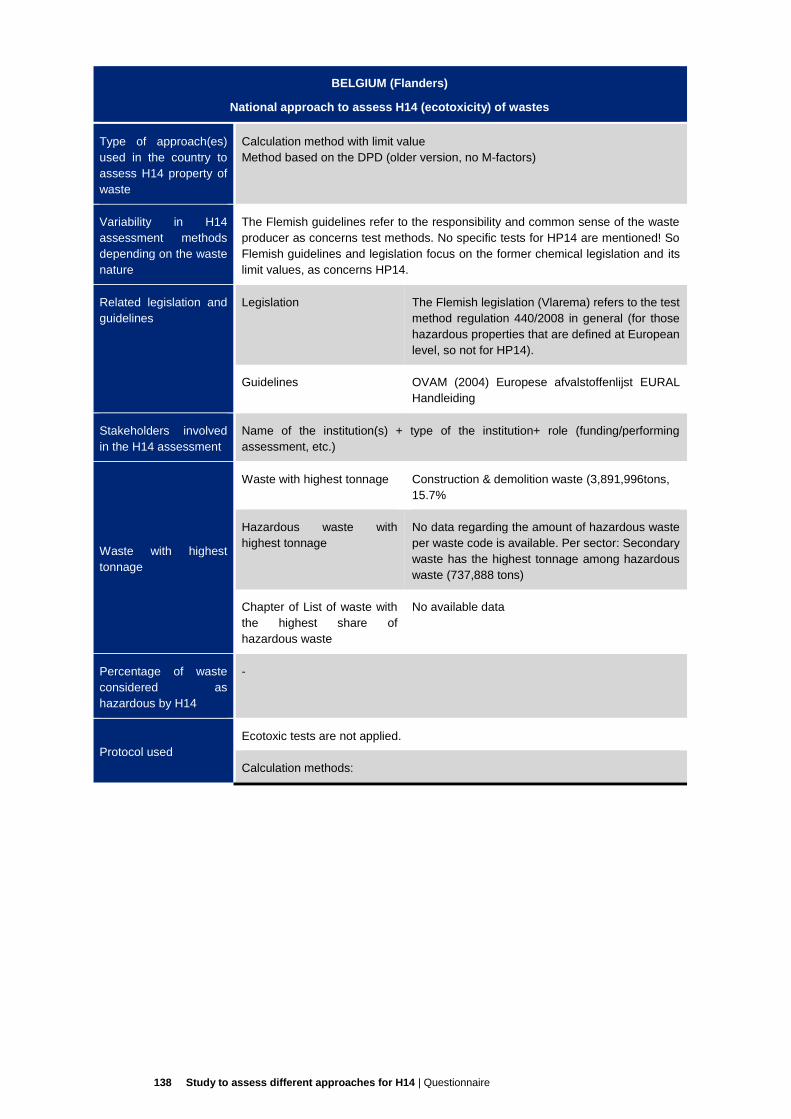
138 Study to assess different approaches for H14 | Questionnaire
BELGIUM (Flanders)
National approach to assess H14 (ecotoxicity) of wastes
Type of approach(es)
used in the country to
assess H14 property of
waste
Calculation method with limit value
Method based on the DPD (older version, no M-factors)
Variability in H14
assessment methods
depending on the waste
nature
The Flemish guidelines refer to the responsibility and common sense of the waste
producer as concerns test methods. No specific tests for HP14 are mentioned! So
Flemish guidelines and legislation focus on the former chemical legislation and its
limit values, as concerns HP14.
Related legislation and
guidelines
Legislation The Flemish legislation (Vlarema) refers to the test
method regulation 440/2008 in general (for those
hazardous properties that are defined at European
level, so not for HP14).
Guidelines OVAM (2004) Europese afvalstoffenlijst EURAL
Handleiding
Stakeholders involved
in the H14 assessment
Name of the institution(s) + type of the institution+ role (funding/performing
assessment, etc.)
Waste with highest
tonnage
Waste with highest tonnage Construction & demolition waste (3,891,996tons,
15.7%
Hazardous waste with
highest tonnage
No data regarding the amount of hazardous waste
per waste code is available. Per sector: Secondary
waste has the highest tonnage among hazardous
waste (737,888 tons)
Chapter of List of waste with
the highest share of
hazardous waste
No available data
Percentage of waste
considered as
hazardous by H14
-
Protocol used
Ecotoxic tests are not applied.
Calculation methods:

139 Study to assess different approaches for H14 | Questionnaire
BELGIUM (Flanders)
National approach to assess H14 (ecotoxicity) of wastes
Individual substances
Classification Concentration limits
R50 25
R50-53 0.25
R51-53 2.5
R52-53 25
R52 25
R53 25
R59 0.1
Combination of substances
Classification Concentration
threshold to be taken
into account
Conditions rendering
waste hazardous
R50 0.1 •Sum of R50-53
substances >2.5%
•Sum of R51-53>25%
•Sum of R50
substances>25%
•Sum of R59
substances >0.1%
R50-53 0.1
R51-53 0.1
R52-53 1
R52 1
R53 1
R59 0.1
Illustrative examples -
Advantages Easy to perform on well-defined samples
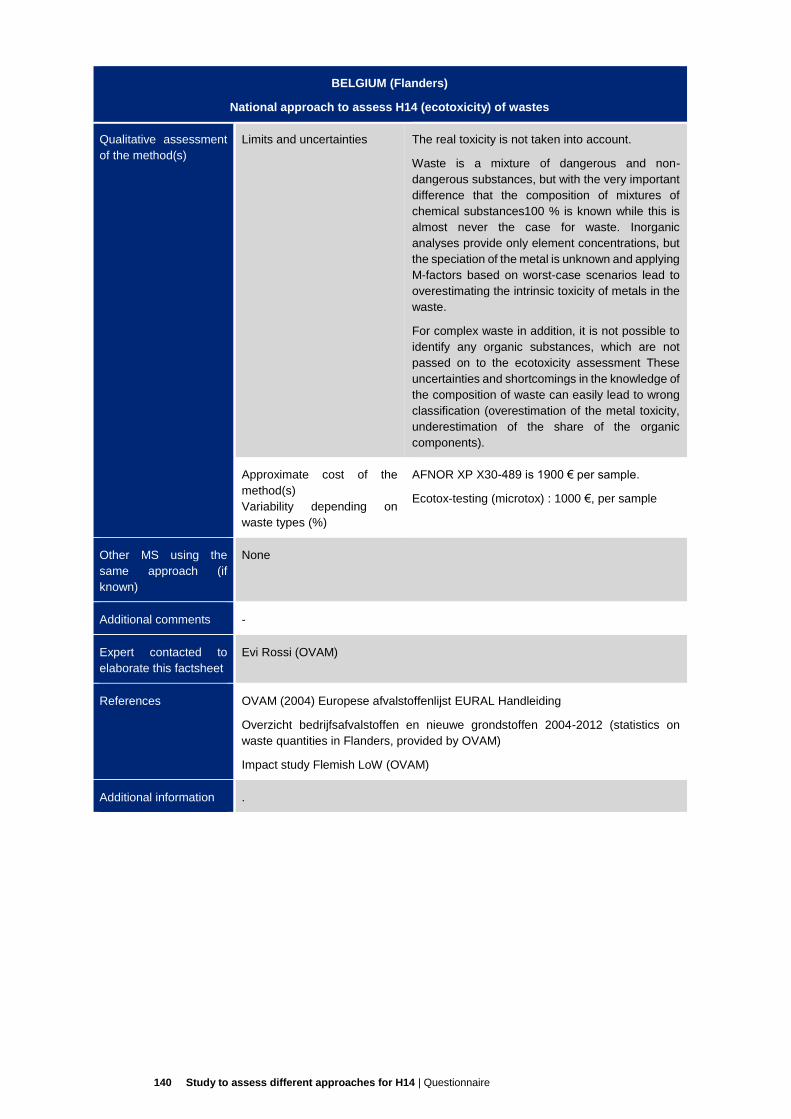
140 Study to assess different approaches for H14 | Questionnaire
BELGIUM (Flanders)
National approach to assess H14 (ecotoxicity) of wastes
Qualitative assessment
of the method(s)
Limits and uncertainties The real toxicity is not taken into account.
Waste is a mixture of dangerous and non-
dangerous substances, but with the very important
difference that the composition of mixtures of
chemical substances100 % is known while this is
almost never the case for waste. Inorganic
analyses provide only element concentrations, but
the speciation of the metal is unknown and applying
M-factors based on worst-case scenarios lead to
overestimating the intrinsic toxicity of metals in the
waste.
For complex waste in addition, it is not possible to
identify any organic substances, which are not
passed on to the ecotoxicity assessment These
uncertainties and shortcomings in the knowledge of
the composition of waste can easily lead to wrong
classification (overestimation of the metal toxicity,
underestimation of the share of the organic
components).
Approximate cost of the
method(s)
Variability depending on
waste types (%)
AFNOR XP X30-489 is 1900 € per sample.
Ecotox-testing (microtox) : 1000 €, per sample
Other MS using the
same approach (if
known)
None
Additional comments -
Expert contacted to
elaborate this factsheet
Evi Rossi (OVAM)
References OVAM (2004) Europese afvalstoffenlijst EURAL Handleiding
Overzicht bedrijfsafvalstoffen en nieuwe grondstoffen 2004-2012 (statistics on
waste quantities in Flanders, provided by OVAM)
Impact study Flemish LoW (OVAM)
Additional information .
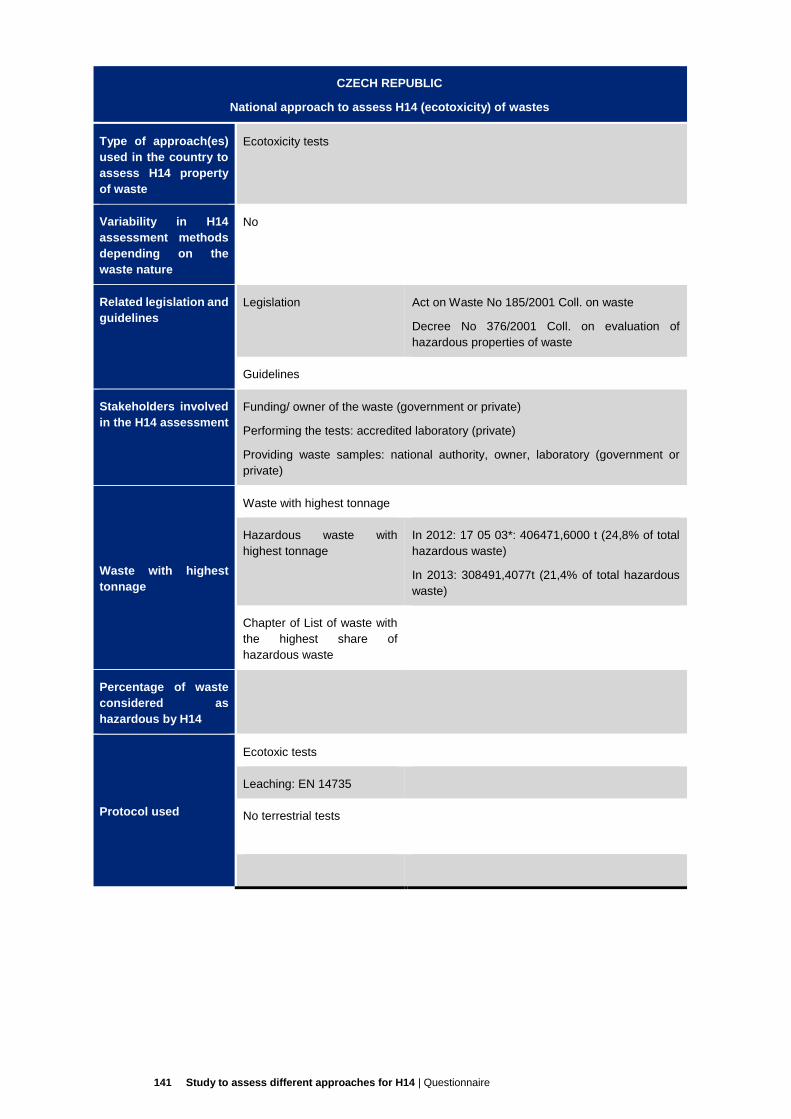
141 Study to assess different approaches for H14 | Questionnaire
CZECH REPUBLIC
National approach to assess H14 (ecotoxicity) of wastes
Type of approach(es)
used in the country to
assess H14 property
of waste
Ecotoxicity tests
Variability in H14
assessment methods
depending on the
waste nature
No
Related legislation and
guidelines
Legislation Act on Waste No 185/2001 Coll. on waste
Decree No 376/2001 Coll. on evaluation of
hazardous properties of waste
Guidelines
Stakeholders involved
in the H14 assessment
Funding/ owner of the waste (government or private)
Performing the tests: accredited laboratory (private)
Providing waste samples: national authority, owner, laboratory (government or
private)
Waste with highest
tonnage
Waste with highest tonnage
Hazardous waste with
highest tonnage
In 2012: 17 05 03*: 406471,6000 t (24,8% of total
hazardous waste)
In 2013: 308491,4077t (21,4% of total hazardous
waste)
Chapter of List of waste with
the highest share of
hazardous waste
Percentage of waste
considered as
hazardous by H14
Protocol used
Ecotoxic tests
Leaching: EN 14735
No terrestrial tests

142 Study to assess different approaches for H14 | Questionnaire
CZECH REPUBLIC
National approach to assess H14 (ecotoxicity) of wastes
Aquatic tests
Test
organism
Endpoi
nt
Test
method
Test
duration
Expres
sion of
results
Thresh
old
value
Sinapis
alba
root
length
Instructio
ns
(Bulletin
of
Ministry
of
Environm
ent CR)
3 days EC50 10 ml/l
Desmode
smus
subspicat
us
growth EN ISO
8692
3 days EC50 10 ml/l
Daphnia
magna
mobilit
y
EN ISO
6341
2 days EC50 10 ml/l
Poecilia
reticulata
lethal
effect
EN ISO
7346-2
4 days EC50 10 ml/l
No calculation methods

143 Study to assess different approaches for H14 | Questionnaire
CZECH REPUBLIC
National approach to assess H14 (ecotoxicity) of wastes
Illustrative examples
Waste
Decree No. 376/2001 Coll.
Chemical
limits Ecotoxicity
Exceeded
limit
Exceeded
limit
Contaminated soil from wood preservation plant
No Yes - algea
Contaminated soil (metals, PAHs, sludge from wastewater treatment plant)
No No
sludge from mechanical industrial wastewater treatment plant
No No
ash from thermal electric power station
No No
Contaminated soil No No
sludge No No
ash Yes - pH No
stabilized waste No No
Qualitative
assessment of the
method(s)
Advantages Aquatic ecotoxicity tests are sensitive to many
water soluble substances. Wastes are usually
materials of heterogenic composition. Ecotoxicity
tests integrate the effects of all contaminants
including additive, synergistic and antagonistic
effects. Waste can be evaluated in a relatively short
time (within 2 weeks).
Limits and uncertainties All tests are carried out only with water extract
(leachate). The results are relevant only for water
ecosystems but the hazard for soil ecosystem has
not been included. To improve the current state,
introduction of terrestrial tests from the EC would
be helpful.
Approximate cost of the
method(s)
Variability depending on
waste types (%)
Approx. CZK 11000,- (EUR 410,-)
Other MS using the
same approach (if
known)
Similar to Spain (only aquatic tests)
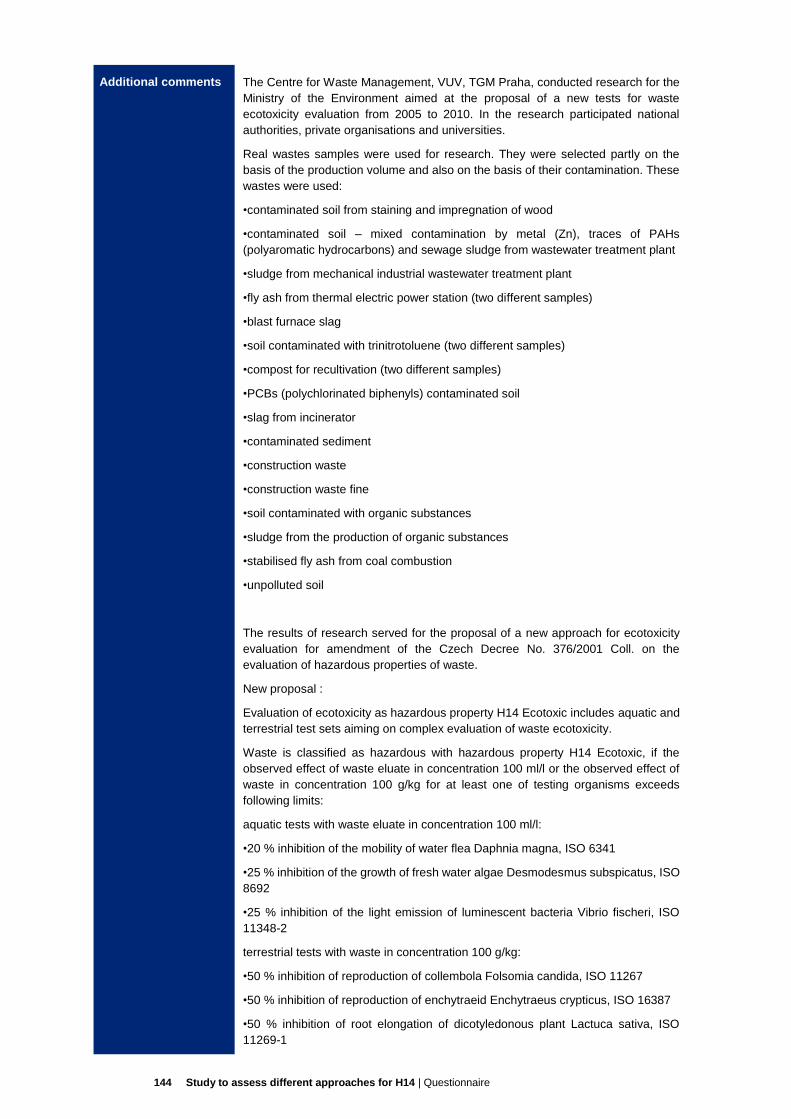
144 Study to assess different approaches for H14 | Questionnaire
Additional comments The Centre for Waste Management, VUV, TGM Praha, conducted research for the
Ministry of the Environment aimed at the proposal of a new tests for waste
ecotoxicity evaluation from 2005 to 2010. In the research participated national
authorities, private organisations and universities.
Real wastes samples were used for research. They were selected partly on the
basis of the production volume and also on the basis of their contamination. These
wastes were used:
•contaminated soil from staining and impregnation of wood
•contaminated soil – mixed contamination by metal (Zn), traces of PAHs
(polyaromatic hydrocarbons) and sewage sludge from wastewater treatment plant
•sludge from mechanical industrial wastewater treatment plant
•fly ash from thermal electric power station (two different samples)
•blast furnace slag
•soil contaminated with trinitrotoluene (two different samples)
•compost for recultivation (two different samples)
•PCBs (polychlorinated biphenyls) contaminated soil
•slag from incinerator
•contaminated sediment
•construction waste
•construction waste fine
•soil contaminated with organic substances
•sludge from the production of organic substances
•stabilised fly ash from coal combustion
•unpolluted soil
The results of research served for the proposal of a new approach for ecotoxicity
evaluation for amendment of the Czech Decree No. 376/2001 Coll. on the
evaluation of hazardous properties of waste.
New proposal :
Evaluation of ecotoxicity as hazardous property H14 Ecotoxic includes aquatic and
terrestrial test sets aiming on complex evaluation of waste ecotoxicity.
Waste is classified as hazardous with hazardous property H14 Ecotoxic, if the
observed effect of waste eluate in concentration 100 ml/l or the observed effect of
waste in concentration 100 g/kg for at least one of testing organisms exceeds
following limits:
aquatic tests with waste eluate in concentration 100 ml/l:
•20 % inhibition of the mobility of water flea Daphnia magna, ISO 6341
•25 % inhibition of the growth of fresh water algae Desmodesmus subspicatus, ISO
8692
•25 % inhibition of the light emission of luminescent bacteria Vibrio fischeri, ISO
11348-2
terrestrial tests with waste in concentration 100 g/kg:
•50 % inhibition of reproduction of collembola Folsomia candida, ISO 11267
•50 % inhibition of reproduction of enchytraeid Enchytraeus crypticus, ISO 16387
•50 % inhibition of root elongation of dicotyledonous plant Lactuca sativa, ISO
11269-1
145 Study to assess different approaches for H14 | Questionnaire
CZECH REPUBLIC
National approach to assess H14 (ecotoxicity) of wastes
Expert contacted to
elaborate this
factsheet
Mr. Jaromír Manhart, [email protected]
Ms. Eva Kubova, [email protected]
References Ministerstvo životního prostředí české republiky (2007) Metodický pokyn odboru
odpadů ke stanovení ekotoxicity odpadů
Additional information
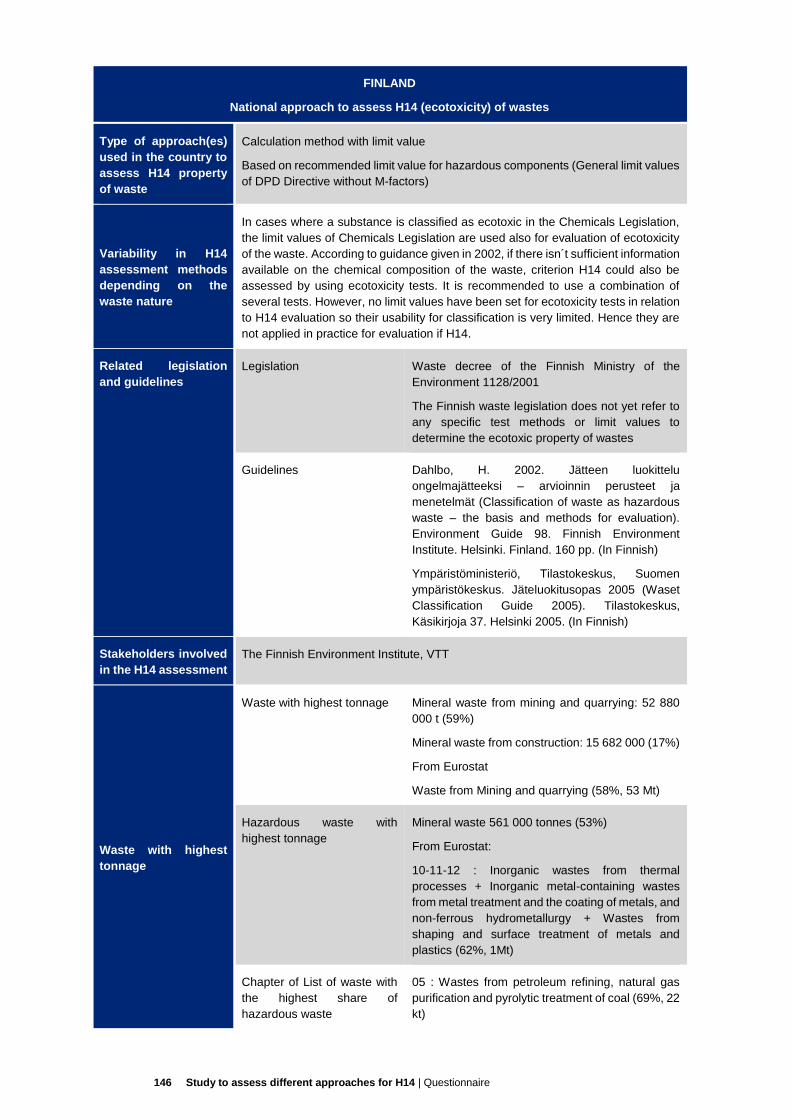
146 Study to assess different approaches for H14 | Questionnaire
FINLAND
National approach to assess H14 (ecotoxicity) of wastes
Type of approach(es)
used in the country to
assess H14 property
of waste
Calculation method with limit value
Based on recommended limit value for hazardous components (General limit values
of DPD Directive without M-factors)
Variability in H14
assessment methods
depending on the
waste nature
In cases where a substance is classified as ecotoxic in the Chemicals Legislation,
the limit values of Chemicals Legislation are used also for evaluation of ecotoxicity
of the waste. According to guidance given in 2002, if there isn´t sufficient information
available on the chemical composition of the waste, criterion H14 could also be
assessed by using ecotoxicity tests. It is recommended to use a combination of
several tests. However, no limit values have been set for ecotoxicity tests in relation
to H14 evaluation so their usability for classification is very limited. Hence they are
not applied in practice for evaluation if H14.
Related legislation
and guidelines
Legislation Waste decree of the Finnish Ministry of the
Environment 1128/2001
The Finnish waste legislation does not yet refer to
any specific test methods or limit values to
determine the ecotoxic property of wastes
Guidelines Dahlbo, H. 2002. Jätteen luokittelu
ongelmajätteeksi – arvioinnin perusteet ja
menetelmät (Classification of waste as hazardous
waste – the basis and methods for evaluation).
Environment Guide 98. Finnish Environment
Institute. Helsinki. Finland. 160 pp. (In Finnish)
Ympäristöministeriö, Tilastokeskus, Suomen
ympäristökeskus. Jäteluokitusopas 2005 (Waset
Classification Guide 2005). Tilastokeskus,
Käsikirjoja 37. Helsinki 2005. (In Finnish)
Stakeholders involved
in the H14 assessment
The Finnish Environment Institute, VTT
Waste with highest
tonnage
Waste with highest tonnage Mineral waste from mining and quarrying: 52 880
000 t (59%)
Mineral waste from construction: 15 682 000 (17%)
From Eurostat
Waste from Mining and quarrying (58%, 53 Mt)
Hazardous waste with
highest tonnage
Mineral waste 561 000 tonnes (53%)
From Eurostat:
10-11-12 : Inorganic wastes from thermal
processes + Inorganic metal-containing wastes
from metal treatment and the coating of metals, and
non-ferrous hydrometallurgy + Wastes from
shaping and surface treatment of metals and
plastics (62%, 1Mt)
Chapter of List of waste with
the highest share of
hazardous waste
05 : Wastes from petroleum refining, natural gas
purification and pyrolytic treatment of coal (69%, 22
kt)

147 Study to assess different approaches for H14 | Questionnaire
FINLAND
National approach to assess H14 (ecotoxicity) of wastes
Percentage of waste
considered as
hazardous by H14
Protocol used
Ecotoxic tests can be applied
According to guidance given in 2002, if there isn´t sufficient information available on
the chemical composition of the waste, criterion H14 could also be assessed by
using ecotoxicity tests (such as: Vibrio fischerii test SFS-EN ISO 11348-3; Daphnia
magna test in EC Directive 67/548/ETY annex V method C2; algae test in EC
Directive 67/548/ETY annex V method C3, various plant tests etc.). It is
recommended to use a combination of several tests.
However, no limit values have been set for ecotoxicity tests in relation to H14
evaluation so their usability for classification is very limited. Hence they are not
applied in practice for evaluation if H14.
Calculation methods are used
Limit values for hazardous properties in wastes (waste decree 1128/2001): none,
recommended limit value in Finland 0.25 % (N and R51-53 or R50 or R53). This
proposed limit value is set on the basis of the classification of chemicals with an
ecotoxic property
Combination of hazardous
components concentration
Limit value Cut-off value
R51-53 2.5 % 0.1 %
R50, R52 25 % 0.1 %
R50-53 0.25 % 0.1 %
R59 0.1 % 0.1 %
R53, R52-53 25 % 1 %
Additivity according to the DPD formulas (without M-factors)
Illustrative examples
Qualitative
assessment of the
method(s)
Advantages When M-factors are not included it is possible to
apply cut-off values 0,1 % / 1 %. Hence minor
concentrations of elements/substances can be
excluded from the evaluation.
(If cut-off would be defined by 0,1% /M for Aquatic
Chronic 1, the number of possible hazardous
substances present in the waste increases
substantially, based on low concentrations of
elements and high M-factors, and it may become
impossible to prove that a waste is not ecotoxic; the
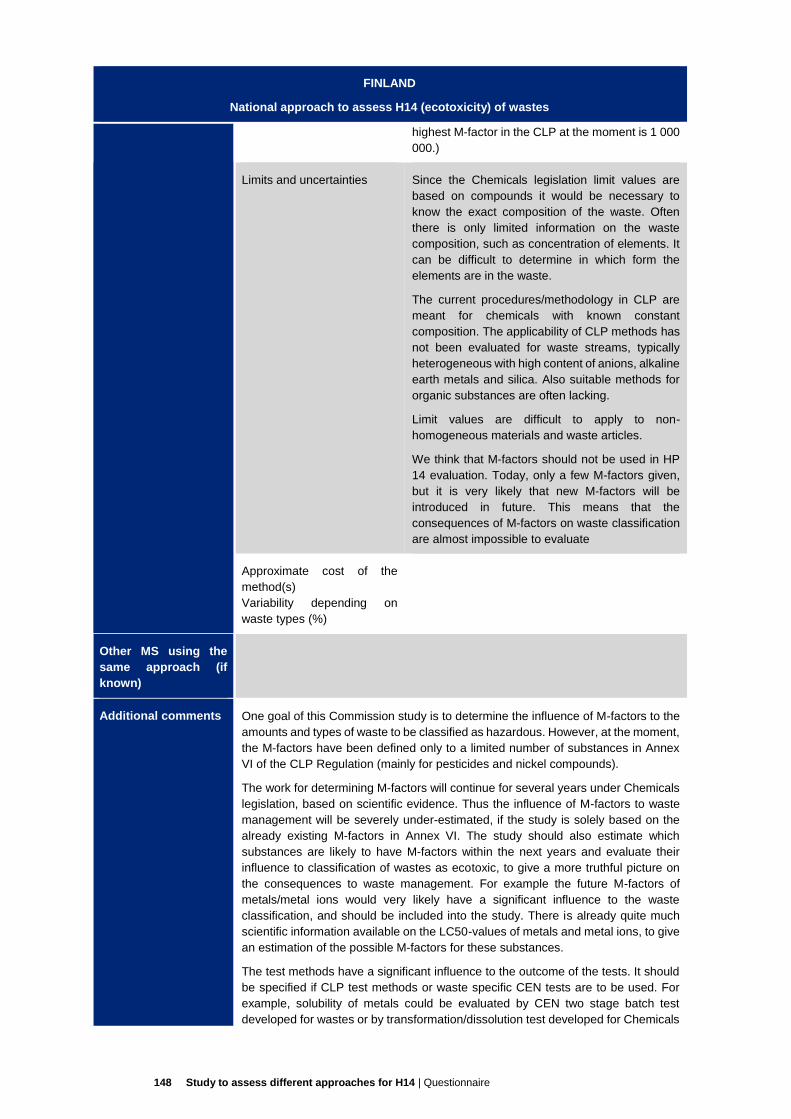
148 Study to assess different approaches for H14 | Questionnaire
FINLAND
National approach to assess H14 (ecotoxicity) of wastes
highest M-factor in the CLP at the moment is 1 000
000.)
Limits and uncertainties Since the Chemicals legislation limit values are
based on compounds it would be necessary to
know the exact composition of the waste. Often
there is only limited information on the waste
composition, such as concentration of elements. It
can be difficult to determine in which form the
elements are in the waste.
The current procedures/methodology in CLP are
meant for chemicals with known constant
composition. The applicability of CLP methods has
not been evaluated for waste streams, typically
heterogeneous with high content of anions, alkaline
earth metals and silica. Also suitable methods for
organic substances are often lacking.
Limit values are difficult to apply to non-
homogeneous materials and waste articles.
We think that M-factors should not be used in HP
14 evaluation. Today, only a few M-factors given,
but it is very likely that new M-factors will be
introduced in future. This means that the
consequences of M-factors on waste classification
are almost impossible to evaluate
Approximate cost of the
method(s)
Variability depending on
waste types (%)
Other MS using the
same approach (if
known)
Additional comments One goal of this Commission study is to determine the influence of M-factors to the
amounts and types of waste to be classified as hazardous. However, at the moment,
the M-factors have been defined only to a limited number of substances in Annex
VI of the CLP Regulation (mainly for pesticides and nickel compounds).
The work for determining M-factors will continue for several years under Chemicals
legislation, based on scientific evidence. Thus the influence of M-factors to waste
management will be severely under-estimated, if the study is solely based on the
already existing M-factors in Annex VI. The study should also estimate which
substances are likely to have M-factors within the next years and evaluate their
influence to classification of wastes as ecotoxic, to give a more truthful picture on
the consequences to waste management. For example the future M-factors of
metals/metal ions would very likely have a significant influence to the waste
classification, and should be included into the study. There is already quite much
scientific information available on the LC50-values of metals and metal ions, to give
an estimation of the possible M-factors for these substances.
The test methods have a significant influence to the outcome of the tests. It should
be specified if CLP test methods or waste specific CEN tests are to be used. For
example, solubility of metals could be evaluated by CEN two stage batch test
developed for wastes or by transformation/dissolution test developed for Chemicals

149 Study to assess different approaches for H14 | Questionnaire
FINLAND
National approach to assess H14 (ecotoxicity) of wastes
classification. Also pre-treatment of samples has influence on the outcome of the
results and should be specified.
Expert contacted to
elaborate this
factsheet
Eevaleena Häkkinen (Finnish Environmental Institute)
References Dahlbo, H. 2002. Jätteen luokittelu ongelmajätteeksi – arvioinnin perusteet ja
menetelmät
(Classification of waste as hazardous waste – the basis and methods for
evaluation). Environment Guide 98. Finnish Environment Institute. Helsinki. Finland.
160 pp. (In Finnish)
Ökopol GmbH (2008) Review of the European List of Waste, 532 pp.
Additional information
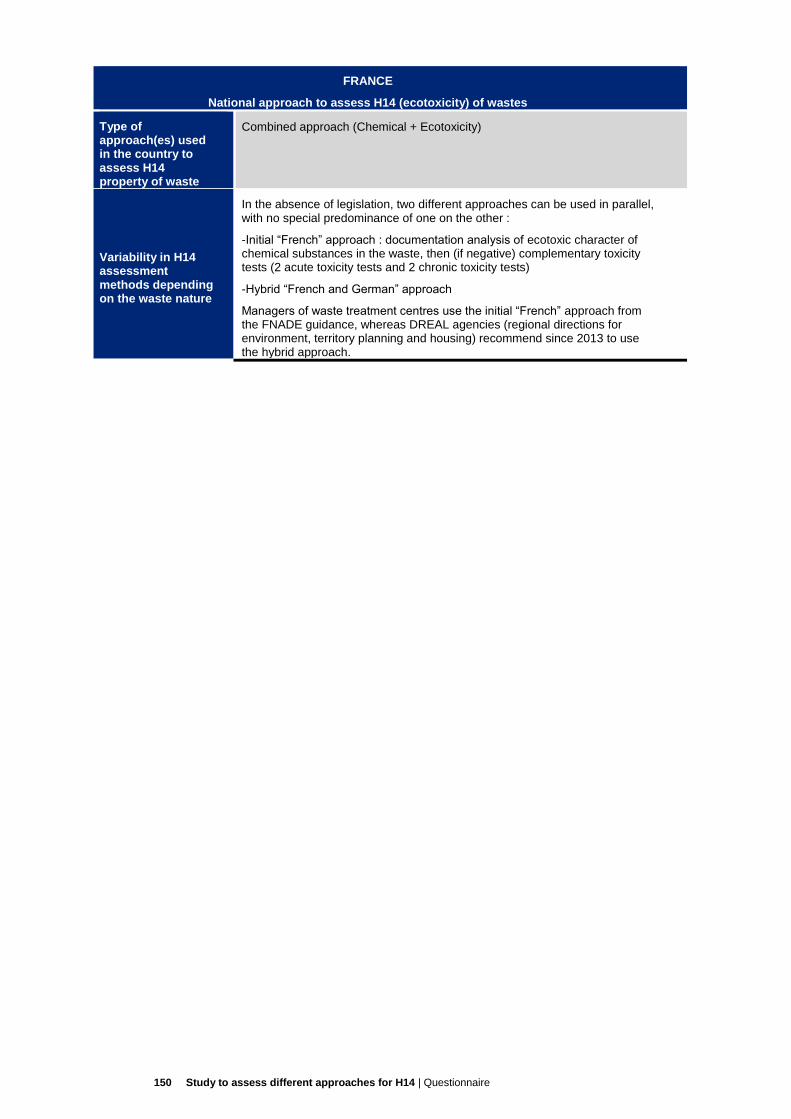
150 Study to assess different approaches for H14 | Questionnaire
FRANCE
National approach to assess H14 (ecotoxicity) of wastes
Type of approach(es) used in the country to assess H14 property of waste
Combined approach (Chemical + Ecotoxicity)
Variability in H14 assessment methods depending on the waste nature
In the absence of legislation, two different approaches can be used in parallel, with no special predominance of one on the other :
-Initial “French” approach : documentation analysis of ecotoxic character of chemical substances in the waste, then (if negative) complementary toxicity tests (2 acute toxicity tests and 2 chronic toxicity tests)
-Hybrid “French and German” approach
Managers of waste treatment centres use the initial “French” approach from the FNADE guidance, whereas DREAL agencies (regional directions for environment, territory planning and housing) recommend since 2013 to use the hybrid approach.
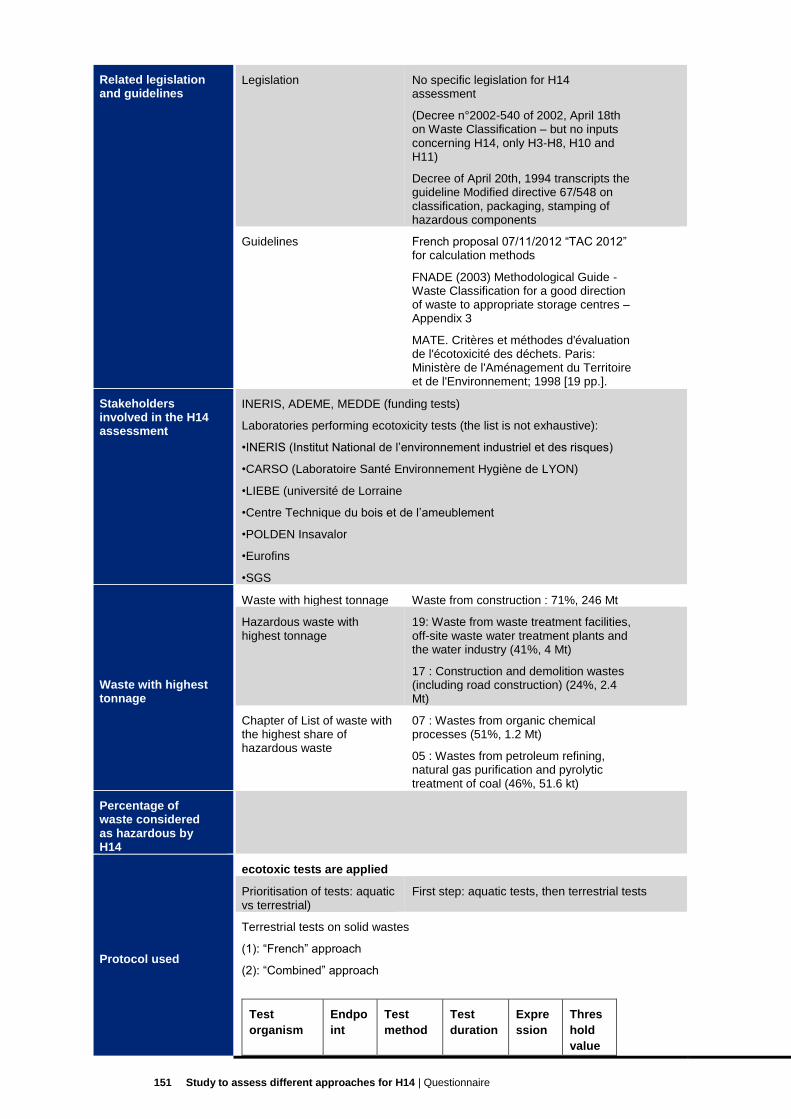
151 Study to assess different approaches for H14 | Questionnaire
Related legislation and guidelines
Legislation No specific legislation for H14 assessment
(Decree n°2002-540 of 2002, April 18th on Waste Classification – but no inputs concerning H14, only H3-H8, H10 and H11)
Decree of April 20th, 1994 transcripts the guideline Modified directive 67/548 on classification, packaging, stamping of hazardous components
Guidelines French proposal 07/11/2012 “TAC 2012” for calculation methods
FNADE (2003) Methodological Guide - Waste Classification for a good direction of waste to appropriate storage centres – Appendix 3
MATE. Critères et méthodes d'évaluation de l'écotoxicité des déchets. Paris: Ministère de l'Aménagement du Territoire et de l'Environnement; 1998 [19 pp.].
Stakeholders involved in the H14 assessment
INERIS, ADEME, MEDDE (funding tests)
Laboratories performing ecotoxicity tests (the list is not exhaustive):
•INERIS (Institut National de l’environnement industriel et des risques)
•CARSO (Laboratoire Santé Environnement Hygiène de LYON)
•LIEBE (université de Lorraine
•Centre Technique du bois et de l’ameublement
•POLDEN Insavalor
•Eurofins
•SGS
Waste with highest tonnage
Waste with highest tonnage Waste from construction : 71%, 246 Mt
Hazardous waste with highest tonnage
19: Waste from waste treatment facilities, off-site waste water treatment plants and the water industry (41%, 4 Mt)
17 : Construction and demolition wastes (including road construction) (24%, 2.4 Mt)
Chapter of List of waste with the highest share of hazardous waste
07 : Wastes from organic chemical processes (51%, 1.2 Mt)
05 : Wastes from petroleum refining, natural gas purification and pyrolytic treatment of coal (46%, 51.6 kt)
Percentage of waste considered as hazardous by H14
Protocol used
ecotoxic tests are applied
Prioritisation of tests: aquatic vs terrestrial)
First step: aquatic tests, then terrestrial tests
Terrestrial tests on solid wastes
(1): “French” approach
(2): “Combined” approach
Test
organism
Endpo
int
Test
method
Test
duration
Expre
ssion
Thres
hold
value
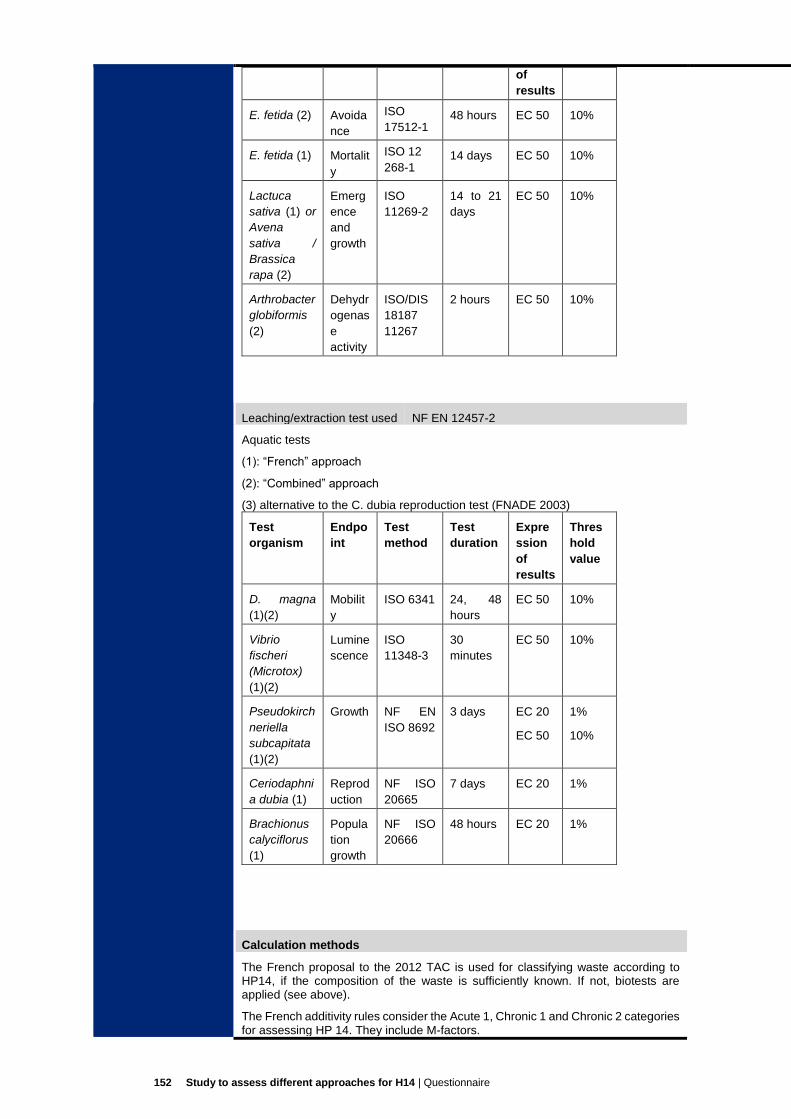
152 Study to assess different approaches for H14 | Questionnaire
of
results
E. fetida (2) Avoida
nce
ISO
17512-1 48 hours EC 50 10%
E. fetida (1) Mortalit
y
ISO 12
268-1 14 days EC 50 10%
Lactuca
sativa (1) or
Avena
sativa /
Brassica
rapa (2)
Emerg
ence
and
growth
ISO
11269-2
14 to 21
days
EC 50 10%
Arthrobacter
globiformis
(2)
Dehydr
ogenas
e
activity
ISO/DIS
18187
11267
2 hours EC 50 10%
Leaching/extraction test used NF EN 12457-2
Aquatic tests
(1): “French” approach
(2): “Combined” approach
(3) alternative to the C. dubia reproduction test (FNADE 2003)
Test
organism
Endpo
int
Test
method
Test
duration
Expre
ssion
of
results
Thres
hold
value
D. magna
(1)(2)
Mobilit
y
ISO 6341 24, 48
hours
EC 50 10%
Vibrio
fischeri
(Microtox)
(1)(2)
Lumine
scence
ISO
11348-3
30
minutes
EC 50 10%
Pseudokirch
neriella
subcapitata
(1)(2)
Growth NF EN
ISO 8692
3 days EC 20
EC 50
1%
10%
Ceriodaphni
a dubia (1)
Reprod
uction
NF ISO
20665
7 days EC 20 1%
Brachionus
calyciflorus
(1)
Popula
tion
growth
NF ISO
20666
48 hours EC 20 1%
Calculation methods
The French proposal to the 2012 TAC is used for classifying waste according to HP14, if the composition of the waste is sufficiently known. If not, biotests are applied (see above).
The French additivity rules consider the Acute 1, Chronic 1 and Chronic 2 categories for assessing HP 14. They include M-factors.
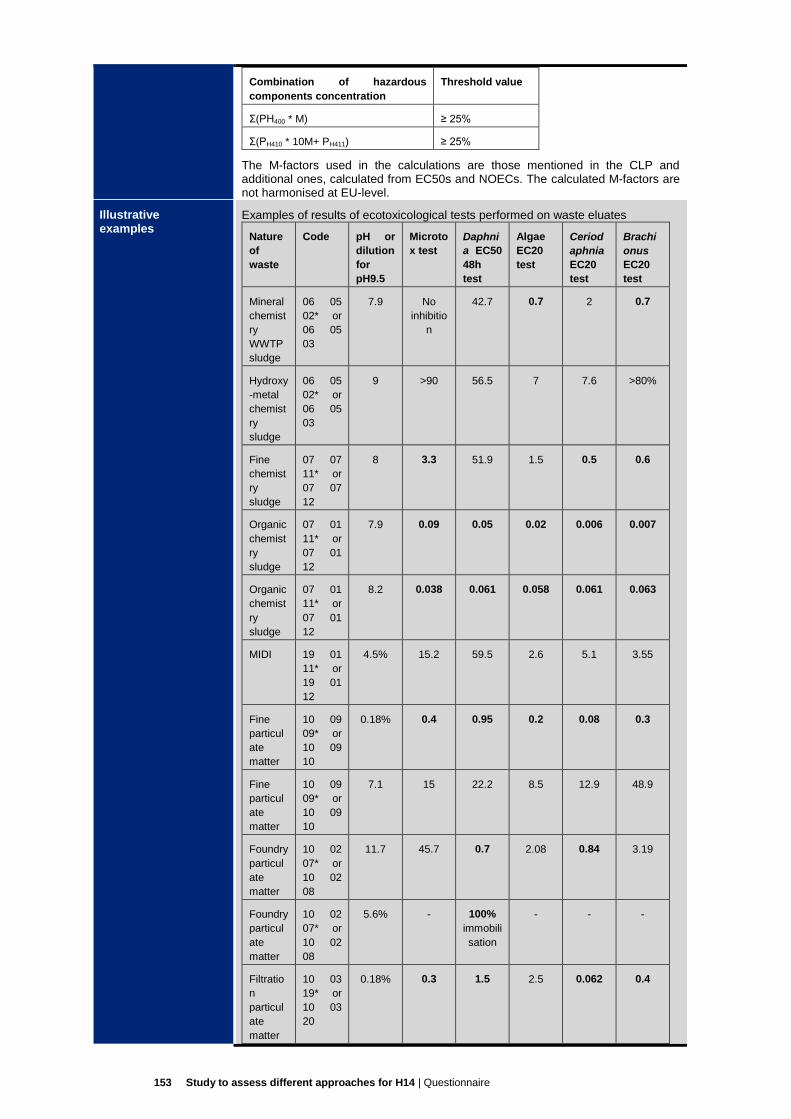
153 Study to assess different approaches for H14 | Questionnaire
Combination of hazardous
components concentration
Threshold value
Σ(PH400 * M) ≥ 25%
Σ(PH410 * 10M+ PH411) ≥ 25%
The M-factors used in the calculations are those mentioned in the CLP and additional ones, calculated from EC50s and NOECs. The calculated M-factors are not harmonised at EU-level.
Illustrative examples
Examples of results of ecotoxicological tests performed on waste eluates
Nature
of
waste
Code pH or
dilution
for
pH9.5
Microto
x test
Daphni
a EC50
48h
test
Algae
EC20
test
Ceriod
aphnia
EC20
test
Brachi
onus
EC20
test
Mineral
chemist
ry
WWTP
sludge
06 05
02* or
06 05
03
7.9 No
inhibitio
n
42.7 0.7 2 0.7
Hydroxy
-metal
chemist
ry
sludge
06 05
02* or
06 05
03
9 >90 56.5 7 7.6 >80%
Fine
chemist
ry
sludge
07 07
11* or
07 07
12
8 3.3 51.9 1.5 0.5 0.6
Organic
chemist
ry
sludge
07 01
11* or
07 01
12
7.9 0.09 0.05 0.02 0.006 0.007
Organic
chemist
ry
sludge
07 01
11* or
07 01
12
8.2 0.038 0.061 0.058 0.061 0.063
MIDI 19 01
11* or
19 01
12
4.5% 15.2 59.5 2.6 5.1 3.55
Fine
particul
ate
matter
10 09
09* or
10 09
10
0.18% 0.4 0.95 0.2 0.08 0.3
Fine
particul
ate
matter
10 09
09* or
10 09
10
7.1 15 22.2 8.5 12.9 48.9
Foundry
particul
ate
matter
10 02
07* or
10 02
08
11.7 45.7 0.7 2.08 0.84 3.19
Foundry
particul
ate
matter
10 02
07* or
10 02
08
5.6% - 100%
immobili
sation
- - -
Filtratio
n
particul
ate
matter
10 03
19* or
10 03
20
0.18% 0.3 1.5 2.5 0.062 0.4
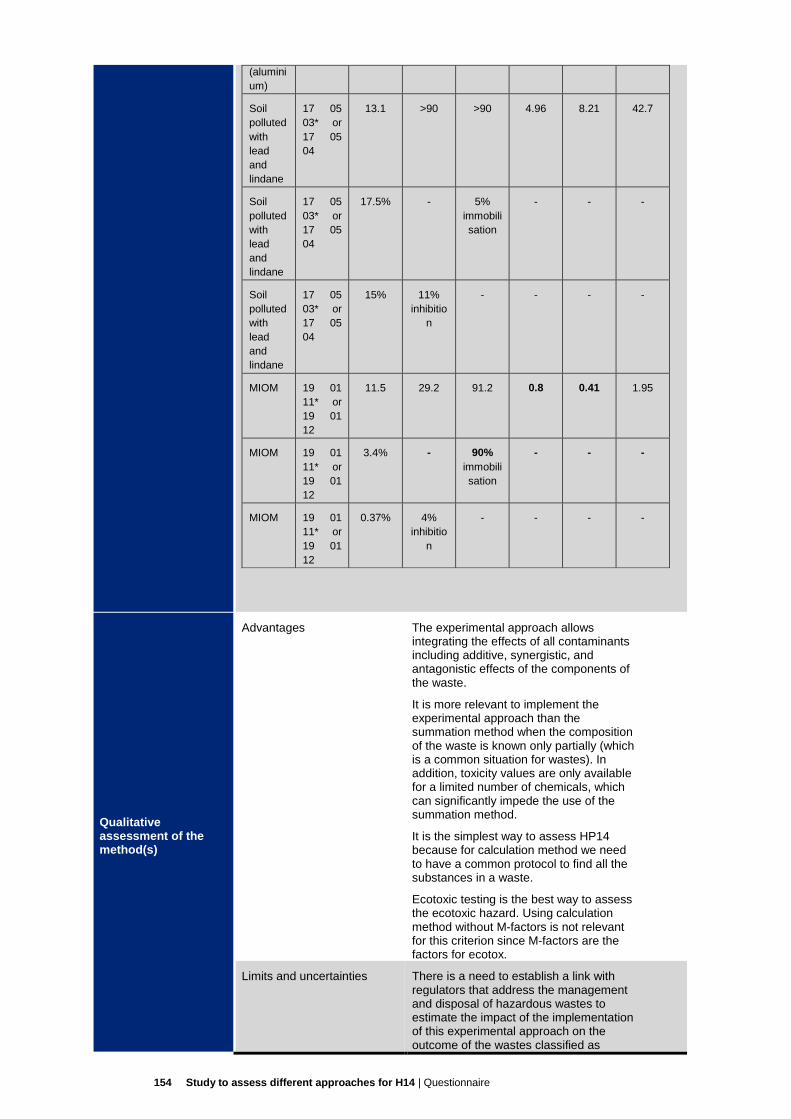
154 Study to assess different approaches for H14 | Questionnaire
(alumini
um)
Soil
polluted
with
lead
and
lindane
17 05
03* or
17 05
04
13.1 >90 >90 4.96 8.21 42.7
Soil
polluted
with
lead
and
lindane
17 05
03* or
17 05
04
17.5% - 5%
immobili
sation
- - -
Soil
polluted
with
lead
and
lindane
17 05
03* or
17 05
04
15% 11%
inhibitio
n
- - - -
MIOM 19 01
11* or
19 01
12
11.5 29.2 91.2 0.8 0.41 1.95
MIOM 19 01
11* or
19 01
12
3.4% - 90%
immobili
sation
- - -
MIOM 19 01
11* or
19 01
12
0.37% 4%
inhibitio
n
- - - -
Qualitative assessment of the method(s)
Advantages The experimental approach allows integrating the effects of all contaminants including additive, synergistic, and antagonistic effects of the components of the waste.
It is more relevant to implement the experimental approach than the summation method when the composition of the waste is known only partially (which is a common situation for wastes). In addition, toxicity values are only available for a limited number of chemicals, which can significantly impede the use of the summation method.
It is the simplest way to assess HP14 because for calculation method we need to have a common protocol to find all the substances in a waste.
Ecotoxic testing is the best way to assess the ecotoxic hazard. Using calculation method without M-factors is not relevant for this criterion since M-factors are the factors for ecotox.
Limits and uncertainties There is a need to establish a link with regulators that address the management and disposal of hazardous wastes to estimate the impact of the implementation of this experimental approach on the outcome of the wastes classified as

155 Study to assess different approaches for H14 | Questionnaire
hazardous. Therefore, it would seem appropriate to propose a transitional period for the application of these threshold values in order to collect sufficient experimental data at a European level to conclude definitely on the suitability of the proposed threshold values.
The analytical method AFNOR XP X30-489 gives the exhaustive composition of the mineral elements and the organic substances. (Mineral) Elements must be speciated to mineral (and organomineral) substances. This speciation requires expert knowledge.
In most of the case “worst case” classification (with knowledge of the chelistry of the waste, but without speciation) gives evidence for reliable classification.
There is a need to have consistency between results from testing and results from the calculation method on which Commission works.
Approximate cost of the method(s) Variability depending on waste types (%)
3000 – 5000 euros
Other MS using the same approach (if known)
Germany
Additional comments
Expert contacted to elaborate this factsheet
Pascal Pandard (INERIS)
References - French Ministry of the Environment (2015) Note provisoire sur la comparaison des méthodes d’attribution de la propriété de danger H14
- Pandard P, Römbke J. 2013. Proposal for a “Harmonized” Strategy for the Assessment of the HP 14 Property. Integrated Environmental Assessment and Management 9(4): 665–672
- Pandard P, Devillers J, Charissou AM, Poulsen V, Jourdain MJ, Férard J‐F. Grand C, Bispo A. 2006. Selecting a battery of bioassays for
ecotoxicological characterization of wastes. Sci Total Environ 363:114–125.
- FNADE (2003) Methodological Guide - Waste Classification for a good direction of waste to appropriate storage centres – Appendix 3
- Eurostat Data Centre on Waste
Additional information
INERIS (2013) Guide de classement des déchets selon leur dangerosité suivant le Code de l’Environnement et la réglementation SEVESO II (partie applicable aux déchets). Rapport d’étude N°INERIS- DRC-12-125740-06310A, 66 pp.

156 Study to assess different approaches for H14 | Questionnaire
GERMANY
National approach to assess H14 (ecotoxicity) of wastes
Type of approach(es)
used in the country to
assess H14 property
of waste
Combined method
Combination of solid-phase tests and aquatic tests performed on water extracts from
wastes, if insufficient ecotoxicity data on individual components of the waste.
Variability in H14
assessment methods
depending on the
waste nature
The assessment of wastes is aligned on assessment under hazardous-substances
legislation (CPD). Waste can thus be classified based on sufficient knowledge of its
composition in terms of hazardous substances. Every waste which, based on its
(known) composition, is to be classified and labelled in accordance with hazardous-
substances law (H1 to H13) is considered hazardous waste.
In addition, if the composition of the waste is unknown or complex, biological test
methods may be applied. The testing strategy includes a test battery with terrestrial
and aquatic tests, but the proposed limit values have not been discussed in detail
and no decision has been made to fix limit values.
Related legislation
and guidelines
Legislation No specific legislation for H14 assessment : due to the
Federal constitution the Federal States are the responsible
authorities to enforce the regulations, if there is no legal
instrument in place on national level - what is the case for
H14
Closed Substance Cycle and Waste Management Act
Guidelines UbA (2013) Recommendations for the Ecotoxicological
Characterization of Wastes
Moser, H. (2008) Handlungsempfehlungen zur
ökotoxikologischen Charakterisierung von Abfällen.
Entwurf.
German AVV (Abfallverzeichnisverordnung) (guide
technique)
Guidelines on the Application of the Waste Catalogue
Ordinance
Stakeholders involved
in the H14 assessment
Federal Environment Agency Umweltbundesamt UbA (funding, organising, testing,
communication)
ECT Oekotoxikologie GmbH (testing)
Waste with highest
tonnage
Waste with highest
tonnage
Waste from construction : 54%, 197 Mt
Hazardous waste
with highest tonnage
19: Waste from waste treatment facilities, off-site waste
water treatment plants and the water industry (34%, 6.9 Mt)
17 : Construction and demolition wastes (including road
construction) (34%, 6.9 Mt)
Chapter of List of
waste with the
highest share of
hazardous waste
05 : Wastes from petroleum refining, natural gas purification
and pyrolytic treatment of coal (59%, 146 kt)
Percentage of waste
considered as
hazardous by H14
No data available on Federal level.
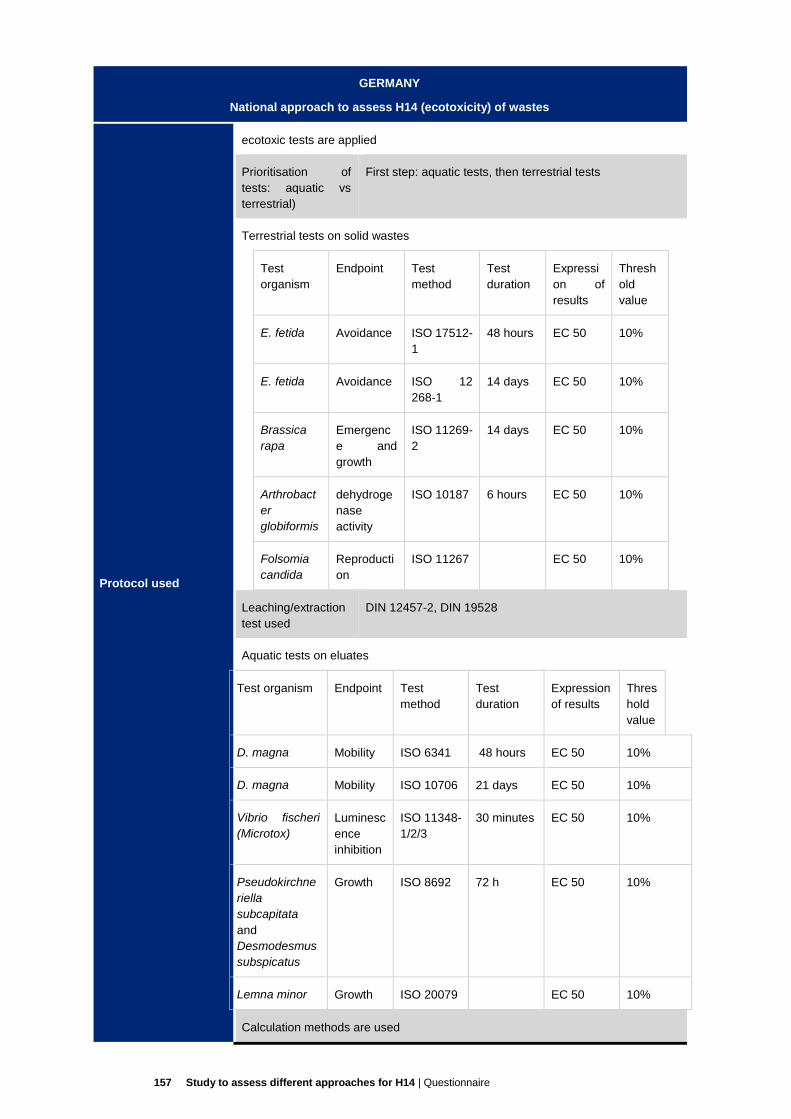
157 Study to assess different approaches for H14 | Questionnaire
GERMANY
National approach to assess H14 (ecotoxicity) of wastes
Protocol used
ecotoxic tests are applied
Prioritisation of
tests: aquatic vs
terrestrial)
First step: aquatic tests, then terrestrial tests
Terrestrial tests on solid wastes
Test
organism
Endpoint Test
method
Test
duration
Expressi
on of
results
Thresh
old
value
E. fetida Avoidance ISO 17512-
1
48 hours EC 50 10%
E. fetida Avoidance ISO 12
268-1
14 days EC 50 10%
Brassica
rapa
Emergenc
e and
growth
ISO 11269-
2
14 days EC 50 10%
Arthrobact
er
globiformis
dehydroge
nase
activity
ISO 10187 6 hours EC 50 10%
Folsomia
candida
Reproducti
on
ISO 11267 EC 50 10%
Leaching/extraction
test used
DIN 12457-2, DIN 19528
Aquatic tests on eluates
Test organism Endpoint Test
method
Test
duration
Expression
of results
Thres
hold
value
D. magna Mobility ISO 6341 48 hours EC 50 10%
D. magna Mobility ISO 10706 21 days EC 50 10%
Vibrio fischeri
(Microtox)
Luminesc
ence
inhibition
ISO 11348-
1/2/3
30 minutes EC 50 10%
Pseudokirchne
riella
subcapitata
and
Desmodesmus
subspicatus
Growth ISO 8692 72 h EC 50 10%
Lemna minor Growth ISO 20079 EC 50 10%
Calculation methods are used

158 Study to assess different approaches for H14 | Questionnaire
GERMANY
National approach to assess H14 (ecotoxicity) of wastes
Classification of the
substance
Generic
concentration limits
(w/w %)
Concentration
thresholds (for
taking into account
the substances in
the combination
equations)
R50 25 0,1
R50-53 0.25 0,1
R51-53 2.5 0,1
R52-53 25 1
R52 25 1
R53 25 1
R59 0.1 0,1
Combination equations
∑(PR50-53) ≥ 0.25
Or
∑(PR51-53) ≥ 2.5
Or
∑(PR52-53) ≥ 25
Or
∑(PR59) ≥ 0.1
Illustrative examples -
Qualitative
assessment of the
method(s)
Advantages The most complete battery of ecotoxic tests.
A combination of chemical and biological test methods
should be used for the ecotoxicological characterisation of
wastes, since a comparison of the results of chemical
analyses with existing threshold values is insufficient to
derive the hazards posed by waste. Instead, an evaluation
of the environmental hazards of waste is possible only by
the use of biological test methods, as only these can mirror
the effects of all bioavailable contaminants including their
potential interactions as well as pollutants in waste which
cannot be determined by chemical analysis.
Limits and
uncertainties
Limit values are proposed but not legally fixed.

159 Study to assess different approaches for H14 | Questionnaire
GERMANY
National approach to assess H14 (ecotoxicity) of wastes
Approximate cost of
the method(s)
Variability
depending on waste
types (%)
Other MS using the
same approach (if
known)
France
Additional comments
Expert contacted to
elaborate this
factsheet
Dr. Joachim Wuttke (UbA)
Mr Daniel Laux (Um BWL)
References - UbA (2013) Recommendations for the Ecotoxicological Characterization of Wastes
- UbA (2014) Weiterentwicklung der UBA-Handlungsempfehlung zur
ökotoxikologischen Charakterisierung von Abfällen, 170 pp.
- Ministerium für Umwelt und Verkehr Baden-Württemberg (2002) Zuordnung von
Abfällen zu Abfallarten aus Spiegeleinträgen - Vorläufige Vollzugshinweise, 48 pp.
- Eurostat Data Centre on Waste
Additional information Römbke J, Moser T, Moser H (2009) Ecotoxicological characterisation of 12
incineration ashes using 6 laboratory tests, Waste Management 29:2475–2482
Wuttke J (2013) Einstufung von HMV-Schlacken im europäischen Abfallverzeichnis.
Wissensforum, 20 pp.
Ökopol GmbH (2008) Review of the European List of Waste, 532 pp.

160 Study to assess different approaches for H14 | Questionnaire
ITALY
National approach to assess H14 (ecotoxicity) of wastes
Type of approach(es) used in the country to assess H14 property of waste
Chemical approach based on the “European Agreement concerning the International Carriage of Dangerous Goods by Road” (ADR) for class 9 (Miscellaneous dangerous substances and articles), M6 and M7 (pollutant to the aquatic environment, liquid and solid).
Variability in H14 assessment methods depending on the waste nature
none
FormuRelated legislation and guidelines
Legislation - Legislative decree 152/2006 (part IV). It replaces the legislative decree 22/97.
- Law 28/2012 .This law has introduced the criteria for H14 assessment into the legislative decree 152/2006 (see point 5, Annex D part IV)
- ADR agreement (European Agreement Concerning the International Carriage of Dangerous Goods by Road)
Guidelines CLASSIFICAZIONE DEI RIFIUTI - D.Lgs. n. 152/2006 e s.i.m. Revisione sostanziale PROCEDURA GESTIONALE ARPAV approvata in data 30/03/2011
Stakeholders involved in the H14 assessment
National and regional environment/health agencies: ISPRA, APPA, ARPA in 2 working groups.
Stakeholder role Name of stakeholder
Type of stakeholder (national authority, research institute, etc.)
Funding Producers Control Authorities
Private Organisations National/Regional Authorities
Performing the test(s),
Laboratories Private and Regional EPA
Providing waste samples
Producers Control Authorities
Private organisation National Authority
Waste with highest tonnage
Type or category or code of waste
Annual tonnage (metric tonnes)
Share (%)
Among hazardous waste
Wastes from waste management facilities, off-site waste water treatment plants and the preparation of water (chapter 19 of European LoW)
2,96 Mtonnes in 2012
31,7 of hazardous waste generated from economic activities
Among total waste
Construction and demolition wastes (chapter 17 of European LoW)
52,48 Mtonnes in 2012
39,1 of total waste generated from economic activities
Percentage of waste considered as hazardous by H14
Share of waste assessed positive for the H14 criteria, globally and by category: information not available at country level
Protocol used No biotests are currently applied in Italy (although recommendations exist).
Calculation methods adapted from the ADR are used

161 Study to assess different approaches for H14 | Questionnaire
The substances considered in the calculation methods are those classified as:
Hazard category DPD phrase CLP phrase
Acute 1 R50 H400
Chronic 1 R50-53 H410
Chronic 2 R51-53 H411
Threshold values below which the substances are not taken into account:
Hazard category Threshold value
Acute 1 0.1
Chronic 1 0.1
Chronic 2 1
The summation methods used in Italy are taken from the ADR and include M-factors. They are organised in a tiered-approach where the first hazard considered is the acute one (formula 1). If this leads to the attribution of the HP14 criterion to the waste, then the assessment stops there. If not, formula 2 is applied, and then formula 3 if HP14 is still not attributed by formula 2.
*P= percentage of weight
Combination of hazardous
components concentration
Threshold value
Formula 1 Σ(PR50 * M) ≥ 25%
Formula 2 Σ(PR50- 53 * M) ≥ 25%
Formula 3 Σ(PR50- 53 * 10M+ PR51- 53) ≥ 25%
The case of wastes containing hydrocarbons:
The Higher Institute for Health with opinion protocol 0035653 on 06/08/2010, second integration to the ISS (Higher Institute of Health) opinion no 36565 on 05/07/2006, assigned specific risk phrases to the different hydrocarbon fractions.
ISS (Higher Institute of Health) identified four groups of hydrocarbons (listed in the following table) with the relative ADR limits, in order to assign hazard property “ecotoxic” to waste containing hydrocarbons of unknown origin or whose origin is no longer attributable to a specific class of compounds.
Hydrocarbon
fractions
R_H phrases Specific ADR Limit
Values
Notes
C5 C8 (sum) R50/53
H410
25.000 mg/kg As a fraction:
R50/53; if the
various
hydrocarbons are
expressed
singularly, the
specific CLP
classification
applies.
Aromatic
hydrocarbons
C9 – cumene
C10 – dipentene,
naftalene
R51/53
H411
R50/53
H410
250.000 mg/kg
25.000 mg/kg
Defined individually
(see Specific Limit
Values of each
substance).
Naftalene can be
determined with
the PAHs.
C>10 (C10 –
C40) (sum)
R51/53
H411
250.000 mg/kg
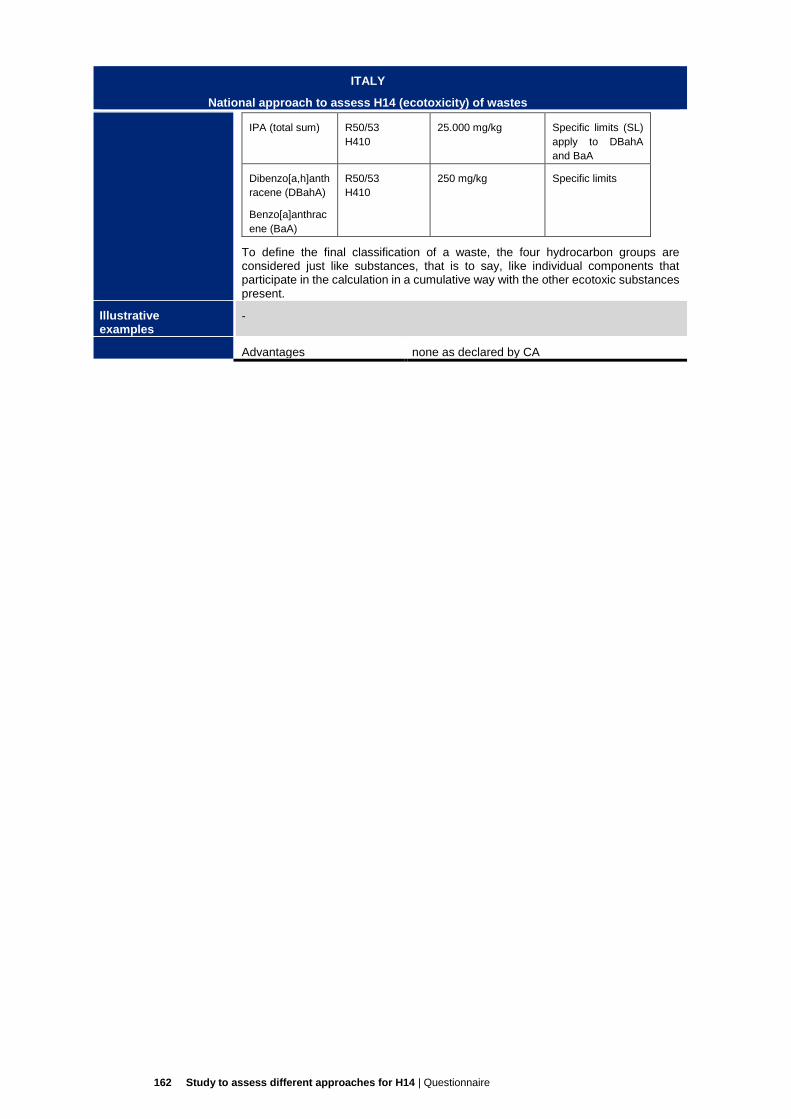
162 Study to assess different approaches for H14 | Questionnaire
ITALY
National approach to assess H14 (ecotoxicity) of wastes
IPA (total sum) R50/53
H410
25.000 mg/kg Specific limits (SL)
apply to DBahA
and BaA
Dibenzo[a,h]anth
racene (DBahA)
Benzo[a]anthrac
ene (BaA)
R50/53
H410
250 mg/kg Specific limits
To define the final classification of a waste, the four hydrocarbon groups are considered just like substances, that is to say, like individual components that participate in the calculation in a cumulative way with the other ecotoxic substances present.
Illustrative examples
-
Advantages none as declared by CA
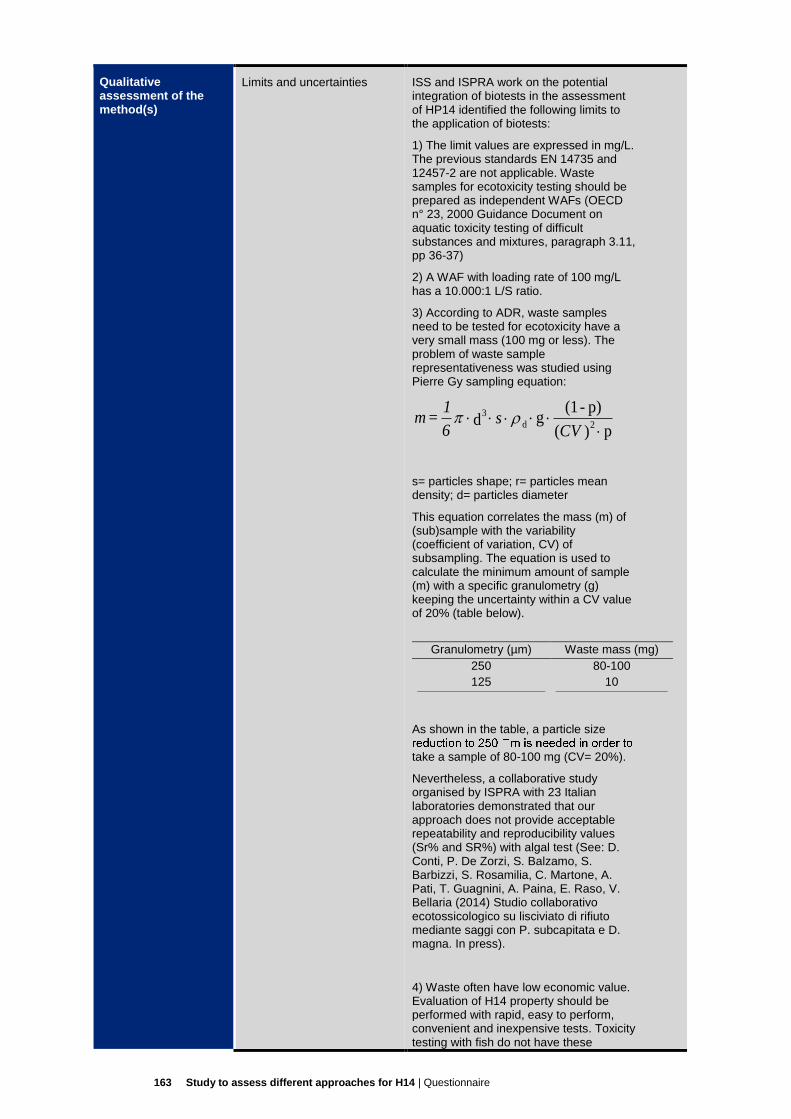
163 Study to assess different approaches for H14 | Questionnaire
Qualitative assessment of the method(s)
Limits and uncertainties ISS and ISPRA work on the potential integration of biotests in the assessment of HP14 identified the following limits to the application of biotests:
1) The limit values are expressed in mg/L. The previous standards EN 14735 and 12457-2 are not applicable. Waste samples for ecotoxicity testing should be prepared as independent WAFs (OECD n° 23, 2000 Guidance Document on aquatic toxicity testing of difficult substances and mixtures, paragraph 3.11, pp 36-37)
2) A WAF with loading rate of 100 mg/L has a 10.000:1 L/S ratio.
3) According to ADR, waste samples need to be tested for ecotoxicity have a very small mass (100 mg or less). The problem of waste sample representativeness was studied using Pierre Gy sampling equation:
p )(
p) - (1 g d
2d
3
CVs
6
1 = m
s= particles shape; r= particles mean density; d= particles diameter
This equation correlates the mass (m) of (sub)sample with the variability (coefficient of variation, CV) of subsampling. The equation is used to calculate the minimum amount of sample (m) with a specific granulometry (g) keeping the uncertainty within a CV value of 20% (table below).
Granulometry (µm) Waste mass (mg)
250 80-100
125 10
As shown in the table, a particle size
take a sample of 80-100 mg (CV= 20%).
Nevertheless, a collaborative study organised by ISPRA with 23 Italian laboratories demonstrated that our approach does not provide acceptable repeatability and reproducibility values (Sr% and SR%) with algal test (See: D. Conti, P. De Zorzi, S. Balzamo, S. Barbizzi, S. Rosamilia, C. Martone, A. Pati, T. Guagnini, A. Paina, E. Raso, V. Bellaria (2014) Studio collaborativo ecotossicologico su lisciviato di rifiuto mediante saggi con P. subcapitata e D. magna. In press).
4) Waste often have low economic value. Evaluation of H14 property should be performed with rapid, easy to perform, convenient and inexpensive tests. Toxicity testing with fish do not have these
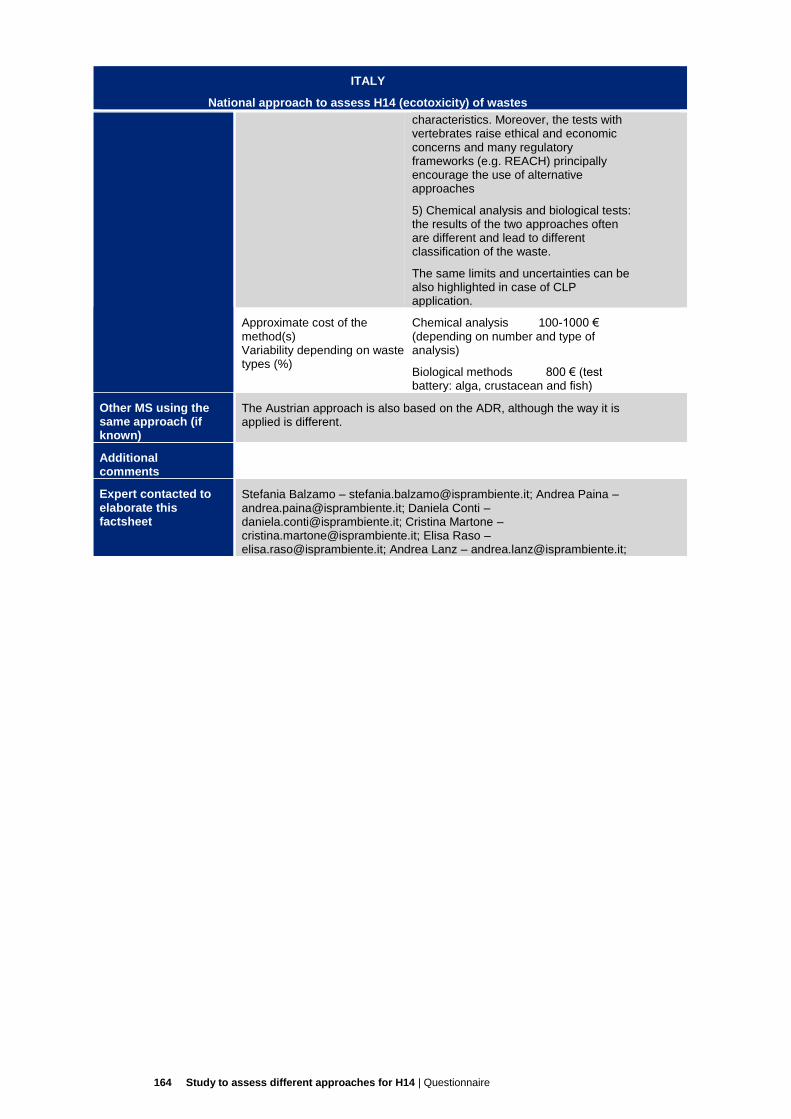
164 Study to assess different approaches for H14 | Questionnaire
ITALY
National approach to assess H14 (ecotoxicity) of wastes
characteristics. Moreover, the tests with vertebrates raise ethical and economic concerns and many regulatory frameworks (e.g. REACH) principally encourage the use of alternative approaches
5) Chemical analysis and biological tests: the results of the two approaches often are different and lead to different classification of the waste.
The same limits and uncertainties can be also highlighted in case of CLP application.
Approximate cost of the method(s) Variability depending on waste types (%)
Chemical analysis 100-1000 € (depending on number and type of analysis)
Biological methods 800 € (test battery: alga, crustacean and fish)
Other MS using the same approach (if known)
The Austrian approach is also based on the ADR, although the way it is applied is different.
Additional comments
Expert contacted to elaborate this factsheet
Stefania Balzamo – [email protected]; Andrea Paina – [email protected]; Daniela Conti – [email protected]; Cristina Martone – [email protected]; Elisa Raso – [email protected]; Andrea Lanz – [email protected];

165 Study to assess different approaches for H14 | Questionnaire
ITALY
National approach to assess H14 (ecotoxicity) of wastes
References Application of ADR approach:
Waste Observatory Service: Waste Classification - Legislative Decree no. 152/2006 and subsequent integrations and modifications. Substantial revision ARPAV MANAGEMENT PROCEDURE approved 30/03/2011
Information on quantities produced by specific waste codes:
Annual publications of ISPRA on production and management of municipal waste and waste from economic activities. Publications are available on ISPRA website at:
http://www.isprambiente.gov.it/it/pubblicazioni/rapporti (available only in Italian language)
Composition data of specific wastes:
Study on fluff-light fraction from crushing of vehicles:
Report ISPRA 2002 http://www.isprambiente.gov.it/contentfiles/00003800/3897-rapporti-02-16.pdf/view (available only in Italian language)
Report ISPRA 2006 http://www.isprambiente.gov.it/contentfiles/00004100/4158-rapporto-veicoli-2007-marzo-2008.pdf/view (available only in Italian language)
Procedures and results of ecotoxicological tests:
S. Balzamo, D. Conti, M. Belli et al. (2008) Caratterizzazione ecotossicologica dei rifiuti: risultati italiani del circuito d’interconfronto europeo organizzato dall’Agenzia tedesca per la Protezione dell’Ambiente. Rapporti ISPRA 81/2008.
D. Conti, P. De Zorzi, S. Balzamo, S. Barbizzi, S. Rosamilia, C. Martone, A. Pati, T. Guagnini, A. Paina, E. Raso, V. Bellaria (2014) Studio collaborativo ecotossicologico su lisciviato di rifiuto mediante saggi con P. subcapitata e D. magna. Final Report ISPRA (in press).
Batterie di test per la caratterizzazzione ecotossicologica dei rifiuti: Stato dell’arte ; Parere ISPRA/ISS sulla classificazione dei rifiuti ai fini dell'attribuzione della caratteristica di pericolo H14 "Ecotossico" Available at : http://www.iss.it/binary/ampp/cont/Ecotx_rf.pdf
A. Paina, D. Conti, S. Balzamo, A. Pati, C. Martone (2013) I rifiuti e la pericolosità per l’ambiente (H14): evoluzione normativa e quadro di riferimento. Atti di Giornate di Studio Livorno 5a edizione, “Ricerca e applicazione di metodologie eco tossicologiche in ambienti acquatici e matrici contaminate” Livorno 7-9 novembre 2013 pp. 194-200.
D. Conti, S. Balzamo, A. Paina, A. Pati, C. Martone, V. Bellaria (2013) Valutazione della pericolosità per l’ambiente dei rifiuti (H14): definizione della procedura analitica. Atti di Giornate di Studio Livorno 5a edizione, “Ricerca e applicazione di metodologie ecotossicologiche in ambienti acquatici e matrici contaminate” Livorno 7-9 novembre 2013 pp. 201-207.
D. Conti, P. De Zorzi, S. Balzamo, S. Barbizzi, S. Rosamilia, C. Martone, A. Pati, T. Guagnini, A. Paina, E. Raso, V. Bellaria (2014) Studio collaborativo ecotossicologico su lisciviato di rifiuto mediante saggi con P. subcapitata e D. magna. Rapporto finale ISPRA (in press)
A. Paina, D. Conti, C. Martone, A. Pati, E. Raso e S. Balzamo (2014) La determinazione della pericolosità per l’ambiente acquatico dei rifiuti (H14): definizione della procedura analitica per l’esecuzione di test biologici in accordo con il Regolamento CE 1272/2008. Ecomondo 2014, Rimini 5-8 November 2014, pp. 194-198
Additional information

166 Study to assess different approaches for H14 | Questionnaire
SPAIN
National approach to assess H14 (ecotoxicity) of wastes
Type of approach(es)
used in the country to
assess H14 property
of waste
Ecotoxicity tests
Two bioassays of luminescence and inhibition on leaching extracts
Variability in H14
assessment methods
depending on the
waste nature
Waste from veterinary products follow a different law.
Related legislation
and guidelines
Legislation Ley 22/2011, de 28 de julio, de residuos y suelos
contaminados
ORDEN de 13 de octubre de 1989 por la que se
determinan los métodos de caracterización de los
residuos tóxicos y peligrosos
ORDEN MAM/304/2002, de 8 de febrero - Anejo 2
(“no contiene en la actualidad disposiciones
respecto a las características H1, H2, H9 y H12 a
H14”)
Guidelines ORDEN de 13 de octubre de 1989 por la que se
determinan los métodos de caracterización de los
residuos tóxicos y peligrosos –Appendice IV and A
Stakeholders involved
in the H14 assessment
ATEGRUS (Asociación Técnica para la Gestión de Residuos, Aseo Urbano y Medio
Ambiente
INTERLAB
Waste with highest
tonnage
Waste with highest tonnage Waste from construction : 22%, 26.1 Mt
Waste from mining and quarrying : 19%, 22.5 Mt
Hazardous waste with
highest tonnage
Manufacture industry : 97.7% of hazardous waste
generated in Spain (1 345 kt on 1 376 kt), and
among them:
- Waste from metal and non-metal industry :
57.8%, 795 kt
- Waste from organic chemistry : 38.3%, 527.34 kt
- Acidic, alkaline and salt waste : 23%, 316.3 kt
From Eurostat data:
10-11-12 : Inorganic wastes from thermal
processes + Inorganic metal-containing wastes
from metal treatment and the coating of metals, and
non-ferrous hydrometallurgy + Wastes from
shaping and surface treatment of metals and
plastics (36%, 751.6 kt)
19 : Waste from waste treatment facilities, off-site
waste water treatment plants and the water
industry (26%, 530.7 kt)
Chapter of List of waste with
the highest share of
hazardous waste
05 : Wastes from petroleum refining, natural gas
purification and pyrolytic treatment of coal (49%,
66.8 kt)
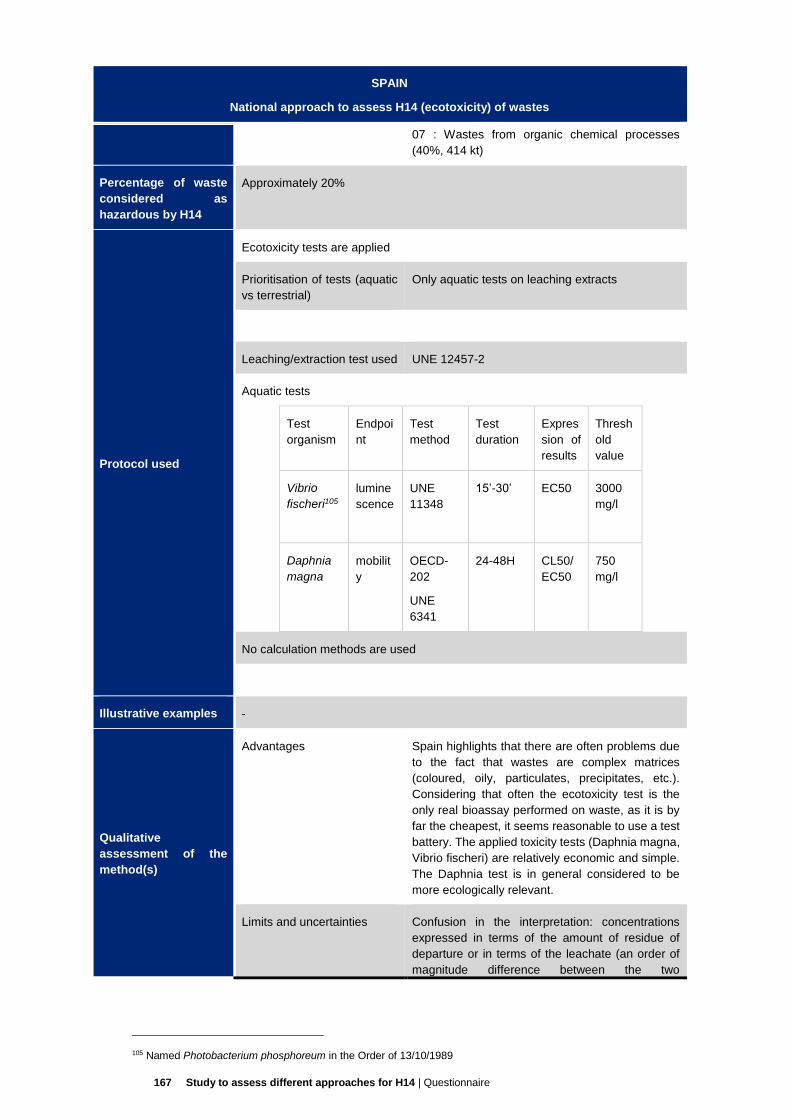
167 Study to assess different approaches for H14 | Questionnaire
SPAIN
National approach to assess H14 (ecotoxicity) of wastes
07 : Wastes from organic chemical processes
(40%, 414 kt)
Percentage of waste
considered as
hazardous by H14
Approximately 20%
Protocol used
Ecotoxicity tests are applied
Prioritisation of tests (aquatic
vs terrestrial)
Only aquatic tests on leaching extracts
Leaching/extraction test used UNE 12457-2
Aquatic tests
Test
organism
Endpoi
nt
Test
method
Test
duration
Expres
sion of
results
Thresh
old
value
Vibrio
fischeri105
lumine
scence
UNE
11348
15’-30’ EC50 3000
mg/l
Daphnia
magna
mobilit
y
OECD-
202
UNE
6341
24-48H CL50/
EC50
750
mg/l
No calculation methods are used
Illustrative examples -
Qualitative
assessment of the
method(s)
Advantages Spain highlights that there are often problems due
to the fact that wastes are complex matrices
(coloured, oily, particulates, precipitates, etc.).
Considering that often the ecotoxicity test is the
only real bioassay performed on waste, as it is by
far the cheapest, it seems reasonable to use a test
battery. The applied toxicity tests (Daphnia magna,
Vibrio fischeri) are relatively economic and simple.
The Daphnia test is in general considered to be
more ecologically relevant.
Limits and uncertainties Confusion in the interpretation: concentrations
expressed in terms of the amount of residue of
departure or in terms of the leachate (an order of
magnitude difference between the two
105 Named Photobacterium phosphoreum in the Order of 13/10/1989

168 Study to assess different approaches for H14 | Questionnaire
SPAIN
National approach to assess H14 (ecotoxicity) of wastes
interpretations [x 10]). Lack of clarity in relation to
the scientific support of limits.
Approximate cost of the
method(s)
Variability depending on
waste types (%)
Unknown
Other MS using the
same approach (if
known)
None.
Similar: France – Uses only Ecotoxicity tests to assess H 14. However, France
includes terrestrial tests in its test battery while Spain does not.
Additional comments
Expert contacted to
elaborate this
factsheet
Joan Parés Gómez, TECNOAMBIANTE SL
References - Jaureguízar J, Dueñas L, John E (2007) Evaluación de metodologías para la
caracterización de residuos como peligrosos o no peligrosos, Residuos 101, 18-26.
- ORDEN de 13 de octubre de 1989 por la que se determinan los métodos de
caracterización de los residuos tóxicos y peligrosos –Appendice IV and A
- Residuos Industriales en España INE, 2003 (2000)
- Eurostat Data Centre on Waste
Additional information Ökopol GmbH (2008) Review of the European List of Waste, 532 pp.

169 Study to assess different approaches for H14 | Questionnaire
UNITED KINGDOM
National approach to assess H14 (ecotoxicity) of wastes
Type of approach(es)
used in the country to
assess H14 property
of waste
Calculation method with limit value
Assessment of H14 based on the composition of the waste with regards to
hazardous substances. The UK approach considers only the hazards to
the aquatic environment (R50 to R53) and to the ozone layer (R59)
In practice, this is a calculation method based on the Dangerous Preparations Directive. It could also be presented as a combined approach.
UK differs from the DPD in that they do not assign substance specific concentration limits (SCL’s) to all R50-53 substance as set out in Part B of Annex III. They apply only those SCL’s listed in Table 3.2 of the CLP.
Ecotoxicity testing is legally permitted in accordance with Annex VI of the
Dangerous Substances Directive. This approach would normally be
applied to substances (rather than preparations), can only modify the
result of the calculation method for a preparation, and is limited by the
need for vertebrate testing. So in practice, ecotoxicity testing of most
wastes would not be appropriate where the calculation method can be
used instead.
Variability in H14
assessment methods
depending on the
waste nature
WM2 emphasises the use of compositional data to assess ecotoxicity (as used
for the assessment of other hazardous properties) and discourages direct
ecotoxicity testing on organisms wherever possible: “A H14 assessment
should normally be done by reference to concentration limits of the substances
in the waste. There will be a few cases when this is not possible, for example
the substances in particularly complex wastes may be difficult to determine
exactly. It is then possible to test these wastes for H14”. In those specific
cases (when the chemical composition of the waste is unknown or when the
waste contains substances whose toxicity is not already known), bioassays
can be used and the approach consists of an eluate testing without dilution
coupled to an inhibition essay on Daphnia magna’ s mobility (48h) and on
algal growth (72h).
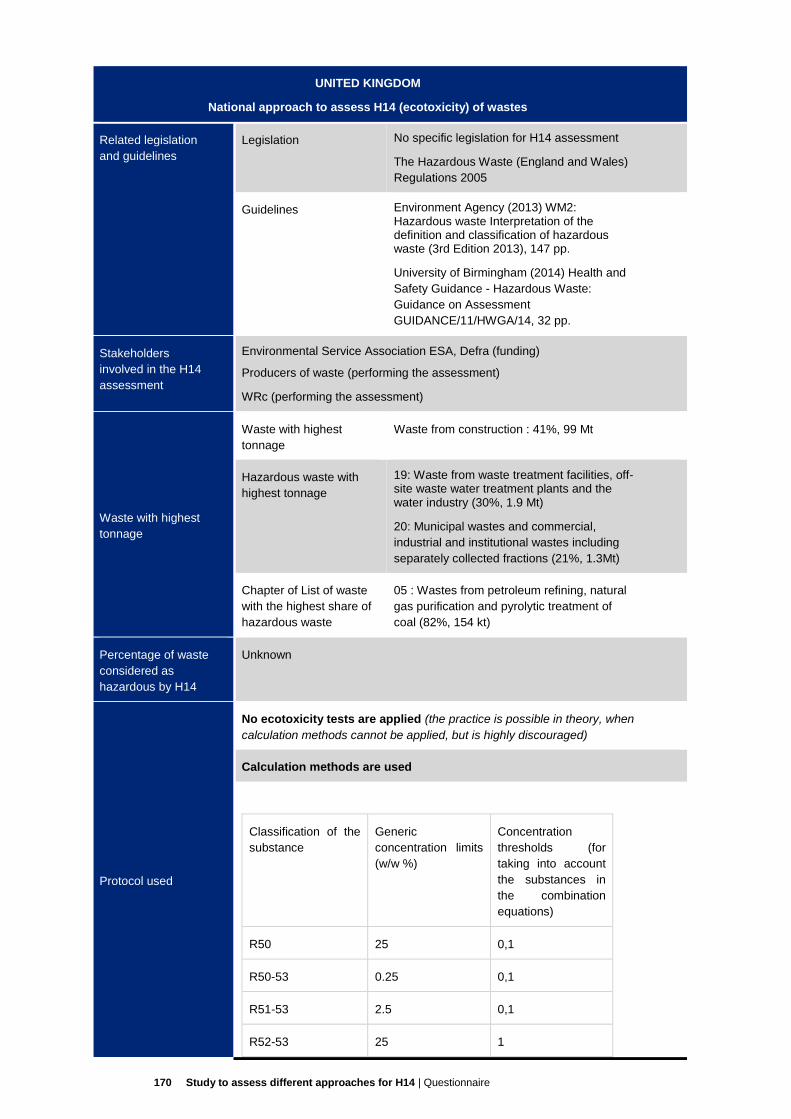
170 Study to assess different approaches for H14 | Questionnaire
UNITED KINGDOM
National approach to assess H14 (ecotoxicity) of wastes
Related legislation
and guidelines
Legislation No specific legislation for H14 assessment
The Hazardous Waste (England and Wales)
Regulations 2005
Guidelines Environment Agency (2013) WM2: Hazardous waste Interpretation of the definition and classification of hazardous waste (3rd Edition 2013), 147 pp.
University of Birmingham (2014) Health and
Safety Guidance - Hazardous Waste:
Guidance on Assessment
GUIDANCE/11/HWGA/14, 32 pp.
Stakeholders
involved in the H14
assessment
Environmental Service Association ESA, Defra (funding)
Producers of waste (performing the assessment)
WRc (performing the assessment)
Waste with highest
tonnage
Waste with highest
tonnage
Waste from construction : 41%, 99 Mt
Hazardous waste with
highest tonnage
19: Waste from waste treatment facilities, off-site waste water treatment plants and the water industry (30%, 1.9 Mt)
20: Municipal wastes and commercial,
industrial and institutional wastes including
separately collected fractions (21%, 1.3Mt)
Chapter of List of waste
with the highest share of
hazardous waste
05 : Wastes from petroleum refining, natural
gas purification and pyrolytic treatment of
coal (82%, 154 kt)
Percentage of waste
considered as
hazardous by H14
Unknown
Protocol used
No ecotoxicity tests are applied (the practice is possible in theory, when
calculation methods cannot be applied, but is highly discouraged)
Calculation methods are used
Classification of the
substance
Generic
concentration limits
(w/w %)
Concentration
thresholds (for
taking into account
the substances in
the combination
equations)
R50 25 0,1
R50-53 0.25 0,1
R51-53 2.5 0,1
R52-53 25 1
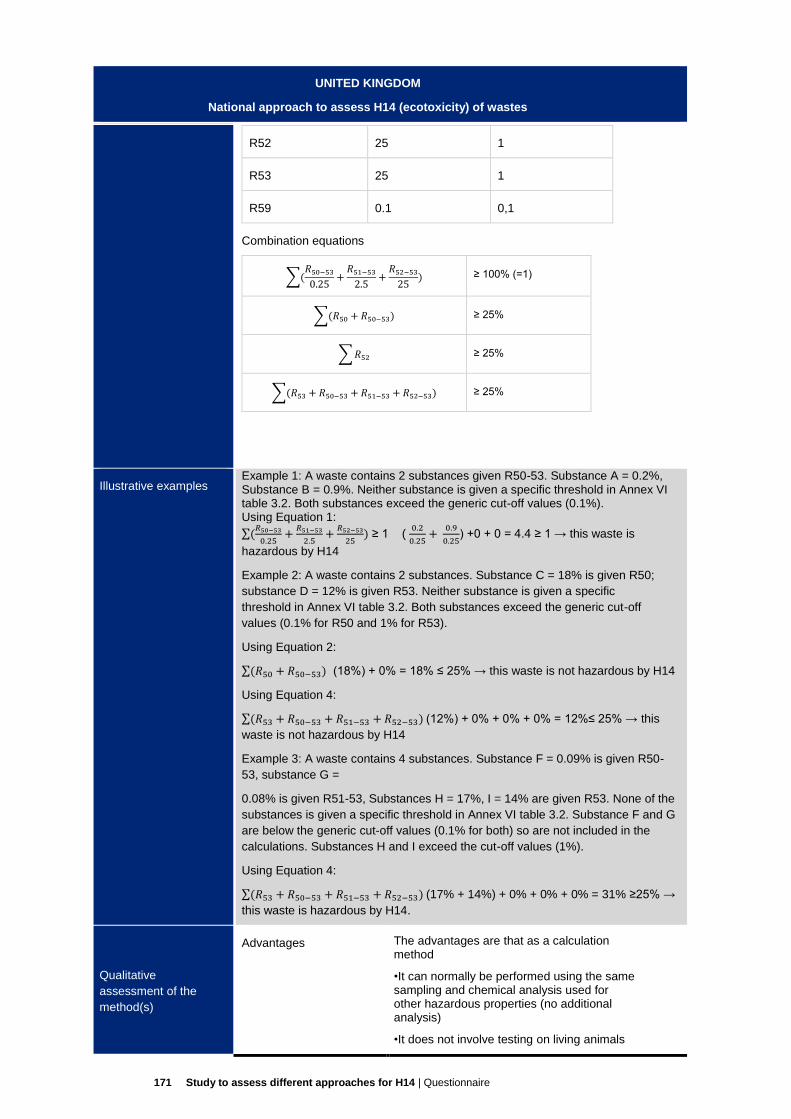
171 Study to assess different approaches for H14 | Questionnaire
UNITED KINGDOM
National approach to assess H14 (ecotoxicity) of wastes
R52 25 1
R53 25 1
R59 0.1 0,1
Combination equations
∑(𝑅50−53
0.25+
𝑅51−53
2.5+
𝑅52−53
25) ≥ 100% (=1)
∑(𝑅50 + 𝑅50−53) ≥ 25%
∑ 𝑅52 ≥ 25%
∑(𝑅53 + 𝑅50−53 + 𝑅51−53 + 𝑅52−53) ≥ 25%
Illustrative examples Example 1: A waste contains 2 substances given R50-53. Substance A = 0.2%, Substance B = 0.9%. Neither substance is given a specific threshold in Annex VI table 3.2. Both substances exceed the generic cut-off values (0.1%). Using Equation 1:
∑(𝑅50−53
0.25+
𝑅51−53
2.5+
𝑅52−53
25) ≥ 1 (
0.2
0.25+
0.9
0.25) +0 + 0 = 4.4 ≥ 1 → this waste is
hazardous by H14
Example 2: A waste contains 2 substances. Substance C = 18% is given R50;
substance D = 12% is given R53. Neither substance is given a specific
threshold in Annex VI table 3.2. Both substances exceed the generic cut-off
values (0.1% for R50 and 1% for R53).
Using Equation 2:
∑(𝑅50 + 𝑅50−53) (18%) + 0% = 18% ≤ 25% → this waste is not hazardous by H14
Using Equation 4:
∑(𝑅53 + 𝑅50−53 + 𝑅51−53 + 𝑅52−53) (12%) + 0% + 0% + 0% = 12%≤ 25% → this
waste is not hazardous by H14
Example 3: A waste contains 4 substances. Substance F = 0.09% is given R50-
53, substance G =
0.08% is given R51-53, Substances H = 17%, I = 14% are given R53. None of the
substances is given a specific threshold in Annex VI table 3.2. Substance F and G
are below the generic cut-off values (0.1% for both) so are not included in the
calculations. Substances H and I exceed the cut-off values (1%).
Using Equation 4:
∑(𝑅53 + 𝑅50−53 + 𝑅51−53 + 𝑅52−53) (17% + 14%) + 0% + 0% + 0% = 31% ≥25% →
this waste is hazardous by H14.
Qualitative
assessment of the
method(s)
Advantages The advantages are that as a calculation method
•It can normally be performed using the same sampling and chemical analysis used for other hazardous properties (no additional analysis)
•It does not involve testing on living animals

172 Study to assess different approaches for H14 | Questionnaire
UNITED KINGDOM
National approach to assess H14 (ecotoxicity) of wastes
•It is similar to that used for products, so the
classification of a product under the DPD as
Ecotoxic can normally be relied upon by
small businesses to indicate that H14 is likely
to apply when that product becomes a waste.
One stakeholder has advocated that the
method selected should be as close to the
CLP as possible to maximise the
simplification this last point provides for
customers. As indicated previously, the use
of direct testing is limited by the legislative
regime and limitations of test methods with
respect to difficult materials. However in
certain circumstances (particularly for
simpler, soluble wastes, or for pure
substances) it may have some advantages.
UK points out that the calculation
methodology set forth in the national
Chemical Regulations (CHIP) and the
Dangerous Preparations Directive (DPD)
supported by chemical analysis is clear and
highly satisfactory. It aligns directly with
chemical risk phrase classification systems
and therefore with other hazardous
properties. UK holds the view that animal
testing of solid wastes is of little or no
scientific value and generates results of
debatable significance. Testing is described
as of often poor quality, overlooks key criteria
in relevant guidance, and results often
suggest that the waste is non-hazardous
where that is clearly not the case. UK
assumes that in more than one case the
analysis appears to have been undertaken
principally because chemical analysis would
show the waste to be hazardous, so
ecotoxicity testing is being used (badly) in an
attempt to obtain a different result.
Limits and uncertainties Our approach has similar limits and uncertainties to the DPD.
The omission of SCL’s for all R50-53 substances means that the calculation method will underestimate the ecotoxicity of a waste (relative to the DPD) when very ecotoxic substances are present.
The reliability of the calculation method is dependent on
•Appropriate sampling in accordance with CEN 14899 and supporting technical reports,
•Determination of the chemical composition of the components (to a level sufficient to assess H14) by analysis, and
•Correctly identifying the classification of the components using Table 3.2 of the CLP, the REACH registered substances database, and other appropriate datasources.

173 Study to assess different approaches for H14 | Questionnaire
UNITED KINGDOM
National approach to assess H14 (ecotoxicity) of wastes
Appropriate sampling of materials, particularly from processes producing variable and heterogenous batches over time, can be the key factor. This can be a significant part of the cost.
Analysis can be more challenging in complex
matrices, and the analytical uncertainties
need to be understood before results are
interpreted. The balance often has to be
found between determining the speciation of
the chemical OR using a worst case
compound.
Approximate cost of the
method(s)
Variability depending on
waste types (%)
The sampling and chemical analysis of the waste is used to support the assessment of several hazardous properties. The use of the calculation method for H14 would not normally generate a separate (additional) cost.
One stakeholder has advised UK EA that ecotoxicity tests range from £650 to £2000 per test, depending on the OECD test method.
Another has indicated that analysis of chemical compositions is approximately £150 per sample, with the calculation taking about 30 minutes for a competent person. They indicate that ecotoxicity testing is more expensive.
Again, where the method is very close the
product legislation – sampling, analysis and
calculation may be not be necessary, if the
safety data sheet for that product has already
completed the assessment. This may reduce
cost.
Other MS using the
same approach (if
known)
Finland
Additional comments The successful assessment of a waste to determine its classification is highly dependent on the reliable and representative sampling of the material. The application of CEN 14899 on waste characterisation and its supporting technical reports is central to this.
One of our stakeholders has made us aware of the CONCAWE aquatic toxicity test procedure in ‘Hazardous classification and labelling of petroleum substances in the European Economic Area -2014’. We would recommend seeking advice from ECHA on the relevance of this to CLP classification of oils (and therefore oil contaminated waste)
When evaluating waste streams for this study we recommend you
-Determine their full composition, and
-Assess all hazardous properties
To determine the impact of H14.
Although a calculation method is most appropriate, this should be
supported by ecotoxicity testing where appropriate. This would need to be
performed in accordance with the CLP and supporting ECHA guidance on
its application. Use of a calculation method similar to that of the CLP
would be needed to enable CLP test methods to be used in parallel. The

174 Study to assess different approaches for H14 | Questionnaire
UNITED KINGDOM
National approach to assess H14 (ecotoxicity) of wastes
performance of the Ecotoxicity method on difficult substances is an
important consideration.
Expert contacted to
elaborate this
factsheet
Bob McIntyre, UK EA
References - Environment Agency (2013) WM2: Hazardous waste Interpretation of the definition and classification of hazardous waste (3rd Edition 2013), 147 pp.
- Eurostat Data Centre on Waste
Additional
information
WRc (2012) Assessment of Hazard Classification of UK IBA, 69 pp.
Ökopol GmbH (2008) Review of the European List of Waste, 532 pp.
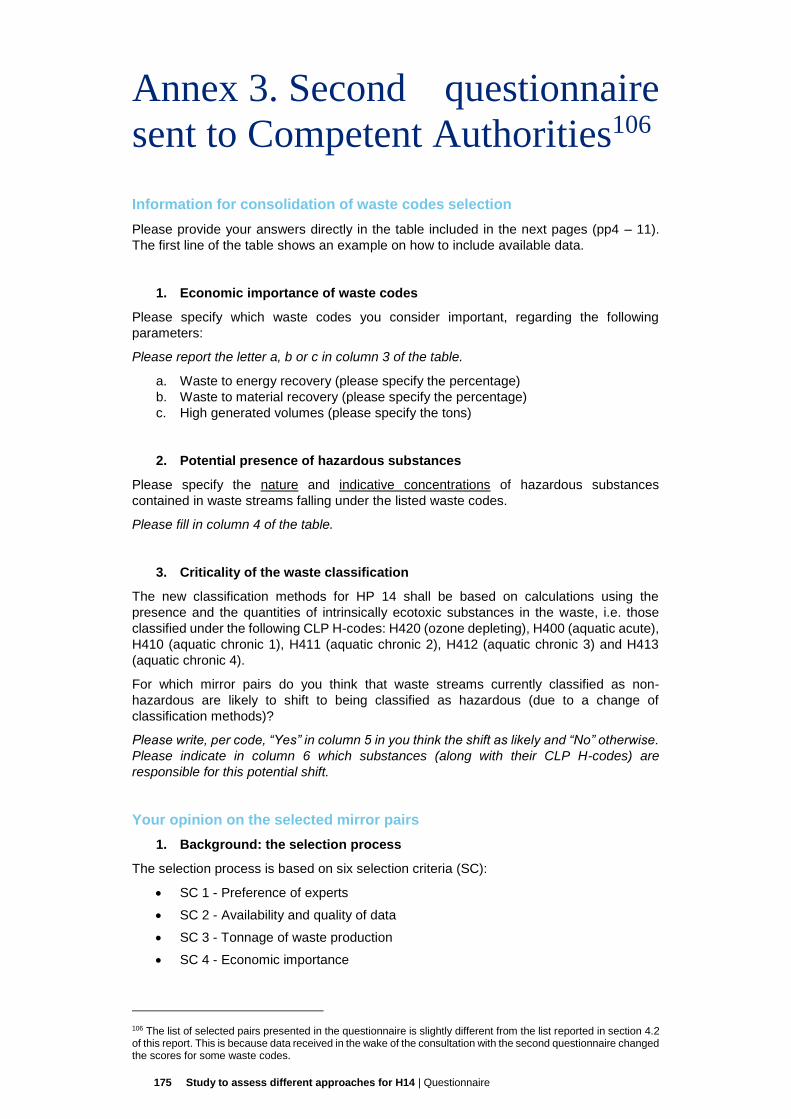
175 Study to assess different approaches for H14 | Questionnaire
Annex 3. Second questionnaire
sent to Competent Authorities106
Information for consolidation of waste codes selection
Please provide your answers directly in the table included in the next pages (pp4 – 11).
The first line of the table shows an example on how to include available data.
1. Economic importance of waste codes
Please specify which waste codes you consider important, regarding the following
parameters:
Please report the letter a, b or c in column 3 of the table.
a. Waste to energy recovery (please specify the percentage)
b. Waste to material recovery (please specify the percentage)
c. High generated volumes (please specify the tons)
2. Potential presence of hazardous substances
Please specify the nature and indicative concentrations of hazardous substances
contained in waste streams falling under the listed waste codes.
Please fill in column 4 of the table.
3. Criticality of the waste classification
The new classification methods for HP 14 shall be based on calculations using the
presence and the quantities of intrinsically ecotoxic substances in the waste, i.e. those
classified under the following CLP H-codes: H420 (ozone depleting), H400 (aquatic acute),
H410 (aquatic chronic 1), H411 (aquatic chronic 2), H412 (aquatic chronic 3) and H413
(aquatic chronic 4).
For which mirror pairs do you think that waste streams currently classified as non-
hazardous are likely to shift to being classified as hazardous (due to a change of
classification methods)?
Please write, per code, “Yes” in column 5 in you think the shift as likely and “No” otherwise.
Please indicate in column 6 which substances (along with their CLP H-codes) are
responsible for this potential shift.
Your opinion on the selected mirror pairs
1. Background: the selection process
The selection process is based on six selection criteria (SC):
SC 1 - Preference of experts
SC 2 - Availability and quality of data
SC 3 - Tonnage of waste production
SC 4 - Economic importance
106 The list of selected pairs presented in the questionnaire is slightly different from the list reported in section 4.2 of this report. This is because data received in the wake of the consultation with the second questionnaire changed the scores for some waste codes.
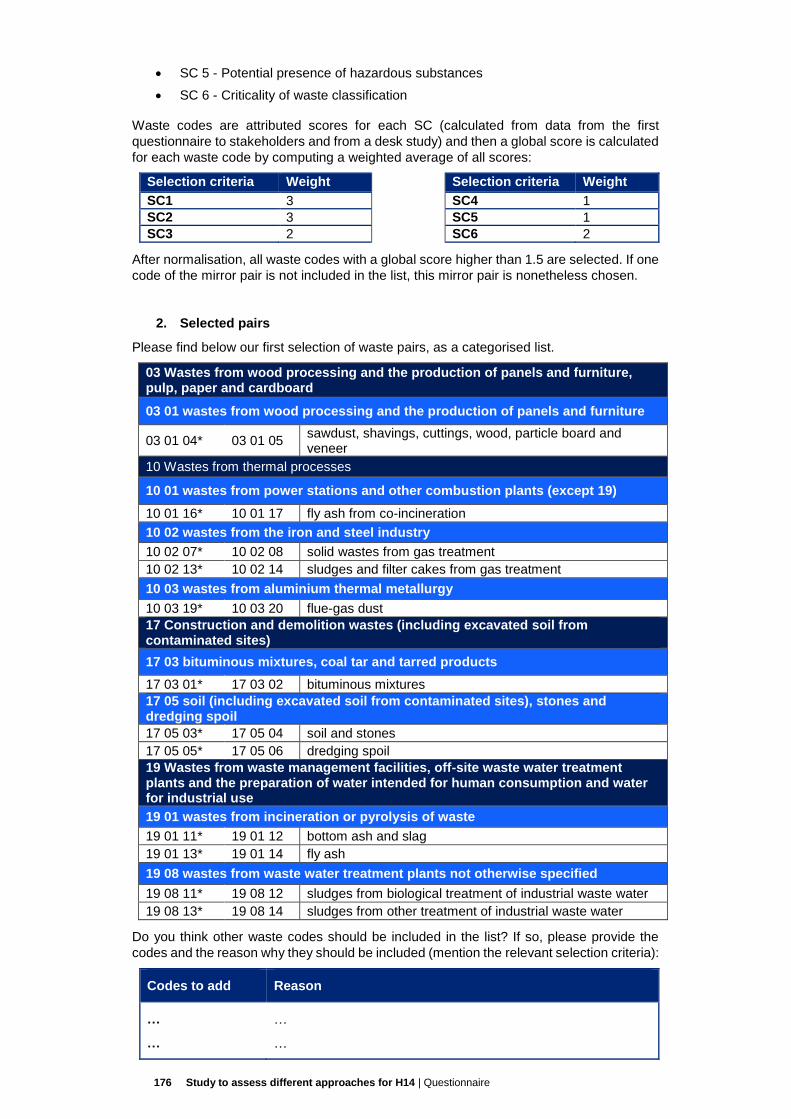
176 Study to assess different approaches for H14 | Questionnaire
SC 5 - Potential presence of hazardous substances
SC 6 - Criticality of waste classification
Waste codes are attributed scores for each SC (calculated from data from the first
questionnaire to stakeholders and from a desk study) and then a global score is calculated
for each waste code by computing a weighted average of all scores:
Selection criteria Weight Selection criteria Weight
SC1 3 SC4 1
SC2 3 SC5 1
SC3 2 SC6 2
After normalisation, all waste codes with a global score higher than 1.5 are selected. If one
code of the mirror pair is not included in the list, this mirror pair is nonetheless chosen.
2. Selected pairs
Please find below our first selection of waste pairs, as a categorised list.
03 Wastes from wood processing and the production of panels and furniture, pulp, paper and cardboard
03 01 wastes from wood processing and the production of panels and furniture
03 01 04* 03 01 05 sawdust, shavings, cuttings, wood, particle board and veneer
10 Wastes from thermal processes
10 01 wastes from power stations and other combustion plants (except 19)
10 01 16* 10 01 17 fly ash from co-incineration
10 02 wastes from the iron and steel industry
10 02 07* 10 02 08 solid wastes from gas treatment
10 02 13* 10 02 14 sludges and filter cakes from gas treatment
10 03 wastes from aluminium thermal metallurgy
10 03 19* 10 03 20 flue-gas dust
17 Construction and demolition wastes (including excavated soil from contaminated sites)
17 03 bituminous mixtures, coal tar and tarred products
17 03 01* 17 03 02 bituminous mixtures
17 05 soil (including excavated soil from contaminated sites), stones and dredging spoil
17 05 03* 17 05 04 soil and stones
17 05 05* 17 05 06 dredging spoil
19 Wastes from waste management facilities, off-site waste water treatment plants and the preparation of water intended for human consumption and water for industrial use
19 01 wastes from incineration or pyrolysis of waste
19 01 11* 19 01 12 bottom ash and slag
19 01 13* 19 01 14 fly ash
19 08 wastes from waste water treatment plants not otherwise specified
19 08 11* 19 08 12 sludges from biological treatment of industrial waste water
19 08 13* 19 08 14 sludges from other treatment of industrial waste water
Do you think other waste codes should be included in the list? If so, please provide the
codes and the reason why they should be included (mention the relevant selection criteria):
Codes to add Reason
…
…
…
…

177 Study to assess different approaches for H14 | Questionnaire
Experimental data on selected waste pairs
We need experimental data (chemical composition and results of ecotoxicity tests) of waste
samples classified under one or the other code of the selected mirror pairs.
The attached Excel file presents and explains the data we need to perform the assessment.
Could you please fill in the tables or provide us with reports/databases containing the
requested information?
If you do not have the experimental data yourself, could you please redirect us to people
who do:
Contacts: ____________________________________________________________
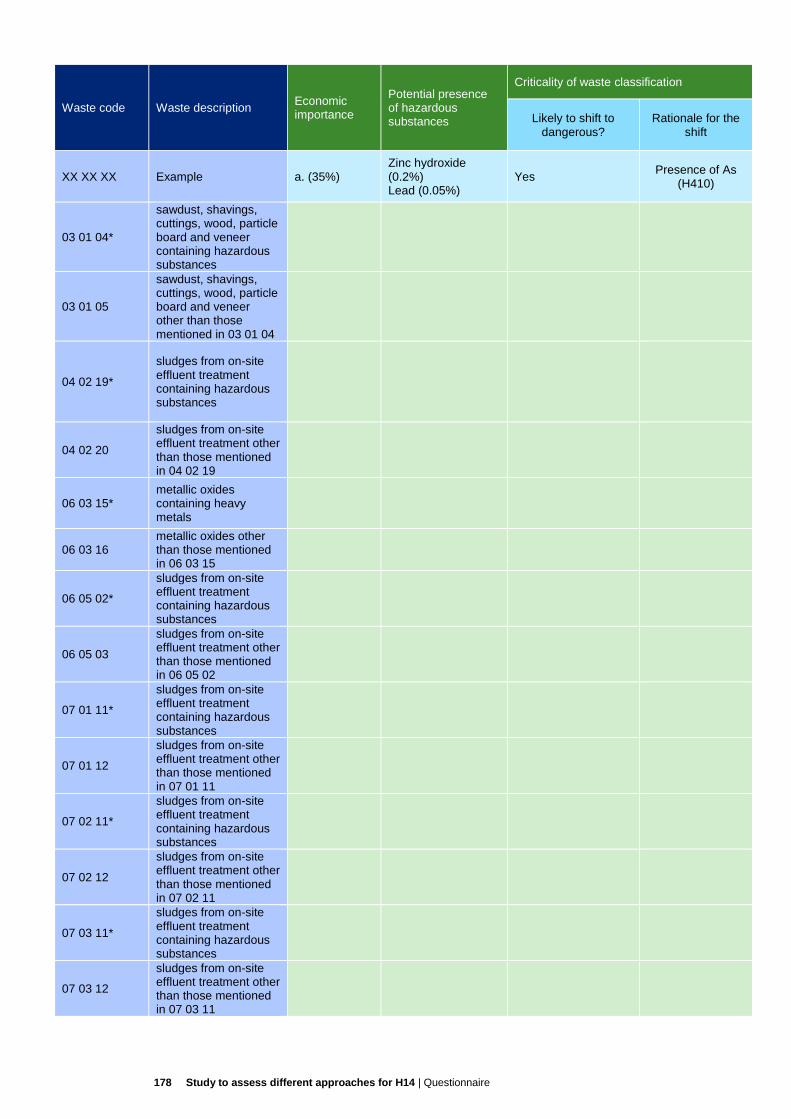
178 Study to assess different approaches for H14 | Questionnaire
Waste code Waste description Economic importance
Potential presence of hazardous substances
Criticality of waste classification
Likely to shift to dangerous?
Rationale for the shift
XX XX XX Example a. (35%) Zinc hydroxide (0.2%) Lead (0.05%)
Yes Presence of As
(H410)
03 01 04*
sawdust, shavings, cuttings, wood, particle board and veneer containing hazardous substances
03 01 05
sawdust, shavings, cuttings, wood, particle board and veneer other than those mentioned in 03 01 04
04 02 19*
sludges from on-site effluent treatment containing hazardous substances
04 02 20
sludges from on-site effluent treatment other than those mentioned in 04 02 19
06 03 15* metallic oxides containing heavy metals
06 03 16 metallic oxides other than those mentioned in 06 03 15
06 05 02*
sludges from on-site effluent treatment containing hazardous substances
06 05 03
sludges from on-site effluent treatment other than those mentioned in 06 05 02
07 01 11*
sludges from on-site effluent treatment containing hazardous substances
07 01 12
sludges from on-site effluent treatment other than those mentioned in 07 01 11
07 02 11*
sludges from on-site effluent treatment containing hazardous substances
07 02 12
sludges from on-site effluent treatment other than those mentioned in 07 02 11
07 03 11*
sludges from on-site effluent treatment containing hazardous substances
07 03 12
sludges from on-site effluent treatment other than those mentioned in 07 03 11
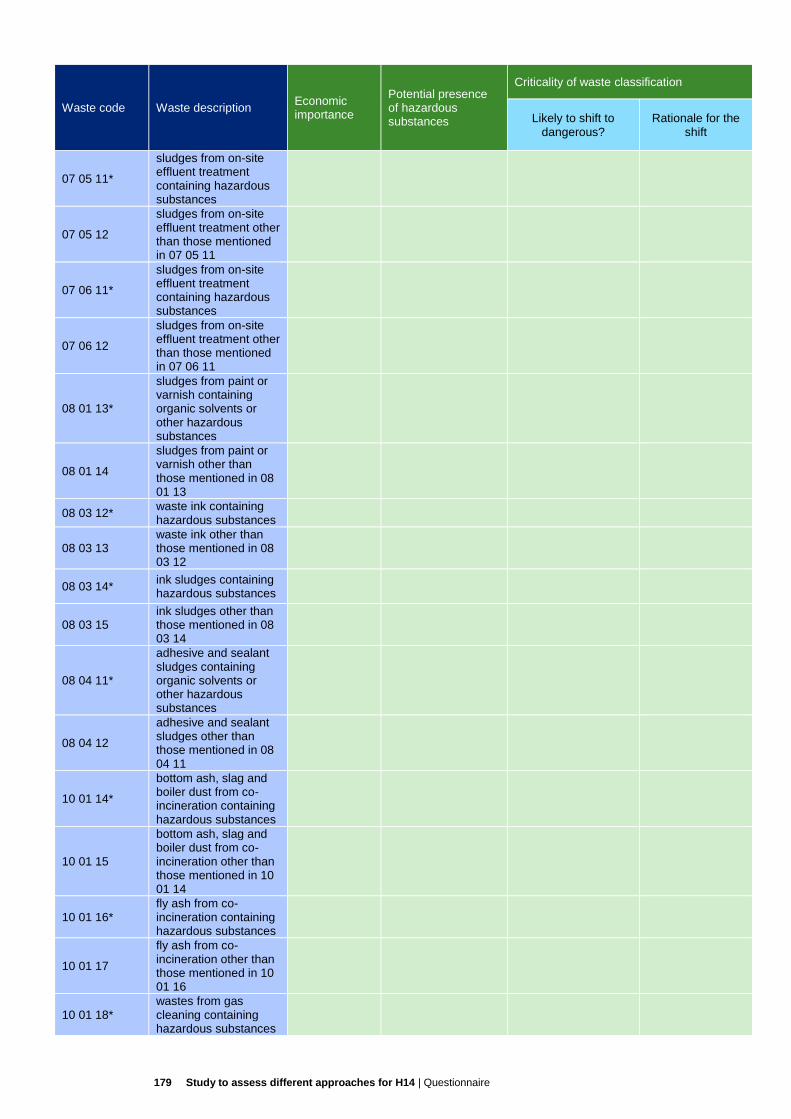
179 Study to assess different approaches for H14 | Questionnaire
Waste code Waste description Economic importance
Potential presence of hazardous substances
Criticality of waste classification
Likely to shift to dangerous?
Rationale for the shift
07 05 11*
sludges from on-site effluent treatment containing hazardous substances
07 05 12
sludges from on-site effluent treatment other than those mentioned in 07 05 11
07 06 11*
sludges from on-site effluent treatment containing hazardous substances
07 06 12
sludges from on-site effluent treatment other than those mentioned in 07 06 11
08 01 13*
sludges from paint or varnish containing organic solvents or other hazardous substances
08 01 14
sludges from paint or varnish other than those mentioned in 08 01 13
08 03 12* waste ink containing hazardous substances
08 03 13 waste ink other than those mentioned in 08 03 12
08 03 14* ink sludges containing hazardous substances
08 03 15 ink sludges other than those mentioned in 08 03 14
08 04 11*
adhesive and sealant sludges containing organic solvents or other hazardous substances
08 04 12
adhesive and sealant sludges other than those mentioned in 08 04 11
10 01 14*
bottom ash, slag and boiler dust from co-incineration containing hazardous substances
10 01 15
bottom ash, slag and boiler dust from co-incineration other than those mentioned in 10 01 14
10 01 16* fly ash from co-incineration containing hazardous substances
10 01 17
fly ash from co-incineration other than those mentioned in 10 01 16
10 01 18* wastes from gas cleaning containing hazardous substances
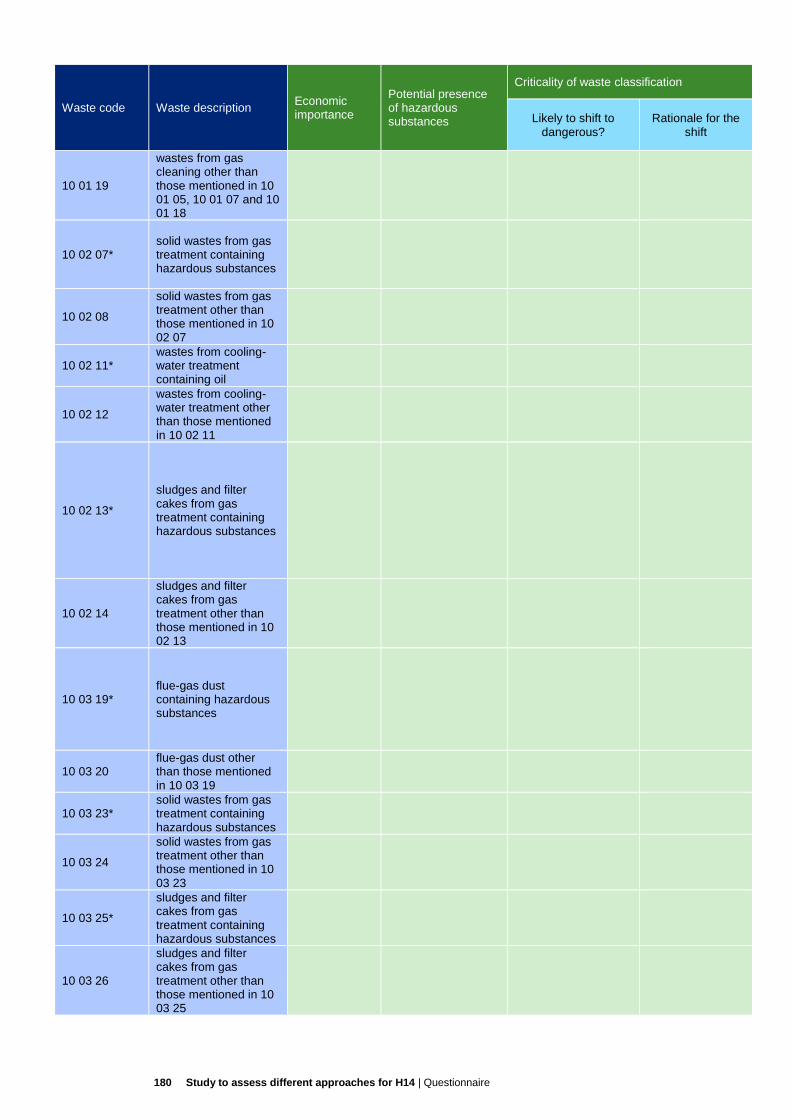
180 Study to assess different approaches for H14 | Questionnaire
Waste code Waste description Economic importance
Potential presence of hazardous substances
Criticality of waste classification
Likely to shift to dangerous?
Rationale for the shift
10 01 19
wastes from gas cleaning other than those mentioned in 10 01 05, 10 01 07 and 10 01 18
10 02 07* solid wastes from gas treatment containing hazardous substances
10 02 08
solid wastes from gas treatment other than those mentioned in 10 02 07
10 02 11* wastes from cooling-water treatment containing oil
10 02 12
wastes from cooling-water treatment other than those mentioned in 10 02 11
10 02 13*
sludges and filter cakes from gas treatment containing hazardous substances
10 02 14
sludges and filter cakes from gas treatment other than those mentioned in 10 02 13
10 03 19* flue-gas dust containing hazardous substances
10 03 20 flue-gas dust other than those mentioned in 10 03 19
10 03 23* solid wastes from gas treatment containing hazardous substances
10 03 24
solid wastes from gas treatment other than those mentioned in 10 03 23
10 03 25*
sludges and filter cakes from gas treatment containing hazardous substances
10 03 26
sludges and filter cakes from gas treatment other than those mentioned in 10 03 25
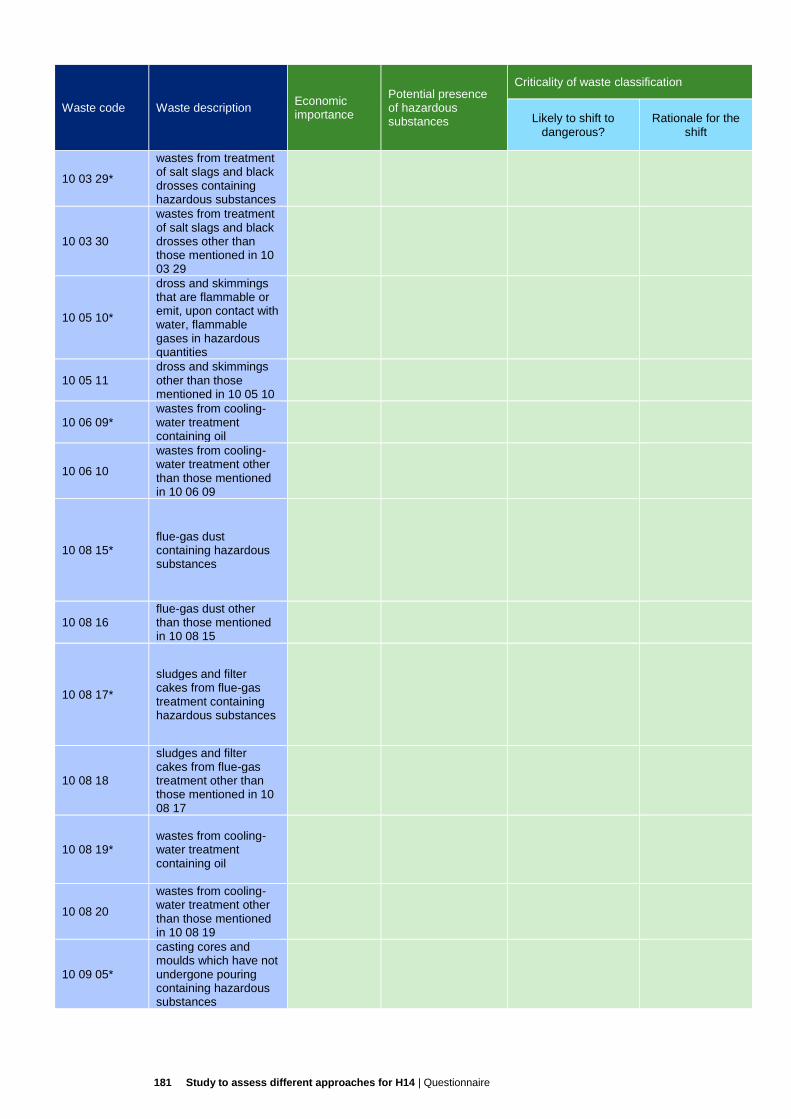
181 Study to assess different approaches for H14 | Questionnaire
Waste code Waste description Economic importance
Potential presence of hazardous substances
Criticality of waste classification
Likely to shift to dangerous?
Rationale for the shift
10 03 29*
wastes from treatment of salt slags and black drosses containing hazardous substances
10 03 30
wastes from treatment of salt slags and black drosses other than those mentioned in 10 03 29
10 05 10*
dross and skimmings that are flammable or emit, upon contact with water, flammable gases in hazardous quantities
10 05 11 dross and skimmings other than those mentioned in 10 05 10
10 06 09* wastes from cooling-water treatment containing oil
10 06 10
wastes from cooling-water treatment other than those mentioned in 10 06 09
10 08 15* flue-gas dust containing hazardous substances
10 08 16 flue-gas dust other than those mentioned in 10 08 15
10 08 17*
sludges and filter cakes from flue-gas treatment containing hazardous substances
10 08 18
sludges and filter cakes from flue-gas treatment other than those mentioned in 10 08 17
10 08 19* wastes from cooling-water treatment containing oil
10 08 20
wastes from cooling-water treatment other than those mentioned in 10 08 19
10 09 05*
casting cores and moulds which have not undergone pouring containing hazardous substances

182 Study to assess different approaches for H14 | Questionnaire
Waste code Waste description Economic importance
Potential presence of hazardous substances
Criticality of waste classification
Likely to shift to dangerous?
Rationale for the shift
10 09 06
casting cores and moulds which have not undergone pouring other than those mentioned in 10 09 05
10 09 07*
casting cores and moulds which have undergone pouring containing hazardous substances
10 09 08
casting cores and moulds which have undergone pouring other than those mentioned in 10 09 07
10 09 11* other particulates containing hazardous substances
10 09 12 other particulates other than those mentioned in 10 09 11
10 09 13* waste binders containing hazardous substances
10 09 14 waste binders other than those mentioned in 10 09 13
10 10 05*
casting cores and moulds which have not undergone pouring, containing hazardous substances
10 10 06
casting cores and moulds which have not undergone pouring, other than those mentioned in 10 10 05
10 10 07*
casting cores and moulds which have undergone pouring, containing hazardous substances
10 10 08
casting cores and moulds which have undergone pouring, other than those mentioned in 10 10 07
10 10 09* flue-gas dust containing hazardous substances
10 10 10 flue-gas dust other than those mentioned in 10 10 09
10 10 11* other particulates containing hazardous substances
10 10 12 other particulates other than those mentioned in 10 10 11
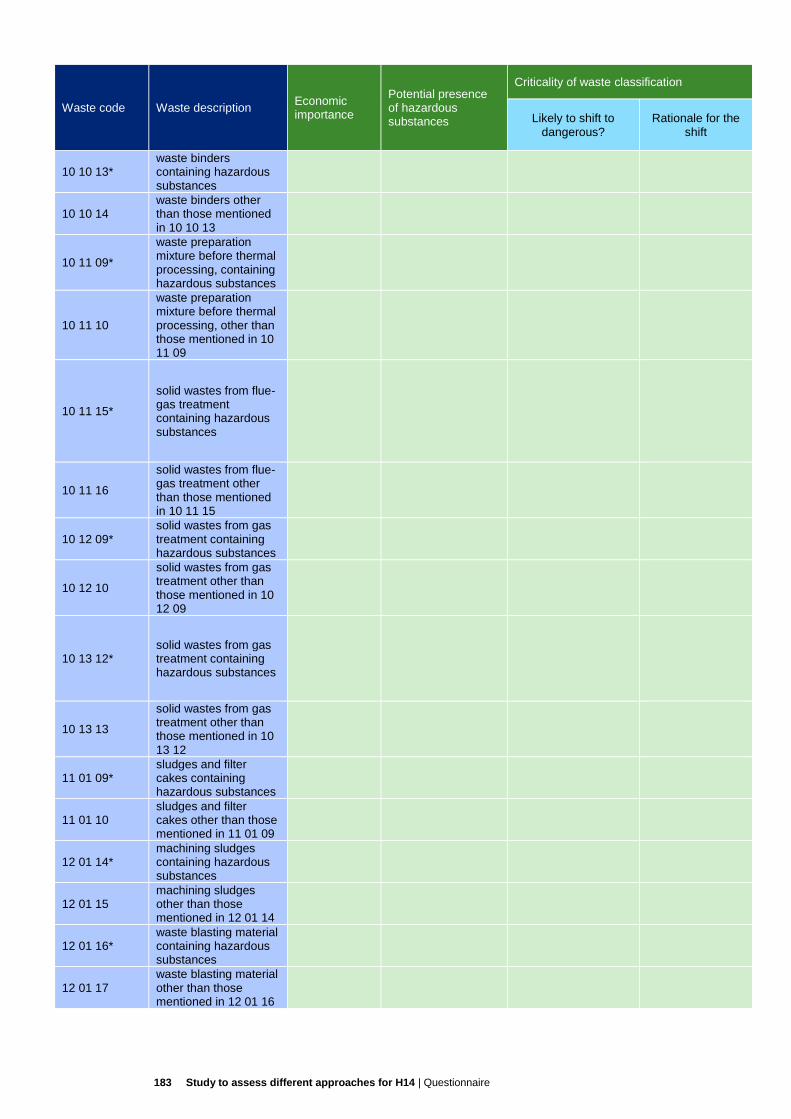
183 Study to assess different approaches for H14 | Questionnaire
Waste code Waste description Economic importance
Potential presence of hazardous substances
Criticality of waste classification
Likely to shift to dangerous?
Rationale for the shift
10 10 13* waste binders containing hazardous substances
10 10 14 waste binders other than those mentioned in 10 10 13
10 11 09*
waste preparation mixture before thermal processing, containing hazardous substances
10 11 10
waste preparation mixture before thermal processing, other than those mentioned in 10 11 09
10 11 15*
solid wastes from flue-gas treatment containing hazardous substances
10 11 16
solid wastes from flue-gas treatment other than those mentioned in 10 11 15
10 12 09* solid wastes from gas treatment containing hazardous substances
10 12 10
solid wastes from gas treatment other than those mentioned in 10 12 09
10 13 12* solid wastes from gas treatment containing hazardous substances
10 13 13
solid wastes from gas treatment other than those mentioned in 10 13 12
11 01 09* sludges and filter cakes containing hazardous substances
11 01 10 sludges and filter cakes other than those mentioned in 11 01 09
12 01 14* machining sludges containing hazardous substances
12 01 15 machining sludges other than those mentioned in 12 01 14
12 01 16* waste blasting material containing hazardous substances
12 01 17 waste blasting material other than those mentioned in 12 01 16

184 Study to assess different approaches for H14 | Questionnaire
Waste code Waste description Economic importance
Potential presence of hazardous substances
Criticality of waste classification
Likely to shift to dangerous?
Rationale for the shift
16 11 01*
carbon-based linings and refractories from metallurgical processes containing hazardous substances
16 11 02
carbon-based linings and refractories from metallurgical processes others than those mentioned in 16 11 01
16 11 03*
other linings and refractories from metallurgical processes containing hazardous substances
16 11 04
other linings and refractories from metallurgical processes other than those mentioned in 16 11 03
16 11 05*
linings and refractories from non-metallurgical processes containing hazardous substances
16 11 06
linings and refractories from non-metallurgical processes others than those mentioned in 16 11 05
17 01 06*
mixtures of, or separate fractions of concrete, bricks, tiles and ceramics containing hazardous substances
17 01 07
mixtures of concrete, bricks, tiles and ceramics other than those mentioned in 17 01 06
17 03 01* bituminous mixtures containing coal tar
17 03 02 bituminous mixtures other than those mentioned in 17 03 01
17 05 03* soil and stones containing hazardous substances
17 05 04 soil and stones other than those mentioned in 17 05 03
17 05 05* dredging spoil containing hazardous substances
17 05 06 dredging spoil other than those mentioned in 17 05 05
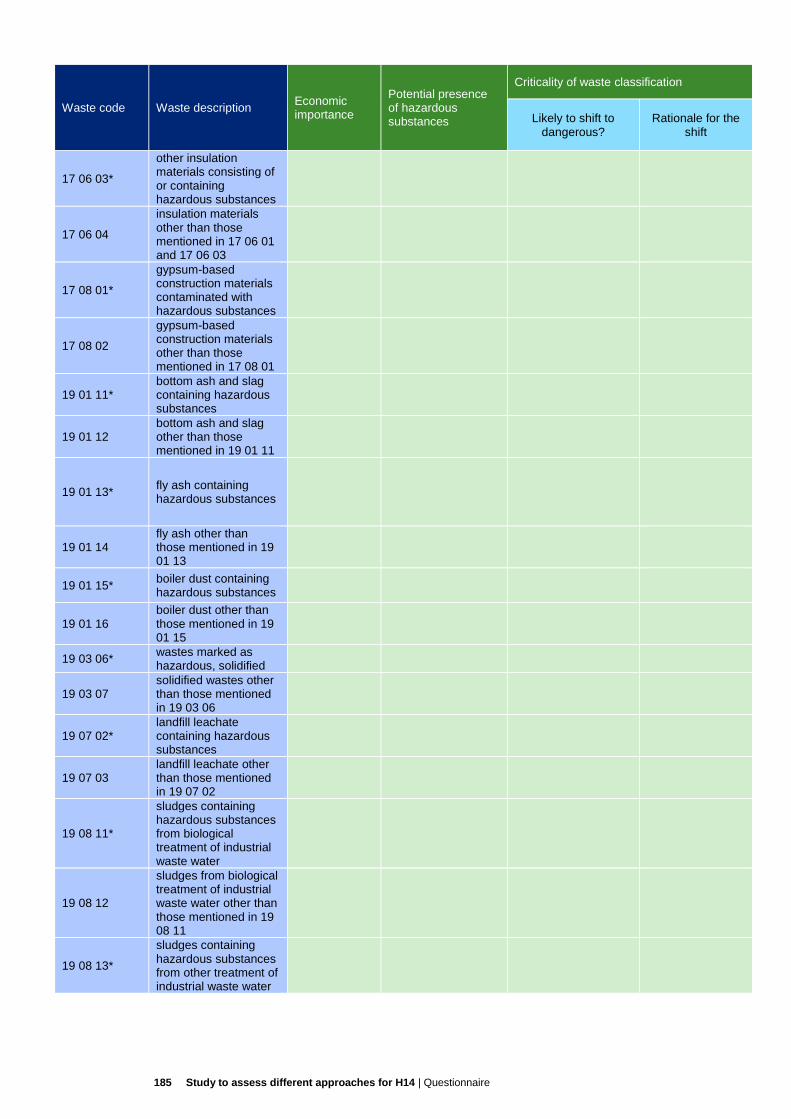
185 Study to assess different approaches for H14 | Questionnaire
Waste code Waste description Economic importance
Potential presence of hazardous substances
Criticality of waste classification
Likely to shift to dangerous?
Rationale for the shift
17 06 03*
other insulation materials consisting of or containing hazardous substances
17 06 04
insulation materials other than those mentioned in 17 06 01 and 17 06 03
17 08 01*
gypsum-based construction materials contaminated with hazardous substances
17 08 02
gypsum-based construction materials other than those mentioned in 17 08 01
19 01 11* bottom ash and slag containing hazardous substances
19 01 12 bottom ash and slag other than those mentioned in 19 01 11
19 01 13* fly ash containing hazardous substances
19 01 14 fly ash other than those mentioned in 19 01 13
19 01 15* boiler dust containing hazardous substances
19 01 16 boiler dust other than those mentioned in 19 01 15
19 03 06* wastes marked as hazardous, solidified
19 03 07 solidified wastes other than those mentioned in 19 03 06
19 07 02* landfill leachate containing hazardous substances
19 07 03 landfill leachate other than those mentioned in 19 07 02
19 08 11*
sludges containing hazardous substances from biological treatment of industrial waste water
19 08 12
sludges from biological treatment of industrial waste water other than those mentioned in 19 08 11
19 08 13*
sludges containing hazardous substances from other treatment of industrial waste water
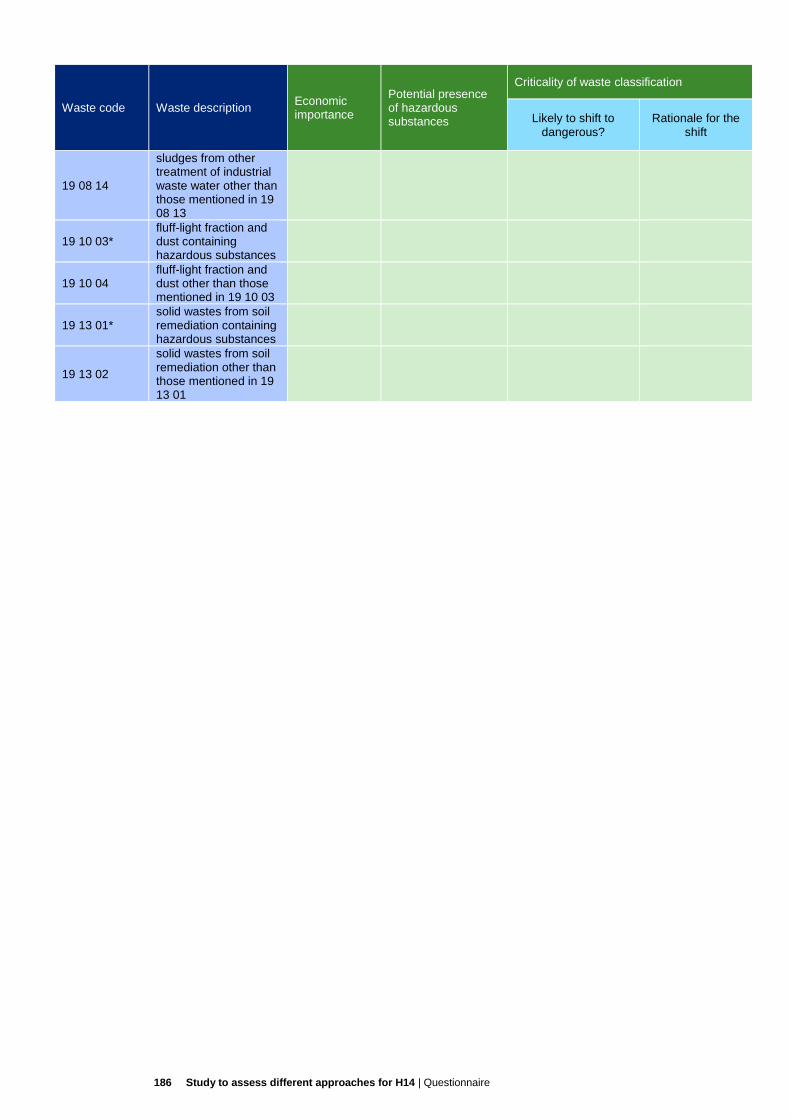
186 Study to assess different approaches for H14 | Questionnaire
Waste code Waste description Economic importance
Potential presence of hazardous substances
Criticality of waste classification
Likely to shift to dangerous?
Rationale for the shift
19 08 14
sludges from other treatment of industrial waste water other than those mentioned in 19 08 13
19 10 03* fluff-light fraction and dust containing hazardous substances
19 10 04 fluff-light fraction and dust other than those mentioned in 19 10 03
19 13 01* solid wastes from soil remediation containing hazardous substances
19 13 02
solid wastes from soil remediation other than those mentioned in 19 13 01

187 Study to assess different approaches for H14 | Questionnaire
Annex 4. Questionnaire sent to
industrial stakeholders for the
impact assessment
1. General information
1.1 Your full name and your email address (please specify your country):
_______________________________________________________________________
1.2 Please provide the name of the organisation to which you belong:
______________________________________________________________________
1.3 Type of waste your expertise covers (bold the right answer):
All
Specific
Provide a general description of waste categories you cover (or waste codes
when relevant):
_____________________________________________________________
2. Economic feasibility of the classification methods
2.1. Please assess the feasibility of the classification methods, according to the following
criteria (the methods are described in the Annex to this questionnaire)? Please fill in the
table below including justifications for your choices.
Please measure feasibility with the symbols +/++/+++ (“+” is low feasibility and “+++” is
high feasibility)
Criteria Feasibility (measured by + /++ /+++) Comments
Level of specialised knowledge required to apply the method
Method 1: ________________________
Method 2: ________________________
Method 3: ________________________
Method 4: ________________________
Affordability of the sampling of waste
Method 1: ________________________
Method 2: ________________________
Method 3: ________________________
Method 4: ________________________
Affordability of analytical determination
Method 1: ________________________
Method 2: ________________________
Method 3: ________________________
Method 4: ________________________
Need for consultancy work
Method 1: ________________________
Method 2: ________________________
Method 3: ________________________
Method 4: ________________________
2.2 For each method, could you provide us with an estimate of the costs related to:
The preparation of waste sample for chemical analysis: _______________
Chemical analysis of the samples: ________________________________
188 Study to assess different approaches for H14 | Questionnaire
The application of the different methodology (incl. consultancy work if needed):
___________________________________________________________
3. Environmental, social and economic impacts of a potential change in
classification
The implementation of any of the four proposed classification methods may lead to a
change in the classification of some waste, from non-hazardous to hazardous, or from
hazardous to non-hazardous. For mirror pairs (waste codes), this means that some waste
streams currently classified under one entry could end up being classified under the other
entry of the pair.
We wish to assess the environmental and socio-economic impacts of these potential
changes of classification. The mirror pairs selected for assessment are reported in Table
55 in Annex, at the end of this questionnaire. In bold are the priority pairs.
Please share with us case studies of potential impacts, using the template provided on the
next page. You can copy/paste the template in the following pages for drafting more than
one case study. You can also send us data relevant to the socio-economic impact
assessment even if it does not fit to the template of case studies.
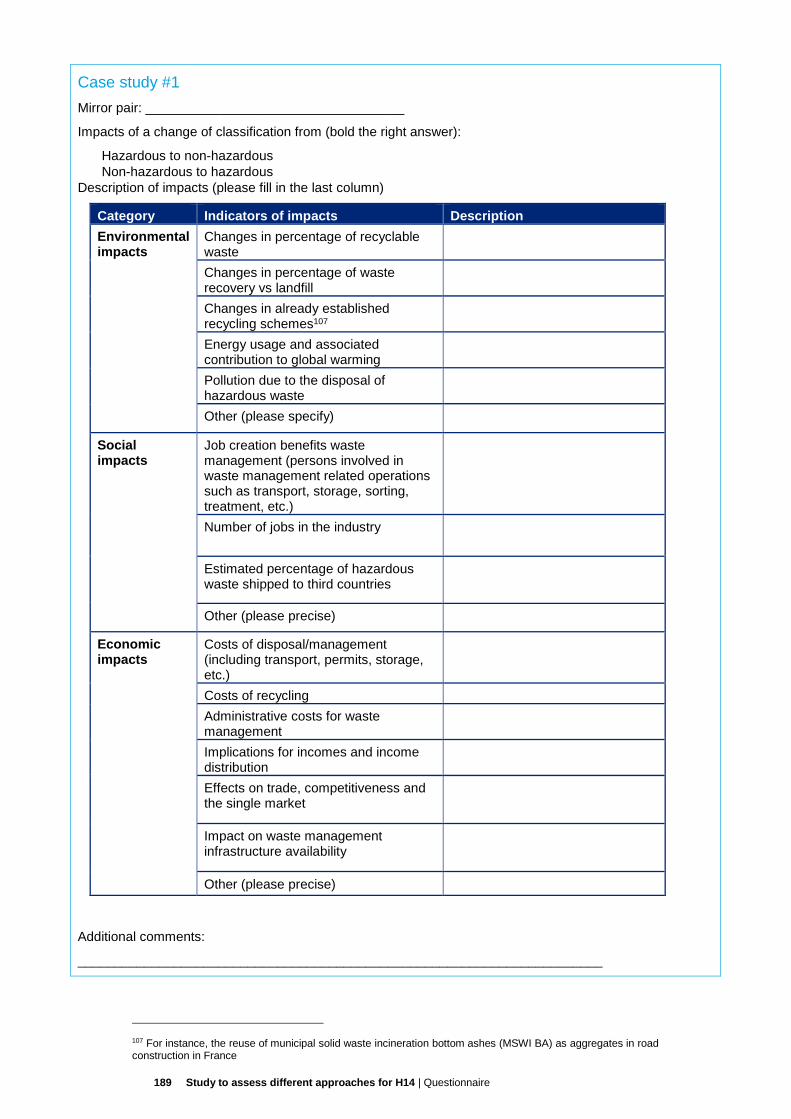
189 Study to assess different approaches for H14 | Questionnaire
Case study #1
Mirror pair: ___________________________________
Impacts of a change of classification from (bold the right answer):
Hazardous to non-hazardous
Non-hazardous to hazardous
Description of impacts (please fill in the last column)
Category Indicators of impacts Description
Environmental impacts
Changes in percentage of recyclable waste
Changes in percentage of waste recovery vs landfill
Changes in already established recycling schemes107
Energy usage and associated contribution to global warming
Pollution due to the disposal of hazardous waste
Other (please specify)
Social impacts
Job creation benefits waste management (persons involved in waste management related operations such as transport, storage, sorting, treatment, etc.)
Number of jobs in the industry
Estimated percentage of hazardous waste shipped to third countries
Other (please precise)
Economic impacts
Costs of disposal/management (including transport, permits, storage, etc.)
Costs of recycling
Administrative costs for waste management
Implications for incomes and income distribution
Effects on trade, competitiveness and the single market
Impact on waste management infrastructure availability
Other (please precise)
Additional comments:
_______________________________________________________________________
107 For instance, the reuse of municipal solid waste incineration bottom ashes (MSWI BA) as aggregates in road construction in France
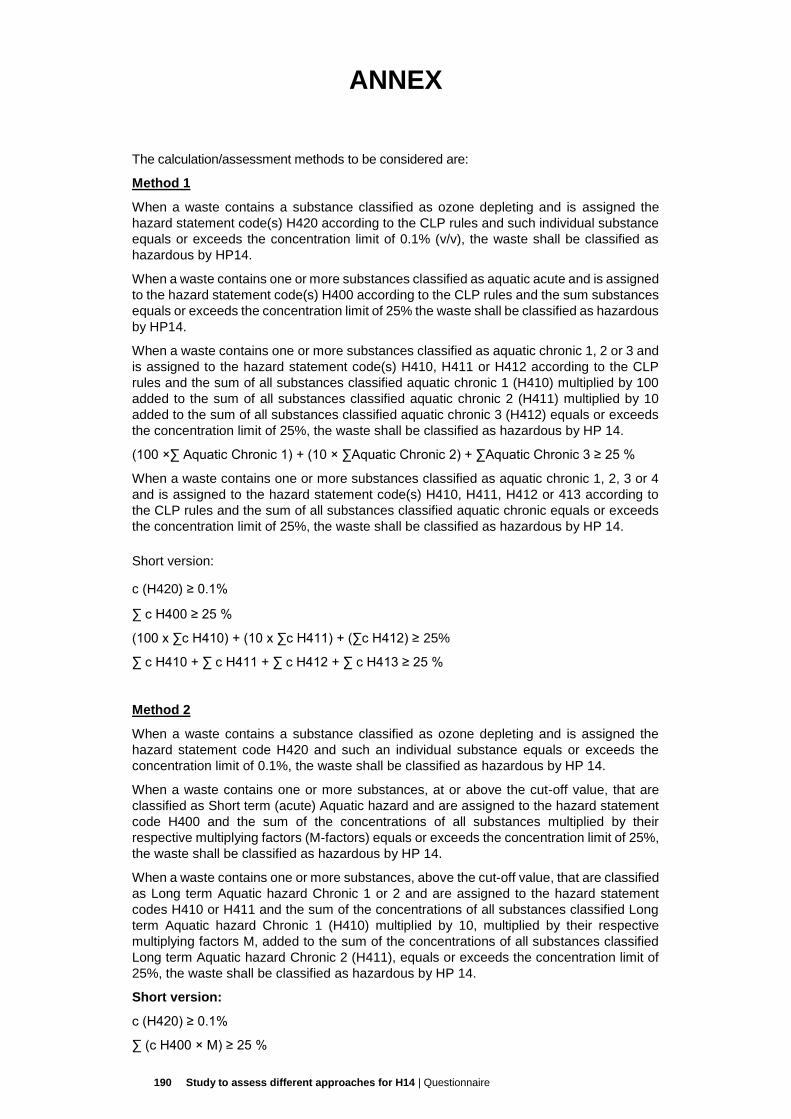
190 Study to assess different approaches for H14 | Questionnaire
ANNEX
The calculation/assessment methods to be considered are:
Method 1
When a waste contains a substance classified as ozone depleting and is assigned the
hazard statement code(s) H420 according to the CLP rules and such individual substance
equals or exceeds the concentration limit of 0.1% (v/v), the waste shall be classified as
hazardous by HP14.
When a waste contains one or more substances classified as aquatic acute and is assigned
to the hazard statement code(s) H400 according to the CLP rules and the sum substances
equals or exceeds the concentration limit of 25% the waste shall be classified as hazardous
by HP14.
When a waste contains one or more substances classified as aquatic chronic 1, 2 or 3 and
is assigned to the hazard statement code(s) H410, H411 or H412 according to the CLP
rules and the sum of all substances classified aquatic chronic 1 (H410) multiplied by 100
added to the sum of all substances classified aquatic chronic 2 (H411) multiplied by 10
added to the sum of all substances classified aquatic chronic 3 (H412) equals or exceeds
the concentration limit of 25%, the waste shall be classified as hazardous by HP 14.
(100 ×∑ Aquatic Chronic 1) + (10 × ∑Aquatic Chronic 2) + ∑Aquatic Chronic 3 ≥ 25 %
When a waste contains one or more substances classified as aquatic chronic 1, 2, 3 or 4
and is assigned to the hazard statement code(s) H410, H411, H412 or 413 according to
the CLP rules and the sum of all substances classified aquatic chronic equals or exceeds
the concentration limit of 25%, the waste shall be classified as hazardous by HP 14.
Short version:
c (H420) ≥ 0.1%
∑ c H400 ≥ 25 %
(100 x ∑c H410) + (10 x ∑c H411) + (∑c H412) ≥ 25%
∑ c H410 + ∑ c H411 + ∑ c H412 + ∑ c H413 ≥ 25 %
Method 2
When a waste contains a substance classified as ozone depleting and is assigned the
hazard statement code H420 and such an individual substance equals or exceeds the
concentration limit of 0.1%, the waste shall be classified as hazardous by HP 14.
When a waste contains one or more substances, at or above the cut-off value, that are
classified as Short term (acute) Aquatic hazard and are assigned to the hazard statement
code H400 and the sum of the concentrations of all substances multiplied by their
respective multiplying factors (M-factors) equals or exceeds the concentration limit of 25%,
the waste shall be classified as hazardous by HP 14.
When a waste contains one or more substances, above the cut-off value, that are classified
as Long term Aquatic hazard Chronic 1 or 2 and are assigned to the hazard statement
codes H410 or H411 and the sum of the concentrations of all substances classified Long
term Aquatic hazard Chronic 1 (H410) multiplied by 10, multiplied by their respective
multiplying factors M, added to the sum of the concentrations of all substances classified
Long term Aquatic hazard Chronic 2 (H411), equals or exceeds the concentration limit of
25%, the waste shall be classified as hazardous by HP 14.
Short version:
c (H420) ≥ 0.1%
∑ (c H400 × M) ≥ 25 %
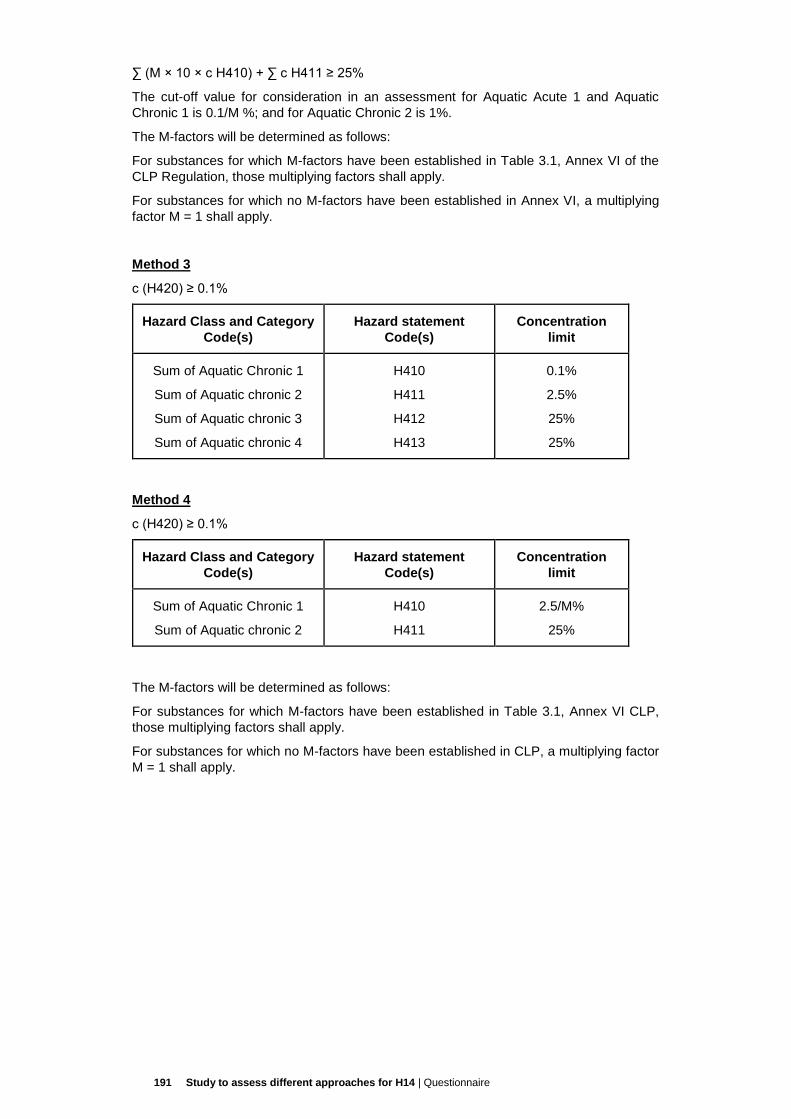
191 Study to assess different approaches for H14 | Questionnaire
∑ (M × 10 × c H410) + ∑ c H411 ≥ 25%
The cut-off value for consideration in an assessment for Aquatic Acute 1 and Aquatic
Chronic 1 is 0.1/M %; and for Aquatic Chronic 2 is 1%.
The M-factors will be determined as follows:
For substances for which M-factors have been established in Table 3.1, Annex VI of the
CLP Regulation, those multiplying factors shall apply.
For substances for which no M-factors have been established in Annex VI, a multiplying
factor M = 1 shall apply.
Method 3
c (H420) ≥ 0.1%
Hazard Class and Category
Code(s)
Hazard statement
Code(s)
Concentration
limit
Sum of Aquatic Chronic 1
Sum of Aquatic chronic 2
Sum of Aquatic chronic 3
Sum of Aquatic chronic 4
H410
H411
H412
H413
0.1%
2.5%
25%
25%
Method 4
c (H420) ≥ 0.1%
Hazard Class and Category
Code(s)
Hazard statement
Code(s)
Concentration
limit
Sum of Aquatic Chronic 1
Sum of Aquatic chronic 2
H410
H411
2.5/M%
25%
The M-factors will be determined as follows:
For substances for which M-factors have been established in Table 3.1, Annex VI CLP,
those multiplying factors shall apply.
For substances for which no M-factors have been established in CLP, a multiplying factor
M = 1 shall apply.
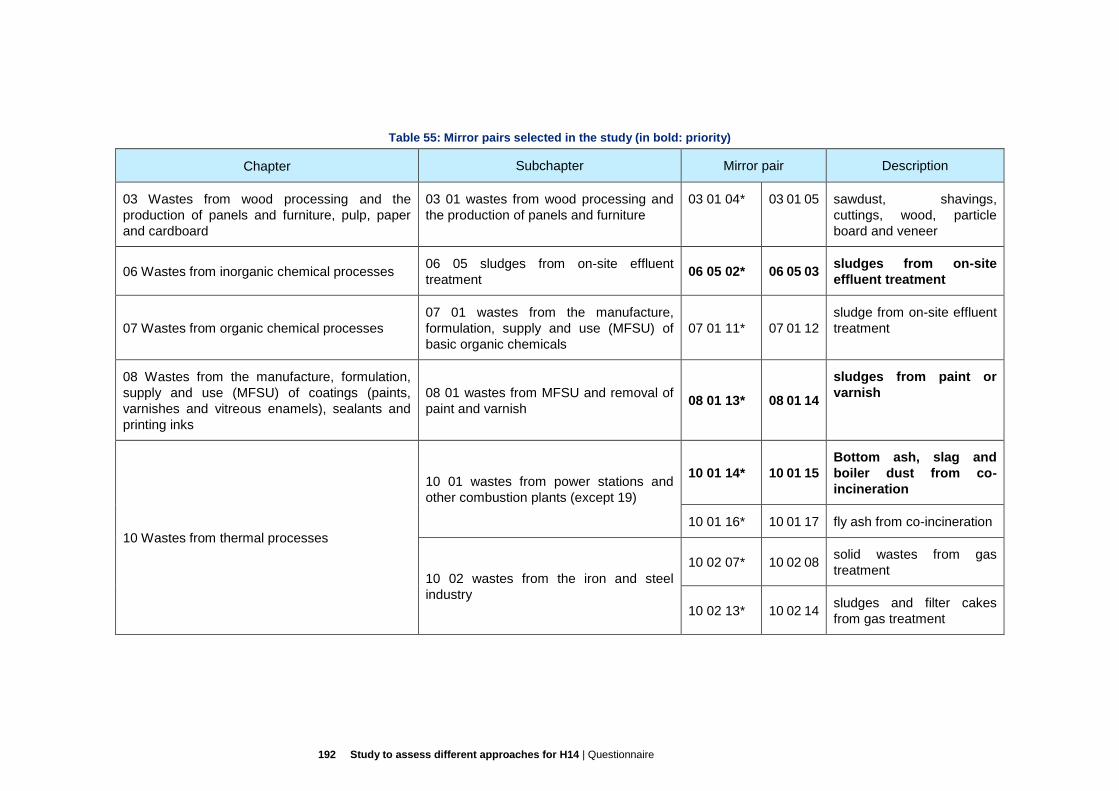
192 Study to assess different approaches for H14 | Questionnaire
Table 55: Mirror pairs selected in the study (in bold: priority)
Chapter Subchapter Mirror pair Description
03 Wastes from wood processing and the
production of panels and furniture, pulp, paper
and cardboard
03 01 wastes from wood processing and
the production of panels and furniture
03 01 04* 03 01 05 sawdust, shavings,
cuttings, wood, particle
board and veneer
06 Wastes from inorganic chemical processes 06 05 sludges from on-site effluent
treatment 06 05 02* 06 05 03
sludges from on-site
effluent treatment
07 Wastes from organic chemical processes
07 01 wastes from the manufacture,
formulation, supply and use (MFSU) of
basic organic chemicals
07 01 11* 07 01 12
sludge from on-site effluent
treatment
08 Wastes from the manufacture, formulation,
supply and use (MFSU) of coatings (paints,
varnishes and vitreous enamels), sealants and
printing inks
08 01 wastes from MFSU and removal of
paint and varnish 08 01 13* 08 01 14
sludges from paint or
varnish
10 Wastes from thermal processes
10 01 wastes from power stations and
other combustion plants (except 19)
10 01 14* 10 01 15
Bottom ash, slag and
boiler dust from co-
incineration
10 01 16* 10 01 17 fly ash from co-incineration
10 02 wastes from the iron and steel
industry
10 02 07* 10 02 08 solid wastes from gas
treatment
10 02 13* 10 02 14 sludges and filter cakes
from gas treatment
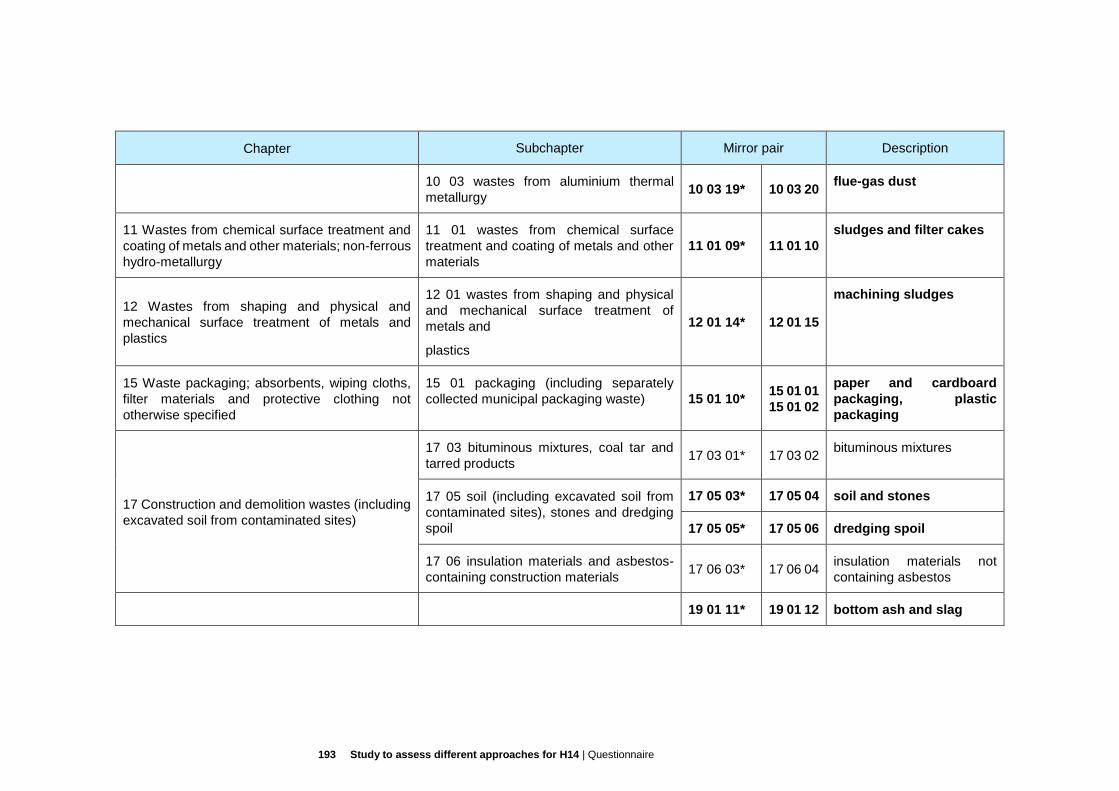
193 Study to assess different approaches for H14 | Questionnaire
Chapter Subchapter Mirror pair Description
10 03 wastes from aluminium thermal
metallurgy 10 03 19* 10 03 20
flue-gas dust
11 Wastes from chemical surface treatment and
coating of metals and other materials; non-ferrous
hydro-metallurgy
11 01 wastes from chemical surface
treatment and coating of metals and other
materials
11 01 09* 11 01 10
sludges and filter cakes
12 Wastes from shaping and physical and
mechanical surface treatment of metals and
plastics
12 01 wastes from shaping and physical
and mechanical surface treatment of
metals and
plastics
12 01 14* 12 01 15
machining sludges
15 Waste packaging; absorbents, wiping cloths,
filter materials and protective clothing not
otherwise specified
15 01 packaging (including separately
collected municipal packaging waste) 15 01 10* 15 01 01
15 01 02
paper and cardboard
packaging, plastic
packaging
17 Construction and demolition wastes (including
excavated soil from contaminated sites)
17 03 bituminous mixtures, coal tar and
tarred products 17 03 01* 17 03 02
bituminous mixtures
17 05 soil (including excavated soil from
contaminated sites), stones and dredging
spoil
17 05 03* 17 05 04 soil and stones
17 05 05* 17 05 06 dredging spoil
17 06 insulation materials and asbestos-
containing construction materials 17 06 03* 17 06 04
insulation materials not
containing asbestos
19 01 11* 19 01 12 bottom ash and slag
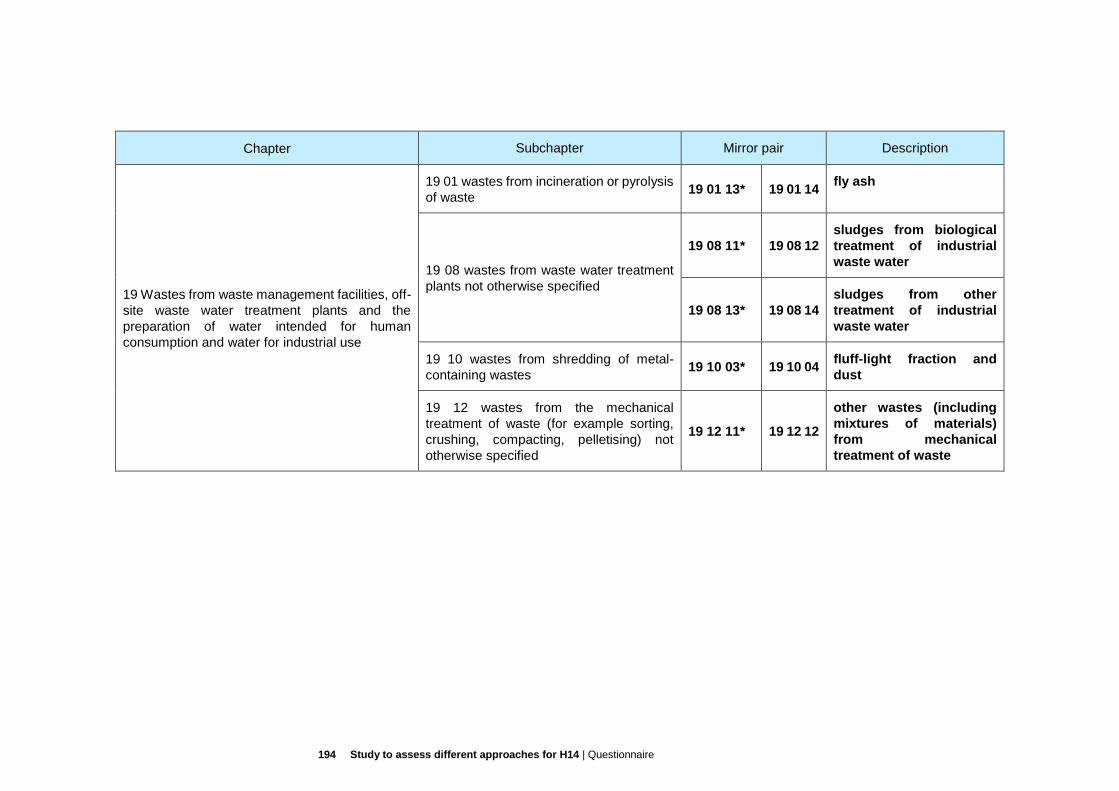
194 Study to assess different approaches for H14 | Questionnaire
Chapter Subchapter Mirror pair Description
19 Wastes from waste management facilities, off-
site waste water treatment plants and the
preparation of water intended for human
consumption and water for industrial use
19 01 wastes from incineration or pyrolysis
of waste 19 01 13* 19 01 14
fly ash
19 08 wastes from waste water treatment
plants not otherwise specified
19 08 11* 19 08 12
sludges from biological
treatment of industrial
waste water
19 08 13* 19 08 14
sludges from other
treatment of industrial
waste water
19 10 wastes from shredding of metal-
containing wastes 19 10 03* 19 10 04
fluff-light fraction and
dust
19 12 wastes from the mechanical
treatment of waste (for example sorting,
crushing, compacting, pelletising) not
otherwise specified
19 12 11* 19 12 12
other wastes (including
mixtures of materials)
from mechanical
treatment of waste
195 Study to assess different approaches for H14 | Questionnaire
Annex 5.Application of the calculation methods
See attached Excel file.

196 Study to assess different approaches for H14 | Questionnaire
Annex 6. Study from the French
Ministry of Ecology
See attached PDF file.

Deloitte refers to one or more of Deloitte Touche Tohmatsu Limited, a UK private company limited by guarantee (“DTTL”), its
network of member firms, and their related entities. DTTL and each of its member firms are legally separate and independent
entities. DTTL (also referred to as “Deloitte Global”) does not provide services to clients. Please see www.deloitte.com/about for
a more detailed description of DTTL and its member firms.
© 2014 Deloitte SA. Member of Deloitte Touche Tohmatsu Limited