using remote sensing to assess tsunami-induced impacts on
TRANSCRIPT
Nat. Hazards Earth Syst. Sci., 10, 729–745, 2010www.nat-hazards-earth-syst-sci.net/10/729/2010/© Author(s) 2010. This work is distributed underthe Creative Commons Attribution 3.0 License.
Natural Hazardsand Earth
System Sciences
Using remote sensing to assess tsunami-induced impacts on coastalforest ecosystems at the Andaman Sea coast of Thailand
H. Roemer1, G. Kaiser1, H. Sterr1, and R. Ludwig2
1Department of Geography, Christian-Albrechts-Universitat zu Kiel, Kiel, Germany2Department of Geography, Ludwig-Maximilians-Universitat Munchen, Munich, Germany
Received: 22 December 2009 – Revised: 16 March 2010 – Accepted: 20 March 2010 – Published: 13 April 2010
Abstract. The December 2004 tsunami strongly impactedcoastal ecosystems along the Andaman Sea coast of Thai-land. In this paper tsunami-induced damage of five differentcoastal forest ecosystems at the Phang-Nga province coastis analysed with a remote sensing driven approach based onmulti-date IKONOS imagery. Two change detection algo-rithms, change vector analysis (CVA) and direct multi-dateclassification (DMC), are applied and compared regardingtheir applicability to assess tsunami impacts. The analy-sis shows that DMC outperforms CVA in terms of accuracy(Kappa values for DMC ranging between 0.947 and 0.950and between 0.610–0.730 for CVA respectively) and the de-gree of detail of the created change classes. Results fromDMC show that mangroves were the worst damaged amongthe five forests, with a 55% of directly damaged forest in thestudy area, followed by casuarina forest and coconut planta-tion. Additionally this study points out the uncertainties inboth methods which are mainly due to a lack of ground truthinformation for the time between the two acquisition datesof satellite images. The created damage maps help to betterunderstand the way the tsunami impacted coastal forests andgive basic information for estimating tsunami sensitivity ofcoastal forests.
1 Introduction
The Indian Ocean Tsunami in 2004 was one of the most dev-astating natural disasters ever. Besides the enormous num-ber of fatalities and the massive destruction of settlementsand infrastructure, coastal ecosystems were deteriorated or
Correspondence to:H. Roemer([email protected])
destroyed (e.g. Szczucinski et al., 2006; Phongsuwan et al.,2006). At the Andaman Sea coast of Thailand, the Phang-Nga province was one of the most severely affected regions.For instance, in total 386 ha of mangrove forests were im-pacted directly by the tsunami (Paphavasit et al., 2009), othercoastal forests were uprooted or washed away, coral reefswere affected in various ways, and beaches as well as tidal in-lets were eroded (e.g. Paphavasit et al., 2009; DMCR, 2005).There are some studies from Thailand referring to the assess-ment of tsunami impacts on coastal forests. Most of themare based on field work, e.g. measurements conducted by theDepartment of Marine and Coastal Resources (e.g. DMCR,2005, 2006; DMCR and Thammasat University, 2005) or byUNEP (UNEP, 2005) or the Office of Natural Resources andEnvironmental Policy and Planning (ONEP) (ONEP, 2005).Some studies focus on the impacts on mangrove forests(Yanagisawa et al., 2009a, b; Paphavasit et al., 2009) and onthe role of mangroves acting as natural buffers in mitigatingtsunami impacts (Danielsen et al., 2005; Chang et al., 2006;Chatenoux and Peduzzi, 2007; Tanaka et al., 2006).
On a larger spatial scale, remote sensing based studieswere conducted in Thailand in order to provide a quickdamage assessment: Vu et al. (2007) used a dual-scaleapproach based on ASTER and IKONOS imagery, whileKouchi and Yamazaki (2007) used a digital elevation modeland spectral indices (NDVI, NDWI, NDSI) developed fromASTER pre- and post-tsunami data. Other remote sens-ing studies refer to specific ecosystems like mangroves:Bahugana et al. (2008) analyse tsunami impacts on coralreefs and mangroves at the Andaman and Nicobar Islandsusing an unsupervised post-classification approach based onmulti-temporal RESOURCESAT and AWiFS data. Damageassessment of mangroves based on SPOT pansharpened ima-gery has been conducted for Phang-Nga by Deeudomchan
Published by Copernicus Publications on behalf of the European Geosciences Union.
730 H. Roemer et al.: Using remote sensing to assess tsunami-induced impacts on coastal forests in South Thailand
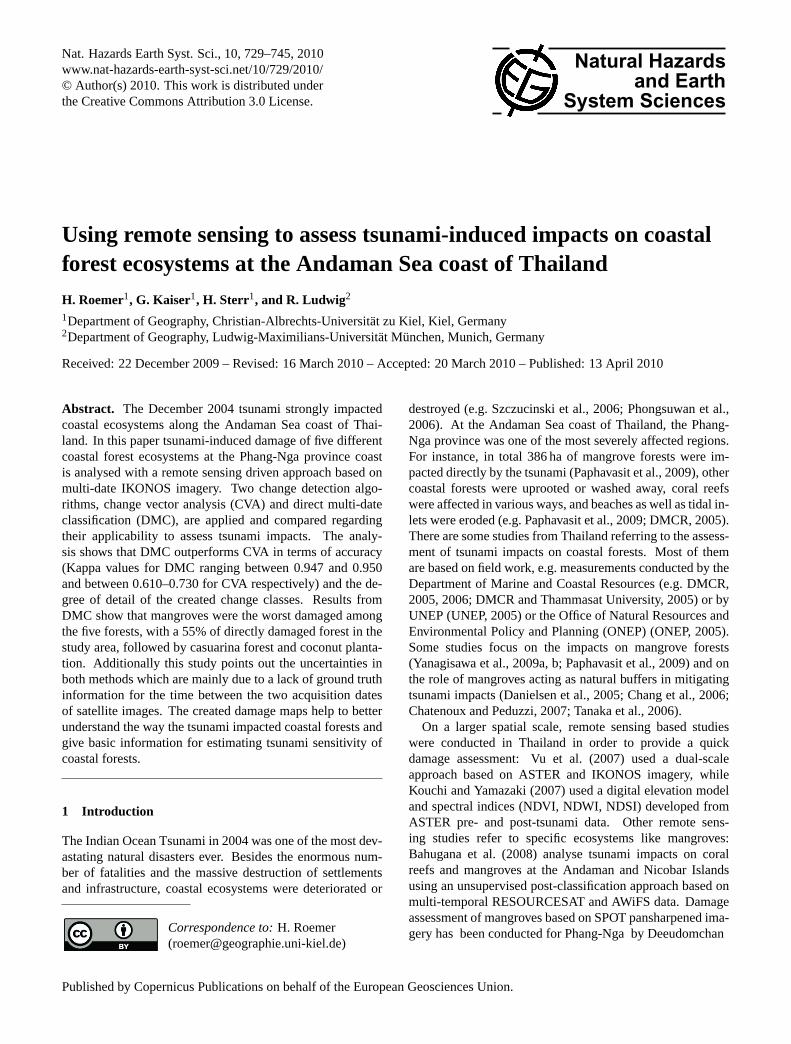
Fig. 1. Study area. Satellite images are based on IKONOS multispectral data from 13 January 2003. The administrative units are at thecommunity level (muban).
et al. (2006). It was found that mangroves along the shoreswere impacted more strongly than those in the inner areas.A combined approach based on change detection techniques(Landsat TM) and GIS proximity analysis was presented bySirikulchayanon et al. (2008).
In this study, tsunami-related impacts are determinedfrom satellite image analyses for five different coastal for-est ecosystems (including mangrove forests, casuarina beachforests, mixed beach forests, melaleuca forest and coconutplantation). Two different change detection techniques(change vector analysis, CVA, and direct multi-date classi-fication, DMC) are compared. Thus, this study contributesto the general need for studies focussing on comparativeevaluations of change detection studies (Mas, 1999). DMC(Weissmiller et al., 1977; Mas, 1999) was applied respec-tively for the red, green and near-infrared bands in the multi-date dataset; the CVA (e.g. Malila, 1980; Johnson, 1994) was
applied for the first two tasseled cap components brightnessand greenness, which were calculated from all four multi-spectral bands (Horne, 2003).
The results of this study help to better understand the waycoastal forests have been impacted by the tsunami and thusprovide a further step for in-depth-assessments of ecologicaland socio-ecological tsunami sensitivity of the coastal area.
2 Study area
The study area (Fig. 1) covers a 50 km long coastal strip inthe Phang-Nga province in Thailand from Ban Nam Khemin the north to Thai Mueang city in the south. The areawas strongly impacted by the 2004 tsunami: Along the coastbetween Khao Lak and the northern tip of Kho Khao Island,runup heights were in the range of 5.0 to 10.0 m and the
Nat. Hazards Earth Syst. Sci., 10, 729–745, 2010 www.nat-hazards-earth-syst-sci.net/10/729/2010/
H. Roemer et al.: Using remote sensing to assess tsunami-induced impacts on coastal forests in South Thailand 731
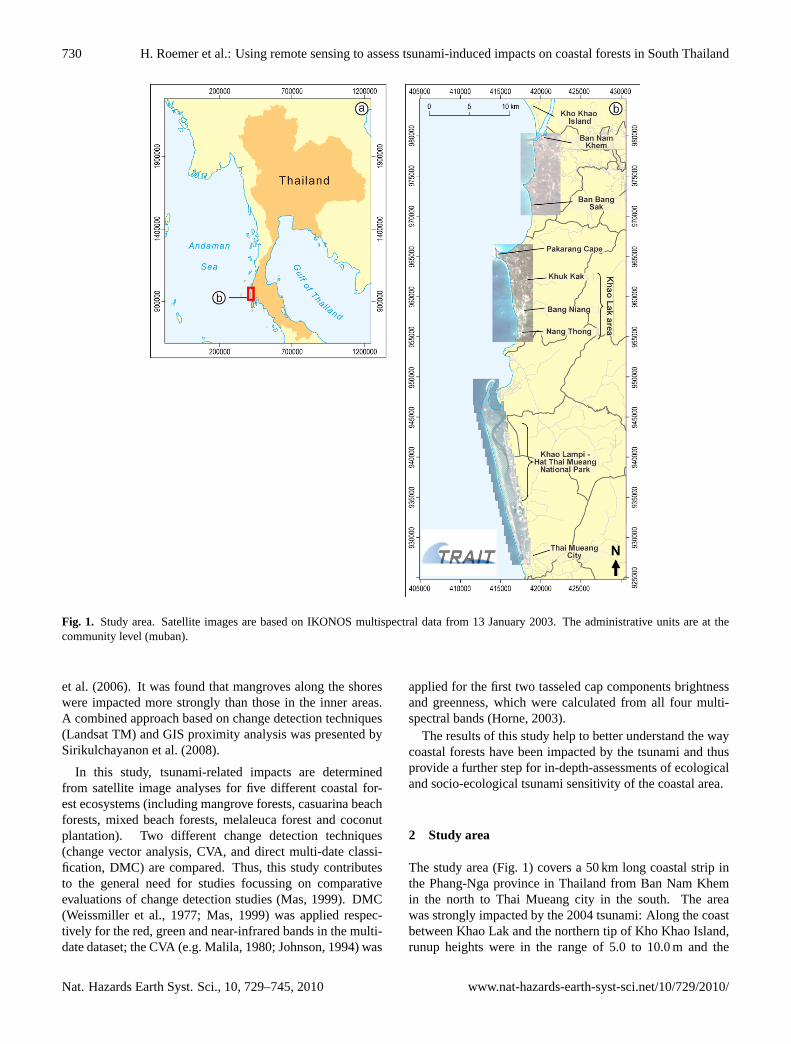
Fig. 2. Coastal forest ecosystems examined in the study (photos taken in January 2009).
inundation varied from 200 m around Ban Bang Sak beach tomore than 1.5 km at Pakarang Cape. Run up at Khao Lampi –Hat Thai Mueang National Park (here called as Thai MueangNational Park) was slightly lower, ranging from 3.5 to 6.5 m(Szczucinski et al., 2006; Ioualalen et al., 2007).
The sparsely populated northern part of the study area(8◦52′10′′ N to 8◦46′30′′ N) is dominated by agriculture (rub-ber, oil palm and coconut plantation, orchards). Furtherto the south, Khao Lak (the area between 8◦44′30′′ and8◦37′52′′) represents a young booming tourism communitywith large hotel complexes scattered near the coast aroundthe touristic villages Khuk Kak, Bang Niang and NangThong. The southern part (8◦35′15′′ N to 8◦28′28′′) is lo-cated on a peninsula around a tidal inlet and hosts large areasof intact coastal ecosystems like mangroves, beach forestsand primary rain forest on the mountainous northern tip ofthe peninsula. The Thai Mueang National Park covers amain part of this peninsula. The whole study area is in-terspersed with smaller freshwater ponds resulting from tinmining activities during the last century (Williams et al.,1996; Szczucinski et al., 2006).
The topography of the coastal area is relatively flat, withelevations mostly below 20 m a.s.l. Coasts are predominantlybuilt-up by sand. A sequence of beach ridges occurs in manycoastal areas. They are usually up to 2 m high and aligned inparallel to the beach. These ridges often alternate with lin-ear swampy depressions termed swales. Rocky coasts occur
north of Thai Mueang National Park at the northern tip of thepeninsula and south of the Khao Lak area (Pajimans, 1976).
Regarding the vegetation characteristics, five coastalforests can be distinguished (Fig. 2): mangrove forests, ca-suarina beach forests, coconut plantation, mixed beach forestand melaleuca forests. Mangrove forests can be found in dif-ferent places in the study area, mostly along the river mouthsnear Thai Mueang National Park. Other river mangroves oc-cur near Ban Nam Khem and Pakarang Cape. The total areaof mangrove forests within the tsunami inundation zone wasabout 108 ha.Rhizophora apicculata, R. mucronata, Ceriopstagal, Bruguierasp. are the dominant species (Yanagisawaet al., 2009a; Phapavasit et al., 2009).
Casuarina equisetifoliais a common pioneer (Ipomoeapes-capraeformation) in beach ridges and flat environmentsand forms 20–30 m wide mono-specific stands above thehigh water-mark on sandy coasts, river mouths and offshorebars (Cochard et al., 2008; Pajimans, 1976; Wong, 2005).The total forest area is 76 ha.
Coconut plantations (Cocos nucifera), with a total area of451 ha, can be found in many places along the coast, espe-cially in the Khao Lak area and near Ban Nam Khem. Beingstrongly influenced by human interventions, it is not to beconsidered a natural forest (Kashio, 2005).
Mixed littoral forest (termed mixed beach forest in the fol-lowing) is located in Thai Mueang National Park coveringa total area of 130 ha. The forest is very dense at uniform
www.nat-hazards-earth-syst-sci.net/10/729/2010/ Nat. Hazards Earth Syst. Sci., 10, 729–745, 2010
732 H. Roemer et al.: Using remote sensing to assess tsunami-induced impacts on coastal forests in South Thailand
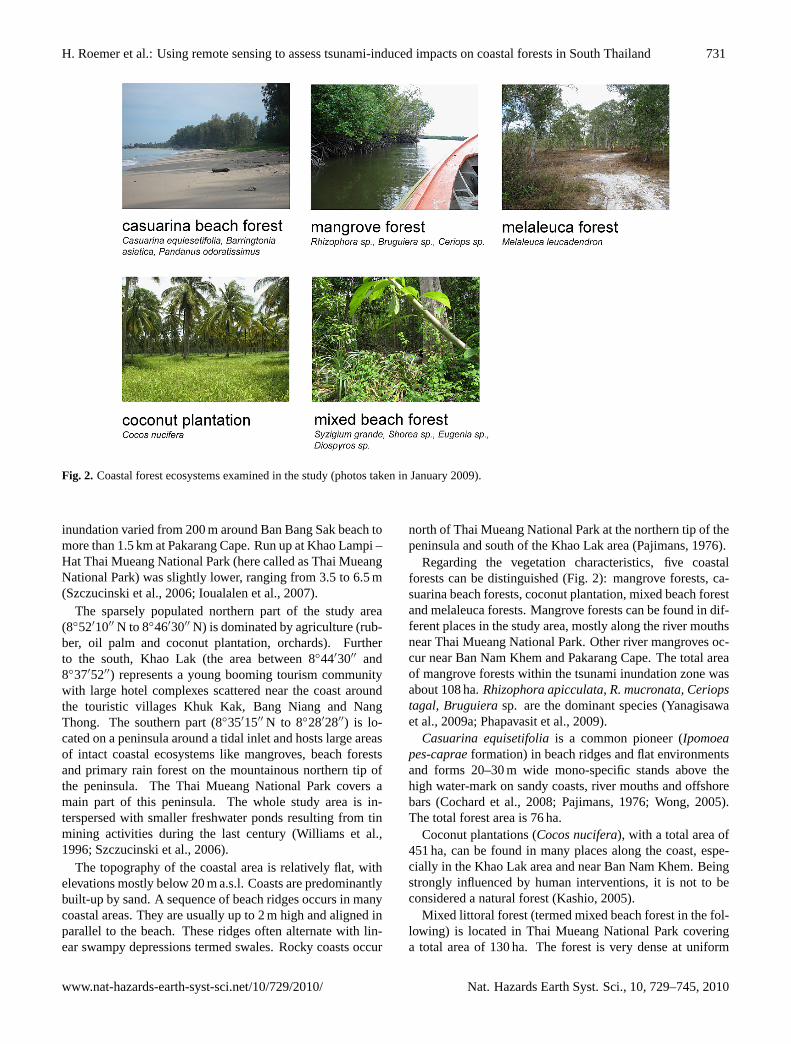
Table 1. IKONOS band dependent parameters of the scenes ac-quired on 13 January 2003, 04:11 GMT (pre-tsunami) and 15 Jan-uary 2005 04:12 GMT (post-tsunami), after Taylor (2009), Geo-eye (2006).
IKONOS spectral band- resolution CalCoef∗λ
band range width
(λ) (nm) (nm) (m) (DN/(mW/nadir/26◦ cm2-sr))off nadir
Pan 526–929 403 0.82/1.0 161Blue 445–516 71.3 3.2/4.0 728Green 506–595 88.6 3.2/4.0 727Red 632–698 65.8 3.2/4.0 949NIR 757–853 95.4 3.2/4.0 843
∗ Only for image production date Post 22 February 2001(coefficients are for the 11-bit products).
canopy height. Typical canopy trees areSyzigium grande,Diospyrossp.,Shoreasp.,Lepisanthes rubigunosa, Eugeniasp. The mixed beach forest directly borders to the melaleucasavannah (here called melaleuca forest), which is dominatedby Melaleuca leucadendron. This widely spaced forest typecovers a small area of 42 ha in Thai Mueang National Park.
3 Data and methods
The study used multi-date IKONOS images (Table 1) ac-quired on 13 January 2003 (pre-tsunami) and on 15 January2005 (post-tsunami). All change detection techniques in thispaper were carried out on the multispectral bands with a res-olution of about four meters, whereas the higher resolutionpan-sharpened data (1 m horizontal resolution) were used forvalidation purposes.
In order to distinguish between different types of coastalforest, a land use map was created from the pre-tsunamiIKONOS image by object oriented image analysis (usingDefiniens Developer 7.0 software). With a total numberof 42 different land use classes, the map provides informa-tion on the spatial distribution of mangrove forests, casuar-ina beach forests, mixed beach forests, melaleuca forest andcoconut plantation. The forest polygons were used to reducethe classified pixel quantity from 2.76×10⁷ to 5.04×10⁵.
4 Image processing
4.1 Pre-processing
Before applying change detection analyses, the digitalnumbers from IKONOS imagery (DNλ) were converted intoat sensor’s aperture radiance values (Lλ), according to theequation (Taylor, 2009):
1
2
resolution multispectral dataset (Fig. 3) was used to visually select training areas and for
identifying appropriate test sites for the accuracy assessment of change classifications.
3
4
5
6
7
8
9
Fig. 3. IKONOS pan-sharpening based on the Gram-Schmidt-spectral sharpening technique (northern Khao Lak)
4.2 Change Detection
4.2.1 Direct multi-date classification
The direct multi-date classification is performed according to the scheme in Fig. 4, starting
with the definition of appropriate change classes and training areas.
8
Fig. 3. IKONOS pan-sharpening based on the Gram-Schmidt-spectral sharpening technique (northern Khao Lak).
Lλ =104
·DNλ
CalCoefλ ·Bandwidthλ, (1)
where,
DNλ = digital value for spectral bandλ,
CalCoefλ = Radiometric calibration coefficient(DN/(mW/cm2-sr))
Bandwidthλ = Bandwidth of spectral bandλ (nm).
Both CalCoefλ and Bandwidthλ are given in Table 1.Geometric correction (co-registration) was carried out by
using a set of ground control points from the pre-tsunamiscene. The post-tsunami scene was then warped to the baseimage. The dark object subtraction, one of the simplestand most widely used image-based absolute atmospheric cor-rection approaches, was applied for radiometric correction(Spanner et al., 1990; Ekstrand, 1994).
Image pan-sharpening was applied using the Gram-Schmidt Spectral Sharpening approach (Laben and Brower,2000). Therewith, the low resolution multispectral data (4 m)were sharpened using the high spatial resolution panchro-matic band (1 m). The resulting high-resolution multispec-tral dataset (Fig. 3) was used to visually select training areasand for identifying appropriate test sites for the accuracy as-sessment of change classifications.
4.2 Change detection
4.2.1 Direct multi-date classification
The direct multi-date classification is performed according tothe scheme in Fig. 4, starting with the definition of appropri-ate change classes and training areas.
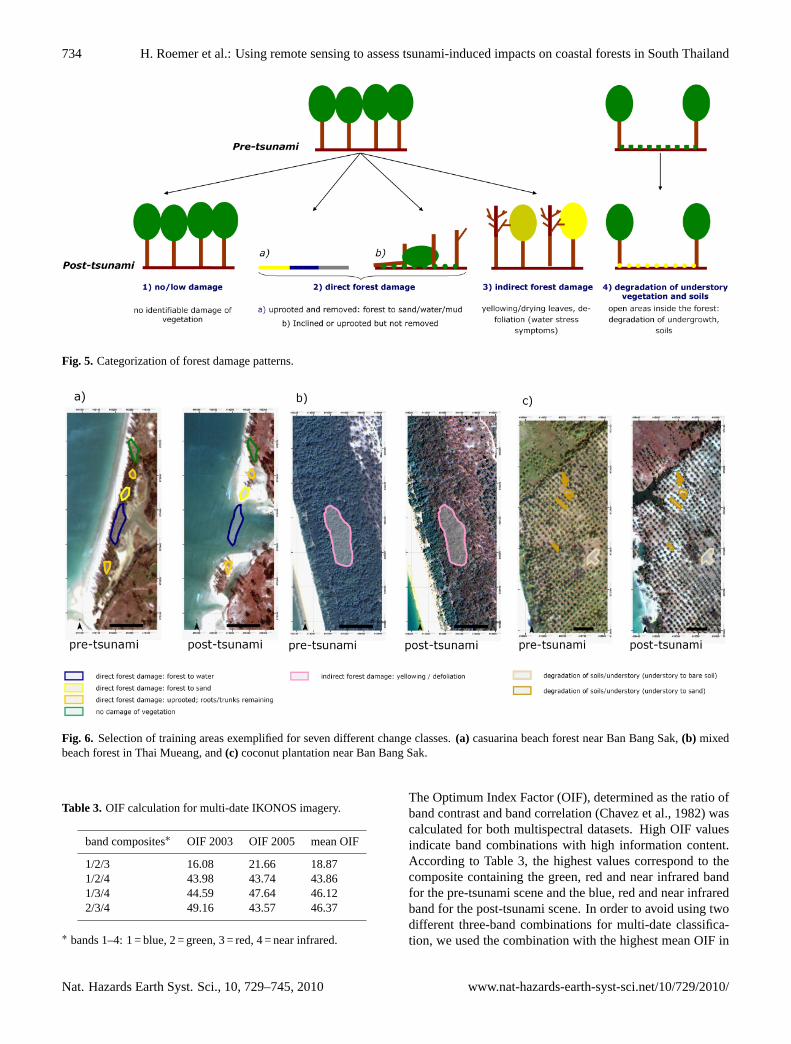
Pan-sharpened IKONOS imagery as well as several stud-ies on tsunami driven impacts on coastal ecosystems (Yanag-isawa et al., 2009a; Phapavasit et al., 2009; Bechteler et al.,2006) revealed that coastal forests were damaged in differ-ent ways and intensities. As illustrated in Fig. 5, forest da-mage patterns were categorized in four major damage classesincluding (1) no/low damage, (2) direct forest damage, (3)indirect forest damage, and (4) degradation of understory
Nat. Hazards Earth Syst. Sci., 10, 729–745, 2010 www.nat-hazards-earth-syst-sci.net/10/729/2010/
H. Roemer et al.: Using remote sensing to assess tsunami-induced impacts on coastal forests in South Thailand 733
Table 2. Training and test area for DMC.
Change classes (ID/name) Training area N∗ Aggregated change classes Test area N∗
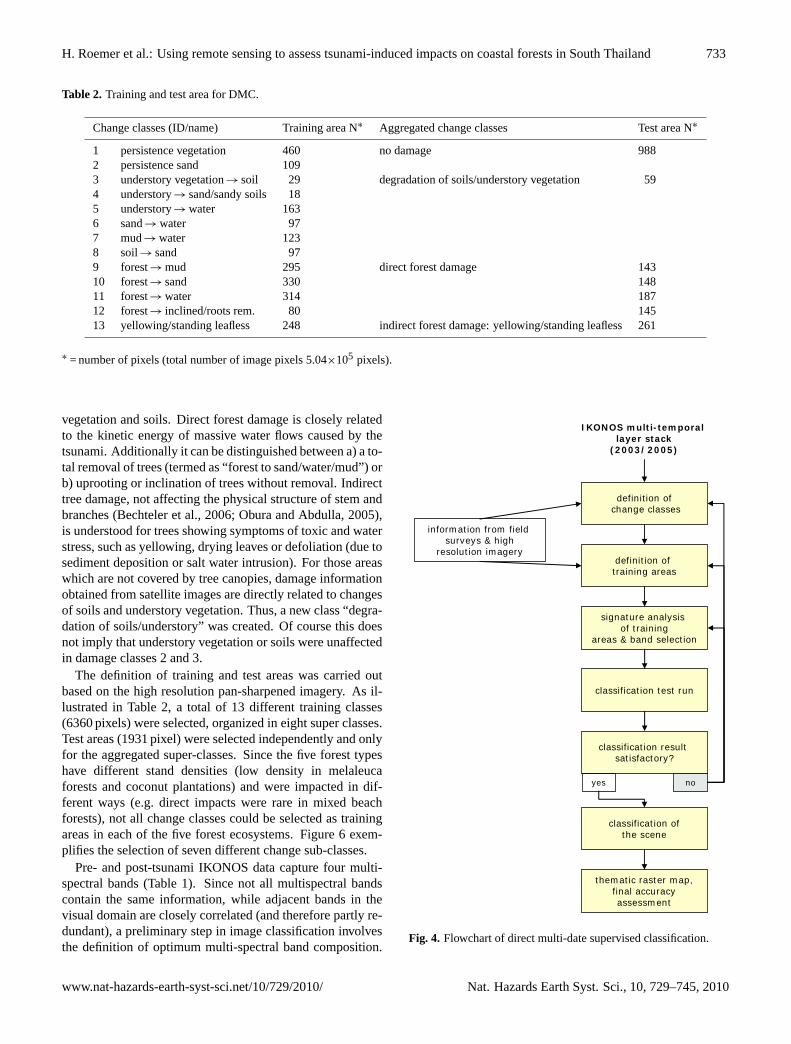
1 persistence vegetation 460 no damage 9882 persistence sand 1093 understory vegetation→ soil 29 degradation of soils/understory vegetation 594 understory→ sand/sandy soils 185 understory→ water 1636 sand→ water 977 mud→ water 1238 soil→ sand 979 forest→ mud 295 direct forest damage 14310 forest→ sand 330 14811 forest→ water 314 18712 forest→ inclined/roots rem. 80 14513 yellowing/standing leafless 248 indirect forest damage: yellowing/standing leafless 261
∗ = number of pixels (total number of image pixels 5.04×105 pixels).
vegetation and soils. Direct forest damage is closely relatedto the kinetic energy of massive water flows caused by thetsunami. Additionally it can be distinguished between a) a to-tal removal of trees (termed as “forest to sand/water/mud”) orb) uprooting or inclination of trees without removal. Indirecttree damage, not affecting the physical structure of stem andbranches (Bechteler et al., 2006; Obura and Abdulla, 2005),is understood for trees showing symptoms of toxic and waterstress, such as yellowing, drying leaves or defoliation (due tosediment deposition or salt water intrusion). For those areaswhich are not covered by tree canopies, damage informationobtained from satellite images are directly related to changesof soils and understory vegetation. Thus, a new class “degra-dation of soils/understory” was created. Of course this doesnot imply that understory vegetation or soils were unaffectedin damage classes 2 and 3.
The definition of training and test areas was carried outbased on the high resolution pan-sharpened imagery. As il-lustrated in Table 2, a total of 13 different training classes(6360 pixels) were selected, organized in eight super classes.Test areas (1931 pixel) were selected independently and onlyfor the aggregated super-classes. Since the five forest typeshave different stand densities (low density in melaleucaforests and coconut plantations) and were impacted in dif-ferent ways (e.g. direct impacts were rare in mixed beachforests), not all change classes could be selected as trainingareas in each of the five forest ecosystems. Figure 6 exem-plifies the selection of seven different change sub-classes.
Pre- and post-tsunami IKONOS data capture four multi-spectral bands (Table 1). Since not all multispectral bandscontain the same information, while adjacent bands in thevisual domain are closely correlated (and therefore partly re-dundant), a preliminary step in image classification involvesthe definition of optimum multi-spectral band composition.
definition ofchange classes
signature analysis of training
areas & band selection
definition of training areas
classification test run
classification result satisfactory?
information from field surveys & high
resolution imagery
classification ofthe scene
yes no
thematic raster map,final accuracyassessment
IKONOS multi-temporal layer stack
(2003/2005)
1
2
3
4
5
6
7
8
9
10
11
12
13
14
15
16
17
Fig. 4. Flowchart of direct multi-date supervised classification.
Pan-sharpened IKONOS imagery as well as several studies on tsunami driven impacts on
coastal ecosystems (Yanagisawa et al., 2009a; Phapavasit et al. 2009, Bechteler et al., 2006)
revealed that coastal forests were damaged in different ways and intensities. Forest damage
patterns were categorized in four major damage classes including (1) no/low damage, (2)
direct forest damage, (3) indirect forest damage and (4) degradation of understory vegetation
and soils. Direct forest damage is closely related to the kinetic energy of massive water flows
caused by the tsunami. Additionally it can be distinguished between a) a total removal of trees
(termed as “forest to sand/water/mud”) or b) uprooting or inclination of trees without
removal. Indirect tree damage, not affecting the physical structure of stem and branches
(Bechteler et al., 2006, Obura and Abdulla, 2005), is understood for trees showing symptoms
of toxic and water stress, such as yellowing, drying leaves or defoliation (due to sediment
deposition or salt water intrusion). For those areas which are not covered by tree canopies,
damage information obtained from satellite images are directly related to changes of soils and
understory vegetation. Thus, a new class “degradation of soils/understory” was created. Of
9
Fig. 4. Flowchart of direct multi-date supervised classification.
www.nat-hazards-earth-syst-sci.net/10/729/2010/ Nat. Hazards Earth Syst. Sci., 10, 729–745, 2010
734 H. Roemer et al.: Using remote sensing to assess tsunami-induced impacts on coastal forests in South Thailand
Fig. 5. Categorization of forest damage patterns.
1 Table 2. Training and test area for DMC.
Change Classes (ID / name) Training area N*
Aggregated change classes Test area N*
1 persistence vegetation 460 2 persistence sand 109
no damage 988
3 understory vegetation soil 29
4 understory sand/sandy soils 18
5 understory water 163
6 sand water 97
7 mud water 123
8 soil sand 97
degradation of soils/understory vegetation 59
9 forest mud 295 143
10 forest sand 330 148
11 forest water 314 187
12 forest inclined/roots rem. 80
direct forest damage
145
13 yellowing/standing leafless 248 indirect forest damage: yellowing/standing leafless
261
2
3
*= number of pixels (total number of image pixels 5.04*105 pixels)
4
5 6
7
8
9
10
Fig. 6. Selection of training areas exemplified for seven different change classes. (a) casuarina beach forest near Ban Bang Sak, (b) mixed beach forest in Thai Mueang and (c) coconut plantation near Ban Bang Sak
Pre- and post-tsunami IKONOS data capture four multispectral bands (Table 1). Since not all
multispectral bands contain the same information, while adjacent bands in the visual domain
are closely correlated (and therefore partly redundant), a preliminary step in image
11
Fig. 6. Selection of training areas exemplified for seven different change classes.(a) casuarina beach forest near Ban Bang Sak,(b) mixedbeach forest in Thai Mueang, and(c) coconut plantation near Ban Bang Sak.
Table 3. OIF calculation for multi-date IKONOS imagery.
band composites∗ OIF 2003 OIF 2005 mean OIF
1/2/3 16.08 21.66 18.871/2/4 43.98 43.74 43.861/3/4 44.59 47.64 46.122/3/4 49.16 43.57 46.37
∗ bands 1–4: 1 = blue, 2 = green, 3 = red, 4 = near infrared.
The Optimum Index Factor (OIF), determined as the ratio ofband contrast and band correlation (Chavez et al., 1982) wascalculated for both multispectral datasets. High OIF valuesindicate band combinations with high information content.According to Table 3, the highest values correspond to thecomposite containing the green, red and near infrared bandfor the pre-tsunami scene and the blue, red and near infraredband for the post-tsunami scene. In order to avoid using twodifferent three-band combinations for multi-date classifica-tion, we used the combination with the highest mean OIF in
Nat. Hazards Earth Syst. Sci., 10, 729–745, 2010 www.nat-hazards-earth-syst-sci.net/10/729/2010/
H. Roemer et al.: Using remote sensing to assess tsunami-induced impacts on coastal forests in South Thailand 735
Table 4. Change class definition based on CVA.
change classes aggregated change classes direction (◦)/ test
(ID/name) magnitude area n∗
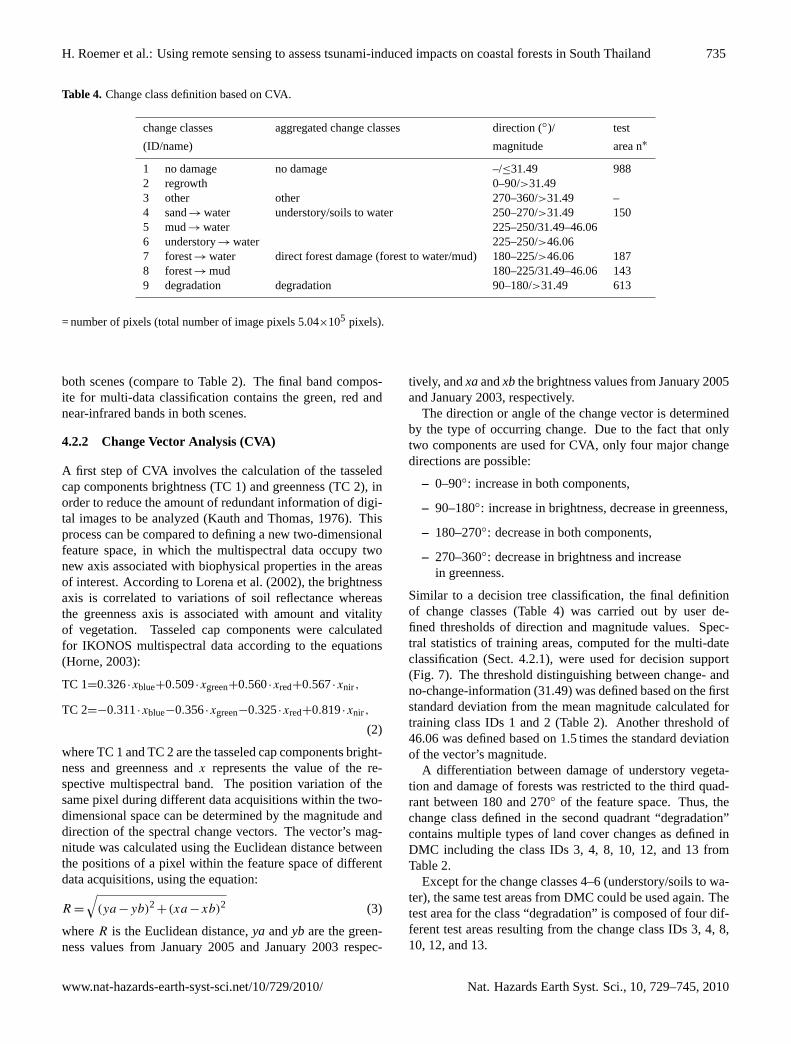
1 no damage no damage –/≤31.49 9882 regrowth 0–90/>31.493 other other 270–360/>31.49 –4 sand→ water understory/soils to water 250–270/>31.49 1505 mud→ water 225–250/31.49–46.066 understory→ water 225–250/>46.067 forest→ water direct forest damage (forest to water/mud) 180–225/>46.06 1878 forest→ mud 180–225/31.49–46.06 1439 degradation degradation 90–180/>31.49 613
= number of pixels (total number of image pixels 5.04×105 pixels).
both scenes (compare to Table 2). The final band compos-ite for multi-data classification contains the green, red andnear-infrared bands in both scenes.
4.2.2 Change Vector Analysis (CVA)
A first step of CVA involves the calculation of the tasseledcap components brightness (TC 1) and greenness (TC 2), inorder to reduce the amount of redundant information of digi-tal images to be analyzed (Kauth and Thomas, 1976). Thisprocess can be compared to defining a new two-dimensionalfeature space, in which the multispectral data occupy twonew axis associated with biophysical properties in the areasof interest. According to Lorena et al. (2002), the brightnessaxis is correlated to variations of soil reflectance whereasthe greenness axis is associated with amount and vitalityof vegetation. Tasseled cap components were calculatedfor IKONOS multispectral data according to the equations(Horne, 2003):
TC 1=0.326·xblue+0.509·xgreen+0.560·xred+0.567·xnir ,
TC 2=−0.311·xblue−0.356·xgreen−0.325·xred+0.819·xnir ,
(2)
where TC 1 and TC 2 are the tasseled cap components bright-ness and greenness andx represents the value of the re-spective multispectral band. The position variation of thesame pixel during different data acquisitions within the two-dimensional space can be determined by the magnitude anddirection of the spectral change vectors. The vector’s mag-nitude was calculated using the Euclidean distance betweenthe positions of a pixel within the feature space of differentdata acquisitions, using the equation:
R =
√(ya−yb)2
+(xa−xb)2 (3)
whereR is the Euclidean distance,ya andyb are the green-ness values from January 2005 and January 2003 respec-
tively, andxaandxb the brightness values from January 2005and January 2003, respectively.
The direction or angle of the change vector is determinedby the type of occurring change. Due to the fact that onlytwo components are used for CVA, only four major changedirections are possible:
– 0–90◦: increase in both components,
– 90–180◦: increase in brightness, decrease in greenness,
– 180–270◦: decrease in both components,
– 270–360◦: decrease in brightness and increasein greenness.
Similar to a decision tree classification, the final definitionof change classes (Table 4) was carried out by user de-fined thresholds of direction and magnitude values. Spec-tral statistics of training areas, computed for the multi-dateclassification (Sect. 4.2.1), were used for decision support(Fig. 7). The threshold distinguishing between change- andno-change-information (31.49) was defined based on the firststandard deviation from the mean magnitude calculated fortraining class IDs 1 and 2 (Table 2). Another threshold of46.06 was defined based on 1.5 times the standard deviationof the vector’s magnitude.
A differentiation between damage of understory vegeta-tion and damage of forests was restricted to the third quad-rant between 180 and 270◦ of the feature space. Thus, thechange class defined in the second quadrant “degradation”contains multiple types of land cover changes as defined inDMC including the class IDs 3, 4, 8, 10, 12, and 13 fromTable 2.
Except for the change classes 4–6 (understory/soils to wa-ter), the same test areas from DMC could be used again. Thetest area for the class “degradation” is composed of four dif-ferent test areas resulting from the change class IDs 3, 4, 8,10, 12, and 13.
www.nat-hazards-earth-syst-sci.net/10/729/2010/ Nat. Hazards Earth Syst. Sci., 10, 729–745, 2010
736 H. Roemer et al.: Using remote sensing to assess tsunami-induced impacts on coastal forests in South Thailand
-100
-50
0
50
-100 -50 0 50 100
Δ TC 1 (Brightness)
persistence: vegetation
150
forest sand
forest inclined/roots remaining
understory soil
understory sand/sandy
soil sand
sand water
persistence: sand
understory water
forests water
mud water
Δ Brightness
Δ G
reen
ness
pre-tsunami (0/0)
forest mud
25
10
= 1st standard deviations of magnitude (1st)
= mean values of Δ greenness and Δ brightness
circle sizes:
yellowing/standing leafless
forest sand
1
2
3
4
5
6
7
8
9
10
11
12
13
14
15
16
17
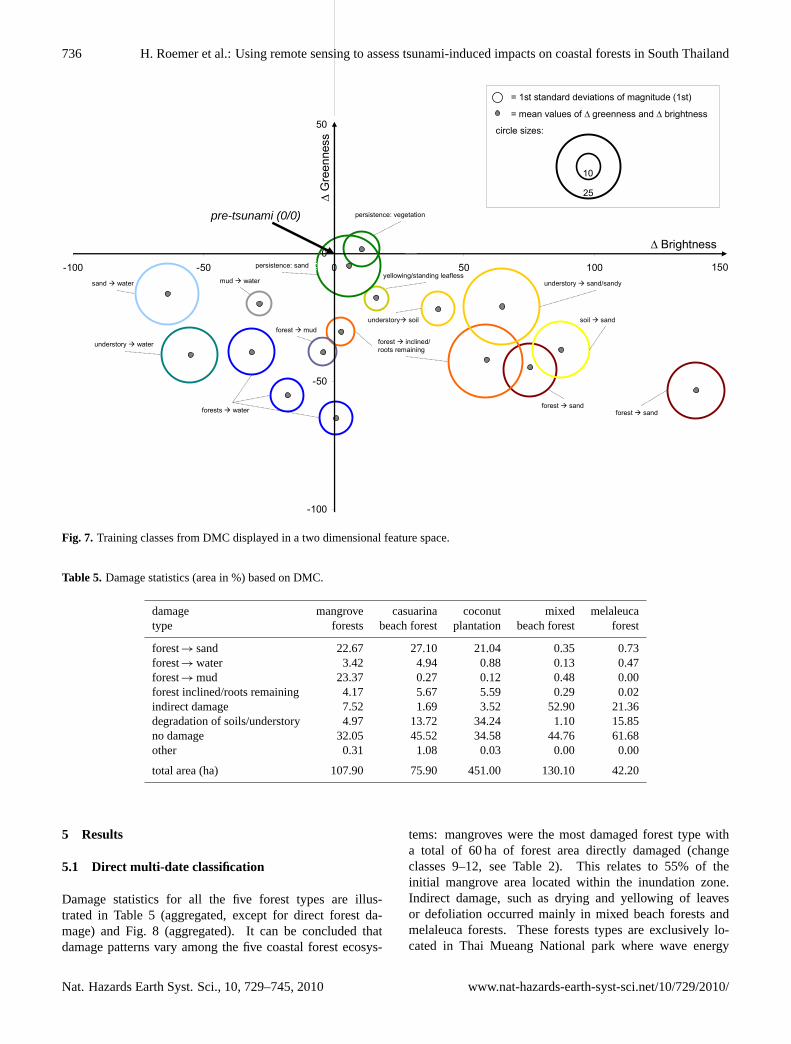
Fig. 7. Training classes from DMC displayed in a two dimensional feature space.
5 Results
5.1 Direct multi-date classification
Damage statistics for all the five forest types are illustrated in Table 5 (aggregated, except for
direct forest damage) and Fig. 8 (aggregated). It can be concluded that damage patterns vary
among the five coastal forest ecosystems: mangroves were the most damaged forest type with
a total of 60 hectares of forest area directly damaged (change classes 9-12, see Table 2). This
relates to 55% of the initial mangrove area located within the inundation zone. Indirect
damage, such as drying and yellowing of leaves or defoliation occurred mainly in mixed
beach forests and melaleuca forests. These forests types are exclusively located in Thai
Mueang National park where wave energy was relatively low (Ioualalen et al., 2007).
Casuarina beach forests were also severely damaged by the tsunami, with 38% of direct
damage. Tsunami induced direct damage to coconut plantation is very likely overestimated,
due to man made changes which have taken place between image acquisition dates. Damage
of understory and soils is maximal in coconut plantation and melaleuca forest, where forest
15
Fig. 7. Training classes from DMC displayed in a two dimensional feature space.
Table 5. Damage statistics (area in %) based on DMC.
damage mangrove casuarina coconut mixed melaleucatype forests beach forest plantation beach forest forest
forest→ sand 22.67 27.10 21.04 0.35 0.73forest→ water 3.42 4.94 0.88 0.13 0.47forest→ mud 23.37 0.27 0.12 0.48 0.00forest inclined/roots remaining 4.17 5.67 5.59 0.29 0.02indirect damage 7.52 1.69 3.52 52.90 21.36degradation of soils/understory 4.97 13.72 34.24 1.10 15.85no damage 32.05 45.52 34.58 44.76 61.68other 0.31 1.08 0.03 0.00 0.00
total area (ha) 107.90 75.90 451.00 130.10 42.20
5 Results
5.1 Direct multi-date classification
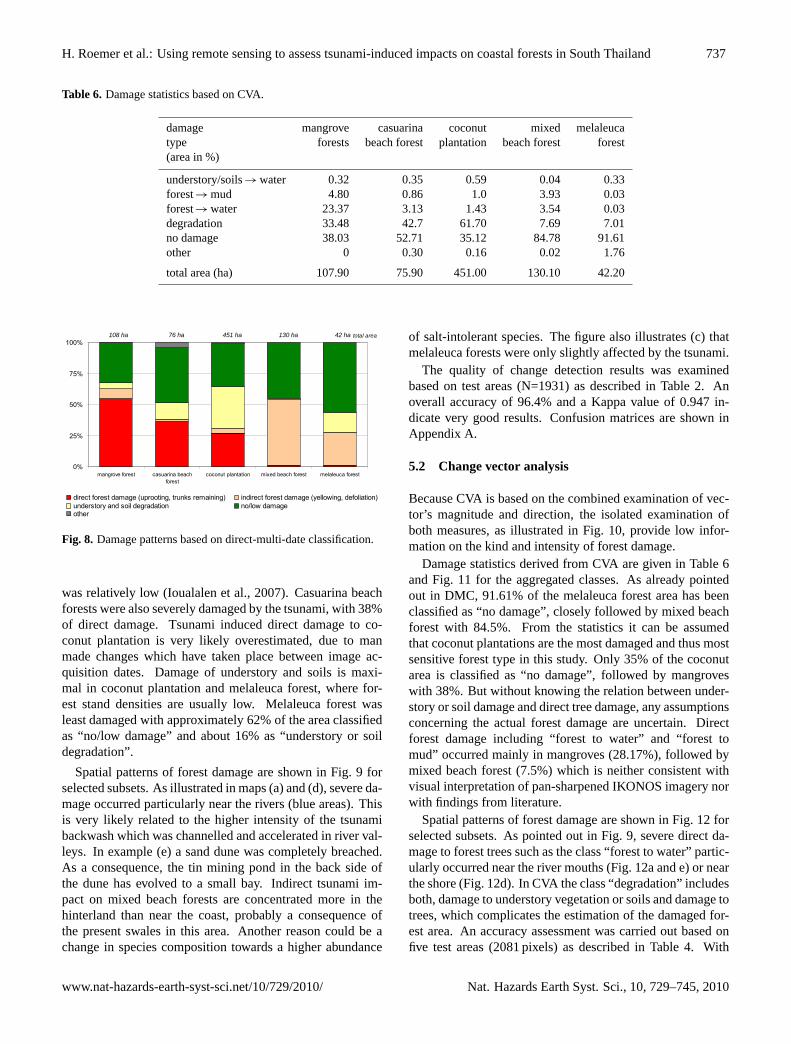
Damage statistics for all the five forest types are illus-trated in Table 5 (aggregated, except for direct forest da-mage) and Fig. 8 (aggregated). It can be concluded thatdamage patterns vary among the five coastal forest ecosys-
tems: mangroves were the most damaged forest type witha total of 60 ha of forest area directly damaged (changeclasses 9–12, see Table 2). This relates to 55% of theinitial mangrove area located within the inundation zone.Indirect damage, such as drying and yellowing of leavesor defoliation occurred mainly in mixed beach forests andmelaleuca forests. These forests types are exclusively lo-cated in Thai Mueang National park where wave energy
Nat. Hazards Earth Syst. Sci., 10, 729–745, 2010 www.nat-hazards-earth-syst-sci.net/10/729/2010/
H. Roemer et al.: Using remote sensing to assess tsunami-induced impacts on coastal forests in South Thailand 737
Table 6. Damage statistics based on CVA.
damage mangrove casuarina coconut mixed melaleucatype forests beach forest plantation beach forest forest(area in %)
understory/soils→ water 0.32 0.35 0.59 0.04 0.33forest→ mud 4.80 0.86 1.0 3.93 0.03forest→ water 23.37 3.13 1.43 3.54 0.03degradation 33.48 42.7 61.70 7.69 7.01no damage 38.03 52.71 35.12 84.78 91.61other 0 0.30 0.16 0.02 1.76
total area (ha) 107.90 75.90 451.00 130.10 42.20
1
2
3
4
stand densities are usually low. Melaleuca forest was least damaged with approximately 62%
of the area classified as “no/low damage” and about 16% as “understory or soil degradation”.
Table 5. Damage statistics (area in %) based on DMC.
damage type mangrove forests
casuarina beach forest
coconut plantation
mixed beach forest
melaleuca forest
forest→sand 22.67 27.10 21.04 0.35 0.73 forest→water 3.42 4.94 0.88 0.13 0.47
forest→mud 23.37 0.27 0.12 0.48 0.00
forest inclined/roots remaining 4.17 5.67 5.59 0.29 0.02
indirect damage 7.52 1.69 3.52 52.90 21.36
degradation of soils/understory 4.97 13.72 34.24 1.10 15.85
no damage 32.05 45.52 34.58 44.76 61.68
Other 0.31 1.08 0.03 0.00 0.00
total area (ha) 107.90 75.90 451.00 130.10 42.20
5
6
0%
25%
50%
75%
100%
mangrove forest casuarina beachforest
coconut plantation mixed beach forest melaleuca forest
direct forest damage (uprooting, trunks remaining) indirect forest damage (yellowing, defoliation)understory and soil degradation no/low damageother
total area108 ha 42 ha76 ha 130 ha451 ha
7
8
9
Fig. 8. Damage patterns based on direct-multi-date classification.
16
Fig. 8. Damage patterns based on direct-multi-date classification.
was relatively low (Ioualalen et al., 2007). Casuarina beachforests were also severely damaged by the tsunami, with 38%of direct damage. Tsunami induced direct damage to co-conut plantation is very likely overestimated, due to manmade changes which have taken place between image ac-quisition dates. Damage of understory and soils is maxi-mal in coconut plantation and melaleuca forest, where for-est stand densities are usually low. Melaleuca forest wasleast damaged with approximately 62% of the area classifiedas “no/low damage” and about 16% as “understory or soildegradation”.
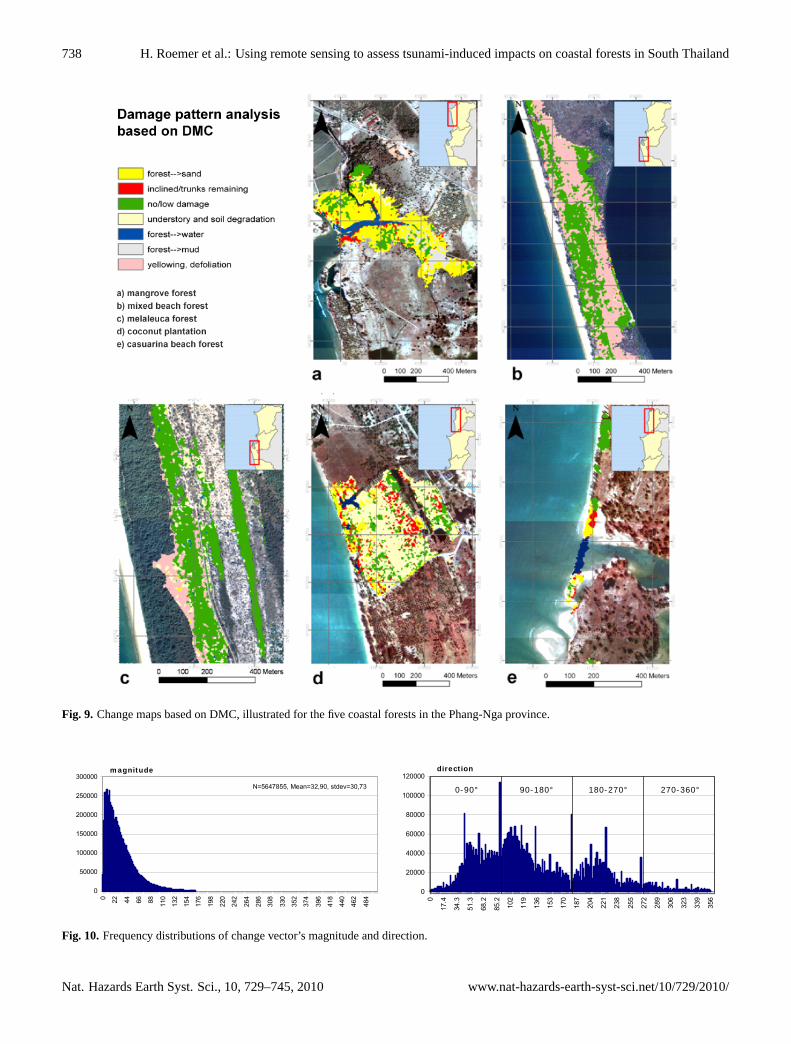
Spatial patterns of forest damage are shown in Fig. 9 forselected subsets. As illustrated in maps (a) and (d), severe da-mage occurred particularly near the rivers (blue areas). Thisis very likely related to the higher intensity of the tsunamibackwash which was channelled and accelerated in river val-leys. In example (e) a sand dune was completely breached.As a consequence, the tin mining pond in the back side ofthe dune has evolved to a small bay. Indirect tsunami im-pact on mixed beach forests are concentrated more in thehinterland than near the coast, probably a consequence ofthe present swales in this area. Another reason could be achange in species composition towards a higher abundance
of salt-intolerant species. The figure also illustrates (c) thatmelaleuca forests were only slightly affected by the tsunami.
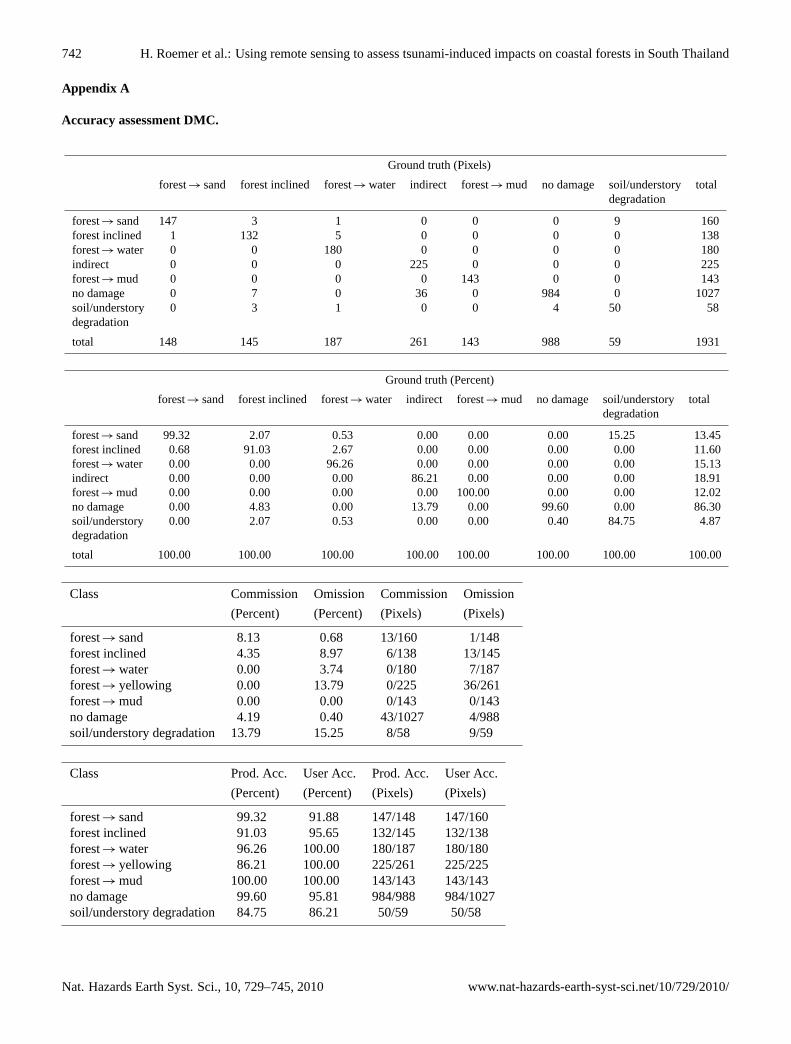
The quality of change detection results was examinedbased on test areas (N=1931) as described in Table 2. Anoverall accuracy of 96.4% and a Kappa value of 0.947 in-dicate very good results. Confusion matrices are shown inAppendix A.
5.2 Change vector analysis
Because CVA is based on the combined examination of vec-tor’s magnitude and direction, the isolated examination ofboth measures, as illustrated in Fig. 10, provide low infor-mation on the kind and intensity of forest damage.
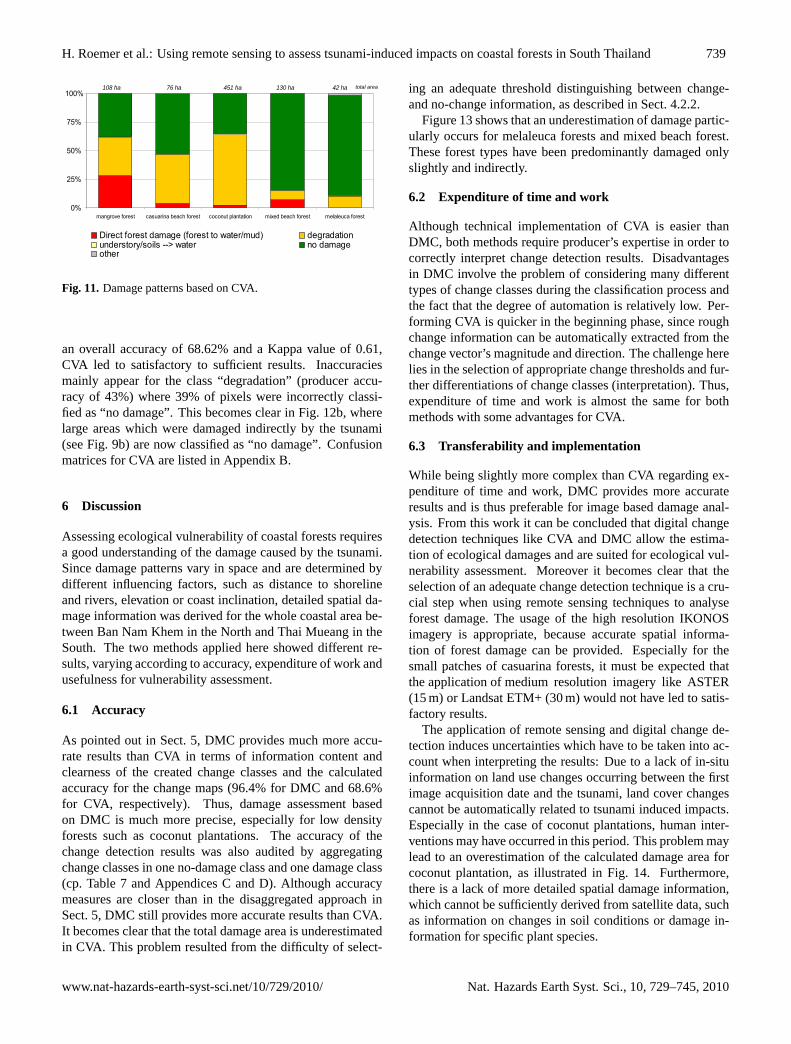
Damage statistics derived from CVA are given in Table 6and Fig. 11 for the aggregated classes. As already pointedout in DMC, 91.61% of the melaleuca forest area has beenclassified as “no damage”, closely followed by mixed beachforest with 84.5%. From the statistics it can be assumedthat coconut plantations are the most damaged and thus mostsensitive forest type in this study. Only 35% of the coconutarea is classified as “no damage”, followed by mangroveswith 38%. But without knowing the relation between under-story or soil damage and direct tree damage, any assumptionsconcerning the actual forest damage are uncertain. Directforest damage including “forest to water” and “forest tomud” occurred mainly in mangroves (28.17%), followed bymixed beach forest (7.5%) which is neither consistent withvisual interpretation of pan-sharpened IKONOS imagery norwith findings from literature.
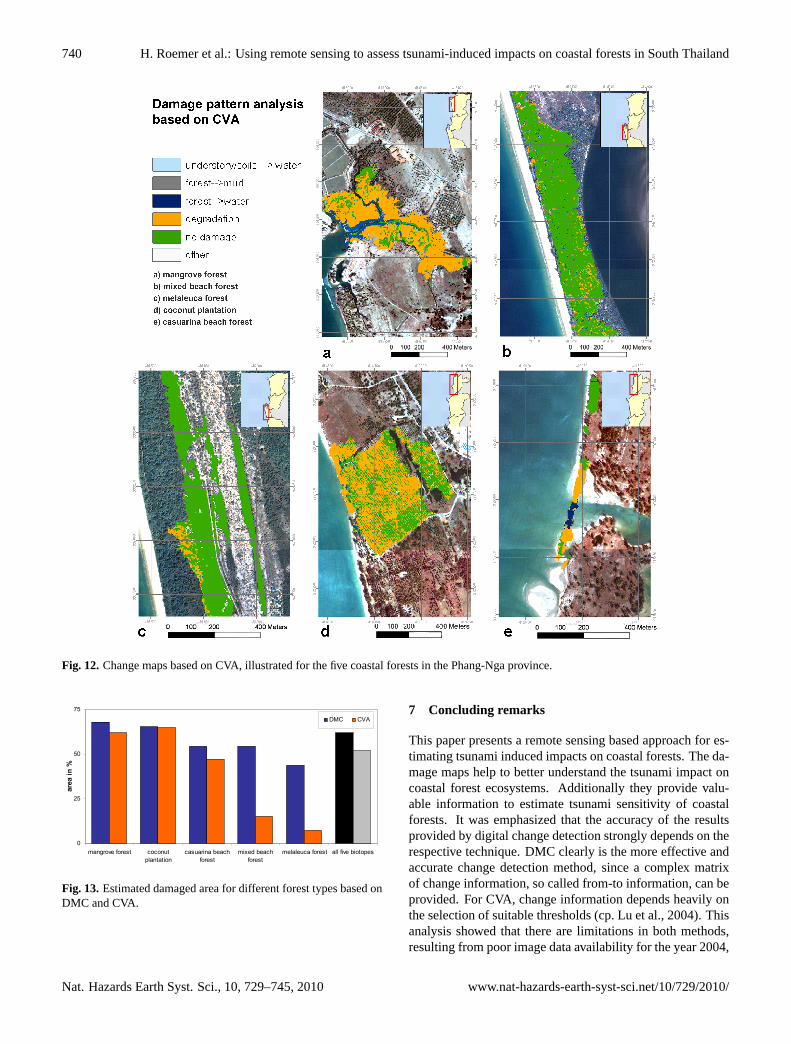
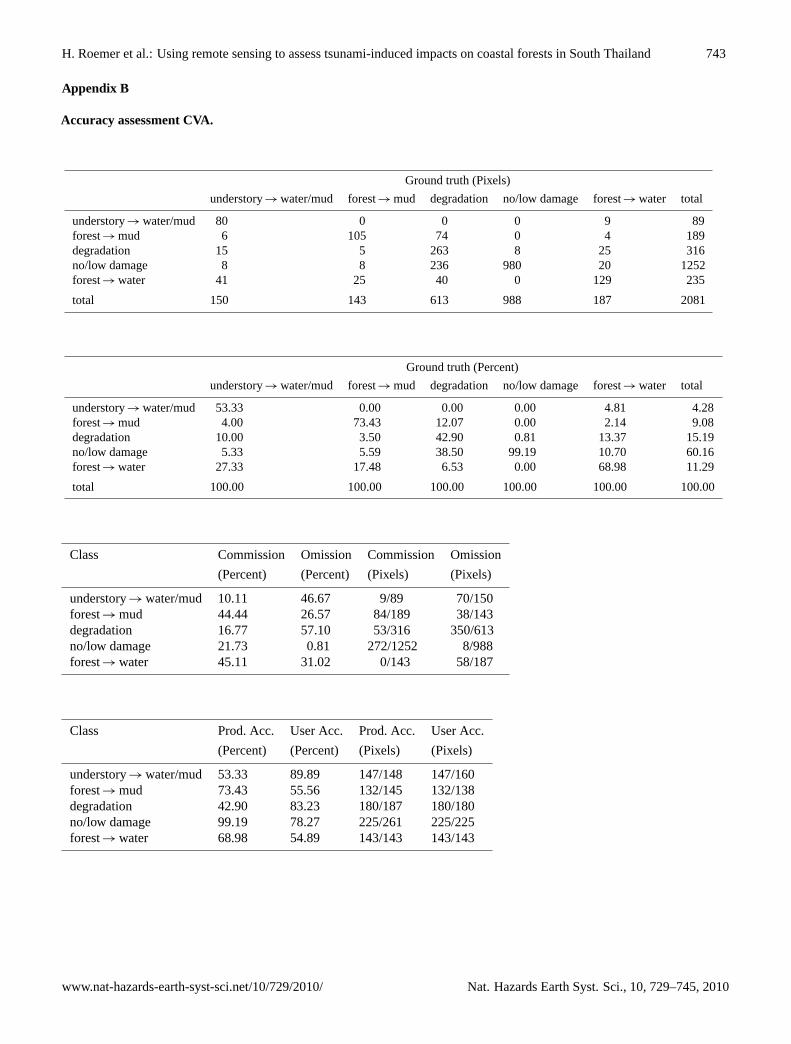
Spatial patterns of forest damage are shown in Fig. 12 forselected subsets. As pointed out in Fig. 9, severe direct da-mage to forest trees such as the class “forest to water” partic-ularly occurred near the river mouths (Fig. 12a and e) or nearthe shore (Fig. 12d). In CVA the class “degradation” includesboth, damage to understory vegetation or soils and damage totrees, which complicates the estimation of the damaged for-est area. An accuracy assessment was carried out based onfive test areas (2081 pixels) as described in Table 4. With
www.nat-hazards-earth-syst-sci.net/10/729/2010/ Nat. Hazards Earth Syst. Sci., 10, 729–745, 2010
738 H. Roemer et al.: Using remote sensing to assess tsunami-induced impacts on coastal forests in South Thailand
Fig. 9. Change maps based on DMC, illustrated for the five coastal forests in the Phang-Nga province.
0
20000
40000
60000
80000
100000
120000
0
17.4
34.3
51.3
68.2
85.2
102
119
136
153
170
187
204
221
238
255
272
289
306
323
339
356
0-90° 90-180° 180-270° 270-360°
direction
1 0
50000
100000
150000
200000
250000
300000
0 22 44 66 88 110
132
154
176
198
220
242
264
286
308
330
352
374
396
418
440
462
484
N=5647855, Mean=32,90, stdev=30,73
magnitude
2
3
4
5
6
7
8
9
10
11
12
13
14
15
16
Fig. 10. Frequency distributions of change vector's magnitude and direction.
Damage statistics derived from CVA are given in Table 6 and Fig. 11 for the aggregated
classes. As already pointed out in DMC, 91.61% of the melaleuca forest area has been
classified as “no damage”, closely followed by mixed beach forest with 84.5%. From the
statistics it can be assumed that coconut plantations are the most damaged and thus most
sensitive forest type in this study. Only 35% of the coconut area is classified as “no damage”,
followed by mangroves with 38%. But without knowing the relation between understory or
soil damage and direct tree damage, any assumptions concerning the actual forest damage are
uncertain. Direct forest damage including “forest to water” and “forest to mud” occurred
mainly in mangroves (28.17%), followed by mixed beach forest (7.5%) which is neither
consistent with visual interpretation of pan-sharpened IKONOS imagery nor with findings
from literature.
Table 6. Damage statistics based on CVA.
damage type (area in %) mangrove forests
casuarina beach forest
coconut plantation
mixed beach forest
melaleuca forest
understory/soils water 0.32 0.35 0.59 0.04 0.33 forest mud 4.80 0.86 1.0 3.93 0.03
forest water 23.37 3.13 1.43 3.54 0.03
degradation 33.48 42.7 61.70 7.69 7.01
no damage 38.03 52.71 35.12 84.78 91.61
Other 0 0.30 0.16 0.02 1.76
total area (ha) 107.90 75.90 451.00 130.10 42.20
17
18
19
Fig. 10. Frequency distributions of change vector’s magnitude and direction.
Nat. Hazards Earth Syst. Sci., 10, 729–745, 2010 www.nat-hazards-earth-syst-sci.net/10/729/2010/
H. Roemer et al.: Using remote sensing to assess tsunami-induced impacts on coastal forests in South Thailand 739
42 ha total area130 ha108 ha100%
76 ha 451 ha
0%
25%
50%
75%
mangrove forest casuarina beach forest coconut plantation mixed beach forest melaleuca forest
Direct forest damage (forest to water/mud) degradationunderstory/soils --> water no damageother 1
2
3
4
5
6
7
8
9
10
11
12
13
14
15
Fig. 11. Damage patterns based on CVA.
Spatial patterns of forest damage are shown in Fig. 12 for selected subsets. As pointed out in
Fig. 9, severe direct damage to forest trees such as the class “forest to water” particularly
occurred near the river mouths (Fig. 12 a and e) or near the shore (Fig. 12 d). In CVA the
class “degradation” includes both, damage to understory vegetation or soils and damage to
trees, which complicates the estimation of the damaged forest area. An accuracy assessment
was carried out based on five test areas (2081 pixels) as described in Table 4. With an overall
accuracy of 68.62% and a Kappa value of 0.61, CVA led to satisfactory to sufficient results.
Inaccuracies mainly appear for the class “degradation” (producer accuracy of 43%) where
39% of pixels were incorrectly classified as “no damage”. This becomes clear in Fig. 12 b,
where large areas which were damaged indirectly by the tsunami (see figure 9b) are now
classified as “no damage”. Confusion matrices for CVA are listed in Appendix. B.
20
Fig. 11. Damage patterns based on CVA.
an overall accuracy of 68.62% and a Kappa value of 0.61,CVA led to satisfactory to sufficient results. Inaccuraciesmainly appear for the class “degradation” (producer accu-racy of 43%) where 39% of pixels were incorrectly classi-fied as “no damage”. This becomes clear in Fig. 12b, wherelarge areas which were damaged indirectly by the tsunami(see Fig. 9b) are now classified as “no damage”. Confusionmatrices for CVA are listed in Appendix B.
6 Discussion
Assessing ecological vulnerability of coastal forests requiresa good understanding of the damage caused by the tsunami.Since damage patterns vary in space and are determined bydifferent influencing factors, such as distance to shorelineand rivers, elevation or coast inclination, detailed spatial da-mage information was derived for the whole coastal area be-tween Ban Nam Khem in the North and Thai Mueang in theSouth. The two methods applied here showed different re-sults, varying according to accuracy, expenditure of work andusefulness for vulnerability assessment.
6.1 Accuracy
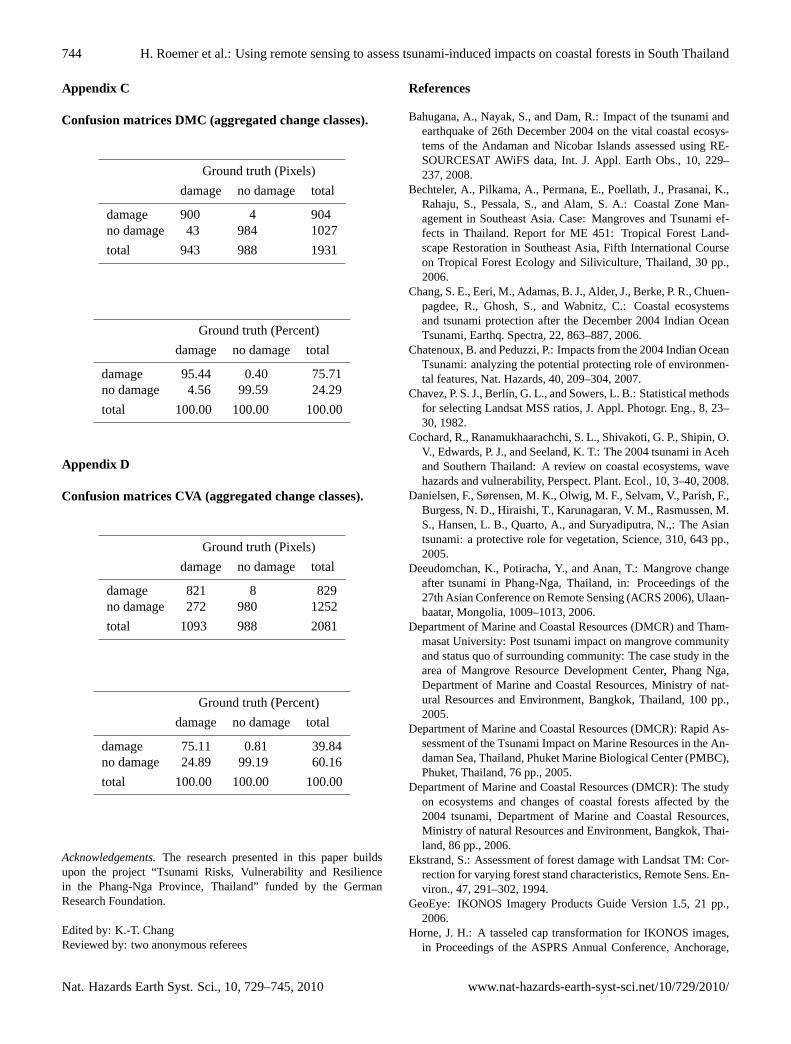
As pointed out in Sect. 5, DMC provides much more accu-rate results than CVA in terms of information content andclearness of the created change classes and the calculatedaccuracy for the change maps (96.4% for DMC and 68.6%for CVA, respectively). Thus, damage assessment basedon DMC is much more precise, especially for low densityforests such as coconut plantations. The accuracy of thechange detection results was also audited by aggregatingchange classes in one no-damage class and one damage class(cp. Table 7 and Appendices C and D). Although accuracymeasures are closer than in the disaggregated approach inSect. 5, DMC still provides more accurate results than CVA.It becomes clear that the total damage area is underestimatedin CVA. This problem resulted from the difficulty of select-
ing an adequate threshold distinguishing between change-and no-change information, as described in Sect. 4.2.2.
Figure 13 shows that an underestimation of damage partic-ularly occurs for melaleuca forests and mixed beach forest.These forest types have been predominantly damaged onlyslightly and indirectly.
6.2 Expenditure of time and work
Although technical implementation of CVA is easier thanDMC, both methods require producer’s expertise in order tocorrectly interpret change detection results. Disadvantagesin DMC involve the problem of considering many differenttypes of change classes during the classification process andthe fact that the degree of automation is relatively low. Per-forming CVA is quicker in the beginning phase, since roughchange information can be automatically extracted from thechange vector’s magnitude and direction. The challenge herelies in the selection of appropriate change thresholds and fur-ther differentiations of change classes (interpretation). Thus,expenditure of time and work is almost the same for bothmethods with some advantages for CVA.
6.3 Transferability and implementation
While being slightly more complex than CVA regarding ex-penditure of time and work, DMC provides more accurateresults and is thus preferable for image based damage anal-ysis. From this work it can be concluded that digital changedetection techniques like CVA and DMC allow the estima-tion of ecological damages and are suited for ecological vul-nerability assessment. Moreover it becomes clear that theselection of an adequate change detection technique is a cru-cial step when using remote sensing techniques to analyseforest damage. The usage of the high resolution IKONOSimagery is appropriate, because accurate spatial informa-tion of forest damage can be provided. Especially for thesmall patches of casuarina forests, it must be expected thatthe application of medium resolution imagery like ASTER(15 m) or Landsat ETM+ (30 m) would not have led to satis-factory results.
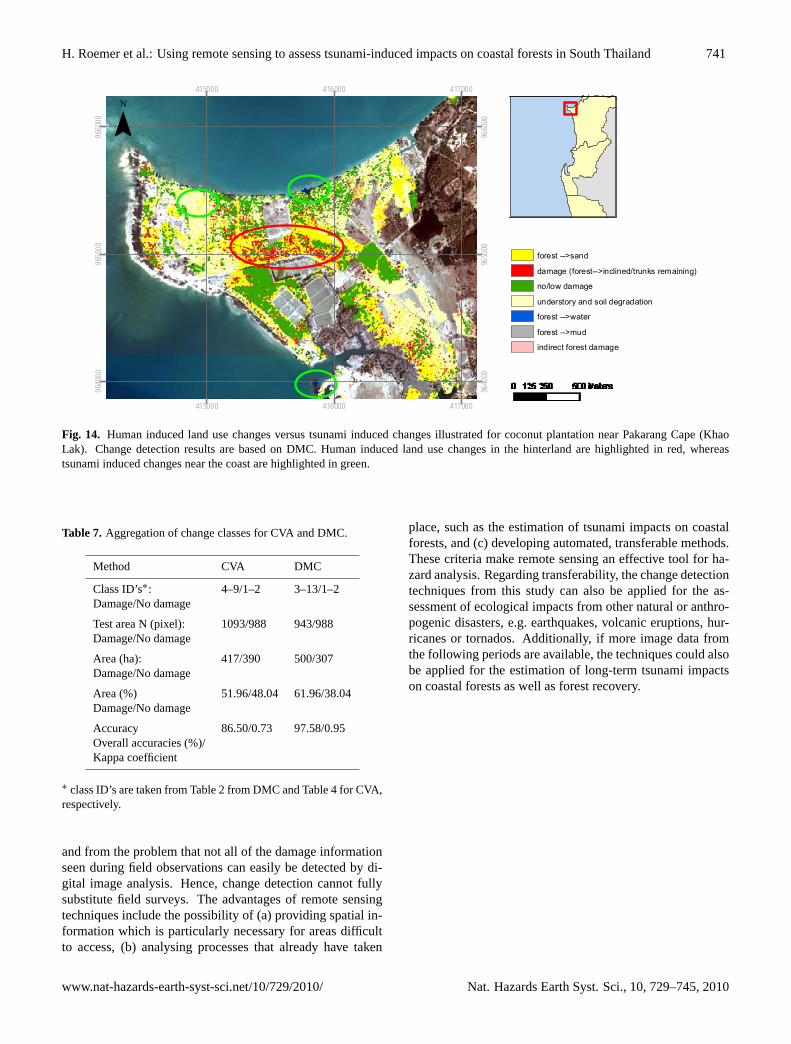
The application of remote sensing and digital change de-tection induces uncertainties which have to be taken into ac-count when interpreting the results: Due to a lack of in-situinformation on land use changes occurring between the firstimage acquisition date and the tsunami, land cover changescannot be automatically related to tsunami induced impacts.Especially in the case of coconut plantations, human inter-ventions may have occurred in this period. This problem maylead to an overestimation of the calculated damage area forcoconut plantation, as illustrated in Fig. 14. Furthermore,there is a lack of more detailed spatial damage information,which cannot be sufficiently derived from satellite data, suchas information on changes in soil conditions or damage in-formation for specific plant species.
www.nat-hazards-earth-syst-sci.net/10/729/2010/ Nat. Hazards Earth Syst. Sci., 10, 729–745, 2010
740 H. Roemer et al.: Using remote sensing to assess tsunami-induced impacts on coastal forests in South Thailand
Fig. 12. Change maps based on CVA, illustrated for the five coastal forests in the Phang-Nga province.
0
50
%nea
iar
25
75
mangrove forest coconutplantation
casuarina beachforest
mixed beachforest
melaleuca forest all five biotopes
DMC CVA
1
2
3
4
5
6
7
8
9
10
11
12
13
14
15
16
17
18
19
20
Fig. 13. Estimated damaged area for different forest types based on DMC and CVA.
6.2 Expenditure of time and work
Although technical implementation of CVA is easier than DMC, both methods require
producer’s expertise in order to correctly interpret change detection results. Disadvantages in
DMC involve the problem of considering many different types of change classes during the
classification process and the fact that the degree of automation is relatively low. Performing
CVA is quicker in the beginning phase, since rough change information can be automatically
extracted from the change vector’s magnitude and direction. The challenge here lies in the
selection of appropriate change thresholds and further differentiations of change classes
(interpretation). Thus, expenditure of time and work is almost the same for both methods with
some advantages for CVA.
6.3 Transferability and Implementation
While being slightly more complex than CVA regarding expenditure of time and work, DMC
provides more accurate results and is thus preferable for image based damage analysis. From
this work it can be concluded that digital change detection techniques like CVA and DMC
allow the estimation of ecological damages and are suited for ecological vulnerability
assessment. Moreover it becomes clear that the selection of an adequate change detection
23
Fig. 13.Estimated damaged area for different forest types based onDMC and CVA.
7 Concluding remarks
This paper presents a remote sensing based approach for es-timating tsunami induced impacts on coastal forests. The da-mage maps help to better understand the tsunami impact oncoastal forest ecosystems. Additionally they provide valu-able information to estimate tsunami sensitivity of coastalforests. It was emphasized that the accuracy of the resultsprovided by digital change detection strongly depends on therespective technique. DMC clearly is the more effective andaccurate change detection method, since a complex matrixof change information, so called from-to information, can beprovided. For CVA, change information depends heavily onthe selection of suitable thresholds (cp. Lu et al., 2004). Thisanalysis showed that there are limitations in both methods,resulting from poor image data availability for the year 2004,
Nat. Hazards Earth Syst. Sci., 10, 729–745, 2010 www.nat-hazards-earth-syst-sci.net/10/729/2010/
H. Roemer et al.: Using remote sensing to assess tsunami-induced impacts on coastal forests in South Thailand 741
1
2
3
4
5
6
7
8
9
10
11
12
13
14
15
technique is a crucial step when using remote sensing techniques to analyse forest damage.
The usage of the high resolution IKONOS imagery is appropriate, because accurate spatial
information of forest damage can be provided. Especially for the small patches of casuarina
forests, it must be expected that the application of medium resolution imagery like ASTER
(15m) or Landsat ETM+ (30m) would not have led to satisfactory results.
The application of remote sensing and digital change detection induces uncertainties which
have to be taken into account when interpreting the results: Due to a lack of in-situ
information on land use changes occurring between the first image acquisition date and the
tsunami, land cover changes cannot be automatically related to tsunami induced impacts.
Especially in the case of coconut plantations, human interventions may have occurred in this
period. This problem may lead to an overestimation of the calculated damage area for coconut
plantation, as illustrated in Fig. 14. Furthermore, there is a lack of more detailed spatial
damage information, which cannot be sufficiently derived from satellite data, such as
information on changes in soil conditions or damage information for specific plant species.
415000
415000
416000
416000
417000
417000
9640
00
9640
00
9650
00
9650
00
9660
00
9660
00
forest -->sand
damage (forest-->inclined/trunks remaining)
no/low damage
understory and soil degradation
forest -->water
forest -->mud
indirect forest damage
¯
16
17 18 19
Fig. 14. Human induced land use changes versus tsunami induced changes illustrated for coconut plantation near Pakarang Cape (Khao Lak). Change detection results are based on DMC. Human induced land use changes in the hinterland are highlighted in red, whereas tsunami induced changes near the coast are highlighted in green.
24
Fig. 14. Human induced land use changes versus tsunami induced changes illustrated for coconut plantation near Pakarang Cape (KhaoLak). Change detection results are based on DMC. Human induced land use changes in the hinterland are highlighted in red, whereastsunami induced changes near the coast are highlighted in green.
Table 7. Aggregation of change classes for CVA and DMC.
Method CVA DMC
Class ID’s∗: 4–9/1–2 3–13/1–2Damage/No damage
Test area N (pixel): 1093/988 943/988Damage/No damage
Area (ha): 417/390 500/307Damage/No damage
Area (%) 51.96/48.04 61.96/38.04Damage/No damage
Accuracy 86.50/0.73 97.58/0.95Overall accuracies (%)/Kappa coefficient
∗ class ID’s are taken from Table 2 from DMC and Table 4 for CVA,respectively.
and from the problem that not all of the damage informationseen during field observations can easily be detected by di-gital image analysis. Hence, change detection cannot fullysubstitute field surveys. The advantages of remote sensingtechniques include the possibility of (a) providing spatial in-formation which is particularly necessary for areas difficultto access, (b) analysing processes that already have taken
place, such as the estimation of tsunami impacts on coastalforests, and (c) developing automated, transferable methods.These criteria make remote sensing an effective tool for ha-zard analysis. Regarding transferability, the change detectiontechniques from this study can also be applied for the as-sessment of ecological impacts from other natural or anthro-pogenic disasters, e.g. earthquakes, volcanic eruptions, hur-ricanes or tornados. Additionally, if more image data fromthe following periods are available, the techniques could alsobe applied for the estimation of long-term tsunami impactson coastal forests as well as forest recovery.
www.nat-hazards-earth-syst-sci.net/10/729/2010/ Nat. Hazards Earth Syst. Sci., 10, 729–745, 2010
742 H. Roemer et al.: Using remote sensing to assess tsunami-induced impacts on coastal forests in South Thailand
Appendix A
Accuracy assessment DMC.
Ground truth (Pixels)
forest→ sand forest inclined forest→ water indirect forest→ mud no damage soil/understory totaldegradation
forest→ sand 147 3 1 0 0 0 9 160forest inclined 1 132 5 0 0 0 0 138forest→ water 0 0 180 0 0 0 0 180indirect 0 0 0 225 0 0 0 225forest→ mud 0 0 0 0 143 0 0 143no damage 0 7 0 36 0 984 0 1027soil/understory 0 3 1 0 0 4 50 58degradation
total 148 145 187 261 143 988 59 1931
Ground truth (Percent)
forest→ sand forest inclined forest→ water indirect forest→ mud no damage soil/understory totaldegradation
forest→ sand 99.32 2.07 0.53 0.00 0.00 0.00 15.25 13.45forest inclined 0.68 91.03 2.67 0.00 0.00 0.00 0.00 11.60forest→ water 0.00 0.00 96.26 0.00 0.00 0.00 0.00 15.13indirect 0.00 0.00 0.00 86.21 0.00 0.00 0.00 18.91forest→ mud 0.00 0.00 0.00 0.00 100.00 0.00 0.00 12.02no damage 0.00 4.83 0.00 13.79 0.00 99.60 0.00 86.30soil/understory 0.00 2.07 0.53 0.00 0.00 0.40 84.75 4.87degradation
total 100.00 100.00 100.00 100.00 100.00 100.00 100.00 100.00
Class Commission Omission Commission Omission
(Percent) (Percent) (Pixels) (Pixels)
forest→ sand 8.13 0.68 13/160 1/148forest inclined 4.35 8.97 6/138 13/145forest→ water 0.00 3.74 0/180 7/187forest→ yellowing 0.00 13.79 0/225 36/261forest→ mud 0.00 0.00 0/143 0/143no damage 4.19 0.40 43/1027 4/988soil/understory degradation 13.79 15.25 8/58 9/59
Class Prod. Acc. User Acc. Prod. Acc. User Acc.
(Percent) (Percent) (Pixels) (Pixels)
forest→ sand 99.32 91.88 147/148 147/160forest inclined 91.03 95.65 132/145 132/138forest→ water 96.26 100.00 180/187 180/180forest→ yellowing 86.21 100.00 225/261 225/225forest→ mud 100.00 100.00 143/143 143/143no damage 99.60 95.81 984/988 984/1027soil/understory degradation 84.75 86.21 50/59 50/58
Nat. Hazards Earth Syst. Sci., 10, 729–745, 2010 www.nat-hazards-earth-syst-sci.net/10/729/2010/
H. Roemer et al.: Using remote sensing to assess tsunami-induced impacts on coastal forests in South Thailand 743
Appendix B
Accuracy assessment CVA.
Ground truth (Pixels)
understory→ water/mud forest→ mud degradation no/low damage forest→ water total
understory→ water/mud 80 0 0 0 9 89forest→ mud 6 105 74 0 4 189degradation 15 5 263 8 25 316no/low damage 8 8 236 980 20 1252forest→ water 41 25 40 0 129 235
total 150 143 613 988 187 2081
Ground truth (Percent)
understory→ water/mud forest→ mud degradation no/low damage forest→ water total
understory→ water/mud 53.33 0.00 0.00 0.00 4.81 4.28forest→ mud 4.00 73.43 12.07 0.00 2.14 9.08degradation 10.00 3.50 42.90 0.81 13.37 15.19no/low damage 5.33 5.59 38.50 99.19 10.70 60.16forest→ water 27.33 17.48 6.53 0.00 68.98 11.29
total 100.00 100.00 100.00 100.00 100.00 100.00
Class Commission Omission Commission Omission
(Percent) (Percent) (Pixels) (Pixels)
understory→ water/mud 10.11 46.67 9/89 70/150forest→ mud 44.44 26.57 84/189 38/143degradation 16.77 57.10 53/316 350/613no/low damage 21.73 0.81 272/1252 8/988forest→ water 45.11 31.02 0/143 58/187
Class Prod. Acc. User Acc. Prod. Acc. User Acc.
(Percent) (Percent) (Pixels) (Pixels)
understory→ water/mud 53.33 89.89 147/148 147/160forest→ mud 73.43 55.56 132/145 132/138degradation 42.90 83.23 180/187 180/180no/low damage 99.19 78.27 225/261 225/225forest→ water 68.98 54.89 143/143 143/143
www.nat-hazards-earth-syst-sci.net/10/729/2010/ Nat. Hazards Earth Syst. Sci., 10, 729–745, 2010
744 H. Roemer et al.: Using remote sensing to assess tsunami-induced impacts on coastal forests in South Thailand
Appendix C
Confusion matrices DMC (aggregated change classes).
Ground truth (Pixels)
damage no damage total
damage 900 4 904no damage 43 984 1027
total 943 988 1931
Ground truth (Percent)
damage no damage total
damage 95.44 0.40 75.71no damage 4.56 99.59 24.29
total 100.00 100.00 100.00
Appendix D
Confusion matrices CVA (aggregated change classes).
Ground truth (Pixels)
damage no damage total
damage 821 8 829no damage 272 980 1252
total 1093 988 2081
Ground truth (Percent)
damage no damage total
damage 75.11 0.81 39.84no damage 24.89 99.19 60.16
total 100.00 100.00 100.00
Acknowledgements.The research presented in this paper buildsupon the project “Tsunami Risks, Vulnerability and Resiliencein the Phang-Nga Province, Thailand” funded by the GermanResearch Foundation.
Edited by: K.-T. ChangReviewed by: two anonymous referees
References
Bahugana, A., Nayak, S., and Dam, R.: Impact of the tsunami andearthquake of 26th December 2004 on the vital coastal ecosys-tems of the Andaman and Nicobar Islands assessed using RE-SOURCESAT AWiFS data, Int. J. Appl. Earth Obs., 10, 229–237, 2008.
Bechteler, A., Pilkama, A., Permana, E., Poellath, J., Prasanai, K.,Rahaju, S., Pessala, S., and Alam, S. A.: Coastal Zone Man-agement in Southeast Asia. Case: Mangroves and Tsunami ef-fects in Thailand. Report for ME 451: Tropical Forest Land-scape Restoration in Southeast Asia, Fifth International Courseon Tropical Forest Ecology and Siliviculture, Thailand, 30 pp.,2006.
Chang, S. E., Eeri, M., Adamas, B. J., Alder, J., Berke, P. R., Chuen-pagdee, R., Ghosh, S., and Wabnitz, C.: Coastal ecosystemsand tsunami protection after the December 2004 Indian OceanTsunami, Earthq. Spectra, 22, 863–887, 2006.
Chatenoux, B. and Peduzzi, P.: Impacts from the 2004 Indian OceanTsunami: analyzing the potential protecting role of environmen-tal features, Nat. Hazards, 40, 209–304, 2007.
Chavez, P. S. J., Berlın, G. L., and Sowers, L. B.: Statistical methodsfor selecting Landsat MSS ratios, J. Appl. Photogr. Eng., 8, 23–30, 1982.
Cochard, R., Ranamukhaarachchi, S. L., Shivakoti, G. P., Shipin, O.V., Edwards, P. J., and Seeland, K. T.: The 2004 tsunami in Acehand Southern Thailand: A review on coastal ecosystems, wavehazards and vulnerability, Perspect. Plant. Ecol., 10, 3–40, 2008.
Danielsen, F., Sørensen, M. K., Olwig, M. F., Selvam, V., Parish, F.,Burgess, N. D., Hiraishi, T., Karunagaran, V. M., Rasmussen, M.S., Hansen, L. B., Quarto, A., and Suryadiputra, N.,: The Asiantsunami: a protective role for vegetation, Science, 310, 643 pp.,2005.
Deeudomchan, K., Potiracha, Y., and Anan, T.: Mangrove changeafter tsunami in Phang-Nga, Thailand, in: Proceedings of the27th Asian Conference on Remote Sensing (ACRS 2006), Ulaan-baatar, Mongolia, 1009–1013, 2006.
Department of Marine and Coastal Resources (DMCR) and Tham-masat University: Post tsunami impact on mangrove communityand status quo of surrounding community: The case study in thearea of Mangrove Resource Development Center, Phang Nga,Department of Marine and Coastal Resources, Ministry of nat-ural Resources and Environment, Bangkok, Thailand, 100 pp.,2005.
Department of Marine and Coastal Resources (DMCR): Rapid As-sessment of the Tsunami Impact on Marine Resources in the An-daman Sea, Thailand, Phuket Marine Biological Center (PMBC),Phuket, Thailand, 76 pp., 2005.
Department of Marine and Coastal Resources (DMCR): The studyon ecosystems and changes of coastal forests affected by the2004 tsunami, Department of Marine and Coastal Resources,Ministry of natural Resources and Environment, Bangkok, Thai-land, 86 pp., 2006.
Ekstrand, S.: Assessment of forest damage with Landsat TM: Cor-rection for varying forest stand characteristics, Remote Sens. En-viron., 47, 291–302, 1994.
GeoEye: IKONOS Imagery Products Guide Version 1.5, 21 pp.,2006.
Horne, J. H.: A tasseled cap transformation for IKONOS images,in Proceedings of the ASPRS Annual Conference, Anchorage,
Nat. Hazards Earth Syst. Sci., 10, 729–745, 2010 www.nat-hazards-earth-syst-sci.net/10/729/2010/
H. Roemer et al.: Using remote sensing to assess tsunami-induced impacts on coastal forests in South Thailand 745
USA, 5–9 May 2003.Ioualalen, M., Asavanant, J., Kaewbanjak, N., Grilli, S. T., Kirby,
J. T., and Watts, P.: Modelling the 26 December 2004 IndianOcean tsunami: Case study of impact in Thailand, J. Geophys.Res., 112, C07024, doi:10.1029/2006JC003850, 2007.
Johnson, R. D.: Change Vector Analysis for disaster assessment: acase study of Hurricane Andrew, Geocarto International, 9, 41–45, 1994.
Kashio, M.: Tsunami impact assessment in mangroves and othercoastal forests in the southern Thailand, FAO Regional Officefor Asia and the Pacific, Bangkok, Thailand, 8 pp., 2005.
Kauth, R. J. and Thomas, G. S.: Tasseled Cap – a graphic descrip-tion of the spectral-temporal development of agricultural cropsa seen by Landsat, in: Proceedings of the Machine Processingof Remotely Sensed Data Symposium, Purdue University, WestLafayette, USA, 1976.
Kouchi, K. and Yamazaki, F.: Characteristics of Tsunami-AffectedAreas in Moderate-Resolution Satellite Images, IEEE T. Geosci.Remote, 45, 1650–1657, 2007.
Laben, C. A. and Brower, B. V.: Process for enhancing the spatialresolution of multispectral imagery using pan-sharpening, East-man Kodak Company, Technical Report US Patent #6011875,2000.
Lorena, R. B., Dos Santos, J. R., Shimabukoro, Y. E., Brown, I. F.,and Kux, H. J. H.: A Change Vector Analysis technique to mon-itor land use/land cover in SW Brazilian Amazon: Acre State,in: Proceedings of the International Society for Photogramme-try and Remote Sensing (ISPRS), Denver Co, USA, 8 pp., 10–14November 2002.
Lu, D., Mausel, P., Brondızio, E., and Moran, E.: Change detectiontechniques, Int. J. Remote Sens., 25, 2365–2407, 2004.
Malila, W. A.: Change Vector Analysis: an approach for detectingforest changes with Landsat, in: Proceedings of the 6th AnnualSymposium on Machine Processing of Remotely Sensed Data,West Lafayette, USA, 10 pp., 1980.
Mas, J.-F.: Monitoring land cover changes: a comparison of changedetection techniques, Int. J. Remote Sens., 20, 139–152, 1999.
Obura, D. and Abdulla, A.: Assessment of tsunami impacts on themarine environment of the Seychelles, International Union forthe Conservation of Nature (IUCN) and United Nations Environ-ment Programme (UNEP), 22 pp., 2005.
Office of Natural Resources and Environmental Policy and Plan-ning: 1 Year After Tsunami: Restoration of Thailand’s NaturalResources and Environment, Ministry of Natural Resources andEnvironment, Bangkok, Thailand, 128 pp., 2005.
Pajimans, K.: Part II Vegetation, in: New Guinea Vegetation,CRISPO, Canberra, Australia, 81 pp., 1976.
Paphavasit, N., Aksornkoae, S., and De Silvia, J.: Tsunami Im-pact on Mangrove Ecosystem, Thailand Environmental Institute,Nonthaburi, Thailand, 211 pp., 2009.
Phongsuwan, N., Yeemin, T., Worachananant, S., Duangsawasdi,M., Chotiyaputta, C., and Comley, J.: Post-tsunami status ofcoral reefs and other coastal ecosystems in the Andaman Seacoast of Thailand, in: Status of coral reefs in tsunami-affectedcountries, edited by: Wilkinson, C., Souter, D., and Goldberg,J., Australian Institute of marine Science, Townville, Australia,63–78, 2006.
Sirikulchayanon, P., Sun, W., and Oyana, T. J.: Assessing the im-pact of the 2004 tsunami on mangroves using remote sensing andGIS techniques, Int. J. Remote Sens., 29, 3553–3576, 2008.
Spanner, M. A., Pierce, L. L., Peterson, D. L., and Running, S. W.:Remote sensing of temperate coniferous forest leaf area index:the influence of canopy closure, understory vegetation and back-ground reflectance, Int. J. Remote Sens., 11(1), 95–111, 1990.
Szczucinski, W., Chaimanee, N., Niedzielski, P., Rachlewicz, G.,Saisuttichai, D., Tepsuwan, T., Lorenc, S., and Siepak, J.: En-vironmental and Geological Impacts of the 26 December 2004Tsunami in Coastal Zone of Thailand – Overview of Short andLong-Term Effects, Pol. J. Environ. Stud., 15, 793-810, 2006.
Tanaka, N., Sasaki, Y., Mowjood, M. I. M., Jinadasa, K. B. S.N., and Homchuen, S.: Coastal vegetation structures and theirfunctions in tsunami protection: experience of the recent IndianOcean tsunami, Landsc. Ecol. Eng., 3, 33–45, 2007.
Taylor, M.: IKONOS Planetary Reflectance and Mean Solar Exoat-mospheric Irradiance, GeoEye, 2009.
United Nations Environment Programme (UNEP): After theTsunami, Rapid Environmental Assessment, Nairobi, Kenia,140 pp., 2005.
Vu, T. T., Matsuoka, M., and Yamazaki, F.: Dual-scale approach fordetection of tsunami affected areas using optical satellite images,Int. J. Remote Sens., 28, 2995–3011, 2007.
Weissmiller, A., Kristofs, J., Scholzd, K., Anutap, E., and Mo-mens, A.: Change detection in coastal zone environments, Pho-togramm. Eng. Rem. S., 43, 1533–1539, 1977.
Williams, M., Foryce, F., Paijitprapapon, A., and Charoenchaisri,P.: Arsenic contamination in surface drainage and groundwaterin part of the southeast Asian tin belt, Nakhon Si ThammaratProvince, southern Thailand, Environ. Geol., 27, 16–33, 1996.
Wong, P. P.: Coastal environment of southeast Asia, in The Physi-cal Geography of Southeast Asia, edited by: Gupta, A., OxfordUniversity Press, Oxford, Great Britain, 16 pp., 2005.
Yanagisawa, H., Kushimura, S., Goto, K., Miyagi, T., Imamura, F.,Ruangrassamee, A., and Tanavud, C.: The reduction effects ofmangrove forest on a tsunami based on field surveys at PakarangCape, Thailand and numerical analysis, Estuar. Coast Shelf S.,81, 27–37, 2009a.
Yanagisawa, H., Kushimura, S., Goto, K., Miyagi, T., Imamura,F., Ruangrassamee, A., and Tanavud, C.: Damage to MangroveForest by 2004 Tsunami at pakarang Cape and Namke, Thailand,Pol. J. Environ. Stud., 18, 35–42, 2009b.
www.nat-hazards-earth-syst-sci.net/10/729/2010/ Nat. Hazards Earth Syst. Sci., 10, 729–745, 2010