study on cost of capital, return on equity and pension ... · equity and pension costs of air...
TRANSCRIPT
Study on Cost of Capital, Return on
Equity and Pension Costs of Air
Navigation Service Providers
Final Report
Report
24 March 2014
Prepared for: Prepared by:
European Commission
Directorate-General for Mobility and Transport
Unit E.2 - Single European Sky
B-1049 Brussels
Steer Davies Gleave
28-32 Upper Ground
London SE1 9PD
+44 (0)20 7910 5000
www.steerdaviesgleave.com


Final Report
Disclaimer
DISCLAIMER
Whilst this report has been produced at the request of the European Commission, the
content of this report does not reflect the official opinion of the European Commission.
Responsibility for views expressed in the report lies entirely with the author.
This analysis is based on data supplied by our client/collected by third parties. This has
been checked whenever possible; however Steer Davies Gleave cannot guarantee the
accuracy of such data and accepts no liability to third parties for any inaccuracies.

Final Report
Contents
CONTENTS
GLOSSARY ..................................................................................................... I
EXECUTIVE SUMMARY ..................................................................................... IV
1 INTRODUCTION ..................................................................................... 1
Background ............................................................................................ 1
The need for this study ............................................................................. 2
The study .............................................................................................. 2
Structure of this report ............................................................................. 2
2 STAKEHOLDER CONSULTATION .................................................................. 4
Organisation of the stakeholder consultation ................................................... 4
3 PART A: CONTEXT OF THE PROVISION OF AIR NAVIGATION SERVICES IN EUROPE .. 10
Introduction ......................................................................................... 10
Overview of air navigation services ............................................................. 10
The legal framework governing air navigation services in Europe ........................ 11
Overview of European ANSPs .................................................................... 12
The nature of air navigation service provision................................................ 14
Risk factors affecting revenue and costs of ANSPs ........................................... 16
4 PART A: REGULATORY ASSET BASE............................................................ 22
Principles as per Single European Sky Regulation ............................................ 22
Some accounting and regulatory principles ................................................... 22
Examination of ANSPs accounting methods and asset values .............................. 27
The views of the stakeholders on assets reporting and composition ..................... 39
Conclusion on asset reporting and composition .............................................. 41
Recommendations ................................................................................. 41
5 PART A: CALCULATING A REASONABLE RETURN ON CAPITAL FOR ANSPS ............ 44
Application of the cost of capital in air navigation .......................................... 44
Calculation of the Weighted Average Cost of Capital ....................................... 44
The return of equity ............................................................................... 45
The cost of debt .................................................................................... 50
Review of ANSP estimates of the cost of capital ............................................. 51
6 PART A: RECOMMENDATIONS FOR “REASONABLE PROFITABILITY” .................... 63
Introduction ......................................................................................... 63
Stakeholder views .................................................................................. 63
Final Report
Contents
Objectives of economic regulation ............................................................. 69
Proposed framework for calculating the cost of capital .................................... 71
Option 1 – efficient cost of capital ............................................................. 72
Options 2 and 3 – administered cost of capital and hybrid approach ..................... 76
Illustration of the application of options ...................................................... 76
Application of the framework to terminal and approach charges ........................ 79
Functional Airspace Blocks ....................................................................... 79
Overview of key findings on the cost of capital .............................................. 80
Recommendations ................................................................................. 80
7 PART B: PENSION COSTS AND APPLICATION OF IFRS ...................................... 82
Introduction ......................................................................................... 82
Principles as per Single European Sky Regulation ............................................ 82
Pension systems in Europe ....................................................................... 83
Application of IAS/IFRS accounting rules ...................................................... 86
Review of Eurocontrol guidance................................................................. 89
Pension systems in use by the ANSPs ........................................................... 92
Implications of current pension schemes offered by ANSPs ............................... 107
Views of the stakeholders ....................................................................... 117
Recommendations ................................................................................ 118
FIGURES
Figure 2.1 Consultation methodology .................................................. 5
Figure 3.1 Variability in ANSP service unit growth (en route) ................... 17
Figure 3.2 Variability in ANSP real en route service costs ....................... 20
Figure 4.1 Total asset base by category (2012) .................................... 31
Figure 4.2 Growth of total asset base (2012-2014 CAGR) ........................ 32
Figure 4.3 Average total asset base per service unit (2012) ..................... 32
Figure 4.4 Fixed asset composition ................................................... 33
Figure 4.5 Average implied economic life of fixed assets ........................ 35
Figure 4.6 Net current asset composition ........................................... 36
Figure 5.1 Government bond yields in selected EU countries ................... 46
Figure 5.2 Estimates of the equity risk premium .................................. 48
Figure 5.3 EURO and sterling denominated Corporate bond yields ............. 50
Figure 5.4 ANSP nominal and reported risk free rates ............................ 52

Final Report
Contents
Figure 5.5 European Sovereign bond yields (nominal) ............................ 53
Figure 5.6 ANSP reported equity risk premiums ................................... 54
Figure 5.7 ANSP equity beta assumptions ........................................... 54
Figure 5.8 ANSP reported return on equity for 2012 (nominal) ................. 58
Figure 5.9 ANSP reported cost of debt for 2012 (nominal) ....................... 59
Figure 5.10 Cororate bond yields and interest rates ................................ 59
Figure 5.11 ANSP nominal WACC values ............................................... 62
Figure 6.1 Options for calculating the cost of capital ............................ 72
Figure 6.2 Relationship between cost of capital and gearing.................... 75
Figure 7.1 Organisation of pension systems in Europe ............................ 85
Figure 7.2 Summary of Pay As You Go Pensions Schemes ....................... 109
Figure 7.3 Summary of Define Contribution Pensions Schemes ................ 110
Figure 7.4 Summary of approaches to Defined Benefit pension schemes .... 116
TABLES
Table 2.1 Stakeholder contacts for ANSP ............................................. 6
Table 2.2 Stakeholder contacts for NSA .............................................. 7
Table 2.3 Stakeholder contacts for users ............................................. 8
Table 2.4 Other stakeholders ........................................................... 8
Table 3.1 Ownership and capital structure of ANSPs ............................. 13
Table 3.2 ANSP revenue and cost risk ............................................... 16
Table 3.3 Fluctuation of exchange rates over 12 weeks ......................... 18
Table 4.1 Accounting method in use by ANSP ..................................... 27
Table 4.2 Separation of activities .................................................... 29
Table 4.3 Depreciation assumptions ................................................. 34
Table 4.4 Share of net current assets ............................................... 36
Table 4.5 Asset adjustments .......................................................... 37
Table 4.6 Adjustments compared to CoC asset base ............................. 38
Table 5.1 Impact of non-zero debt beta ............................................ 51
Table 5.2 Comparison of asset betas by industry ................................. 55
Table 5.3 ANSP tax rates .............................................................. 60
Table 5.4 ANSP reported cost of capital and supporting assumptions......... 61
Final Report
Contents
Table 6.1 Comparison of ANSP cost of capital under framework options ..... 78
Table 7.1 Hybrid pension schemes ................................................... 84
Table 7.2 Pension systems ............................................................ 92
Table 7.3 France, ANSP - DSNA ....................................................... 94
Table 7.4 Germany, ANSP - DFS ...................................................... 95
Table 7.5 Hungary, ANSP - Hungarocontrol ........................................ 97
Table 7.6 Latvia, ANSP - LGS ......................................................... 98
Table 7.7 MALTA, ANSP - MATS ....................................................... 99
Table 7.8 Norway, ANSP - Avinor ................................................... 100
Table 7.9 Poland, ANSP - PANSA .................................................... 102
Table 7.10 SPAIN, ANSP - AENA ....................................................... 103
Table 7.11 Sweden, ANSP - LFV....................................................... 104
Table 7.12 United Kingdom, ANSP - NATS .......................................... 105
Table 7.13 DFS pension valuation assumptions (Nominal) ....................... 112
Table 7.14 LFV Pension provisions 2009-2012 (SEK million) ..................... 114
Table 7.15 NATS DB Pension scheme – key dimensions ........................... 115
Table 7.16 Check sheet framework for uncontrollable cost assessment
(example) ................................................................... 121
APPENDICES
A QUESTIONNAIRES USED
Final Report
i
GLOSSARY
Air navigation services. This term includes air traffic management (ATM), communications,
navigation and surveillance systems (CNS), meteorological services for air navigation
(MET), search and rescue (SAR) and aeronautical information services/aeronautical
information management (AIS/AIM). These services are provided to air traffic during all
phases of operations (approach, aerodrome and en route).
Air navigation services provider (ANSP). Any entity providing ATM and/or other air
navigation services mentioned above.
Air traffic control (ATC) service. A service provided for the purpose of: a) preventing
collisions (between aircraft and on the manoeuvring area between aircraft and
obstructions); and b) expediting and maintaining an orderly flow of air traffic.
Air traffic management (ATM). The aggregation of the airborne functions and ground-based
functions (air traffic services, airspace management and air traffic flow management)
required to ensure the safe and efficient movement of aircraft during all phases of
operations.
Air traffic service (ATS). A generic term meaning variously, flight information service,
alerting service, air traffic advisory service, air traffic control service (area control
service, approach control service or aerodrome control service).
Amortization. The gradual extinguishment of the cost of an asset by periodic (annual)
charges to expenses, usually applicable to intangible assets (e.g. development costs).
Approach. Air traffic control service for arriving or departing controlled flights.
Asset. A resource from which future economic benefits are expected to flow to the entity
that owns or controls it.
Beta. An indicator that measures the degree of volatility, or systematic risk, of a
particular asset compared to that of the market.
Compound Annual Growth Rate (CAGR). The year-over-year growth rate of an investment
over a specified period of time.
CAPM. Capital Asset Pricing Model. A model that describes the relationship between risk
and expected return.
Cash flow. The net amount of money received by an entity over a given period.
Charge. A levy that is designed and applied specifically to recover the costs of providing
facilities and services for civil aviation.
Cost of capital. The cost of raising debt or equity funds.
CRCO (Central Route Charges Office). Office of Eurocontrol that collects charges from
airspace users on behalf of Eurocontrol Member States.
Debt risk premium. Excess return the market requires on debt finance provided to a
company to compensate for the risk of default.

Final Report
ii
Defined Benefits (DB). A type of pension plan that guarantees the member a certain
benefit at retirement.
Defined Contributions (DC). A type of pension plan where the benefits for the member
depend on the performance of the investments comprising the pension fund.
Depreciation of assets. The decrease in the value of an asset due to wear and tear through
use, action of the elements, inadequacy or obsolescence, normally over a predetermined
period of time (depreciation period/book life of the asset).
Determined costs. Costs established in Article 15(2)(a) and (b) of Regulation (EC) No
550/2004, that is costs to be shared among airspace users for the provision of air
navigation services. Determined costs are the costs determined by Member States at
national level or at the level of functional airspace blocks.
Economic life (of an asset). The period during which an asset is expected to yield a rate of
return.
En-route phase. That part of flight from the end of the take-off and initial climb phase to
the commencement of the approach and landing phase.
Equity capital. Money furnished by the owner(s) of the entity.
Equity risk premium. Excess return over the risk-free rate that investors require to
compensate them for the risks associated with variability of a market portfolio of
securities.
Eurocontrol. Eurocontrol is an intergovernmental organisation made up of 40 Member
States and the European Union. It develops and coordinates the implementation of pan-
European ATM programmes, operates a Network Operations Centre, collects and
redistributes route charges (CRCO), contributes to the development of new technologies.
Eurocontrol is also an ANSP which operates an international air traffic control centre at
Maastricht (MUAC).
Functional Airspace Block (FAB). FABs are defined in the Single European Sky legislative
package, as an airspace block based on operational requirements and established
regardless of State boundaries, where the provision of air navigation services and related
functions is performance-driven and optimised through enhanced cooperation among air
navigation service providers or, when appropriate, an integrated provider.
Fixed assets. Tangible assets that are permanent in nature and generally held for a period
of more than one year (normally buildings and equipment).
Fixed costs. Costs which, in the short-term, remain unchanged regardless of whether or
not the volume of services provided increases or decreases.
Gearing. Proportion of the capital structure of an entity which consists of debt.
International Finance Reporting Standards (IFRS). A set of international financial reporting
standards developed to be accepted globally.
International Civil Aviation Organisation (ICAO). ICAO is is a UN specialized agency which
develops international standards which are then used by Member States when they
develop their legally-binding national civil aviation regulations.

Final Report
iii
Liabilities. Debt of the entity in the form of financial claims on an entity’s assets.
National Supervisory Authority (NSA). Ensures the supervision of the ATM regulatory
framework in EU Member States. They are responsible for certifying and overseeing the air
navigation service providers.
National Performance Plans (NPP) National Supervisory Authorities draft and submit to the
European Commission National Performance Plans for ATM/Air Navigation Services (ANS)
for a given Reference Period (RP).
NATS En-Route plc (NERL). NERL is a subsidiary of NATS which provides en route air traffic
control (ATC) services to aircraft flying to, from and over the UK and over the eastern
North Atlantic.
Net asset value. The value of the total assets of an entity after deduction of all debts
(equals equity capital).
Operating life (of an asset). Period of time that a fixed asset can be used.
Pay-As-You-Go (PAYG). A type of pension plan where current contributions of members
serve to pay current benefits of pensioners.
Reference Period (RP). Periods of application of the Union-wide performance targets and
the performance plans, as set out in Article 11(3)(d) of Regulation (EC) No 549/2004. The
first Reference Period (RP1) covers the period 2012-14, whilst the second Reference Period
(RP2) covers 2015-2019. Thereafter Reference Periods are expected to be of 5 years
duration.
Residual value. Cost (of an asset) less any part of the cost that has been depreciated or
amortized, or treated as an expense or loss.
Risk free rate. Return investors could reasonably expect if they invested their money in a
risk-free investment, where returns are guaranteed and there is no possibility of default.
Single European Sky (SES). An initiative from the European Commission to create more
coherent air traffic management systems in Europe.
STATFOR. A unit of Eurocontrol that provides statistics and forecasts on air traffic in
Europe.
Users. This term refers to aircraft operators as users of air navigation facilities and
services. The term “end-users” refers to ultimate consumers in general (for example,
passengers and shippers).
WACC. Weighted average cost of capital. The WACC is the cost of each capital component
multiplied by its proportional weight and then summed. It represents the cost of servicing
the capital invested in a company.

Final Report
iv
Executive Summary
Context
1. Since 2004, the European Union gained competencies in air traffic management with the
introduction of the Single European Sky (SES). A performance scheme was introduced with
the adoption of the Single European Sky (SES) II package in 2009. The performance
scheme sets targets for, among other key performance areas, cost-efficiency for EU and
associated States. The objective of the performance scheme is to improve the provision
of air navigation services, which are provided under statutory monopoly, hitherto mainly
by national state-owned service providers (Air Navigation Service Providers).
2. Costs of air navigation services are recovered through user charges paid by airspace users.
The revised charging Regulation (EC 391/2013) allows the definition of determined costs to
include, inter alia, the cost of capital and staff costs, including pension costs.
Furthermore, a specific provision in Article 14 of the revised charging Regulation allows
the recovery of unforeseen changes in pension costs due to unforeseen changes in pension
law, pension accounting law or pension costs resulting from unforeseen financial market
conditions.
3. It has been observed during the adoption of national performance plans for the first
Reference Period (2012-2014) that there are considerable differences in the level and
approach to calculating the cost of capital and also in the evaluation of future pension
risks between Member States.
Objectives and methodology
4. The study has collected further information on the situation in Member States in respect of
risks justifying differences in the cost of capital and in respect of States’ and ANSPs’
pension obligations and developed recommendations for future application. Calculating
the allowable cost of capital for ANSPs is not straightforward as most are wholly owned by
their respective States, and none of the ANSPs in the SES are traded on the stock
exchange. Moreover, the economic crisis alongside low interest rates across the EU, have
led to devaluations in pension funds for those ANSPs which operate such funds (NATS, DFS,
LFV, Avinor in the sample) and year-on-year variations in costs. Depending upon the
interpretation of accounting rules, this could lead to volatility in the level of user charges.
5. Steer Davies Gleave was appointed in July 2013 to support the European Commission in the
implementation of the Performance Scheme by addressing two specific issues related to
the cost-efficiency Key Performance Area and to provide recommendations:
I Part A: Study on the Cost of Capital and Return on Equity of Air Navigation Service
Providers;
I Part B: Study on Pension Costs of Air Navigation Service Providers and the application of
International Financial Reporting Standards (IFRS).
6. The methodology developed for the study was based upon:
Final Report
v
I A programme of stakeholder engagement: we engaged with a significant sample of the
air traffic management stakeholders in order to obtain their views on both parts of the
study. Stakeholders included air navigation service providers, Member States/ National
Supervisory Authorities, airspace users, staff representatives and other relevant
parties;
I An empirical analysis: we collected and analysed relevant data on the calculation of
the cost of capital and pension systems across Europe.
Part A - Findings
7. The monopoly characteristics of the industry mean that it is subject to economic
regulation as defined in Regulation EC 390/2013, in common with a number of other
industries including, inter alia, water and energy utilities, telecommunications, airports
and rail networks. As in the case of other regulatory frameworks, this is intended to
ensure that charges are reflective of efficient costs and are as close as possible to the
charges that would be levied if individual ANSPs operated in a competitive environment.
8. At the same time, air navigation differs significantly from other industries in a number of
respects. These differences must be taken into account in any consideration of the
efficient costs of air navigation, in particular the industry’s cost of capital, since they
inform an understanding of the various risk factors affecting ANSPs.
9. Overall, we consider that the cost and revenue risk faced by ANSPs is low and broadly
similar to that faced by some other regulated industries, in particular the fixed
infrastructure component of the energy and water sectors. Notwithstanding the potential
for air traffic demand to vary from year-to-year, the effect of such variation is
substantially reduced by the risk sharing arrangements introduced by the Charging
Regulation. Based on a comparison of ANSPs with entities in other regulated industries,
we conclude that underlying ANSP risk (after abstracting from financial risk introduced by
gearing) can be represented by an asset beta in the range 0.3 to 0.5.
10. There are important differences in the approach to estimating WACCs applied by different
ANSPs, resulting from:
I Different methods for determining key rates of return (application of CAPM versus use
of government-determined rates);
I Different assumptions about key parameter values (e.g. beta values and the risk free
rate); and
I Inconsistencies and anomalies in the use of component values (e.g. a value for the cost
of debt lower that is lower than the risk free rate).
11. There are also important differences in the approach to financing ANSPs’ activities,
particularly in respect of:
I Gearing;
I Reliance on market versus government finance.
12. The estimation of WACC elements is also affected by distortions resulting from the
financial crisis, not least changes in government bond rates in countries experiencing
serious financial difficulties.
13. Much of the debate between stakeholders concerning the appropriate approach for
calculating the cost of capital arguably reflects differences in their underlying view of

Final Report
vi
what economic regulation is seeking to achieve. In our view, a robust framework for the
calculation should be based on explicit and transparent objectives, recognising that
principles of economic efficiency that underpin methodologies such as CAPM may need to
be balanced by other considerations. Our suggested objectives are economic efficiency,
stability of charges, consistency of approach, transparency and credibility.
14. The appropriate return on assets for an economically regulated entity is normally
determined by calculating a Weighted Average Cost of Capital (WACC). However, while
the use of the WACC in economic regulation is well established, we note that it is typically
applied to commercial organisations securing finance in private capital markets, although
these organisations are not necessarily privately owned. In the case of air navigation,
methods of financing ANSPs vary considerably across the EU, and many are subject to
heavy state involvement in terms of ownership and funding. The WACC therefore needs to
be applied to ANSPs with care.
15. The asset base that is included in the calculation of the cost of capital also requires
careful consideration. However, under the current reporting arrangements, it is very
difficult to understand the rationale behind the value of the assets used by States/ ANSPs
for their cost of capital calculation, and to reconcile with statutory/ independently
audited accounts. Additionally there is little clarity in the performance plans as to any
revaluation or adjustment of assets or liabilities. Interest-bearing assets appear to have
been removed from assets used for the calculation of the cost of capital, but there are
other assets including cash, leased assets and pension assets which can receive a return
from other sources.
Part A - Recommendations
16. We propose a framework that encourages the use of the WACC and CAPM methodologies
and provides for greater rigour in the calculation of the cost of capital while recognising
the need for flexibility in terms of the approach adopted in different Member States.
17. The industry should move towards the calculation of an efficient cost of capital over the
long term, since this will ensure cost reflective charges and align with the broad objective
of economic regulation in other sectors to encourage an efficient allocation of resources
across the economy.
18. However, in view of the potential and unknown impact on charges in the short term, and
the lack of industry consensus on the appropriate basis for determining reasonable
profitability, the framework of calculation should allow greater flexibility for at least the
next Review Period.
19. Our framework would allow ANSPs and NSAs to apply one of three options, as follows :
I Option 1 – efficient cost of capital: this would involve full application of the WACC and
CAPM methodologies. It would be appropriate for Member States in which the ANSP
operates as an independent commercial entity, regardless of ownership.
I Option 2 – administered cost of capital: this would involve a calculation based on
actual values for the cost of debt (i.e. the rate actually paid when borrowing from
government or benefitting from favourable terms due to state guarantees) and, in
those Member States where the government specifies the required equity return, for
the cost of equity. In principle, the calculation would involve application of the WACC
using actual gearing, although we note that is those Member States in which the ANSP is
wholly debt-financed the cost of debt and the cost of capital are equivalent.
Final Report
vii
I Option 3 – hybrid: the calculation would be based on the actual cost of debt, as
defined under Option 2, and a market rate of equity calculated using the CAPM. This
approach would apply in Member States in which the ANSP is able to secure loan
finance on favourable terms but is not subject to a government-specified equity return.
20. ANSPs and NSAs would be required to adopt one of these options and apply it consistently.
They would also be required to provide a justification, based on the specific circumstances
in which the ANSP was funded. For example, an ANSP adopting Option 2 would be
required to confirm that returns on government equity are specified as a matter of policy
and that consequently application of the CAPM was not appropriate. Moreover, within this
framework Option 1 would set a ceiling for the cost of capital, with ANSPs adopting either
of the other two options required to demonstrate that the resulting value did not exceed
that calculated under Option 1.
21. With regards to assets, Steer Davies Gleave’s recommendations are built around the
following principles:
I Improved transparency of asset reporting should be mandated: the asset value
proposed for the Cost of Capital should be reconciled to published/ audited accounts
with explanations, to enable verification.
I Assets which receive a return from another source should be excluded from the asset
base to receive a cost of capital.
I A movement to greater standardisation of depreciation policy should be encouraged.
I There should be consistency between the asset valuation method applied and
application of nominal/real cost of capital, so that where assets are revalued they are
not included twice in the costs paid by airspace users
Part B – Findings
22. The provision of pensions can provide ANSPs with significant future liabilities which can be
subject to a variety of market forces such as the financial performance of any pension
plan, inflation and interest rates together with social dynamics such as the life expectancy
of current and future retirees.
23. Accounting for defined benefit plans is complex because actuarial assumptions and
valuation methods are required to measure the balance sheet obligation and the expense.
The expense recognised generally differs from the contributions made in the period. For
Defined Benefit plans, the view about the future Discount Rate (DR) is key to changes in
value of net pension liabilities: in general a lower DR has led to an increase in the net
funding gap between assets and liabilities. Another issues is that different approaches are
developed by each ANSP based on historical and local arrangements, that pension
arrangements often involve outside authorities and that NSAs review of pensions
arrangements is limited by available expertise and resources. However transparency is
required.
24. IAS 19 outlines the accounting requirements for employee benefits and establishes the
principle that the cost of providing employee benefits should be recognised in the period
in which the benefit is earned by the employee, rather than when it is paid or payable.
Since January 2013, using a “corridor approach” to smooth the amounts recoverable which
was previously acceptable within IAS 19, is no longer permitted. However, two ANSPs are
Final Report
viii
applying the smoothing approach in 2013 through the use of Regulatory Accounting in
order to close the net pension liability gap over 11 and 15 years respectively.
25. Following the trend of companies, and States, throughout Europe, some ANSPs have taken
explicit actions to mitigate the future pensions cost risks including transitioning from a
Defined Benefit to Defined Contribution scheme, movement to an average rather than
final salary Defined Benefits system, extending the age of retirement, transfer of pension
liabilities to the State or new joiners on Defined Contribution Scheme. There is a risk that
the pensions costs of ANSPs, if not addressed now will potentially become more difficult to
manage, in an environment where the industry is restructuring and becoming more capital
intensive. ANSPs therefore need to address the long term sustainability of their pension
arrangements.
Part B - Recommendations
26. With regards to pension arrangements, Steer Davies Gleave’s recommendations are built
around the following principles:
I ANSPs should actively seek to implement some of the full range of options open to
them to manage and mitigate pension costs risks, including transition to other schemes
and arrangements subject to negotiation and transitional arrangements;
I Sufficient information should be provided in Performance Plans in order for the
Commission and PRB to understand the evolution of projected pension costs;
I Sufficient information should be provided in Performance Plans in order to provide a
sound basis for the future assessment by NSAs, the Commission and PRB of "costs
exempt from risk sharing";
I Different reporting requirements should be specified for the different type of pension
schemes (PAYG, DB, DC) in use across European ANSPs;
I Detailed information on Defined benefit schemes in particular should be presented in
the Performance Plans;
I Where actuarial expectations of the future Discount Rate play a key role in the value of
pension fund requirements, the timing of the valuation should be aligned with the
timing of the preparation of performance plans;
I Where there is a cash requirement to fund a pension scheme deficit, Commission
guidance should be provided as to which tools can be used by ANSPs to meet the CRCO
requirement for smoothing and changes to the level of charges;
I There should be an explicit exemption from the Service Provision Regulation’s
requirement to follow IAS. The explicit exemption should be provided to encourage the
use of smoothing charges through regulatory accounts.
I Cash payments, including those required for deficit or gap repair, rather than
accounting accruals payments should be recognised in CRCO calculations of pensions
costs; and
I When reviewing ANSPs pension arrangements and costs, NSAs should pool their
expertise to address the complex pension cost issues.

Final Report
1
1 Introduction
Background
Since 2004, the European Union gained competencies in air traffic management with the 1.1
introduction of the Single European Sky (SES). The main objective of the EU is to reform
ATM in Europe in order to support sustainable air traffic growth and to provide air traffic
operations under the safest, most cost- and flight-efficient and environmentally friendly
conditions. This implies de-fragmenting European airspace, reducing delays, increasing
safety standards and improving flight efficiency to reduce aviation’s environmental
footprint and reduce costs related to service provision.
A performance scheme was introduced with the adoption of the Single European Sky (SES) 1.2
II package in 2009. The performance scheme sets targets in the area of safety,
environment, capacity and cost-efficiency for EU and associated States. The objective is
to improve the provision of air navigation services, which are provided under statutory
monopoly, hitherto mainly by national state-owned service providers. The first Reference
Period (RP1) covers the period 2012-14, and second Reference Period (RP2), the period
2015-2019.
Air Navigation Service Providers (ANSPs) are designated by their States to provide ATM 1.3
services. Whilst ANSPs do compete for the provision of terminal and tower services in
some States, there is no competition between ANSPs providing en-route services in Europe.
Costs of air navigation services are recovered through user charges paid by airspace users. 1.4
The revised charging Regulation (EC 391/2013) allows the definition of determined costs to
include, inter alia, the cost of capital and staff costs, including pension costs.
Furthermore, a specific provision in Article 14 of the revised charging Regulation allows
the recovery of unforeseen changes in pension costs due to unforeseen changes in pension
law, pension accounting law or pension costs resulting from unforeseen financial market
conditions.
The traffic risk sharing arrangements of article 13 of the charging Regulation (EC 1.5
391/2013) requires that additional or lost revenue of the ANSPs (in respect of determined
costs) due to the difference in traffic between the actual and forecast service units1 are
shared between ANSPs and airspace users. This mechanism has the following features:
I Service unit difference less than 2%: ANSPs bear all of the risk and receive all of the
rewards. This 2% neutral zone means small variations in traffic or forecasting errors do
not result in changes in the unit rate;
I Service unit difference less than 10% but higher than 2%: ANSPs bears 30% of the
revenue difference, airspace users bearing 70% for RP1.
I Service unit difference greater than 10%: airspace users bear 100% of the revenue
difference.
1 A service unit represent the product of the distance factor and the weight factor of the aircraft concerned.

Final Report
2
The provisions of the charging Regulation place the cost risk onto the ANSPs, but there are 1.6
two important caveats:
I “Uncontrollable cost factors”, or “costs exempt from risk sharing” can be passed on to
airspace users, by adjustment at the end of the Reference Period subject to approval
of NSAs and the Commission;
I Inflation risk is fully borne by airspace users.
The need for this study
It has been observed during the adoption of national performance plans for the RP1 that 1.7
there are considerable differences in the level and approach to calculating the cost of
capital and also in the evaluation of future pension risks between Member States. The aim
of this study is to gain further information on the situation in Member States in respect of
risks justifying differences in the cost of capital and in respect of States’ and ANSPs’
pension obligations and to develop recommendations for future application.
As the return on assets and pensions costs are allowable Determined Costs, and the 1.8
charging Regulation allows for the pass through of unforeseen changes in pension costs,
the calculation of these values for RP2 target setting could have a significant influence on
the level of Determined Costs and charges to users across the SES States.
Calculating the allowable cost of capital for ANSPs is not straightforward as most are 1.9
wholly owned by their respective States, and none of the ANSPs in the SES are traded on
the stock exchange. Moreover, the economic crisis alongside low interest rates across the
EU, have led to devaluations in pension funds for those ANSPs which operate such funds
(NATS, DFS, LFV, Avinor) and year-on-year variations in costs. Depending upon the
interpretation of accounting rules, this could lead to volatility in the level of user charges.
The study
Steer Davies Gleave was appointed to support the European Commission in the 1.10
implementation of the Performance Scheme by addressing two specific issues related to
the cost-efficiency Key Performance Area and to provide recommendations:
I Part A: Study on the Cost of Capital and Return on Equity of Air Navigation Service
Providers;
I Part B: Study on Pension Costs of Air Navigation Service Providers and the application of
International Financial Reporting Standards (IFRS).
Structure of this report
The remainder of this report is structured as follows: 1.11
I Chapter 2 sets out the approach to and the stakeholders met or interviewed as a part
of the consultation exercise undertaken of the study;
I Chapter 3 describes the provision of ATM services In Europe and discusses the specific
situation of ANSPs;

Final Report
3
I Chapter 4 discusses a number of issues related to the definition of the regulatory asset
base for ANSPs;
I Chapter 5 discusses the calculation of a reasonable rate of return on capital for ANSPs;
I Chapter 6 sets out our view of “reasonable profitability”; and
I Chapter 7 discusses the treatment of pension costs and the application of IFRS.
The report also includes an appendix: 1.12
I Appendix 1 presents the questionnaires that were circulated to all types of
stakeholders.

Final Report
4
2 Stakeholder consultation
Organisation of the stakeholder consultation
Purpose of the consultation
2.1 In order to gain an understanding of the relevant issues to be considered in this
study, and in agreement with the Commission we defined a programme of
stakeholder consultation with the following objectives to:
I Collect stakeholder data in order to complement the data already submitted as
part of RP1;
I Discuss issues arising with the application of the legislation and any possible
suggested approaches;
I Obtain information in order to answer the detailed questions of the Terms of
Reference; and
I Collect stakeholder views on how they rate the existing guidance they receive
and any suggested amendments for improvement.
2.2 The consultation involved the following organisations:
I Air Navigation Service Providers (ANSP) who are the key focus of the study;
I National Supervisory Authorities (NSAs) who are responsible for the
supervision of ANSPs and drawing up the performance plans submitted to the
European Commission;
I Airlines and business aviation since they are the final “customers” of ANSPs
and will have a valuable perspective on industry practices (airport
representatives will also be included in this group);
I Staff representatives of ANSPs; and
I Other relevant parties.
2.3 The next section explains the choice of stakeholders within each category
consulted, and is followed by a summary of the strategy adopted when engaging
with each organisation.
Methodology for the stakeholder consultation
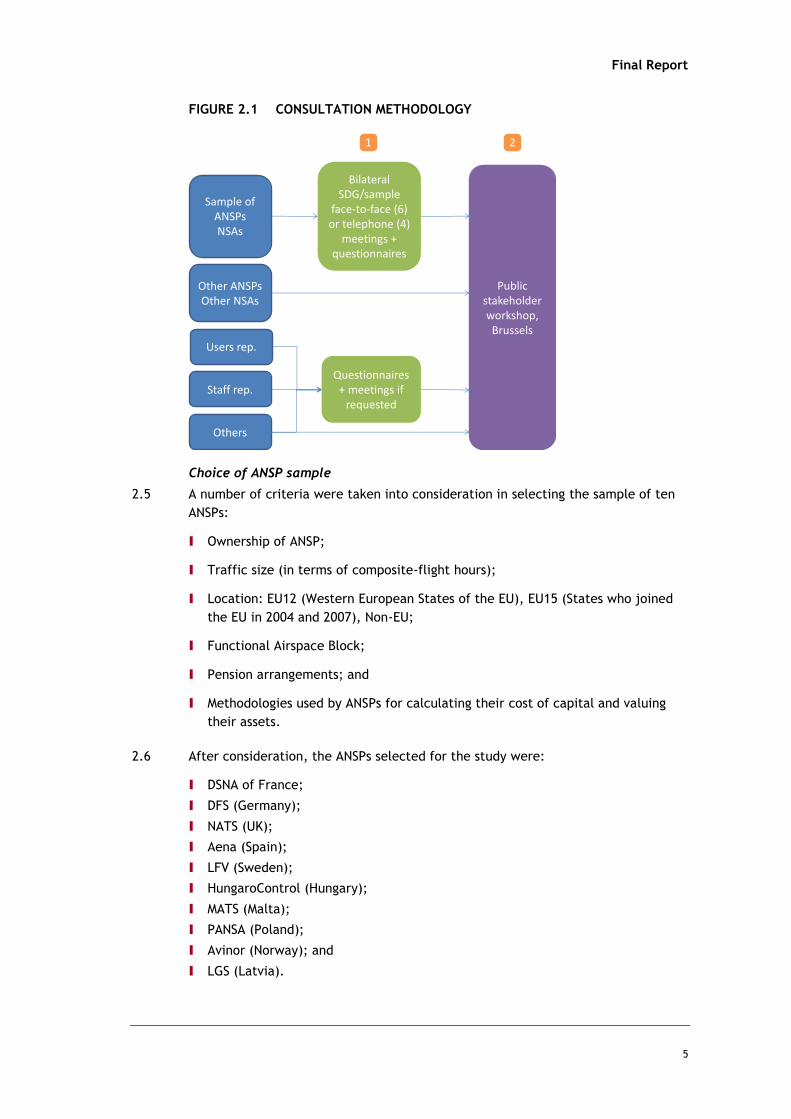
2.4 The graphic below shows the methodology developed in agreement with the
European Commission for the consultation with stakeholders.
Final Report
5
FIGURE 2.1 CONSULTATION METHODOLOGY
Choice of ANSP sample
2.5 A number of criteria were taken into consideration in selecting the sample of ten
ANSPs:
I Ownership of ANSP;
I Traffic size (in terms of composite-flight hours);
I Location: EU12 (Western European States of the EU), EU15 (States who joined
the EU in 2004 and 2007), Non-EU;
I Functional Airspace Block;
I Pension arrangements; and
I Methodologies used by ANSPs for calculating their cost of capital and valuing
their assets.
2.6 After consideration, the ANSPs selected for the study were:
I DSNA of France;
I DFS (Germany);
I NATS (UK);
I Aena (Spain);
I LFV (Sweden);
I HungaroControl (Hungary);
I MATS (Malta);
I PANSA (Poland);
I Avinor (Norway); and
I LGS (Latvia).
1
Public stakeholder workshop,
Brussels
Sample of ANSPsNSAs
2
Other ANSPsOther NSAs
Users rep.
Staff rep.
Others
Bilateral SDG/sample
face-to-face (6) or telephone (4)
meetings + questionnaires
Questionnaires + meetings if
requested
Final Report
6
Questionnaires
2.7 The questionnaires were designed in order to help understand:
I Opinions and views of stakeholders on the issues raised by the study;
I A factual assessment of the situation in each Member State and ANSP; and
I Any suggested recommendations by stakeholders.
2.8 The questionnaires sent consisted of:
I ANSPs and NSAs: general questionnaire with a specific questionnaire on their
pension scheme (depending on their pension scheme); and
I Users, staff representatives and others: a separate questionnaire.
2.9 The respondents were initially given 4-6 weeks to provide their responses.
Bilateral consultation achieved
Air Navigation Service Providers (ANSPs)
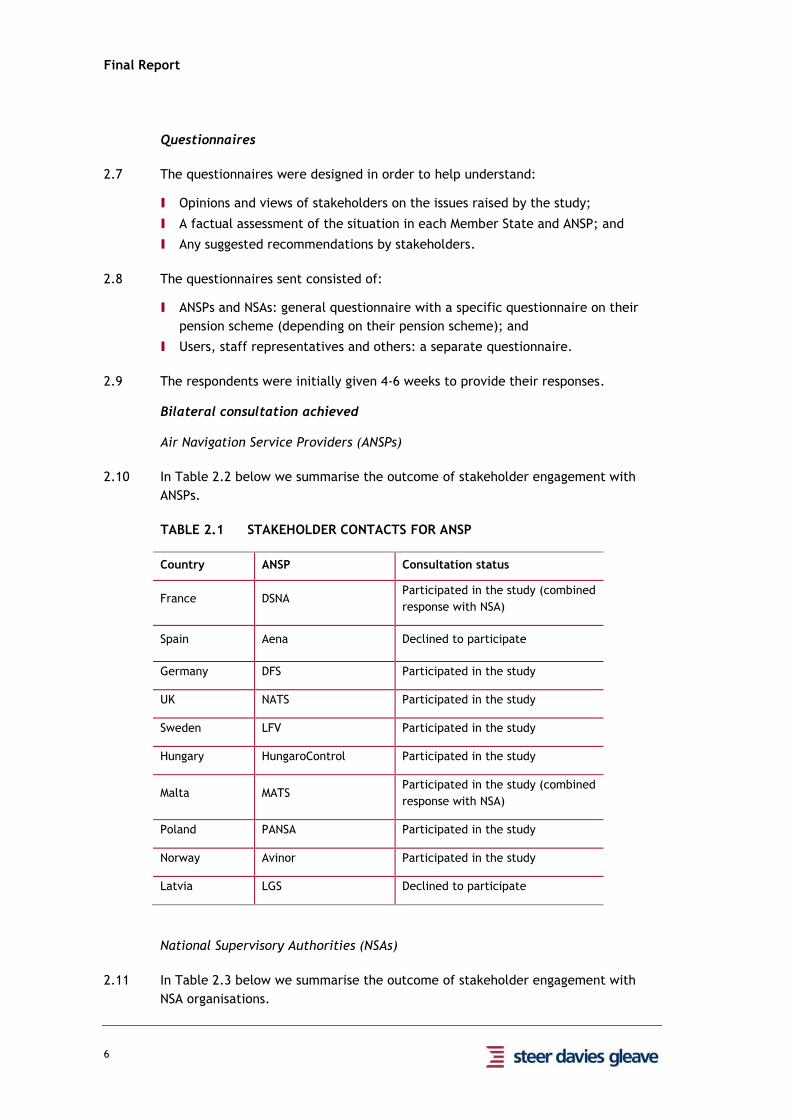
2.10 In Table 2.2 below we summarise the outcome of stakeholder engagement with
ANSPs.
TABLE 2.1 STAKEHOLDER CONTACTS FOR ANSP
Country ANSP Consultation status
France DSNA Participated in the study (combined
response with NSA)
Spain Aena Declined to participate
Germany DFS Participated in the study
UK NATS Participated in the study
Sweden LFV Participated in the study
Hungary HungaroControl Participated in the study
Malta MATS Participated in the study (combined
response with NSA)
Poland PANSA Participated in the study
Norway Avinor Participated in the study
Latvia LGS Declined to participate
National Supervisory Authorities (NSAs)
2.11 In Table 2.3 below we summarise the outcome of stakeholder engagement with
NSA organisations.

Final Report
7
TABLE 2.2 STAKEHOLDER CONTACTS FOR NSA
Country NSA Consultation status
France DTA Participated in the study
(combined response with ANSP)
Spain AESA (Agencia Estatal de
Seguridad Aérea) Participated in the study
Germany Bundesaufsichtsamt für
Flugsicherung (BAF) Participated in the study
UK Civil Aviation Authority Participated in the study
Sweden
Transportstyrelsen
(Swedish Transport
Agency)
Participated in the study
Hungary
National Transport
Authority, Aviation
Authority
Declined to participate
Malta Department of Civil
Aviation
Answers to questionnaire
received (combined response
with ANSP)
Poland Civil Aviation Office Participated in the study
Norway Civil Aviation Authority Participated in the study
Latvia Civil Aviation Authority Declined to participate

Final Report
8
Users: Airlines, business aviation and airport representatives
2.12 In Table 2.4 below we summarise the outcome of stakeholder engagement with
user organisations.
TABLE 2.3 STAKEHOLDER CONTACTS FOR USERS
Stakeholder Group Specific organisation(s) Consultation status
Airline Associations
International Air Transport
Association (IATA) Participated in the study
Association of European
Airlines (AEA) Participated in the study
European Low Fare
Airlines Association
(ELFAA)
Participated in the study
European Regions Airline
Association (ERAA)
Endorsed the responses of
IATA/AEA
International Air Carrier
Association (IACA) Participated in the study
EBAA (European Business
Airlines Association)
Endorsed the responses of
IATA/AEA
Airport representatives
Airport Council
International Europe (ACI
Europe)
Declined to participate
Staff representatives of ANSPs
Other stakeholders
2.13 Other stakeholders that we consulted with include the following organisations. In
Table 2.5 below we summarise the outcome of other stakeholder engagement.
TABLE 2.4 OTHER STAKEHOLDERS
Organisation Type Consultation status
Air Traffic Controllers
European Union
Coordination (ATCEUC)
Pan-European trade
union (ATCOs) Participated in the study
IFATCA Worldwide trade union
(ATCOs) Declined to participate
European Transport
Federation
Pan European transport
trade union Participated in the study
International Federation
of Air Traffic Safety
Electronics Associations
(IFATSEA)
International trade
union Did not participate

Final Report
9
Organisation Type Consultation status
International Federation
of Aeronautical
Information Management
Associations (IFAIMA)
International trade
union Declined to participate
CANSO
International
representative body of
air navigation service
providers
Participated in the study
Interviews
2.14 A number of face-to-face interviews (or where unavailable) telephone interviews
were conducted during the study.
I ANSPs: DSNA, NATS, DFS, HungaroControl, LFV, Avinor;
I NSAs: French DTA, German LBA, UK CAA, Swedish Transportstyrelsen;
I Staff representatives: European Transport Federation;
Stakeholder workshop
2.15 An open stakeholder workshop was organised in Brussels on 12th November 2013.
The meeting was open to all interested parties and not restricted to the sample of
stakeholders contacted as part of this study. Publicity about this workshop was
communicated by the Performance Review Body. The detailed list of attendees is
available from the Commission.
2.16 Web-cam streaming was also arranged in order to allow better access to the
meeting issues. After the workshop, all attendees and web-cam attendees were
invited to send written comments to Steer Davies Gleave to be considered for the
study.
2.17 An agenda for the workshop was agreed with the Commission and an information
document was circulated as part of the registration process to all attendees. This
document summarised some of the initial findings of the study and listed a number
of points that were discussed with stakeholders at the meeting.

Final Report
10
3 PART A: Context of the provision of air navigation
services in Europe
Introduction
In order to assess the efficient capital and pension costs of European air navigation 3.1
service provision, it is important to understand the characteristics of the industry
including the scope and nature of the service, the industry cost structure, the legal
framework within which it operates and the risks factors affecting ANSPs. A
careful consideration of risks is particularly important in determining how the cost
of capital for ANSPs should be calculated and what guidance on reasonable
profitability should be provided. This chapter discusses key industry
characteristics and their implications for industry and individual ANSP risk, drawing
comparisons with other regulated industries in order to highlight similarities and
differences and inform the benchmarking described in Chapter 5.
Overview of air navigation services
Under the Chicago Convention, the concept of the Flight Information Region (FIR) 3.2
is defined as a homogenous region of airspace that should ensure efficient
coverage of air route structures. Hitherto, air frontiers have been fixed by
reference to land and sea frontiers. Against this background, the International
Civil Aviation Organisation (ICAO) recommends that the delineation of internal
airspace should be related to the need for efficient service rather than to national
boundaries.
Air navigation services are categorised as either en-route or terminal and approach 3.3
services according to whether they relate to the management of upper airspace
(above Flight Level 285) or lower airspace (under Flight level 285). Each is subject
to a different market and regulatory environment.
There are 38 en-route service providers in Europe, each providing air navigation 3.4
services above the territory of their Member State (apart from the Maastricht
Upper Area Control Centre operated by Eurocontrol on behalf of four States) as
monopolies. However this has led to a fragmented provision of services, and to
achieve maximum capacity and efficiency of the ATM network, the upper airspace
will be reconfigured into functional airspace blocks (FAB).
Terminal air navigation services are most often provided by the same monopoly 3.5
entity as en-route services. As noted in a UK CAA report, “European ANSPs,
through their certification, are in principle entitled to offer their services
anywhere in Europe, where the certification must be mutually accepted. However
ANSPs are still required to be designated by the Member State where they wish to
operate in order to provide services”. In practice, there is competition between
different entities for the right to operate the service at some airports only in the
UK, Germany, Sweden and Spain.
In the UK, Liverpool, East Midlands, Belfast City and Newcastle airports as well as 3.6
a number of smaller aerodromes provide their own terminal services rather than
using those of the incumbent en-route provider NATS Services Limited (NSL). In

Final Report
11
Sweden, nine airports will shortly tender their terminal ANS services, while
Austrocontrol has won a contract to provide airport air navigation services at a
number of locations in Germany. In Spain, 13 towers have been subject to an open
tender process and DFS7, NATS and Austrocontrol have all secured designation to
operate from the Spanish National Supervisory Authority. In addition new,
privately owned ANSPs have been established and have secured certification to
provide services, including ACR8 (providing ANS in Sweden), FerroNATS (NATS’ joint
venture with Ferrovial that has won contracts to provide services in Spain) and
Saerco (which has also won contracts to provide services in Spain)”2.
Functional Airspace Blocks (FABs) have been defined for the purposes of the SES 3.7
legislation as blocks of upper airspace based on operational requirements and
established regardless of State boundaries. Within FABs, the provision of air
navigation services and related functions is performance-driven and optimised
through enhanced cooperation among ANSPs or, when appropriate, an integrated
provider. Nine FAB initiatives have been developed.
The legal framework governing air navigation services in Europe
The SES Performance Scheme
The SES initiative was implemented in 2004 through four European Regulations (EC 3.8
549-550-551-552/2004). Following a review of the progress of the SES in 2007, the
Commission concluded that desired outcomes were not being realised sufficiently
quickly, and that further action was needed in other areas as performance and the
environment. SES II came into force in December 2009 and sought to address these
concerns in a number of ways, including through the introduction of a Performance
Scheme.
The Performance Scheme is organised around fixed Reference Periods (RPs), 3.9
before which performance targets are set both at an Union-wide and National/FAB
level. These targets are legally binding on Member States and designed to
encourage ANSPs to be more efficient and responsive to traffic demand, while
ensuring adequate safety levels. The First Reference Period (RP1) is 2012-2014,
whilst the Second Reference Period (RP2) is 2015-2019. Subsequent reference
periods shall be of five calendar years duration too. The key provisions of the
Performance Scheme for RP1 are contained in Article 11 of the Framework
Regulation, which can be found in Regulation 549/2004, as amended, and in
Regulation 691/2010. The Performance Scheme for RP2 has, meanwhile, been
adopted and published by the Commission in Regulation EC 390/2013. Regulation
EC 390/2013 is applicable for some provisions prior to 2015 as detailed in the
legislation.
User charges
Costs of air navigation services are recovered through user charges paid by 3.10
airlines. The revised charging Regulation (EC 391/2013) lays down the measures
for the development of a common charging scheme for air navigation services, in
respect of RP2 of the Performance Scheme (2015-2019). Article 13 of the revised
Charging Regulation describes how traffic risks should be shared between ANSPs
2 CAP 1004, Single European Sky - Market Conditions for Terminal Air Navigation Services in the UK, February 2013

Final Report
12
and airspace users by introducing a traffic-risk sharing scheme. This limits ANSP
exposure to downside traffic risk but does not allow full pass through. The
provisions of the charging scheme allocate cost risk to ANSPs but allow
“uncontrollable cost factors”/ “costs exempt from risk sharing” to be passed on to
airspace users, subject to Commission approval. The Charging Regulation also
allows for the recovery of, inter alia, cost of capital and staff costs, including
pension costs.
According to Article 7 of the revised Charging Regulation, determined costs shall 3.11
be broken down into staff costs, operating costs, depreciation costs, cost of
capital and exceptional items. The cost of capital category is further defined in
Article 7 as follows:
“Cost of capital shall be equal to the product of:
(a) the sum of the average net book value of fixed assets and possible
adjustments to total assets determined by the national supervisory authority and
used by the air navigation service provider in operation or under construction,
and of the average value of the net current assets, excluding interest bearing
accounts, that are required for the provision of air navigation services; and
(b) the weighted average of the interest rate on debts and of the return on
equity. For air navigation service providers without any equity capital, the
weighted average shall be calculated on the basis of a return applied to the
difference between the total of the assets referred to in point (a) and the debts.
(…) the factors to which weight shall be given shall be based on the proportion of
financing through either debt or equity. The interest rate on debts shall be equal
to the average interest rate on debts of the air navigation service provider. The
return on equity shall be based on the actual financial risk incurred by the air
navigation service provider.
When the assets do not belong to the air navigation service provider, but are
included in the calculation of the cost of capital, Member States shall ensure that
the costs of these assets are not recovered twice.
Any adjustment beyond the provisions of the International Accounting Standards
shall be specified in the performance plan for review by the Commission and in
the additional information to be provided in accordance with Annex II”.
ICAO requirements
Under Article 28 of the Chicago Convention of 1944, it is the States responsibility 3.12
to provide air navigation facilities and services in the airspace above their
territories. It is important to note that there is an obligation for States to ensure
continuity of provision of this service. This means that service must be provided
on an on-going basis and cannot be interrupted because, for example, a privately
owned and commercially operated ANSP has gone bankrupt.
Overview of European ANSPs
In Europe, ANSPs are required to obtain the status of Certification and Designation 3.13
in accordance with SES legislation. As already noted, en-route services are subject
to monopoly provision but there can be more than one provider for terminal and
tower services. National Supervisory Authorities (NSAs) ensure the supervision of
Final Report
13
the ATM regulatory framework in all EU Member States. They have particular
responsibility for certifying and overseeing ANSPs.
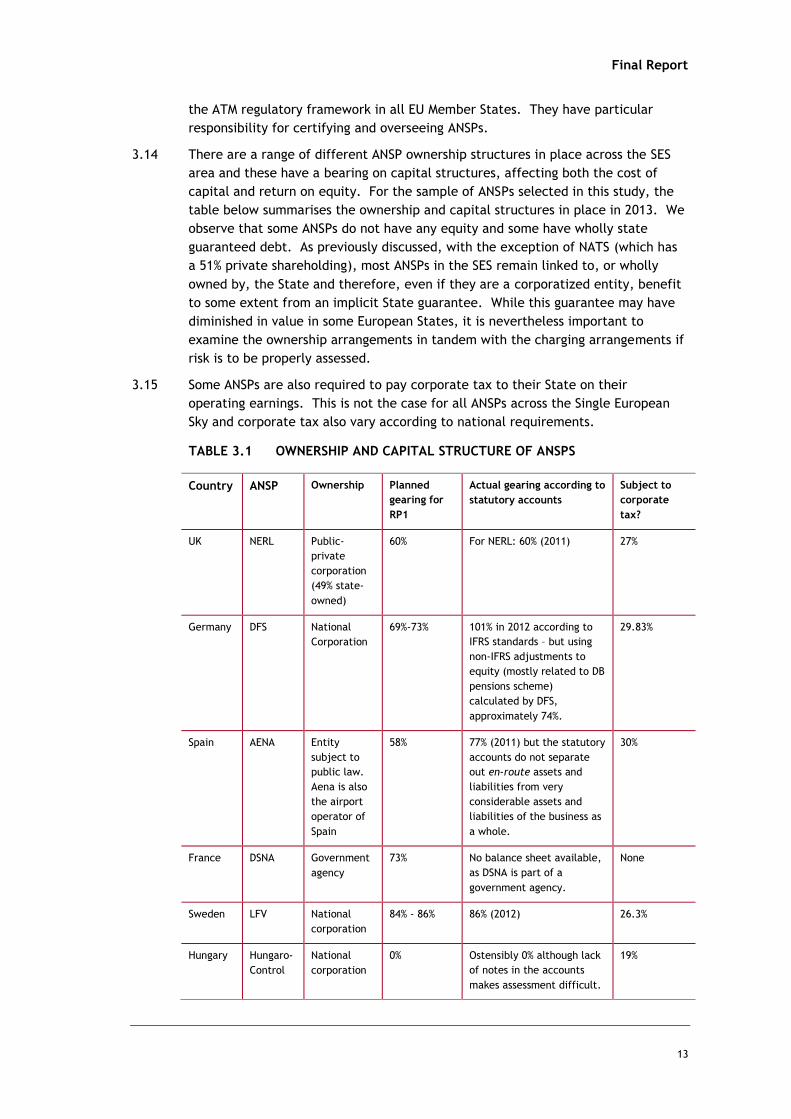
There are a range of different ANSP ownership structures in place across the SES 3.14
area and these have a bearing on capital structures, affecting both the cost of
capital and return on equity. For the sample of ANSPs selected in this study, the
table below summarises the ownership and capital structures in place in 2013. We
observe that some ANSPs do not have any equity and some have wholly state
guaranteed debt. As previously discussed, with the exception of NATS (which has
a 51% private shareholding), most ANSPs in the SES remain linked to, or wholly
owned by, the State and therefore, even if they are a corporatized entity, benefit
to some extent from an implicit State guarantee. While this guarantee may have
diminished in value in some European States, it is nevertheless important to
examine the ownership arrangements in tandem with the charging arrangements if
risk is to be properly assessed.
Some ANSPs are also required to pay corporate tax to their State on their 3.15
operating earnings. This is not the case for all ANSPs across the Single European
Sky and corporate tax also vary according to national requirements.
TABLE 3.1 OWNERSHIP AND CAPITAL STRUCTURE OF ANSPS
Country ANSP Ownership Planned
gearing for
RP1
Actual gearing according to
statutory accounts
Subject to
corporate
tax?
UK NERL Public-
private
corporation
(49% state-
owned)
60% For NERL: 60% (2011) 27%
Germany DFS National
Corporation
69%-73% 101% in 2012 according to
IFRS standards – but using
non-IFRS adjustments to
equity (mostly related to DB
pensions scheme)
calculated by DFS,
approximately 74%.
29.83%
Spain AENA Entity
subject to
public law.
Aena is also
the airport
operator of
Spain
58% 77% (2011) but the statutory
accounts do not separate
out en-route assets and
liabilities from very
considerable assets and
liabilities of the business as
a whole.
30%
France DSNA Government
agency
73% No balance sheet available,
as DSNA is part of a
government agency.
None
Sweden LFV National
corporation
84% - 86% 86% (2012) 26.3%
Hungary Hungaro-
Control
National
corporation
0% Ostensibly 0% although lack
of notes in the accounts
makes assessment difficult.
19%

Final Report
14
Country ANSP Ownership Planned
gearing for
RP1
Actual gearing according to
statutory accounts
Subject to
corporate
tax?
Poland PANSA Government
owned,
contractor
operated
entity
Average of
11.7%
(increases
gradually
from 2012 to
2014)
Gearing in 2011 and 2010
was less than 1%, although
lack of notes in the
accounts means that it is
not possible to calculate
precisely.
19%
Malta MATS Government
owned,
operated by
a contractor
50% - 51% 33% (2010), 66% (2011) 35%
Norway Avinor National
corporation.
Avinor also
operates 46
airports in
Norway
60% For Avinor Group, 31% in
2011. However, the en-
route business is not
separated out in the
statutory accounts.
28%
Latvia LGS National
corporation
Treated as
0% for
purposes of
calculating
WACC
4% (2011), 0% (2010) 15%
Source: Steer Davies Gleave
The values for ‘planned’ gearing in the table above are taken from the ANSPs’ RP1 3.16
Performance Plans and Revised Performance Plans. Where this information was
absent from the plans (i.e. for Sweden, Malta and Latvia), values have been taken
from the PRB Annual Monitoring Report 2012 (Volume 2).
The nature of air navigation service provision
ATM can be defined as the control of all flights in a defined airspace. It includes 3.17
the provision of air navigation services as well as Communication/ Navigation/
Surveillance (CNS), Meteorological (MET) services and Aeronautical Information
Services (AIS) to airspace users. Other activities include airspace management and
air traffic flow and capacity management (ATFCM).
As noted above, States must provide ATM and air navigation services in accordance 3.18
with ICAO requirements, which has important implications for the relationship
between a State and its ANSP. More specifically:
I A State may choose to ensure that ICAO requirements are met by exerting
strong influence or control over an ANSP organisation, for example in terms of
resourcing for operations and funding of investment, including by retaining the
organisation in public ownership and/or providing it with debt or equity finance
on more favourable terms than the market would offer; and
I A State choosing to secure the provision of the relevant services from a
privately owned, commercial organisation, as in the UK, must provide for an
on-going service in the event that the ANSP experiences financially difficulties.
Final Report
15
The monopoly characteristics of air navigation services, highlighted above, are also 3.19
important. In the case of en-route services, there is only one supplier in each
State and the scope for competition between them is particularly limited (with the
exemption of Benelux countries and Germany where there are 2 en-route suppliers
– but not competing). While in principle airspace users are free to choose
alternative routings, in practice the need to minimise flight costs (notably fuel
costs as well as other costs varying by flight time) mean that they will typically
operate the shortest possible route. Terminal and approach services are also
monopolistic in this sense, since there is only one supplier of such services at a
given location at any one time although, as noted above, there has been
competition for the provision of terminal and approach through contract at some
airports in some Member States.
The monopoly characteristics of the industry mean that it is subject to economic 3.20
regulation as defined in Regulation EC 390/2013, in common with a number of
other industries including, inter alia, water and energy utilities,
telecommunications, airports and rail networks. As in the case of other regulatory
frameworks, this is intended to ensure that charges are reflective of efficient costs
and are as close as possible to the charges that would be levied if individual ANSPs
operated in a competitive environment. Note that it is supplementary to other
types of regulation, for example safety and environmental regulation, which are
frequently applied to competitive industries (e.g. the airline industry). In the
remainder of this report, the term ‘regulation’ is generally taken to mean
economic regulation, as defined above. In addition, charges for en-route as well
as terminal and approach services are subject to a harmonised charging scheme
defined in Regulation 391/2013. The billing and collection of charges from air
navigation users is organised by the Central Route Charges Office (CRCO) of
Eurocontrol.
At the same time, air navigation differs significantly from the other industries 3.21
mentioned above in a number of respects. These differences must be taken into
account in any consideration of the efficient costs of air navigation, in particular
the industry’s cost of capital, since they inform an understanding of the various
risk factors affecting ANSPs:
I Air navigation is subject to little or no competition, in contrast to some
(although not all) other regulated industries;
I Air navigation is characterised by a higher proportion of staff costs in its overall
cost base as compared with the other industries included in the comparison,
which tend to be relatively capital intensive and subject to high fixed costs;
I The demand for air navigation is more affected by variations in the economic
climate than some other regulated industries, although the impact of demand
variations on ANSPs is mitigated through regulation as it is in other sectors, in
this case through specific risk sharing arrangements; and
I Air navigation is subject to a specific, international regulatory framework that
requires Member States to provide for the continuity of navigation services,
although other sectors are subject to security of supply provisions in national
legislation.

Final Report
16
The implication of these factors for a comparison of risk between sectors is 3.22
considered further below.
Risk factors affecting revenue and costs of ANSPs
Overview of risk factors
Any entity undertaking economic activity faces uncertainties over revenues and 3.23
costs. Some of these will be internal to the entity (e.g. the efficiency with which
it undertakes certain activities) while others will be external (e.g. changes in the
exchange rate). Risks may also be more or less manageable by the entity
according to the extent to which they can be anticipated, avoided or at least
mitigated by management. In general, internal risks tend to be more manageable,
although external risks can often be mitigated relatively easily (e.g. exchange rate
risks can be reduced through hedging3).
The table below identifies the risks4 relating to variations in ANSP revenues and 3.24
costs and provides some commentary on the factors that influence them.
TABLE 3.2 ANSP REVENUE AND COST RISK
Primary risk Underlying risk Influencing factors
Revenue Demand Can vary with the economic climate as well as changes in air
traveller preferences and extreme climate events (e.g.
volcanic eruptions). In practice, demand risks are mitigated
through the SES Charging Regulation traffic risk sharing
arrangements (see paragraph 3.25).
Unlike in other industries, demand is not affected by
competition as ANSPs are monopoly service providers.
Exchange rate ANSP charges are initially fixed in terms of the domestic
currency and converted to Euros using estimates of monthly
average exchange rates. The resulting exchange rate
variations may have a positive or negative effect on revenue
depending on the direction of movement. This risk is
discussed in more detail in paragraph 3.30
Bad debt ANSPs face some limited risk of non-payment of charges due
to airline failure.
Cost Cost variations Some costs may increase by more than the general rate of
inflation applied in the escalation of charges. For example,
staff costs may be subject to a significant increase as a result
of industrial action. It is therefore possible that increases in
charges do not keep pace with increases in the cost base
Policy and
regulation
In principle, changes to the regulatory framework and
relatively frequent changes to regulated charges can
3 Hedging exchange risk is an investment strategy which consists of minimizing or suppressing foreign exchange risk.
Banking costs may be incurred, but foreign currency hedging is very popular across business of all sizes facing
foreign currency exposure.
4 Financial risks which result purely from the financial structure of an entity and not from the market or the
activities undertaken by that entity are not included in the table.
Final Report
17
Primary risk Underlying risk Influencing factors
introduce both stability and uncertainty. Some uncertainty
can arise in the early stages following the implementation of
a new policy or regulation, for example, when there is no
established track record of regulatory decisions. At the same
time, given ICAO requirements relating to the continuity of
service provision, a State may be obliged to guarantee
support for an ANSP, for example by providing distress
finance or direct grants. The policy framework may
therefore serve to substantially reduce cost-related risk.
Exchange rate Limited exchange rate risk similarly applies in respect of
costs, and it can be mitigated in the same way as for
revenues.
Source: Steer Davies Gleave analysis
ANSP revenue risks
Demand risk
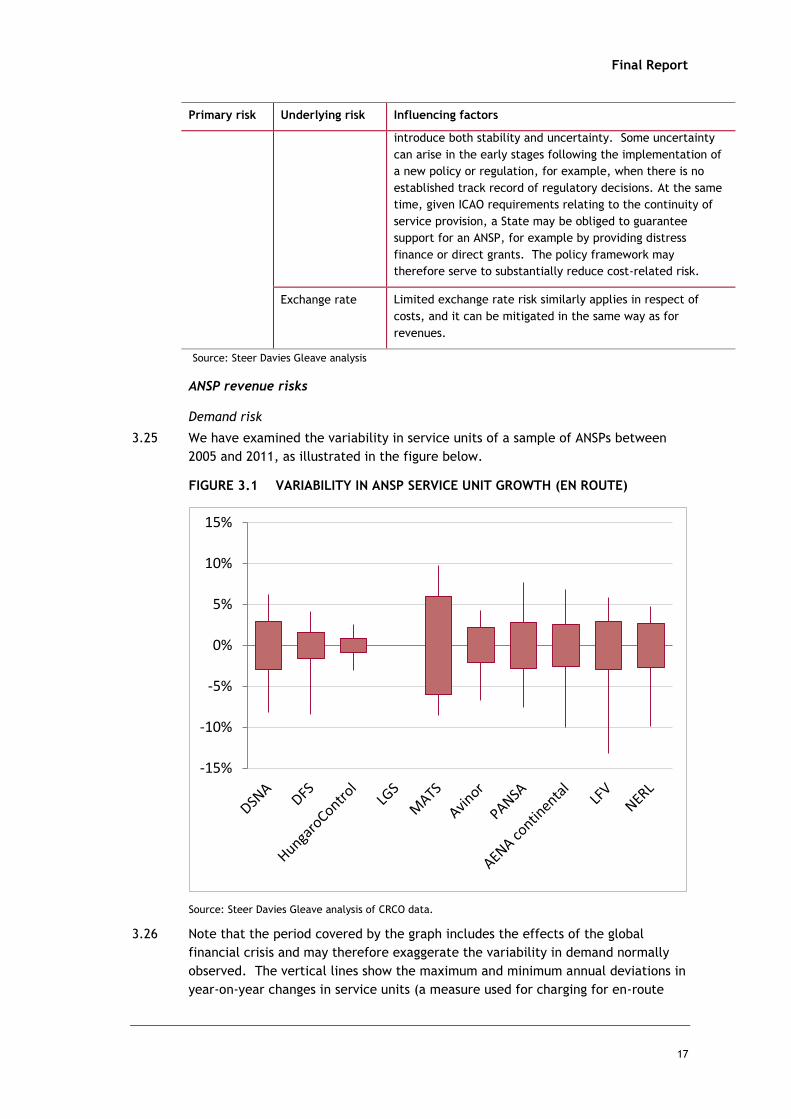
We have examined the variability in service units of a sample of ANSPs between 3.25
2005 and 2011, as illustrated in the figure below.
FIGURE 3.1 VARIABILITY IN ANSP SERVICE UNIT GROWTH (EN ROUTE)
Source: Steer Davies Gleave analysis of CRCO data.
Note that the period covered by the graph includes the effects of the global 3.26
financial crisis and may therefore exaggerate the variability in demand normally
observed. The vertical lines show the maximum and minimum annual deviations in
year-on-year changes in service units (a measure used for charging for en-route
-15%
-10%
-5%
0%
5%
10%
15%
Final Report
18
services which takes a multiplication of a distance and aircraft weight factor) of
each ANSP compared to trend measured by the corresponding Compound Annual
Growth Rate (CAGR) of service units. For example, in the case of DSNA, we
observe that in the 2005-2011 period, the year-on-year change in service units has
moved within a range of + 6.2% and -8.2%. The boxes show the standard deviation
of the annual growth rates from the CAGR.
For most ANSPs, the maximum variation in Service Unit growth is within a range of 3.27
+/- 5% to 10%.
The demand risk indicated by this analysis has been significantly mitigated by the 3.28
risk sharing mechanism introduced through the SES Charging Regulation (Article
13). This mechanism has the following features:
I Service unit differences of less than 2%: ANSPs bear all of the risk and receive
all of the rewards. This 2% zone means small variations in traffic or forecasting
errors do not result in changes in the unit rate.
I Service unit differences of less than 10% but higher than 2%: ANSPs bears
30% of the traffic difference, airspace users bearing the remaining 70%.
I Service unit difference greater than 10%: airspace users bear 100% of the
traffic difference.
This means that the maximum exposure to traffic risk is +/- 4.4% for ANSPs. 3.29
Moreover, we note that union-wide performance targets for RP2 are set on the
basis of the STATFOR low case scenario traffic forecast, further reducing demand
risk. Given this forecast, the traffic risk sharing mechanism of the charging
Regulation is likely to generate some additional revenues for ANSPS.
Exchange rate risk
Route charges are billed in Euros. ANSPs outside the Eurozone therefore face 3.30
some exchange rate risk (positive and negative). On average we have estimated
that there is a delay of around 12 weeks from the date when the exchange rates
are fixed to when the ANSPs receive the payments. .
The table below shows the standard deviation of exchange rate movements over 3.31
12 weeks between 2004 and 2013 for a number of Member states. It indicates that
in 70% of months, currency movements cause a variation in revenue of between
0.1% and 5%, depending on country.
TABLE 3.3 FLUCTUATION OF EXCHANGE RATES OVER 12 WEEKS
Country Standard deviation of 12-week exchange
rate movements
Czech Republic 3.0%
Denmark 0.1%
Hungary 4.5%
Lithuania 0.2%
Latvia 1.0%

Final Report
19
Norway 3.3%
Poland 5.2%
Romania 3.7%
Sweden 3.0%
UK 3.7%
Source: Steer Davies Gleave analysis of exchange rate data (Oanda)
However, while the table indicates significant variability in the case of some 3.32
countries, the associated risk can be substantially mitigated through hedging.
Risk of bad debt
ANSPs might face some risk of non-payment due to airline financial failure. During 3.33
the consultation process, one ANSP indicated that bad debt on average accounted
for 0.5% of its revenues.
The CRCO office of Eurocontrol coordinates the recovery of user charges and 3.34
reports a very high recovery rate of more than 99% of total amounts billed. There
are also a number of additional mechanisms for recovery of charges including
requisition of aircraft meaning that ANSP risk exposure to bad debt is very limited.
ANSP cost risks
Risk of cost variations
Unit rates charged to airspace users are adjusted for the general rate of inflation 3.35
and ANSPs are therefore protected from general, economy-wide cost increases.
However, ANSP’s staff costs may increase such that the resulting rise in its cost
base is not covered by an adjustment in charges reflecting general inflation.
The figure below shows the results of our analysis of the variability of ANSP en-3.36
route service costs. As for our analysis of demand described above, the vertical
lines show the difference between annual growth and the CAGR while the boxes
show the corresponding standard deviation.
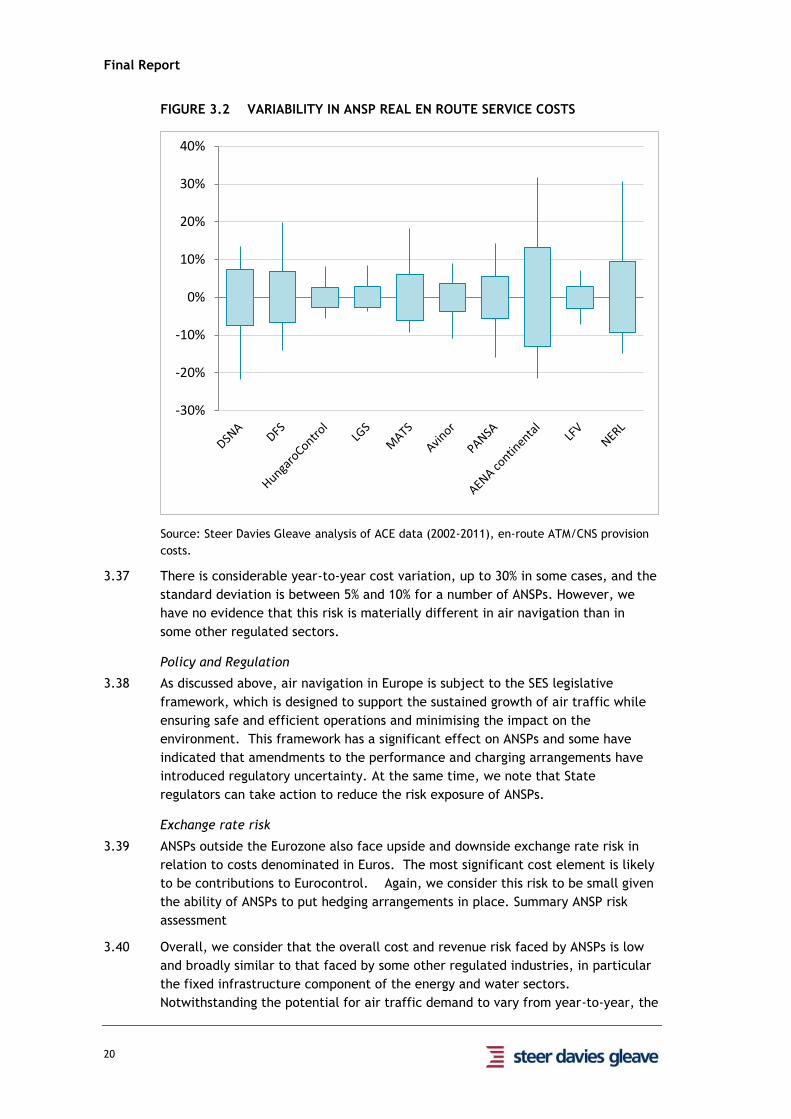
Final Report
20
FIGURE 3.2 VARIABILITY IN ANSP REAL EN ROUTE SERVICE COSTS
Source: Steer Davies Gleave analysis of ACE data (2002-2011), en-route ATM/CNS provision
costs.
There is considerable year-to-year cost variation, up to 30% in some cases, and the 3.37
standard deviation is between 5% and 10% for a number of ANSPs. However, we
have no evidence that this risk is materially different in air navigation than in
some other regulated sectors.
Policy and Regulation
As discussed above, air navigation in Europe is subject to the SES legislative 3.38
framework, which is designed to support the sustained growth of air traffic while
ensuring safe and efficient operations and minimising the impact on the
environment. This framework has a significant effect on ANSPs and some have
indicated that amendments to the performance and charging arrangements have
introduced regulatory uncertainty. At the same time, we note that State
regulators can take action to reduce the risk exposure of ANSPs.
Exchange rate risk
ANSPs outside the Eurozone also face upside and downside exchange rate risk in 3.39
relation to costs denominated in Euros. The most significant cost element is likely
to be contributions to Eurocontrol. Again, we consider this risk to be small given
the ability of ANSPs to put hedging arrangements in place. Summary ANSP risk
assessment
Overall, we consider that the overall cost and revenue risk faced by ANSPs is low 3.40
and broadly similar to that faced by some other regulated industries, in particular
the fixed infrastructure component of the energy and water sectors.
Notwithstanding the potential for air traffic demand to vary from year-to-year, the
-30%
-20%
-10%
0%
10%
20%
30%
40%

Final Report
21
effect of such variation is substantially reduced by the risk sharing arrangements
introduced by the Charging Regulation. This view is confirmed by a recent Moody's
report on DFS and NATS, which concluded that, due to their being national
monopoly providers as well as their ownership structure and strategic importance
from a national security perspective, both ANSPs have a low business risk profile.
Such reports provide a useful independent assessment of the risk faced by ANSPs
and should inform future calculations of the cost of capital.
Final Report
22
4 PART A: Regulatory asset base
In this chapter we introduce the SES regulation and the recommended definition of 4.1
total assets to be applied in the cost of capital calculation. We then go on to
review the accounting valuation techniques used to value fixed assets before
discussing the different approaches applied by the sample of 10 States /ANSPs in
their calculations of the total asset base. Finally, we present stakeholders views
and our findings and recommendations.
Principles as per Single European Sky Regulation
The definition of total assets used when calculating the cost of capital is defined in 4.2
the charging scheme Regulation (EC 390/2013) Article 7 as:
“(a) the sum of the average net book value of fixed assets and possible
adjustments to total assets determined by the national supervisory authority and
used by the air navigation service provider in operation or under construction,
and of the average value of the net current assets, excluding interest bearing
accounts, that are required for the provision of air navigation services”.
Some accounting and regulatory principles
Asset types
Assets are recorded on the balance sheets of companies; they represent what a 4.3
company owns. Section 5 of the CRCO Guidance on route charges defines assets as
“a resource from which future economic benefits over several years are expected
to flow to the air navigation services organisation that owns or controls it”. For
accounting purposes, assets are defined as either current or fixed (i.e. non-
current):
I Current assets are consumed either within a year or in the operating cycle and
include items such as cash, accounts receivable and inventory; and
I Fixed assets are those that are expected to generate value for more than one
year, such as systems and equipment, buildings and land.
Section 4 of the CRCO Guidance on route charges of June 2012 defines net current 4.4
assets as current assets less current liabilities.
Other asset categories may also be recorded such as: 4.5
I Intangible assets, which do not have physical substance but are identifiable and
controlled by the entity through custody or legal rights; and
I Financial investments, which are expected to generate a flow of dividends or
interest over a period of years.
Accounting methods in use to calculate the asset base
Asset values can be heavily influenced by different accounting conventions 4.6
governing the approach to valuing assets - historic cost, current cost (allowing for
price inflation), modified historic cost (allowing for current, or revalued asset
values for some asset categories like land and buildings for example) - and the
Final Report
23
approach to depreciating these assets according to their assumed economic lives.
We briefly describe below the different methods which are in use.
Historic cost
Under historic cost accounting, fixed assets are recorded at their values when 4.7
acquired, less any accumulated depreciation charged to account for their use and
wear and tear, and in accordance with the ANSPs depreciation policy. Liabilities
are recorded at the prices at which they were incurred. Neither assets nor
liabilities are restated for changes in values, and any profit or loss on the disposal
of an asset is only recognised in the year the disposal takes place. Historical cost
does not reflect current market valuation.
Historical cost is criticised for its inaccuracy as it fails to provide a true 4.8
replacement or market value of an asset or liability, meaning that book values may
be calculated using costs that are out of date. However it remains in use in most
accounting systems for fixed assets because of its simplicity and certainty, as it
follows the accounting concepts of prudence, whereby financial statements only
recognise gains when an asset is actually disposed of, and of matching, in so far as
a proportion of the value of an asset is charged to the profit and loss account over
the useful economic life of the asset. In countries subject to high levels of
inflation, depreciation of historic values will also significantly understate
replacement values.
Current cost
Current cost accounting was originally authorized in International Financial 4.9
Reporting Standards (IFRS) in 1989 as an alternative to traditional historical cost
accounting in countries subjected to significant levels of inflation or deflation.
Under current cost accounting, financial statements are prepared to account for
the effects of changing prices. Purchasing power is measured by reference to a
general index of prices, a method which has significant drawbacks in stable
economies since it diverges from the principal of prudence. For this reason
current cost accounting is rarely used in practice.
Modified historical cost
Under the modified historical cost accounting method, fixed assets are re-valued 4.10
at market rate or fair value, with a revaluation reserve being credited with the
accumulated increases or decreases in asset value compared to the historic cost.
This method of accounting allows for assets to be carried at their true market
value within the balance sheet, although the concept of prudence is compromised
in comparison to pure historic cost accounting. Many companies apply revaluation
to only a sub-category of assets whose value is subject to higher volatility such as
land and buildings.
Asset valuation
When assets need to be valued, two methods are generally used: market value and 4.11
fair value.
Market value
International Valuation Standards defines market value as: "the estimated amount 4.12
for which a property should exchange on the date of valuation between a willing
buyer and a willing seller in an arm’s-length transaction after proper marketing

Final Report
24
wherein the parties had each acted knowledgeably, prudently, and without
compulsion". Market value therefore represents the estimated price at which an
asset would trade in a competitive auction setting.
Fair value
Fair value is defined as: “the price that would be received to sell an asset or paid 4.13
to transfer a liability in an orderly transaction between market participants at
the measurement date, other than in a liquidation sale”.
It is important to understand that there is a difference between fair value and 4.14
market value. The term "market value" refers to the price an asset would obtain
were it to be sold. Since assets can fetch different prices if sold in different
locations, an asset can have different market values in different markets.
As an example, if one was to consider the “fair” and “market” value of a 4.15
shareholding, the fair value of the shareholding would be the sum of the
discounted future cash flows, whereas the market value of the shares, which is
still influenced by future cash flows and discount rates would also influenced by
short-term factors such as the immediate demand and supply for that
shareholding.
The use of fair value in financial statements is governed by IFRS 13 (effective from 4.16
1st January 2013), which defines fair value as “the price that would be received to
sell an asset or paid to transfer a liability in an orderly transaction between
market participants at the measurement date”. IFRS requires disclosures about
fair value measurements. IFRS 13 applies when another IFRS requires or permits
fair value measurements or disclosures about fair value measurements.
Measurement of fair value
IFRS 13 provides guidance on the measurement of fair value, including the 4.17
following:
I An entity takes into account the characteristics of the asset or liability being
measured that a market participant would take into account when pricing the
asset or liability at measurement date (e.g. the condition and location of the
asset and any restrictions on the sale and use of the asset);
I Fair value measurement assumes an orderly transaction between market
participants at the measurement date under current market conditions;
I Fair value measurement assumes a transaction taking place in the principal
market for the asset or liability, or in the absence of a principal market, the
most advantageous market for the asset or liability;
I A fair value measurement of a non-financial asset takes into account its highest
and best use;
I A fair value measurement of a financial or non-financial liability or an entity's
own equity instruments assumes it is transferred to a market participant at the
measurement date, without settlement, extinguishment, or cancellation at the
measurement date; and
I The fair value of a liability reflects non-performance risk (the risk the entity
will not fulfill an obligation), including an entity's own credit risk and assuming
the same non-performance risk before and after the transfer of the liability.
Final Report
25
An optional exception applies for certain financial assets and financial liabilities 4.18
with offsetting positions in market risks or counterparty credit risk, provided
certain conditions are met (additional disclosure is required).
Statutory and regulatory accounts
All companies in Europe are required by law to produce financial accounts, which 4.19
are in most cases subject to the independent audit of an accountant. These
accounts are called statutory accounts or financial statements. Companies that
are subject to economic regulation may also be required to produce regulatory
accounts in addition to statutory accounts.
Regulatory accounts are prepared to provide financial information about regulated 4.20
businesses for use by the regulator, the industry, investors, consumers and other
stakeholders. They provide information that is more focused than that contained
in statutory accounts as they relate to regulated businesses or activities, whereas
statutory accounts relate to the company or entity as a whole and are more
focused on the requirements of investors.
Regulatory accounts may assist regulation in a variety of ways, depending on 4.21
market structure and regulatory emphasis, the main ones being:
I Monitoring performance against the assumptions underlying a current price
control;
I Informing future price control reviews;
I Assisting in the detection of certain anti-competitive behaviour such as unfair
cross-subsidisation and undue discrimination at levels of disaggregation
appropriate to the relevant market; and
I Assisting in comparative competition, which is the process of benchmarking a
company’s performance in relation to other companies’ performance.
Regulatory accounts can also be the subject of an audit, performed or not by the 4.22
same company that audited the statutory accounts.
The valuation of the capital base is central to the formulation of price controls. 4.23
For price control purposes most regulators have not relied upon reported asset
valuations, whether based on HCA, MHCA or CCA principles, but instead have used
their own estimates of an appropriate valuation for the capital base, which takes
account of the circumstances of privatisation. This is commonly known as the
regulatory asset base, regulatory capital value or regulatory asset value. Usually
the RAV is based on rolling forward an initial privatisation or market valuation by
adjusting for depreciation, capital investment, disposals and inflation5”.
In our sample, only NATS is subject to economic regulation from its NSA, the UK 4.24
CAA. The method of regulation of NATS is similar to that used to regulate the
three UK regulated airports, with determined costs being built up using a regulated
asset base that increases in value by RPI each year, and involves the application of
a real rather than a nominal cost of capital.
5 http://www.caa.co.uk/docs/5/ergdocs/joint_consultation_paper.pdf

Final Report
26
Valuation method used for assets and in the calculation of the cost of capital
As explained above in the accounting principles section, when the historic cost 4.25
accounting method is used in reports, assets held in the balance sheet should
normally be recorded based on their nominal or original cost when acquired by the
company. This means that accounts should be prepared with nominal historic
values, i.e. values unadjusted for inflation or revaluation. This is what is required
by the charging scheme Regulation (EC 390/2013) Article 7.
Where historic cost assets are presented they should be remunerated using a 4.26
nominal pre-tax cost of capital.
When the current cost accounting method is used, the assets are valued in the 4.27
current cost basis. This means that the assets are recorded at their replacement
cost value in the balance sheet. Where current cost assets are presented they
should be remunerated using a real pre-tax cost of capital.
In many ANSPs some assets have been revalued, using fair value or market 4.28
estimates. For these categories of assets applying a pre-tax nominal cost of
capital would overestimate the required rate of return.
In principle, the fixed assets could be split between historic cost values 4.29
remunerated at pre-tax nominal and the revalued assets at pre-tax real cost of
capital. However, this does not address the additional issue of unreasonable or
unjustified increases in the value of assets. An alternative would be to require and
revalued assets for cost of capital purposed to be indexed to a general price
inflation index only – as is the case with NERL’s regulatory accounts.
Exclusion of interest-bearing assets
The charging scheme Regulation (EC 390/2013) requires interest bearing accounts 4.30
to be excluded from the cost of capital calculation, because they have already
earned a return and should not be compensated in addition by airspace users.
There are a number of assets (or liabilities) that may fall under this definition: 4.31
I Cash and cash equivalents, which in some cases may receive interest in
overnight accounts;
I Bank overdraft and loans;
I Leased assets: the leasing of assets entitles the asset owner to receive payment
from the lessor, meaning that these assets should be excluded too;
I Financial assets at fair value through profit or loss: in this case it would depend
on the type of assets held. If these assets were shares in other companies for
instance, then these would yield dividends rather than interest and would not
be considered as interest-bearing assets;
I Pension assets: in some cases, pensions schemes are invested external in
financial products that provide a return.

Final Report
27
Examination of ANSPs accounting methods and asset values
Accounting methods used by the ANSPs
We have examined the accounting method used by ANSPs in their statutory and 4.32
regulatory (where available) accounts. The table below presents these methods.
TABLE 4.1 ACCOUNTING METHOD IN USE BY ANSP
Country
(ANSP)
Method of accounting
adopted
Reference to market or
fair value
Comments
France
(DSNA)
Unclear – DSNA does not publish financial accounts
- -
Spain (Aena)
Modified historical cost
"Financial assets are initially recognised at the fair value of the consideration given, plus any directly attributable transaction costs”
The revaluation reserve (€273.4m) dates from a 1996 revaluation of the assets and liabilities of AENA
Germany (DFS)
Modified historical cost
Available-for-sale financial assets are measured at fair value and the gains and losses arising from changes in fair value are recognised in equity until the asset is disposed of or it is determined that it has become (permanently) impaired, at which time the cumulative gains or losses previously recognised in equity are recognised in the net profit or loss for the year.
-
UK (NATS)
NATS’ financial accounts are prepared on a historic cost basis. NERL’s RAB is presented on a current cost accounting basis. The two sets of accounts are not reconciled by revaluation in the statutory accounts
No reference to fair value Statutory accounts do not contain any revaluations
Sweden (LFV)
Historical cost No reference to fair value Tangible assets valued at acquisition value with deduction for depreciation
Hungary (Hungaro-Control)
Historical cost
Reference in the accounts only as: "The HUF 116,393 thousand shown under the fair value reserves is the negative fair value of the Company’s cash flow hedging transactions outstanding as at 31 December 2011."
Statutory accounts do not contain any revaluations
Malta Historical cost “Financial assets and -
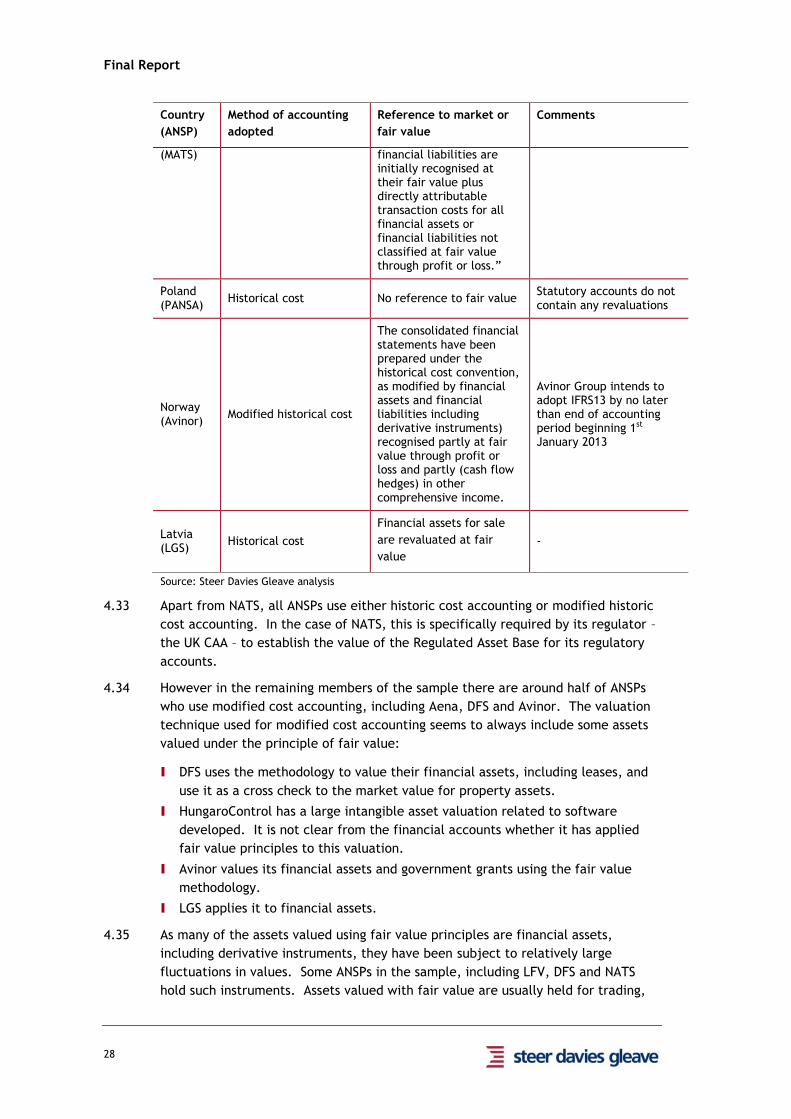
Final Report
28
Country
(ANSP)
Method of accounting
adopted
Reference to market or
fair value
Comments
(MATS) financial liabilities are initially recognised at their fair value plus directly attributable transaction costs for all financial assets or financial liabilities not classified at fair value through profit or loss.”
Poland (PANSA)
Historical cost No reference to fair value Statutory accounts do not contain any revaluations
Norway (Avinor)
Modified historical cost
The consolidated financial statements have been prepared under the historical cost convention, as modified by financial assets and financial liabilities including derivative instruments) recognised partly at fair value through profit or loss and partly (cash flow hedges) in other comprehensive income.
Avinor Group intends to adopt IFRS13 by no later than end of accounting period beginning 1st January 2013
Latvia (LGS)
Historical cost
Financial assets for sale
are revaluated at fair
value
-
Source: Steer Davies Gleave analysis
Apart from NATS, all ANSPs use either historic cost accounting or modified historic 4.33
cost accounting. In the case of NATS, this is specifically required by its regulator –
the UK CAA – to establish the value of the Regulated Asset Base for its regulatory
accounts.
However in the remaining members of the sample there are around half of ANSPs 4.34
who use modified cost accounting, including Aena, DFS and Avinor. The valuation
technique used for modified cost accounting seems to always include some assets
valued under the principle of fair value:
I DFS uses the methodology to value their financial assets, including leases, and
use it as a cross check to the market value for property assets.
I HungaroControl has a large intangible asset valuation related to software
developed. It is not clear from the financial accounts whether it has applied
fair value principles to this valuation.
I Avinor values its financial assets and government grants using the fair value
methodology.
I LGS applies it to financial assets.
As many of the assets valued using fair value principles are financial assets, 4.35
including derivative instruments, they have been subject to relatively large
fluctuations in values. Some ANSPs in the sample, including LFV, DFS and NATS
hold such instruments. Assets valued with fair value are usually held for trading,

Final Report
29
and there is a case for excluding them from any asset definition used for return on
capital employed. Moreover, if leases are included in the fair value valuation,
these should be excluded from the asset base for the cost of capital as they are
remunerated through financial payments.
Based on the information available, it is unclear whether assets valued through fair 4.36
value methods have been excluded by States for the purpose of total assets
applied to their cost of capital.
Separation of activities and cost allocation
ANSPs are required to separate their activities in the Performance Plans in order to 4.37
report specifically en-route and terminal ANS values. These plans are reviewed
and approved by the National Supervisory Authority (NSA).
We present below the level of disaggregation of activities underpinning each 4.38
ASNP’s accounts.
TABLE 4.2 SEPARATION OF ACTIVITIES
Country Separation of business activities
France (DSNA) N/A
Spain (Aena)
Separation of en-route, terminal and other services in the
accounts submitted for certification purposes to the NSA but
not in the statutory accounts
Germany (DFS)
Separation of en-route, terminal and other services in the
accounts submitted for certification purposes to the NSA but
not in the statutory accounts
UK (NATS)
Separate statutory accounts exist for the en-route business
(NERL). The regulatory accounts also describe NERL as opposed
to NATS. The regulatory accounts use a distinct accounting
policy and include regulatory adjustments that cannot be found
in the statutory accounts.
Sweden (LFV) Only in the internal accounts
Hungary
(Hungaro-
Control)
Only in the internal accounts
Malta (MATS)
En-route, terminal and other services are separated in the
statutory accounts, but not the regulatory accounts submitted
for certification by the NSA
Poland (PANSA)
En-route business is separated in the statutory accounts, but
PANSA’s submission to ACE also states in contradictory terms
that the costs of en-route provision are not separated from the
costs of other services. The accounts submitted to the NSA for
certification show complete separation
Norway (Avinor) Only in the regulatory accounts submitted to the NSA for
certification – not the statutory accounts.
Latvia (LGS) Answers to the ACE 2012 questionnaire are not consistent, but
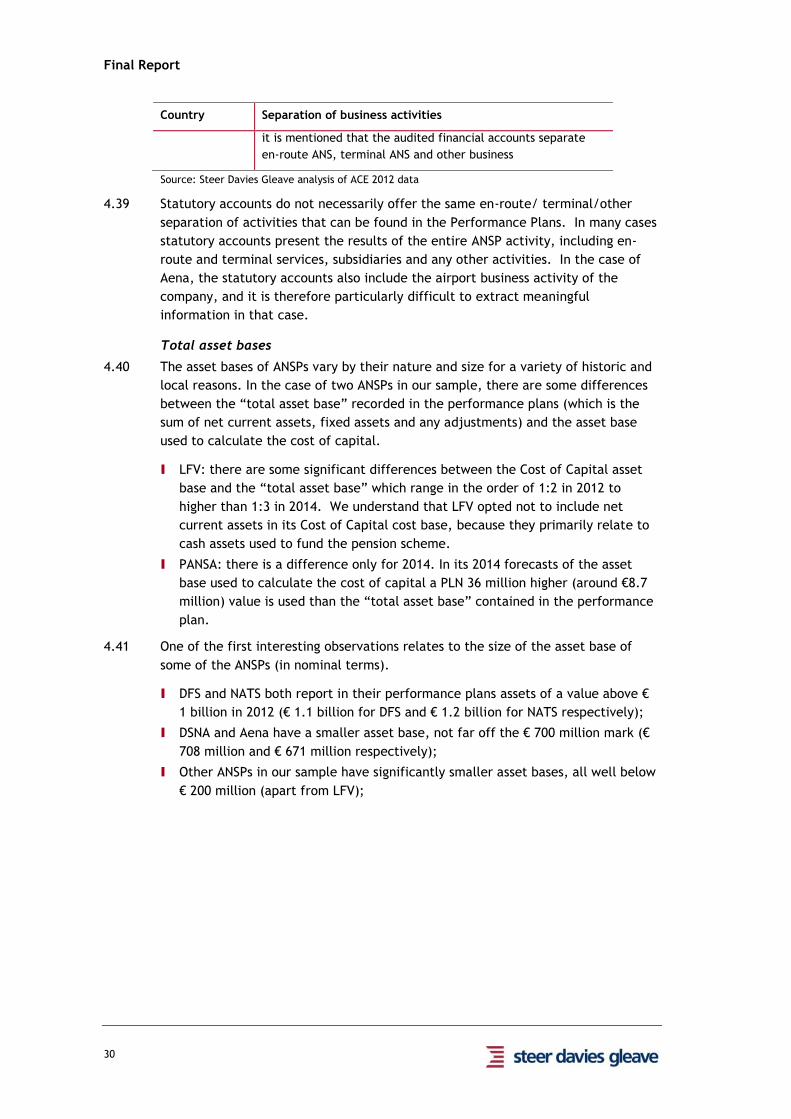
Final Report
30
Country Separation of business activities
it is mentioned that the audited financial accounts separate
en-route ANS, terminal ANS and other business
Source: Steer Davies Gleave analysis of ACE 2012 data
Statutory accounts do not necessarily offer the same en-route/ terminal/other 4.39
separation of activities that can be found in the Performance Plans. In many cases
statutory accounts present the results of the entire ANSP activity, including en-
route and terminal services, subsidiaries and any other activities. In the case of
Aena, the statutory accounts also include the airport business activity of the
company, and it is therefore particularly difficult to extract meaningful
information in that case.
Total asset bases
The asset bases of ANSPs vary by their nature and size for a variety of historic and 4.40
local reasons. In the case of two ANSPs in our sample, there are some differences
between the “total asset base” recorded in the performance plans (which is the
sum of net current assets, fixed assets and any adjustments) and the asset base
used to calculate the cost of capital.
I LFV: there are some significant differences between the Cost of Capital asset
base and the “total asset base” which range in the order of 1:2 in 2012 to
higher than 1:3 in 2014. We understand that LFV opted not to include net
current assets in its Cost of Capital cost base, because they primarily relate to
cash assets used to fund the pension scheme.
I PANSA: there is a difference only for 2014. In its 2014 forecasts of the asset
base used to calculate the cost of capital a PLN 36 million higher (around €8.7
million) value is used than the “total asset base” contained in the performance
plan.
One of the first interesting observations relates to the size of the asset base of 4.41
some of the ANSPs (in nominal terms).
I DFS and NATS both report in their performance plans assets of a value above €
1 billion in 2012 (€ 1.1 billion for DFS and € 1.2 billion for NATS respectively);
I DSNA and Aena have a smaller asset base, not far off the € 700 million mark (€
708 million and € 671 million respectively);
I Other ANSPs in our sample have significantly smaller asset bases, all well below
€ 200 million (apart from LFV);

Final Report
31
FIGURE 4.1 TOTAL ASSET BASE BY CATEGORY (2012)
Source: Steer Davies Gleave analysis. Note that all cost bases have been converted in euro based on the
2012 euro/local currency exchange rate. Nominal terms
Growth assumptions of the asset bases vary between ANSPs, with the providers 4.42
with the largest asset base generally showing less inflation in asset value growth
than the smaller ones.
-200
-
200
400
600
800
1,000
1,200
1,400
DSNA Aena(continental)
DFS NERL LFV
€m
illio
n
Net book value of fixed assets Adjustments Net current assets
-40
-
40
80
120
160
200
€m
illio
n
Net book value of fixed assets Adjustments Net current assets

Final Report
32
FIGURE 4.2 GROWTH OF TOTAL ASSET BASE (2012-2014 CAGR)
Source: Steer Davies Gleave analysis of revised performance plans. Nominal terms.
The size of the asset base should of course take into consideration the traffic 4.43
handled by ANSPs or the nature of this traffic. If this is compared to forecast
service units, we observe significant differences in asset bases among the four
largest ANSPs, as illustrated below.
FIGURE 4.3 AVERAGE TOTAL ASSET BASE PER SERVICE UNIT (2012)
Source: Steer Davies Gleave analysis of revised performance plans. Note that all cost bases have been
converted in euro based on the 2012 euro/local currency exchange rate. Nominal terms.
We observe that there are some significant differences in asset bases among the 4.44
four largest ANSPs. The difference in average size between DSNA and NERL, for
instance, is of the order of 1:3. However, without a proper disclosure of how
assets are allocated to en-route versus terminal or other subsidiaries, it is difficult
to reach any meaningful conclusions. Nevertheless, the comparison shows that it
0
20
40
60
80
100
120
140
160
Ave
rage
ass
et
bas
e (€
) p
er
serv
ice
un
it
CoC claim asset base Total asset base
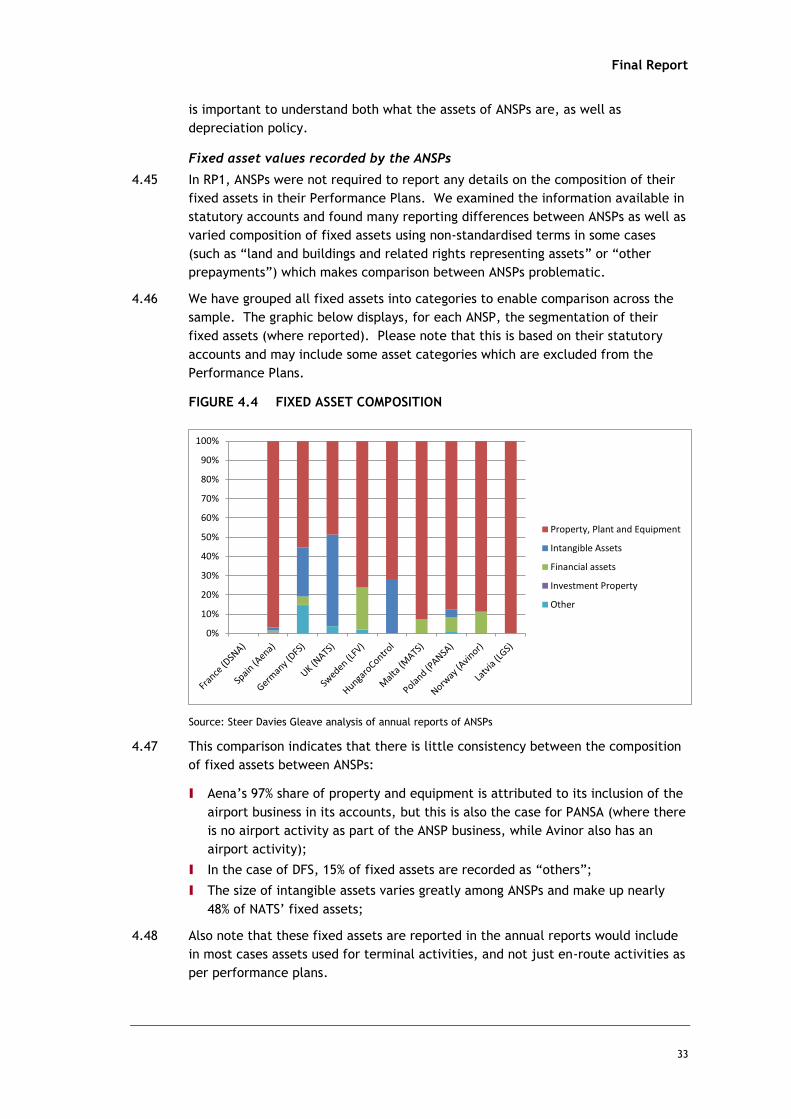
Final Report
33
is important to understand both what the assets of ANSPs are, as well as
depreciation policy.
Fixed asset values recorded by the ANSPs
In RP1, ANSPs were not required to report any details on the composition of their 4.45
fixed assets in their Performance Plans. We examined the information available in
statutory accounts and found many reporting differences between ANSPs as well as
varied composition of fixed assets using non-standardised terms in some cases
(such as “land and buildings and related rights representing assets” or “other
prepayments”) which makes comparison between ANSPs problematic.
We have grouped all fixed assets into categories to enable comparison across the 4.46
sample. The graphic below displays, for each ANSP, the segmentation of their
fixed assets (where reported). Please note that this is based on their statutory
accounts and may include some asset categories which are excluded from the
Performance Plans.
FIGURE 4.4 FIXED ASSET COMPOSITION
Source: Steer Davies Gleave analysis of annual reports of ANSPs
This comparison indicates that there is little consistency between the composition 4.47
of fixed assets between ANSPs:
I Aena’s 97% share of property and equipment is attributed to its inclusion of the
airport business in its accounts, but this is also the case for PANSA (where there
is no airport activity as part of the ANSP business, while Avinor also has an
airport activity);
I In the case of DFS, 15% of fixed assets are recorded as “others”;
I The size of intangible assets varies greatly among ANSPs and make up nearly
48% of NATS’ fixed assets;
Also note that these fixed assets are reported in the annual reports would include 4.48
in most cases assets used for terminal activities, and not just en-route activities as
per performance plans.
0%
10%
20%
30%
40%
50%
60%
70%
80%
90%
100%
Property, Plant and Equipment
Intangible Assets
Financial assets
Investment Property
Other
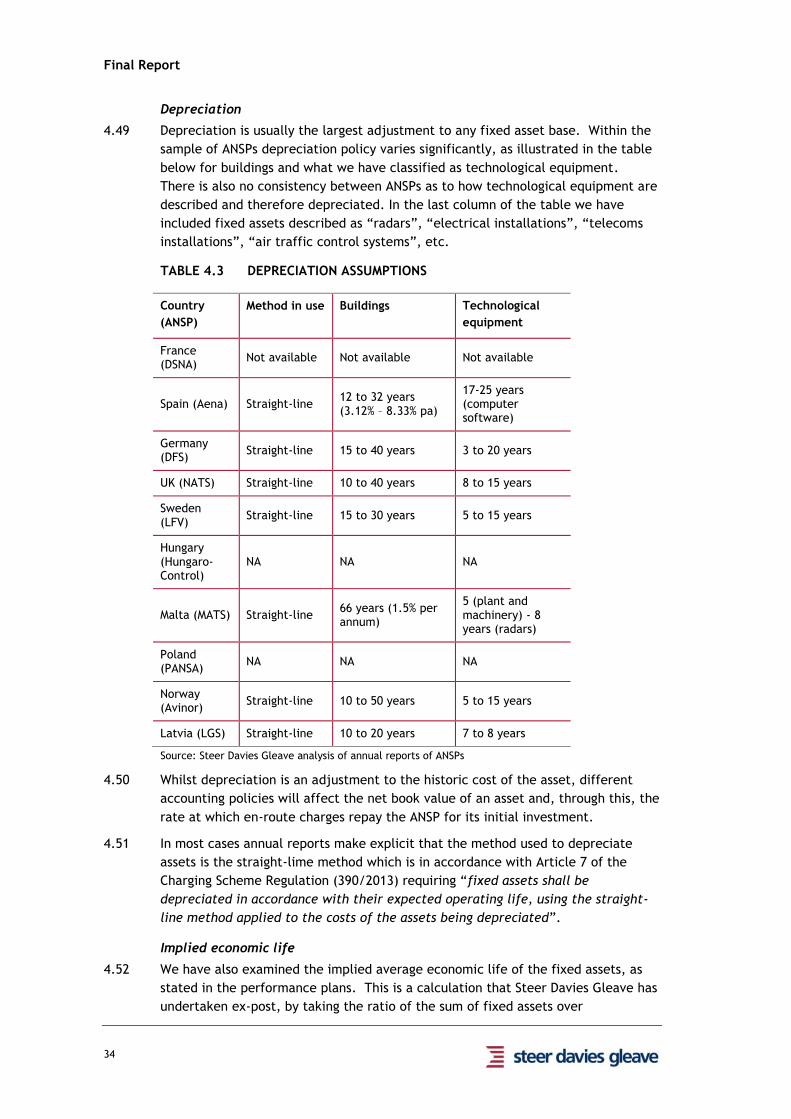
Final Report
34
Depreciation
Depreciation is usually the largest adjustment to any fixed asset base. Within the 4.49
sample of ANSPs depreciation policy varies significantly, as illustrated in the table
below for buildings and what we have classified as technological equipment.
There is also no consistency between ANSPs as to how technological equipment are
described and therefore depreciated. In the last column of the table we have
included fixed assets described as “radars”, “electrical installations”, “telecoms
installations”, “air traffic control systems”, etc.
TABLE 4.3 DEPRECIATION ASSUMPTIONS
Country
(ANSP)
Method in use Buildings Technological
equipment
France (DSNA)
Not available Not available Not available
Spain (Aena) Straight-line 12 to 32 years (3.12% – 8.33% pa)
17-25 years (computer software)
Germany (DFS)
Straight-line 15 to 40 years 3 to 20 years
UK (NATS) Straight-line 10 to 40 years 8 to 15 years
Sweden (LFV)
Straight-line 15 to 30 years 5 to 15 years
Hungary (Hungaro-Control)
NA NA NA
Malta (MATS) Straight-line 66 years (1.5% per annum)
5 (plant and machinery) - 8 years (radars)
Poland (PANSA)
NA NA NA
Norway (Avinor)
Straight-line 10 to 50 years 5 to 15 years
Latvia (LGS) Straight-line 10 to 20 years 7 to 8 years
Source: Steer Davies Gleave analysis of annual reports of ANSPs
Whilst depreciation is an adjustment to the historic cost of the asset, different 4.50
accounting policies will affect the net book value of an asset and, through this, the
rate at which en-route charges repay the ANSP for its initial investment.
In most cases annual reports make explicit that the method used to depreciate 4.51
assets is the straight-lime method which is in accordance with Article 7 of the
Charging Scheme Regulation (390/2013) requiring “fixed assets shall be
depreciated in accordance with their expected operating life, using the straight-
line method applied to the costs of the assets being depreciated”.
Implied economic life
We have also examined the implied average economic life of the fixed assets, as 4.52
stated in the performance plans. This is a calculation that Steer Davies Gleave has
undertaken ex-post, by taking the ratio of the sum of fixed assets over

Final Report
35
depreciation charges without any other adjustments. Whilst we recognise that this
is a crude estimate, it nonetheless presents some interesting findings, as shown in
the figure below.
FIGURE 4.5 AVERAGE IMPLIED ECONOMIC LIFE OF FIXED ASSETS
Source: Steer Davies Gleave analysis of 2012-2014 performance plans calculated as net book value of
fixed assets over depreciation charge, nominal terms.
We observe that ANSPs appear to fall into three broad groups: some ANSPs (LGS, 4.53
DSNA) have assets with a short economic life of around 4 years, whilst others have
assets with a significantly longer average life, between 9 and 12 years (PANSA and
Avinor). However, most ANSPs seem to expect their assets to have lives of
between 6 to 8 years.
Note that NERL provided some useful commentary on asset life, stating that “for 4.54
assets existing at privatisation it had assumed 20 years, 12 years if the assets had
been pre-CP3 and 15 years afterwards”.
The analysis indicated that applying standardised depreciation lives across 4.55
European ANSPs would have a material impact on asset values.
Net current assets recorded by the ANSPs
In RP1, ANSPs were not required to report any details on the composition of their 4.56
net current assets in their Performance Plans. This of course is scrutinised by their
respective NSAs provided they are able to do so. We examined the information
available in statutory accounts and identified many differences between ANSPs as
well as varied composition of net current assets. With more than 35 asset
categories among all ANSPs, some statutory accounts provide a lot of detail, whilst
others are very limited in content.
However, it remains in many cases difficult to understand if interest-bearing assets 4.57
or liabilities may have been included in these numbers.
- 2 4 6 8 10 12 14
DSNA
Aena
DFS
NERL
LFV
Hungaro-Control
MATS
PANSA
Avinor
LGS
Years
2012
2013
2014
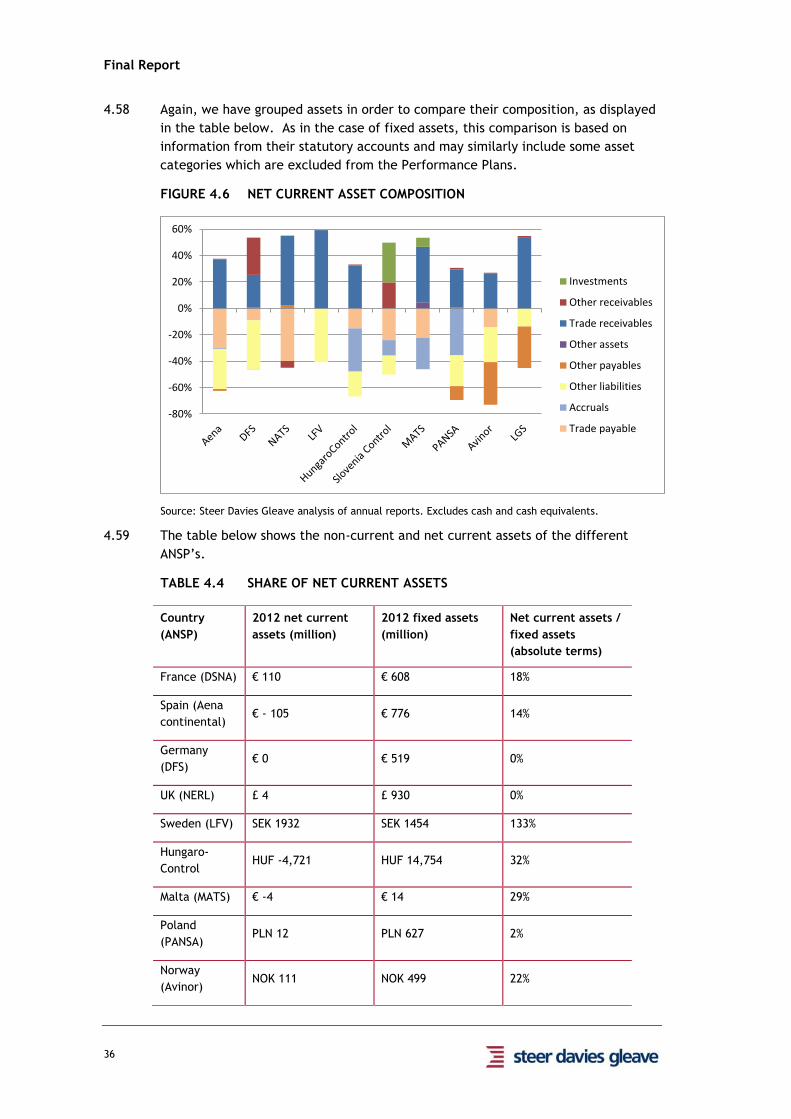
Final Report
36
Again, we have grouped assets in order to compare their composition, as displayed 4.58
in the table below. As in the case of fixed assets, this comparison is based on
information from their statutory accounts and may similarly include some asset
categories which are excluded from the Performance Plans.
FIGURE 4.6 NET CURRENT ASSET COMPOSITION
Source: Steer Davies Gleave analysis of annual reports. Excludes cash and cash equivalents.
The table below shows the non-current and net current assets of the different 4.59
ANSP’s.
TABLE 4.4 SHARE OF NET CURRENT ASSETS
Country
(ANSP)
2012 net current
assets (million)
2012 fixed assets
(million)
Net current assets /
fixed assets
(absolute terms)
France (DSNA) € 110 € 608 18%
Spain (Aena
continental) € - 105 € 776 14%
Germany
(DFS) € 0 € 519 0%
UK (NERL) £ 4 £ 930 0%
Sweden (LFV) SEK 1932 SEK 1454 133%
Hungaro-
Control HUF -4,721 HUF 14,754 32%
Malta (MATS) € -4 € 14 29%
Poland
(PANSA) PLN 12 PLN 627 2%
Norway
(Avinor) NOK 111 NOK 499 22%
-80%
-60%
-40%
-20%
0%
20%
40%
60%
Investments
Other receivables
Trade receivables
Other assets
Other payables
Other liabilities
Accruals
Trade payable
Final Report
37
Country
(ANSP)
2012 net current
assets (million)
2012 fixed assets
(million)
Net current assets /
fixed assets
(absolute terms)
Latvia (LGS) LVL 2 LVL 13 13%
Source: Steer Davies Gleave analysis of values reported in performance plans
The PRB made the following comment with regards to DFS: “The PRB notes that 4.60
45% of the asset base used by DFS to compute the cost of capital relate to current
assets. The PRB understands that these current assets comprise an amount
relating to the implementation of IFRS in 2007 (i.e. mainly reflecting a change in
the treatment of provisions for pensions and similar obligations). As the costs of
the transition to IFRS are already accounted for in the determined costs (as part
of exceptional costs), it is important to ensure that no cost of capital is computed
on the current assets relating to the implementation of IFRS. The PRB considers
that this point deserves a clarification”.
In addition, a number of ANSPs have other subsidiary companies that offer other 4.61
additional services. We suggest that the value of these investments and the value
of the net assets used to provide these additional services are not included in the
assets used in the performance plans to evaluate the cost of capital.
A number of ANSP’s also hold securities for investment purposes and these should 4.62
also be removed from the asset base as they are held in order to earn a return and
are not related to providing air navigation services.
Asset adjustments
The table below shows the net asset adjustments made in the national 4.63
performance plans. These adjustments are made with the agreement of the
respective NSA.
TABLE 4.5 ASSET ADJUSTMENTS
Country
(ANSP)
Value of adjustments Comments on the adjustments
2012 2013 2014
France
(DSNA) €(11.1)m
€(11.9)m
€(12.7)m
The asset base is adjusted to account for a specific treatment of the air navigation assets that were bought from Aéroports de Paris (ADP) in 2006. For consistency, the Net Book Value (NBV) of the assets bought from ADP has therefore to be retreated, as if the lifetime of all the assets bought through the loan had the length of the loan as their lifetime.
Spain
(Aena) No adjustments made in NPP for RP1
Aena comments “due to the process of adaption to the IAS, the recognition of the global amounts related to the pending adjustment mechanisms as contingent assets and its disappearance from the Balance sheet implied that no cost of capital has been applied to those amounts”.
Germany
(DFS) €607m €542m €480m
The nature of these adjustments does not seem to be explained in the national performance plan. PRB note in their assessment that ‘45% of the asset base used by DFS to compute the cost of capital relate to current assets’. The adjustments here are slightly more than 45%, so the adjustments and the current assets do not seem to be equivalent.

Final Report
38
UK (NATS) £58.7m £48.7m £45.5m
NERL’s asset base is prepared on a regulatory building-block basis. The components of NERL’s RAB include (1) fixed assets (approximately 90% of the RAB), (2) working capital movement, (3) a Rolling Incentive Mechanism, (4) a pensions pass-through asset, (5) capitalised finance costs.
Sweden
(LFV) SEK 375m
SEK
268m
SEK
158m
The NPP does not seem to offer any commentary on what
these adjustments might be
Hungary
(Hungaro-
Control)
HUF (708)m
HUF (579)m
HUF (504)m
The only adjustment done to the cost base is due to the EU funds received for the construction of some assets. Due to the adjustment, only the net value is taken into account.
Malta
(MATS) € 0m over RP1 No adjustments made
Poland
(PANSA) PLN 0m PLN 0m PLN 0m No adjustments made
Norway
(Avinor) NOK 0m
NOK
0m
NOK
0m No adjustments made
Latvia
(LGS) LVL 0m over RP1 No adjustments made
Source: Steer Davies Gleave analysis
We observe that some ANSPs have made positive adjustments (added asset value 4.64
to their total asset base), whilst some ANSPs have reduced their total asset base.
I All four largest ANSPs have made adjustments, whereas of the remaining 6
smaller ANSPs a smaller proportion have done so.
I The reasons stated (or found) for adjustments vary and there is no unique
reason across the sample.
I In some cases we were unable to find a reason for the adjustments being made.
This would have allowed us to understand what adjustments had been made.
The relative size of the adjustments also varies significantly within the sample as 4.65
illustrated in the table below. DFS adjustments are very large whilst for most
other ANSPs they remain small. LFV adjustments appear to have reduced over
time.
TABLE 4.6 ADJUSTMENTS COMPARED TO COC ASSET BASE
2012 2013 2014
France (DSNA) -1.6% -1.6% -1.6%
Germany (DFS) 53.9% 50.6% 47.0%
UK (NATS) 5.9% 4.8% 4.5%
Sweden (LFV) 20.5% 16.1% 10.7%
HungaroControl -7.6% -4.5% -3.4%
Source: Steer Davies Gleave analysis based on data from the national performance plans, nominal
terms.

Final Report
39
The views of the stakeholders on assets reporting and composition
The views of the ANSPs diverged when asked if only one valuation method should 4.66
be recommended for the assets. DFS and MATS thought that there should be a
limited number of approaches allowed in order to cater for particular
circumstances prevailing in different ANSPs. NERL agreed with this view too as it
wished to retain its specific approach (RAB-based approach). PANSA did not
comment whilst HungaroControl stated that in principle one approach (historic
cost based approach) should be preferable. However, it also recognised that there
might be cases where the historic cost accounting method would not be reliable,
or not proper, and where therefore where market valuations shall be used. It
thought that these cases where divergence from historic cost accounting is allowed
should be listed or at the very least the principles should be clarified. LFV also
said that historic cost value should be preferred.
HungaroControl explained that it applied a linear – “straight line” depreciation 4.67
policy. This method is also used by MATS, Avinor, PANSA and LFV (according to
their respective NSAs) and NERL. Other ANSPs did not make this explicit.
Depreciation rates used varied. NERL depreciates pre-existing assets over 20 years 4.68
from the Public Private Partnership and subsequent additions are depreciated over
15 or 12 years. The Polish NSA also clarified that PANSA depreciation rates are in
line with the Eurocontrol principles (from 40 years to 7 years). LFV rates ranged
from 3 to 30 years. MATS summarised that “depreciation commences when the
depreciable assets are available for use and is charged to P&L so as to write off
the cost of the assets less any estimated residual value, over their estimated
useful lives”.
Some ANSPs provided clarity as to how the asset base was derived for the cost of 4.69
capital calculation. HungaroControl for instance explained that it ensured that
interest-bearing assets were removed as well as assets owned by the State but
used by the ANSP (for which a fee is paid). NERL detailed that the cost of capital
is applied to NERL's Regulatory Asset Base (RAB) to derive a regulatory return
which forms part of the building blocks of Determined Costs. NERL clarified that
for the purpose of economic regulation, the RAB includes working capital which
represents trade and other receivables, trade and other payables and provisions.
However the RAB working capital does not include financing balances (cash and
short term investments, derivative financial instruments, interest receivable or
payable) and corporate tax liabilities.
MATS explained that all current assets (except for interest bearing accounts) less 4.70
current liabilities are taken into account in the net current assets. Avinor ANS
does not have its own balance sheet as of today. However net current assets are
included in the asset base used for calculating the cost of capital, based on a pro
forma balance sheet.
CANSO commented that calculation of assets employed and of cost of capital 4.71
should be based on generally accepted accounting principles, but ‘there is no and
there should be no common way’ of calculating cost of capital. CANSO was
generally in favour of states retaining discretion in the way they formulate their
accounts for charging purposes, for example in the way depreciate their assets or
allocate assets to terminal versus en-route. CANSO was concerned about the
Final Report
40
possibility of harmonization of accounting policies leading to additional
bookkeeping costs for ANSPs or restricting their options for financial policy.
NSAs
Four NSAs (from Norway, Poland, Sweden and the UK) provided their views on 4.72
assets. The Swedish NSA thought that any guidance provided to ANSPs regarding
their valuation of assets should follow standard accounting procedures, whilst the
UK NSA was keen that the guidance enables the RAB and real WACC approach to be
continued as it thought it had “proved robust over a long period of time, and has
enabled NERL to make significant investment in capital expenditure programmes
and raise and retain debt and equity”.
The UK NSA also thought that changing valuation methodology for assets after the 4.73
investments had occurred would not be a wise move as it would undermine
confidence in the regime, and put future investments at risk particularly for
finance provided by the markets.
The Polish NSA thought that due to differences in legal status of ANSPs in Europe 4.74
that may influence the accounting principles applied, it seems reasonable that a
limited number of approaches for the valuation of assets should be available.
The Norwegian NSA did not comment further on Avinor’s view that when it comes 4.75
to valuation of assets it is important to have transparency of approach and
parameters used.
Airspace users
AEA, IATA, ELFAA and EBAA provided the same response. They thought that assets 4.76
should be valued at historic cost, because “historic cost value represents the
actual amount that ANSPs paid when investing in those assets”. They also thought
that asset revaluation should not be allowed for price setting purposes. This view
was supported by IACA who declared that “acquisition costs should be taken into
account as no risks will be borne by ANSPs on the value of these assets”.
However AEA, IATA, ELFAA and EBAA also acknowledged that current cost 4.77
accounting is allowed by the Charging Regulation. Their view is where assets have
been subject to revaluations (“one offs” or “automatic inflation adjustments”),
only a “real” (i.e. excluding inflation) cost of capital should be allowed.
AEA, IATA, ELFAA and EBAA also thought that the asset base should only include 4.78
what they qualified as “efficient” historic costs and that costs from capital
expenditure delivered over budget should not be allowed in the asset base.
Others
Other stakeholders did not comment much on assets. ETF thought that the 4.79
meaning of the “employed capital” would need to be more precisely specified.
This stakeholder also thought that in order to be “fairer with users” the cost of
capital should be based on “real values” but did not explain what they meant.
ATCEUC only commented that IFRS and GAAP provisions should be applied but did
not offer more detailed considerations.
Final Report
41
Conclusion on asset reporting and composition
Overview of key findings regarding asset reporting and composition
I Under the current reporting arrangements, it is very difficult to understand the
rationale behind the value of the assets used by States/ ANSPs for their cost of
capital calculation, and to reconcile with statutory/ independently audited
accounts.
I The reasons for asset adjustment in the performance plans, whilst being
allowed if agreed by the National Supervisory Authority, are not always
disclosed.
I Some ANSPs take the view that there is no difference between the value of
assets used for the calculation of the cost of capital being estimated on the
asset side of the balance sheet or on the liability side. We would prefer assets
to be consistently estimated according to the asset side of the balance sheet,
using the CRCO guidance.
I There is little clarity in the performance plans as to any revaluation or
adjustment of assets or liabilities that should be disclosed as per requirements
of IFRS 13.
I Interest-bearing assets appear to have been removed from assets used for the
calculation of the cost of capital as per EC Regulation 390/2013. However,
there are other assets including cash, leased assets and pension assets which
receive a return from other sources: our assessment is that these assets should
not be included in the cost of capital calculation as returns would be double
counted if a cost of capital was allowed on top of return on this asset.
I There should be consistency between the way assets are accounted for and the
application method (real or nominal) used in the cost of capital calculations.
For example, where ANSPs revalue assets on an annual basis the real cost of
capital should be applied. Where ANSPs use historic cost accounting they
should apply the nominal cost of capital. However, in most cases ANSPs apply
the modified historic cost accounting method, with some assets been
revaluated. The current method of applying the nominal cost of capital to
these assets overvalues the return allowed.
Recommendations
With regards to assets, Steer Davies Gleave’s recommendations are built around 4.80
the following principles :
I Improved transparency of asset reporting should be mandated:
The asset value proposed for the Cost of Capital should be reconciled to
published/ audited accounts with explanations, to enable verification.
Where the published accounts include other businesses a clear explanation
of the method for allocating the assets applied to the cost of capital should
be provided.
The accounting method used for the valuation of the assets used in the
calculation of the cost of capital should be clarified so that it is clear that
airspace users only pay the cost of purchase and not any asset revaluation.
The use of fair or market value should also be specifically disclosed for
assets where it is used.
Final Report
42
More clarity should be provided as to the requirements of IFRS 13 so that any
revaluation or adjustment to the value of an asset or a liability is more fully
disclosed. A description of the key assets included in the total asset value
for cost of capital purposes should be provided. This should include the
main categories of fixed assets by asset category (land, buildings, plant and
machinery, etc). For net current assets, a full breakdown should be
provided and evidence that these assets are not attracting a return from
other sources should be provided.
The value of assets used in the calculation of the cost of capital should be
reported based on the asset side of the balance sheet, not the liability side.
A standardized break-down of categories of fixed and net current assets
should be added to the reporting tables for charging purposes. This could be
based for a start on Eurocontrol’s Specification for Information Disclosure,
section B which requires a break-down of assets and liabilities in operation
and in construction at year-end. This would need to be expanded further in
order to provide enhanced clarity as detailed in this document.
I Assets which receive a return from another source should be excluded from
the asset base to receive a cost of capital:
In addition to interest bearing assets, there are other assets which should be
excluded from the asset base for the calculation of the cost of capital as
they will be earning a return from another source, such as:
Cash: which can earn interest in overnight bank accounts;
Pension assets: where assets are managed and invested in an external fund
and earn an investment return through this process;
Financial and lease assets: which receive a return through the financial
investment.
These refinements should be included in the revision of CRCO guidance.
I A movement to greater standardisation of depreciation policy should be
encouraged:
The depreciation policy and amortisation life of the assets used in the
calculation of the asset base applied to the cost of capital should be made
clear for each type of asset, with a standardised reporting vocabulary.
ANSPs should be encouraged to move towards the application of standard
depreciation lives for categories of assets which would allow greater
comparability across the SES States.
For the predicted value of assets used in the cost of capital calculation a full
explanation of the capital expenditure forecast by category and change in
current assets by category should be provided.
I Consistency of the approach to asset valuation and cost of capital
There should be consistency between the asset valuation method applied
and application of nominal/real cost of capital, so that where assets are
revalued they are not included twice in the costs paid by airspace users.
Where assets are valued at historic cost and represent the actual amount
that ANSPs paid when investing in those assets then the nominal cost of
capital calculation must be used.

Final Report
43
Where current cost accounting is used or where assets have been subject to
revaluation, then a real cost of capital must be used.
In most cases ANSPs apply modified historic cost accounting, with land and
buildings, amongst other assets, being revalued. In this circumstance, for
assets that have been revalued the real cost of capital must be applied to
these assets, and the nominal cost of capital to those reported as historic
cost.
Final Report
44
5 PART A: Calculating a reasonable return on capital
for ANSPs
Application of the cost of capital in air navigation
The appropriate return on assets for an economically regulated entity is normally 5.1
determined by calculating a Weighted Average Cost of Capital (WACC). The WACC
reflects the rate of return on the different sources of capital financing made
available to the entity, including debt and equity, and the weighting of each in its
overall capital structure. In principle, application of the WACC ensures that the
entity earns a normal return that is fully reflective of efficient resource costs.
However, while the use of the WACC in economic regulation is well established, 5.2
we note that it is typically applied to commercial organisations securing finance in
private capital markets, although these organisations are not necessarily privately
owned. In the case of air navigation, methods of financing ANSPs vary
considerably across the EU, and many are subject to heavy state involvement in
terms of ownership and funding. More specifically, we note that:
I Some States take the view that international and other obligations in respect of
air navigation are best met through state ownership and operation of the
national ANSP. In these circumstances, the ANSP may be able to borrow from
the state at the government borrowing rate or another specified rate below
that available from the market, although it may also have recourse to
borrowing on market terms. In addition, some States provide their ANSPs with
equity attracting a specified return that is similarly below what the market is
willing to offer.
I Other States regard their ANSP as an independent, commercial entity, although
it may be publicly or privately owned. In these circumstances it is important to
ensure that returns reflect the costs of obtaining finance in the market in order
to ensure that the ANSP does not experience financial difficulties including a
risk of default. At the same time, returns should not be set too high, such that
the ANSP is able to earn monopoly profits at the expense of airspace users.
The WACC therefore needs to be applied to ANSPs with care, taking account of the 5.3
broad objectives of economic regulation as well as the characteristics of the
industry discussed in Chapter 3 and the approach to ownership and operation at
the national level. These issues are considered further in the development of a
framework for determining a reasonable rate of return for ANSPs in Chapter 6. In
the remainder of this chapter, we describe the various components of the WACC
and comment on its application in the calculation of the cost of capital for ANSPs
hitherto.
Calculation of the Weighted Average Cost of Capital
The WACC represents the cost of servicing the capital invested in a commercial 5.4
entity such as a company. It comprises the cost of equity and the cost of debt,
weighted by their relative share in a company’s capital structure, as shown by the
expression below (D = debt and E = equity):
Final Report
45
( ) ( )⁄ ( ) ( )⁄
In principle, the WACC represents a fair return in the sense of reasonable 5.5
compensation for the capital supporting the company’s activities. In economic
terms, it reflects the opportunity cost of employing the capital to support another
business activity with similar risk. According to economic theory, setting the
WACC at an appropriate level is essential in order to achieve economic efficiency,
whereby resources across the economy are allocated optimally. In practice,
distortions in the economy frequently mean that efficient outcomes depend on
some modification to market determined prices, including the cost of capital. In
addition, economic efficiency is anyway only one of a number of objectives that
need to be taken into account in regulating the return on capital.
The return of equity
The WACC assumes that the entity is partly financed through the provision of 5.6
equity by shareholders. Shareholders are rewarded through a combination of
dividend payments and capital appreciation, although returns are variable and
uncertain, and typically their investment entitles them to a share in ownership and
some participation in the entity’s governance arrangements. Returns are
calculated by expressing the earnings of the company after interest payments and
tax as a percentage of total share value.
A number of European ANSPs benefit from equity finance but none is traded on 5.7
capital markets and it is therefore not possible to estimate returns based on
observed price-earnings ratios. A number of other techniques have been used in
estimating returns for commercial entities in similar circumstances, for example:
I The Capital Asset Pricing Model (CAPM);
I The Dividend Growth Model (DGM) which takes into consideration dividend per
share and its expected growth; and
I Benchmarking against other industries with comparable risk.
In practice, the most common approach to estimating the cost of equity is the 5.8
CAPM as it allows the cost to be estimated based on individual components that
can be observed or estimated specifically for the company in question. This is
considered a more accurate approach than attempting to identify comparator
companies with similar business and financial risk for benchmarking. Moreover,
the DGM method can only be applied to listed companies, which in practice means
its application to a non-listed entity would involve a benchmarking exercise.
The Capital Asset Pricing Model
The CAPM states that a firm’s cost of equity capital is equal to a market risk-free 5.9
rate of return, plus a premium above the risk free rate to reflect the relative
riskiness of the company and its investments. The CAPM can be expressed as:
( )
Re = Return on equity
Rf = Risk free rate of return
Rm = Equity or market rate of return

Final Report
46
βe = Equity beta , which measures the correlation between the riskiness of
an asset and that of the overall market.
In the following paragraphs, we discuss each of the components of the CAPM and 5.10
how they can be estimated.
The risk free rate
The risk free rate is the return investors could reasonably expect if they invested 5.11
capital in a risk-free investment with guaranteed returns and no possibility of
default. Although an entirely risk-free instrument does not exist, government
bond rates in stable and developed countries are often considered reasonable
proxies for the “risk-free” rate.
However, there are circumstances in which government bond rates are poor 5.12
proxies for a risk free rate. This is demonstrated by the recent sovereign debt
crises in what were previously considered relatively stable European economies.
The figure below shows the yields on long term government bonds issued by
Greece, Ireland and Portugal, as well by the European Central Bank (ECB). Until
2007, there was relatively little variation in yields both over time and between
countries, but as the market lost confidence in countries’ ability to service their
debt yields increased substantially. By contrast, yields on ECB bonds tended to
decrease, probably reflecting the combined impact of lower base rates and an
investor rush towards safe havens.
FIGURE 5.1 GOVERNMENT BOND YIELDS IN SELECTED EU COUNTRIES
Source: Steer Davies Gleave analysis of ECB data (Harmonised long-term interest rates for convergence
assessment purposes). Note: shaded area indicates the window used by the PRB to assess the yield for
an indication of risk-free rates, i.e. the recent history of rates at the time the performance plans were
written.
This analysis suggests that estimation of the risk free rate should be based on bond 5.13
yields during periods of relative financial stability. Focusing on trends up to the
beginning of 2009 in the above figure, this approach would result in a value in the

Final Report
47
order of 3.5% to 4.5% for Greece, Ireland and Poland, rather than the 7% to 12%
yields observed during the development of the performance plans. However,
basing the calculation on data from previous years is open to the objection that
past yields do not adequately reflect current risk free rates, in particular if
inflation expectations change over time.
The difficulties of using government bond yields to estimate the risk free rate 5.14
raises the question of what other options are available. One possibility is to use a
benchmark bond value such as a UK index-linked gilt or ECB bond, with their yields
deflated by inflation expectations. The justification for this approach is that,
according to economic theory, there is no reason why the risk free rate should vary
in real terms between countries. Assuming there are no constraints on capital
flows between countries, the only source of discrepancy in nominal risk free rates
should therefore be differences in inflation expectations. Any country-specific
risks should not affect the risk free rate, but rather form a component of the
equity (and debt) risk premium.
The equity risk premium
The equity risk premium represents the excess return over the risk-free rate that 5.15
investors require to compensate them for the risks associated with variability of a
market portfolio of securities. It is therefore specific to the market in question
and not to an individual company or sector. The equity risk premium is typically
measured using analysis of historic excess return in the stock market over the risk-
free rate.
However, there are reasons why historic measures of the equity risk premium may 5.16
not provide good indicators of current and future premiums. Observed premiums
vary significantly over time and a long time series is therefore required in order to
generate a statistically robust estimate. At the same time, using a long time
series assumes that the risk premium is constant over time, whereas it is likely to
change significantly (e.g. it is unlikely that observed premiums in the early 20th
century are representative of the premiums expected today). Furthermore,
estimates of the premium are likely to be inflated because of survivor bias: in the
long run, stock market indices will be dominated by successful companies and
unprofitable entities who de-list are excluded from the sample.
In practice, there are a number of different approaches to estimating the likely 5.17
future equity risk premium. These include the following:
I Dimson–Marsh–Staunton (DMS) use a long time series of the performance of
company stocks and record how they have performed against a measure of risk
free rates. This approach suffers from the drawbacks mentioned above,
although attempts have been made to correct for survivor bias. Additionally, it
is only available for a selection of countries with a large stock market and
mature economies.
I Damodoran uses market prices to estimate implied levels of ‘country risk’
relative to the USA, taking differences in sovereign bond yields as a proxy for
differences in country-specific risk. Damodoran’s method has the advantages
of being forward-looking, providing replicable results, and covering all SES
states. Amongst the disadvantages of the method is the fact that it assumes a
fixed relationship between sovereign risk and equity market risk. This method

Final Report
48
would have implied unrealistically high equity market returns in countries like
Ireland during the period of sovereign debt crisis.
I Fernandez-IESE Business School undertook a large survey of academics, bankers
and investors on what they consider to be the current equity risk premium.
Although many respondents simply quoted the values derived by DMS and
Damodoran, the survey did help to establish a consensus view on the equity risk
premium amongst experts and practitioners who use these estimates to inform
real investment decisions.
The figure below shows the results of the three methods for the countries in the 5.18
sample. We observe that in most cases the methods provide estimates of equity
risk-premiums that are broadly similar. However, the figure highlights the
divergence in the estimates for certain countries, such as Germany and Spain. For
the former, this may reflect DMS’ reliance on historical circumstances that no
longer hold. For Spain, Damodaran’s high estimate of the equity risk premium
presumably arises from the fact that sovereign risk (which was perceived as
abnormally high in Spain in 2012) is difficult to isolate from equity risk.
FIGURE 5.2 ESTIMATES OF THE EQUITY RISK PREMIUM
Source: Steer Davies Gleave analysis of DMS, Damodoran and Fernandez data
Equity beta
In finance theory, a beta value measures the degree of volatility of a particular 5.19
asset compared to that of the market. It is a measure of the excess systemic risk
of an investment, which is a function of a commercial entity’s business risk and
the financial risk of using debt in addition to equity finance. The term “gearing” is
sometimes used to refer to the proportion of an entity’s capital structure that
consists of debt; a high proportion of debt means high gearing.
An investor would require a higher return on an investment in an activity subject 5.20
to inherent uncertainty as compared to an activity with limited risks. Therefore
the equity beta of a commercial entity should increase with its business risk. In

Final Report
49
addition, an equity investor would require a higher return on investment in an
entity with a high proportion of debt finance, because remuneration of creditors
takes precedence over remuneration of shareholders and a high level of debt
therefore results in additional shareholder risk. For this reason, the equity beta
should increase with gearing.
Against this background, beta values are generally interpreted as follows: 5.21
I A beta of 1 means that, on average, returns on the particular asset track those
of the market;
I A beta greater than 1 implies that returns tend to move in the same direction
as the market but with a more extreme amplitude;
I A beta of 0 means that there is no correlation with the market; and
I A negative beta implies that the asset’s return tends to rise when the market
return falls.
Equity betas for quoted companies are normally measured using statistical analysis 5.22
of relative variation in the published share price to the market. However, this is
not possible for entities that are not listed and in practice the most common
approach is to benchmark against companies with similar risk and operational
profiles. Such an approach can be problematic, since a like-for-like comparison
requires the benchmarking to be performed while controlling simultaneously for
differences in the risk of the activity itself and financial risk. Hence, in order to
facilitate such comparisons regulators have introduced the concept of the asset
beta.
Asset betas are the weighted average of the betas on debt and equity. They 5.23
provide an indication of the riskiness of an entity that is independent of its capital
structure. A widely used approach in the finance industry and in the academic
literature to relating the equity beta to the asset beta is to use Hamada’s
Equation:
Note that this equation holds when there is no beta on debt. The section below on 5.24
cost of debt discusses debt betas.
The asset beta for an ANSP is dependent on different aspects of its activity, in 5.25
particular:
I The traffic risk: linked to the demand and capacity for air transport within and
above a given State airspace;
I The cost-risk: that is, risks to its cash-flow; and
I Other risks such as operational gearing.
As discussed in Chapter 3, the actual traffic and cost risks facing ANSPs need to be 5.26
seen in the context of the risk sharing arrangements introduced by the Charging
Regulation.
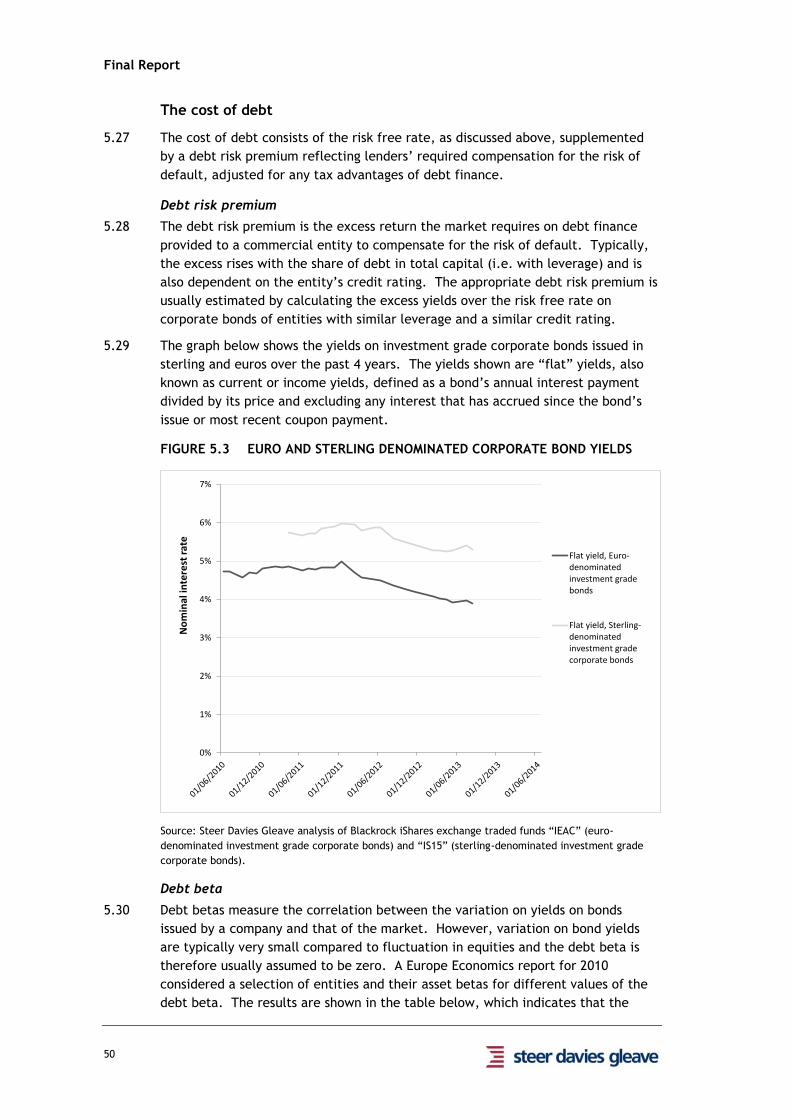
Final Report
50
The cost of debt
The cost of debt consists of the risk free rate, as discussed above, supplemented 5.27
by a debt risk premium reflecting lenders’ required compensation for the risk of
default, adjusted for any tax advantages of debt finance.
Debt risk premium
The debt risk premium is the excess return the market requires on debt finance 5.28
provided to a commercial entity to compensate for the risk of default. Typically,
the excess rises with the share of debt in total capital (i.e. with leverage) and is
also dependent on the entity’s credit rating. The appropriate debt risk premium is
usually estimated by calculating the excess yields over the risk free rate on
corporate bonds of entities with similar leverage and a similar credit rating.
The graph below shows the yields on investment grade corporate bonds issued in 5.29
sterling and euros over the past 4 years. The yields shown are “flat” yields, also
known as current or income yields, defined as a bond’s annual interest payment
divided by its price and excluding any interest that has accrued since the bond’s
issue or most recent coupon payment.
FIGURE 5.3 EURO AND STERLING DENOMINATED CORPORATE BOND YIELDS
Source: Steer Davies Gleave analysis of Blackrock iShares exchange traded funds “IEAC” (euro-
denominated investment grade corporate bonds) and “IS15” (sterling-denominated investment grade
corporate bonds).
Debt beta
Debt betas measure the correlation between the variation on yields on bonds 5.30
issued by a company and that of the market. However, variation on bond yields
are typically very small compared to fluctuation in equities and the debt beta is
therefore usually assumed to be zero. A Europe Economics report for 2010
considered a selection of entities and their asset betas for different values of the
debt beta. The results are shown in the table below, which indicates that the
0%
1%
2%
3%
4%
5%
6%
7%
No
min
al in
tere
st r
ate
Flat yield, Euro-denominatedinvestment gradebonds
Flat yield, Sterling-denominatedinvestment gradecorporate bonds
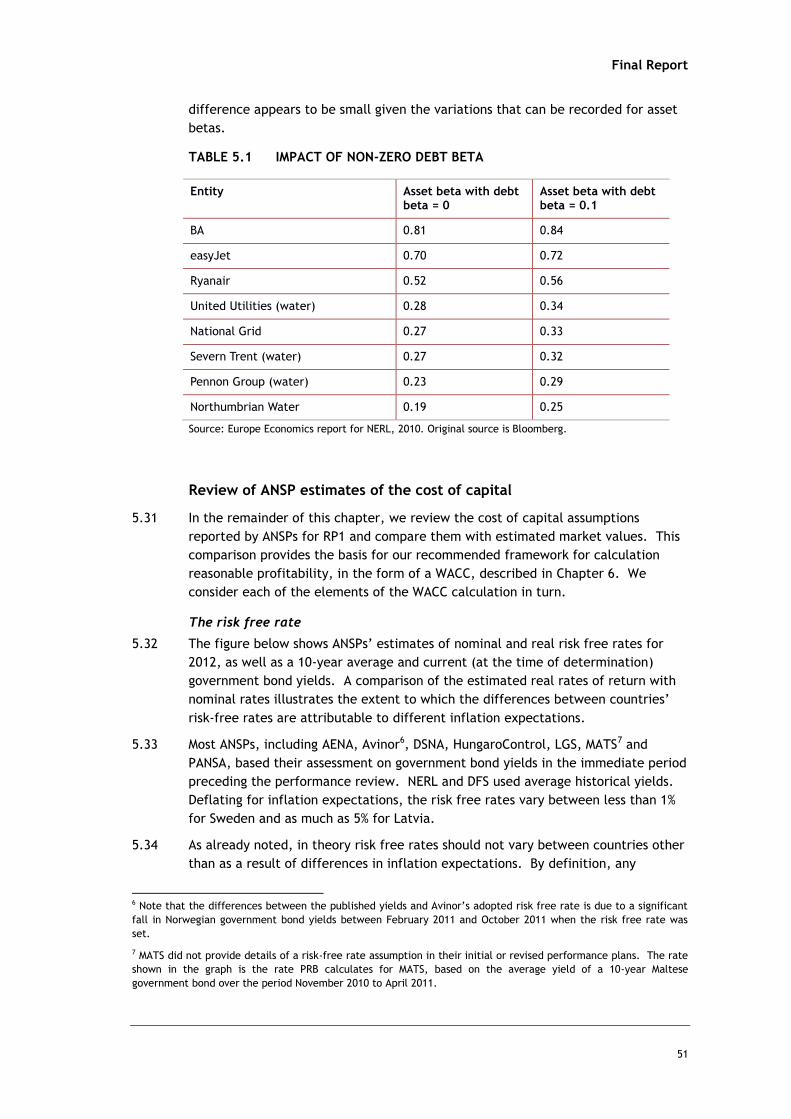
Final Report
51
difference appears to be small given the variations that can be recorded for asset
betas.
TABLE 5.1 IMPACT OF NON-ZERO DEBT BETA
Entity Asset beta with debt beta = 0
Asset beta with debt beta = 0.1
BA 0.81 0.84
easyJet 0.70 0.72
Ryanair 0.52 0.56
United Utilities (water) 0.28 0.34
National Grid 0.27 0.33
Severn Trent (water) 0.27 0.32
Pennon Group (water) 0.23 0.29
Northumbrian Water 0.19 0.25
Source: Europe Economics report for NERL, 2010. Original source is Bloomberg.
Review of ANSP estimates of the cost of capital
In the remainder of this chapter, we review the cost of capital assumptions 5.31
reported by ANSPs for RP1 and compare them with estimated market values. This
comparison provides the basis for our recommended framework for calculation
reasonable profitability, in the form of a WACC, described in Chapter 6. We
consider each of the elements of the WACC calculation in turn.
The risk free rate
The figure below shows ANSPs’ estimates of nominal and real risk free rates for 5.32
2012, as well as a 10-year average and current (at the time of determination)
government bond yields. A comparison of the estimated real rates of return with
nominal rates illustrates the extent to which the differences between countries’
risk-free rates are attributable to different inflation expectations.
Most ANSPs, including AENA, Avinor6, DSNA, HungaroControl, LGS, MATS7 and 5.33
PANSA, based their assessment on government bond yields in the immediate period
preceding the performance review. NERL and DFS used average historical yields.
Deflating for inflation expectations, the risk free rates vary between less than 1%
for Sweden and as much as 5% for Latvia.
As already noted, in theory risk free rates should not vary between countries other 5.34
than as a result of differences in inflation expectations. By definition, any
6 Note that the differences between the published yields and Avinor’s adopted risk free rate is due to a significant
fall in Norwegian government bond yields between February 2011 and October 2011 when the risk free rate was
set.
7 MATS did not provide details of a risk-free rate assumption in their initial or revised performance plans. The rate
shown in the graph is the rate PRB calculates for MATS, based on the average yield of a 10-year Maltese
government bond over the period November 2010 to April 2011.
Final Report
52
country-specific risks should be reflected in the equity and debt risk premiums.
The differences in the risk free rates reported by ANSPs are therefore difficult to
explain, even after correcting for differences in assumed inflation. One possible
explanation is that market expectations of inflation differ significantly from those
of the ANSPs. Alternatively, it may be that the government bond yield is not a
suitable proxy for the risk free rate in every, or even in all, countries.
FIGURE 5.4 ANSP NOMINAL AND REPORTED RISK FREE RATES
Source: Steer Davies Gleave analysis.
The figure below shows sovereign bond yields over the 10 years to 2013 for each of 5.35
the countries in our sample. Yields in the Eurozone and in the most developed
countries outside (including Sweden, Norway, Malta and the UK) track each other
quite closely until 2008, and yields in the other countries converge with those in
the more developed group. After the onset of the financial crisis, however, yields
in Hungary, Latvia, Poland, Spain and, to a lesser extent, Malta, begin to diverge
from the rest.
It is unlikely that this divergence reflects differences in inflation expectations. 5.36
Rather, it probably reflects the markets’ increasing unease about the risk of
certain countries defaulting on sovereign debt. The implication is that, since
2008, government bond yields in these countries do not offer a reasonable proxy
for the risk free rate. As a result, the risk free rates determined in the
performance reviews for HungaroControl, LGS, PANSA and AENA are likely to
significantly overstate the relevant risk free rate in each case. This is view
supported by the observation that these countries have estimated significantly
higher real risk free rates than the rest of our sample.
0%
1%
2%
3%
4%
5%
6%
7%
8%
Rat
e o
f re
turn
Nominal Risk free rate
Real Risk free rate
Nominal Govt bond - Apr'01 - Apr '11
Nominal Govt bond - Feb'11
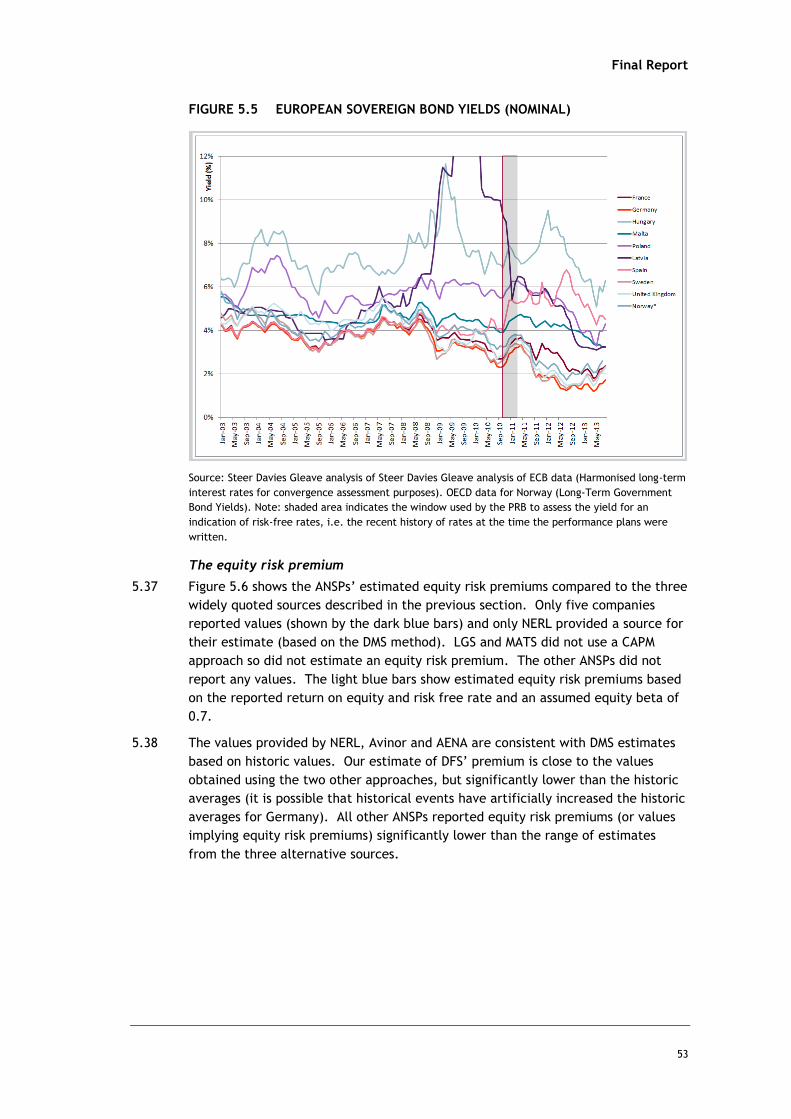
Final Report
53
FIGURE 5.5 EUROPEAN SOVEREIGN BOND YIELDS (NOMINAL)
Source: Steer Davies Gleave analysis of Steer Davies Gleave analysis of ECB data (Harmonised long-term
interest rates for convergence assessment purposes). OECD data for Norway (Long-Term Government
Bond Yields). Note: shaded area indicates the window used by the PRB to assess the yield for an
indication of risk-free rates, i.e. the recent history of rates at the time the performance plans were
written.
The equity risk premium
Figure 5.6 shows the ANSPs’ estimated equity risk premiums compared to the three 5.37
widely quoted sources described in the previous section. Only five companies
reported values (shown by the dark blue bars) and only NERL provided a source for
their estimate (based on the DMS method). LGS and MATS did not use a CAPM
approach so did not estimate an equity risk premium. The other ANSPs did not
report any values. The light blue bars show estimated equity risk premiums based
on the reported return on equity and risk free rate and an assumed equity beta of
0.7.
The values provided by NERL, Avinor and AENA are consistent with DMS estimates 5.38
based on historic values. Our estimate of DFS’ premium is close to the values
obtained using the two other approaches, but significantly lower than the historic
averages (it is possible that historical events have artificially increased the historic
averages for Germany). All other ANSPs reported equity risk premiums (or values
implying equity risk premiums) significantly lower than the range of estimates
from the three alternative sources.
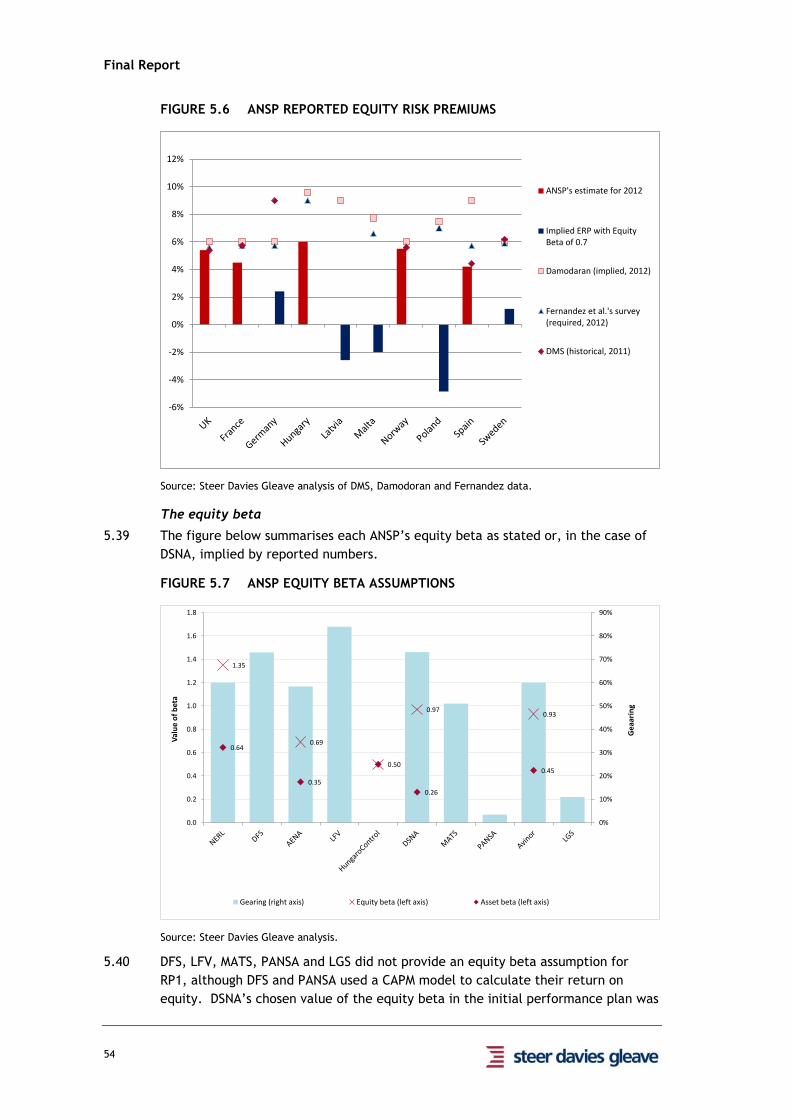
Final Report
54
FIGURE 5.6 ANSP REPORTED EQUITY RISK PREMIUMS
Source: Steer Davies Gleave analysis of DMS, Damodoran and Fernandez data.
The equity beta
The figure below summarises each ANSP’s equity beta as stated or, in the case of 5.39
DSNA, implied by reported numbers.
FIGURE 5.7 ANSP EQUITY BETA ASSUMPTIONS
Source: Steer Davies Gleave analysis.
DFS, LFV, MATS, PANSA and LGS did not provide an equity beta assumption for 5.40
RP1, although DFS and PANSA used a CAPM model to calculate their return on
equity. DSNA’s chosen value of the equity beta in the initial performance plan was
-6%
-4%
-2%
0%
2%
4%
6%
8%
10%
12%
ANSP's estimate for 2012
Implied ERP with EquityBeta of 0.7
Damodaran (implied, 2012)
Fernandez et al.'s survey(required, 2012)
DMS (historical, 2011)
1.35
0.69
0.50
0.970.93
0.64
0.35
0.26
0.45
0%
10%
20%
30%
40%
50%
60%
70%
80%
90%
0.0
0.2
0.4
0.6
0.8
1.0
1.2
1.4
1.6
1.8
Ge
aari
ng
Val
ue
of
bet
a
Gearing (right axis) Equity beta (left axis) Asset beta (left axis)
Final Report
55
1.9. However, the return on equity submitted in the revised plan is not consistent
with the market rate and equity beta assumptions in the initial plan. Assuming
DSNA’s market rate assumption remained unchanged, its return on equity in the
revised plan implies an equity beta of approximately 1. The range of estimated
values is quite wide, although the use of different gearing levels complicates the
comparison.
The asset beta
To facilitate the comparison of risk between ANSPs, the figure below shows both 5.41
the asset and equity betas reported for RP1 where available. The asset betas for
the five ANSPs providing sufficient information to allow their calculation range
from less than 0.3 to over 0.68. Hence, even after correcting for leverage the
differences in perceptions of the ANSP-specific equity risk vary substantially, and
much more so than might be expected from consideration of the differences in the
ANSPs’ respective operational environments.
The choice of the appropriate asset beta value for a non-listed ANSP will 5.42
necessarily depend on subjective views about the revenue and cost risks that they
face. The following table presents asset betas for ANSPs and other regulated
entities in a number of industries and countries.
TABLE 5.2 COMPARISON OF ASSET BETAS BY INDUSTRY
Industry Entity Asset beta Source
Rail
Network Rail 2014-2019 determination 0.46 SDG analysis of CEPA report for rail regulator
Network Rail 2009-2014 determination 0.35 First Economics report for rail regulator
Deutsche Bahn DB’s view as of June 2010 0.46 NERA report for DB
Deutsche Bahn Regulator’s implied view as of December 2009
0.19 NERA analysis in report for DB
ANSPs
Airservices Australia
2012 determination 0.55 Oxera report for NERL
New Zealand Airways en-route
2013 determination 0.45 Airways 2013 Annual report
Airlines
Easyjet 2007-2009 observed beta 0.92 First Economics report for UK CAA
Easyjet 2009 observed beta 0.70 Europe Economics report for NERL
Ryanair 2007-2009 observed beta 0.81 First Economics report for UK CAA
8 NERL’s asset beta is reported in its performance plan as 0.6. This would be consistent with the equity beta
applied by the ANSP if it used a debt beta assumption of 0.0. However, the ANSP also reports using a debt beta of
0.1, which would imply an asset beta of 0.7. Therefore, it is ambiguous whether NERL’s assumptions should be
presented as (1) an asset beta of 0.7 and a debt beta of 0.1 or (2) an asset beta of approximately 0.6, or more
precisely 0.64, and a debt beta of 0.0. For the purpose of our report, the choice between the two is not material.

Final Report
56
Industry Entity Asset beta Source
Ryanair 2009 observed beta 0.52 Europe Economics report for NERL
British Airways 2007-2009 observed beta 0.74 First Economics report for UK CAA
British Airways 2009 observed beta 0.81 Europe Economics report for NERL
Airports
Zurich airport 2007-2009 observed beta 1.00 First economics report for UK CAA
Vienna airport 2007-2009 observed beta 0.63 First economics report for UK CAA
Macquarie airports
2007-2009 observed beta 0.55 First economics report for UK CAA
Frankfurt airport 2007-2009 observed beta 0.46 First economics report for UK CAA
Copenhagen airport
2007-2009 observed beta 0.17 First economics report for UK CAA
Florence airport 2007-2009 observed beta 0.16 First economics report for UK CAA
Irish airports 2011 determination 0.65 Oxera report for NERL
Norwegian airport operations
2011 estimate 0.58 Deloitte report for Avinor
Electricity and gas networks
National Grid PLC 2007-2009 observed beta 0.35 First economics report for UK CAA
National Grid PLC 2009 observed beta 0.27 Europe Economics report for NERL
Electricity Distribution Network Operators
2008 determination 0.48 First economics report for UK CAA
Irish electricity and gas
2010 determination 0.40 Oxera report for NERL
Dutch electricity and gas
2010 determination 0.43 Oxera report for NERL
French electricity and gas
2009 determination 0.33 Oxera report for NERL
German electricity and gas
2008 determination 0.39 Oxera report for NERL
Water
United Utilities 2007-2009 observed beta 0.44 First Economics report for UK CAA
United Utilities 2009 observed beta 0.28 Europe Economics report for NERL
Severn Trent 2007-2009 observed beta 0.41 First Economics report for UK CAA

Final Report
57
Industry Entity Asset beta Source
Severn Trent 2009 observed beta 0.27 Europe Economics report for NERL
Pennon Group 2007-2009 observed beta 0.37 First Economics report for UK CAA
Pennon Group 2009 observed beta 0.23 Europe Economics report for NERL
Northumbrian Water
2007-2009 observed beta 0.36 First Economics report for UK CAA
Northumbrian Water
2009 observed beta 0.19 Europe Economics report for NERL
Telecoms
BT (regulated operations)
2008 determination 0.56 First Economics report for UK CAA
French fixed-line telecoms
2011 determination 0.48 Oxera report for NERL
Spanish fixed-line telecoms
2011 determination 0.43 Oxera report for NERL
Swedish fixed-line telecoms
2011 determination 0.54 Oxera report for NERL
Source: Steer Davies Gleave analysis.
As the table demonstrates, asset betas vary greatly. Many regulated companies 5.43
are true natural monopolies and therefore do not face significant competition,
whilst some, such as telecommunications service providers, are contestable and
others, such as airlines, face significant competition. Some operate in stable
markets providing essential services, the demand for which is unlikely to fluctuate
significantly over time, while others face significant demand uncertainty.
Regulated frameworks also differ and the degree of regulatory oversight of
business planning and performance will affect the perception of risk.
As noted in Chapter 3, we consider that revenue and cost risks for ANSPs are 5.44
broadly similar as for electricity, gas and water utilities. On the other hand, the
risks faced by ANSPs are likely to be lower than for airport operators and fixed-line
telecommunications, and considerably lower than for airlines. This suggests values
for asset betas for ANSPs within the range found for electricity, gas and water
utilities, giving a reasonable range of between 0.3 and 0.5 with a midpoint of 0.4.
This view is supported by the asset beta determined for New Zealand and
Australian ANSPs of 0.3 – 0.55.
Cost of equity
Figure 5.8 summarises the cost of equity estimated for each ANSP in the 5.45
performance plans, including the contribution from the risk free rate and market
risk premium where available. Where CAPM has been used and values reported for
the equity risk premium, the difference between the cost of equity and the sum of
the risk free rate and equity risk premium (the market return) is determined by
the equity beta. The comparison between the market returns and ANSPs’ reported
cost of equity in the UK and Hungary demonstrates the impact of the beta value in
the overall calculation. Market rate returns in Hungary are significantly higher
than in the UK, but because the ANSPs use very different betas (1.35 in the case of
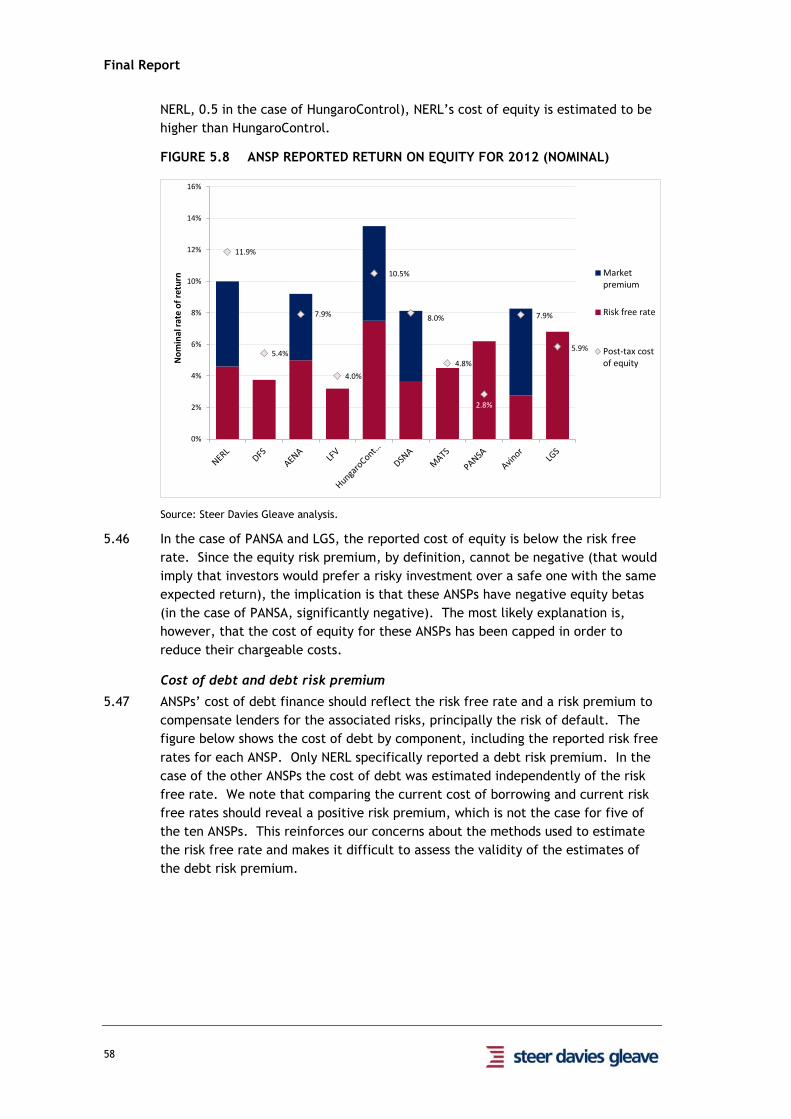
Final Report
58
NERL, 0.5 in the case of HungaroControl), NERL’s cost of equity is estimated to be
higher than HungaroControl.
FIGURE 5.8 ANSP REPORTED RETURN ON EQUITY FOR 2012 (NOMINAL)
Source: Steer Davies Gleave analysis.
In the case of PANSA and LGS, the reported cost of equity is below the risk free 5.46
rate. Since the equity risk premium, by definition, cannot be negative (that would
imply that investors would prefer a risky investment over a safe one with the same
expected return), the implication is that these ANSPs have negative equity betas
(in the case of PANSA, significantly negative). The most likely explanation is,
however, that the cost of equity for these ANSPs has been capped in order to
reduce their chargeable costs.
Cost of debt and debt risk premium
ANSPs’ cost of debt finance should reflect the risk free rate and a risk premium to 5.47
compensate lenders for the associated risks, principally the risk of default. The
figure below shows the cost of debt by component, including the reported risk free
rates for each ANSP. Only NERL specifically reported a debt risk premium. In the
case of the other ANSPs the cost of debt was estimated independently of the risk
free rate. We note that comparing the current cost of borrowing and current risk
free rates should reveal a positive risk premium, which is not the case for five of
the ten ANSPs. This reinforces our concerns about the methods used to estimate
the risk free rate and makes it difficult to assess the validity of the estimates of
the debt risk premium.
11.9%
5.4%
7.9%
4.0%
10.5%
8.0%
4.8%
2.8%
7.9%
5.9%
0%
2%
4%
6%
8%
10%
12%
14%
16%N
om
inal
rat
e o
f re
turn
Marketpremium
Risk free rate
Post-tax costof equity

Final Report
59
FIGURE 5.9 ANSP REPORTED COST OF DEBT FOR 2012 (NOMINAL)
Source: Steer Davies Gleave analysis.
FIGURE 5.10 CORORATE BOND YIELDS AND INTEREST RATES
Source: Steer Davies Gleave analysis of corporate bonds yields denominated in Euros (iShares Blackrock
exchange traded fund “IEAC”) and Sterling corporate bond yields (iShares Blackrock exchange traded
fund “IS15”). Average ANSPs interest on debt submitted in their Performance Plans.
Figure 5.10 compares investment grade corporate bond yields with the interest 5.48
rates reported by ANSPs in the performance plans. The comparison highlights a
number of issues, in particular:
6.5%
4.5%4.0%
0.0%
3.3%
5.5%
6.0%
5.4%
6.0%
-4%
-3%
-2%
-1%
0%
1%
2%
3%
4%
5%
6%
7%
8%
No
min
al in
tere
st r
ate Debt risk
premium
Risk free rate
Pre-tax cost ofdebt
-1%
0%
1%
2%
3%
4%
5%
6%
7%
8%
01
/06
/10
01
/12
/10
01
/06
/11
01
/12
/11
01
/06
/12
01
/12
/12
01
/06
/13
01
/12
/13
01
/06
/14
No
min
al in
tere
st r
ate
Flat yield, Euro-denominatedinvestment grade bonds
Flat yield, Sterling-denominatedinvestment grade corporatebondsNERL
LGS
PANSA
MATS
Avinor
DFS
AENA
DSNA
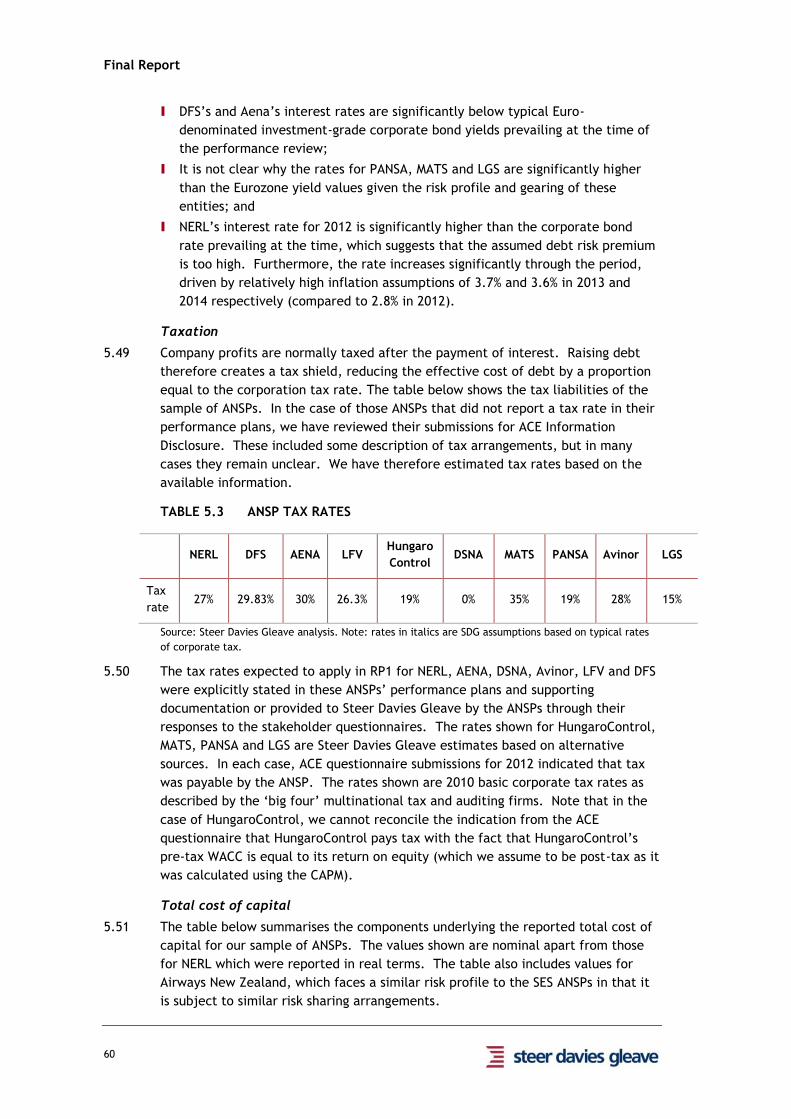
Final Report
60
I DFS’s and Aena’s interest rates are significantly below typical Euro-
denominated investment-grade corporate bond yields prevailing at the time of
the performance review;
I It is not clear why the rates for PANSA, MATS and LGS are significantly higher
than the Eurozone yield values given the risk profile and gearing of these
entities; and
I NERL’s interest rate for 2012 is significantly higher than the corporate bond
rate prevailing at the time, which suggests that the assumed debt risk premium
is too high. Furthermore, the rate increases significantly through the period,
driven by relatively high inflation assumptions of 3.7% and 3.6% in 2013 and
2014 respectively (compared to 2.8% in 2012).
Taxation
Company profits are normally taxed after the payment of interest. Raising debt 5.49
therefore creates a tax shield, reducing the effective cost of debt by a proportion
equal to the corporation tax rate. The table below shows the tax liabilities of the
sample of ANSPs. In the case of those ANSPs that did not report a tax rate in their
performance plans, we have reviewed their submissions for ACE Information
Disclosure. These included some description of tax arrangements, but in many
cases they remain unclear. We have therefore estimated tax rates based on the
available information.
TABLE 5.3 ANSP TAX RATES
NERL DFS AENA LFV
Hungaro
Control DSNA MATS PANSA Avinor LGS
Tax
rate 27% 29.83% 30% 26.3% 19% 0% 35% 19% 28% 15%
Source: Steer Davies Gleave analysis. Note: rates in italics are SDG assumptions based on typical rates
of corporate tax.
The tax rates expected to apply in RP1 for NERL, AENA, DSNA, Avinor, LFV and DFS 5.50
were explicitly stated in these ANSPs’ performance plans and supporting
documentation or provided to Steer Davies Gleave by the ANSPs through their
responses to the stakeholder questionnaires. The rates shown for HungaroControl,
MATS, PANSA and LGS are Steer Davies Gleave estimates based on alternative
sources. In each case, ACE questionnaire submissions for 2012 indicated that tax
was payable by the ANSP. The rates shown are 2010 basic corporate tax rates as
described by the ‘big four’ multinational tax and auditing firms. Note that in the
case of HungaroControl, we cannot reconcile the indication from the ACE
questionnaire that HungaroControl pays tax with the fact that HungaroControl’s
pre-tax WACC is equal to its return on equity (which we assume to be post-tax as it
was calculated using the CAPM).
Total cost of capital
The table below summarises the components underlying the reported total cost of 5.51
capital for our sample of ANSPs. The values shown are nominal apart from those
for NERL which were reported in real terms. The table also includes values for
Airways New Zealand, which faces a similar risk profile to the SES ANSPs in that it
is subject to similar risk sharing arrangements.
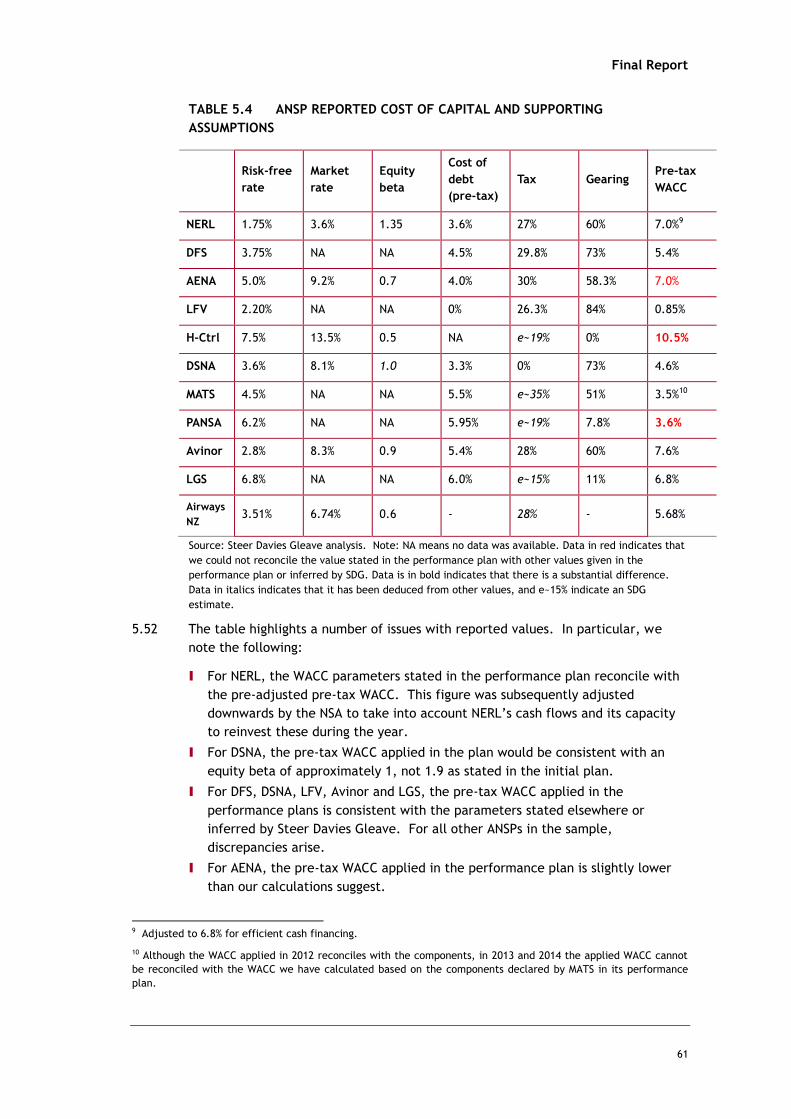
Final Report
61
TABLE 5.4 ANSP REPORTED COST OF CAPITAL AND SUPPORTING
ASSUMPTIONS
Risk-free
rate
Market
rate
Equity
beta
Cost of
debt
(pre-tax)
Tax Gearing Pre-tax
WACC
NERL 1.75% 3.6% 1.35 3.6% 27% 60% 7.0%9
DFS 3.75% NA NA 4.5% 29.8% 73% 5.4%
AENA 5.0% 9.2% 0.7 4.0% 30% 58.3% 7.0%
LFV 2.20% NA NA 0% 26.3% 84% 0.85%
H-Ctrl 7.5% 13.5% 0.5 NA e~19% 0% 10.5%
DSNA 3.6% 8.1% 1.0 3.3% 0% 73% 4.6%
MATS 4.5% NA NA 5.5% e~35% 51% 3.5%10
PANSA 6.2% NA NA 5.95% e~19% 7.8% 3.6%
Avinor 2.8% 8.3% 0.9 5.4% 28% 60% 7.6%
LGS 6.8% NA NA 6.0% e~15% 11% 6.8%
Airways
NZ 3.51% 6.74% 0.6 - 28% - 5.68%
Source: Steer Davies Gleave analysis. Note: NA means no data was available. Data in red indicates that
we could not reconcile the value stated in the performance plan with other values given in the
performance plan or inferred by SDG. Data is in bold indicates that there is a substantial difference.
Data in italics indicates that it has been deduced from other values, and e~15% indicate an SDG
estimate.
The table highlights a number of issues with reported values. In particular, we 5.52
note the following:
I For NERL, the WACC parameters stated in the performance plan reconcile with
the pre-adjusted pre-tax WACC. This figure was subsequently adjusted
downwards by the NSA to take into account NERL’s cash flows and its capacity
to reinvest these during the year.
I For DSNA, the pre-tax WACC applied in the plan would be consistent with an
equity beta of approximately 1, not 1.9 as stated in the initial plan.
I For DFS, DSNA, LFV, Avinor and LGS, the pre-tax WACC applied in the
performance plans is consistent with the parameters stated elsewhere or
inferred by Steer Davies Gleave. For all other ANSPs in the sample,
discrepancies arise.
I For AENA, the pre-tax WACC applied in the performance plan is slightly lower
than our calculations suggest.
9 Adjusted to 6.8% for efficient cash financing.
10 Although the WACC applied in 2012 reconciles with the components, in 2013 and 2014 the applied WACC cannot
be reconciled with the WACC we have calculated based on the components declared by MATS in its performance
plan.
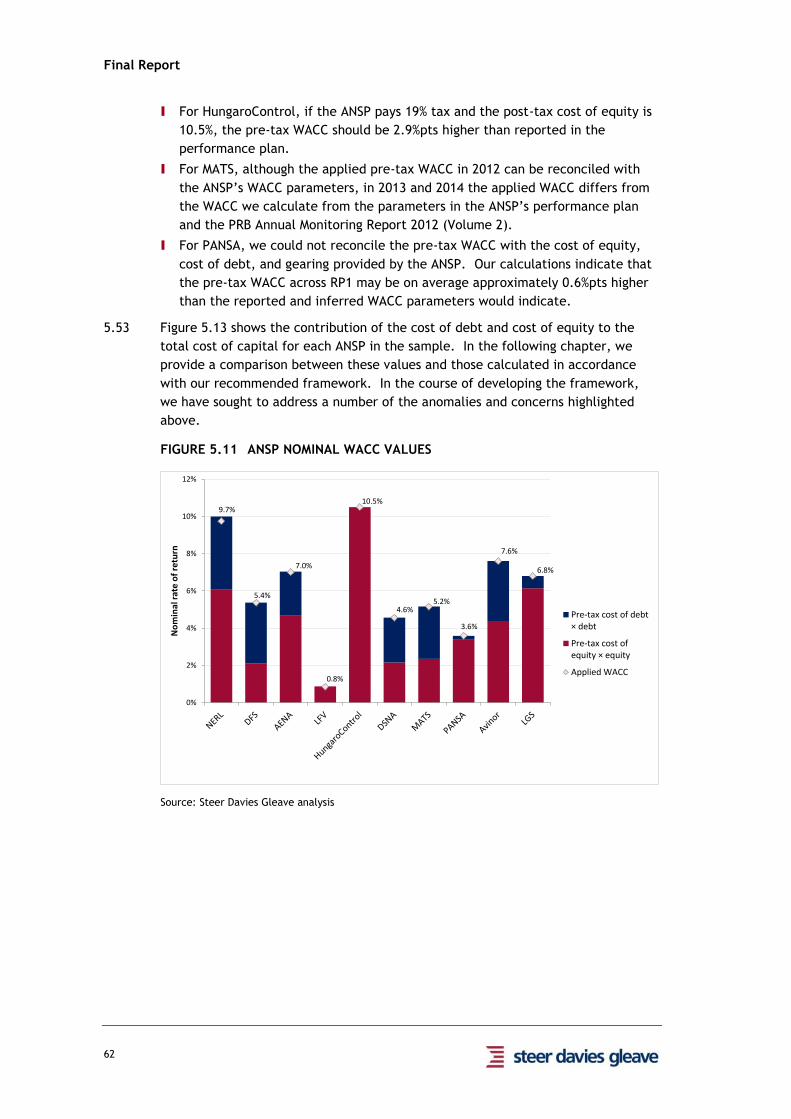
Final Report
62
I For HungaroControl, if the ANSP pays 19% tax and the post-tax cost of equity is
10.5%, the pre-tax WACC should be 2.9%pts higher than reported in the
performance plan.
I For MATS, although the applied pre-tax WACC in 2012 can be reconciled with
the ANSP’s WACC parameters, in 2013 and 2014 the applied WACC differs from
the WACC we calculate from the parameters in the ANSP’s performance plan
and the PRB Annual Monitoring Report 2012 (Volume 2).
I For PANSA, we could not reconcile the pre-tax WACC with the cost of equity,
cost of debt, and gearing provided by the ANSP. Our calculations indicate that
the pre-tax WACC across RP1 may be on average approximately 0.6%pts higher
than the reported and inferred WACC parameters would indicate.
Figure 5.13 shows the contribution of the cost of debt and cost of equity to the 5.53
total cost of capital for each ANSP in the sample. In the following chapter, we
provide a comparison between these values and those calculated in accordance
with our recommended framework. In the course of developing the framework,
we have sought to address a number of the anomalies and concerns highlighted
above.
FIGURE 5.11 ANSP NOMINAL WACC VALUES
Source: Steer Davies Gleave analysis
9.7%
5.4%
7.0%
0.8%
10.5%
4.6%5.2%
3.6%
7.6%
6.8%
0%
2%
4%
6%
8%
10%
12%
No
min
al r
ate
of
retu
rn
Pre-tax cost of debt× debt
Pre-tax cost ofequity × equity
Applied WACC

Final Report
63
6 PART A: Recommendations for “reasonable
profitability”
Introduction
In preparing our recommendations for the calculation of reasonable profitability 6.1
for ANSPs, we have taken account of the issues surrounding the calculation of
WACC discussed in the previous chapter as well as broader considerations
concerning the nature of the air navigation industry and the objectives of
economic regulation. We have also sought to reflect the views of stakeholders
based on the consultation responses received and comments expressed at the
stakeholder workshop described in Chapter 2, recognising the lack of a clear
consensus across different stakeholder groups on an appropriate approach. In this
chapter we begin by summarising stakeholder responses before outlining a set of
regulatory objectives and proposing a framework for the calculation in line with
our terms of reference.
Stakeholder views
We summarise the views according to the broad themes of particular importance 6.2
for the calculation of the cost of capital.
In general, the views of different stakeholders often differed considerably. In 6.3
particular, there is strong disagreement between ANSPs and NSAs on one hand and
airspace users on the other. Airspace users share very similar views among
themselves: AEA, IATA and EBAA as well as ELFAA submitted a unified set of
responses to our questionnaire. IACA responded separately but had similar
concerns. ERAA also mentioned that it endorsed the responses of IATA/AEA/EBAA.
There is more divergence of views among ANSPs and NSAs. Whilst opinions on
business risks faced by ANSPs tend to be shared, there is more than one view on
the calculation of the cost of capital.
Other organisations did not participate in the consultation to the same extent as 6.4
ANSPs, NSAs and airspace users.
Industry risks
Nearly all ANSPs cited traffic risk as the primary risk in the provision of air 6.5
navigation services. DSNA explained that that the traffic risk of each ANSP would
differ from others as the typology of traffic differs between ANSPs. The UK CAA
drew attention to two particular points on the nature and extent of traffic risk
borne by ANSPs: firstly, that the specific risk “is that traffic turns out to be
different to that forecast by the regulator,” and secondly that traffic risk is
“partially mitigated through the risk sharing mechanism and by resetting price
caps every 5 years or so”. It clarified that for charging purposes, it is only the
systematic element of traffic risk which is of interest, as one-off events would be
excluded, and that “what is important is whether ANSP risk has changed relative
to the rest of the economy”.
Several ANSPs also highlighted the importance of regulatory risk. LFV, for 6.6
example, suggested that there was “a risk that there will be tougher targets set
Final Report
64
out in the coming performance plan,” while NATS and the UK CAA both considered
that the length of the reference period introduced some risk. One ANSP described
regulatory risk as a “moving-goal post”. CANSO also drew attention to potential of
national policy to affect ANSP business, e.g. through changes to environmental
policy.
LFV and Avinor (both outside the Eurozone) mentioned exchange rate risk under 6.7
the heading of financial risk, while NATS and DFS drew attention to the risk of bad
debts. Some ANSPs, notably MATS and LFV, stated that they did not consider their
financial risks to be significant.
MATS noted the importance of political instability in neighbouring states, 6.8
especially Libya where the imposition of the No-Fly zone resulted in a substantial
reduction in revenues. DFS, Avinor, LFV and NATS, all of which operate defined
benefit pension schemes, highlighted pension costs as another significant
contributor to risk.
CANSO also highlighted the level of fixed costs as a key risk for ANSPs. 6.9
NATS and Avinor both drew attention to the financial risk they incur through 6.10
financing themselves with debt. By contrast, MATS and LFV – which also rely
significantly on debt finance - both remarked that they did not consider their
financial risks to be significant.
As to the method used to quantify business risk faced by ANSPs, DFS and MATS 6.11
commented that the actual sources of business risk had not been quantitatively
measured. LFV provided details of its risk management procedure, which includes
assigning probabilities to types of risk as well as estimating their ‘economic
consequences.
Both the Polish and UK CAAs remarked that in future, ANSPs may benefit from 6.12
being supplied with a list of identified risks together with guidance on their likely
effect, if any, on the return on equity. By contrast, Transportstyrelsen’s view was
that current Eurocontrol Guidance is ‘quite exhaustive’.
For the most part, respondents generally did not indicate the extent to which their 6.13
comments applied to terminal as well as en-route services. Both NATS and the UK
CAA indicated that their answers related only to en-route charges, and the CAA
noted that it had “not yet considered what the systematic risk is contained in the
terminal business.”
Ownership and involvement of the State
Several ANSPs considered that they had conventional equity relationships with 6.14
government shareholders, with the government receiving dividends and potentially
benefiting from capital gains through ownership of some or all of the ASNP’s
shares. Similarly, Avinor described a typical debt relationship with the
government whereby it pays a variable interest rate on some government loans
and a fixed rate on others. Some ANSPs described themselves as being entirely
free of State financing. Additionally, MATS noted that it benefits from a
proportionally large shareholder loan from the government and leases certain
assets from it.
In the case of most ANSPs in the sample, the State is involved in the governance of 6.15
the organisation. For example, the state appoints the board of directors and sets
Final Report
65
dividend targets for MATS and Avinor, both of which are wholly government-
owned. DFS’s equity is also wholly government-owned, and the government is
represented on a supervisory board within the company. The Polish Ministry of
Transport’s relationship to PANSA, which has a special legal status, allows the
government to dispose of PANSA’s fixed assets or decide the amount of debt it may
take on. Similarly, LFV can be given special instructions from the government in
the form of state decrees.
Within the sample, NATS arguably has the most independence from the State, as 6.16
the UK government is a mere minority shareholder in NATS and only acts in that
capacity (although NATS is also subject to certification and economic regulation by
the UK CAA).
CANSO thought that private and public ANSPs face distinct risks. It said that 6.17
privatised ANSPs are generally subject to more risk due to having to ‘act in the
market (procurement, taxes, financing), whereas state-owned ANSPs’ stability is
tied to the stability of the state.
Comparator industries
Stakeholders were asked which companies and/or industries would serve as good 6.18
comparators to them for the purpose of estimating the cost of capital. They were
also asked which comparators they had actually used (if any) to establish their
WACC. ANSPs providing substantive answers to this question.
Stakeholders tended to consider the aviation industry and regulated utilities as the 6.19
most appropriate comparators for the purposes of estimating the cost of capital.
Avinor and LFV also suggested that comparisons between ANSPs could be useful.
MATS indicated that it had not used comparators to estimate its own cost of
capital, but suggested that ANSPs use “airlines and the tourism industry to some
extent”. Avinor used a weighted mix of airports (25%) and utilities (75%) to
estimate its asset beta. NATS provided supplementary material explaining that its
asset beta had been established by considering its risk relative to a number of
sectors including regulated airports and utilities (gas, electricity and water).
Transportstyrelsen remarked on the difficulty of deciding upon appropriate 6.20
comparators, noting that public bodies in Sweden had previously struggled with
the question. The UK CAA recommended that attempts to compare ANS with these
industries should take into account the different risk-sharing mechanisms in the
different industries, and remarked that some airports might make better
comparators to ANSPs than others. AESA indicated that the asset beta of Aena has
been compared to within the air navigation sector but also with other regulated
sectors such as energy.
Reasonable profitability
Several ANSPs articulated general principles that they considered should be 6.21
reflected in the method for calculating reasonable profitability. Avinor stressed
that all ANSPs should use a similar approach “to ensure a level playing field”.
HungaroControl asserted that whether the ANSP is state-owned or not was not a
relevant consideration.
Final Report
66
Several respondents made reference to the Capital Asset Pricing Model and/or the 6.22
formula for calculating the Weighted Average Cost of Capital when describing their
views on how reasonable profitability should be calculated.
NATS and DFS referred to supplementary material providing extensive details of 6.23
their method for calculating their own WACC for RP1. NATS’ method was unique
amongst ANSPs in that it used a real-term WACC and an inflation-indexed
regulatory asset base. DFS’ method was unique in that it involved use of an
original model for converting the estimated pensions deficit according to IFRS
standards into a difference estimate used to establish the ANSPs’ capital structure
for charging purposes. In referencing these materials, NATS and DFS were
presumably advocating for the continued use of these special methods to define
their own ‘reasonable profitability’.
The UK CAA articulated the principle of irrelevance of ownership, as well as noting 6.24
that ‘actual financial structure’ and ‘actual organisational structure’ were not
relevant to the calculation of an efficient cost of capital. It stated that the WACC
“should reflect the risks of the standalone ANSP”.
Two NSAs implied that reasonable profitability may differ for terminal versus en-6.25
route ANS provision. Transportstyrelsen remarked that while the level of risk
associated with en route ANS is probably small, for terminal ANS there is (in
Sweden) an additional threat of competition. The UK CAA also warned that it may
need to develop a somewhat different approach to asset valuation for terminal
ANS so that it could give appropriate treatment to intangible assets.
In similar remarks, Transportstyrelsen warned that the WACC multiplied by the 6.26
asset base may not serve as an appropriate calculation of reasonable profitability
in situations where ANSPs are not ‘capital intense organisations,’ but instead
reliant on use of facilities provided by other entities (for example airports).
The UK CAA opposed the imposition of a single approach to asset valuation across 6.27
states participating in the scheme if this meant changing the (RAB multiplied by
WACC) approach taken in the UK. This is because in the CAA’s view ‘changing
valuation of methodologies after investments has occurred can undermine
confidence in the regime and therefore put at risk future investment’ – with
particularly acute effects on ANSPs reliant on markets for their finance. Poland’s
CAA endorsed the position that a limited number of alternative approaches to
asset valuation would be ‘reasonable’.
The airspace users stated in emphatic terms that most ANSPs currently 6.28
overestimate their cost of capital. It was their view that ANSPs’ return on equity
should be close to the Member State’s government bond rate (except in
circumstances where that rate reflects a perceived nontrivial risk of government
default).
In addition, AEA/IATA/EBAA/ELFAA were concerned by the lack of a consistent 6.29
approach to calculating Cost of Capital and the way this creates uneven results
across Member States.
AEA/IATA/EBAA/ELFAA presented a number of concerns regarding the details of 6.30
ANSPs’ approaches to determining their Cost of Capital:
Final Report
67
I There is a lack of pressure on ANSPs to optimise their capital structure and
thereby reduce their Cost of Capital – many ANSPs are almost entirely equity-
financed and therefore do not benefit from the tax-deductibility of debt.
ANSPs may also be (wrongly) passing on the costs of their own financial
mismanagement (constituted by investors’ demands for high returns) through
the Cost of Capital.
I Some ANSPs’ calculation of their return on equity fails to take into account
their (low) level of gearing, inflating the return on equity.
I It was claimed that some ANSPs are erroneously including cash in their assets
employed, inflating the Cost of Capital.
I It was claimed that ‘at least one’ ANSP calculated its Cost of Capital by
multiplying its asset base – which was quantified using current cost accounting –
by a nominal WACC rather than a real WACC, erroneously inflating the Cost of
Capital.
I The fact that there is no clawback mechanism for Cost of Capital in the event
that planned capital expenditure does not materialise was seen as an
inadequacy of the current system.
AEA/IATA/EBAA/ELFAA also suggested that the actual profitability of ANSPs in 2012 6.31
– which in many cases exceeded the returns on equity that had been planned ex
ante, despite a substantial traffic downturn – implies that current cost-efficiency
targets are not challenging enough.
IACA also criticised the risk-sharing mechanism, stating that “a minimum of 95.6% 6.32
of the risk of traffic is supported by airspace users”. IACA also thought that
because of “adjustments in the current legislation”, the current system is still
“equivalent to the full cost recovery system”. The association also emphasized
that under the current framework ANSPs “are not incentivized to manage their
staff and pension costs in a cost-conscious manner as even the costs arising from a
strike (of a state-owned monopoly company) will be supported 100% by the
airlines”.
ATCEUC was opposed in principle to comparisons between ANSPs’ returns on 6.33
equity, especially the comparisons of individual ANSPs to PRB-selected peer groups
for RP1. Similarly, ETF were concerned that the Cost of Capital should fully
reflect the different contexts of ANSPs. ATCEUC pointed to the “different
inflation, different bond rate, different country risk, etc.” in different Member
States.
ATCEUC considered that on average, risk premia (in this context meaning the 6.34
difference between the risk-free rate and the return on equity) should be at least
double their current typical level (of 2.6%). One of the reasons given for this was
lack of confidence in the likely accuracy of STATFOR’s traffic forecasts.
Regulatory framework
User respondents expressed concern that NSAs do not have the expertise or 6.35
substantive independence to challenge ANSPs robustly on their Cost of Capital
calculations.
Final Report
68
IACA also suggested that States do not have a sufficient interest in reducing the 6.36
costs of their ANSPs when they own stakes in these organisations.
Staff group respondents commented that they did not see a need to change the 6.37
regulatory framework for Cost of Capital calculation, but asked for more guidance
on the appropriate assessment of business and financial risk. ETF claimed that the
risk-sharing mechanism had in fact increased the level of risk faced by ANSPs.
CANSO stated that cost of capital should ultimately be decided by ANSP owners 6.38
(although it recognised that airspace users should be consulted on these
decisions). It thought that the cost of capital may differ from state to state and
ANSP to ANSP, and should not be subject to detailed regulation at EU-level.
CANSO also drew attention to the fact that performance plans are submitted by
states, not ANSPs, and suggested more confidence should be placed in the work of
NSAs, in part due to the fact that they have access to more information than can
be presented in the performance plans.
CANSO was generally sceptical about the value of further guidance on cost of 6.39
capital being issued to ANSPs, although the organisation mentioned the possibility
of a range of asset betas being recommended. CANSO also articulated an
expectation that this study would specify an alternative method to CAPM for
calculating ANSPs’ cost of capital.
Application of CAPM
Some ANSPs noted that since their cost of equity was determined by government, 6.40
application of the CAPM was irrelevant to them. HungaroControl highlighted the
difficulty of applying this methodology to SES ANSPs, none of which are listed
entities, precluding the direct estimation of betas. It also considered that there is
no listed company with a similar risk profile. LFV and NATS supported continued
use of CAPM, however, given the rigour and transparency of the approach. DSNA
thought that the CAPM was the only relevant model to estimate the return on
equity of businesses, but DSNA noted that there were limits to its use. AESA
concurred and suggested that it is a reasonable methodology but thought that
difficulties lied in rightly quantifying hypotheses.
The UK CAA drew attention to the widespread prevalence of CAPM, at least in a ‘in 6.41
a simple form’ as a tool of regulators in the UK. Points were made about how to
use CAPM properly, including the fact that CAPM captures systematic risk (i.e. risk
that is inherent to the entire market segment and cannot be diversified away), and
that its point is to capture the risk of ANS relative to other industries (rather than
its absolute level of risk).
FAB
Most ANSPs remarked that the calculation of Cost of Capital would not be different 6.42
if looked at from a FAB perspective. NATS stated that it may potentially be
different. ANSP respondents did not explain the reasoning behind these views.
Transportstyrelsen and Poland’s CAA both remarked that at present they could not 6.43
see why calculating the Cost of Capital should be substantially different if done
from a FAB perspective. The UK CAA remarked that the Cost of Capital of a FAB
should be the weighted average Cost of Capital of its constituent ANSPs, where the
weights are the relative sizes of the ANSPs’ asset bases.
Final Report
69
Other issues
IACA thought that one of the two real issues on cost of capital was the “lack of 6.44
independence and very often of expertise of the National Supervisory Body”,
preventing NSAs of exercising their role of independent arbitrator and not allowing
them to manage conflicts of interests. IACA therefore proposed that the
assessment of the return on equity should be made by a fully independent body at
European level, stating that it would ensure a consultation process by opposition
to what it described as “information process” with an appeal mechanism.
Objectives of economic regulation
Much of the debate between stakeholders concerning the appropriate approach for 6.45
calculating the cost of capital arguably reflects differences in their underlying
view of what economic regulation is seeking to achieve. In our view, a robust
framework for the calculation should be based on explicit and transparent
objectives, recognising that principles of economic efficiency that underpin
methodologies such as CAPM may need to be balanced by other considerations.
Our suggested objectives are summarised below.
Economic efficiency
A key motivation behind price regulation such as the ANS Performance Regime is to 6.46
ensure regulated service providers are operated in a cost-efficient manner and
that their charges reflect the true economic costs of their activities. In order to
ensure an efficient cost of capital, the regulatory framework should be designed to
provide incentives to raise finance at the lowest possible cost, including combining
the use of various sources of debt and equity to reflect prevailing and expected
future rates.
To achieve cost-reflectiveness, the framework should allow a cost of capital that 6.47
reflects the nature and risk of the service provider’s operations, independently of
ownership. This means that it should be set based on the market rates that a
private operator undertaking the same activities would pay to raise finance. The
fact that some regulated service providers are able to obtain finance on
preferential terms from the government, or that it benefits from access to finance
on preferential terms because of a real or perceived government guarantee, does
not change the risks, or the economic costs of the risks associated with their
activities; it merely transfers this risk to the tax payer. The result is an effective
subsidy to the service providers’ users.
Comparing the way current charging regulations deal with the cost of equity and 6.48
cost of debt makes this principle clear. Publicly-owned ANSPs do not face an
actual cost of equity (as the government provides the equity for free), but the
charging regulations still require ANSPs to estimate the cost of raising equity in the
market and pass this on to users. There is no theoretical reason why the approach
to cost of debt should be different; just as for the cost of equity, the economically
efficient cost of debt is based on that of an independent entity raising debt in the
market – not on the actual rates ANSPs are paying.
Stability of charges
Changes in regulatory regimes, ownership arrangements or policy can mean that 6.49
charges to end-users change significantly over time. The regulatory framework

Final Report
70
may seek to limit such adjustments on the grounds that they may lead to
instability and make it more difficult for airspace users to plan. Significant
adjustments can also lead to a perception of significant regulatory risk. We note
that the Eurocontrol charging guidance explicitly seeks to minimise significant
year-to-year changes in air navigation charges.
Significant changes in the cost of capital from one period to the next can be 6.50
limited by providing for a more gradual change over time, for example by
introducing gradual adjustments to the asset base or time-limited fees or
compensations, or allowing a gradual transition between two different values of
the cost of capital.
Consistency of approach
Consistency of approach in the application of a regulatory framework is desirable 6.51
for several reasons. A uniform framework facilitates the issue of simpler guidance
and regulations and improves the regulator’s ability to ensure compliance.
Importantly, consistency of approach also facilitates performance monitoring, as
key measures can be more directly compared across regulated entities.
Furthermore, conformity enables regulated organisations to pool research in
investigating or addressing common challenges or opportunities.
The key initial challenge to achieve consistency of approach to the estimation of 6.52
the cost of capital among the ANSPs is to ensure common understanding and
adherence to issued regulations. This may involve a revision to such regulations or
increased efforts to ensure compliance.
Transparency
Transparency in the design and application of a regulatory framework similarly 6.53
facilitates enforcement of regulations and compliance. It also supports the
achievement of the other objectives described here, not least because it helps to
improve understanding among the regulated entities.
Credibility
The success of a regulatory framework relies fundamentally on its acceptance 6.54
among affected parties. This means taking into account the interests of the
regulated entities, the regulator, users, investors and lenders, the States and the
general public. Such interests may include:
I The need to achieve regulatory objectives;
I The requirement of the regulated service provider for a stable environment in
which to plan and execute its activities and sufficient allowance to enable it to
raise capital;
I The right of users to fair and predictable charges;
I The desire of governments to ensure consistent and reliable service; and
I The interest of the travelling and general public in an efficient provision of
services.
All other objectives notwithstanding, pragmatism is therefore often needed to 6.55
ensure the credibility and acceptability of a regulatory framework.
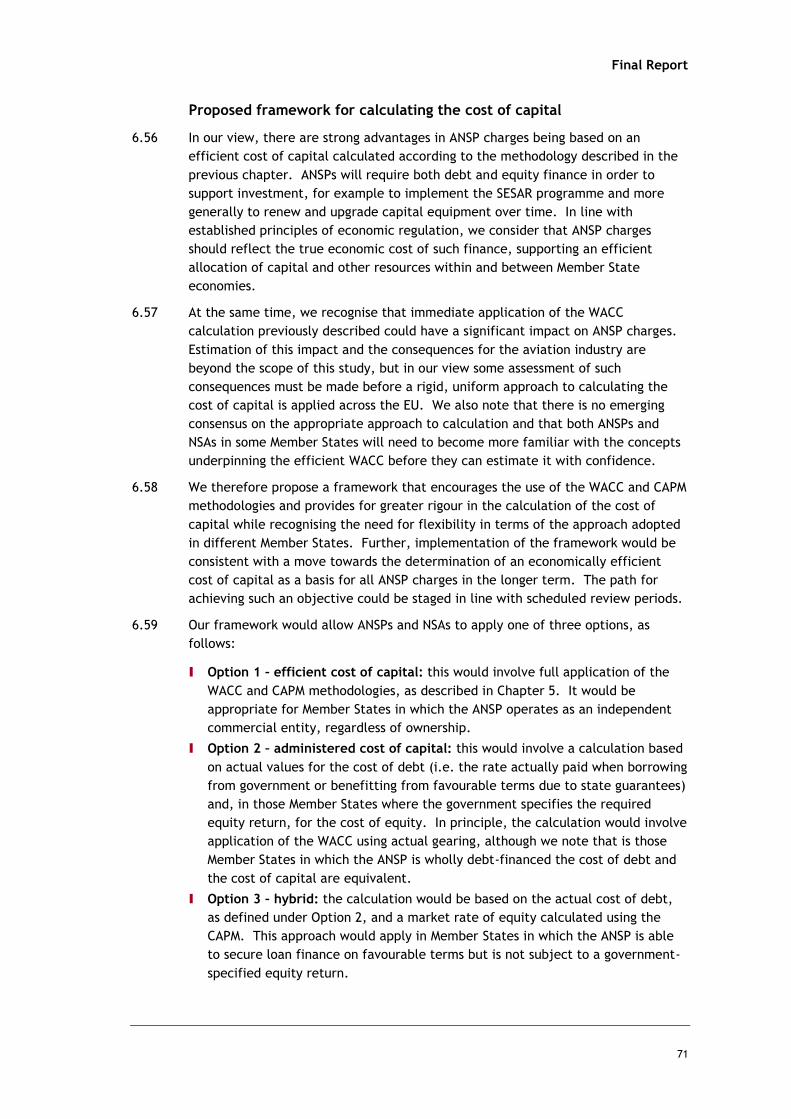
Final Report
71
Proposed framework for calculating the cost of capital
In our view, there are strong advantages in ANSP charges being based on an 6.56
efficient cost of capital calculated according to the methodology described in the
previous chapter. ANSPs will require both debt and equity finance in order to
support investment, for example to implement the SESAR programme and more
generally to renew and upgrade capital equipment over time. In line with
established principles of economic regulation, we consider that ANSP charges
should reflect the true economic cost of such finance, supporting an efficient
allocation of capital and other resources within and between Member State
economies.
At the same time, we recognise that immediate application of the WACC 6.57
calculation previously described could have a significant impact on ANSP charges.
Estimation of this impact and the consequences for the aviation industry are
beyond the scope of this study, but in our view some assessment of such
consequences must be made before a rigid, uniform approach to calculating the
cost of capital is applied across the EU. We also note that there is no emerging
consensus on the appropriate approach to calculation and that both ANSPs and
NSAs in some Member States will need to become more familiar with the concepts
underpinning the efficient WACC before they can estimate it with confidence.
We therefore propose a framework that encourages the use of the WACC and CAPM 6.58
methodologies and provides for greater rigour in the calculation of the cost of
capital while recognising the need for flexibility in terms of the approach adopted
in different Member States. Further, implementation of the framework would be
consistent with a move towards the determination of an economically efficient
cost of capital as a basis for all ANSP charges in the longer term. The path for
achieving such an objective could be staged in line with scheduled review periods.
Our framework would allow ANSPs and NSAs to apply one of three options, as 6.59
follows:
I Option 1 – efficient cost of capital: this would involve full application of the
WACC and CAPM methodologies, as described in Chapter 5. It would be
appropriate for Member States in which the ANSP operates as an independent
commercial entity, regardless of ownership.
I Option 2 – administered cost of capital: this would involve a calculation based
on actual values for the cost of debt (i.e. the rate actually paid when borrowing
from government or benefitting from favourable terms due to state guarantees)
and, in those Member States where the government specifies the required
equity return, for the cost of equity. In principle, the calculation would involve
application of the WACC using actual gearing, although we note that is those
Member States in which the ANSP is wholly debt-financed the cost of debt and
the cost of capital are equivalent.
I Option 3 – hybrid: the calculation would be based on the actual cost of debt,
as defined under Option 2, and a market rate of equity calculated using the
CAPM. This approach would apply in Member States in which the ANSP is able
to secure loan finance on favourable terms but is not subject to a government-
specified equity return.
Final Report
72
ANSPs and NSAs would be required to adopt one of these options and apply it 6.60
consistently. They would also be required to provide a justification, based on the
specific circumstances in which the ANSP was funded. For example, an ANSP
adopting Option 2 would be required to confirm that returns on government equity
are specified as a matter of policy and that consequently application of the CAPM
was not appropriate. Moreover, within this framework Option 1 would set a ceiling
for the cost of capital, with ANSPs adopting either of the other two options
required to demonstrate that the resulting value did not exceed that calculated
under Option 1. The relationship between the options is shown in the figure
below.
FIGURE 6.1 OPTIONS FOR CALCULATING THE COST OF CAPITAL
Source: Steer Davies Gleave analysis
We also propose that application of each of the options is subject to a number of 6.61
other parameters and constraints intended to ensure rigour and transparency in
calculation. These are described below.
Option 1 – efficient cost of capital
We would expect option1 to be adopted in Member States in which the ANSP 6.62
operates on a commercial basis and independently of government. We suggest
that in performing the calculation, ANSPs and NSAs are subject to the following
guidance.
Risk free rate
In periods of financial stability, yields on a Member State’s government bonds 6.63
should be used as a proxy for the risk free rate as they incorporate both time
preference and country specific inflation expectations. If a Member State is
experiencing financial difficulties, we propose basing the risk free rate on ECB
bonds yields, with an adjustment to take account of the difference in domestic
and Eurozone inflation forecasts.
In practice, there is a case for estimating risk free rates using both approaches, as 6.64
comparing the two provides a useful indication of whether the market has
concerns about default. If the results are broadly similar, the domestic yields
Final Report
73
should be used. If domestic yields are significantly higher than those estimated
based on ECB bonds, the latter should be used.
Equity risk premium
In Chapter 5, we described three different approaches to estimating the equity 6.65
risk premium (as applied by Dimson-Marsh-Staunton (DMS), Damodaran and
Fernandez-IESE Business School). We suggest that estimates of equity risk
premiums should be obtained using all three approaches where possible. The
adopted value should be based on a judgement reflecting the specific situation for
each country, but in general an average of the available estimates is likely to be
appropriate. Obvious outlier values should, however, be disregarded in the
calculation of the average.
Asset and equity beta values
Based on the comparison of ANSPs with other regulated industries in Chapter 5, we 6.66
consider that an appropriate value for the asset beta is between 0.3 and 0.5.
Before applying the CAPM, the asset beta must be converted into an equity beta
using information on gearing and tax rates. For the calculation of the efficient
cost of capital, the estimated optimal gearing should be used (see below) and not
the ANSP’s actual level of gearing. This will ensure that the resulting cost of
equity is consistent with the minimum WACC of an organisation raising finance in
the market.
Cost of debt
The cost of debt finance reflects the risk free rate plus a risk premium to 6.67
compensate lenders for the risks they are bearing, such as default risk, liquidity
risk, currency risk, downgrade risk and reinvestment risk. The premium rises with
the share of debt in total capital (i.e. with leverage) and is also dependent on an
entity’s credit rating. The economically efficient cost of debt can be estimated
based on average yields on corporate bonds – either bonds issued by the same
entity or by those with similar characteristics.
Some corporate debt risks are country specific (liquidity risk, currency risk), while 6.68
others are company specific (default risk, reinvestment risk). The cost of debt
should therefore be estimated based on average yields on corporate bonds issued
in the same country by an entity with similar leverage and a similar credit rating.
If no domestic comparators exist, the cost of debt should be calculated based on
yields on bonds in other countries issued by similar entities, corrected for country
specific differences.
In the case of ANSPs that have issued bonds and are considered to be optimally 6.69
geared, the cost of debt should be estimated according to average bond yields.
Otherwise, it should be estimated based on average yields on bonds issued by
other entities in the same country with broadly similar credit ratings to the ANSP.
In the case of an unrated ANSP, a synthetic rating can be estimated by comparing
the ANSP’s interest coverage ratio (EBIT/ interest expenses) with that of rated
entities in the same market.
In the event that there is no sufficiently liquid domestic bond market in the 6.70
relevant Member State, the cost of debt should be estimated based on that of
similar entities in another, similar country. To correct for country specific factors,

Final Report
74
the debt risk premium for the comparator entities should be calculated as the
difference between their cost of debt and their country’s risk free rate. The
resulting debt risk premium is then added to the domestic risk free rate to obtain
an estimate of the ANSP’s market cost of debt.
Debt beta values
Debt beta values measure the correlation between the variation on yields on bonds 6.71
issued by a company and that of a market portfolio of securities. However,
variations on bond yields are typically very small compared to fluctuations in
equities, and the debt beta is therefore often assumed to be zero. A Europe
Economics report published in 2010 considered a selection of entities and their
asset betas for different values of the debt beta and, in light of the wide range of
asset betas in use even within the same industry, concluded that the difference
introduced by a debt beta appeared to be small in comparison. We therefore
suggest that the debt beta value is assumed to be zero for the purposes of the
calculation.
Capital structure
As explained previously, ANSPs generally require both debt and equity finance in 6.72
order to support investments. Raising debt can be a cost-efficient way of raising
finance – as recognised by most ANSPs, who have taken on significant debt in the
past - as interest rates are typically significantly lower than the cost of equity
(everything being equal, debt holders rank before equity holders, so in normal
circumstances, it is reasonable to assume a lower return on debt than on equity).
This is also reinforced by tax benefits, as corporation tax is paid on earnings after
interest. However, increased gearing also increases financial risk11, as the
proportion of an entity’s revenues that are committed to the repayment of debt
becomes higher. At higher levels of gearing, the probability of bankruptcy may be
a significant concern and lenders may demand higher interest.
As a result, at low levels of gearing the effect of the lower cost of debt outweighs 6.73
the increasing cost of equity and increasing gearing reduces the WACC. But at a
certain point, growing financial risk means that increasing gearing further
increases the WACC. The figure below illustrates how the cost of debt (kd), cost
of equity (ke) and WACC (kO) may change with the level of gearing. The optimal
level of gearing is the one that minimises the WACC, as represented by point X in
the diagram. Note, however, that this effect, which is a feature of commercial
entities obtaining finance in the market, may be substantially reduced or even
eliminated where an entity benefits from a State guarantee. For example, it may
secure debt finance at relatively low rates of interest even if it is fully geared if
the debt is underwritten by the State. This would effectively eliminate financial
risk, although it would not eliminate the underlying risk associated with the
activity (e.g. investment in ANSP capacity that was not subsequently justified by
the volume of air traffic).
11 As discussed in Chapter 3, financial risks result purely from the financial structure of an entity and not from the
market or the activities undertaken by that entity.

Final Report
75
FIGURE 6.2 RELATIONSHIP BETWEEN COST OF CAPITAL AND GEARING
Source: Kaplan Financial Knowledge bank
The gearing used in the calculation of ANSPs’ efficient cost of capital should be 6.74
based on an assessment of the optimal level of gearing rather than actual
leverage. This ensures that the allowed cost of capital reflects true market cost of
finance for ANSPs. We suggest using two alternative approaches to estimating
ANSPs’ optimal gearing.
It is reasonable to expect that private, profit maximising organisations strive to 6.75
achieve optimal gearing in order to minimise their WACC. One view on the optimal
gearing for ANSPs would therefore be the actual gearing of privately-owned
organisations with broadly similar operating characteristics to ANSPs. These may
include other regulated entities (including ANSPs) as long as they are subject to a
regulatory framework that incentivises optimal gearing.
Alternatively, if an ANSP’s asset beta is known, an indication of optimal gearing 6.76
can be estimated using a ‘full form’ WACC equation (where the cost of equity is
represented by a CAPM equation modified to include the asset rather than equity
beta). By trial and error it is possible to find the level of gearing that produces
the lowest WACC. Since this approach does not take into account the potential
impact on the cost of debt at high levels of gearing, additional analysis of the
ANSP’s financial condition under different levels of gearing should be undertaken
(e.g. by estimating the impact of different gearing levels on the interest coverage
ratio and assessing whether the optimal gearing level is likely to imply a lower
credit rating).
If possible, both approaches should be used to determine the gearing used in the 6.77
calculation of the cost of capital. The first approach can be used to provide a
useful cross-check on the second, although the latter is arguably more robust.

Final Report
76
Options 2 and 3 – administered cost of capital and hybrid approach
ANSPs and NSAs adopting options 2 or 3 should ensure that they are applied 6.78
transparently. In particular, they should:
I Provide clear evidence that rates and other parameter values are appropriate,
for example through reference to published government borrowing rates or
required equity returns, and provide information on supporting policy decisions
as appropriate; and
I In the case of option 3, apply the CAPM in accordance with the guidance
described above in relation to option 1.
In addition, we propose that a cost of capital calculated using either of these 6.79
options be subject to the following constraints:
I The calculated WACC and each of its components must not be higher than the
corresponding market-based values;
I The calculated WACC and each of its components must not be lower than the
long term cost of government borrowing in the Member State concerned; and
I An ANSP benefitting from equity that is subject to a government-specified
return that is lower than the value implied by the CAPM must apply the
specified rate rather than a market-based rate in the calculation of the WACC.
These constraints are intended to ensure that WACC values are contained within 6.80
an appropriate range, and that where a Member State government has specified a
favourable equity rate of return airspace users benefit from the resulting lower
cost of capital. However, they should be reviewed as part of any transition
towards the universal calculation of an efficient cost of capital over the longer
term.
Illustration of the application of options
In the table below, we compare the cost of capital calculated under different 6.81
options with the values reported in the RP1 performance plans for selected ANSPs.
We have calculated:
I The efficient cost of capital for all four ANSPs in order to demonstrate
differences with reported values;
I The administered cost of capital for LFV, which benefits from both subsidised
borrowing rates and a government specified return on equity; and
I Hybrid rates for the other ANSPs, none of which benefits from specified equity
returns but all of which reported a cost of debt differing from market rates.
The calculations have been prepared for the purpose of illustration and the results 6.82
are not intended to represent firm estimates of the cost of capital for the ANSPs
included in the table. In particular, we note that:
I We have assumed optimal gearing of 60%, which is based on the estimated
efficient value for NATS and may not be appropriate in all cases; and
I The assumed value of the debt risk premium of 1.5% applied in each case may
also vary between ANSPs according to conditions in their respective Member
States’ bond markets.

Final Report
77
I We have assumed an asset beta of 0.4 and a debt beta of 0.1 for optimally-
geared ANSPs.
For NERL and Avinor, the impact of applying the economic efficiency approach is 6.83
to create a lower estimate of the pre-tax WACC than was adopted in the ANSPs’
national performance plans. Most of the difference can be attributed to a lower
estimated return on equity, which is in turn largely due to use of a smaller equity
beta. In addition, although Avinor already makes use of an optimised capital
structure, according to the economic efficiency approach Avinor’s cost of debt
ought to be lower than was claimed for RP1.
The hybrid approach allows Avinor and NERL a higher cost of debt. In NERL’s case, 6.84
this makes little difference, because the difference between the economically
efficiency cost of debt and the reported cost of debt is minimal. But in Avinor’s
case it leads to a significantly higher pre-tax WACC.
The economic efficiency approach also recommends a higher WACC for DSNA. This 6.85
is primarily due to the fact that DSNA appears to benefit from subsidised debt;
despite its high gearing it is able to borrow at below the risk-free rate.
The hybrid allows this high level of borrowing at subsidised rates. However, the 6.86
subsidy is capped at a level where the cost of debt is equal to the risk-free rate.
The hybrid approach allows the higher-than-optimum level of gearing adopted by
DSNA but allows its owners a higher return on equity to compensate for this. The
overall result is a pre-tax WACC somewhere between the economically efficient
recommendation and the reported value for RP1.
Similar comments apply to LFV as to DSNA, but the contrast between the three 6.87
approaches is more marked. Like DSNA, LFV benefits from a high level of
borrowing at subsidised rates; this is not permitted according to the economic
efficiency approach, and it is only allowed to a certain extent by the hybrid
approach. Furthermore, the return on equity reported for RP1 was significantly
lower than the economically efficiency approach suggests should have been
adopted. Due to the fact that this return on equity is required by government as a
matter of policy, the hybrid approach permits its use, which creates a large gap
between the hybrid and economically efficient approaches.

Final Report
78
TABLE 6.1 COMPARISON OF ANSP COST OF CAPITAL UNDER FRAMEWORK OPTIONS
Inflation
expectation Gearing Tax
Risk free
rate
Equity risk
premium
Equity
beta
Cost of
equity
(post-tax)
Cost of
equity
(pre-tax)
Debt risk
premium
Cost of
debt
(pre-tax)
WACC
(pre-tax)
NERL
Reported 2.8% 60% 27% 4.6% 5.4% 1.35 11.9% 15.2% 1.9% 6.5% 10.0%
Efficient 2.8% 60% 27% 4.6% 5.75% 0.73 8.8% 12.0% 1.5% 6.1% 8.5%
Hybrid 2.8% 60% 27% 4.6% 5.75% 0.73 8.8% 12.0% 1.9% 6.5% 8.7%
DSNA
Reported 1.75% 73% 0% 3.6% 4.5% 0.97 8.0% 8.0% -0.3% 3.3% 4.6%
Efficient 1.75% 60% 0% 3.5% 5.75% 0.85 8.4% 8.4% 1.5% 5.1% 6.4%
Hybrid 1.75% 73% 0% 3.5% 5.75% 1.21 10.5% 10.5% 0.0% 3.5% 5.4%
Avinor
Reported 1.4% 60% 28% 2.8% 5.5% 0.93 7.9% 11.0% 2.6% 5.4% 7.6%
Efficient 1.4% 60% 28% 3.2% 5.75% 0.72 7.3% 10.2% 1.5% 4.7% 6.9%
Hybrid 1.4% 60% 28% 3.2% 5.75% 0.72 7.3% 10.2% 2.2% 5.4% 7.3%
LFV
Reported 2.2% 84% 26% 3.2% 4.0% 5.4% -3.2% 0.0% 0.9%
Efficient 2.2% 60% 26% 4.0% 6.00% 0.73 8.4% 11.4% 1.5% 5.5% 7.9%
Administered 2.2% 84% 26% 4.0% 4.0% 5.4% 0.0% 4.0% 4.2%
Final Report
79
Application of the framework to terminal and approach charges
Terminal air navigation services are most often provided by the same monopoly 6.88
supplier as en-route services. As discussed in Chapter 3, there is competition
between different organisations for the right to operate the service at some
airports in a small number of Member States.
A number of arguments have been put forward by the industry in support of the 6.89
case for differences in the cost of capital applicable for Terminal air navigation
and En-route air navigation, including:
I In some States Terminal services are subject to competition for the market, as
noted above, and the cost of capital should reflect the need for a commercial
return;
I Traffic risks for Terminal services (the number of flights) are more localised,
reflecting local economic conditions, as compared to en-route service risks,
which are determined by a wider range of economic considerations; and
I Payments made by airports to ANSPs are sometimes only partially related to
volumes and involve a fixed element of payment, again affecting the risk
profile.
However, a number of ANSPs do not operationally distinguish between some 6.90
elements of En-route and Terminal services, which are often provided through
joint use of infrastructure, systems and corporate functions.
Under the UK economic regulatory framework applied in 2011, there were 6.91
separate regulatory price controls for the oceanic and en-route businesses. The
UK CAA considered that although there were probably slight differences in the
risks facing both businesses, the basis for distinguishing these differences would be
subject to a margin of error and therefore decided to apply the same cost of
capital in setting both price controls.
On balance, we consider that the same framework approach to assessing 6.92
reasonable level of profitability for en-route services is applicable to terminal air
navigation as in most States they are operated by the same organisation and
subject to similar risks.
Functional Airspace Blocks
Progress towards the implementation of FABS is discussed in Chapter 3. To date, 6.93
only one FAB (Denmark-Sweden) has submitted a joint performance plan with
individual Reporting Tables for charging purposes for each participating ANSP.
Meetings with stakeholders have also indicated that in other FABs discussion and
exchange of financial information is only in its infancy. Given this lack of financial
integration, we have not developed the calculation of the cost of capital for a FAB.
However, we are confident that it will be possible to perform such a calculation
once the required level of integration has been achieved.
One option that could be implemented relatively easily, suggested by the UK CAA, 6.94
would be to calculate a weighted average of the WACCs for each of the ANSPs
participating in a FAB, using their respective asset values as weights. In principle,
this would allow some comparison of the cost of capital across FABs prior to their
achieving financial integration. However, we note that the resulting values would

Final Report
80
be difficult to interpret given the different approaches to the valuation of assets
and different accounting policies applied in different Member States.
Overview of key findings on the cost of capital
Our key findings can be summarised as follows: 6.95
I There are important differences in the approach to estimating WACCs applied
by different ANSPs, resulting from:
Different methods for determining key rates of return (application of CAPM
versus use of government-determined rates);
Different assumptions about key parameter values (e.g. beta values and the
risk free rate); and
Inconsistencies and anomalies in the use of component values (e.g. a value
for the cost of debt lower that is lower than the risk free rate).
I There are also important differences in the approach to financing ANSPs’
activities, particularly in respect of:
Gearing;
Reliance on market versus government finance.
I The estimation of WACC elements is also affected by distortions resulting from
the financial crisis, not least changes in government bond rates in countries
experiencing serious financial difficulties;
I The most significant industry risk is to revenue through variation in demand
from forecast. The potential for cost variations also introduces some risk.
Other factors make little or no contribution to overall risk;
I ANSPs face a risk profile broadly similar to that faced by regulated utilities such
as gas and electricity transmission and distribution and water given that:
They do not face significant competition; and
They are likely to benefit from implicit or explicit state guarantees given
the strategic importance of the service.
I ANSPs are subject to different profit margins and levels of operational gearing
than other regulated industries, but revenue risk is anyway substantially
mitigated by the SES revenue risk sharing mechanism;
I Based on a comparison of ANSPs with entities in other regulated industries, we
conclude that underlying ANSP risk (after abstracting from financial risk
introduced by gearing) can be represented by an asset beta in the range 0.3 to
0.5.
Recommendations
Our recommendations for a framework for calculating the reasonable profitability 6.96
of ANSPs are as follows:
I The industry should move towards the calculation of an efficient cost of capital
over the long term, since this will ensure cost reflective charges and align with
the broad objective of economic regulation in other sectors to encourage an
efficient allocation of resources across the economy;
Final Report
81
I However, in view of the potential and unknown impact on charges in the short
term, and the lack of industry consensus on the appropriate basis for
determining reasonable profitability, the framework of calculation should allow
greater flexibility for at least the next Review Period;
I The framework should allow calculation of the cost of capital according to any
one of three options:
Option 1: an efficient cost of capital calculated on the assumption that the
ANSP is an independent, commercial entity;
Option 2: an administered cost of capital, based on the cost of debt and
equity available to the ANSP, for example through borrowing from
government or as a result of government-specified equity returns; and
Option 3: a hybrid approach, combining the administered cost of debt with a
return on equity calculated according to the CAPM.
I Application of option 1 would require the following:
The cost of equity to be calculated using the CAPM;
The cost of debt should be estimated by reference to market borrowing
rates;
The assumed gearing should be the optimal level rather than the level
actually prevailing when the calculation is made;
The assumed risk free rate should be set by reference to government bond
yields providing financial markets are relatively stable, and by reference to
an appropriate comparator such as ECB bond rates otherwise;
The asset beta should be within a recommended range of 0.3 to 0.5 unless
the ANSP is able to justify a value outside the range; and
All components of the calculation should be identified transparently and
justified.
I In applying options 2 and 3, ANSPs should be free to use rates that are different
from those in the market providing these reflect rates that are available to
them as a result of a transparent policy decision. In addition:
In the event that an ANSP chooses the hybrid option, the return on equity
must be calculated using the CAPM and in accordance with the relevant
guidance provided under option 1;
The resulting cost of capital should not exceed an efficient value calculated
under option 1;
The resulting cost of capital should not be below the long term government
borrowing rate in the relevant State;
Where an ANSP benefits from equity that is subject to a government
specified return, the specified return rather than a value based on CAPM
should be used; and
Again, all components of the calculation should be identified transparently
and justified.
I The approach to the calculation of en-route charges should be similarly applied
in the case of terminal charges.
Final Report
82
7 PART B: Pension costs and application of IFRS
Introduction
In this chapter we discuss the different pension systems in place across EU ANSPs, 7.1
and review the content of Eurocontrol guidance for route charges and accounting
standards, in particular International Accounting Standard (IAS 19). We then go on
to provide our findings and recommendations for amendments to guidance and an
approach to assessing pensions cost in RP2 Performance Plans.
Principles as per Single European Sky Regulation
According to Article 7 of the revised charging Regulation, determined costs shall 7.2
be broken down into staff costs, operating costs, depreciation costs, cost of
capital and exceptional items. The “staff costs” category is further defined in
Article 7 as follows:
“Staff costs shall include gross remuneration, payments for overtime, employers’
contributions to social security schemes as well as pension costs and other
benefits. Pension costs may be calculated using prudent assumptions according to
the governance of the scheme or to national law, as appropriate. Those
assumptions shall be detailed in the performance plan.”
In addition, costs exempt from risk sharing, which lie outside cost risk sharing 7.3
arrangements are allowed for through in Article 14 (2)a:
“Costs exempt from the application of paragraphs 1(a) and 1(b):
(a) The cost-sharing arrangements in paragraphs 1(a) and 1(b) shall not apply to
the difference between determined costs and actual costs with regard to cost
items for which the air navigation service provider, Member State or qualified
entities concerned have taken reasonable and identifiable steps to manage but
which may be deemed to be outside their control as a result of:
(i) unforeseen changes in national pensions law, pension accounting law or pension
costs resulting from unforeseen financial market conditions;
(ii) significant changes in interest rates on loans, which finance costs arising from
the provision of air navigation services;
(iii) unforeseen new cost items not covered in the performance plan, but required
by law;
(iv) unforeseen changes in national taxation law;
(v) unforeseen changes in costs or revenues stemming from international
agreements.”
Furthermore, Eurocontrol, which bills and collects charges on behalf of Member 7.4
States, has developed guidance material on its Route Charges System, which is
consistent with the revised charging Regulation. As far as pensions are concerned,
this guidance material (the Eurocontrol Guidance on the Route Charges System,
edition June 2012) states (p.61): “good judgment has to be used to decide
whether the IFRS compliant accounts figures should apply fully and where these

Final Report
83
may need to be adjusted based on the fairness and appropriateness within the
context of the cost base calculations”.
The provision of pensions can provide ANSPs with significant future liabilities which 7.5
can be subject to a variety of market forces such as the financial performance of
any pension plan, inflation and interest rates together with social dynamics such as
the life expectancy of current and future retirees.
Accounting regulation IAS 19 requires that changes in liabilities must be shown in 7.6
the organisations’ financial statements, with the profit and loss account being
used to record movements in the liability between periods.
Pension systems in Europe
There is a significant degree of heterogeneity of pension systems in use in States 7.7
across Europe and across the European ANSPs. Pension systems usually include two
components: public (or State) and private pensions. Therefore when looking at
pension arrangements of particular ANSPs it is important to understand the pension
system in use in the State in question and then turn to particular pension
arrangements of the ANSP.
State and private pension systems
Private pensions can be designed as occupational pensions or personal pensions. 7.8
Occupational pensions are also known as “company pensions”. Financial
management is sometimes retained by the company (“the sponsor”) but most
often delegated to a pension fund or financial institution. Most ANSPs across
Europe in States with a private pension system offer occupational pensions.
Personal pensions, on the other hand, do not have a link to an employer, even
though the employer may make contributions to them. Management of the plan is
the responsibility of the individual, who usually delegates it to a pension fund or
financial institution.
Both public and private pension plans can be classified as “Defined Benefits (DB)” 7.9
or “Defined Contributions (DC)”.
Defined benefits plans
Defined Benefits plans guarantee a certain pay-out at retirement according to a 7.10
formula typically related to the length of employment and employee earnings.
Entities operating defined benefit pension plans bear the risk for ensuring that the
accumulated value of the pension plan is sufficient to cover the liability the
company has to existing and future retirees. The value of the pension plan assets
is dependent on stock and bond market conditions and the forecast economic
returns of the invested asset whilst the value of the liability is determined by
actuaries and is influenced by factors such as the forecast life expectancy of
current and future retirees and average salary increases of current employees.
Defined contribution plans
With a Defined Contribution plan, the payments made into the plan are specified, 7.11
but the benefits depend on the performance of the investments comprising the
pension fund. Investment risk and investment rewards are therefore assumed by
each member and not by the sponsor.

Final Report
84
In a defined contribution plan, pension contributions are paid into an individual 7.12
account for each member. The contributions are invested, for example in the
stock market, and the returns on the investment (which may be positive or
negative) are credited to the individual's account. On retirement, the member's
account is used to provide retirement benefits, sometimes through the purchase of
an annuity which then provides a regular income.
A significant proportion of ANSPs across Europe still offer Defined Benefits to their 7.13
staff but there has been a gradual shift in some States towards Defined
Contribution schemes, particularly for new joiners.
Hybrid plans
Hybrid plans combine features of defined benefit and defined contribution plans. 7.14
There is a wide-variety of hybrid plans. We list below some that we have found
through a review of pension literature. We have also found some advice from the
UK Pensions Regulator as to how each hybrid plan should be treated, but this does
not cover every hybrid scheme in existence.
TABLE 7.1 HYBRID PENSION SCHEMES
Type Description Treat as According to
Self-
annuitising
Benefits accrue on a DC scheme but the
pension is paid by the scheme, rather
than each member’s pot being used to
buy their pension.
Treat as a DC
scheme
UK Pensions
Regulator
Combination Both DB and DC benefits accrue at the
same time.
Treat each
section as a
separate
scheme
UK Pensions
Regulator
Sequential
Both DB and DC benefits accrue in the
scheme but not at the same time: for
instance members start in the DC
section and move into the DB section
after a specified number of years.
Treat each
section as a
separate
scheme
UK Pensions
Regulator
DB or DC
entitlement
DB scheme with a DC underpin, e.g. a
scheme that will pay a member the
better of their DB or DC benefit.
Treat each
section as a
separate
scheme
SDG
assumption
DC scheme
with
Guaranteed
Minimum
Payment
underpin
DC scheme with Guaranteed Minimum
Payment underpin. NA NA
DB
entitlement
with DC
Additional
Voluntary
Treat each section as a separate
scheme.
Treat each
section as a
separate
scheme
SDG
assumption
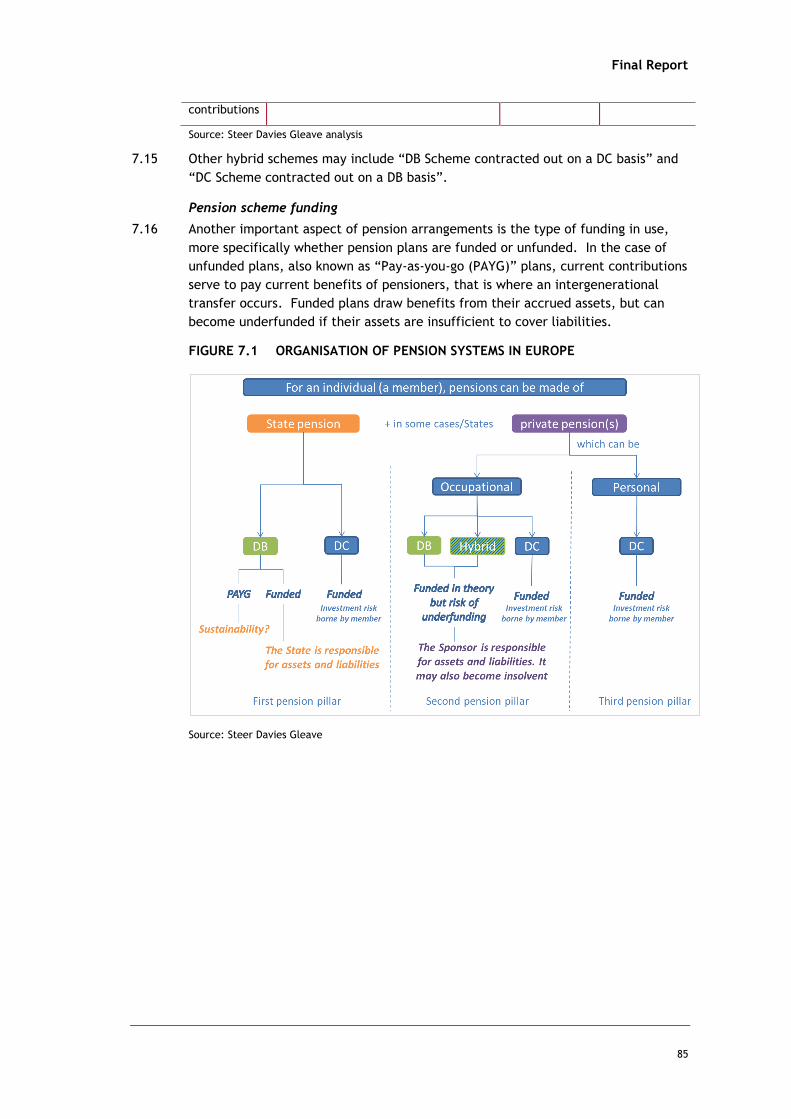
Final Report
85
contributions
Source: Steer Davies Gleave analysis
Other hybrid schemes may include “DB Scheme contracted out on a DC basis” and 7.15
“DC Scheme contracted out on a DB basis”.
Pension scheme funding
Another important aspect of pension arrangements is the type of funding in use, 7.16
more specifically whether pension plans are funded or unfunded. In the case of
unfunded plans, also known as “Pay-as-you-go (PAYG)” plans, current contributions
serve to pay current benefits of pensioners, that is where an intergenerational
transfer occurs. Funded plans draw benefits from their accrued assets, but can
become underfunded if their assets are insufficient to cover liabilities.
FIGURE 7.1 ORGANISATION OF PENSION SYSTEMS IN EUROPE
Source: Steer Davies Gleave
Final Report
86
Application of IAS/IFRS accounting rules
General principles
IAS 19 outlines the accounting requirements for employee benefits, including 7.17
short-term benefits (e.g. wages and salaries, annual leave), post-employment
benefits such as retirement benefits, other long-term benefits (e.g. long service
leave) and termination benefits. The standard establishes the principle that the
cost of providing employee benefits should be recognised in the period in which
the benefit is earned by the employee, rather than when it is paid or payable.
IAS 19 has been in use since 1999, but its latest amendments are applicable to 7.18
annual periods from 1 January 2013. The amendments are part of a longer term
objective to improve the accounting in this area. Accounting for employee
benefits was included in the Memorandum of Understanding between the
International Accounting Standard Board (IASB) which is the independent,
accounting standard-setting body of the IFRS Foundation and the Federal
Accounting Standards Board. There will still be significant differences, but some
of the changes further align IFRS and US General Accepted Accounting Practices
(US GAAP).
For defined benefit schemes, IAS 19 requires that “the amount recognised in the 7.19
balance sheet should be the present value of the defined benefit obligation (that
is, the present value of expected future payments required to settle the
obligation resulting from employee service in the current and prior periods), as
adjusted for unrecognised actuarial gains and losses and unrecognised past service
cost, and reduced by the fair value of plan assets at the balance sheet date”.
IAS 19 accounting rules for defined contribution schemes are more straightforward 7.20
because the reporting entity’s obligation for each period is determined by the
amounts to be contributed for that period. Consequently, no actuarial
assumptions are required to measure the obligation or the expense and there is no
possibility of any actuarial gain or loss.
Defined Benefits pension plans accounting requirements
Accounting for defined benefit plans is complex because actuarial assumptions and 7.21
valuation methods are required to measure the balance sheet obligation and the
expense. The expense recognised generally differs from the contributions made in
the period.
Subject to certain conditions, the amount recognised on the balance sheet is the 7.22
difference between the defined benefit obligation (liabilities) and the plan assets.
To calculate the defined benefit obligation, estimates (actuarial assumptions)
regarding demographic variables (such as employee turnover and mortality) and
financial variables (such as future increases in salaries and medical costs) are
made and included in a valuation model. The resulting benefit obligation is then
discounted to present value. This normally requires the expertise of an actuary.
Where defined benefit plans are funded, the plan assets are measured at fair 7.23
value. Where no market price is available, the fair value of plan assets is
estimated, for example, by discounting expected future cash flows using a
discount rate that reflects both the risk associated with the plan assets and the
maturity of those assets. Plan assets are tightly defined, and only assets that
Final Report
87
meet a strict definition may be offset against the plan's defined benefit
obligations, resulting in a net surplus or deficit that is shown on the balance sheet.
At each balance sheet date the plan assets and the defined benefit obligation are 7.24
re-measured. The income statement reflects the change in the surplus or deficit
except for the following:
I Contributions to the plan and benefits paid by the plan; and
I Business combinations and re-measurement of gains and losses. (Re-
measurement gains and losses comprise actuarial gains and losses, return on
plan assets (excluding amounts included in net interest on the net defined
benefit liability or asset) and any change in the effect of the asset ceiling
(excluding amounts included in net interest on the net defined benefit liability
or asset). Re-measurements are recognised in other comprehensive income).
Corridor approach amendment
Using a “corridor approach” to smooth the amounts recoverable was previously 7.25
acceptable within IAS 19. Due to declining financial markets, decreasing discount
rates and particularly changing mortality rates, in general most companies using
the corridor approach disclosed unrecognised actuarial losses. These companies
therefore presented a smaller balance sheet liability or larger balance sheet asset
than the actual deficit or surplus in the defined benefit plan.
On application of the latest amendments of IAS 19, all cumulative unrecognised 7.26
actuarial gains and losses at the start of the period will be recognised in retained
earnings. If unrecognised actuarial losses are in place then companies will need to
decrease their equity position.
The corridor and spreading method are no longer permitted. This will reduce 7.27
diversity in presentation and, subject to the asset ceiling, will ensure that the
balance sheet always reflects the extent to which a pension plan is funded.
Amounts recognised in other comprehensive income (it is an addition to the Profit
& Loss statement of a company focussing on the reporting of all comprehensive
income) are not reclassified through profit or loss, but the standard no longer
requires these items to be recognised immediately in retained earnings. This will
allow re-measurements to be presented as a separate category within equity.
Judgement is required to distinguish the portion included in cost of assets from
that recognised in other comprehensive income.
Other recent amendments of IAS 19
Other relevant changes that have been introduced in IAS 19 include the following: 7.28
I The amendment introduces a new term: “re-measurements”. It defines re-
measurements as being made “of actuarial gains and losses on the defined
benefit obligation, the difference between actual investment returns and the
return implied by the net interest cost and the effect of the asset ceiling”.
Re-measurements will need to be recognised in the balance sheet immediately,
with a charge or credit to the other comprehensive income in the periods in
which they occur. They are not recycled subsequently. An appropriate portion
of re-measurements is included in the cost of assets, if other IFRSs require the
inclusion of such costs.

Final Report
88
I Interest expense or income will now be calculated on the net defined benefit
liability (asset) by applying the discount rate to the net defined benefit liability
(asset). This replaces the interest cost on the defined benefit obligation and
the expected return on plan assets and is likely to increase the employee
benefit expense for most entities.
I Past-service cost will be recognised in profit or loss in the period when a plan is
amended.
I A curtailment will only occur when an entity significantly reduces the number
of employees covered by a plan.
I Curtailment gains and losses will be accounted for as a past-service cost.
I A liability for a termination benefit will be recognised at the earlier of when
the entity can no longer withdraw the offer of the termination benefit and
when the entity recognises any related restructuring costs. Any benefit that
requires future service is not a termination benefit.
I Enhanced disclosures are required to explain the characteristics of benefit
plans and risks associated with them, and identify and explain the amounts
recognised in the financial statements.
Impact of IAS 19 changes on ANSPs
Removal of the corridor and spreading method to net pension liabilities, and 7.29
changes to the approach to calculating interest expenses, have the potential to
produce a very material impact on user charges through the uncontrollable costs
elements of determined costs. User charges are likely to be volatile – leading to
problems with future planning, and provisions for expected changes in the
valuation of liabilities and assets will need to be forecast over the five years of
RP2 in submitted Performance Plans. Depending on the coincidence with
economic factors such as interest rates, stock and bond market values, and
expected life estimates, there could be very large differences between projected
values and actual values.
Although Eurocontrol, as discussed below, advocates a movement away from a 7.30
strict application of IAS to enable greater transparency and predictability of user
charges, States and ANSPs will need to comply with fiduciary measures consistent
with their shareholders requirements.
If IAS 19 is followed, it substantially reduces the financial risks associated with 7.31
running an ANSP, and this should be reflected in the allowed return on capital
provided under the Determined Unit Cost method.
Possible future amendments of IAS 19
There are a number of possible future amendments and research studies under 7.32
consideration by IFRS, including:
I Discount rates: there is an on-going discussion about the right determination of
the discount rate used when applying IAS 19 Employee Benefits, particularly
around the requirement to use market yields on high quality corporate bonds or
government bonds.
I Employee Contributions: a proposed amendment to IAS 19 was tabled in March
2013 with comments due by July 2013. It proposes that contributions from
employees (or third parties) should be recognised as a reduction in the service
Final Report
89
costs in the same period as they are payable, if, and only if, they are linked
solely to the employee’s service rendered in that period. The example quoted
is when a fixed percentage of employee’s salary is paid and the percentage
does not depend on the number of years’ service of the employee.
As interest rates and thus discount rates are currently low, this has had the impact 7.33
of reducing the value of pension assets and introducing net liabilities associated
with ANSPs DB schemes. This has the potential to change over RP2, if and when
the EU economy recovers, interest rates can be expected to rise, and this can be
expected to have a requisite impact on the fair value of assets.
Underlying States Performance Plan submissions will implicitly include a view as to 7.34
the five year profile of discount rates applied to the pension assets.
Review of Eurocontrol guidance
Eurocontrol guidance on accounting for pensions covers Defined Contribution and 7.35
Defined Benefit plans and covers to a lesser extent certain country specific issues
such as the German defined contribution scheme having a residual risk to the
ANSP. Eurocontrol guidance was based on IAS 19 prior to its most recent revision
(date of entry January 2013). There are therefore a number of gaps in the existing
guidance in relation to both the latest accounting standards, and also the range of
pension schemes practically in use across ANSPs.
In the remainder of this section we discuss areas where we consider that it would 7.36
be helpful for Eurocontrol to provide guidance to States, and outline the current
content of the guidance.
Guidance on Defined Contribution schemes
The following key elements of guidance are provided: 7.37
I Contributions should be expensed;
I Actuarial risk falls on the employee; and
I The periodic contribution is a cost that can be charged to the Determined Cost
base.
The guidance provides an exception for Germany, where a residual liability is held 7.38
by DFS because of the risk of default in the external fund holding of the DB
scheme. Where the company continues to accept some of these risks – such as
biometric developments, investment of plan assets and other factors, the
treatment is the same as a DB scheme (provided below).
Guidance on Defined Benefit schemes
The following key guidance is provided for DB schemes, which can in principle be 7.39
under or over funded:
I Contributions should be expensed (service cost, net interest costs);
I Changes in actuarial gains and losses are to be expensed (but the corridor
approach is allowed – see further discussion below);
I Actuarial risk falls on the company; and
I The periodic contribution is a cost that can be charged to the Determined Cost
base.

Final Report
90
Any difference between pension assets and liabilities – defined by the Defined 7.40
Benefit Obligations - needs to be calculated and shown in the balance sheet as
either a provision or an asset. This value is calculated through:
I Actuarial estimates of employee benefit obligations (using assumptions about
demographic and financial variables);
I Discounting the benefits using the Projected Unit Cost Method to determine the
present value of the benefit obligation;
I Determining a fair value of the pension plan assets;
I As a result determining the total gains or losses of the plan.
The values are determined on the basis of expected values at the start of the year 7.41
but will change when looking back at year-end.
Guidance on corridor approach
Eurocontrol guidance was based on IAS 19 prior to its most recent revision (date of 7.42
entry January 2013).
Using a “corridor approach” to smooth the amounts recoverable was previously 7.43
acceptable within IAS 19. The corridor approach attempted to smooth changes to
defined benefit plan liabilities and was included in the Eurocontrol guidance
document. Providing the changes in assets or liabilities did not exceed 10% of the
Present Value of the liabilities or the fair value of the assets there was no need to
post the change to the profit and loss account. If the change was higher than 10%,
then the liability could be divided over the remaining average life of the
employees participating in the plan.
This approach prevented large year-to-year variations in pension assets and 7.44
liabilities that in turn can drive large swings in air navigation charges. However,
with the use of the corridor and spreading method being abolished in the latest
revision of IAS 19, there is a risk of greater volatility in air navigation charges.
This guidance will need to be updated for the latest IAS 19. 7.45
Guidance on hybrid schemes
No specific guidance is provided on hybrid schemes but, by implication, the 7.46
guidance on DB and DC schemes can be applied to the respective parts of the
composite schemes.
Guidance on PAYG schemes
For those countries with a PAYG pension system (France and Malta in our analysis), 7.47
employees are automatically enrolled into the pension plan offered to government
civil servants. It is the responsibility of the Government to provide its retirees
with their pensions. Therefore any risk that the fund is insufficient rests not with
the ANSP but with the Government. The guidance appears not to provide for a
method of accounting for pensions that are related to such to PAYG schemes.
Guidance on discount rates
The discount rate used should be based on high quality corporate bonds at the 7.48
Balance Sheet date.
Final Report
91
Pension plans valuations
Valuation of assets and liabilities should be actuarial and undertaken on an annual 7.49
basis. However, there is no specific guidance on the qualifications of the
actuaries, or the extent of revaluation of the scheme benefits on an annual basis.
IAS 19 also requires organisations to include in their financial statements the Fair 7.50
Value of assets and liabilities.
Other relevant guidance
The CRCO recognises in its guidance the potential for the removal of the Corridor 7.51
approach through changes to accounting standards, but in any event advocates
that States and ANSPs limit the impacts on costs where possible so as to retain
stability in unit rates.
This guidance will need to be reviewed and reinforced to avoid some of the 7.52
potential downsides of the changes in IAS 19 described above.

Final Report
92
Pension systems in use by the ANSPs
As described in the table below, there are a variety of pension systems in place 7.53
across the sample of 10 States/ ANSPs included in the study. For the majority,
including DSNA and Aena, the pension scheme is a PAYG or DC, meaning that the
obligation lies with the State or the employees, and therefore any changes in costs
will come through annual expenses to the profit and loss account reflecting the
level of contributions.
For the minority, including DFS, NATS, LFV and Avinor, who have a hybrid or DB 7.54
scheme, the change in the level of net assets or liabilities as well as service costs
need to be recognised in the profit and loss.
Therefore, in this sample four of the 10 States, are likely to be subject to 7.55
considerable uncertainty about the volatility of the Determined Unit Costs linked
to pensions.
For three of the four States, there appear to be large deficits in 2012 of the net 7.56
pension assets.
TABLE 7.2 PENSION SYSTEMS
Country ANSP Type of plan Level of state
support
Pension
assets
Deficit/surplus
France DSNA Pay As You Go French state is responsible for the fund
N/A N/A
Spain Aena
Pay As You Go and an external Defined Contribution fund.
None N/A N/A
Germany DFS
Defined Benefit (final salary) for employees joining before 2005; Defined Benefit (average salary) thereafter
None €1,592.6m (2012)
€(1,827.2m) (2012)
UK NATS
NERL has Defined Benefits for employees joining before 2009, Defined Contributions for all others.
None £2,943.7m (2013)
£10.8m (2013) using IAS -£383.3m (2012) using actuarial
Sweden LFV Defined benefit
The extent of the liability appears to be a current subject of negotiation with the state.
N/A
Provisions of SEK 4,027m (2012) made in the balance sheet
Hungary Hungaro-Control
Defined Contribution scheme (transformed from previous Defined Benefit scheme
None None None
Malta MATS Pay As You Go. The state is N/A N/A
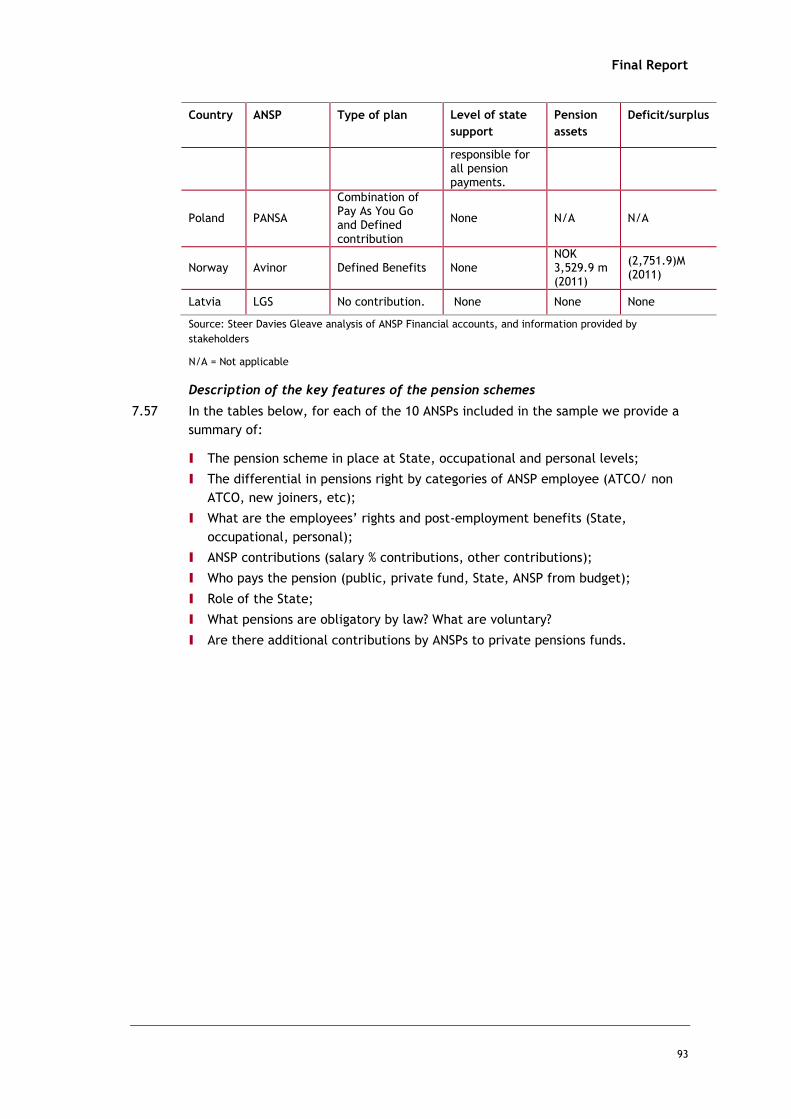
Final Report
93
Country ANSP Type of plan Level of state
support
Pension
assets
Deficit/surplus
responsible for all pension payments.
Poland PANSA
Combination of Pay As You Go and Defined contribution
None N/A N/A
Norway Avinor Defined Benefits None NOK 3,529.9 m (2011)
(2,751.9)M (2011)
Latvia LGS No contribution. None None None
Source: Steer Davies Gleave analysis of ANSP Financial accounts, and information provided by
stakeholders
N/A = Not applicable
Description of the key features of the pension schemes
In the tables below, for each of the 10 ANSPs included in the sample we provide a 7.57
summary of:
I The pension scheme in place at State, occupational and personal levels;
I The differential in pensions right by categories of ANSP employee (ATCO/ non
ATCO, new joiners, etc);
I What are the employees’ rights and post-employment benefits (State,
occupational, personal);
I ANSP contributions (salary % contributions, other contributions);
I Who pays the pension (public, private fund, State, ANSP from budget);
I Role of the State;
I What pensions are obligatory by law? What are voluntary?
I Are there additional contributions by ANSPs to private pensions funds.

Final Report
94
TABLE 7.3 FRANCE, ANSP - DSNA
Issue Description
Describe the pension scheme in place for
employees (State, Occupational, and
Personal)
The State provides a PAYG pension scheme, contributions from DSNA are governed by social security contributions per
employee. The funds that are paid by DSNA goes to a national civil servant pension fund (compte d'affectation spéciale
Pensions - CAS), managed as an unfunded PAYG.
No occupational scheme is made available.
Different pension rights for different
employees? (differences between ex-State
employees, new joiners, etc.)
Retirement age for ATCOs is 50-57, as compared to 60-65 for other employees. The retirement age for ATCOs is fixed by a law
for “special retirement regime”. ATCOs can retire from 50 to 57, but more than 90% retire at 57. Other staff can retire from 60
to 65. A recent law has extended the work time, so that progressively:- ATCOs in OPS will retire from 52 to 59.
What are the rights and post-employment
benefits (State, Occupation, Personal)
The mandatory state pension is an unfunded contributory pension based on redistribution of contributions from those working
to those in retirement. The scheme aims to provide up to a maximum of 50% of the retiree's income during their highest earning
years up to a limit of €35,000 annually (in 2010).
The state scheme is financed by a payroll tax known as "social security contributions". The rate in 2013 is 15.15% (8.4% for
employer and 6.75% for the employee) of pay up to the social security contribution ceiling of € 37,032, and 1.7% (1.6% for the
employer and 0.1% for the employee) on the remainder of the salary. Management of the scheme is the responsibility of the
Caisse Nationale d'Assurance Viellesse (National Old-age Insurance Bank).
In addition there is the ability to add more contribution so that it increases the income of retirees from the 50% level to
between 70% and 80%.
ANSP Contributions – (salary contributions,
separate funds)
Payment level determined by the Ministry of Finance, in 2013 this was translated into 76.4% of pensionable salary.
Who pays the pension (public, private fund,
State, ANSP from budget)
State
Role of the State It is responsible for the PAYG scheme
What pensions are obligatory by law?
What are voluntary?
As a government controlled entity, payments according to Ministry of Finance requirements are obligatory.
DSNA does not run a voluntary occupational pension scheme
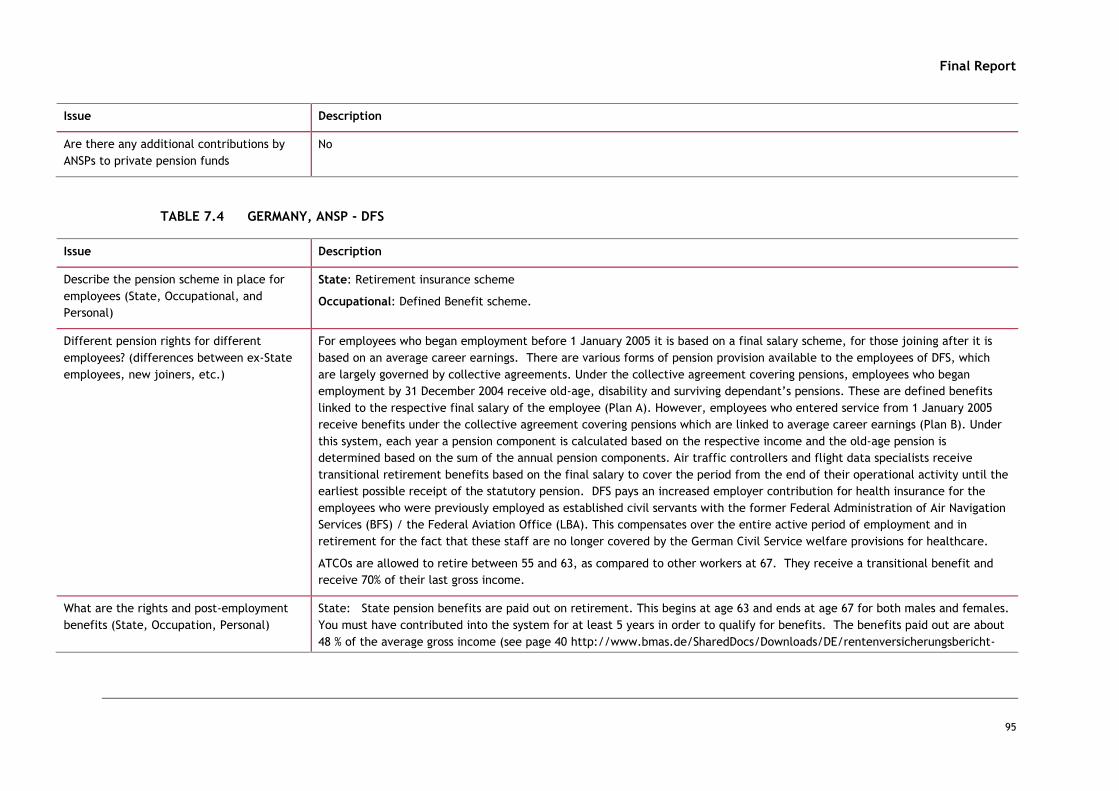
Final Report
95
Issue Description
Are there any additional contributions by
ANSPs to private pension funds
No
TABLE 7.4 GERMANY, ANSP - DFS
Issue Description
Describe the pension scheme in place for
employees (State, Occupational, and
Personal)
State: Retirement insurance scheme
Occupational: Defined Benefit scheme.
Different pension rights for different
employees? (differences between ex-State
employees, new joiners, etc.)
For employees who began employment before 1 January 2005 it is based on a final salary scheme, for those joining after it is
based on an average career earnings. There are various forms of pension provision available to the employees of DFS, which
are largely governed by collective agreements. Under the collective agreement covering pensions, employees who began
employment by 31 December 2004 receive old-age, disability and surviving dependant’s pensions. These are defined benefits
linked to the respective final salary of the employee (Plan A). However, employees who entered service from 1 January 2005
receive benefits under the collective agreement covering pensions which are linked to average career earnings (Plan B). Under
this system, each year a pension component is calculated based on the respective income and the old-age pension is
determined based on the sum of the annual pension components. Air traffic controllers and flight data specialists receive
transitional retirement benefits based on the final salary to cover the period from the end of their operational activity until the
earliest possible receipt of the statutory pension. DFS pays an increased employer contribution for health insurance for the
employees who were previously employed as established civil servants with the former Federal Administration of Air Navigation
Services (BFS) / the Federal Aviation Office (LBA). This compensates over the entire active period of employment and in
retirement for the fact that these staff are no longer covered by the German Civil Service welfare provisions for healthcare.
ATCOs are allowed to retire between 55 and 63, as compared to other workers at 67. They receive a transitional benefit and
receive 70% of their last gross income.
What are the rights and post-employment
benefits (State, Occupation, Personal)
State: State pension benefits are paid out on retirement. This begins at age 63 and ends at age 67 for both males and females.
You must have contributed into the system for at least 5 years in order to qualify for benefits. The benefits paid out are about
48 % of the average gross income (see page 40 http://www.bmas.de/SharedDocs/Downloads/DE/rentenversicherungsbericht-

Final Report
96
Issue Description
2013.pdf) and it will decrease to an average of 46% in 2020 to 43% minimum in 2030 due to legislation. The exact amount paid
out depends on how much you put in and for how long.
Occupational: based on final salary or average earnings related to years of service. On this topic, the following calculations
have been made in 2011 on the described assumptions:
• typical DFS range of jobs (a non ATCO-Expert/ a non-ATCO technical officer/ an ATCO)
• Calculation of the gross level of remuneration (relationship between the gross income as active employee compared to
pension according to the labour agreement for retirement plan A and plan B (without including the recognition of the
transitional retirement benefit of ATCOs).
• no inclusion of the pension scheme insured by national insurance
• all figures have been adjusted to the year 2011
ANSP Contributions – (salary contributions,
separate funds)
State: The contribution rate is currently 18.9 percent of the gross salary (gross = total salary before tax) up to the social
security ceiling (in 2014: €71,400 p.a.). This contribution is shared equally between employee and employer. This means the
employee pays 9.45 % of their gross salary and the employer pays the same. Contributions - and the benefits paid out - are
limited up to a maximum income in line with the social security ceiling. For this reason many employers in Germany pay more
contribution in the occupational pension system for income above the ceiling to fill this pension gap (e.g. 0.4% up to the social
security ceiling and 1.2% above the ceiling).
Occupational: In DFS’s group statutory accounts, pensions constitute 22.7% of staff costs in 2012 (20.8% in 2011). DFS describes
payments as on average, about 25% of the pensionable income (the ATCOs about 40% and the non-ATCOs between 7 and 12% of
the pensionable income).
Expert Technical Officer ATCO
gross level of
retirement plan A (without social security)
15% 19% 30%
gross level of retirement plan B
(without social security)
14% 20% 30%

Final Report
97
Issue Description
Who pays the pension (public, private fund,
State, ANSP from budget)
State pays retirement insurance
DFS is responsible for the pensions and refinances itself from the fund
Role of the State In the retirement insurance scheme
As a state enterprise, for the occupational pension
What pensions are obligatory by law?
What are voluntary?
Retirement insurance payments required by law.
Occupational pension payments are linked to the Collective Agreements with staff. Granting pension benefits is a voluntary
decision for any employer. But as soon as benefits have been granted they are subject to the rules and regulations of the
German Company Pensions Act (Betriebsrentengesetz).
Are there any additional contributions by
ANSPs to private pension funds
Payments to Occupational pension fund, but this is not strictly private as it is run by DFS and the fund.
TABLE 7.5 HUNGARY, ANSP - HUNGAROCONTROL
Issue Description
Describe the pension scheme in place for
employees (State, Occupational, and
Personal)
The State provides a compulsory pension scheme for which Hungarocontrol and employees contribute.
Hungarocontrol plans to provide an occupational Defined Contributions scheme (transformed through agreement with trade
unions from the previous defined benefits scheme).
Different pension rights for different
employees? (differences between ex-State
employees, new joiners, etc)
ATCO and FIS personnel can be retired earlier depending on their gender and years of service in the specified job(s) (reduced
retirement age). The most common case is to have 5 or 6 years of reduction of retirement age, therefore the most common
retirement age of a male ATCO is 56-57 years of age. Please note that it is the employee’s discretional right to retire before the
general retirement age. Most other services retire between 62.5 and 65.
What are the rights and post-employment State pension and early retirement scheme. Typically following a full working life employees are entitled to around 60% of

Final Report
98
Issue Description
benefits (State, Occupation, Personal) covered earnings.
Occupational pension benefits linked to contributions at the time of retirement
ANSP Contributions – (salary contributions,
separate funds)
Employers and employees contribute. There is a difference in the level of contribution paid for ATCOs and non- ATCOs. For
ATCOs it is linked to salary and the contribution is 9.2 – 9.3% of basic salary. For non-ATCOs it is a fixed contribution.
Employer and employees also contribute to the State scheme. Employers contribute 24% of earnings to the First Pillar for
pensions and 3% for medical care and other benefits. Employees contribute 10.0% of covered earnings for pensions and 7.5% of
all earnings for medical care and other benefits.
For the Early Retirement Scheme (ERS) for ATCOs Hungarocontrol pays an additional contribution of 13%.
Who pays the pension (public, private fund,
State, ANSP from budget)
There is a State pension fund, early retirement is paid from the State but through contributions from the ANSP.
There is a separate occupational pensions linked to contributions.
Role of the State State pension scheme
No involvement from the State in occupational scheme.
What pensions are obligatory by law?
What are voluntary?
State pension is obligatory, occupational pension according to trade union negotiations
Are there any additional contributions by
ANSPs to private pension funds
Occupational pension contributions (see above)
TABLE 7.6 LATVIA, ANSP - LGS
Issue Description
Describe the pension scheme in place for
employees (State, Occupational, and
Personal)
State social security pension scheme.
LGS does not have an occupational pension scheme
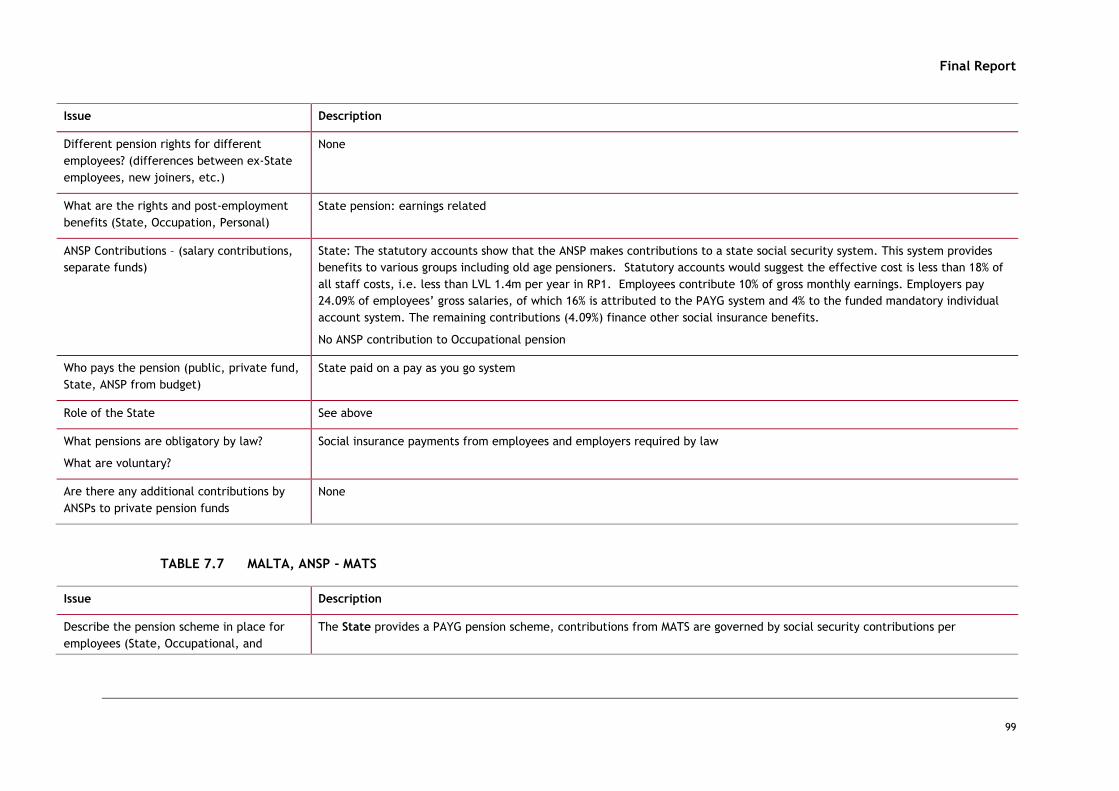
Final Report
99
Issue Description
Different pension rights for different
employees? (differences between ex-State
employees, new joiners, etc.)
None
What are the rights and post-employment
benefits (State, Occupation, Personal)
State pension: earnings related
ANSP Contributions – (salary contributions,
separate funds)
State: The statutory accounts show that the ANSP makes contributions to a state social security system. This system provides
benefits to various groups including old age pensioners. Statutory accounts would suggest the effective cost is less than 18% of
all staff costs, i.e. less than LVL 1.4m per year in RP1. Employees contribute 10% of gross monthly earnings. Employers pay
24.09% of employees’ gross salaries, of which 16% is attributed to the PAYG system and 4% to the funded mandatory individual
account system. The remaining contributions (4.09%) finance other social insurance benefits.
No ANSP contribution to Occupational pension
Who pays the pension (public, private fund,
State, ANSP from budget)
State paid on a pay as you go system
Role of the State See above
What pensions are obligatory by law?
What are voluntary?
Social insurance payments from employees and employers required by law
Are there any additional contributions by
ANSPs to private pension funds
None
TABLE 7.7 MALTA, ANSP - MATS
Issue Description
Describe the pension scheme in place for
employees (State, Occupational, and
The State provides a PAYG pension scheme, contributions from MATS are governed by social security contributions per

Final Report
100
Issue Description
Personal) employee.
No occupational scheme is made available.
Different pension rights for different
employees? (differences between ex-State
employees, new joiners, etc.)
No
What are the rights and post-employment
benefits (State, Occupation, Personal)
State pension scheme provides for a minimum of around 50% of the average earnings, with a full pension equivalent to two-
thirds of pensionable average earnings.
ANSP Contributions – (salary contributions,
separate funds)
Malta Air Traffic Services does not have specific pension plans for its employees. However Maltese law governs social security
payments that the company must make for each employee. The level of payment varies depending upon the level of income up
to a maximum of 10% from employee and 10% from employer (20% total).
Who pays the pension (public, private fund,
State, ANSP from budget)
The state is responsible for pension payments.
Role of the State See above
What pensions are obligatory by law?
What are voluntary?
Maltese Social Security Law governs the level of social security payment that MATS must make for each employee.
Are there any additional contributions by
ANSPs to private pension funds
No
TABLE 7.8 NORWAY, ANSP - AVINOR
Issue Description
Describe the pension scheme in place for
employees (State, Occupational, and
State based on National Insurance payments.
Occupational Defined Benefits Scheme based on payments to Norwegian Public Service Pension Fund
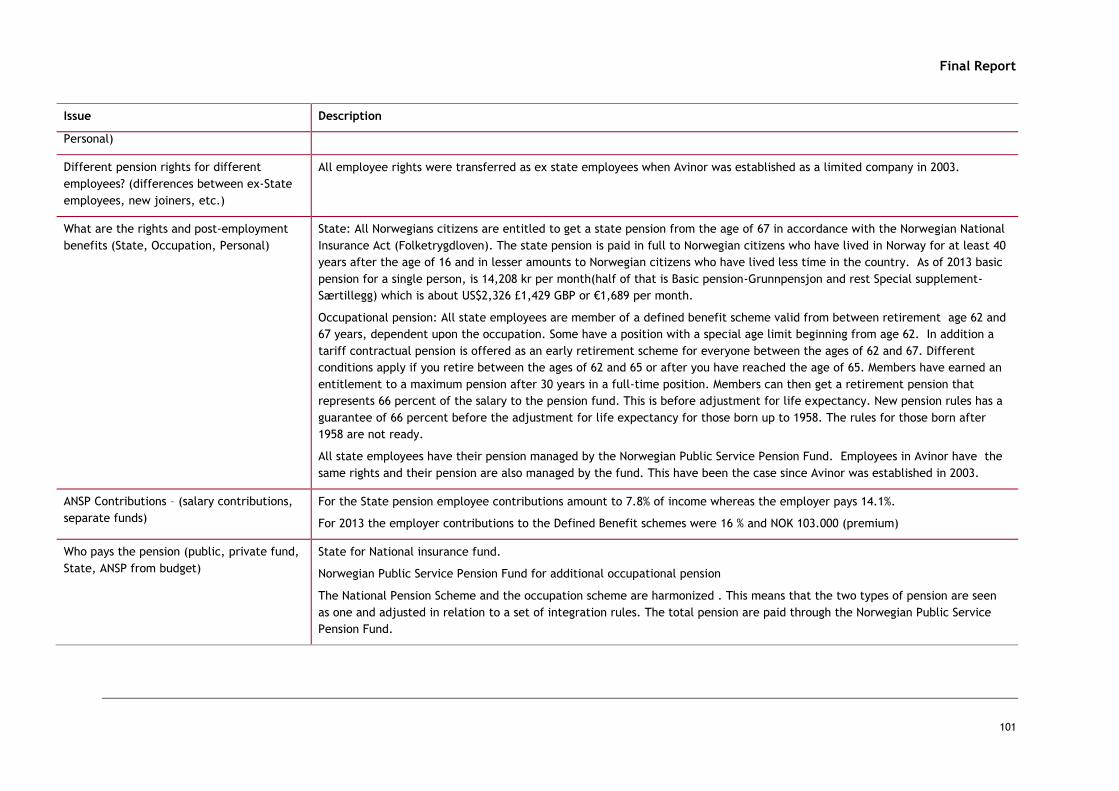
Final Report
101
Issue Description
Personal)
Different pension rights for different
employees? (differences between ex-State
employees, new joiners, etc.)
All employee rights were transferred as ex state employees when Avinor was established as a limited company in 2003.
What are the rights and post-employment
benefits (State, Occupation, Personal)
State: All Norwegians citizens are entitled to get a state pension from the age of 67 in accordance with the Norwegian National
Insurance Act (Folketrygdloven). The state pension is paid in full to Norwegian citizens who have lived in Norway for at least 40
years after the age of 16 and in lesser amounts to Norwegian citizens who have lived less time in the country. As of 2013 basic
pension for a single person, is 14,208 kr per month(half of that is Basic pension-Grunnpensjon and rest Special supplement-
Særtillegg) which is about US$2,326 £1,429 GBP or €1,689 per month.
Occupational pension: All state employees are member of a defined benefit scheme valid from between retirement age 62 and
67 years, dependent upon the occupation. Some have a position with a special age limit beginning from age 62. In addition a
tariff contractual pension is offered as an early retirement scheme for everyone between the ages of 62 and 67. Different
conditions apply if you retire between the ages of 62 and 65 or after you have reached the age of 65. Members have earned an
entitlement to a maximum pension after 30 years in a full-time position. Members can then get a retirement pension that
represents 66 percent of the salary to the pension fund. This is before adjustment for life expectancy. New pension rules has a
guarantee of 66 percent before the adjustment for life expectancy for those born up to 1958. The rules for those born after
1958 are not ready.
All state employees have their pension managed by the Norwegian Public Service Pension Fund. Employees in Avinor have the
same rights and their pension are also managed by the fund. This have been the case since Avinor was established in 2003.
ANSP Contributions – (salary contributions,
separate funds)
For the State pension employee contributions amount to 7.8% of income whereas the employer pays 14.1%.
For 2013 the employer contributions to the Defined Benefit schemes were 16 % and NOK 103.000 (premium)
Who pays the pension (public, private fund,
State, ANSP from budget)
State for National insurance fund.
Norwegian Public Service Pension Fund for additional occupational pension
The National Pension Scheme and the occupation scheme are harmonized . This means that the two types of pension are seen
as one and adjusted in relation to a set of integration rules. The total pension are paid through the Norwegian Public Service
Pension Fund.
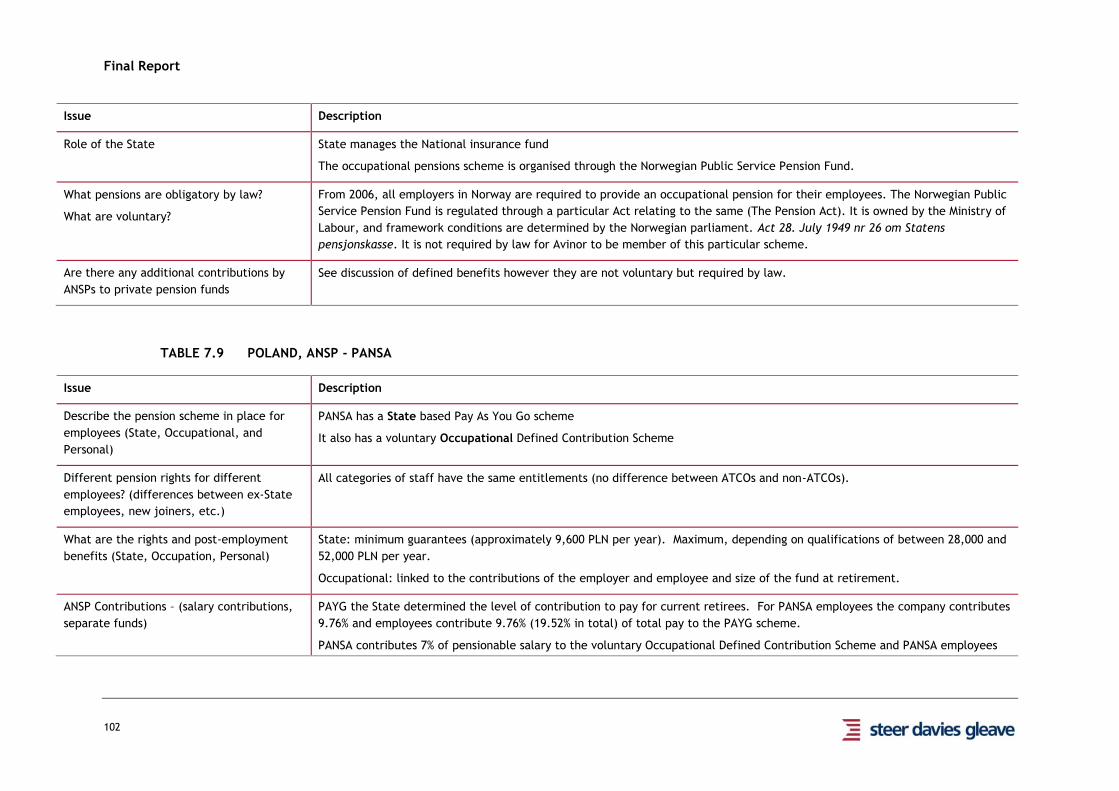
Final Report
102
Issue Description
Role of the State State manages the National insurance fund
The occupational pensions scheme is organised through the Norwegian Public Service Pension Fund.
What pensions are obligatory by law?
What are voluntary?
From 2006, all employers in Norway are required to provide an occupational pension for their employees. The Norwegian Public
Service Pension Fund is regulated through a particular Act relating to the same (The Pension Act). It is owned by the Ministry of
Labour, and framework conditions are determined by the Norwegian parliament. Act 28. July 1949 nr 26 om Statens
pensjonskasse. It is not required by law for Avinor to be member of this particular scheme.
Are there any additional contributions by
ANSPs to private pension funds
See discussion of defined benefits however they are not voluntary but required by law.
TABLE 7.9 POLAND, ANSP - PANSA
Issue Description
Describe the pension scheme in place for
employees (State, Occupational, and
Personal)
PANSA has a State based Pay As You Go scheme
It also has a voluntary Occupational Defined Contribution Scheme
Different pension rights for different
employees? (differences between ex-State
employees, new joiners, etc.)
All categories of staff have the same entitlements (no difference between ATCOs and non-ATCOs).
What are the rights and post-employment
benefits (State, Occupation, Personal)
State: minimum guarantees (approximately 9,600 PLN per year). Maximum, depending on qualifications of between 28,000 and
52,000 PLN per year.
Occupational: linked to the contributions of the employer and employee and size of the fund at retirement.
ANSP Contributions – (salary contributions,
separate funds)
PAYG the State determined the level of contribution to pay for current retirees. For PANSA employees the company contributes
9.76% and employees contribute 9.76% (19.52% in total) of total pay to the PAYG scheme.
PANSA contributes 7% of pensionable salary to the voluntary Occupational Defined Contribution Scheme and PANSA employees
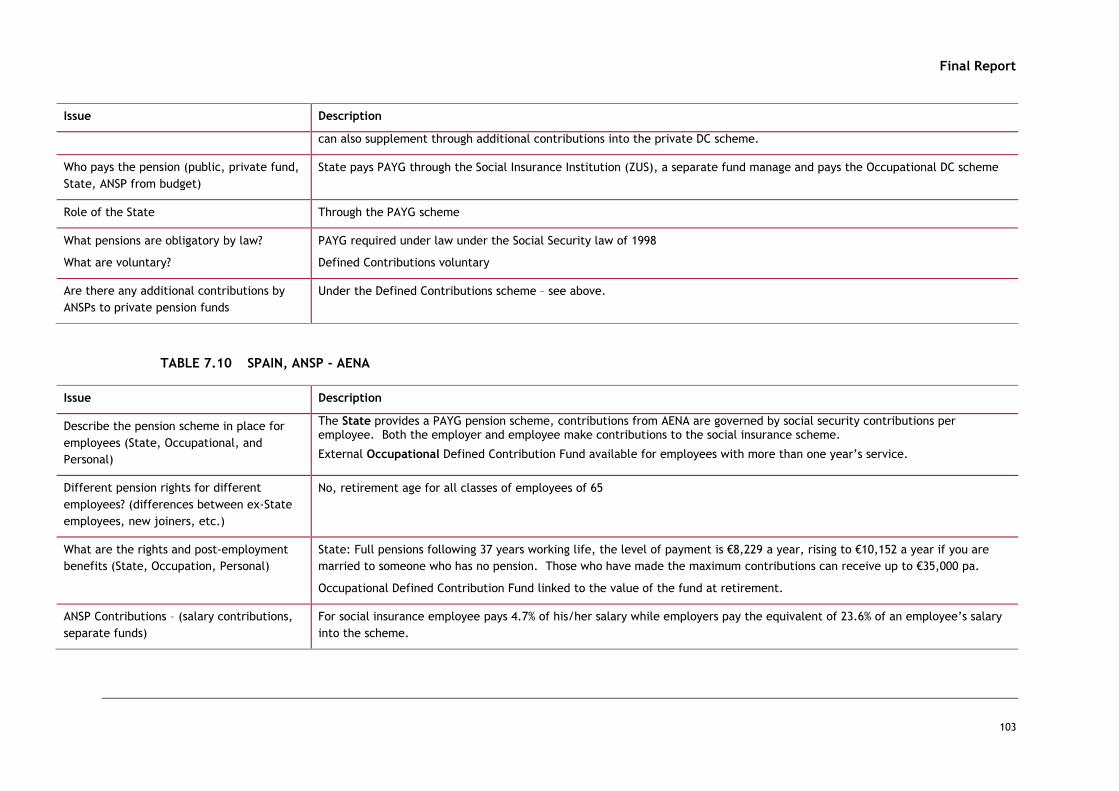
Final Report
103
Issue Description
can also supplement through additional contributions into the private DC scheme.
Who pays the pension (public, private fund,
State, ANSP from budget)
State pays PAYG through the Social Insurance Institution (ZUS), a separate fund manage and pays the Occupational DC scheme
Role of the State Through the PAYG scheme
What pensions are obligatory by law?
What are voluntary?
PAYG required under law under the Social Security law of 1998
Defined Contributions voluntary
Are there any additional contributions by
ANSPs to private pension funds
Under the Defined Contributions scheme – see above.
TABLE 7.10 SPAIN, ANSP - AENA
Issue Description
Describe the pension scheme in place for
employees (State, Occupational, and
Personal)
The State provides a PAYG pension scheme, contributions from AENA are governed by social security contributions per employee. Both the employer and employee make contributions to the social insurance scheme.
External Occupational Defined Contribution Fund available for employees with more than one year’s service.
Different pension rights for different
employees? (differences between ex-State
employees, new joiners, etc.)
No, retirement age for all classes of employees of 65
What are the rights and post-employment
benefits (State, Occupation, Personal)
State: Full pensions following 37 years working life, the level of payment is €8,229 a year, rising to €10,152 a year if you are
married to someone who has no pension. Those who have made the maximum contributions can receive up to €35,000 pa.
Occupational Defined Contribution Fund linked to the value of the fund at retirement.
ANSP Contributions – (salary contributions,
separate funds)
For social insurance employee pays 4.7% of his/her salary while employers pay the equivalent of 23.6% of an employee’s salary
into the scheme.

Final Report
104
Issue Description
The Defined Contribution payment rates were not available from AENA and AESA. In 2011, it appears 5% of the cost to AENA of
employee benefit obligations came from the DC scheme, with the remaining 95% coming from the PAYG scheme.
Who pays the pension (public, private fund,
State, ANSP from budget)
State on a Pay As You Go basis
Occupational pension according to level of contributions and value of fund.
Role of the State See above
What pensions are obligatory by law?
What are voluntary?
Social insurance by law, the legal right to establish additional schemes.
Are there any additional contributions by
ANSPs to private pension funds
See external Defined Contribution Fund above
TABLE 7.11 SWEDEN, ANSP - LFV
Issue Description
Describe the pension scheme in place for
employees (State, Occupational, and
Personal)
State based on social security payments
Occupational Defined Benefits Scheme based on payments to Swedish Pensions Authority
Different pension rights for different
employees? (differences between ex-State
employees, new joiners, etc.)
ATCOs have a retirement age of 60 compared to normal retirement age of 65. Other employees retirement age is 65.
What are the rights and post-employment
benefits (State, Occupation, Personal)
State: based on the number of years worked and earnings related up to a maximum, minimum social pension for non-earners
available.
Occupational: To get the full benefit you need 30 years of service, ATCOs retire at 60 other occupations 65. Depending on
years of service ATCOs can receive between 40 % and 65% of their final salary (based on average of final five years of service).

Final Report
105
Issue Description
Between 60 and 65 ATCOs will receive a temporary pensions linked to years of service.
ANSP Contributions – (salary contributions,
separate funds)
For State: Pensionable incomes are wages as well as payments from social security and unemployment insurance systems. 31% is
paid in total of which 11% is for pension and the remainder for other insurance payments .
For Defined Benefits Scheme: On paid wage: 4.5% + 24.26% in wage tax on the charge. Additionally, for ATCOs retiring at 60,
6.9%+wage tax based on annual salary (Pensions basis) as a one-time amount.
Who pays the pension (public, private fund,
State, ANSP from budget)
Direct from State for Social security pension.
State, via the Swedish Pensions Authority for the Occupational pension.
Role of the State LFV is a State Enterprise so its pension obligations are the States
What pensions are obligatory by law?
What are voluntary?
The pensions requirement are partly required by law and partly by Collective Agreement
Are there any additional contributions by
ANSPs to private pension funds
The payments to the Occupational pension scheme are required by law and Collective Agreement so they are not strictly
voluntary but are additional to the State basic pension.
TABLE 7.12 UNITED KINGDOM, ANSP - NATS
Issue Description
Describe the pension scheme in place for
employees (State, Occupational, and
Personal)
The State provides a pension scheme (safety net), which is paid for out of National Insurance Contributions which are based on
employee earnings.
An occupational pension scheme is provided to NATS employees. For those employed before 31/3/2009 it is based on a
Defined Benefits scheme. For those after 31/3/2009 a Defined Contribution scheme. The pension funds are managed by
independent trustees.
Different pension rights for different New joiners are only eligible for the Defined Contribution Scheme. Otherwise all classes of employees treated the same.

Final Report
106
Issue Description
employees? (differences between ex-State
employees, new joiners, etc)
What are the rights and post-employment
benefits (State, Occupation, Personal)
Subject to sufficient years of employment the employer will receive a full basic State pension. Current basic single person
pension is £5,720 per year.
The Occupational pension for defined benefits will be accrued of final salary on the basis of the total years of service divided by
58ths. So for example after 40 years services that person will receive 40/58th or 69% of their final salary.
The Occupational pension for defined contribution will depend on the value of the accumulated fund at retirement.
ANSP Contributions – (salary contributions,
separate funds)
Defined Benefits: 45% of pensionable pay forecast for 213/14, employees contribute 6% of their pensionable salary.
Defined Contributions: employer matches employee contribution 2:1. Employees choose 4% - 9% (default rate is 6%), employer
8 to 18% (current average 14%).
State National Insurance scheme: employer contributions up to 13.8%, employee contributions 12-14%, the higher based on a
salary threshold above £797 per week.
Who pays the pension (public, private fund,
State, ANSP from budget)
The occupational pension is paid out of the fund which is managed by independent Trustees.
State pension from public funds.
Role of the State The State is responsible for the State pension funded through National Insurance contributions.
The occupational pension is completely separate and has no State involvement and is paid through the Trustees.
What pensions are obligatory by law?
What are voluntary?
Occupational pensions are subject to choices by companies but once offered are subject to pensions law.
National Insurance contributions to the State pension are obligatory.
Are there any additional contributions by
ANSPs to private pension funds
See above for description of employers contributions to different occupational funds.
Final Report
107
Implications of current pension schemes offered by ANSPs
Most ANSPs in the sample provide pension rights which are either comparable or 7.58
better than other public services workers in the country. Moreover, many of the
occupational pension schemes are linked to final salary schemes. Others are tied
into State pension commitments allied with the results of promises made through
Collective Bargaining arrangements. The cost of these schemes has been
systematically underestimated by planners and therefore serious consideration
needs to be made of ways of mitigating the potential pension cost risks rather than
continuing the escalation of costs.
This cost escalation issue may become increasingly difficult as the industry trends 7.59
towards greater use of technology and improved productivity as a result of
restructuring and the cost of pension commitments are spread over a smaller
workforce.
Approaches taken to mitigate pension cost risks
Following the trend of companies, and States, throughout Europe, some ANSPs 7.60
have taken explicit actions to mitigate the future pensions cost risks. These have
included:
I Transitioning from a Defined Benefit to Defined Contribution scheme: This
was achieved by Hungarocontrol in 2013 following negotiation with staff
representatives.
I Movement to an average rather than final salary Defined Benefits system:
As introduced in 2005 for new joiners at DFS follow renegotiation with trade
unions.
I Extending the age of retirement: This is generally taking place in the State
sector in Spain, Greece, United Kingdom and Germany, amongst others. With
employees needing to work longer before qualifying for receipt of pensions
benefits.
I Transfer of pension liabilities to the State: In April 2011, LFV agreed with the
Swedish Government a transfer of the pension debt for retired staff to the
Swedish Pensions Board. This led to about SEK 2 Billion of LFV’s pensions
liability being transferred to the National Government Pensions Board.
I New joiners on Defined Contribution Scheme: All new joiners of NATS after
2009 can only join the Defined Contribution pension scheme.
These are actions, potentially available to all ANSPs when faced with escalating 7.61
and uncertain pension costs, and reflect changes that have already taken place in
the competitive private sector, as well as some State sector companies and State
provided pension schemes. ANSPs and States when facing escalating pension
liabilities need to actively implement some of these changes to mitigate costs
risks, which are ultimately borne by airspace users.
Pay As You Go Pensions Schemes
Experience from ANSP sample
In the sample of 10, there are a number of ANSPs contributing to Pay As You Go 7.62
systems, including DSNA, Aena, MATS and PANSA where the State takes the
primary decision on the level of contribution, but payments are made by the ANSPs

Final Report
108
to the State pension system to pay for current retirees. In France, the level of
DSNA contribution into the state managed pensions system is determined by the
Ministry of Finance and has increased over the period 2010-2013, and is currently
at 76.4% of basic salary. In MATS the payments are made into a national insurance
scheme at the rate of 10% of basic salary, subject to a minimum. For AENA,
employees are part of the state pension system and the current level of
contribution in 26.3% of basic pay. For PANSA employees, the company
contributes 9.76% and employees 9.76% (19.52% in total into the PAYG scheme) of
total pay. PANSA employees can also supplement through additional contributions
into a private DC pension scheme.
By the nature of an aging population, there is a risk that the level of contributions 7.63
expected by the State will continue to increase over time and is affected by the
birth rate and changes in life expectancy of retirees.
Key risks for RP2
The key risks in a Pay As You Go scheme in relation to future pensions costs is 7.64
predicting the level of contribution (as a % of salary costs), required to service the
State obligation. Moreover, these obligations are usually determined at a State
level and are outside the direct control of ANSP management, and in principle
difficult to predict.
Furthermore, it needs to be clarified by policy makers whether decisions, at State 7.65
level, about the level of pensions contribution for PAYG systems are beyond the
control of ANSP management and therefore would qualify as ‘costs exempt from
risk sharing’, or as the State is also the owner of the ANSP it is effectively within
their control and is at the ANSP’s risk.

Final Report
109
FIGURE 7.2 SUMMARY OF PAY AS YOU GO PENSIONS SCHEMES
Defined Contributions Schemes
Experience from ANSP sample
HungaroControl have moved from an old scheme (DB) to a new one (DC) in August 7.66
2013. The DB pension obligation has been converted in the DC pension scheme
providing a more transparent and stable system. Under the old system, the DB
scheme was unfunded. A lump-sum (% of final salary) was paid to the employees
when they retired. Under the new system, Hungarocontrol pays annually a fixed
contribution into the scheme, as well as the employees. There is a difference in
the contribution which is paid for ATCOs and non-ATCOs. For ATCOs, it is linked to
salary and the contribution is 9.2-9.3% of basic salary. For non-ATCOs, it is not
linked to salary (it is a fixed contribution) but is adjusted with inflation.
There is also an ERS (early retirement scheme), that is just for ATCOs at HU, and 7.67
for those individuals HU pays an additional ERS contribution (13% of employee
salary). This is a State requirement.
NATS also have a defined contribution scheme for new joiners after 2009. 7.68
Employee contributions, at a minimum of 4% and maximum of 9.1% are matched by
NERL on a 2:1 basis. The expectation is that on average NERL will be contributing
15% of pensionable earnings (not all allowances are included) for DC employees.
PANSA has a voluntary Defined Contribution scheme (in addition to a PAYG 7.69
scheme), with a payment rate of 7% of pensionable pay.
Key risks for RP2
As the level of contribution is at the sole discretion of the ANSP, there should be 7.70
very limited risks associated with the level of contribution predicted for the period
of RP2. As a result of ANSP control of the value, the changes should not be
considered as costs exempt from risk sharing.
State Central Pensions system
Contribution Rate (set centrally usually by State/
Finance Ministry)
ANSP cash payments
Paym
en
ts
Current Retirees
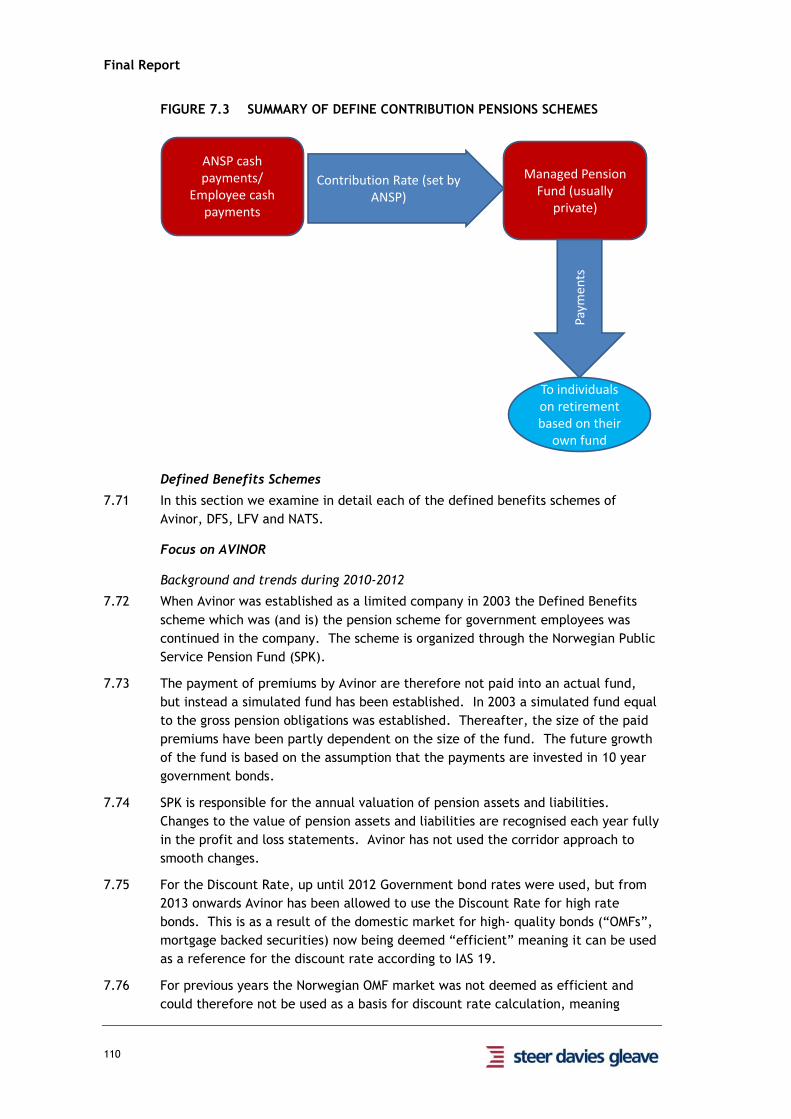
Final Report
110
FIGURE 7.3 SUMMARY OF DEFINE CONTRIBUTION PENSIONS SCHEMES
Defined Benefits Schemes
In this section we examine in detail each of the defined benefits schemes of 7.71
Avinor, DFS, LFV and NATS.
Focus on AVINOR
Background and trends during 2010-2012
When Avinor was established as a limited company in 2003 the Defined Benefits 7.72
scheme which was (and is) the pension scheme for government employees was
continued in the company. The scheme is organized through the Norwegian Public
Service Pension Fund (SPK).
The payment of premiums by Avinor are therefore not paid into an actual fund, 7.73
but instead a simulated fund has been established. In 2003 a simulated fund equal
to the gross pension obligations was established. Thereafter, the size of the paid
premiums have been partly dependent on the size of the fund. The future growth
of the fund is based on the assumption that the payments are invested in 10 year
government bonds.
SPK is responsible for the annual valuation of pension assets and liabilities. 7.74
Changes to the value of pension assets and liabilities are recognised each year fully
in the profit and loss statements. Avinor has not used the corridor approach to
smooth changes.
For the Discount Rate, up until 2012 Government bond rates were used, but from 7.75
2013 onwards Avinor has been allowed to use the Discount Rate for high rate
bonds. This is as a result of the domestic market for high- quality bonds (“OMFs”,
mortgage backed securities) now being deemed “efficient” meaning it can be used
as a reference for the discount rate according to IAS 19.
For previous years the Norwegian OMF market was not deemed as efficient and 7.76
could therefore not be used as a basis for discount rate calculation, meaning
ANSP cash payments/
Employee cash payments
Contribution Rate (set by ANSP)
Managed Pension Fund (usually
private)
Paym
ents
To individuals on retirement based on their
own fund
Final Report
111
government bonds was the only allowable discount rate basis as per IAS 19. Avinor
believe that OMFs give a more appropriate discount rate, with the government
bond rate being currently very low.
The Actuarial losses recognised in the Avinor AS profit and loss were NOK -1,068.8 7.77
million in 2011 and NOK -650.4 million in 2012. The Discount rate applied in 2012
was 2.4% slightly lower than the 2.6% applied in 2011, resulting in lower return on
assets.
Emerging approach for RP2:
No assumptions for discount rates have been made for RP2 yet, but Avinor expect 7.78
to use OMF rates as the basis for the calculation unless accounting rules change.
There is no intention to use a Corridor approach and to continue the recognition of 7.79
changes in pensions assets and liabilities on an annual basis.
Key issues arising
I Changes in annual liabilities will be reflected in provisions on an annual basis.
The current national arrangements do not allow smoothing to facilitate smaller
changes in charge levels.
I The pension provisions are entirely provided by the Avinor balance sheet, and
comprise mainly cash assets.
I The Discount Rate used and the approach to recognition and recovery of
pensions costs is influenced by the Norwegian Public Service Pension Fund,
rather than Avinor.
Focus on DFS (Germany)
Background and trends during 2010-2012
DFS has a DB pensions system. For employees who began employment before 01 7.80
January 2005 it is a final salary scheme, for those joining after it is linked to
average career earnings.
When DFS moved to the application of IFRS on 1 January 2006, which resulted in a 7.81
negative adjustment to retained earnings through the application of IAS to pension
liabilities, it agreed with its regulator to spread the impact over 15 years such that
the negative equity will be steadily reduced over time.
In 2010, DFS stated in its accounts that it used the 10% corridor approach. In 2010 7.82
the net obligation was €718.8 million, of which €573 million was recognised.
In 2011, the net pension obligation was €988.8 million, of which €547.5 was 7.83
recognised.
DFS estimated in 2012 that the impact of IAS 19 and the discontinuation of the 7.84
corridor approach, will require recognition of actuarial losses of €1,295 million
directly in equity as of 1 January 2013.
Since 1 January 2012, as agreed with the German regulatory authority, the 7.85
calculation of pension costs conforms with European regulations. In 2012, DFS was
authorised to distribute the difference between the plan deficit/surplus over the
average remaining time to work of staff (15 years) on a rolling basis, and include
the changes in the next reference period. The approach is described as avoiding
random fluctuations in the cost base for charges. This resulted in a net charge to
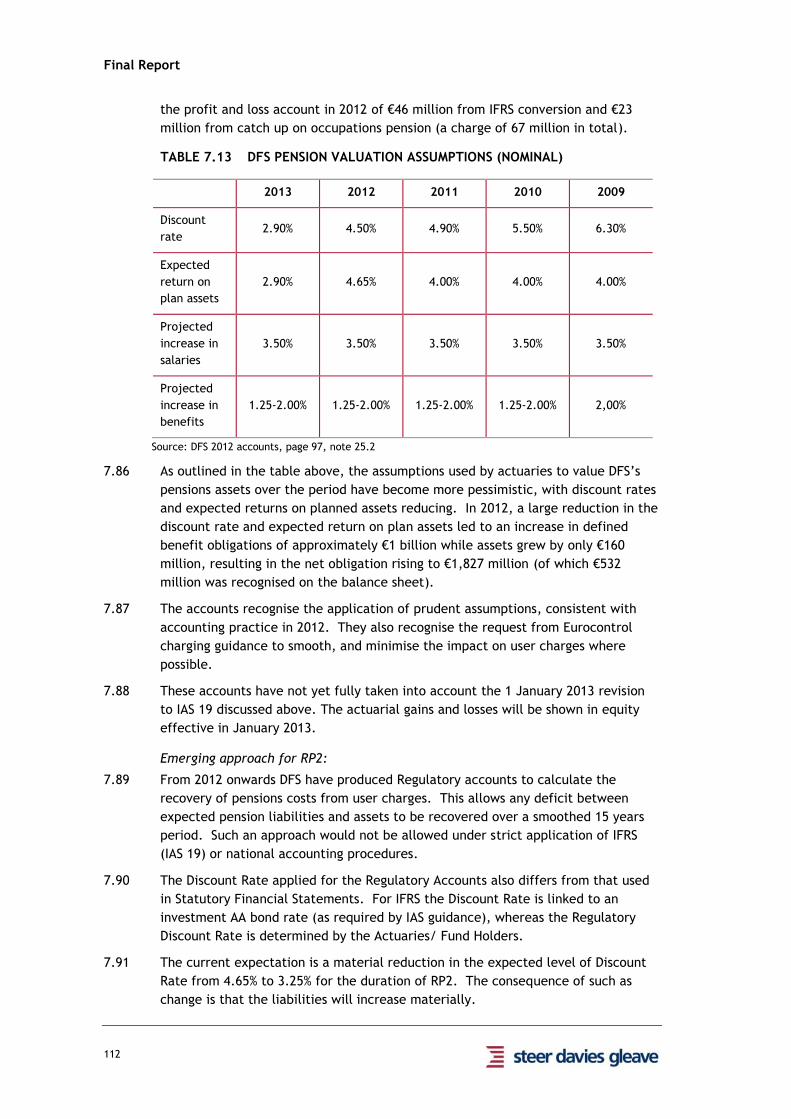
Final Report
112
the profit and loss account in 2012 of €46 million from IFRS conversion and €23
million from catch up on occupations pension (a charge of 67 million in total).
TABLE 7.13 DFS PENSION VALUATION ASSUMPTIONS (NOMINAL)
2013 2012 2011 2010 2009
Discount
rate 2.90% 4.50% 4.90% 5.50% 6.30%
Expected
return on
plan assets
2.90% 4.65% 4.00% 4.00% 4.00%
Projected
increase in
salaries
3.50% 3.50% 3.50% 3.50% 3.50%
Projected
increase in
benefits
1.25-2.00% 1.25-2.00% 1.25-2.00% 1.25-2.00% 2,00%
Source: DFS 2012 accounts, page 97, note 25.2
As outlined in the table above, the assumptions used by actuaries to value DFS’s 7.86
pensions assets over the period have become more pessimistic, with discount rates
and expected returns on planned assets reducing. In 2012, a large reduction in the
discount rate and expected return on plan assets led to an increase in defined
benefit obligations of approximately €1 billion while assets grew by only €160
million, resulting in the net obligation rising to €1,827 million (of which €532
million was recognised on the balance sheet).
The accounts recognise the application of prudent assumptions, consistent with 7.87
accounting practice in 2012. They also recognise the request from Eurocontrol
charging guidance to smooth, and minimise the impact on user charges where
possible.
These accounts have not yet fully taken into account the 1 January 2013 revision 7.88
to IAS 19 discussed above. The actuarial gains and losses will be shown in equity
effective in January 2013.
Emerging approach for RP2:
From 2012 onwards DFS have produced Regulatory accounts to calculate the 7.89
recovery of pensions costs from user charges. This allows any deficit between
expected pension liabilities and assets to be recovered over a smoothed 15 years
period. Such an approach would not be allowed under strict application of IFRS
(IAS 19) or national accounting procedures.
The Discount Rate applied for the Regulatory Accounts also differs from that used 7.90
in Statutory Financial Statements. For IFRS the Discount Rate is linked to an
investment AA bond rate (as required by IAS guidance), whereas the Regulatory
Discount Rate is determined by the Actuaries/ Fund Holders.
The current expectation is a material reduction in the expected level of Discount 7.91
Rate from 4.65% to 3.25% for the duration of RP2. The consequence of such as
change is that the liabilities will increase materially.
Final Report
113
DFS intends to ask its NSA to recover this deficit over 15 years (with this 7.92
representing the remaining average working life of current employees). The
consequence of this amendment would be to increase current annual pensions
costs. The exact level of the increment will be determined at the time of the RP2
submission and based on the then current valuation and estimate Discount Rates.
Any adjustment to the pensions liability would take place every 5 years (at the end 7.93
of the current regulation period) when a new estimate of the Discount Rate (and
presumably other parameters like average life expectancy and asset growth) would
be revised. Current expectations would be that this would next take place in 2014
and 2019 (up to several months earlier).
The approach proposed by DFS to its NSA, it believes is permitted under the 7.94
existing SES Regulation in that this legislation requires ANSPs to follow IFRS to the
greatest extent possible, and they recognise that a strict application of IAS19 for
the purpose of charging is not practical and will lead to large annual variations.
Key issues arising
I Even with smoothing, this implies large changes in the pensions costs for DFS
airspace users;
I The level of prudence and conservatism in the value of the Discount Rate
applied by fundholders and actuaries has a big impact on the apparent pension
deficit;
I The volatility within the costs is reduced by application of the smoothing
principles.
Focus on Sweden (LFV)
Background and trends during 2010-2012
There is a Defined Benefit Scheme for people born between 1943 and 1972 working 7.95
for the Swedish Government. Pension payments are made for LFV employees, as a
State Enterprise, via social security payments into a national governed scheme.
In 2010, LFV increased its pension reserves and expenses significantly as a result of 7.96
the National Government Employees Pensions Board decision to reduce the
Discount Rate that is used in the calculation for state enterprises’ pension
obligations. This led to a SEK 300 million increase in costs, split between SEK 60
million to personnel expenses and SEK 240 million to financial expenses.
In October 2010, the pensions calculation applied a lower interest rate (real Gross 7.97
1.4% (previously 1.8%) and real Net 0.7% (previously 1.1%)).
In 2010, the total pensions obligation was amended by the revaluation, but also 7.98
the transfer of obligations to Swedavia AB, in connection with the separation of
airports activities from LFV. The net pension provision reduced from SEK 5,365
million in 2009 to SEK 4,670 million in 2010.
In April 2011, LFV agreed with the Swedish Government a transfer of the pension 7.99
debt for retired staff to the Swedish Pensions Board. This led to about SEK 2
Billion of LFV’s pensions liability being transferred to the National Government
Pensions Board. This resulted in an income gain of SEK 100 million, but combined
pensions costs remained material at SEK 440 million. As a result of these changes,
the pension provisions reduced to SEK 3,205 million by the end of 2011. However,
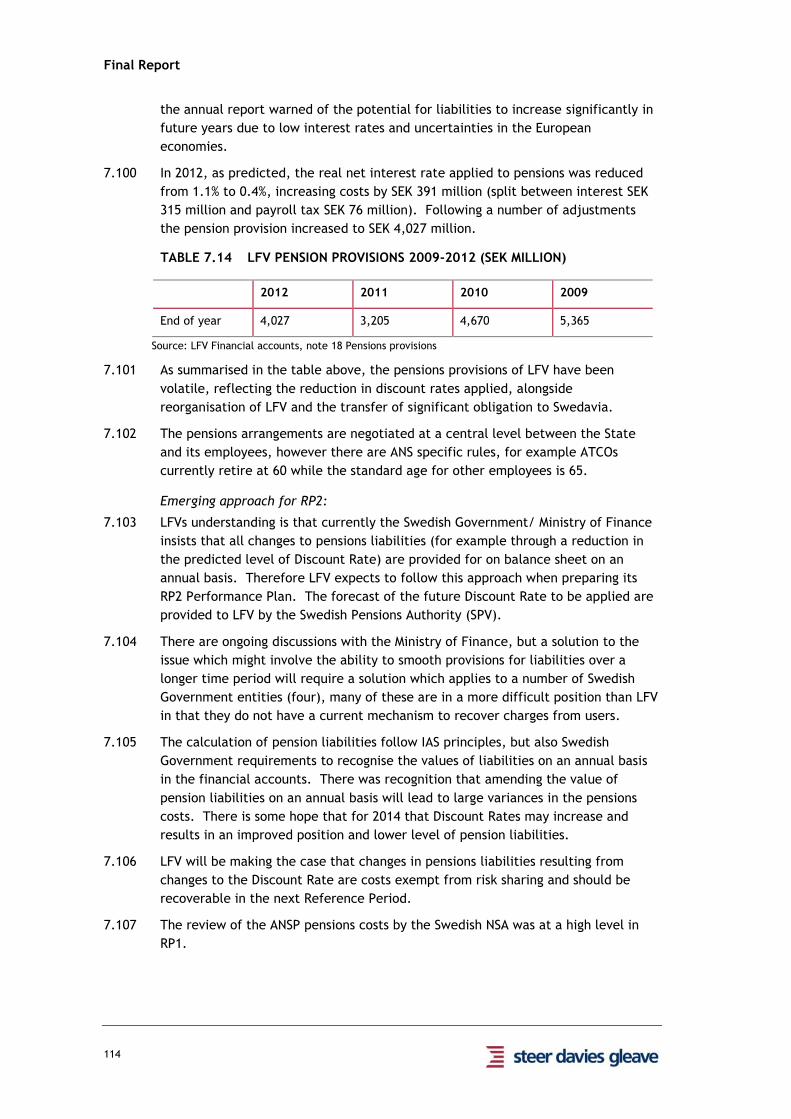
Final Report
114
the annual report warned of the potential for liabilities to increase significantly in
future years due to low interest rates and uncertainties in the European
economies.
In 2012, as predicted, the real net interest rate applied to pensions was reduced 7.100
from 1.1% to 0.4%, increasing costs by SEK 391 million (split between interest SEK
315 million and payroll tax SEK 76 million). Following a number of adjustments
the pension provision increased to SEK 4,027 million.
TABLE 7.14 LFV PENSION PROVISIONS 2009-2012 (SEK MILLION)
2012 2011 2010 2009
End of year 4,027 3,205 4,670 5,365
Source: LFV Financial accounts, note 18 Pensions provisions
As summarised in the table above, the pensions provisions of LFV have been 7.101
volatile, reflecting the reduction in discount rates applied, alongside
reorganisation of LFV and the transfer of significant obligation to Swedavia.
The pensions arrangements are negotiated at a central level between the State 7.102
and its employees, however there are ANS specific rules, for example ATCOs
currently retire at 60 while the standard age for other employees is 65.
Emerging approach for RP2:
LFVs understanding is that currently the Swedish Government/ Ministry of Finance 7.103
insists that all changes to pensions liabilities (for example through a reduction in
the predicted level of Discount Rate) are provided for on balance sheet on an
annual basis. Therefore LFV expects to follow this approach when preparing its
RP2 Performance Plan. The forecast of the future Discount Rate to be applied are
provided to LFV by the Swedish Pensions Authority (SPV).
There are ongoing discussions with the Ministry of Finance, but a solution to the 7.104
issue which might involve the ability to smooth provisions for liabilities over a
longer time period will require a solution which applies to a number of Swedish
Government entities (four), many of these are in a more difficult position than LFV
in that they do not have a current mechanism to recover charges from users.
The calculation of pension liabilities follow IAS principles, but also Swedish 7.105
Government requirements to recognise the values of liabilities on an annual basis
in the financial accounts. There was recognition that amending the value of
pension liabilities on an annual basis will lead to large variances in the pensions
costs. There is some hope that for 2014 that Discount Rates may increase and
results in an improved position and lower level of pension liabilities.
LFV will be making the case that changes in pensions liabilities resulting from 7.106
changes to the Discount Rate are costs exempt from risk sharing and should be
recoverable in the next Reference Period.
The review of the ANSP pensions costs by the Swedish NSA was at a high level in 7.107
RP1.
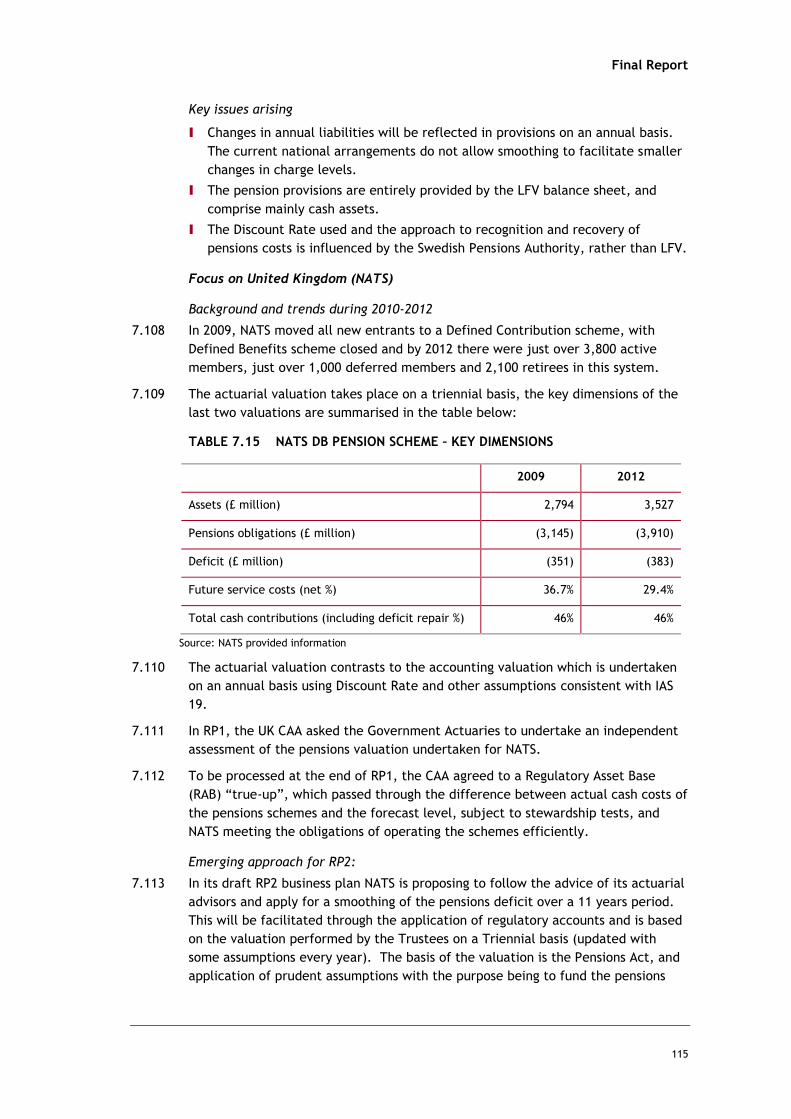
Final Report
115
Key issues arising
I Changes in annual liabilities will be reflected in provisions on an annual basis.
The current national arrangements do not allow smoothing to facilitate smaller
changes in charge levels.
I The pension provisions are entirely provided by the LFV balance sheet, and
comprise mainly cash assets.
I The Discount Rate used and the approach to recognition and recovery of
pensions costs is influenced by the Swedish Pensions Authority, rather than LFV.
Focus on United Kingdom (NATS)
Background and trends during 2010-2012
In 2009, NATS moved all new entrants to a Defined Contribution scheme, with 7.108
Defined Benefits scheme closed and by 2012 there were just over 3,800 active
members, just over 1,000 deferred members and 2,100 retirees in this system.
The actuarial valuation takes place on a triennial basis, the key dimensions of the 7.109
last two valuations are summarised in the table below:
TABLE 7.15 NATS DB PENSION SCHEME – KEY DIMENSIONS
2009 2012
Assets (£ million) 2,794 3,527
Pensions obligations (£ million) (3,145) (3,910)
Deficit (£ million) (351) (383)
Future service costs (net %) 36.7% 29.4%
Total cash contributions (including deficit repair %) 46% 46%
Source: NATS provided information
The actuarial valuation contrasts to the accounting valuation which is undertaken 7.110
on an annual basis using Discount Rate and other assumptions consistent with IAS
19.
In RP1, the UK CAA asked the Government Actuaries to undertake an independent 7.111
assessment of the pensions valuation undertaken for NATS.
To be processed at the end of RP1, the CAA agreed to a Regulatory Asset Base 7.112
(RAB) “true-up”, which passed through the difference between actual cash costs of
the pensions schemes and the forecast level, subject to stewardship tests, and
NATS meeting the obligations of operating the schemes efficiently.
Emerging approach for RP2:
In its draft RP2 business plan NATS is proposing to follow the advice of its actuarial 7.113
advisors and apply for a smoothing of the pensions deficit over a 11 years period.
This will be facilitated through the application of regulatory accounts and is based
on the valuation performed by the Trustees on a Triennial basis (updated with
some assumptions every year). The basis of the valuation is the Pensions Act, and
application of prudent assumptions with the purpose being to fund the pensions
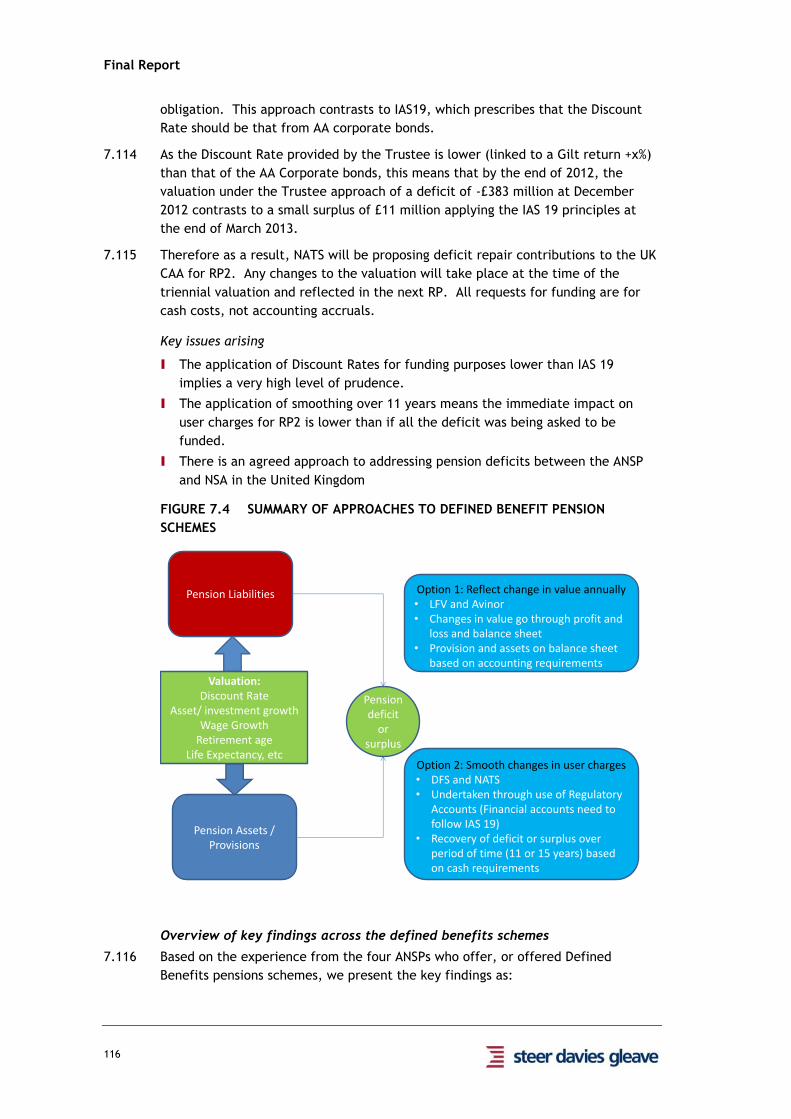
Final Report
116
obligation. This approach contrasts to IAS19, which prescribes that the Discount
Rate should be that from AA corporate bonds.
As the Discount Rate provided by the Trustee is lower (linked to a Gilt return +x%) 7.114
than that of the AA Corporate bonds, this means that by the end of 2012, the
valuation under the Trustee approach of a deficit of -£383 million at December
2012 contrasts to a small surplus of £11 million applying the IAS 19 principles at
the end of March 2013.
Therefore as a result, NATS will be proposing deficit repair contributions to the UK 7.115
CAA for RP2. Any changes to the valuation will take place at the time of the
triennial valuation and reflected in the next RP. All requests for funding are for
cash costs, not accounting accruals.
Key issues arising
I The application of Discount Rates for funding purposes lower than IAS 19
implies a very high level of prudence.
I The application of smoothing over 11 years means the immediate impact on
user charges for RP2 is lower than if all the deficit was being asked to be
funded.
I There is an agreed approach to addressing pension deficits between the ANSP
and NSA in the United Kingdom
FIGURE 7.4 SUMMARY OF APPROACHES TO DEFINED BENEFIT PENSION
SCHEMES
Overview of key findings across the defined benefits schemes
Based on the experience from the four ANSPs who offer, or offered Defined 7.116
Benefits pensions schemes, we present the key findings as:
Pension Liabilities
Pension Assets / Provisions
Pension deficit
or surplus
Valuation:Discount Rate
Asset/ investment growthWage Growth
Retirement ageLife Expectancy, etc
Option 1: Reflect change in value annually• LFV and Avinor• Changes in value go through profit and
loss and balance sheet• Provision and assets on balance sheet
based on accounting requirements
Option 2: Smooth changes in user charges• DFS and NATS• Undertaken through use of Regulatory
Accounts (Financial accounts need to follow IAS 19)
• Recovery of deficit or surplus over period of time (11 or 15 years) based on cash requirements
Final Report
117
I Discount rate is key: The view about the future Discount Rate (DR) is key to
changes in value of net pension liabilities – in general a lower DR has led to an
increase in the net funding gap between assets and liabilities. Very prudent
assumptions obliged by actuaries or law provide the driver of apparent deficits.
I ANSP specific approaches being developed: Each ANSP is developing its own
approach to this issue which differs according to historical arrangements and
state laws and requirements.
I Smoothing approach being applied for 2013 through use of Regulatory
Accounting: For 2013 onwards the smoothing approach to closing the net
pension liability gap is be applied by 2 ANSPs, but over different periods (11
years for NATS and 15 years for DFS). LFV currently plans to recognise changes
in value in the year incurred as required by its National Pensions Authority.
Avinor has not yet decided its approach to RP2, but has previously followed a
similar approach as LFV.
I NSAs review of pensions arrangements limited by available expertise and
resources: For RP1, the NSAs investigation of pensions arrangements was
limited by available expertise and resources. Investigation was undertaken in
the UK through use of the Pensions Ombudsman, but the review in Germany and
Sweden was more limited.
I Pension arrangements often involve outside authorities: The process for
determining the level of pensions costs often involves other authorities/
agencies. For example in the United Kingdom the requirements of the Pensions
Act and in Sweden the requirements of the Swedish and Norwegian Pensions
Agencies.
I Transparency required: There was general agreement from those interviewed
that greater transparency over the assumptions used for pension costs needs to
be provided to EC in Performance Plans and enable the tracking of changes in
key assumptions used in relation to “costs exempt from risk sharing” for
Reference Period 2.
Views of the stakeholders
During the consultation process, stakeholders provided their views on pensions 7.117
arrangements within the SES.
ANSPs believed that care should be taken when comparing pension schemes, for 7.118
example when one fund is required by law to be fully funded while in another
state can be partly funded. One ANSP believed that cash rather than accounting
payments should form the basis of determined costs.
ANSPs believe that NSAs rather than the EU or PRB should take the lead in 7.119
reviewing pension schemes and their cost applicability. This would then be
reflected in the State Performance Plans. ANSPs recognise that for RP2 projecting
key parameters that determine the pension scheme over 6 years is likely to lead to
errors.
An Airline Association stated that Member States rather than airspace users should 7.120
bear the consequences of pension cost decisions. A number of Airline Associations
highlighted the additional cost exempt from risk sharing resulting from changes in
accounting rules (IAS 19). A number of Airline Associations pointed out that there
was insufficient information and transparency of pension schemes during RP1, and

Final Report
118
that guidance needed to be provided to enable much greater detail of pension
schemes and their underlying assumptions to be provided to stakeholders.
Moreover, these assumptions should form the basis of any claim for costs exempt
from risk sharing at the end of RP2.
Most Airline Associations stated that pensions schemes for ANSPs should be brought 7.121
into line with systems for competitive industries and that the ability to pass
through changes in the costs exempt from risk sharing process should be removed
from the legislation. One Airline Association suggested that any benefits over and
above those provided by the comparator airline in that state should be paid for by
the State not airspace users.
A staff organisation pointed out the risk in a PAYG system when the level of social 7.122
payments are outside the control of the ANSP. Another organisation supported
greater transparency in the description of each ANSPs pensions scheme, and in
particular calculation of the discount rate applied. Staff organisations did not
support any changes to the current Regulation in relation to pensions.
Recommendations
With regards to pension arrangements, Steer Davies Gleave’s recommendations are 7.123
built around the following principles:
I ANSPs should actively seek to implement some of the full range of options
open to them to manage and mitigate pension costs risks, including transition
to other schemes and arrangements subject to negotiation and transitional
arrangements;
I Sufficient information should be provided in Performance Plans in order for the
Commission and PRB to understand the evolution of projected pension costs;
I Sufficient information should be provided in Performance Plans in order to
provide a sound basis for the future assessment by NSAs, the Commission and
PRB of "costs exempt from risk sharing";
I Different reporting requirements should be specified for the different type of
pension schemes (PAYG, DB, DC) in use across European ANSPs;
I Detailed information on Defined benefit schemes in particular should be
presented in the Performance Plans;
I Where actuarial expectations of the future Discount Rate play a key role in the
value of pension fund requirements, the timing of the valuation should be
aligned with the timing of the preparation of performance plans;
I Where there is a cash requirement to fund a pension scheme deficit,
Commission guidance should be provided as to which tools can be used by
ANSPs to meet the requirement for smoothing and changes to the level of
charges;
I There should be an explicit exemption from the Service Provision Regulation’s
requirement to follow IAS (Article 12 2: “These accounts shall comply with the
international accounting standards adopted by the Community. Where, owing
to the legal status of the service provider, full compliance with the
international accounting standards is not possible, the provider shall

Final Report
119
endeavour toachieve such compliance to the maximum possible extent”. An
explicit exemption should be provided to encourage the use of smoothing
charges through regulatory accounts.
I Cash payments, including those required for deficit or gap repair, rather than
accounting accruals payments should be recognised in calculations of pensions
costs;
I When reviewing ANSPs pension arrangements and costs, NSAs should pool their
expertise to address the complex pension cost issues.
ANSPs should be encouraged to consider the full range of options to manage
and mitigate their pensions costs risks
Subject to negotiation and transitional arrangements: 7.124
i) Moving from Defined Benefits to Defined Contributions;
ii) Average salary rather than final salary;
iii) Extending the age of retirement;
iv) Transfer of pensions liability obligations to State;
v) New joiners on a Defined Contribution Scheme.
Detailed information required for PAYG schemes
Information provided for each year of the performance plan (2015-2019) and the 7.125
period 2012-2014 preceding it:
i) % Contribution rate of the ANSP company to pensionable salary;
ii) Pensionable salary as a percentage of gross salary;
iii) Contribution rate of employee (if relevant);
iv) Description of entity responsible, and process for deciding the Contribution
rate.
Detailed information required for Defined Contribution Schemes
Information provided for each year of the performance plan (2015-2019) and the 7.126
period 2012-2014 preceding it:
i) Contribution rate of the ANSP company to pensionable salary;
ii) Pensionable salary as a percentage of gross salary;
iii) Contribution rate of employee (if relevant);
iv) Description of entity responsible for, and process for deciding the
Contribution rate.
Detailed information required for Defined Benefit Schemes
Information provided for each year of the performance plan (2015-2019) and the 7.127
period 2012-2014 preceding it:
i) Basis of cash payments to pension scheme;
ii) Discount rate applied/ predicted;
iii) Asset value growth assumed;
Final Report
120
iv) Value of pension assets and pension liabilities and Net funding surplus/ gap
calculated;
v) Description of basis of actuarial valuation (when done, by who, principles of
prudence or fair value, etc.);
vi) Assumed increase in staff salaries;
vii) Assumed increase in payment benefits; and
viii) Description of pension fund investment strategy (mix of low and higher risk,
by percentage), description of who decides on the investment strategy.
Where local legal or accounting requirements determined the approach taken by 7.128
the ANSP/ State, these should be fully explained.
Timing of pensions valuations
i) In Defined Benefit schemes, where the applicable future Discount Rate play
a key role in the value of pension fund requirements, ANSPs / States should
undertake a full valuation at the time of preparing its performance plan;
ii) Such valuation should be undertaken by a suitably qualified, independent
actuary or valuation expert. Evidence of independence of the valuation
should be provided in the Performance Plan.
Smoothing of charges (Defined Benefits Schemes)
i) The use of regulatory accounts to enable a smoothing approach to charges
should be permitted;
ii) This would mean allowing a specific exemption from IAS, as required under
Article 12(2) of the Service Provision Regulaiton 550/2004, as amended to
allow the use of Regulatory Accounts for pension cost smoothing;
i) But these accounts should be independently certified and a reconciliation to
IAS audited financial accounts provided in the Performance Plan;
ii) The number of years chosen to smooth charges over, should be based on an
independent principle (number of years of service remaining, etc.)
Cash payments rather than accounting accruals payments should be
recognised in calculations of pensions costs.
i) The principle that changes in the level of charges should be linked to cash
payments rather than accruals.
ii) The cash payments required to address pensions deficits rather than
accounting accruals should be basis of pensions costs allowed in the user
charges calculations.
iii) These cash payments can include those needed for deficit or asset gap
repair.
Pooling of NSA expertise to address complex issues
i) NSAs should consider greater pooling of financial expertise, either at a FAB
or NSA Co-ordination Group level;
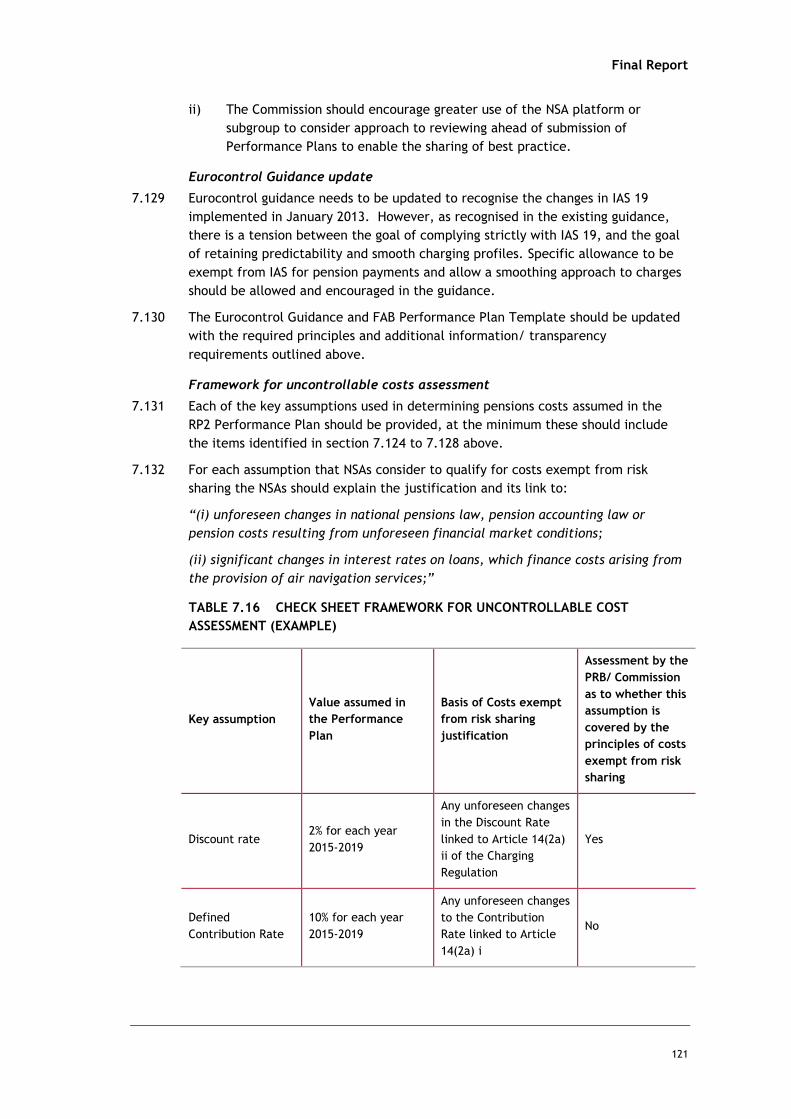
Final Report
121
ii) The Commission should encourage greater use of the NSA platform or
subgroup to consider approach to reviewing ahead of submission of
Performance Plans to enable the sharing of best practice.
Eurocontrol Guidance update
Eurocontrol guidance needs to be updated to recognise the changes in IAS 19 7.129
implemented in January 2013. However, as recognised in the existing guidance,
there is a tension between the goal of complying strictly with IAS 19, and the goal
of retaining predictability and smooth charging profiles. Specific allowance to be
exempt from IAS for pension payments and allow a smoothing approach to charges
should be allowed and encouraged in the guidance.
The Eurocontrol Guidance and FAB Performance Plan Template should be updated 7.130
with the required principles and additional information/ transparency
requirements outlined above.
Framework for uncontrollable costs assessment
Each of the key assumptions used in determining pensions costs assumed in the 7.131
RP2 Performance Plan should be provided, at the minimum these should include
the items identified in section 7.124 to 7.128 above.
For each assumption that NSAs consider to qualify for costs exempt from risk 7.132
sharing the NSAs should explain the justification and its link to:
“(i) unforeseen changes in national pensions law, pension accounting law or
pension costs resulting from unforeseen financial market conditions;
(ii) significant changes in interest rates on loans, which finance costs arising from
the provision of air navigation services;”
TABLE 7.16 CHECK SHEET FRAMEWORK FOR UNCONTROLLABLE COST
ASSESSMENT (EXAMPLE)
Key assumption
Value assumed in
the Performance
Plan
Basis of Costs exempt
from risk sharing
justification
Assessment by the
PRB/ Commission
as to whether this
assumption is
covered by the
principles of costs
exempt from risk
sharing
Discount rate 2% for each year
2015-2019
Any unforeseen changes
in the Discount Rate
linked to Article 14(2a)
ii of the Charging
Regulation
Yes
Defined
Contribution Rate
10% for each year
2015-2019
Any unforeseen changes
to the Contribution
Rate linked to Article
14(2a) i
No


Final Report
Appendix A
APPENDIX
A
QUESTIONNAIRES USED

Final Report
Appendix A1
A1 APPENDIX 1
ANSP and NSA questionnaire
Please note that all questions refer to RP1
General questions
1. Please could you detail the ownership structure of your ANSP in more details
than what was provided in the latest Economic Information Disclosure question
3.2.1. In particular could you please detail your capital structure (equity and
debt) and/or how much you are Government owned if relevant.
2. Please describe the financial, operational and managerial relationships between
the ANSP and Government.
Asset Base
3. Please could you detail the composition of your fixed asset base (e.g. amounts
of tangible and intangible assets)?
4. How is the asset base used in the computation of the charge for cost of capital
recovery calculated?
5. Please detail any adjustments made by your NSA to the fixed asset base, and
the rationale for these.
6. Please detail the accounting policies which are relevant to the fixed asset
valuation (e.g. if historic/modified historic/current cost is adopted, revaluation,
depreciation and amortisation policies). Please differentiate by asset category
as appropriate.
7. Please detail the level of net current assets included in the asset base, and how
these are calculated.
8. Please could you provide a comparison of:
i) The asset base used in the calculation of the charge for cost of capital
recovery;
ii) The book value of equity and long term debt; and
iii) The market value of equity and long term debt (if applicable).
9. Please could you provide a comparison of:
i) The charges made for cost of capital recovery;
ii) The interest costs incurred;
iii) The dividends paid (if any); and
iv) The operational risks materialising, measured as the net variance in costs
and revenues from planned values.
10. Do you think only one approach for the valuation of assets should be
recommended or should a limited number of approached be allowed? Why?
11. Please clarify the approach(es) you would recommend.

Final Report
Appendix A2
Cost of Capital
12. What are the sources of finance for your ANSP's assets?
i) Please detail the source(s) of finance for the debt and provide the value of
the Debt (in your currency or in €);
ii) Please detail the source(s) of finance for the equity and provide the value of
the equity (in your currency or in €) ;
iii) Please provide the value for the Total (in your currency or in €);
13. What is the (estimated) cost of each of these sources of finance?
i) Debt (in %)
ii) Equity (in %)
14. Regarding the debt, how have the market rates been calculated (please provide
actual calculations and references to data sources, as appropriate) for:
i) The risk free rate (%)
ii) The debt risk premium (%)
iii) The total cost of debt finance (%)
15. Regarding the equity, how have the market rates been calculated (please
provide actual calculations and references to data sources, as appropriate) for:
i) The risk free rate (%)
ii) The market equity risk premium (%)
iii) The equity beta (#)
iv) The total cost of equity finance (%)
16. How has tax relief on debt interest payments been treated in the calculation of
the cost of capital?
17. What tax relief did you apply?
18. Please could you fill in the attached spreadsheet (displayed after ANSP
Questionnaire) with your calculation of the weighted average cost of capital
based on its individual components?
If this figure does not reconcile with the determined cost of capital for RP1,
explain the nature of the differences, and the rationale for any adjustments that
were made to the WACC before it was applied to the asset base.
19. If the Cost of Capital has been calculated based on other approaches than the
Capital Asset Pricing Model, please provide a detailed, step-by-step calculation
including references to sources of data/ evidence.
20. How relevant do you think is the Capital Asset Pricing Model for calculation of
the ANSPs Cost of Capital? Which adjustments (if any) would you suggest?
21. Which comparator companies/industries have been used in the estimation of
weighted average cost of capital (or its components)?
Final Report
Appendix A3
22. Please detail the main sources of business risk faced by your ANSP (for terminal
and en-route)
23. Please explain how the actual sources of business risk have been quantitatively
measured.
24. Please quantify historic exposure to each of these risks (e.g. revenue variation
compared to forecasts) and explain to what extent these are uncontrollable
and/ or unforeseen.
25. Please detail the main sources of financial risk faced by your ANSP (for terminal
and en-route)
26. Please explain how the actual sources of financial risk have been quantitatively
measured.
27. Please quantify historic exposure to each of these risks (e.g. revenue variation
compared to forecasts) and explain to what extent these are uncontrollable
and/ or unforeseen.
28. Which traded companies and/or industries would serve as good comparators for
the risks profile faced by your ANSP?
29. Where your ANSP is financed by the State (equity and/ or debt), please detail
how the State is compensated for the finance provided (interest on debt,
dividends, etc) and quantify historic and predicted future returns.
30. In your opinion what should be the recommended method for calculating a
“reasonable” profitability for en-route ANS provision?
31. And for terminal ANS provision?
32. Would the calculation of Cost of Capital be different if looked at from A FAB
perspective?
Pension systems
33. Is there a State pension system in the State of your ANSP? Is it a compulsory
system where contributions have to be made on behalf of all employees?
34. Is the ANSP required to make payments to the State pension system (the State
pension system is sometimes called “national insurance” or “social insurance”)
on behalf of its staff?
35. Is the staff required to make payments to the State pension system (the State
pension system is sometimes called “national insurance” or “social insurance”)?
36. Does the ANSP make payments into any other pension schemes on behalf of its
staff, apart from the State pension system if applicable? These plans can be
occupational or personal.
37. Is this a requirement by law or a benefit provided by the ANSP?
38. Does the staff make payments into any other pension schemes (these plans can
be occupational or personal)?
39. Is that on a voluntary basis or is it a requirement?
Final Report
Appendix A4
40. If payments are made by the ANSP to any other non-State pension system, is
that into a “Defined Benefits” or “Defined Contribution” schemes or both?
Please clarify the status of both schemes and how employees qualify for each
scheme.
41. Please clarify which scheme is available for all categories of staff (ATCOs and
non-ATCOs)?
Retirement age
42. What is the current legal retirement age in your State? (For men and women).
Are there different rules for civil servants and the private sector? Please also
indicate if any changes to these ages are foreseen, and if so what they are.
43. What is (if any) the current legal retirement age for ATCOs? Please detail men
and women. Please also indicate if any changes to these ages are foreseen, and
if so what they are.
44. What is the effective retirement age for ATCOs? Please detail men and women.
Please also indicate if any changes to these ages are foreseen, and if so what
they are.
Pension costs
45. How is the charge for recovery of pensions costs calculated?
46. Please detail the cash costs (e.g. payments into Defined Contribution or PAYG
schemes, employer contributions to Defined Benefit schemes) included in the
charge.
47. Please detail the non-cash costs included in the charge relating to Defined
Benefit schemes (or any other relevant schemes), such as current and past
service costs, interest costs, expected return on assets, any
curtailments/settlements, actuarial gains and losses.
48. For your ANSP, do you expect that pension costs will increase or decrease in the
future? Please give reasons.
49. Is it driven by changes to the national legislation or by changes to your ANSP
only? Please explain.
50. Will the calculation of the pension charge be affected by abandonment of the
‘corridor approach’ under IAS 19, which previously allowed actuarial
gains/losses within the 10% corridor not to be recognised in income or equity? If
so, can you please detail how?
51. Do you expect to make an additional ‘uncontrollable’ cost recovery in respect of
pensions, either arising from the change to IAS 19 or for another reason? (If so,
please detail the reason)
52. Should non-cash pension costs be recovered through cash charges to users? If
so, why?

Final Report
Appendix A5
53. What other means of cost recovery of non-cash pension costs might be
appropriate?
54. In your opinion, which are the most problematic requirements of IAS19 on
pension costs? Should some of these requirements be removed? And if so which
ones?
55. On pensions, should the potential to phase in changes in valuation over a 5 or
10-year rolling period be considered? Why?
Guidance
56. What do you think of the RP1 framework (in terms of information to provide,
level of detail, structure of the reporting sheets, etc) ?
57. How do you think it could be improved for RP2? Please specify and join
examples if necessary
58. What guidance do you think should be provided to your ANSP and/or States
regarding your assessment of business and financial risks? Please explain
59. What guidance should be provided to your ANSP regarding your valuation of
assets?
60. What sort of guidance should be provided to your ANSP and/or States regarding
your specific pension-related information to be included in their Performance
Plans? Please detail
Final Report
Appendix A6
Users and others questionnaire
General
1. What do you think are the real issues regarding ANSPs Cost of Capital?
2. What do you think are the most important issues with the pension arrangements
of ANSPs?
3. And with the pension costs of ANSPs?
Return on Equity
4. What guidance do you think should be provided to States and/or ANSPs
regarding their assessment of business and financial risks? Please explain
5. What guidance should be provided to ANSPs regarding their valuation of assets?
6. What sort of risk premium would you typically expect ANSPs to apply on top of
long-term government bond yields?
Pension costs
7. Have you noticed any impact on ANSPs pension related items consecutive to the
change in accounting rules in IFRS (IAS 19)?
8. What sort of guidance should be provided to States and/or ANSPs regarding their
specific pension-related information to be included in their Performance Plans?
Please detail
Role of the Regulator
9. Should the regulatory framework be changed for the determination of Return on
Equity and Cost of Capital calculations and if so, how? Please specify
10. Should the regulatory framework be changed for the determination of Pension
costs and if so, how? Please specify
11. Any other comments?
Final Report
Appendix A7
Pension specific questionnaire for ANSPs and NSAs- State has the
obligation to provide a pension
General
1. Who exactly is responsible for the management of the Scheme?
2. Is the Scheme managed as a PAYG scheme with intergenerational transfer or is
the scheme funded (funded plans draw benefits from their accrued assets)?
3. Is there a special scheme for ANSP employees or are they entitled to the same
Scheme as other Civil Servants? Please explain
4. Is there are any differences in treatment between ATCOs and non-ATCOs?
5. Is there a different pension scheme for Civil Servants and the rest of the
employees in your State? Please explain
6. Is the pension Scheme for your ANSP employees and retirees made of different
sections (such as base scheme and additional scheme) or is there a unique
Scheme?
Contributions
7. Which percentage of individual employee gross salary is the ANSP employer
contribution? Please detail for each section of the scheme (as per Q6) if
relevant;
8. Is there a minimum contribution rate for the employee? If so which percentage
of individual employee gross salary is the employee contribution? Please detail
for each section of the scheme (as per Q6) if relevant;
9. Are scheme contributions based on the full employee earnings (also called
“pensionable earnings”) or only on some earnings (also called “qualified
earnings”) with lower and higher pay threshold for instance? Please specify
10. Are all employee earnings (salary, wages, bonuses, overtime, statutory sick pay,
statutory maternity pay, etc) taken into account in the calculation of
pensionable or qualified earnings or only some of them? Please explain
11. Is there a contribution ceiling? If so, what is it?
Risks faced by the Scheme
12. Please detail all the risks faced by the Scheme;
13. Please explain the processes in place to evaluate risks;
14. Please explain how exposed you believe the scheme is to these risks.

Final Report
Appendix A8
Pension questionnaire for ANSPs and NSAs - Defined Benefit Pension
Scheme
General
1. What is the legislation covering Defined Benefits Schemes in your State?
2. Is application of IFRS/IAS rules compulsory or is it left to the choice of your
ANSP?
3. Could you please describe the profile of the membership of your Scheme?
4. Who is responsible for the management of the Scheme?
5. Is the Defined Benefit scheme still opened to new members? Is that for all
categories of staff (ATCOs and non-ATCOs)?
6. Is the Defined Benefit scheme still open for future accrual? Is that for all
categories of staff (ATCOs and non-ATCOs)?
7. In which country is the Scheme tax-registered?
8. In the most recent financial year, what is the size (in € or in your currency) of
the scheme assets?
9. In the most recent financial year, what is the size (in € or in your currency) of
the scheme liabilities?
Scheme Valuation
10. What was the effective date of the last Scheme independent valuation that was
undertaken (month/year)?
11. With which frequency are valuations of your scheme undertaken?
12. Is this a legal requirement?
13. Who undertook the latest valuation of your scheme? If it is an external company,
it is totally independent (legally, financially and operationally) of your ANSP?
Scheme accounting
14. Does the difference between the assets and liabilities of the pension scheme
need to be included in the ANSP balance sheet? Or are they recognised via the
Statement of Other Recognised Income and Expense?
15. How are the surpluses (assets greater than liabilities) treated? Do they need to
be recognised immediately or are they spread over several years? Do they need
to appear on the Profit and Loss account?
16. How are the increases/decreases in liabilities treated? Are they recognised
immediately as per IAS 19 or are they spread over several years? Do they need
to appear on the Profit and Loss account?
Discount rates
17. Please indicate if discount rates are taken into account in the valuation using
either:
i) the yield on assets held by the scheme to fund future benefits and the
anticipated future investment returns;

Final Report
Appendix A9
ii) the market redemption yields on government or high quality bonds;
iii) Both
iv) Any other method (please detail)
18. Does your local legislation allow you to smooth your discount rates?
19. What has been the impact on your scheme of IAS 19 requirement of bonds with
AA credit rating?
20. Are there some country (or others) specific rules that you must follow for the
choice of your discount rates?
21. And choice of bonds and equity investments?
Investment returns assumptions
22. What are the investment performance assumptions assumed? Please detail
23. Which rules do you have to follow for the investment of your assets? Please
detail
Risks faced by the Scheme
24. Please detail all the risks faced by the Scheme;
25. Please explain the processes in place to evaluate risks;
26. Please explain how exposed you believe the scheme to be to these risks.
27. Do you feel there is sometimes a tension between the need for the pension
scheme contribution and any other investment in the ANSP’s business? If so, how
are these tensions arbitrated?
28. If the scheme was in deficit, has a recovery plan been agreed? If so:
29. What is its length (in years);
i) How much do the contributions represent as a percentage of the technical
provisions deficit?
ii) Do you think the recovery plan contributions and the amount of investment
risk appropriately reflects the relative strength of the ANSP and also the
affordability of contributions?
iii) How many extra years of currently planned deficit recovery contributions
(DRCs) would be required to meet the increase in deficit if no other
flexibilities were used?
Contributions
30. What is the average level of employer contribution per employee (in % and € or
local currency) in your latest financial year?
31. Do you think that the current level of employee contributions can be
maintained?
32. Do you think the ANSP would be able to increase the level of its contributions if
necessary?

Final Report
Appendix A10
Pension questionnaire for ANSPs and NSAs - Defined Contribution
Pension Scheme
Please could you provide us with a copy of your most recent financial report?
General
1. What is the legislation covering Defined Contribution Schemes in your State?
2. Is application of IFRS/IAS rules compulsory or is it left to the choice of your
ANSP?
3. Could you please describe the profile of the membership of your Scheme?
4. Who is responsible for the management of the Scheme?
5. As far as you are aware, is enrolment in your scheme compulsory for ANSP staff
or it voluntary? Is this the case for both ATCOs and non-ATCOs?
6. Which percentage of individual employee gross salary is the ANSP employer
contribution?
7. Is there a minimum contribution rate for the employee? If so which percentage
of individual employee gross salary is the employee contribution?
8. Are scheme contributions based on the full employee earnings (also called
“pensionable earnings”) or only on some earnings (also called “qualified
earnings”) with lower and higher pay threshold for instance? Please specify
9. In which country is the Scheme tax-registered?
Scheme Valuation
10. What was the effective date of the last Scheme independent valuation that was
undertaken (month/year)?
11. With which frequency are valuations of your scheme undertaken?
12. Is this a legal requirement?
13. Who undertook the latest valuation of your scheme? If it is an external company,
it is totally independent (legally, financially and operationally) of your ANSP?
Investments
14. What are the investment principles of your Scheme?
15. Which rules (if any) do you have to follow for the investment of your assets?
Please detail
16. Please describe the investment strategies that you offer to your members?
(Number available, risk profile, etc). Are the same options available for ATCOs
and non-ATCOs?
17. Is there a default investment strategy for members automatically enrolled in the
Scheme?
Scheme performance
18. Please describe the mechanisms in place to review scheme performance;
19. How often do these reviews take place?

Final Report
Appendix A11
20. Are the results communicated to the Sponsor (i.e. the ANSP)?
21. How much do cost and charges make of the employees contributions?
22. Are Pension Schemes costs and charges regulated in your country?
23. Which consideration is given to asset protection in your Scheme?
24. Do you have any compensation arrangements in place?
25. Are any parts of the Scheme management outsourced? Please detail
26. Which processes are in place to ensure adequate performance of service
providers and/or advisors?
Role of the Trustees
27. How are Trustee to the Scheme appointed?
28. What are the procedures in place in your Scheme for checking conflict of
interests of Trustees?
29. Do they all have professional pension qualifications?
30. Are written record of Trustee meetings kept?
Risks faced by the Scheme
31. Please detail all the risks faced by the Scheme;
32. Please explain the processes in place to evaluate risks;
33. Please explain how exposed you believe the scheme to be to these risks.
34. Is there a capital guarantee for Scheme Members?
Final Report
Appendix A12
Pension questionnaire for ANSPs and NSAs - Hybrid Pension Scheme (a
hybrid pension scheme is a scheme which is neither purely a DB nor
purely a DC, but which generally has elements of both)
General
1. What is the legislation covering Hybrid Schemes in your State?
2. Is application of IFRS/IAS rules compulsory or is it left to the choice of your
ANSP?
3. Could you please describe the profile of the membership of your Scheme?
4. Is your Hybrid Scheme open to all ANSPs employees? Is that for all categories of
staff (ATCOs and non-ATCOs)?
5. In which country is the Scheme tax-registered?
Type of Hybrid Scheme
6. Which of the following statements best describes the structure of the benefits
offered to members of your scheme:
i) Self-annuitising (Benefits accrue on a DC scheme but the pension is paid by
the scheme, rather than each member’s pot being used to buy their
pension);
ii) Combination (both DB and DC benefits accrue at the same time);
iii) Sequential (Both DB and DC benefits accrue in the scheme but not at the
same time: for instance members start in the DC section and move into the
DB section after a specified number of years);
iv) DB or DC scheme entitlement (DB scheme with a DC underpin, e.g. a scheme
that will pay a member the better of their DB or DC benefit);
v) DB entitlement with DC Additional Voluntary Contributions;
vi) DB Scheme contracted out on a DC basis;
vii) DC Scheme contracted out on a DB basis;
viii) Other (Please specify);
7. Which of the following most closely describes how these benefits accrue?
8. Monies are invested in a separate DB scheme and in a separate DC scheme;
i) All monies are invested in a DB Scheme;
ii) All monies are invested in a DC Scheme;
iii) Other (Please specify);
Scheme Management
9. Are assets for the DB and DC Schemes held together or separately?
10. Does your scheme’s Annual Report & Accounts separate out DB and DC
investments?
11. Are DB and DC monies held within the same bank account?

Final Report
Appendix A13
12. Are you able to identify at any given time which monies belong to which
members of which scheme?
13. Are there separate investment strategies for the DB and DC sections of the
scheme?
14. Please describe your investment strategies and applicable rules (if any) for the
DB section of the Scheme;
15. Please describe your investment strategies and applicable rules (if any) for the
DC section of the Scheme;
16. Does your scheme have any pooled investments?
Scheme Valuation
17. What was the effective date of the last Scheme independent valuation that was
undertaken (month/year)?
18. With which frequency are valuations of your scheme undertaken?
19. Is this a legal requirement?
20. Who undertook the latest valuation of your scheme? If it is an external company,
it is totally independent (legally, financially and operationally) of your ANSP?
Risks faced by the Scheme
21. Please detail all the risks faced by the Scheme;
22. Please explain the processes in place to evaluate risks;
23. Please explain how exposed you believe the scheme to be to these risks.
24. If the scheme was in deficit, has a recovery plan been agreed? If so:
25. What is its length (in years);
i) How much do the contributions represent as a percentage of the technical
provisions deficit?
ii) Do you think the recovery plan contributions and the amount of investment
risk appropriately reflects the relative strength of the ANSP and also the
affordability of contributions?
iii) How many extra years of currently planned deficit recovery contributions
(DRCs) would be required to meet the increase in deficit if no other
flexibilities were used?
Role of the Trustees
26. How are Trustee to the Scheme appointed?
27. What are the procedures in place in your Scheme for checking conflict of
interests of Trustees?
28. Do they all have professional pension qualifications?
29. Are written record of Trustee meetings kept?

Final Report
Appendix A14
DB section of the Scheme
Scheme accounting (for the DB section of the Scheme)
30. In the most recent financial year, what is the size (in € or in your currency) of
the scheme assets?
31. In the most recent financial year, what is the size (in € or in your currency) of
the scheme liabilities?
32. Does the difference between the assets and liabilities of the pension scheme
need to be included in the ANSP balance sheet? Or are they recognised via the
Statement of Other Recognised Income and Expense?
33. How are the surpluses (assets greater than liabilities) treated? Do they need to
be recognised immediately or are they spread over several years? Do they need
to appear on the Profit and Loss account?
34. How are the increases/decreases in liabilities treated? Are they recognised
immediately as per IAS 19 or are they spread over several years? Do they need
to appear on the Profit and Loss account?
Discount rates (for the DB section of the Scheme)
35. Please indicate if discount rates are taken into account in the valuation using
either:
i) the yield on assets held by the scheme to fund future benefits and the
anticipated future investment returns;
ii) the market redemption yields on government or high quality bonds;
iii) Both
iv) Any other method (please detail)
36. Does your local legislation allow you to smooth your discount rates?
37. What has been the impact on your scheme of IAS 19 requirement of bonds with
AA credit rating?
38. Are there some country (or others) specific rules that you must follow for the
choice of your discount rates?
39. And choice of bonds and equity investments?
Investment returns assumptions (for the DB section of the Scheme)
40. What are the investment performance assumptions assumed? Please detail
Contributions (for the DB section of the Scheme)
41. What is the average level of employee contribution per employee in your latest
financial year?
42. Do you think that the current level of employee contributions can be
maintained?
43. Do you think the ANSP would be able to increase the level of its contributions if
necessary?

Final Report
Appendix A15
DC section of the Scheme
General (for the DC section of the Scheme)
44. Which percentage of individual employee gross salary is the ANSP employer
contribution?
45. Is there a minimum contribution rate for the employee? If so which percentage
of individual employee gross salary is the employee contribution?
46. Are scheme contributions based on the full employee earnings (also called
“pensionable earnings”) or only on some earnings (also called “qualified
earnings”) with lower and higher pay threshold for instance? Please specify
Investments (for the DC section of the Scheme)
47. Please describe the investment strategies that you offer to your members?
(Number available, risk profile, etc). Are the same options available for ATCOs
and non-ATCOs?
48. Is there a default investment strategy for members automatically enrolled in the
Scheme?
Scheme performance (for the DC section of the Scheme)
49. Please describe the mechanisms in place to review the DC scheme performance;
50. How often do these reviews take place?
51. Are the results communicated to the Sponsor (i.e. the ANSP)?
52. How much do cost and charges make of the employees contributions?
53. Are Pension Schemes costs and charges regulated in your country?
54. Which consideration is given to asset protection in your Scheme?
55. Do you have any compensation arrangements in place?
56. Are any parts of the Scheme management outsourced? Please detail
57. Which processes are in place to ensure adequate performance of service
providers and/or advisors?


C:\Users\rfineman\Desktop\Final Report Cost of Capital and Pensions - v2 - 25 March 2014.docx
Control Sheet
CONTROL SHEET
Project/Proposal Name Study on Cost of Capital, Return on Equity and Pension
Costs of Air Navigation Service Providers
Document Title Final Report
Client Contract/Project No. Click here to enter text.
SDG Project/Proposal No. 22591001
ISSUE HISTORY
Issue No. Date Details
1 28 Feb 2014 Final Report
2 24 March 2014 Final Report – correction of stakeholder
participation
REVIEW
Originator Clémence Routaboul
Other Contributors Stephen Wainwright, Simon Ellis, Lars Rognlien, Stephen
Luckhurst, Sriram Lakshman
Review by: Print Simon Ellis
Sign
DISTRIBUTION
Client: European Commission
Steer Davies Gleave: Project team