study of the effectiveness of itd pavement design method
TRANSCRIPT

RP 199
Study of the Effectiveness of ITD
Pavement Design Method
By
Fouad M. Bayomy
Sherif M. El-Badawy
National Institute for Advanced Transportation Technology
University of Idaho
Prepared for
Idaho Transportation Department
Research Program
Division of Highways, Resource Center
http://itd.idaho.gov/planning/research/
November 2011
IDA
HO
TR
AN
SPO
RT
AT
ION
DE
PA
RT
ME
NT
R
ESE
AR
CH
RE
PO
RT

DISCLAIMER
This document is disseminated under the sponsorship of the Idaho Transportation Department and the United States Department of Transportation in the interest of information exchange. The State of Idaho and the United States Government assume no liability of its contents or use thereof.
The contents of this report reflect the views of the author(s), who are responsible for the facts and accuracy of the data presented herein. The contents do not necessarily reflect the official policies of the Idaho Transportation Department or the United States Department of Transportation.
The State of Idaho and the United States Government do not endorse products or manufacturers. Trademarks or manufacturers' names appear herein only because they are considered essential to the object of this document.
This report does constitute a standard, specification or regulation on report format.

i
1. Report No. FHWA-ID-11-199
2. Government Accession No. 3. Recipient's Catalog No.
4. Title and Subtitle Study of the Effectiveness of ITD Pavement Design Method
5. Report Date November 2011
6. Performing Organization Code KLK558
7. Author(s) Fouad Bayomy and Sherif El-Badawy
8. Performing Organization Report
9. Performing Organization Name and Address National Institute for Advanced Transportation Technology University of Idaho PO Box 440901; 115 Engineering Physics Building; Moscow, ID 83844-0901
10. Work Unit No. (TRAIS)
11. Contract or Grant No. RP199
12 . Sponsoring Agency Name and Address Research Program, Division of Highways, Resource Center, Idaho Transportation Department 3311 West State Street Boise, ID 83707-5881
13. Type of Report and Period Final Report 01/01/2010 to 11/30/2011
14. Sponsoring Agency Code
15. Supplementary Notes
16. Abstract The current ITD design method for flexible pavement is an empirical procedure based on R-value of the subgrade. There are claims that this design method is conservative and that ITD’s calculated Equivalent Single Axle Loads (ESALs) are also conservative compared to the surrounding states. Thus, the main objective of this research was to compare the pavement design using the ITD’s current design method with the pavement design using the AASHTO 1993 design guide and the Mechanistic-Empirical Pavement Design Guide (MEPDG). Furthermore, the research aimed to evaluate the methods of ESAL calculations as well as the traffic volume projection methods that are adopted in Idaho. A total of 8 in-service pavement sections located in different regions in the state were selected in coordination with ITD engineers. The key factor was the availability of design information for these sections. For each pavement section, the ITD design was checked, and the section was redesigned using the AASHTO 1993 design guide and MEPDG. All designs using AASHTO 1993 and MEPDG were developed at 50 and 85 percent reliability levels. The nationally calibrated MEPDG software (Version 1.1) was used to predict the performance of the 3 design methods. Design inputs for MEPDG were established as Level 2 for Hot Mix Asphalt and subgrade materials. All other MEPDG inputs were selected as Level 3. To evaluate the designs by various methods, MEPDG was used to predict performance for the pavement sections designed by the three methods, and then compared to each other. Also, the performance predicted by MEPDG was compared to actual performance to the extent of performance data available in ITD pavement management system. For ESAL and traffic evaluation, ITD’s ESAL calculation method and traffic volume projection methods were studied, analyzed, and compared with other states. New truck factors were developed for ITD based on the analysis of weight-in-motion (WIM) data located in Idaho. ITD climatic factors were also analyzed and compared with MEPDG. Results showed that, relative to AASHTO 1993 and MEPDG procedures, ITD design method leads to thicker unbound layer(s) than the other methods. On the other hand, the AASHTO 1993 and MEPDG guides show reasonable agreement on the resulting pavement structure. ITD’s current truck classification system and truck factors yield highly conservative ESALs compared to other state factors as well as regional and statewide factors developed. Finally, current ITD climatic zones are not consistent and yield different stresses based on MEPDG analysis.
17. Key Word AASHTO 1993, MEPDG, Flexible Pavement, ESAL, Performance, ITD R-Value method
18. Distribution Statement Unrestricted. This document is available to the public at http://itd.idaho.gov/planning/research/archived/closed.htm
19. Security Classif. (of this report) Unrestricted
20. Security Classif. (of this page) Unrestricted
21. No. of Pages 215
22. Price

ii
METRIC (SI*) CONVERSION FACTORS
APPROXIMATE CONVERSIONS TO SI UNITS APPROXIMATE CONVERSIONS FROM SI UNITS Symbol When You Know Multiply By To Find Symbol Symbol When You Know Multiply By To Find Symbol
LENGTH LENGTH
in inches 25.4 mm mm millimeters 0.039 inches in
ft feet 0.3048 m m meters 3.28 feet ft
yd yards 0.914 m m meters 1.09 yards yd
mi Miles (statute) 1.61 km km kilometers 0.621 Miles (statute) mi
AREA AREA
in2 square inches 645.2 millimeters squared cm2 mm2 millimeters squared 0.0016 square inches in2
ft2 square feet 0.0929 meters squared m2 m2 meters squared 10.764 square feet ft2
yd2 square yards 0.836 meters squared m2 km2 kilometers squared 0.39 square miles mi2
mi2 square miles 2.59 kilometers squared km2 ha hectares (10,000 m2) 2.471 acres ac
ac acres 0.4046 Hectares ha
MASS
(weight)
MASS
(weight)
oz Ounces (avdp) 28.35 Grams g g grams 0.0353 Ounces (avdp) oz
lb Pounds (avdp) 0.454 Kilograms kg kg kilograms 2.205 Pounds (avdp) lb
T Short tons (2000 lb) 0.907 Megagrams mg mg megagrams (1000 kg) 1.103 short tons T
VOLUME VOLUME
fl oz fluid ounces (US) 29.57 Milliliters mL mL milliliters 0.034 fluid ounces (US) fl oz
gal Gallons (liq) 3.785 Liters liters liters liters 0.264 Gallons (liq) gal
ft3 cubic feet 0.0283 meters cubed m3 m3 meters cubed 35.315 cubic feet ft3
yd3 cubic yards 0.765 meters cubed m3 m3 meters cubed 1.308 cubic yards yd3
Note: Volumes greater than 1000 L shall be shown in m3
TEMPERATURE
(exact)
TEMPERATURE
(exact)
oF Fahrenheit
temperature
5/9 (oF-32) Celsius
temperature
oC oC Celsius temperature 9/5 oC+32 Fahrenheit
temperature
oF
ILLUMINATION ILLUMINATION
fc Foot-candles 10.76 Lux lx lx lux 0.0929 foot-candles fc
fl foot-lamberts 3.426 candela/m2 cd/cm2 cd/cm2 candela/m2 0.2919 foot-lamberts fl
FORCE and
PRESSURE or
STRESS
FORCE and
PRESSURE or
STRESS
lbf pound-force 4.45 newtons N N newtons 0.225 pound-force lbf
psi pound-force per
square inch
6.89 kilopascals kPa kPa kilopascals 0.145 pound-force
per square inch
psi

iii
Acknowledgements
This project was funded by the Idaho Transportation Department (ITD) under a contract with the National
Institute for Advanced Transportation Technology (NIATT), ITD Research Project No. RP199. Many
individuals have contributed to the progress of this project.
From ITD, thanks are due to Mike Santi and Ned Parrish and their supporting staff for their efforts to help
the research team complete the project tasks. Thanks to Scott Fugit (Roadway Data section), Pat Lightfield
and Chad Clawson (District 2), for their time, effort, and constructive feedback during the analysis tasks,
and also for providing the data needed for the project.
The support of the NIATT administrative staff is also acknowledged. Thanks are due to Mrs. Tami Nobel
and Ms. Debbie Foster for their dedicated efforts in facilitating the project administration. Authors are
very thankful to all their efforts and support

iv
.

v
Table of Contents List of Acronyms ............................................................................................................................................ xxii
Executive Summary ...................................................................................................................................... xxiii
Introduction ............................................................................................................................................. xxiii
Research Methodology ............................................................................................................................ xxiii
Key Findings ............................................................................................................................................. xxiv
Conclusions ............................................................................................................................................... xxv
Recommendations .................................................................................................................................... xxv
Chapter 1. Introduction ................................................................................................................................... 1
Background .................................................................................................................................................. 1
Problem Statement ...................................................................................................................................... 1
Research Objectives ..................................................................................................................................... 1
Scope of Work .............................................................................................................................................. 2
Report Organization ..................................................................................................................................... 2
Chapter 2. Flexible Pavement Design Practice in the U.S. .............................................................................. 3
Introduction ................................................................................................................................................. 3
Current Flexible Pavement Design Practice in the U.S. ............................................................................... 3
Current Flexible Pavement Design Practice in the Western States ............................................................. 5
Overview of Idaho Flexible Pavement Design Method ................................................................................ 6
ITD Design Method Required Inputs ........................................................................................................ 6
Overview of AASHTO 1993 Pavement Design Method ................................................................................ 7
AASHTO 1993 Design Method Required Inputs ....................................................................................... 7
Overview of MEPDG Pavement Design Method .......................................................................................... 8
MEPDG Required Inputs........................................................................................................................... 9
Chapter 3. Comparison of Idaho Flexible Pavement Design Procedure with AASHTO 1993
and MEPDG Methods ................................................................................................................... 11
Introduction ............................................................................................................................................... 11
Selected Projects ........................................................................................................................................ 11
ITD Pavement Performance Management Information System ............................................................... 12
Performance Indicators for the Selected Pavement Sections ................................................................... 13
Analysis Procedure ..................................................................................................................................... 14
Project Input Data for Each Design Method .............................................................................................. 15

vi
ITD’s Inputs for the Investigated Projects .............................................................................................. 15
AASHTO 1993 Inputs for the Investigated Projects ............................................................................... 16
MEPDG Inputs for the Investigated Projects ......................................................................................... 18
Pavement Structure Design ....................................................................................................................... 20
Results and Analysis ................................................................................................................................... 20
Structure Design at 50 Percent Reliability Level .................................................................................... 20
MEPDG Predicted Distresses at 50 Percent Reliability .......................................................................... 24
Structure Design at 85 Percent Reliability Level .................................................................................... 29
MEPDG Predicted Distresses for Structures Designed at 85 Percent Reliability ................................... 33
Construction Cost Comparison .................................................................................................................. 37
Chapter 4. Pavement Performance Evaluation using MEPDG ...................................................................... 39
Introduction ............................................................................................................................................... 39
Investigated Projects and Input Data ......................................................................................................... 39
Field Measured and MEPDG Predicted Performance ................................................................................ 45
Rutting Performance of the Investigated Projects ................................................................................. 45
Cracking Performance of the Investigated Projects ............................................................................... 53
International Roughness Index .............................................................................................................. 57
Performance at Different Reliability Levels and Longer Pavement Age .................................................... 58
Chapter 5. Comparison of ITD and Other States ESAL Calculation Methods ................................................ 63
AASHTO 1993 ESAL Calculation.................................................................................................................. 63
ITD ESAL Calculation ................................................................................................................................... 65
Washington State Department of Transportation ESAL Calculation ......................................................... 67
Utah Department of Transportation ESAL Estimation ............................................................................... 69
California Department of Transportation ESAL Calculation ....................................................................... 72
Comparison of ITD and Other States ESAL Calculation Methods .............................................................. 72
Development of Truck Factors from MEPDG Axle Load Spectra ............................................................... 75
Development of Truck Factors for a Simplified Truck Classification .......................................................... 81
Current ITD Traffic Projection Method ...................................................................................................... 81
Idaho Traffic Volume Data ..................................................................................................................... 82
Accuracy of the Current ITD Traffic Projection Method ........................................................................ 82
Chapter 6. Analysis of ITD Climatic Factors ................................................................................................... 85
ITD Climatic and Environmental Factors .................................................................................................... 85

vii
AASHTO 1993 Climatic and Environmental Factors ................................................................................... 85
MEPDG Climatic and Environmental Factors ............................................................................................. 87
MEPDG Climatic and Environmental Factors for Idaho ......................................................................... 87
Investigating the Accuracy of the ITD Climatic Zones and Factors ............................................................ 89
Chapter 7. Summary, Conclusions, and Recommendations ......................................................................... 99
Summary .................................................................................................................................................... 99
Conclusions ................................................................................................................................................ 99
Evaluation of ITD Design Method for Flexible Pavement ...................................................................... 99
ITD ESAL Calculation Method ............................................................................................................... 100
ITD Pavement Performance Management Information System.......................................................... 100
MEPDG Predicted Performance for Idaho Conditions ......................................................................... 101
ITD Climatic Zones and Factors ............................................................................................................ 101
Recommendations ................................................................................................................................... 101
References.................................................................................................................................................... 103
Appendix A. Idaho R-Value Thickness Design ............................................................................................. 107
Appendix B. Comparison of MEPDG Predicted Distresses and Smoothness at 50 Percent Reliability ....... 115
Appendix C. Comparison of MEPDG Predicted Distresses and Smoothness at 85 Percent Reliability ........ 145
Appendix D. ATR Stations AADT Database ................................................................................................... 175

viii

ix
List of Tables
Table 1. Western States Current Design Practice .......................................................................................... 6
Table 2. AASHTO 1993 Recommended Reliability Levels ............................................................................... 7
Table 3. Major Assumptions for AASHTO Design Method Utilized in Selected Western States ................... 8
Table 4. MEPDG Recommended Reliability Levels ......................................................................................... 9
Table 5. MEPDG Recommended Design Criteria .......................................................................................... 10
Table 6. Selected Projects ............................................................................................................................ 12
Table 7. ITD Pavement Deficiency Criteria ................................................................................................... 13
Table 8. Performance Indicators of the Investigated Projects as of 2008 ................................................... 14
Table 9. Design Input Data for ITD Design Method ...................................................................................... 16
Table 10. Design Input Data for AASHTO 1993 Method ................................................................................ 17
Table 11. Design Input Data for MEPDG ........................................................................................................ 19
Table 12. AASHTO 1993 Minimum Layer Thicknesses ................................................................................... 20
Table 13. ITD Design Structures for the Investigated Projects ...................................................................... 21
Table 14. AASHTO 1993 Design Structures for the Investigated Projects at 50 Percent Reliability .............. 21
Table 15. MEPDG Design Structures for the Investigated Projects at 50 Percent Reliability ........................ 21
Table 16. AASHTO 1993 Design Structure for the Investigated Projects at 85 Percent Reliability ................ 30
Table 17. MEPDG Design Structures for the Investigated Projects at 85 Percent Reliability ........................ 30
Table 18. Statewide Single Axle Load Spectra ............................................................................................... 40
Table 19. Statewide Tandem Axle Load Spectra ............................................................................................ 41
Table 20. Statewide Tridem Axle Load Spectra .............................................................................................. 42
Table 21. Statewide Quad Axle Load Spectra ................................................................................................ 43
Table 22. Number of Axles per Truck ............................................................................................................. 44
Table 23. AADTT Traffic Distributions by Vehicle Class .................................................................................. 44

x
Table 24. Axle Configurations and General Traffic Data ................................................................................ 44
Table 25. MEPDG Predicted Rutting for Each Individual Pavement Layer..................................................... 49
Table 26. Comparison of MEPDG Predicted Rutting Based on ALS and ESALs .............................................. 52
Table 27. ITD Distress Evaluation Method ..................................................................................................... 55
Table 28. LTPP Distress Evaluation Method ................................................................................................... 56
Table 29. Comparison of MEPDG Predicted Cracking and Cracking Index from ITD PPMIS .......................... 57
Table 30. Truck Factors for Different Rural Highways and Vehicles in the U.S. ............................................. 65
Table 31. Truck Factors for Different Urban Highways and Vehicles in the U.S. ........................................... 65
Table 32. ITD Lane Distribution Factors ......................................................................................................... 66
Table 33. ITD Commercial Traffic Classification ............................................................................................. 66
Table 34. WSDOT Truck Factors from PMS and WIM Analysis ...................................................................... 68
Table 35. Typical WSDOT Truck Factors Based on Measurement ................................................................. 69
Table 36. UDOT Recommended Lane Distribution Factors ........................................................................... 70
Table 37. UDOT Functional Classification Code ............................................................................................. 70
Table 38. Truck Factors for the Rural Functional Classes ............................................................................... 71
Table 39. Truck Factors for the Urban Functional Classes ............................................................................. 71
Table 40. ESAL Growth Rate ........................................................................................................................... 71
Table 41. Caltrans Default Truck Factors ....................................................................................................... 72
Table 42. WIM Locations ................................................................................................................................ 72
Table 43. Average Daily Truck Traffic by Truck Class ..................................................................................... 73
Table 44. WIM Sites Used for the Development of ITD Axle Load Spectra ................................................... 75
Table 45. WIM Sites Associated with Idaho Truck Weight Road Groups....................................................... 76
Table 46. Average Number of Axles per Truck and Axle Group Based on ITD WIM Data ............................. 76
Table 47. Developed Truck Factors Based on WIM Data Analysis for ITD ..................................................... 77

xi
Table 48. Developed ITD Truck Factors Based on WIM Data Analysis for Simplified
Truck Classification ......................................................................................................................... 81
Table 49. Summary of Idaho Weather Stations Currently Available in MEPDG Software
Version 1.1 ...................................................................................................................................... 88
Table 50. Summary of the Climatic Data for the MEPDG Weather Stations Located in Idaho...................... 89
Table 51. Selected MEPDG Weather Stations and Corresponding ITD Climatic Zone ................................... 89

xii

xiii
List of Figures
Figure 1. 2007 Survey Results of the States Current Design Practices........................................................... 4
Figure 2. States with MEPDG Implementation Plans ..................................................................................... 5
Figure 3. 2009 Statewide Pavement Condition ............................................................................................ 14
Figure 4. Asphalt Institute Equation to Estimate Resilient Modulus from R-Value ..................................... 16
Figure 5. ITD Equation to Estimate Resilient Modulus from R-Value .......................................................... 17
Figure 6. Equation to Determine Effective Binder Content of HMA ............................................................ 18
Figure 7. Comparison of the Recommended Pavement Structure by the Investigated Design Methods
at 50 Percent Reliability ............................................................................................................... 22
Figure 8. Comparison of the Recommended AC Layer Thickness by the Investigated Design Methods
at 50 Percent Reliability ............................................................................................................... 23
Figure 9. Comparison of the Recommended Base Layer Thickness by the Investigated Design Methods
at 50 Percent Reliability ............................................................................................................... 23
Figure 10. Comparison of the Recommended Subbase Layer Thickness by the Investigated Design
Methods at 50 Percent Reliability ................................................................................................ 24
Figure 11. Comparison of MEPDG Total Predicted Rutting from the 3 Design Methods
at 50 Percent Reliability .............................................................................................................. 25
Figure 12. Comparison of MEPDG Predicted AC Rutting from the 3 Design Methods
at 50 Percent Reliability ............................................................................................................... 26
Figure 13. Comparison of MEPDG Predicted Unbound Layers Rutting from the 3 Design Methods
at 50 Percent Reliability ............................................................................................................... 27
Figure 14. Comparison of MEPDG Predicted Subgrade Rutting from the 3 Design Methods
at 50 Percent Reliability ............................................................................................................... 27
Figure 15. Comparison of MEPDG Predicted Alligator Fatigue Cracking from the 3 Design Methods
at 50 Percent Reliability ............................................................................................................... 28
Figure 16. Comparison of MEPDG Predicted IRI from the 3 Design Methods at 50 Percent Reliability ........ 29
Figure 17. Comparison of the Recommended Pavement Structure by the Investigated Design Methods
at 85 Percent Reliability ............................................................................................................... 31
xiv
Figure 18. Comparison of the Recommended AC Layer Thickness by the Investigated Design Methods
at 85 Percent Reliability ............................................................................................................... 31
Figure 19. Comparison of the Recommended Base Layer Thickness by the Investigated Design Methods
at 85 Percent Reliability ............................................................................................................... 32
Figure 20. Comparison of the Recommended Subbase Layer Thickness by the Investigated Design
Methods at 85 Percent Reliability ................................................................................................ 32
Figure 21. Comparison of MEPDG Total Predicted Rutting from the 3 Design Methods at
85 Percent Reliability ................................................................................................................... 33
Figure 22. Comparison of MEPDG Predicted AC Rutting from the 3 Design Methods at
85 Percent Reliability ................................................................................................................... 34
Figure 23. Comparison of MEPDG Predicted Unbound Layers Rutting from the 3 Design Methods at
85 Percent Reliability ................................................................................................................... 34
Figure 24. Comparison of MEPDG Predicted Subgrade Rutting from the 3 Design Methods at
85 Percent Reliability ................................................................................................................... 35
Figure 25. Comparison of MEPDG Predicted Alligator Fatigue Cracking from the 3 Design Methods at
85 Percent Reliability ................................................................................................................... 36
Figure 26. Comparison of MEPDG Predicted IRI from the 3 Design Methods at 85 Percent Reliability ........ 36
Figure 27. Comparison of the Initial Construction Cost at 50 Percent Reliability Level ................................ 37
Figure 28. Comparison of the Initial Construction Cost at 85 Percent Reliability Level ................................ 38
Figure 29. Comparison of MEPDG Predicted Rutting and Field Measured Rutting for US-2(a) Project ........ 46
Figure 30. Comparison of MEPDG Predicted Rutting and Field Measured Rutting for US-2(b) Project ........ 46
Figure 31. Comparison of MEPDG Predicted Rutting and Field Measured Rutting for US-2(c) Project ........ 47
Figure 32. Comparison of MEPDG Predicted Rutting and Field Measured Rutting for SH-3 Project ............ 47
Figure 33. Comparison of MEPDG Predicted Rutting and Field Measured Rutting for SH-19 Project .......... 48
Figure 34. Comparison of MEPDG Predicted Rutting and Field Measured Rutting for SH-95 Project .......... 48
Figure 35. Comparison of MEPDG Predicted Rutting and Field Measured Rutting for SH-93 Project .......... 49
Figure 36. MEPDG Predicted Rutting Versus Field Measured Rutting for All Projects .................................. 50

xv
Figure 37. MEPDG Predicted Rutting Versus Field Measured Rutting for All Projects After Applying
a Calibration Factor ...................................................................................................................... 51
Figure 38. Influence of Moisture Changes and Freeze and Thaw on MEPDG Predicted Resilient Modulus
of the Base and Subbase Layers of the US-2(c) Project ............................................................... 52
Figure 39. Influence of Moisture Changes on MEPDG Predicted Resilient Modulus of the Subgrade Soil
of the US-2(c) Project ................................................................................................................... 53
Figure 40. MEPDG Predicted Top-Down Longitudinal Cracking .................................................................... 54
Figure 41. MEPDG Predicted Bottom-Up Fatigue Cracking ........................................................................... 54
Figure 42. MEPDG Predicted Total Rutting at 50 Percent Reliability Level for 40-Years Service Life ............ 58
Figure 43. MEPDG Predicted Alligator Cracking at 50 Percent Reliability Level for 40-Years Service Life .... 59
Figure 44. MEPDG Predicted IRI at 50 Percent Reliability Level for 40-Years Service Life ............................ 59
Figure 45. MEPDG Predicted Total Rutting at 85 Percent Reliability Level for 40-Years Service Life ............ 60
Figure 46. MEPDG Predicted Alligator Cracking at 85 Percent Reliability Level for 40-Years Service Life .... 61
Figure 47. MEPDG Predicted IRI at 85 Percent Reliability Level for 40-Years Service Life ............................ 61
Figure 48. AASHTO 1993 Formula for ESAL Calculation ................................................................................. 63
Figure 49. AASHTO 1993 Equations to Calculate the Load Equivalency Factor ............................................. 64
Figure 50. Equation to Determine ESALs as a Function of Truck Factor ........................................................ 64
Figure 51. ITD Current Truck Factors ............................................................................................................. 67
Figure 52. FHWA Vehicle Classes Used for Collecting Traffic Data ................................................................ 68
Figure 53. WSDOT Equation for ESAL Growth Rate ....................................................................................... 69
Figure 54. Equation to Calculate the Growth Factor ..................................................................................... 69
Figure 55. Comparison of ITD, WSDOT, UDOT, Caltrans, and AASHTO 1993 Calculated
ESALs for Traffic Data Corresponding to WIM Site 134 ............................................................... 73
Figure 56. Comparison of ITD, WSDOT, UDOT, Caltrans, and AASHTO 1993 Calculated
ESALs for Traffic Data Corresponding to WIM Site 137 ............................................................... 74
Figure 57. Comparison of ITD, WSDOT, UDOT, Caltrans, and AASHTO 1993 Calculated
ESALs for Traffic Data Corresponding to WIM Site 192 ............................................................... 74
xvi
Figure 58. Equation to Calculate the Normalized Error ................................................................................. 77
Figure 59. Comparison of ESALs Based on Current ITD, Actual, Statewide, and Primarily Loaded
TWRG Truck Factors from WIM Site 134 ..................................................................................... 78
Figure 60. Comparison of ESALs Based on Current ITD, Actual, Statewide, and Moderately Loaded
TWRG Truck Factors from WIM Site 137 ..................................................................................... 78
Figure 61. Comparison of ESALs Based on Current ITD, Actual, Statewide, and Lightly Loaded
TWRG Truck Factors from WIM Site 192 ..................................................................................... 79
Figure 62. ESALs Normalized Error for WIM Site 134 .................................................................................... 79
Figure 63. ESALs Normalized Error for WIM Site 137 .................................................................................... 80
Figure 64. ESALs Normalized Error for WIM Site 192 .................................................................................... 80
Figure 65. Example Showing Current ITD Traffic Projection Method ............................................................ 82
Figure 66. Observed Versus Projected AADT Based on Current ITD Traffic Projection Methods ................. 83
Figure 67. Current Idaho Climatic Zones Along with Climatic Factors ........................................................... 86
Figure 68. MEPDG Predicted Longitudinal Cracking for the Investigated Climatic Locations in ITD Zone 3 . 90
Figure 69. MEPDG Predicted Alligator Cracking for the Investigated Climatic Locations in ITD Zone 3 ........ 91
Figure 70. MEPDG Predicted Total Rutting for the Investigated Climatic Locations in ITD Zone 3 ............... 91
Figure 71. MEPDG Predicted AC Rutting for the Investigated Climatic Locations in ITD Zone 3 ................... 92
Figure 72. MEPDG Predicted Unbound Granular Layers Rutting for the Investigated Climatic
Locations in ITD Zone 3 ................................................................................................................ 92
Figure 73. MEPDG Predicted Subgrade Rutting for the Investigated Climatic Locations in ITD Zone 3 ........ 93
Figure 74. MEPDG Predicted IRI for the Investigated Climatic Locations in ITD Zone 3 ................................ 93
Figure 75. MEPDG Predicted Longitudinal Cracking for the Investigated Climatic Locations in
Zones 2 and 4 ............................................................................................................................... 94
Figure 76. MEPDG Predicted Alligator Cracking for the Investigated Climatic Locations in Zones 2 and 4 .. 94
Figure 77. MEPDG Predicted Total Rutting for the Investigated Climatic Locations in Zones 2 and 4 .......... 95
Figure 78. MEPDG Predicted AC Rutting for the Investigated Climatic Locations in Zones 2 and 4 .............. 95
xvii
Figure 79. MEPDG Predicted Unbound Granular Layers Rutting for the Investigated Climatic
Locations in Zones 2 and 4 .......................................................................................................... 96
Figure 80. MEPDG Predicted Subgrade Rutting for the Investigated Climatic Locations in Zones 2 and 4 . 96
Figure 81. MEPDG Predicted IRI for the Investigated Climatic Locations in Zones 2 and 4 ......................... 97
Figure 82. Comparison of the Predicted Alligator Cracking, US-2(a) Project ............................................. 115
Figure 83. Comparison of the Predicted Longitudinal Cracking, US-2(a) Project ...................................... 116
Figure 84. Comparison of the Predicted Total Rutting, US-2(a) Project .................................................... 116
Figure 85. Comparison of the Predicted AC Layer Rutting, US-2(a) Project .............................................. 117
Figure 86. Comparison of the Predicted Unbound Granular Layer(s) Rutting, US-2(a) Project ................. 117
Figure 87. Comparison of the Predicted Subgrade Layer Rutting, US-2(a) Project .................................... 118
Figure 88. Comparison of the Predicted IRI, US-2(a) Project ..................................................................... 118
Figure 89. Comparison of the Predicted Alligator Cracking, US-2(b) Project ............................................. 119
Figure 90. Comparison of the Predicted Longitudinal Cracking, US-2(b) Project ...................................... 119
Figure 91. Comparison of the Predicted Total Rutting, US-2(b) Project .................................................... 120
Figure 92. Comparison of the Predicted AC Layer Rutting, US-2(b) Project .............................................. 120
Figure 93. Comparison of the Predicted Unbound Granular Layer(s) Rutting, US-2(b) Project ................ 121
Figure 94. Comparison of the Predicted Subgrade Layer Rutting, US-2(b) Project ................................... 121
Figure 95. Comparison of the Predicted IRI, US-2(b) Project ..................................................................... 122
Figure 96. Comparison of the Predicted Alligator Cracking, US-2(c) Project ............................................. 122
Figure 97. Comparison of the Predicted Longitudinal Cracking, US-2(c) Project ....................................... 123
Figure 98. Comparison of the Predicted Total Rutting, US-2(c) Project..................................................... 123
Figure 99. Comparison of the Predicted AC Layer Rutting, US-2(c) Project ............................................... 124
Figure 100. Comparison of the Predicted Unbound Granular Layer(s) Rutting, US-2(c) Project ................. 124
Figure 101. Comparison of the Predicted Subgrade Layer Rutting, US-2(c) Project .................................... 125
Figure 102. Comparison of the Predicted IRI, US-2(c) Project ..................................................................... 125

xviii
Figure 103. Comparison of the Predicted Alligator Cracking, SH-62 Project ............................................... 126
Figure 104. Comparison of the Predicted Longitudinal Cracking, SH-62 Project ......................................... 126
Figure 105. Comparison of the Predicted Total Rutting, SH-62 Project ...................................................... 127
Figure 106. Comparison of the Predicted AC Layer Rutting, SH-62 Project ................................................. 127
Figure 107. Comparison of the Predicted Unbound Granular Layer(s) Rutting, SH-62 Project ................... 128
Figure 108. Comparison of the Predicted Subgrade Layer Rutting, SH-62 Project ...................................... 128
Figure 109. Comparison of the Predicted IRI, SH-62 Project ....................................................................... 129
Figure 110. Comparison of the Predicted Alligator Cracking, SH-3 Project ................................................. 129
Figure 111. Comparison of the Predicted Longitudinal Cracking, SH-3 Project ........................................... 130
Figure 112. Comparison of the Predicted Total Rutting, SH-3 Project ........................................................ 130
Figure 113. Comparison of the Predicted AC Layer Rutting, SH-3 Project ................................................... 131
Figure 114. Comparison of the Predicted Unbound Granular Layer(s) Rutting, SH-3 Project ..................... 131
Figure 115. Comparison of the Predicted Subgrade Layer Rutting, SH-3 Project ........................................ 132
Figure 116. Comparison of the Predicted IRI, SH-3 Project ......................................................................... 132
Figure 117. Comparison of the Predicted Alligator Cracking, SH-19 Project ............................................... 133
Figure 118. Comparison of the Predicted Longitudinal Cracking, SH-19 Project ......................................... 133
Figure 119. Comparison of the Predicted Total Rutting, SH-19 Project ...................................................... 134
Figure 120. Comparison of the Predicted AC Layer Rutting, SH-19 Project ................................................. 134
Figure 121. Comparison of the Predicted Unbound Granular Layer(s) Rutting, SH-19 Project ................... 135
Figure 122. Comparison of the Predicted Subgrade Layer Rutting, SH-19 Project ...................................... 135
Figure 123. Comparison of the Predicted IRI, SH-19 Project ....................................................................... 136
Figure 124. Comparison of the Predicted Alligator Cracking, US-95 Project ............................................... 136
Figure 125. Comparison of the Predicted Longitudinal Cracking, US-95 Project ......................................... 137
Figure 126. Comparison of the Predicted Total Rutting, US-95 Project ...................................................... 137

xix
Figure 127. Comparison of the Predicted AC Layer Rutting, US-95 Project ................................................ 138
Figure 128. Comparison of the Predicted Unbound Granular Layer(s) Rutting, US-95 Project ................... 138
Figure 129. Comparison of the Predicted Subgrade Layer Rutting, US-95 Project ...................................... 139
Figure 130. Comparison of the Predicted IRI, US-95 Project ....................................................................... 139
Figure 131. Comparison of the Predicted Alligator Cracking, US-93 Project ............................................... 140
Figure 132. Comparison of the Predicted Longitudinal Cracking, US-93 Project ......................................... 140
Figure 133. Comparison of the Predicted Total Rutting, US-93 Project ...................................................... 141
Figure 134. Comparison of the Predicted AC Layer Rutting, US-93 Project ................................................ 141
Figure 135. Comparison of the Predicted Unbound Granular Layer(s) Rutting, US-93 Project ................... 142
Figure 136. Comparison of the Predicted Subgrade Layer Rutting, US-93 Project ...................................... 142
Figure 137. Comparison of the Predicted IRI, US-93 Project ....................................................................... 143
Figure 138. Comparison of the Predicted Alligator Cracking, US-2(a) Project ............................................. 145
Figure 139. Comparison of the Predicted Longitudinal Cracking, US-2(a) Project ...................................... 146
Figure 140. Comparison of the Predicted Total Rutting, US-2(a) Project .................................................... 146
Figure 141. Comparison of the Predicted AC Layer Rutting, US-2(a) Project .............................................. 147
Figure 142. Comparison of the Predicted Unbound Granular Layer(s) Rutting, US-2(a) Project ................ 147
Figure 143. Comparison of the Predicted Subgrade Layer Rutting, US-2(a) Project ................................... 148
Figure 144. Comparison of the Predicted IRI, US-2(a) Project ..................................................................... 148
Figure 145. Comparison of the Predicted Alligator Cracking, US-2(b) Project ............................................ 149
Figure 146. Comparison of the Predicted Longitudinal Cracking, US-2(b) Project ...................................... 149
Figure 147. Comparison of the Predicted Total Rutting, US-2(b) Project .................................................... 150
Figure 148. Comparison of the Predicted AC Layer Rutting, US-2(b) Project .............................................. 150
Figure 149. Comparison of the Predicted Unbound Granular Layer(s) Rutting, US-2(b) Project ................ 151
Figure 150. Comparison of the Predicted Subgrade Layer Rutting, US-2(b) Project ................................... 151

xx
Figure 151. Comparison of the Predicted IRI, US-2(b) Project ..................................................................... 152
Figure 152. Comparison of the Predicted Alligator Cracking, US-2(c) Project ............................................. 152
Figure 153. Comparison of the Predicted Longitudinal Cracking, US-2(c) Project....................................... 153
Figure 154. Comparison of the Predicted Total Rutting, US-2(c) Project .................................................... 153
Figure 155. Comparison of the Predicted AC Layer Rutting, US-2(c) Project .............................................. 154
Figure 156. Comparison of the Predicted Unbound Granular Layer(s) Rutting, US-2(c) Project ................. 154
Figure 157. Comparison of the Predicted Subgrade Layer Rutting, US-2(c) Project .................................... 155
Figure 158. Comparison of the Predicted IRI, US-2(c) Project ..................................................................... 155
Figure 159. Comparison of the Predicted Alligator Cracking, SH-62 Project ............................................... 156
Figure 160. Comparison of the Predicted Longitudinal Cracking, SH-62 Project ......................................... 156
Figure 161. Comparison of the Predicted Total Rutting, SH-62 Project ...................................................... 157
Figure 162. Comparison of the Predicted AC Layer Rutting, SH-62 Project ................................................. 157
Figure 163. Comparison of the Predicted Unbound Granular Layer(s) Rutting, SH-62 Project ................... 158
Figure 164. Comparison of the Predicted Subgrade Layer Rutting, SH-62 Project ...................................... 158
Figure 165. Comparison of the Predicted IRI, SH-62 Project ....................................................................... 159
Figure 166. Comparison of the Predicted Alligator Cracking, SH-3 Project ................................................. 159
Figure 167. Comparison of the Predicted Longitudinal Cracking, SH-3 Project ........................................... 160
Figure 168. Comparison of the Predicted Total Rutting, SH-3 Project ........................................................ 160
Figure 169. Comparison of the Predicted AC Layer Rutting, SH-3 Project ................................................... 161
Figure 170. Comparison of the Predicted Unbound Granular Layer(s) Rutting, SH-3 Project ..................... 161
Figure 171. Comparison of the Predicted Subgrade Layer Rutting, SH-3 Project ........................................ 162
Figure 172. Comparison of the Predicted IRI, SH-3 Project ......................................................................... 162
Figure 173. Comparison of the Predicted Alligator Cracking, SH-19 Project ............................................... 163
Figure 174. Comparison of the Predicted Longitudinal Cracking, SH-19 Project ......................................... 163

xxi
Figure 175. Comparison of the Predicted Total Rutting, SH-19 Project ...................................................... 164
Figure 176. Comparison of the Predicted AC Layer Rutting, SH-19 Project ................................................. 164
Figure 177. Comparison of the Predicted Unbound Granular Layer(s) Rutting, SH-19 Project ................... 165
Figure 178. Comparison of the Predicted Subgrade Layer Rutting, SH-19 Project ...................................... 165
Figure 179. Comparison of the Predicted IRI, SH-19 Project ....................................................................... 166
Figure 180. Comparison of the Predicted Alligator Cracking, US-95 Project ............................................... 166
Figure 181. Comparison of the Predicted Longitudinal Cracking, US-95 Project ......................................... 167
Figure 182. Comparison of the Predicted Total Rutting, US-95 Project ...................................................... 167
Figure 183. Comparison of the Predicted AC Layer Rutting, US-95 Project ................................................ 168
Figure 184. Comparison of the Predicted Unbound Granular Layer(s) Rutting, US-95 Project ................... 168
Figure 185. Comparison of the Predicted Subgrade Layer Rutting, US-95 Project ...................................... 169
Figure 186. Comparison of the Predicted IRI, US-95 Project ....................................................................... 169
Figure 187. Comparison of the Predicted Alligator Cracking, US-93 Project ............................................... 170
Figure 188. Comparison of the Predicted Longitudinal Cracking, US-93 Project ......................................... 170
Figure 189. Comparison of the Predicted Total Rutting, US-93 Project ...................................................... 171
Figure 190. Comparison of the Predicted AC Layer Rutting, US-93 Project ................................................ 171
Figure 191. Comparison of the Predicted Unbound Granular Layer(s) Rutting, US-93 Project ................... 172
Figure 192. Comparison of the Predicted Subgrade Layer Rutting, US-93 Project ...................................... 172
Figure 193. Comparison of the Predicted IRI, US-93 Project ....................................................................... 173

xxii
List of Acronyms
AADT Annual Average Daily Traffic
AADTT Annual Average Daily Truck Traffic
ADTT Average Daily Truck Traffic
AASHO American Association of State Highway Officials (predecessor to AASHTO)
AASHTO American Association of State Highway and Transportation Officials
AC Asphalt Concrete
ALS Axle Load Spectra
CAADT Commercial Annual Average Daily Traffic
Caltrans California Department of Transportation
CBR California Bearing Ratio
CF Climatic Factor
CI Cracking Index
DHV Design Hourly Volume
DOT Department of Transportation
ESALs Equivalent Single Axle Loads
EQL Equivalent Wheel Load
FHWA Federal Highway Agency
GE Gravel Equivalence
Gf Gravel Factor (Substitution Ratio)
HMA Hot Mix Asphalt
ITD Idaho Transportation Department
LCCA Life Cycle Cost Analysis
LEF Load Equivalency Factor
LTPP Long Term Pavement Performance
MEPDG Mechanistic-Empirical Pavement Design Guide
PPMIS Pavement Performance Management Information System
RD Rut Depth
RI Roughness Index
SHAs State Highway Agencies
SN Structure Number
TTC Truck Traffic Classification
TWRG Truck Weight Road Group
UDOT Utah Department of Transportation
UI University of Idaho
WASHO Western Association of State Highway Officials
WIM Weigh-In-Motion
WSDOT Washington State Department of Transportation

Executive Summary
xxiii
Executive Summary
Introduction
The current flexible pavement design method adopted by the Idaho Transportation Department (ITD) is an
empirical procedure based on the California Department of Transportation (Caltrans) R-Value method. In
this method, traffic is characterized in terms of Traffic Index, which is a function of the design 18-kip
Equivalent Single Axle Load (ESAL). A Climatic Factor (CF) is used to reflect the various geographical
regions in the State of Idaho. ITD’s procedure determines the pavement thickness as a Gravel Equivalence
(GE) based on an empirical equation. The GE is then transferred to various layer thicknesses through a
Gravel factor (Gf) for each type of material. Observations in Idaho showed that many existing roadways
that have been designed with ITD’s design method have performed well beyond their design lives, and still
perform adequately. Furthermore, based on information from adjacent states, ESALs calculated by ITD are
extremely conservative.
This research investigated the current ITD design method and compared it with both American Association
of State Highway and Transportation Officials (AASHTO) 1993 and the Mechanistic-Empirical Pavement
Design Guide (MEPDG) procedures. In addition, the current ITD truck factors and traffic volume projection
methods as well as Idaho climatic factors were also investigated.
Several in-service pavement sections located in different districts and designed according to ITD design
method were identified. These pavement sections were redesigned using AASHTO 1993 and MEPDG
procedures. All designs using AASHTO 1993 and MEPDG were conducted at 50 and 85 percent reliability
levels. The nationally calibrated MEPDG software was used to predict the performance of the three design
alternatives. Level 2 Hot Mix Asphalt (HMA) and subgrade material characterization inputs were used in
the MEPDG analysis. All other MEPDG inputs were Level 3. Pavement distresses and smoothness predicted
using MEPDG related to the three design methods were compared to each other. In addition, MEPDG
predicted performance was compared to measured field performance. The measured field performance
was obtained from ITD’s Pavement Performance Management Information System (PPMIS). Furthermore,
a comparison was made between ITD’s and other states’ ESAL calculations. Additionally, current ITD truck
factors were compared with truck factors developed for Idaho from the analysis of traffic Weigh-In-
Motion (WIM) data. Moreover, the accuracy of the ITD traffic volume projection method was investigated.
Finally, ITD climatic factors were analyzed and compared with MEPDG climatic data.
Research Methodology
This project was conducted in eight major tasks. The following tasks were conducted:
Task 1: Reviewed other state agencies design procedures, focusing on the western states.
Task 2: Obtained and reviewed selected states’ design methodologies and the latest version of
MEPDG.
Task 3: Identified and selected one or two projects in each ITD district for analysis.

Study of the Effectiveness of ITD Pavement Design Method
xxiv
Task 4: Analyzed ITD traffic data to determine accuracy.
Task 5: Analyzed material properties to determine basic design parameters.
Task 6: Analyzed climatic factors for the State of Idaho.
Task 7: Analyzed and re-designed recruited pavement sections using AASHTO 1993, and MEPDG.
Task 8: Evaluated pavement performance using MEPDG.
This report documents all research work conducted under these tasks for ITD.
Key Findings
The key findings of this research work are summarized below:
The unbound granular layer(s) thickness(s) resulting from the ITD design method were much
thicker (2 to 4.5 times as thick) compared to the AASHTO 1993 and MEPDG designs.
The 3 design methods yielded reasonably similar thickness for the Asphalt Concrete (AC) layer at
50 percent reliability. However, at higher reliability levels, MEPDG yielded thicker AC thickness
compared to both methods, especially in the case of very weak subgrade strength.
ITD truck factors used in ESAL calculations are more conservative compared to other state DOTs
and AASHTO factors.
Truck traffic data obtained from WIM sites in Idaho were analyzed to develop regional and
statewide truck factors for Idaho. Researchers found that the current ITD truck factors are highly
conservative compared to the developed regional and statewide factors. Furthermore, ITD’s
current truck classification is based on the classical Equivalent Wheel Load (EWL) and does not
accurately represent the current truck traffic classifications.
Comparison between total rutting predicted using MEPDG and the actual measured rutting for the
investigated projects revealed that the nationally calibrated rutting models in MEPDG are
significantly over predicting the total rutting.
ITD’s current cracking rating method measures and reports cracking differently compared to
MEPDG required distress survey method.
MEPDG climatic inputs are much more comprehensive compared to empirical ITD climatic factors.
In addition, ITD climatic zones were found to be inconsistent with MEPDG. When MEPDG was run
on sections located in the same climatic zones it yielded different distresses.

Executive Summary
xxv
Conclusions
The main conclusion of this research is that the current ITD design method for flexible pavement
structures yields highly conservative pavement structures compared to the widely used AASHTO 1993
design method and the newly developed MEPDG procedure. In addition, current ITD truck factors and
truck traffic classification yield highly conservative values compared to other states’ factors as well as
factors developed from the analysis of Idaho WIM data.
Recommendations
Based on the findings of this research, the following recommendations are offered:
ITD should continue with the implementation and calibration of MEPDG in Idaho to replace its
current design method as soon as practical.
To ensure consistency with MEPDG distress prediction, ITD should consider performing pavement
condition surveys in accordance with the Long-Term Pavement Performance (LTPP) method of
data collection.
ITD should adopt the truck factors that were developed in this study, and regularly update them
using Idaho WIM site data.
ITD should consider changing its current truck classification system, which was based on the EWL
principals. The Federal Highway Administration (FHWA) truck classification system, or a simplified
system based on it, should be used.
ITD should consider replacing its current method for projecting future traffic volume needs, as it
consistently over predicts traffic volume. There are several traffic forecasting methods that ITD
may investigate. These methods include: time series forecasting, regression, clustering, and neural
networks.

Study of the Effectiveness of ITD Pavement Design Method
xxvi

Chapter 1. Introduction
1
Chapter 1
Introduction Background
The majority of the State Department of Transportation (DOTs) are currently using different versions of
the AASHTO method for pavement structure design. The AASHTO methods are empirical methods based
on relationships between traffic loading, materials, and pavement serviceability developed from the
AASHO Road Test in the late 1950s.(1) ITD uses an empirical design procedure adapted from Caltrans.(2)
These empirical procedures for pavement structure design have many limitations and concerns regarding
climate, traffic, materials, and pavement performance. In fact, many existing pavement sections that have
been designed with the ITD design procedure were found to perform beyond their design lives, and are
still performing adequately. This raises the question of the cost effectiveness of the ITD design procedure,
especially with the development of MEPDG.
Problem Statement
With limited funding, there is increased emphasis on building structurally adequate, yet cost effective,
flexible pavements. Current flexible design methods range from empirical designs based on data from the
1950s AASHO Road Test, to methods developed by FHWA, ITD, University of Idaho (UI), and from other
states.(1) In addition, the newly developed MEPDG is now available. Based on information from
surrounding states, there may be evidence that ITD’s calculated ESALs for design are extremely
conservative. Many existing roadways have performed beyond their calculated design lives, and still
perform adequately. ITD needs to evaluate existing design methodologies to determine if they are still
applicable to current needs or if modifications can improve performance and reduce costs.
Research Objectives
The key objectives of this research project were to:
1) Evaluate the current ITD flexible pavement top-down design method and design methods from
selected other states against the MEPDG analysis tool.
2) Review selected district projects designed with ITD’s top-down design procedure, for performance
and longevity. Evaluate performance using MEPDG and compare the predicted performance to
the actual performance in the ITD pavement management database, where available.
3) Review the current ITD ESAL calculation and traffic volume projection methods and methods from
other states. Provide recommendations for any proposed changes.
4) Evaluate the current ITD climatic factors.

Study of the Effectiveness of ITD Pavement Design Method
2
Scope of Work
To investigate the current ITD design method, eight in-service flexible pavements designed using ITD’s
design method and located in different districts in Idaho, were identified. These pavement projects were
redesigned using ITD’s method and with both the AASHTO 1993 and MEPDG procedures at 2 different
reliability levels.(3, 4) MEPDG predicted distresses and smoothness for the three design alternatives for
each investigated project were compared to each other. Furthermore, pavement performance predicted
using the nationally calibrated version of the MEPDG for the ITD in-service pavement sections was
compared to actual measured field performance.
The current ITD ESAL calculation method was studied and compared with methods from the neighboring
states. Moreover, statewide and regional truck factors were developed for Idaho based on analysis of
traffic (WIM) data. These truck factors were compared with the current factors. The current ITD simple
method for traffic projection was also evaluated. Finally, current ITD climatic factors and climatic zones
were investigated and compared to MEPDG climatic weather stations in Idaho.
Report Organization
This report is organized in 7 chapters as described below:
Chapter 1 covers the problem statement, research objectives, and scope of work.
Chapter 2 presents a review of the current flexible pavement design practices in the U.S. It also provides
an overview of the current ITD, AASHTO 1993, and MEPDG design procedures and major inputs required
by each of these methods.
Chapter 3 presents the selected projects for analysis. The major inputs required by the investigated design
methods for each project are presented. This chapter covers the redesign of each project using ITD’s,
AASHTO 1993 and MEPDG at different levels of reliability showing the results and analysis.
Chapter 4 investigates the actual field performance of the selected projects against MEPDG predicted
performance. It also presents the variations of the current ITD distress survey compared to the
requirements of MEPDG.
Chapter 5 studied and investigated current ITD ESAL calculation method and compares it with different
state methods. It also presents the development of truck factors for Idaho using WIM data for a more
precise traffic characterization.
Chapter 6 presents an evaluation of the current ITD climatic zones and factors in comparison with MEPDG
climatic factors.
Finally, Chapter 7 summarizes the key findings of this research as well as recommendations for ITD.
References and several supporting appendices are included at the end of the report.

Chapter 2. Flexible Pavement Design Practice in the U.S.
3
Chapter 2
Flexible Pavement Design Practice in the U.S.
Introduction
Pavement design is the process of determining the pavement layer thicknesses and the appropriate
material properties. The designed pavement structure should safely and economically sustain the
expected traffic loads and environmental conditions for the intended service life of the pavement.
Several design methods for flexible pavements are currently practiced in the U.S. and around the world.
These methods range from very simple empirical methods to more advanced and sophisticated
mechanistic based methods. The empirical pavement design methods are generally based on empirical
correlations that relate the design traffic to the pavement section and its material properties such as
(R-value, California Bearing Ratio: CBR, layer coefficient, etc.). It is often based on local experience of
observed performance and some engineering judgment. Most of the current pavement design
procedures practiced in the U.S. and around the world are empirical procedures. Both ITD’s and AASHTO
1993 methods belong to the empirical pavement design procedure category. These empirical design
procedures have many limitations in terms of the characterization of materials, traffic, climate, and
pavement performance. However, they worked well when computing capabilities were limited. On the
other hand, the advanced pavement design methods are based on Mechanistic-Empirical (M-E)
principals. The Asphalt Institute’s method and MEPDG are examples of these design methods. M-E
design methods rely on calculating stresses, strains, and deformations based on fundamental
engineering mechanics. Then, the calculated stresses, strains, and deformations are transformed into
field distresses such as fatigue cracking, thermal cracking, and rutting using empirical transfer functions.
This method would not be possible without the computing power of today’s computers.
This chapter presents an overview of the ITD design method for flexible pavement structures. It also
covers the current flexible pavement design practice in the U.S. with the focus on the design methods
used in the western states especially Idaho’s neighboring states.
Current Flexible Pavement Design Practices in the U.S.
Literature searches showed that the current design practices for flexible pavements in the U.S. include
the following methods:
AASHTO 1972.
AASHTO 1993.
State Procedures (ITD’s and Caltrans’ design methods, for example).
Combination of AASHTO and State procedures.
MEPDG for forensic analysis and comparison studies.

Study of the Effectiveness of ITD Pavement Design Method
4
A survey was conducted in 2007 regarding MEPDG.(5) This survey included 65 questions sent to the
Department of Transportation (DOTs) addressing their current design procedures, MEPDG knowledge,
implementation activities, partnering activities, and training needs.(5) The 50 state DOT responders
showed that, 63 percent use the 1993 AASHTO Pavement Design Guide, 12 percent use the 1972
AASHTO Design Guide, 13 percent use individual state design procedures, 8 percent use a combination
of AASHTO and state procedures, and the remaining use other design procedures.(5) This distribution is
shown in Figure 1.
Figure 1. 2007 Survey Results of the States Current Design Practices.(5)
The same survey results showed that, about 80 percent of the DOTs stated that they have plans to
implement MEPDG.(5, 6) An older FHWA survey that was completed in 2003 showed at that time, only
42 percent of the DOTs had implementation plans for MEPDG.(7) This means that MEPDG is gaining more
attention with time. Figure 2 illustrates the DOTs, in 2007 that had implementation plans for MEPDG.
It should be noted that Idaho is one of the states that has an implementation plan for MEPDG. In fact,
ITD contracted with the University of Idaho to do a research project to evaluate the implementation of
MEPDG in Idaho.(8) Another research project between ITD and UI has been proposed to calibrate the
MEPDG distress models for Idaho conditions.
AASHTO 1993, 63%
AASHTO 1972, 12%
State Procedure, 13%
Combination of AASHTO and
State Procedure,
8%
Other Design Procedures, 4%

Chapter 2. Flexible Pavement Design Practice in the U.S.
5
Figure 2. States with MEPDG Implementation Plans(5)
Current Flexible Pavement Design Practice in the Western States
Table 1 shows the flexible pavement design methods currently practiced in the western United States.(7)
This table clearly shows that the AASHTO 1993 design procedure is the most practiced within the
western states and especially states neighboring Idaho.
Based on the presented survey results, it was concluded that the AASHTO 1993 is the most widely used
design method in the U.S. It is also the most practiced method in the western states and those
surrounding Idaho. The same survey results showed that 80 percent of the DOTs, including Idaho, have
MEPDG implementation plans in place.(6)
Based on the results from the literature searches, it was decided to evaluate ITD’s flexible pavement
design method against AASHTO 1993 and MEPDG design methods.

Study of the Effectiveness of ITD Pavement Design Method
6
Table 1. Western States Current Design Practice(7)
State Current Pavement Design Method
Arizona AASHTO 1993
California State Procedure
Colorado AASHTO 1993
Montana AASHTO 1972 & 1993
Nevada AASHTO 1993
New Mexico Combination of AASHTO 1972 and State Procedures
Oregon Combination of AASHTO 1993 and State Procedures
Utah AASHTO 1993
Washington AASHTO 1993
Wyoming AASHTO 1993
Overview of Idaho Flexible Pavement Design Method
The current flexible pavement design method adopted by ITD is an empirical procedure based on the
R-value of the subgrade.(2) It incorporates traffic in terms of Traffic Index (TI) which is a function of the
design 18-kip Equivalent-Single Axle Load (ESAL).(16, 17) It also incorporates Climatic Factors (CF) to reflect
the various geographical regions within Idaho. ITD’s procedure determines the pavement thickness as a
Gravel Equivalence (GE) based on an empirical equation adopted from the California Department of
Transportation (Caltrans). The GE is then transferred to various layer thicknesses through a gravel factor
(Gf) for each type of material. The minimum design standards for this design method are based on
recommendations of Caltrans, AASHTO, Asphalt Institute, and local experience.(2) It should be noted that
ITD design method is a deterministic design method (i.e., it does not incorporate reliability into design).
However, it incorporates factors of safety on the GE factors.
The benefit of ITD’s design method is that it can be considered a perpetual pavement design concept.
The ballast section is thick enough to allow major rehabilitation in the surface layer only without the
need for full depth reconstruction.
ITD Design Method Required Inputs
The major inputs required by ITD design method are as follows:
Design life (of at least 20 years).
Traffic in terms of Traffic Index which is a function of the 18-kip ESAL.
Resistance values (R-values) for the supporting layers (base, subbase, and subgrade).

Chapter 2. Flexible Pavement Design Practice in the U.S.
7
Climatic factor (CF) which is based on the geographical location of the project.
Gravel factors (Gf) for various layers. Gravel factor is an empirical factor that relates the
thickness of a layer to its equivalent thickness of gravel.
More detail on the ITD’s design method can be found in the ITD’s Materials Manual.(2)
Overview of AASHTO 1993 Pavement Design Method
This empirical design procedure is based on the results of the AASHO road test conducted in Ottawa,
Illinois, in the late 1950s and early 1960s.(3) The first design guide was published in 1961 and was revised
in 1972, 1981, and 1986, and 1993. The empirical performance equations obtained from the road test
under certain traffic, climatic and subgrade conditions are used to compute the pavement layer
thickness. The various versions of the AASHTO design guides have served well for several decades.(18)
However, deficiencies and limitations associated with the AASHTO 1993 design guide motivated the
development of MEPDG.(4)
AASHTO 1993 Design Method Required Inputs
The major inputs required by the AASHTO 1993 design method are as follows:
Design life.
Serviceability.
Reliability and overall standard deviation.
Traffic in terms of 18-kip ESAL.
Stiffness (resilient moduli) of the supporting layers.
Structural layers coefficients (ai).
Drainage coefficients (mi).
The AASHTO 1993 recommended design reliability levels are shown in Table 2.
Table 2. AASHTO 1993 Recommended Reliability Levels(3)
Functional Classification Recommended Level of Reliability
Urban Rural
Interstate and Other Freeways 85-99.9 80-99.9
Principal Arterials 80-99 75-95
Collectors 80-95 75-95
Local 50-80 50-80

Study of the Effectiveness of ITD Pavement Design Method
8
Major assumptions for AASHTO design method regarding the design reliability levels, unbound granular
base/subbase materials and subgrade soils characterization methods, conversion equation for the
resilient modulus (Mr) utilized in some of the western states are summarized in Table 3.
Table 3. Major Assumptions for AASHTO Design Method Utilized in Selected Western States
State
Flexible
Pavement
Design
Method
Design Reliability
Level
Primary
Unbound
Materials and
Subgrade Soils
Property
Conversion Equation
if Mr is not Measured
Reference
Number
Arizona AASHTO 1993
Interstates : 99% ≥ 10,000 ADT : 95% 2,001-10,000 ADT: 90% 501-2,000 ADT : 85% ≤ 500 ADT : 75%
R-value 0.6
2
rSVF0.6
(Rmean)2.4(Rmean)2251815M
9
Colorado AASHTO 1993 Reliability selected Based on the Functional Class
R-Value Mr = 10
[(SSV+18.72)/6.24]
SSV=[(R-5)/11.29]+3 10
Montana AASHTO 1993 Reliability selected Based on the Functional Class
R-Value, Mr Mr = -0.51 (R)2+297 (R) + 3292 11
New Mexico AASHTO 1972 and State Procedure
No Reliability (50%). However, it uses @-risk software to calculate design R-value, ESAL, and AC thickness.
R-value Convert R-value to SSV
Not Mr 12
Oregon AASHTO 1993 and State Procedure
AASHTO Recommendations based on Functional Class
Mr form lab or correlation with
DCP Mr =49023(Cf)(DCP)-0.39 13
Utah AASHTO 1993 Interstates: 95% Others : 90%
CBR Mr = 1500(CBR) 14
Washington AASHTO 1993 ESAL < 10,000,000: 85% ESAL ≥10,000,000: 95%
Currently: Mr Historically :CBR until 1951, then
R-value
- 15
ADT = average daily traffic Mr = resilient modulus, psi CBR = California bearing ratio
R = R-value DCP = dynamic cone penetrometer, mm/blow
Cf = correction factor SSV = soil support value Rmean = weighted average R-value
SVF = seasonal variation factor
Overview of MEPDG Pavement Design Method
MEPDG is a state-of-the-art tool for the analysis/design of new and rehabilitated pavement structures
based on mechanistic-empirical principles. The flexible pavement portion of the software
mechanistically calculates the structural response (stresses, strains, and deflections), within a pavement
system, using the multi-layer elastic theory or finite element analysis.(4) Moisture and temperature
variations within the pavement structure are calculated internally using the Enhanced Integrated
Climatic Model (EICM). EICM utilizes a comprehensive database from 851 weather stations throughout
the United States. Pavement distresses (rutting, bottom-up and top-down fatigue cracking, thermal
cracking) and roughness are predicted using empirical transfer functions. In the current software version
of the MEPDG (version 1.1), these transfer functions are nationally calibrated based on field data from

Chapter 2. Flexible Pavement Design Practice in the U.S.
9
94 LTPP sections distributed all over the U.S. The software also allows users to input their calibration
coefficients to reflect certain conditions.
MEPDG Required Inputs
Unlike ITD and AASHTO 1993, MEPDG requires an extensive amount of input data. It requires 100+
inputs in order to design/analyze a pavement section. MEPDG also utilizes hierarchical levels of the
design inputs. This feature provides the user with flexibility in obtaining the design inputs of the project
based on its importance and anticipated funding cost. The inputs for the MEPDG may also be obtained
using a mix of the three hierarchical levels. The MEPDG three levels of inputs regarding traffic and
material properties are as follows.
Level 1: represents the highest level of accuracy and lowest level of errors for the inputs. Input
parameters for this level must be measured directly either in the laboratory or in the
field. This level of input has the highest cost in testing and data collection.
Level 2: represents an intermediate level of accuracy. Parameters are estimated from built-in-
correlations based on limited routine laboratory test results or selected from an agency
database.
Level 3: represents the lowest level of accuracy. Usually, typical default values (best estimates)
of input parameters are used in this level.
The main inputs of the MEPDG are divided into four main categories. These categories are project,
traffic, climate, and structure. More details regarding these inputs can be found in the NCHRP 1-37A
Report and the Manual of Practice.(4, 19) The MEPDG recommend levels of reliability for different
functional classification of roadway are presented in Table 4.
Table 4. MEPDG Recommended Reliability Levels(19)
Functional Classification Recommended Level of Reliability
Urban Rural
Interstate/Freeways 95 95
Principal Arterials 90 85
Collectors 80 75
Local 75 70
Table 5 presents the performance criteria (threshold values) recommended for use with the MEPDG for
flexible pavement design based on the roadway functional class.
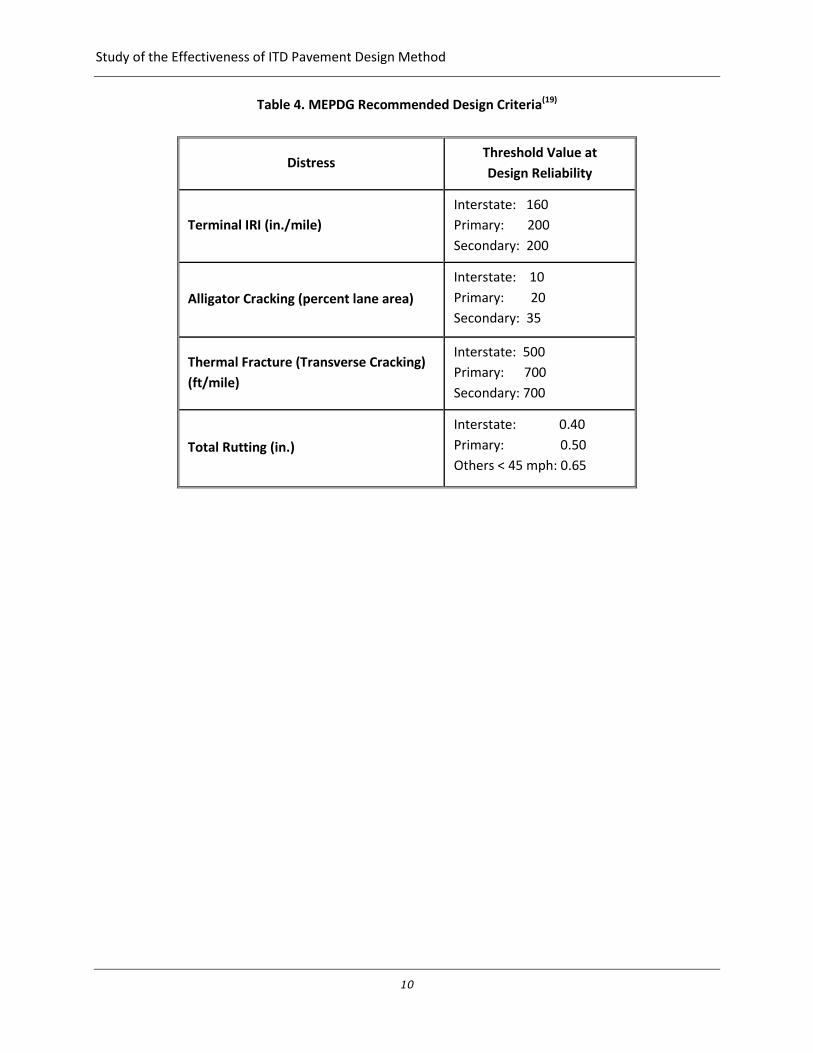
Study of the Effectiveness of ITD Pavement Design Method
10
Table 4. MEPDG Recommended Design Criteria(19)
Distress Threshold Value at
Design Reliability
Terminal IRI (in./mile)
Interstate: 160
Primary: 200
Secondary: 200
Alligator Cracking (percent lane area)
Interstate: 10
Primary: 20
Secondary: 35
Thermal Fracture (Transverse Cracking)
(ft/mile)
Interstate: 500
Primary: 700
Secondary: 700
Total Rutting (in.)
Interstate: 0.40
Primary: 0.50
Others < 45 mph: 0.65

Chapter 3. Comparison of Idaho Flexible Pavement Design
11
Chapter 3
Comparison of Idaho Flexible Pavement Design Procedure
with AASHTO 1993 and MEPDG Methods
Introduction
The previous chapter presented a literature review of the flexible pavement design methods practiced in
the U.S. as well as an overview of ITD’s, AASHTO 1993, and MEPDG design methods. It was found in the
literature that AASHTO 1993 design method is the most practiced design method by DOTs across the U.S.,
especially in the western states.(5, 6, 7) This chapter presents a comparison of ITD’s design method to
AASHTO 1993, and MEPDG methods using real in-service pavement sections designed according to ITD’s
design method.
Selected Projects
The original work plan called for identifying 1 or 2 projects from each of the 6 districts in Idaho. However,
ITD was only able to provide UI’s research team with projects from Districts 1, 2, 3, and 6. The total
number of the recruited projects was 8. There was 1 project from District 4 presented, however the data
was incomplete and did not allow for analysis. There were no projects from District 5. The 8 recruited
projects are shown in Table 5. The US-2 project (from Wrenco Loop to Dover) has 3 different sections with
the same design inputs with the exception of subgrade strength. This allows for direct evaluation of the
influence of the subgrade strength on the designed pavement structure using the three pavement design
methods considered in this study.

Study of the Effectiveness of ITD Pavement Design Method
12
Table 5. Selected Projects
Project
US-2 (a)
Wrenco
Loop to
Dover
(MP 22.01-
MP 22.32)
US-2(b)
Wrenco
Loop to
Dover
(MP 22.32-
MP 23.91)
US-2(c)
Wrenco
Loop to
Dover
(MP 23.91-
MP 24.99)
SH-62
Oak
Street
SH-3
Arrow to
Turkey
Farm
SH-19
Greenleaf
to
Simplot
US-95
Devil’s
Elbow
US-93 Tom
Cat Hill, East
Project No. F-
5121(019)
F-
5121(019)
F-
5121(019)
ST-
4749(612)
STP-
4170(101)
STP-RS
3712(008)
F-
3112(42)
ST-
6350(652)
Key No. 0717 0717 0717 9338 5956 0135 2224 7768
County Bonner Bonner Bonner Lewis Nez Perce Canyon Washington Butte
District 1 1 1 2 2 3 3 6
Functional
Class*
Principal
Arterial-
Other
(Rural)
Principal
Arterial-
Other
(Rural)
Principal
Arterial-
Other
(Rural)
Major
Collector
(Rural)
Minor
Arterial
(Rural)
Minor
Arterial
(Rural)
Principal
Arterial-Other
(Rural)
Principal
Arterial-Other
(Rural)
AC Layer
Thickness
(in.)**
6.0 6.0 6.0 4.2 5.4 4.2 3.6 6.0
Granular
Base Layer
Thickness
(in.)**
6.0 6.0 6.0 22.2 19.2 5.4 6.0 9.0
Granular
Subbase
Layer
Thickness
(in.)**
26.4 9.0 30.0 - - 12.0 30.0 6.0
* From Idaho State Highway Functional Classification 2015 Map.(20)
** These values represent the constructed typical section.
ITD Pavement Performance Management Information System
ITD is using Arizona’s method to evaluate pavement surface distresses.(21) This distress survey is conducted
visually on the most travelled lane. ITD measures its pavement performance based on roughness index
(RI), cracking index (CI), skid number, and rut depth (RD).(21) In order to determine the RI, the International
Roughness Index (IRI) is first measured in units of (in./mile) using a laser mounted on the Profiler Van. The
measured IRI values are then compressed into 0.0 to 5.0 scale, where 0.0 is a very rough and 5.0 is a very
smooth pavement surface. The skid data is collected by towing a small trailer that measures force on a
wheel that is locked and not rotating. The skid number ranges from 20 to 200 with a threshold value less
than 35.
A crack index value between 0.0 and 5.0 is given to the pavement, based on the size and location of
cracks, percentage of the roadway surveyed that shows distresses, and type of road surface. A rating of

Chapter 3. Comparison of Idaho Flexible Pavement Design
13
5.0 is good pavement with no visible cracking and 0.0 is for pavement with the maximum distress
classification. It should be noted that the CI represents all types of cracks occurring in the pavement
together (alligator, longitudinal, and transverse). In collecting this distress survey data, ITD started using
Pathway © Profiler Van technology to gather the majority of their roadway data since 1995.(21) Profiler
Vans drive over the pavement and produce digital images of the pavement surface across the width and
length of the roadway segment being evaluated. The rutting is measured using rutting detection scanning
lasers attached to the profiler vans. ITD considers the pavement to be deficient based on the RI or CI and
the functional class of the roadway according to the criteria shown in Table 6.
Table 6. ITD Pavement Deficiency Criteria(21)
Pavement Condition Interstates and Arterials Collectors
Good (CI or RI) > 3.0 (CI or RI) > 3.0
Fair 2.5 ≤ (CI or RI) ≤ 3.0 2.0 ≤ (CI or RI) ≤ 3.0
Poor 2.0 ≤ (CI or RI) < 2.5 1.5 ≤ (CI or RI) < 2.0
Very Poor (CI or RI) < 2.0 (CI or RI) < 1.5
Performance Indicators for the Selected Pavement Sections
ITD’s online Pavement Performance Management Information System (PPMIS) was used to find the
performance of these pavement sections.(22) Table 7 shows the performance indicators of the investigated
projects as of 2008. The data in this table shows good performance for almost all investigated projects.
Even though the US-95 pavement section is near the end of its service life, it rates at a fair condition. In
addition, the 2009 statewide pavement condition for Idaho shows that 60 percent of the roadway
network is in good condition, 22 percent in fair condition, and only 18 percent of the roadway network fall
in the poor to very poor category.(21) This is shown in Figure 3.

Study of the Effectiveness of ITD Pavement Design Method
14
Table 7. Performance Indicators of the Investigated Projects as of 2008
Design Project US-2(a) US-2(b) US-2(c) SH-62 SH-3 SH-19 US-95 US-93
Years in Service 6.0 6.0 6.0 New 10.0 11.0 18.0 2.0
RI 4.7 3.4 4.1 - 3.1 3.9 3.5 3.7
CI 5.0 4.7 5.0 - 5.0 5.0 3.0 5.0
Skid Number 44.0 44.0 44.0 - 51.0 4.0 47.1 57.0
Rut Depth (in.) 0.23 0.16 0.24 - 0.17 0.14 0.18 0.10
Figure 3. 2009 Statewide Pavement Condition(21)
Analysis Procedure
The projects presented previously in Table 5 represent in-service pavement sections that were designed
according to the ITD’s design method. These projects were redesigned using the AASHTO 1993 and
MEPDG (version 1.10) procedures in addition to redesigning ITD to compare with the documented
structure. Since ITD’s flexible pavement design method is a deterministic method, (does not incorporate
reliability into design), all designs were conducted at 50 percent reliability level using both AASHTO 1993
and MEPDG procedures. The investigated projects were also redesigned using AASHTO 1993 and MEPDG
methods at 85 percent reliability level. The 85 percent reliability level analyses were conducted in order to
compare ITD’s method with AASHTO 1993 and MEPDG guides at a higher reliability level. This higher

Chapter 3. Comparison of Idaho Flexible Pavement Design
15
reliability level is the recommended design reliability for the analyzed projects if AASHTO or MEPDG
design methods are used.
Both ITD and AASHTO 1993 design methods use one representative value for the strength characterization
for each of the unbound granular layers and subgrade. Additionally, for traffic characterization ITD uses TI
which is a function of ESAL. AASHTO 1993 uses ESAL while MEPDG uses Axle Load Spectra (ALS). Thus, in
order to simulate ITD and AASHTO 1993, MEPDG’s Enhanced Integrated Climatic Model (EICM), which
adjusts the resilient modulus of the unbound materials and subgrade soils, was deactivated. The MEPDG
representative modulus option was then used in all MEPDG analyses. Moreover, MEPDG traffic data was
characterized in terms of ESALs instead of axle load spectra. This was made because it compares all design
methods on the same assumptions.
The nationally calibrated MEPDG (version 1.1) was also used to predict the performance of the
investigated projects designed using the 3 design methods. The predicted performance includes alligator
cracking, rutting, and IRI.
Project Input Data for Each Design Method
Input data as well as the design criteria vary significantly among the three design methods. To redesign
each of the investigated projects using the selected design methods, data was collected from several
sources. ITD design phase reports as well as Google Earth, ITD’s PPMIS, ITD highway information through
the ITD’s official website, and the United States Geological Survey (USGS) website were used.(23, 24, 25)
Reasonable assumptions were made for some of the input parameters where information was not
available. The following subsections summarize the major design inputs for each studied project for each
of the three design methods.
ITD’s Inputs for the Investigated Projects
ITD’s input data required for the investigated projects are shown in Table 8. This data was the easiest and
most straight forward as they are available in the ITD phase reports and design sheets recruited from ITD.
Design details of these projects are shown in Appendix A. These designs were done by ITD.

Study of the Effectiveness of ITD Pavement Design Method
16
Table 8. Design Input Data for ITD Design Method
Design Input
Design Project
US-2(a) US-2(b) US-2(c) SH-62 SH-3 SH-19 US-95 US-93
Design Life, years 20 20 20 20 20 20 20 20
Traffic Index 11.51 11.51 11.51 8.78 10.5 9.57 9.9 10.27
Climatic Factor 1.1 1.1 1.1 1.1 1.0 1.0 1.0 1.05
Base R-Value* 80 80 80 80 80 80 80 80
Subbase R-Value* 65 65 65 - - 65 65 60
Subgrade R-Value**
20 50 15 8 25 44 5 50
*Estimated values
**Laboratory measured values
AASHTO 1993 Inputs for the Investigated Projects
Table 10 summarizes the AASHTO 1993 Input data required for the investigated projects. For all of the
investigated projects, initial and final serviceability values of 4.5, and 2.5, respectively, were assumed. The
structural layer coefficients (ai) were estimated based on the modulus of each layer as recommended by
the design method. The primary unbound granular base/subbase materials and subgrade soils
characterization input required by AASHTO 1993 and MEPDG methods is the resilient modulus. The
resilient modulus values of the base and subbase layers were estimated based on the assumed R-values
for these layers. For the resilient moduli of the subgrade layers, the laboratory measured design R-values
were used to estimate them using the Asphalt Institute (AI) equation. The AASHTO 1993 and MEPDG
guides recommend the use of this equation to convert R-values to Mr.(3, 4) This equation is given in Figure 4
as follows:(26)
Mr = 1155 + 555 (R)
where:
Mr = resilient modulus, psi
R = R-value
Figure 4. Asphalt Institute Equation to Estimate Resilient Modulus from R-Value

Chapter 3. Comparison of Idaho Flexible Pavement Design
17
ITD uses an approximate relationship between Mr and R-value for the subgrade soils. This relationship is
shown in Figure 5.(2) ITD’s Mr-R-value relationship was not used in this analysis. The AI equation was used
instead as it is recommended by AASHTO and MEPDG.(4) In addition, ITD’s Mr-R-value relationship yields
conservative results (lower R-values).
Log Mr = (222 + R) / 67
where:
Mr = resilient modulus, psi
R = R-value
Figure 5. ITD Equation to Estimate Resilient Modulus from R-Value
As previously mentioned, all performed designs using the AASHTO 1993 method were performed at
2 different reliability levels of 50 percent and 85 percent.
Table 10. Design Input Data for AASHTO 1993 Method
Design Input Design Project
US-2(a) US-2(b) US-2(c) SH-62 SH-3 SH-19 US-95 US-93
Design Reliability, % 50% & 85%
Design ESALs 7,920,000 7,920,000 7,920,000 816,000 3,696,000 1,677,000 2,240,000 3,034,000
PSI (Loss of
Serviceability) 2 2 2 2 2 2 2 2
Structural Layer Coefficients (ai)
a1 0.44 0.44 0.44 0.44 0.44 0.44 0.44 0.44
a2 0.17 0.17 0.17 0.17 0.17 0.17 0.17 0.17
a3 - - - - - - 0.19 -
Drainage Coefficients (mi)
m2 1.0 1.0 1.0 1.0 1.0 1.0 1.0 1.0
m3 - - - - - - 1.2 -
Mr (psi), Base* 38,000 38,000 38,000 38,000 38,000 38,000 38,000 38,000
Mr (psi), Subbase* - - - - - - 32,000 -
Mr (psi), Subgrade** 12,255 28,905 9,480 5,595 15,030 25,575 3,930 28,905
Mr (psi),
Subgrade*** 4092 11473 3446 2710 4860 9336 2444 11474
* Estimated Values
** Estimated from measured R-values using the Asphalt Institute equation given in Figure 4 and used
in the analysis.
* ** Estimated from measured R-values using the Asphalt Institute equation given in Figure 5 and
was not used in the analysis.

Study of the Effectiveness of ITD Pavement Design Method
18
MEPDG Inputs for the Investigated Projects
Most of the inputs used in MEPDG for the investigated project are considered Level 3 inputs. For the Hot
Mix Asphalt (HMA) material characterization, the dynamic modulus (E*) is the primary input. Level 2 input
data which includes some gradation parameters as well as volumetric mix parameters was used for the
HMA characterization for all investigated projects as shown in Table 11. The NCHRP 1-37A viscosity-based
model incorporated in to the software was selected to estimate E* for the analyses.(4) HMA volumetric
properties required by MEPDG are the in-situ air voids at the time of construction and the effective binder
content (Vbeff). Because the actual in-situ air voids at the time of construction for the investigated projects
were not available, this parameter was assumed to be 7 percent. The Vbeff for HMA used for each project
was calculated from the gravimetric asphalt content with the help of the following formula shown in
Figure 6:(28)
where:
Vbeff = effective binder content by volume (%)
Va = in-situ target air voids (%)
Gsb = bulk specific gravity of aggregates
Gmm = theoretical maximum specific gravity
AC % = gravimetric asphalt content percentage (by % of total mix weight)
Figure 6. Equation to Determine Effective Binder Content of HMA
For the subgrade material characterization inputs, MEPDG Level 2 was used as the R-value of the subgrade
is measured in the laboratory. MEPDG then uses the Asphalt Institute equation presented in Figure 4 to
compute the resilient modulus from the R-value. The appropriate weather station data for each location
was chosen based on the latitude, longitude and elevation of the project.
For the traffic data inputs, MEPDG uses the axle load spectra while ITD uses the TI (function of the classical
18-kip ESAL) and AASHTO 1993 design method uses the classical ESALs as the only traffic input. In order to
maintain consistent traffic inputs for the three methods, the traffic load spectra analysis in the MEPDG
was modified to reflect the design ESALs. The use of 18-kips-ESALs in MEPDG was conducted by:
1. using 100 percent FHWA Truck Class 5 and 0 percent for all other truck classes.
2. using 100 percent 18,000 lb single axle load and 0 percent for all other single axle loads.
3. using 100 percent of trucks in design direction.
4. using 100 percent trucks in design lane. In addition, the design ESALs expected to use the
pavement was assumed to be uniformly distributed over the design life.
sb
mmmmsbabeff
G
GACGGVV
)%100100(
100
)100(

Chapter 3. Comparison of Idaho Flexible Pavement Design
19
Furthermore, the representative modulus module for the base/subbase and subgrade layers was used in
the analyses. MEPDG recommended a criterion shown previously in Table 5 was followed. The major
inputs for the investigated projects using MEPDG design method are illustrated in Table 11.
Table 11. Design Input Data for MEPDG
Design Input Design Project
US-2(a) US-2(b) US-2(c) SH-62 SH-3 SH-19 US-95 US-93
Location:
County Bonner Bonner Bonner Lewis Nez Perce Canyon Washington Butte
Latitude, Deg. Min. 48.15 48.15 48.15 46.14 46.28 43.4 44.19 43.26
Longitude, Deg. Min. -116.39 -116.39 -116.39 -116.14 -116.45 -116.46 -116.55 -113.37
Elevation, ft 2,085 2,085 2,085 3,215 850 2,330 2,490 5,641
Main Traffic Inputs:
Design Life, years 20 20 20 20 20 20 20 20
Speed, mph 60 60 60 35 55 60 60 65
AADTT
(design lane) 542 542 542 56 253 115 153 208
Hot Mix Asphalt (HMA) Material Properties:
Binder Type PG58-28 PG58-28 PG58-28 PG58-28 PG70-28 AC-10 AC-10 PG64-34
Cumulative, %
Retained ¾" Sieve 1 1 1 0 3 0 0 0
Cumulative, %
Retained 3/8" Sieve
27 27 27 15 23 27 26 26.4
Cumulative, %
Retained
No.4 Sieve
53 53 53 45 54 49 49 53
% Passing
No.200 Sieve 6 6 6 8.2 4 5.6 4.9 5.3
% Vbeff 9.95 9.95 9.95 11.01 11.6 9.66 9.38 10.09
% Air Voids 7 7 7 7 7 7 7 7
Unbound Granular Base Course Properties:
Material Type A-1-a A-1-a A-1-a A-1-a A-1-a A-1-a A-1-a A-1-a
Mr, psi 38,000 38,000 38,000 38,000 38,000 38,000 38,000 38,000
Unbound Granular Subbase Course Properties:
Material Type Permeable
Aggregate
Permeable Aggregate
Permeable Aggregate
- - Permeable
Aggregate
Permeable
Aggregate
Permeable
Aggregate
Mr, psi 32,000* 32,000* 32,000* - - 32,000* 32,000 32,000*
Subgrade Properties:
Material Type SP-SM ML CL CL SM ML MH SW
Mr, psi 12,255 28,905 9,480 5,595 15,030 25,575 3,930 28,905
GWT Depth, ft 10 10 10 6 45 7 7 30
* For ITD’s Design Method sections only

Study of the Effectiveness of ITD Pavement Design Method
20
Pavement Structure Design
Three designs were considered for each of the 8 selected projects. ITD’s design method was used to
design each of these projects. The projects were also structurally designed using both the AASHTO 1993
guide and MEPDG method. It should be noted that, the AASHTO 1993 design method recommends
minimum layer thicknesses as a function of the design traffic level in terms of ESALs. The AASHTO 1993
minimum recommended layer thicknesses are shown in Table 12. Thus, for AASHTO 1993 design, if the
method yielded thicknesses lower than the ones shown in Table 12, the design thicknesses were then
taken from this table.
Table 12. AASHTO 1993 Minimum Layer Thicknesses(3)
Traffic (ESALs) Asphalt Concrete Aggregate Base
Less than 50,000 1.0 4.0
50,001 - 150,000 2.0 4.0
150,001 - 500,000 2.5 4.0
500,001 - 2,000,000 3.0 6.0
2,000,001 - 7,000,000 3.5 6.0
Greater than 7,000,000 4.0 6.0
Currently, MEPDG software is an analysis tool rather than a design tool. In order to find the design
structure for each project using MEPDG, MEPDG software version 1.10 was ran several times based on the
criteria for primary roadways presented in Table 5.
Results and Analysis
The following subsections present a comparison between the resulting pavement structure using ITD,
AASHTO 1993, and MEPDG procedures at 50 percent and 85 percent reliability levels. It also present a
comparison of the predicted performance using MEPDG for the three pavement designs for each of the
investigated projects. AASHTO 1993 designs were conducted using the flexible pavement design utility
which is available online.(27) This flexible pavement design utility solves the AASHTO 1993 basic design
equation for flexible pavements.
Structure Design at a 50 Percent Reliability Level
Table 13 summarizes the resulted structures of the investigated projects using ITD’s design method. The
designed pavement structures using the AASHTO 1993 guide are shown in Table 14. The data in this table
shows that for most of studied projects, the base layer thickness was chosen according to the minimum
thickness criteria as a function of traffic recommended by AASHTO (See Table 12). Thus the actual
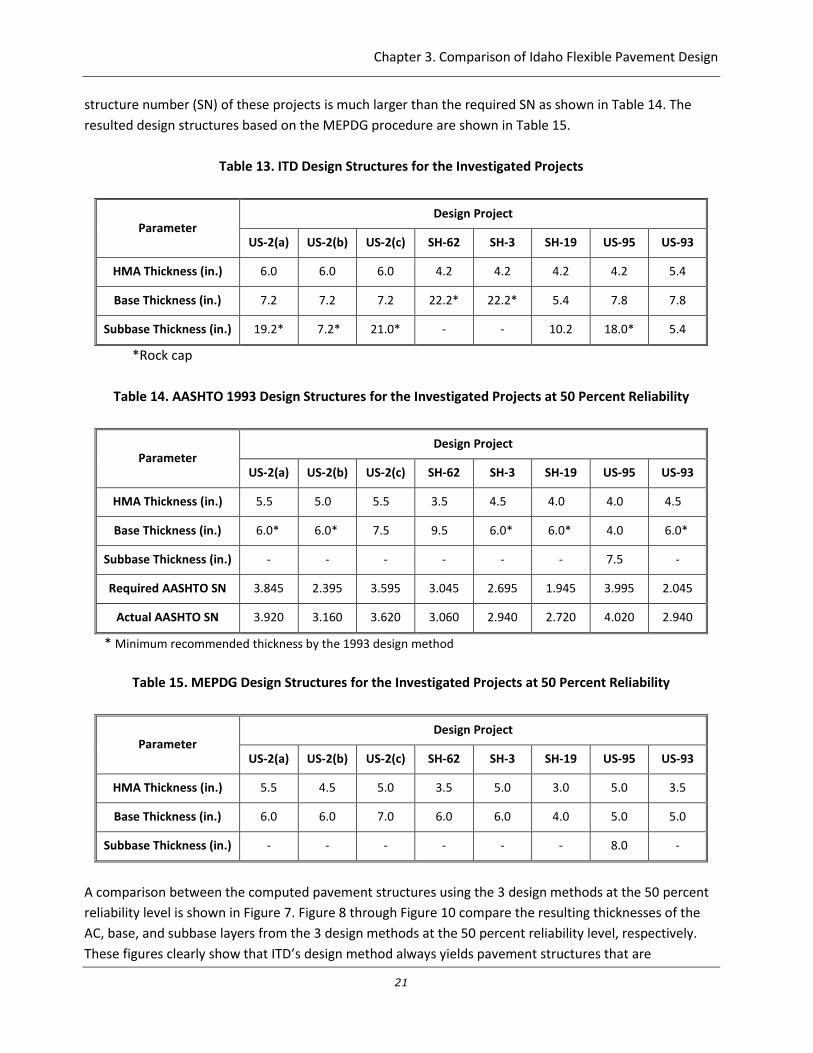
Chapter 3. Comparison of Idaho Flexible Pavement Design
21
structure number (SN) of these projects is much larger than the required SN as shown in Table 14. The
resulted design structures based on the MEPDG procedure are shown in Table 15.
Table 13. ITD Design Structures for the Investigated Projects
Parameter Design Project
US-2(a) US-2(b) US-2(c) SH-62 SH-3 SH-19 US-95 US-93
HMA Thickness (in.) 6.0 6.0 6.0 4.2 4.2 4.2 4.2 5.4
Base Thickness (in.) 7.2 7.2 7.2 22.2* 22.2* 5.4 7.8 7.8
Subbase Thickness (in.) 19.2* 7.2* 21.0* - - 10.2 18.0* 5.4
*Rock cap
Table 14. AASHTO 1993 Design Structures for the Investigated Projects at 50 Percent Reliability
Parameter Design Project
US-2(a) US-2(b) US-2(c) SH-62 SH-3 SH-19 US-95 US-93
HMA Thickness (in.) 5.5 5.0 5.5 3.5 4.5 4.0 4.0 4.5
Base Thickness (in.) 6.0* 6.0* 7.5 9.5 6.0* 6.0* 4.0 6.0*
Subbase Thickness (in.) - - - - - - 7.5 -
Required AASHTO SN 3.845 2.395 3.595 3.045 2.695 1.945 3.995 2.045
Actual AASHTO SN 3.920 3.160 3.620 3.060 2.940 2.720 4.020 2.940
* Minimum recommended thickness by the 1993 design method
Table 15. MEPDG Design Structures for the Investigated Projects at 50 Percent Reliability
Parameter Design Project
US-2(a) US-2(b) US-2(c) SH-62 SH-3 SH-19 US-95 US-93
HMA Thickness (in.) 5.5 4.5 5.0 3.5 5.0 3.0 5.0 3.5
Base Thickness (in.) 6.0 6.0 7.0 6.0 6.0 4.0 5.0 5.0
Subbase Thickness (in.) - - - - - - 8.0 -
A comparison between the computed pavement structures using the 3 design methods at the 50 percent
reliability level is shown in Figure 7. Figure 8 through Figure 10 compare the resulting thicknesses of the
AC, base, and subbase layers from the 3 design methods at the 50 percent reliability level, respectively.
These figures clearly show that ITD’s design method always yields pavement structures that are

Study of the Effectiveness of ITD Pavement Design Method
22
significantly thicker compared to the other two methods. Figure 8 shows that that AASHTO 1993 and
MEPDG methods yield very similar AC thicknesses for most of the investigated projects. Furthermore, a
reasonable agreement was found between the three design methods regarding the design thickness of
the asphalt layer except in case of projects with either very high strength or very weak subgrade
foundation. However, the unbound granular layer(s) thickness(s) were found to be much thicker in the
ITD’s design method (2 to 4.5 times). For all practical purposes, the AASHTO 1993 and MEPDG methods
produce reasonably similar pavement structures.
It should be noted that the assumptions used in this study are different from that ITD used when
implementing AASHTO 1993 design guide. ITD used Mr-R-value equation that led to low Mr values. Hence,
when using AASHTO 1993 guide it produced thicker pavement than ITD’s design method. In this study the
Asphalt Institute equation of Mr-R-value was used as per AASHTO recommendation. This, in turn, led to
much higher Mr values for the same R-values, and consequently produced thinner pavements than ITD
method. Hence the key difference in the results between AASHTO 1993 design guide and ITD method is in
the transfer equation of Mr from R-value.
Figure 7. Comparison of the Recommended Pavement Structure by the
Investigated Design Methods at 50 Percent Reliability
0
5
10
15
20
25
AC
Bas
e
Sub
bas
e
AC
Bas
e
Sub
bas
e
AC
Bas
e
Sub
bas
e
AC
Bas
e
AC
Bas
e
AC
Bas
e
Sub
bas
e
AC
Bas
e
Sub
bas
e
AC
Bas
e
Sub
bas
e
US-2(a) US-2(b) US-2(c) SH-62 SH-3 SH-19 US-95 US-93
Laye
r Th
ickn
ess
(in
.)
Design Project
ITD AASHTO 1993 MEPDG

Chapter 3. Comparison of Idaho Flexible Pavement Design
23
Figure 8. Comparison of the Recommended AC Layer Thickness by the
Investigated Design Methods at 50 Percent Reliability
Figure 9. Comparison of the Recommended Base Layer Thickness by the
Investigated Design Methods at 50 Percent Reliability
0
1
2
3
4
5
6
7
US-2(a) US-2(b) US-2(c) SH-62 SH-3 SH-19 US-95 US-93
AC
Lay
er T
hic
knes
s (i
n.)
Design Project
ITD Design Method AASHTO 1993 MEPDG
0
5
10
15
20
25
US-2(a) US-2(b) US-2(c) SH-62 SH-3 SH-19 US-95 US-93
Bas
e L
ayer
Th
ickn
ess
(in
.)
Design Project
ITD Design Method
AASHTO 1993
MEPDG

Study of the Effectiveness of ITD Pavement Design Method
24
Figure 10. Comparison of the Recommended Subbase Layer Thickness by the
Investigated Design Methods at 50 Percent Reliability
The US-2 project has 3 sections with the same inputs except for the subgrade strength. The designed
pavement structures using the 3 different methods for the 3 US-2 sections show that the subgrade
strength is overemphasized by the ITD’s design method compared to the other 2 design methods.(29) This
is shown in Figure and Figure by the dramatic increase in the subbase thickness with the decrease in the
subgrade strength based on ITD’s design.
MEPDG Predicted Distresses at 50 Percent Reliability
Rutting Analysis
MEPDG predicted distresses and roughness, at the end of design life, using the pavement structures
resulting from the 3 design methods for the investigated projects are shown in Figure 11 through
Figure 16. No thermal cracking was predicted for any of the pavement structures resulted by any of the
investigated design methodologies. A comparison of MEPDG predicted distresses and roughness, during
the service life, using the pavement structures resulted from the three design methods for the
investigated projects are shown in Appendix B.
For all practical purposes, Figure 11 shows no significant difference in the predicted total rutting for the
structures designed with AASHTO 1993 and MEPDG as these 2 methods generally yielded similar
pavement structures. This figure also shows no significant difference in the predicted total rutting
0
5
10
15
20
25
US-2(a) US-2(b) US-2(c) SH-62 SH-3 SH-19 US-95 US-93
Sub
bas
e L
aye
r Th
ickn
ess
(in
.)
Design Project
ITD Design Method AASHTO 1993 MEPDG

Chapter 3. Comparison of Idaho Flexible Pavement Design
25
between the structures resulting from ITD’s design method and the other 2 design methods, despite the
fact that ITD’s method always yielded a much thicker pavement structures.
Figure 11. Comparison of MEPDG Total Predicted Rutting
From the 3 Design Methods at 50 Percent Reliability
Furthermore, one can surmise from Figure 12 that, there is no significant difference in the predicted AC
rutting for all pavement structures resulted from the 3 design methods. The primary reason for this is that,
generally, there was no significant difference in the design AC thickness resulting from the three different
design methods. In addition, the AC rutting is only a function of the AC layer properties, traffic, and
environment and it is not affected by the foundation properties. This observation agrees with other
studies.(30, 31)
0.00
0.10
0.20
0.30
0.40
0.50
0.60
0.70
US-2(a) US-2(b) US-2(c) SH-62 SH-3 SH-19 US-95 US-93
Tota
l Ru
ttin
g (i
n.)
Design Project
ITD Design Method AASHTO 1993 MEPDG

Study of the Effectiveness of ITD Pavement Design Method
26
Figure 12. Comparison of MEPDG Predicted AC Rutting from
the 3 Design Methods at 50 Percent Reliability
It can be also deduced from Figure 7 and Figure 13 that as the thickness of the unbound base/subbase
layers increases, the rutting within this layer(s) also increases. This is obvious in Figure 13 for the
structures designed with ITD’s method. This fact is the main reason that, although ITD’s design method
always yielded larger total pavement thickness compared to AASHTO 1993 and MEPDG, the total rutting
predicted from the 3 design methods is not significantly different.
Figure 14 shows that, the predicted subgrade rutting for the pavement structures designed by ITD’s
method is the lowest. This observation is basically because ITD’s design always yielded thicker pavement
structures. It is obvious that if the pavement structure above the subgrade is thicker, the compressive
strain at the top as well as any point within the subgrade is lower, hence subgrade rutting decreases.
Only the US-95 section at the 50 percent reliability level, AASHTO 1993 design yielded a structure with a
total rutting slightly in excess of MEPDG recommended threshold value. All other structures conform to
MEPDG recommended design criteria.
0.00
0.05
0.10
0.15
0.20
0.25
0.30
US-2(a) US-2(b) US-2(c) SH-62 SH-3 SH-19 US-95 US-93
AC
Lay
er R
utt
ing
(in
.)
Design Project
ITD Design Method AASHTO 1993 MEPDG

Chapter 3. Comparison of Idaho Flexible Pavement Design
27
Figure 13. Comparison of MEPDG Predicted Unbound Layers Rutting
from the 3 Design Methods at 50 Percent Reliability
Figure 14. Comparison of MEPDG Predicted Subgrade Rutting from
the 3 Design Methods at 50 Percent Reliability
0.00
0.02
0.04
0.06
0.08
0.10
0.12
0.14
0.16
0.18
US-2(a) US-2(b) US-2(c) SH-62 SH-3 SH-19 US-95
Un
bo
un
d L
ayer
(s)
Ru
ttin
g (i
n.)
Design Project
ITD Design Method AASHTO 1993 MEPDG
0.00
0.05
0.10
0.15
0.20
0.25
0.30
US-2(a) US-2(b) US-2(c) SH-62 SH-3 SH-19 US-95 US-93
Sub
grad
e R
utt
ing
(in
.)
Design Project
ITD Design Method AASHTO 1993 MEPDG

Study of the Effectiveness of ITD Pavement Design Method
28
Fatigue Cracking Analysis
Regarding alligator fatigue cracking, Figure 15 clearly shows that among the 3 design methods, ITD’s
design method always yielded pavement sections with the least amount of fatigue cracking. This is
obviously because ITD’s method always yields thicker (at least 2.0 times as thick) unbound granular layers
which results in a stronger support for the AC layer. Thus less tensile strain at the bottom of the AC layer
occurs. This figure also shows that MEPDG predicted alligator fatigue cracking values for all structures
resulted for the 3 design methods are way below the MEPDG recommended threshold value of
20 percent.(19)
Roughness (IRI) Analysis
A comparison between the IRI predicted using MEPDG for the pavement structures resulted from the
3 design methods, at the 50 percent reliability level is shown in Figure 16. No significant difference in the
predicted IRI was observed as shown in this figure. Additionally, MEPDG predicted IRI values for all
structures resulted from the 3 design methods, are way below MEPDG recommended threshold value of
200 in./mile.
Figure 15. Comparison of MEPDG Predicted Alligator Fatigue Cracking
from the 3 Design Methods at 50 Percent Reliability
0
2
4
6
8
10
12
14
16
18
20
US-2(a) US-2(b) US-2(c) SH-62 SH-3 SH-19 US-95 US-93
Alli
gato
r Fa
tigu
e C
rack
ing
(%
)
Design Project
ITD AASHTO 1993 MEPDG

Chapter 3. Comparison of Idaho Flexible Pavement Design
29
Figure 16. Comparison of MEPDG Predicted IRI from
the 3 Design Methods at 50 Percent Reliability
Finally, a comparison between Figure 11, Figure 15, and Figure 16 along with MEPDG recommended
design criteria reveals that MEPDG designs were governed by the total pavement rutting not by cracking
or IRI. One direct reason for this is the use of ESALs instead of axle load spectra in all MEPDG computer
simulation runs. In general, load associated cracking are more sensitive to axle load spectra compared to
rutting.(8)
Structure Design at 85 Percent Reliability Level
ITD’s design method for flexible pavements is a deterministic method that does not incorporate reliability.
On the other hand, both AASHTO 1993 and MEPDG methods allow design at different reliability levels.
Results at the 50 percent reliability level show that ITD’s design method always yielded significantly
thicker unbound layer thicknesses compared to both AASHTO 1993 and MEPDG guides. It was decided to
redesign the investigated projects at 85 percent reliability levels using both AASHTO 1993 and MEPDG
methods and compare the resulting structures and predicted distresses with ITD’s design.
The designed pavement structures at 85 percent reliability level and combined standard deviation of 0.45
using the AASHTO 1993 guide are shown in Table 16. As expected comparing the thicknesses in Table 14
and Table 16 show that, the higher the reliability, the thicker the pavement thickness. This is true
especially on the AC layer thickness. Table 17 summarizes the designed pavement structures at 85 percent
reliability levels using MEPDG.
90
95
100
105
110
115
120
125
130
US-2(a) US-2(b) US-2(c) SH-62 SH-3 SH-19 US-95 US-93
IRI (
in./
mile
)
Design Project
ITD AASHTO 1993 MEPDG

Study of the Effectiveness of ITD Pavement Design Method
30
Table 16. AASHTO 1993 Design Structure for the Investigated Projects at 85 Percent Reliability
Parameter Design Project
US-2(a) US-2(b) US-2(c) SH-62 SH-3 SH-19 US-95 US-93
HMA Thickness (in.) 6.0 6.0 6.0 4.0 5.5 5.0 5.0 5.5
Base Thickness (in.) 8.0 6.0* 9.5 11.5 6.0* 6.0* 4.0 6.0*
Subbase Thickness (in.) - - - - - - 8.0 -
Required SN 3.845 2.795 4.100 3.595 3.195 2.295 4.595 2.395
Actual SN 3.920 3.600 4.160 3.600 3.380 3.160 4.676 3.160
* Minimum Recommended Thickness by the 1993 Design Method
Table 17. MEPDG Design Structure for the Investigated Projects at 85 Percent Reliability
Parameter Design Project
US-2(a) US-2(b) US-2(c) SH-62 SH-3 SH-19 US-95 US-93
HMA Thickness (in.) 7.0 6.5 7.5 4.0 7.0 4.0 7.0 4.5
Base Thickness (in.) 8.0 6.0 9.0 8.0 6.0 4.0 4.0 6.0
Subbase Thickness (in.) - - - - - - 8.5 -
Figure 17 shows a comparison between the computed pavement structures using the 3 design methods at
the 85 percent reliability level. A comparison of the resulting thicknesses of the AC, base, and subbase
layers from the 3 design methods at the 85 percent reliability level, is shown in Figure 18 through
Figure 20, respectively. Similar to the results at the 50 percent reliability level, AASHTO 1993, and MEPDG
methods at 85 percent reliability still result in significantly thinner unbound layer thicknesses compared to
ITD design method. However, at this reliability level, generally for most of the investigated projects, both
AASHTO 1993 and MEPDG methods yielded thicker AC layer thicknesses compared to ITD’s method as
shown in Figure 18. Figure 18 also reveals that MEPDG desired AC thickness is usually slightly larger than
the one required by ITD’s and AASHTO 1993 methods. The significant increase in the AC layer thickness for
projects designed with MEPDG occurred with the US-95 project which has a very weak subgrade
(R- value = 5).

Chapter 3. Comparison of Idaho Flexible Pavement Design
31
Figure 17. Comparison of the Recommended Pavement Structure by
the Investigated Design Methods at 85 Percent Reliability
Figure 18. Comparison of the Recommended AC Layer Thickness by
the Investigated Design Methods at 85 Percent Reliability
0
5
10
15
20
25
AC
Bas
e
Sub
bas
e
AC
Bas
e
Sub
bas
e
AC
Bas
e
Sub
bas
e
AC
Bas
e
AC
Bas
e
AC
Bas
e
Sub
bas
e
AC
Bas
e
Sub
bas
e
AC
Bas
e
Sub
bas
e
US-2(a) US-2(b) US-2(c) SH-62 SH-3 SH-19 US-95 US-93
Laye
r Th
ickn
ess
(in
.)
Design Project
ITD AASHTO 1993 MEPDG
0
1
2
3
4
5
6
7
8
9
US-2(a) US-2(b) US-2(c) SH-62 SH-3 SH-19 US-95 US-93
AC
Lay
er T
hic
knes
s (i
n.)
Design Project
ITD Design Method AASHTO 1993 MEPDG

Study of the Effectiveness of ITD Pavement Design Method
32
Figure 19. Comparison of the Recommended Base Layer Thickness by
the Investigated Design Methods at 85 Percent Reliability
Figure 20. Comparison of the Recommended Subbase Layer Thickness
by the Investigated Design Methods at 85 Percent Reliability
0
5
10
15
20
25
US-2(a) US-2(b) US-2(c) SH-62 SH-3 SH-19 US-95 US-93
Bas
e L
ayer
Th
ickn
ess
(in
.)
Design Project
ITD Design Method
AASHTO 1993
MEPDG
0
5
10
15
20
25
US-2(a) US-2(b) US-2(c) SH-62 SH-3 SH-19 US-95 US-93
Sub
bas
e L
ayer
Th
ickn
ess
(in
.)
Design Project
ITD Design Method AASHTO 1993 MEPDG

Chapter 3. Comparison of Idaho Flexible Pavement Design
33
MEPDG Predicted Distresses for Structures Designed at 85 Percent Reliability
MEPDG predicted distresses and roughness, at the end of design life, using the pavement structures
resulting from the 3 design methods for the investigated projects are shown in Figure 21 through
Figure 26. Again, no thermal cracking was predicted for any of the pavement structures resulting by any of
the investigated design methodologies at this level of reliability. A comparison of MEPDG predicted
distresses and roughness for structures designed at 85 percent reliability using MEPDG and AASHTO 1993
compared to structures designed using ITD’s design method which does not incorporate reliability are
shown in Appendix C.
Rutting Analysis
Similar to the results at 50 percent reliability, Figure 21 shows no significant difference in MEPDG
predicted total rutting for the structures designed with the 3 investigated methods. However, the AC layer
rutting is generally higher for the structures designed using ITD’s method as the thickness of the AC was
smaller in these structures. This is shown in Figure 22. Again, the rutting in the unbound layers is
significantly higher for the structures designed with ITD’s method as shown in Figure 23.
Similar to results at 50 percent reliability, Figure 24 shows that, the predicted subgrade rutting for the
pavement structures designed by ITD’s method is the lowest. Furthermore, this figure shows that all
investigated structures conform to MEPDG recommended design criteria.
Figure 21. Comparison of MEPDG Total Predicted Rutting from
the 3 Design Methods at 85 Percent Reliability
0.00
0.10
0.20
0.30
0.40
0.50
0.60
US-2(a) US-2(b) US-2(c) SH-62 SH-3 SH-19 US-95 US-93
Tota
l Ru
ttin
g (i
n.)
Design Project
ITD Design Method AASHTO 1993 MEPDG

Study of the Effectiveness of ITD Pavement Design Method
34
Figure 22. Comparison of MEPDG Predicted AC Rutting from
the 3 Design Methods at 85 Percent Reliability
Figure 23. Comparison of MEPDG Predicted Unbound Layers Rutting
from the 3 Design Methods at 85 Percent Reliability
0.00
0.05
0.10
0.15
0.20
0.25
0.30
US-2(a) US-2(b) US-2(c) SH-62 SH-3 SH-19 US-95 US-93
AC
Lay
er R
utt
ing
(in
.)
Design Project
ITD Design Method AASHTO 1993 MEPDG
0.00
0.02
0.04
0.06
0.08
0.10
0.12
0.14
0.16
0.18
US-2(a) US-2(b) US-2(c) SH-62 SH-3 SH-19 US-95
Un
bo
un
d L
ayer
(s)
Ru
ttin
g (i
n.)
Design Project
ITD Design Method AASHTO 1993 MEPDG

Chapter 3. Comparison of Idaho Flexible Pavement Design
35
Figure 24. Comparison of MEPDG Predicted Subgrade Rutting
from the 3 Design Methods at 85 Percent Reliability
Fatigue Cracking Analysis
A comparison of MEPDG predicted alligator fatigue cracking resulting from pavement structures using the
3 investigated design alternatives, is shown in Figure 25. This figure shows that among the three design
methods, MEPDG design method yielded pavement sections with the least amount of fatigue cracking.
This is obviously because MEPDG resulting AC layer thicknesses were thicker compared to the other two
methods. One can conclude from Figure 25 and Figure 15 that increasing the AC layer thickness is more
effective in resisting fatigue cracking compared to increasing the unbound layer thickness. As the AC layer
thickness increased, the tensile strain at the bottom of the AC layer becomes lower, hence less fatigue
occurs. Figure 25 also shows that MEPDG predicted fatigue cracking values for all structures resulted from
the 3 design methods, are way below MEPDG recommended threshold value of 20 percent.
Roughness (IRI) Analysis
Finally, a comparison between the IRI predicted using MEPDG for the pavement structures resulted from
the 3 design methods, at the 85 percent reliability level is shown in Figure 26. No significant difference in
the predicted IRI was observed as shown in this figure. Additionally, MEPDG predicted IRI values for all
structures resulted from the three design methods, are way below MEPDG recommended threshold value
of 200 in./mile.
0.00
0.05
0.10
0.15
0.20
0.25
0.30
US-2(a) US-2(b) US-2(c) SH-62 SH-3 SH-19 US-95 US-93
Sub
grad
e R
utt
ing
(in
.)
Design Project
ITD Design Method AASHTO 1993 MEPDG

Study of the Effectiveness of ITD Pavement Design Method
36
Figure 25. Comparison of MEPDG Predicted Alligator Fatigue Cracking
from the 3 Design Methods at 85 Percent Reliability
Figure 26. Comparison of MEPDG Predicted IRI from
the 3 Design Methods at 85 Percent Reliability
0.0
1.0
2.0
3.0
4.0
5.0
6.0
US-2(a) US-2(b) US-2(c) SH-62 SH-3 SH-19 US-95 US-93
Alli
gato
r Fa
tigu
e C
rack
ing
(%)
Design Project
ITD AASHTO 1993 MEPDG
90
95
100
105
110
115
120
125
130
US-2(a) US-2(b) US-2(c) SH-62 SH-3 SH-19 US-95 US-93
IRI (
in./
mile
)
Design Project
ITD AASHTO 1993 MEPDG
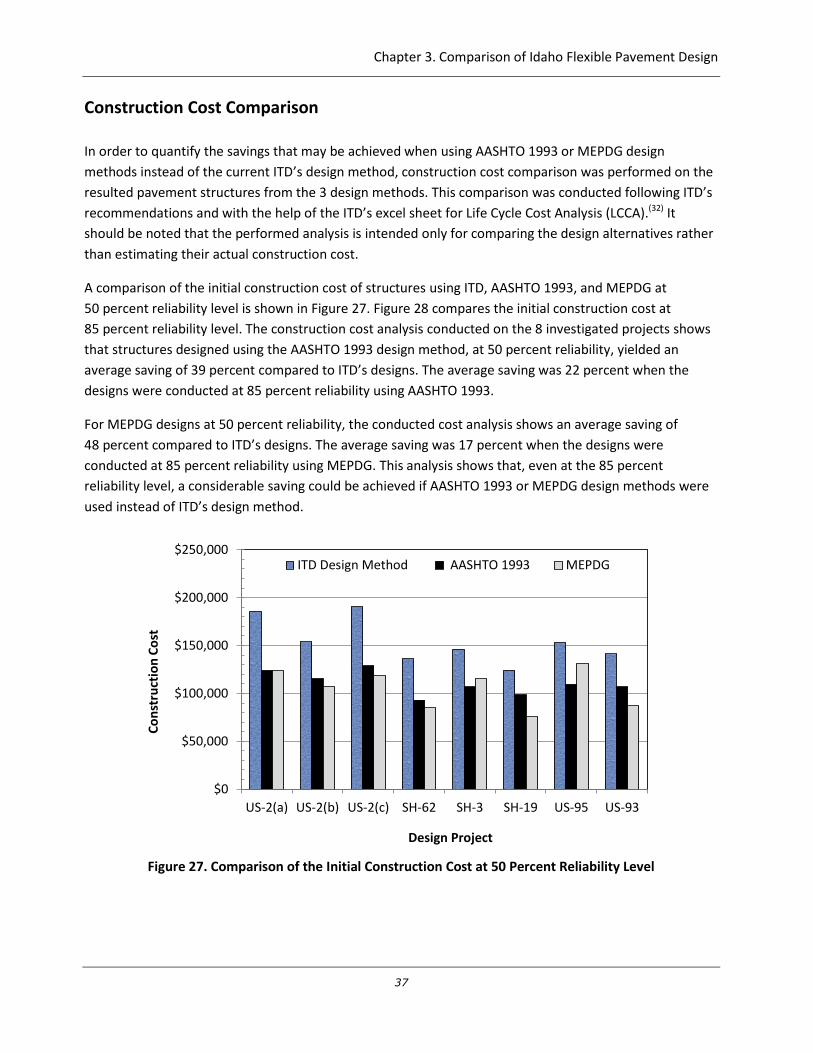
Chapter 3. Comparison of Idaho Flexible Pavement Design
37
Construction Cost Comparison
In order to quantify the savings that may be achieved when using AASHTO 1993 or MEPDG design
methods instead of the current ITD’s design method, construction cost comparison was performed on the
resulted pavement structures from the 3 design methods. This comparison was conducted following ITD’s
recommendations and with the help of the ITD’s excel sheet for Life Cycle Cost Analysis (LCCA).(32) It
should be noted that the performed analysis is intended only for comparing the design alternatives rather
than estimating their actual construction cost.
A comparison of the initial construction cost of structures using ITD, AASHTO 1993, and MEPDG at
50 percent reliability level is shown in Figure 27. Figure 28 compares the initial construction cost at
85 percent reliability level. The construction cost analysis conducted on the 8 investigated projects shows
that structures designed using the AASHTO 1993 design method, at 50 percent reliability, yielded an
average saving of 39 percent compared to ITD’s designs. The average saving was 22 percent when the
designs were conducted at 85 percent reliability using AASHTO 1993.
For MEPDG designs at 50 percent reliability, the conducted cost analysis shows an average saving of
48 percent compared to ITD’s designs. The average saving was 17 percent when the designs were
conducted at 85 percent reliability using MEPDG. This analysis shows that, even at the 85 percent
reliability level, a considerable saving could be achieved if AASHTO 1993 or MEPDG design methods were
used instead of ITD’s design method.
Figure 27. Comparison of the Initial Construction Cost at 50 Percent Reliability Level
$0
$50,000
$100,000
$150,000
$200,000
$250,000
US-2(a) US-2(b) US-2(c) SH-62 SH-3 SH-19 US-95 US-93
Co
nst
ruct
ion
Co
st
Design Project
ITD Design Method AASHTO 1993 MEPDG

Study of the Effectiveness of ITD Pavement Design Method
38
Figure 28. Comparison of the Initial Construction Cost at 85 Percent Reliability Level
$0
$50,000
$100,000
$150,000
$200,000
$250,000
US-2(a) US-2(b) US-2(c) SH-62 SH-3 SH-19 US-95 US-93
Co
nst
ruct
ion
Co
st
Design Project
ITD Design Method AASHTO 1993 MEPDG

Chapter 4. Pavement Performance Evaluation
39
Chapter 4
Pavement Performance Evaluation Using MEPDG
Introduction
Unlike both ITD’s and AASHTO 1993 design methods, MEPDG is able to simulate and predict pavement
performance over the service life of the pavement. Four different distress types as well as pavement
smoothness are predicted using MEPDG for flexible pavements. The distresses predicted are permanent
deformation (rutting), bottom-up alligator fatigue cracking, top-down longitudinal fatigue cracking, and
thermal (transverse) cracking. Pavement smoothness (roughness) is expressed as IRI in MEPDG.
In the current version of the MEPDG software (Version 1.10), pavement distresses are predicted, from
mechanistically calculated strains and deformations, using statistical transfer functions. These transfer
functions are nationally calibrated based on field data from 94 LTPP sections distributed all over the U.S.
The software also allows users to input user defined calibration coefficients to reflect certain conditions.
In MEPDG, IRI is predicted empirically as a function of pavement distresses, site factors that represent the
foundation’s shrink/swell and frost heave capabilities, and an estimate of the initial IRI (at time of
construction).(19)
This chapter presents a comparison between field measured and MEPDG predicted distresses based on
the evaluated ITD projects.
Investigated Projects and Input Data
No performance data was available for the SH-62 project as it is a new project. Consequently, a total of
7 out of the 8 projects presented previously in Table 5 and designed by ITD’s flexible pavement design
method were investigated for performance. These projects represent a wide range of subgrade strength,
climatic conditions, and traffic levels.
The actual cross section for each of the investigated projects was taken from ITD’s design reports. MEPDG
Level 2 input data was used for the characterization of the HMA and subgrade soils. A statewide Axle Load
Spectra (ALS) and number of axles per truck class data developed for Idaho as part of the MEPDG
implementation in Idaho which is close to completion were used for this task.(8) Idaho statewide ALS data
is presented in Table 18 through Table 21 for single, tandem, tridem, and quad axles, respectively.
Table 22 summarizes the number of axles per truck per axle type. The Annual Average Daily Truck Traffic
(AADTT) distribution is shown in Table 23. This data belongs to MEPDG default values for the Truck Traffic
Classification (TTC) Group 3. The traffic axle configuration and general traffic data are shown in Table 24.
All other required inputs were MEPDG Level 3 default values.

Study of the Effectiveness of ITD Pavement Design Method
40
Table 18. Statewide Single Axle Load Spectra
Axle Load
(lb)
Vehicle Class
4 5 6 7 8 9 10 11 12 13
3,000 4.07 9.14 1.82 5.81 15.18 2.13 1.16 9.74 8.25 5.21
4,000 1.91 10.92 2.83 3.02 10.52 2.15 0.78 6.44 5.84 5.81
5,000 3.18 10.80 3.51 2.44 9.48 2.64 1.72 9.26 4.66 5.87
6,000 6.18 12.22 5.14 5.03 9.05 3.02 2.74 9.79 6.56 6.65
7,000 6.30 7.69 6.82 6.59 7.04 4.89 3.53 7.82 7.12 7.75
8,000 10.77 8.31 9.85 8.93 10.41 7.45 7.30 9.01 10.57 7.20
9,000 8.39 6.94 9.12 9.03 6.37 9.20 10.35 6.72 9.77 8.34
10,000 9.01 5.70 10.59 9.35 7.18 13.36 15.49 7.70 11.94 11.01
11,000 7.49 4.60 9.13 9.15 4.45 14.00 13.92 5.83 9.51 8.15
12,000 7.39 4.47 10.23 9.18 4.00 14.58 15.04 4.73 7.04 8.59
13,000 6.94 3.31 8.47 7.99 3.11 9.22 10.78 3.34 4.67 5.86
14,000 6.22 2.50 5.75 5.07 2.09 4.02 3.94 2.74 2.80 3.48
15,000 6.21 2.40 5.67 3.51 2.15 3.42 3.28 2.82 2.55 3.78
16,000 3.46 1.80 2.97 3.84 1.19 2.05 1.22 2.23 1.78 2.50
17,000 2.68 1.81 2.48 3.13 1.18 1.77 0.96 2.03 1.39 2.63
18,000 1.83 1.48 1.41 2.21 1.01 1.34 0.60 1.72 1.04 1.87
19,000 1.58 1.42 1.18 1.49 1.26 1.18 1.21 1.53 0.71 1.54
20,000 1.02 0.94 0.70 0.87 0.82 0.79 2.29 1.06 0.49 0.96
21,000 0.88 0.74 0.75 0.75 1.01 0.67 1.61 0.83 0.59 0.69
22,000 0.83 0.45 0.80 0.40 0.60 0.52 0.66 0.74 0.31 0.41
23,000 0.74 0.43 0.38 0.66 0.41 0.47 0.24 0.84 0.27 0.27
24,000 0.55 0.29 0.10 0.51 0.23 0.27 0.32 0.56 0.37 0.30
25,000 0.58 0.15 0.12 0.25 0.14 0.14 0.29 0.31 0.31 0.31
26,000 0.43 0.17 0.03 0.13 0.14 0.15 0.11 0.17 0.27 0.12
27,000 0.32 0.19 0.02 0.21 0.11 0.10 0.04 0.22 0.14 0.09
28,000 0.24 0.29 0.02 0.09 0.10 0.06 0.05 0.12 0.11 0.06
29,000 0.15 0.19 0.01 0.16 0.07 0.03 0.02 0.14 0.06 0.06
30,000 0.09 0.11 0.00 0.01 0.07 0.07 0.06 0.25 0.06 0.06
31,000 0.09 0.08 0.00 0.01 0.06 0.04 0.02 0.17 0.06 0.04
32,000 0.11 0.07 0.00 0.04 0.06 0.03 0.01 0.16 0.06 0.04
33,000 0.10 0.04 0.02 0.03 0.06 0.02 0.03 0.15 0.04 0.02
34,000 0.07 0.04 0.00 0.00 0.05 0.05 0.05 0.13 0.05 0.04
35,000 0.04 0.03 0.00 0.00 0.05 0.03 0.02 0.15 0.05 0.03
36,000 0.04 0.04 0.00 0.01 0.04 0.01 0.01 0.09 0.08 0.02
37,000 0.01 0.04 0.01 0.01 0.04 0.03 0.01 0.08 0.09 0.04
38,000 0.01 0.02 0.00 0.01 0.03 0.02 0.01 0.06 0.08 0.03
39,000 0.03 0.01 0.00 0.00 0.04 0.01 0.02 0.06 0.06 0.03
40,000 0.01 0.04 0.02 0.05 0.05 0.01 0.03 0.08 0.09 0.04
41,000 0.05 0.13 0.05 0.03 0.15 0.06 0.08 0.18 0.16 0.10

Chapter 4. Pavement Performance Evaluation
41
Table 19. Statewide Tandem Axle Load Spectra
Axle Load (lb)
Vehicle Class
4 5 6 7 8 9 10 11 12 13
6,000 4.34 0.00 5.52 11.08 30.69 1.69 3.74 21.91 7.33 6.03
8,000 2.25 0.00 6.01 6.54 11.45 2.92 5.89 9.97 4.42 6.60
10,000 2.60 0.00 6.93 9.47 9.39 5.61 6.01 15.71 8.03 7.20
12,000 3.52 0.00 7.25 9.73 11.11 8.14 7.41 20.39 8.45 9.54
14,000 2.64 0.00 7.09 7.18 7.52 6.94 7.82 13.50 8.20 5.77
16,000 4.20 0.00 6.27 5.76 6.04 6.23 8.24 4.49 10.64 6.20
18,000 4.40 0.00 6.45 5.82 4.66 5.35 5.73 2.91 13.47 6.00
20,000 5.91 0.00 5.45 4.39 3.58 5.22 5.06 1.91 7.83 5.97
22,000 9.56 0.00 5.47 4.15 2.42 4.87 5.70 1.04 8.38 4.79
24,000 10.61 0.00 5.74 4.68 3.64 5.67 6.39 0.57 6.51 5.46
26,000 7.87 0.00 6.18 4.54 3.15 5.93 4.06 0.43 3.84 6.28
28,000 6.64 0.00 5.36 3.97 1.51 6.03 5.21 0.57 3.13 6.13
30,000 6.89 0.00 4.73 3.93 0.90 6.35 5.75 0.86 2.59 5.67
32,000 6.93 0.00 3.75 2.64 0.66 5.48 5.30 0.84 1.88 3.80
34,000 4.51 0.00 3.39 3.24 0.59 5.31 4.04 0.85 1.28 3.37
36,000 3.71 0.00 2.63 3.07 0.55 4.76 2.85 0.89 0.79 2.95
38,000 2.90 0.00 2.43 2.07 0.40 3.81 2.13 0.30 0.68 1.84
40,000 1.72 0.00 1.83 1.68 0.24 2.74 1.83 0.27 0.35 1.79
42,000 1.30 0.00 1.56 1.42 0.18 2.25 1.59 0.20 0.42 1.14
44,000 0.79 0.00 1.88 0.59 0.18 1.47 0.66 0.21 0.36 0.91
46,000 0.76 0.00 1.26 0.45 0.15 1.18 0.54 0.23 0.42 0.53
48,000 0.51 0.00 0.96 0.40 0.12 0.62 0.42 0.17 0.15 0.33
50,000 1.07 0.00 0.46 0.42 0.10 0.38 0.57 0.14 0.10 0.28
52,000 1.41 0.00 0.24 0.35 0.12 0.17 0.24 0.08 0.15 0.44
54,000 0.91 0.00 0.19 0.26 0.08 0.31 0.15 0.10 0.09 0.36
56,000 0.60 0.00 0.55 0.29 0.08 0.19 0.09 0.18 0.04 0.12
58,000 0.16 0.00 0.12 0.15 0.05 0.12 0.08 0.12 0.04 0.06
60,000 0.03 0.00 0.07 0.18 0.04 0.05 0.08 0.13 0.03 0.09
62,000 0.09 0.00 0.07 0.40 0.05 0.05 0.04 0.06 0.06 0.03
64,000 0.22 0.00 0.03 0.32 0.05 0.04 0.02 0.11 0.04 0.06
66,000 0.24 0.00 0.02 0.21 0.08 0.04 0.13 0.12 0.03 0.05
68,000 0.38 0.00 0.01 0.11 0.06 0.03 0.51 0.13 0.05 0.03
70,000 0.16 0.00 0.02 0.08 0.02 0.01 0.71 0.16 0.06 0.01
72,000 0.00 0.00 0.02 0.10 0.01 0.00 0.68 0.09 0.06 0.06
74,000 0.01 0.00 0.03 0.07 0.01 0.00 0.24 0.08 0.04 0.03
76,000 0.01 0.00 0.01 0.05 0.01 0.00 0.02 0.03 0.02 0.01
78,000 0.00 0.00 0.01 0.09 0.02 0.00 0.01 0.02 0.00 0.01
80,000 0.00 0.00 0.00 0.04 0.04 0.03 0.01 0.05 0.01 0.01
82,000 0.15 0.00 0.01 0.08 0.05 0.01 0.05 0.18 0.03 0.05

Study of the Effectiveness of ITD Pavement Design Method
42
Table 20. Statewide Tridem Axle Load Spectra
Axle Load
(lb)
Vehicle Class
4 5 6 7 8 9 10 11 12 13
12,000 0.00 0.00 42.61 13.22 14.86 40.49 12.16 3.66 30.50 19.41
15,000 0.00 0.00 7.04 3.73 9.56 12.48 7.10 3.84 6.29 7.94
18,000 0.00 0.00 7.37 4.61 25.09 9.37 5.68 16.10 14.17 5.64
21,000 0.00 0.00 9.01 6.32 22.10 7.78 5.51 22.67 3.32 3.85
24,000 0.00 0.00 8.84 5.22 13.32 3.49 4.62 9.36 1.36 3.05
27,000 0.00 0.00 7.59 6.66 2.38 4.49 4.11 8.81 4.76 4.87
30,000 0.00 0.00 7.06 7.04 1.71 6.07 7.31 1.71 8.20 7.18
33,000 0.00 0.00 1.46 6.45 1.08 2.40 6.40 4.17 7.21 10.89
36,000 0.00 0.00 4.40 8.94 0.51 3.14 8.83 2.37 4.84 9.89
39,000 0.00 0.00 1.25 8.90 0.64 1.93 8.71 0.71 3.61 6.94
42,000 0.00 0.00 1.28 6.76 0.68 1.79 7.36 0.68 2.13 5.11
45,000 0.00 0.00 1.20 5.90 0.55 1.63 6.54 1.19 1.91 5.20
48,000 0.00 0.00 0.47 5.37 0.64 1.69 5.39 0.23 1.84 2.64
51,000 0.00 0.00 0.22 3.33 0.28 1.46 3.16 0.74 1.62 1.22
54,000 0.00 0.00 0.18 2.43 0.57 0.29 2.42 5.72 1.76 1.41
57,000 0.00 0.00 0.01 1.82 0.42 0.27 1.48 2.87 1.06 1.22
60,000 0.00 0.00 0.01 1.14 0.46 0.17 1.24 3.80 0.74 0.57
63,000 0.00 0.00 0.00 0.60 0.37 0.09 0.51 4.92 1.03 0.68
66,000 0.00 0.00 0.00 0.27 0.75 0.07 0.48 1.44 0.56 0.51
69,000 0.00 0.00 0.00 0.25 0.71 0.18 0.27 1.95 0.13 0.35
72,000 0.00 0.00 0.00 0.09 0.27 0.09 0.24 1.53 0.33 0.29
75,000 0.00 0.00 0.00 0.09 0.43 0.02 0.08 0.34 0.34 0.10
78,000 0.00 0.00 0.00 0.12 0.67 0.02 0.05 0.00 0.17 0.11
81,000 0.00 0.00 0.00 0.02 0.46 0.05 0.10 0.00 0.59 0.08
84,000 0.00 0.00 0.00 0.02 0.06 0.08 0.01 0.00 0.86 0.13
87,000 0.00 0.00 0.00 0.02 0.11 0.02 0.01 0.40 0.14 0.04
90,000 0.00 0.00 0.00 0.04 0.41 0.05 0.03 0.00 0.16 0.12
93,000 0.00 0.00 0.00 0.21 0.16 0.00 0.02 0.00 0.13 0.11
96,000 0.00 0.00 0.00 0.02 0.14 0.00 0.03 0.08 0.22 0.03
99,000 0.00 0.00 0.00 0.02 0.05 0.08 0.02 0.71 0.02 0.05
102,000 0.00 0.00 0.00 0.39 0.56 0.31 0.13 0.00 0.00 0.37

Chapter 4. Pavement Performance Evaluation
43
Table 21. Statewide Quad Axle Load Spectra
Axle Load
(lb)
Vehicle Class
4 5 6 7 8 9 10 11 12 13
12,000 0.00 0.00 0.00 10.85 27.34 18.21 4.77 0.00 14.78 8.29
15,000 0.00 0.00 0.00 3.91 8.72 6.68 3.52 0.00 4.66 2.56
18,000 0.00 0.00 0.00 3.22 6.30 13.83 2.94 2.72 3.31 3.06
21,000 0.00 0.00 0.00 4.57 6.60 10.70 2.27 16.20 5.90 2.04
24,000 0.00 0.00 0.00 6.90 2.62 8.81 1.91 17.69 7.13 1.86
27,000 0.00 0.00 0.00 7.74 5.86 6.19 2.55 10.22 6.20 2.22
30,000 0.00 0.00 0.00 6.54 5.18 3.71 2.34 6.51 7.84 3.20
33,000 0.00 0.00 0.00 4.61 3.54 1.08 3.47 9.77 2.08 6.76
36,000 0.00 0.00 0.00 2.94 1.35 2.05 5.47 13.31 3.97 3.74
39,000 0.00 0.00 0.00 3.88 4.80 4.52 9.09 10.48 9.08 4.61
42,000 0.00 0.00 0.00 3.56 4.73 3.38 6.89 9.99 4.38 4.79
45,000 0.00 0.00 0.00 2.82 5.68 2.40 10.90 2.53 2.93 5.77
48,000 0.00 0.00 0.00 4.11 1.24 2.12 10.80 0.58 1.91 4.29
51,000 0.00 0.00 0.00 4.83 2.22 0.72 9.04 0.00 0.37 5.44
54,000 0.00 0.00 0.00 3.69 2.53 1.13 6.06 0.00 1.22 3.99
57,000 0.00 0.00 0.00 2.84 1.25 2.85 4.23 0.00 0.13 4.85
60,000 0.00 0.00 0.00 1.48 1.64 0.95 2.69 0.00 1.06 4.74
63,000 0.00 0.00 0.00 1.36 2.01 1.80 2.46 0.00 0.13 4.72
66,000 0.00 0.00 0.00 1.27 2.05 1.50 2.16 0.00 0.93 4.02
69,000 0.00 0.00 0.00 1.33 0.51 1.60 1.78 0.00 2.45 4.60
72,000 0.00 0.00 0.00 1.64 0.47 0.74 1.50 0.00 2.40 4.17
75,000 0.00 0.00 0.00 1.28 1.03 0.81 1.23 0.00 3.14 1.83
78,000 0.00 0.00 0.00 1.16 0.00 1.64 0.58 0.00 3.84 1.41
81,000 0.00 0.00 0.00 1.65 0.00 0.70 0.20 0.00 4.12 1.00
84,000 0.00 0.00 0.00 0.75 0.04 1.71 0.11 0.00 1.94 1.13
87,000 0.00 0.00 0.00 1.89 0.21 0.17 0.08 0.00 1.31 1.01
90,000 0.00 0.00 0.00 1.90 0.25 0.00 0.07 0.00 1.00 0.60
93,000 0.00 0.00 0.00 2.42 0.20 0.00 0.14 0.00 0.17 0.58
96,000 0.00 0.00 0.00 1.65 0.20 0.00 0.14 0.00 0.09 0.57
99,000 0.00 0.00 0.00 1.20 0.64 0.00 0.09 0.00 0.26 0.27
102,000 0.00 0.00 0.00 2.01 0.79 0.00 0.52 0.00 1.27 1.88

Study of the Effectiveness of ITD Pavement Design Method
44
Table 22. Number of Axles per Truck
FHWA Truck Class
Number of Axles
Single Tandem Tridem Quad
Class 4 1.59 0.34 0.00 0.00
Class 5 2.00 0.00 0.00 0.00
Class 6 1.00 1.00 0.00 0.00
Class 7 1.00 0.22 0.83 0.10
Class 8 2.52 0.60 0.00 0.00
Class 9 1.25 1.87 0.00 0.00
Class 10 1.03 0.85 0.95 0.26
Class 11 4.21 0.29 0.01 0.00
Class 12 3.24 1.16 0.07 0.01
Class 13 3.32 1.79 0.14 0.02
Table 23. AADTT Traffic Distribution by Vehicle Class
FHWA Truck Class Percentage of Truck
Class 4 0.9
Class 5 11.6
Class 6 3.6
Class 7 0.2
Class 8 6.7
Class 9 62.0
Class 10 4.8
Class 11 2.6
Class 12 1.4
Class 13 6.2
Table 24. Axle Configurations and General Traffic Data
Input Value
Average Axle Width (edge to edge) Outside Dimensions (ft) 8.5
Dual Tire Spacing (in.) 12.0
Tire Pressure (psi) 120.0
Tandem Axle Spacing (in.) 51.6
Tridem Axle Spacing (in.) 49.2
Quad Axle Spacing (in.) 49.2
Design Lane Width (ft) 12.0
Standard Deviation of Traffic Wander (in.) 10.0
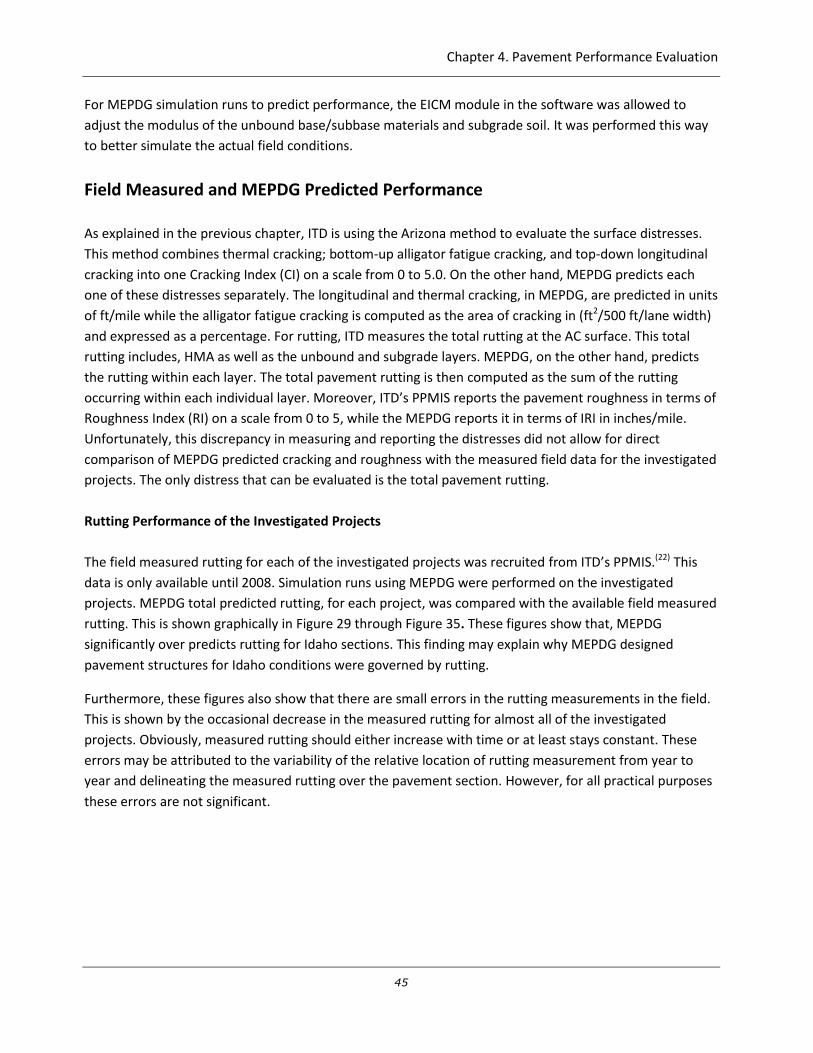
Chapter 4. Pavement Performance Evaluation
45
For MEPDG simulation runs to predict performance, the EICM module in the software was allowed to
adjust the modulus of the unbound base/subbase materials and subgrade soil. It was performed this way
to better simulate the actual field conditions.
Field Measured and MEPDG Predicted Performance
As explained in the previous chapter, ITD is using the Arizona method to evaluate the surface distresses.
This method combines thermal cracking; bottom-up alligator fatigue cracking, and top-down longitudinal
cracking into one Cracking Index (CI) on a scale from 0 to 5.0. On the other hand, MEPDG predicts each
one of these distresses separately. The longitudinal and thermal cracking, in MEPDG, are predicted in units
of ft/mile while the alligator fatigue cracking is computed as the area of cracking in (ft2/500 ft/lane width)
and expressed as a percentage. For rutting, ITD measures the total rutting at the AC surface. This total
rutting includes, HMA as well as the unbound and subgrade layers. MEPDG, on the other hand, predicts
the rutting within each layer. The total pavement rutting is then computed as the sum of the rutting
occurring within each individual layer. Moreover, ITD’s PPMIS reports the pavement roughness in terms of
Roughness Index (RI) on a scale from 0 to 5, while the MEPDG reports it in terms of IRI in inches/mile.
Unfortunately, this discrepancy in measuring and reporting the distresses did not allow for direct
comparison of MEPDG predicted cracking and roughness with the measured field data for the investigated
projects. The only distress that can be evaluated is the total pavement rutting.
Rutting Performance of the Investigated Projects
The field measured rutting for each of the investigated projects was recruited from ITD’s PPMIS.(22) This
data is only available until 2008. Simulation runs using MEPDG were performed on the investigated
projects. MEPDG total predicted rutting, for each project, was compared with the available field measured
rutting. This is shown graphically in Figure 29 through Figure 35. These figures show that, MEPDG
significantly over predicts rutting for Idaho sections. This finding may explain why MEPDG designed
pavement structures for Idaho conditions were governed by rutting.
Furthermore, these figures also show that there are small errors in the rutting measurements in the field.
This is shown by the occasional decrease in the measured rutting for almost all of the investigated
projects. Obviously, measured rutting should either increase with time or at least stays constant. These
errors may be attributed to the variability of the relative location of rutting measurement from year to
year and delineating the measured rutting over the pavement section. However, for all practical purposes
these errors are not significant.

Study of the Effectiveness of ITD Pavement Design Method
46
Figure 29. Comparison of MEPDG Predicted Rutting and Field Measured Rutting for US-2(a) Project
Figure 30. Comparison of MEPDG Predicted Rutting and Field Measured Rutting for US-2(b) Project
0
0.1
0.2
0.3
0.4
0.5
0.6
0.7
0.8
0 50 100 150 200 250
Tota
l Ru
ttin
g (i
n.)
Pavement Age (Months)
MEPDGMeasured
0
0.1
0.2
0.3
0.4
0.5
0.6
0 50 100 150 200 250
Tota
l Ru
ttin
g (i
n.)
Pavement Age (Months)
MEPDGMeasured

Chapter 4. Pavement Performance Evaluation
47
Figure 31. Comparison of MEPDG Predicted Rutting and Field Measured Rutting for US-2(c) Project
Figure 32. Comparison of MEPDG Predicted Rutting and Field Measured Rutting for SH-3 Project
0
0.1
0.2
0.3
0.4
0.5
0.6
0.7
0 50 100 150 200 250
Tota
l Ru
ttin
g (i
n.)
Pavement Age (Months)
MEPDGMeasured
0
0.1
0.2
0.3
0.4
0.5
0.6
0 50 100 150 200 250
Tota
l Ru
ttin
g (i
n.)
Pavement Age (Months)
MEPDGMeasured

Study of the Effectiveness of ITD Pavement Design Method
48
Figure 33. Comparison of MEPDG Predicted Rutting and Field Measured Rutting for SH-19 Project
Figure 34. Comparison of MEPDG Predicted Rutting and Field Measured Rutting for SH-95 Project
0.0
0.1
0.2
0.3
0.4
0.5
0.6
0 50 100 150 200 250
Tota
l Ru
ttin
g (i
n.)
Pavement Age (Months)
MEPDGMeasured
0
0.1
0.2
0.3
0.4
0.5
0.6
0.7
0.8
0 50 100 150 200 250
Tota
l Ru
ttin
g (i
n.)
Pavement Age (Months)
MEPDGMeasured

Chapter 4. Pavement Performance Evaluation
49
Figure 35. Comparison of MEPDG Predicted Rutting and Field Measured Rutting for SH-93 Project
Table 25 illustrates the contribution of each layer to the total rutting as predicted by MEPDG. All the
investigated projects have very thick granular layers above the subgrade; one may surmise from this data
that MEPDG overestimates the subgrade rutting. This table also shows some high rutting values in the
unbound granular layer(s) predicted by MEPDG. Finally, the AC rutting shown in this table, for most of the
investigated projects, also seems high. This reflects a need for local calibration of the MEPDG AC, granular,
and subgrade rutting models.
Table 25. MEPDG Predicted Rutting for Each Individual Pavement Layer
ITD Project MEPDG Predicted Rutting (in.)
AC Unbound Granular Layer(s) Subgrade Total
US-2(a) 0.30 0.14 0. 28 0.72
US-2(b) 0.31 0.11 0.12 0.54
US-2(c) 0.30 0.15 0.18 0.63
SH-3 0.24 0.07 0.23 0.54
SH-19 0.25 0.07 0.21 0.54
US-95 0.18 0.23 0.27 0.68
US-93 0.14 0.09 0.10 0.34
0.0
0.1
0.2
0.3
0.4
0 50 100 150 200 250
Tota
l Ru
ttin
g (i
n.)
Pavement Age (Months)
MEPDGMeasured

Study of the Effectiveness of ITD Pavement Design Method
50
A comparison between field measured and MEPDG predicted rutting for all projects combined in shown in
Figure 36. Again, MEPDG rutting prediction is highly biased. It predicts significantly higher rutting values
compared to the measured ones. This indicates the need for a local calibration of the rutting model in
MEPDG. In order to reduce the highly biased MEPDG rutting predictions, a correction (calibration) factor
of 0.526 was applied to the total predicted rutting. After the application of the calibration factor, this bias
was significantly minimized as shown in Figure 37.
Figure 36. MEPDG Predicted Rutting Versus Field Measured Rutting for All Projects
y = 1.9014x + 0.1028R² = 0.5983
0
0.1
0.2
0.3
0.4
0.5
0.6
0.7
0.8
0 0.1 0.2 0.3 0.4 0.5 0.6 0.7 0.8
MEP
DG
Pre
dic
ted
Ru
ttin
g (
in.)
Field Rutting (in.)
Line of Equality
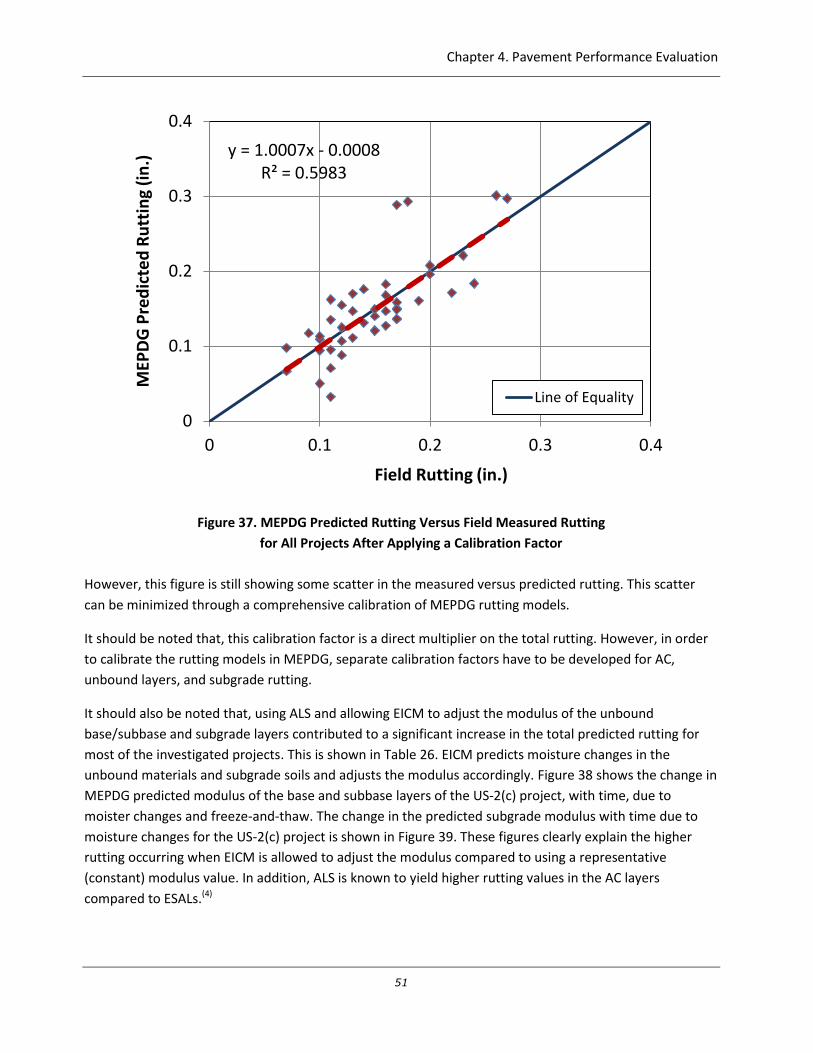
Chapter 4. Pavement Performance Evaluation
51
Figure 37. MEPDG Predicted Rutting Versus Field Measured Rutting
for All Projects After Applying a Calibration Factor
However, this figure is still showing some scatter in the measured versus predicted rutting. This scatter
can be minimized through a comprehensive calibration of MEPDG rutting models.
It should be noted that, this calibration factor is a direct multiplier on the total rutting. However, in order
to calibrate the rutting models in MEPDG, separate calibration factors have to be developed for AC,
unbound layers, and subgrade rutting.
It should also be noted that, using ALS and allowing EICM to adjust the modulus of the unbound
base/subbase and subgrade layers contributed to a significant increase in the total predicted rutting for
most of the investigated projects. This is shown in Table 26. EICM predicts moisture changes in the
unbound materials and subgrade soils and adjusts the modulus accordingly. Figure 38 shows the change in
MEPDG predicted modulus of the base and subbase layers of the US-2(c) project, with time, due to
moister changes and freeze-and-thaw. The change in the predicted subgrade modulus with time due to
moisture changes for the US-2(c) project is shown in Figure 39. These figures clearly explain the higher
rutting occurring when EICM is allowed to adjust the modulus compared to using a representative
(constant) modulus value. In addition, ALS is known to yield higher rutting values in the AC layers
compared to ESALs.(4)
y = 1.0007x - 0.0008R² = 0.5983
0
0.1
0.2
0.3
0.4
0 0.1 0.2 0.3 0.4
MEP
DG
Pre
dic
ted
Ru
ttin
g (i
n.)
Field Rutting (in.)
Line of Equality

Study of the Effectiveness of ITD Pavement Design Method
52
Table 26. Comparison of MEPDG Predicted Rutting Based on ALS and ESALs
ITD Project
MEPDG Predicted Rutting, in.
ALS, EICM ESALs, Representative Modulus
US-2(a) 0.72 0.49
US-2(b) 0.54 0.43
US-2(c) 0.63 0.49
SH-3 0.54 0.44
SH-19 0.54 0.36
US-95 0.68 0.52
US-93 0.34 0.31
Figure 38. Influence of Moisture Changes and Freeze and Thaw on MEPDG Predicted
Resilient Modulus of the Base and Subbase Layers of the US-2(c) Project
20000
30000
40000
50000
60000
70000
80000
0 50 100 150 200 250
Re
silie
nt
Mo
du
lus
(psi
)
Pavement Age (Month)
Base
Subbase

Chapter 4. Pavement Performance Evaluation
53
Figure 39. Influence of Moisture Changes on MEPDG Predicted Resilient
Modulus of the Subgrade Soil of the US-2(c) Project
Cracking Performance of the Investigated Projects
MEPDG predicted top-down longitudinal cracking and bottom-up alligator fatigue cracking of the
investigated projects are depicted in Figure 40 and Figure 41, respectively. No thermal cracking was
predicted for any of the investigated projects. These figures indicate that in general the predicted cracking
for the investigated projects was very little compared to MEPDG recommended threshold values.
5000
5200
5400
5600
5800
6000
6200
0 50 100 150 200 250
Re
silie
nt
Mo
du
lus
(psi
)
Pavement Age (Month)
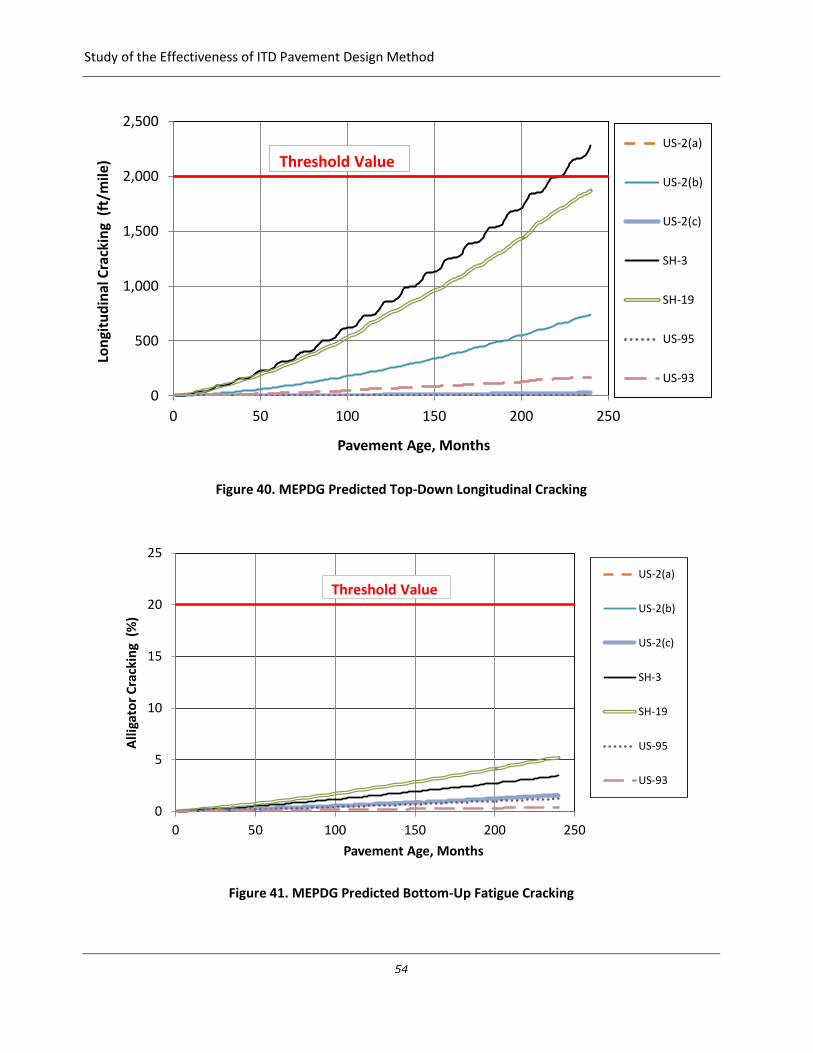
Study of the Effectiveness of ITD Pavement Design Method
54
Figure 40. MEPDG Predicted Top-Down Longitudinal Cracking
Figure 41. MEPDG Predicted Bottom-Up Fatigue Cracking
0
500
1,000
1,500
2,000
2,500
0 50 100 150 200 250
Lon
gitu
din
al C
rack
ing
(ft
/mile
)
Pavement Age, Months
US-2(a)
US-2(b)
US-2(c)
SH-3
SH-19
US-95
US-93
Threshold Value
0
5
10
15
20
25
0 50 100 150 200 250
All
igat
or
Cra
ckin
g (
%)
Pavement Age, Months
US-2(a)
US-2(b)
US-2(c)
SH-3
SH-19
US-95
US-93
Threshold Value

Chapter 4. Pavement Performance Evaluation
55
The ITD’s Pavement Rating Manual explains in detail how surface distresses are to be measured.(33)
Cracking is rated by severity and extent. A summary of ITD’s distress evaluation method is shown in
Table 27. In contrast, MEPDG cracks prediction models were calibrated based on LTPP data. This data was
collected according to the LTPP distress survey method which is summarized in Table 28.(34) A comparison
between these 2 tables reveals that ITD and LTPP cracking evaluation methods are different.
Table 27. ITD Distress Evaluation Method(33)
Distress ITD Distress Evaluation
Severity How to Measure
Alligator (Fatigue) Cracking
Slight Severity: Smaller than 1 ft in size Moderate Severity: 1 ft to 2 ft in size Heavy Severity: 3 ft or more in size
Light Extent: 10% or less of the total evaluation section having cracking. Moderate Extent: 10-40% of the total evaluation section having cracking. Heavy Extent: more than 40% of the total evaluation section having cracking.
Longitudinal Cracking
Slight Severity: Crack width is hairline up to ⅛ in. Moderate Severity: Crack width is ⅛ to ¼ in. or there is a dip 3 to 6 in. wide at the crack. Heavy Severity: Crack width is more than ¼ in. or there is a distinct dip of 6 to 8 in. wide or there is vegetation in the crack.
Light Extent: 100 ft or less of cracking per 500 ft. Moderate Extent: 100-500 ft of cracking per 500 ft. Heavy Extent: more than 500 ft of cracking per 500 ft.
Transverse Cracking
Slight Severity: Crack width is hairline up to ⅛ in. Moderate Severity: Crack width is ⅛ to ¼ in. or there is a dip 3 to 6 in. wide at the crack. Heavy Severity: Crack width is more than ¼” or there is a distinct dip of 6 to 8 in. wide or there is vegetation in the crack.
Light Extent: 1-4 cracks per 500 ft. Moderate Extent: 4-10 cracks per 500 ft. Heavy Extent: more than 10 cracks in 500 ft, or less than 50 ft in between cracks.

Study of the Effectiveness of ITD Pavement Design Method
56
Table 28. LTPP Distress Evaluation Method(34)
Distress LTPP Distress Evaluation
Severity How to Measure
Alligator (Fatigue) Cracking
Low Severity: An area of cracks with no or only a few
connecting cracks; cracks are not spalled or sealed; pumping
is not evident.
Moderate Severity: An area of interconnected cracks
forming a complete pattern; cracks may be slightly spalled;
cracks may be sealed; pumping is not evident.
High Severity: An area of moderately or severely spalled
interconnected cracks forming a complete pattern; pieces
may move when subjected to traffic; cracks may be sealed;
pumping may be evident.
Record square meters of affected area at each
severity level. If different severity levels existing
within an area cannot be distinguished, rate the
entire area at the highest severity present.
Longitudinal Cracking
Low Severity: Crack mean width is hairline up to ¼ in. or a
sealed crack with sealant material in good condition and
with a width that cannot be determined.
Moderate Severity: Any crack with a mean width > ¼ in. and
≤ ¾ in.; or any crack with a mean width ≤ ¾ in. and adjacent
low severity random cracking.
High Severity: Any crack with a mean width > ¾ in. or any
crack with a mean width ≤ ¾ in. and adjacent moderate to
high severity random cracking.
Record separately:
Wheel Path Longitudinal Cracking
Record the length in meters of longitudinal
cracking within the defined wheel paths at each
severity level.
Record the length in meters of longitudinal
cracking with sealant in good condition at each
severity level.
Non-Wheel Path Longitudinal Cracking
Record the length in meters of longitudinal
cracking not located in the defined wheel paths
at each severity level.
Record the length in meters of longitudinal
cracking with sealant in good condition at each
severity level.
Transverse Cracking
Low Severity: Crack mean width is hairline up to ¼ in., or a
sealed crack with sealant material in good condition and
with a width that cannot be determined.
Moderate Severity: Any crack with a mean width > ¼ in. and
≤ ¾ in.; or any crack with a mean width ≤ ¾ in. and adjacent
low severity random cracking.
High Severity: Any crack with a mean width > ¾ in.; or any
crack with a mean width ≤ ¾ in. and adjacent moderate to
high severity random cracking.
Record number and length of transverse cracks
at each severity level.
Also record length in meters of transverse
cracks with sealant in good condition at each
severity level.

Chapter 4. Pavement Performance Evaluation
57
Thus, a direct comparison of MEPDG predicted cracks with ITD measured cracks is not feasible. However,
trends in cracking between the different projects can be compared. In addition, comparison can also be
made with respect to the closeness of the MEPDG predicted cracks to MEPDG threshold values and the
closeness of the CI to the ITD threshold value at the year of interest. This comparison is shown in Table 29.
Data in this table shows that, for most of the investigated projects, the higher the MEPDG predicted
alligator cracking the lower is the CI. Furthermore, most of the investigated projects showed CI values
close to 5 meaning no noticeable cracking. This agrees reasonably well with MEPDG predicted alligator
cracking values for these projects which were in general very low compared to MEPDG recommended
threshold values. On the other hand, the MEPDG predicted longitudinal cracking for the investigated
projects did not agree well with ITD CI of these projects. This is clearly shown in Table 29 by the very high
values of MEPDG predicted longitudinal cracking as well as the not matching trends in the CI and MEPDG
predicted cracking between projects. These results indicate that the MEPDG longitudinal cracking model
needs recalibration for Idaho conditions.
Table 29. Comparison of MEPDG Predicted Cracking and Cracking Index from ITD PPMIS
Design Project US-2(a) US-2(b) US-2(c) SH-3 SH-19 US-95 US-93
Years in Service 6 6 6 10 11 18 2
CI, from ITD’s PPMIS 4.7 5.0 5.0 5.0 5.0 3.0 5.0
MEPDG Alligator Cracking (%)
0.37 0.35 0.36 1.48 2.41 1.08 0.04
MEPDG Longitudinal Cracking (ft/mile)
4.4 104.0 3.7 829.0 808.0 4.0 8.7
MEPDG Thermal Cracking (ft/mile)
0 0 0 0 0 0 0
International Roughness Index
MEPDG predicts the IRI of the pavement over time as a function of the initial pavement IRI, fatigue
cracking, transverse cracking, average rut depth, and site factors. MEPDG predicted rutting and cracking of
the investigated projects indicated that these models need recalibration for Idaho conditions. Once these
models are recalibrated, the IRI model will also need to be recalibrated as it is dependent on the predicted
rutting and cracking.

Study of the Effectiveness of ITD Pavement Design Method
58
Performance at Different Reliability Levels and Longer Pavement Age The performance of the investigated projects using MEPDG software was evaluated at 2 reliability levels of
50 and 85 percent. Longer service life of 40 years was used in this analysis. This was done to investigate
the failure age of these projects. Figure 42 shows the predicted rutting of the investigated projects at
50 percent reliability level. It should be noted that, a local calibration factor of 0.526 was applied to the
MEPDG predicted rutting values shown in this figure. MEPDG predicted alligator cracking and IRI at
50 percent reliability level are shown in Figure 43 and Figure 44, respectively. The data in these figures
show that all investigated projects performed well according to MEPDG failure criteria. None of the
projects failed even after 40-years of service.
Figure 42. MEPDG Predicted Total Rutting at 50 Percent
Reliability Level for 40-Years Service Life
0.0
0.1
0.2
0.3
0.4
0.5
0.6
0 100 200 300 400 500
Tota
l Ru
ttin
g, in
.
Pavement Age, Months
US-2(a)
US-2(b)
US-2(c)
SH-62
SH-3
SH-19
US-95
US-93
Threshold Value

Chapter 4. Pavement Performance Evaluation
59
Figure 43. MEPDG Predicted Alligator Cracking at 50 Percent
Reliability Level for 40-Years Service Life
Figure 44. MEPDG Predicted IRI at 50 Percent
Reliability Level for 40-Years Service Life
0
5
10
15
20
25
0 100 200 300 400 500
Alli
gato
r C
rack
ing,
%
Pavement Age, Months
US-2(a)
US-2(b)
US-2(c)
SH-62
SH-3
SH-19
US-95
US-93
Threshold Value
60
80
100
120
140
160
180
200
220
0 100 200 300 400 500
IRI,
in./
mile
Pavement Age, Months
US-2(a)
US-2(b)
US-2(c)
SH-62
SH-3
SH-19
US-95
US-93
Threshold Value

Study of the Effectiveness of ITD Pavement Design Method
60
MEPDG predicted rutting, alligator cracking and IRI at 85 percent reliability level are shown in Figure 45
through Figure 47, respectively. These figures show that, even at the higher reliability level, most of the
investigated projects performed well beyond their design life (20-years). Few projects failed due to
alligator cracking and rutting but after the 20-years design life. Most of the projects failed due to IRI.
However, the earliest failure was predicted to occur after 31-years.
It should be noted that alligator cracking and IRI predictions are based on the nationally calibrated models.
These results may change after recalibrating these models for Idaho conditions.
Figure 45. MEPDG Predicted Total Rutting at 85 Percent
Reliability Level for 40-Years Service Life
0.0
0.1
0.2
0.3
0.4
0.5
0.6
0 100 200 300 400 500
Tota
l Ru
ttin
g, in
.
Pavement Age, Months
US-2(a)
US-2(b)
US-2(c)
SH-62
SH-3
SH-19
US-95
US-93
Threshold Value

Chapter 4. Pavement Performance Evaluation
61
Figure 46. MEPDG Predicted Alligator Cracking at 85 Percent
Reliability Level for 40-Years Service Life
Figure 47. MEPDG Predicted IRI at 85 Percent
Reliability Level for 40-Years Service Life
0
5
10
15
20
25
30
0 100 200 300 400 500
Alli
gato
r C
rack
ing,
%
Pavement Age, Months
US-2(a)
US-2(b)
US-2(c)
SH-62
SH-3
SH-19
US-95
US-93
Threshold Value
60
80
100
120
140
160
180
200
220
240
260
0 100 200 300 400 500
IRI,
in./
mile
Pavement Age, Months
US-2(a)
US-2(b)
US-2(c)
SH-3
SH-19
US-95
US-93
SH-62
Threshold Value

Study of the Effectiveness of ITD Pavement Design Method
62

Chapter 5. Comparison of ITD and Other States ESAL Calculation Methods
63
Chapter 5 Comparison of ITD and Other States ESAL Calculation Methods
Traffic is one of the primary inputs to any pavement design methodology. ITD’s design method is using TI
as the primary traffic load input. The Traffic Index is a function of ESALs which is widely used to express
traffic loading by many pavement design procedures. ESAL was developed based on the AASHO road test
results.(3) It is a way to convert axle loads of various magnitudes and repetitions to an equivalent number
of repetitions of the standard axle which is 18,000 lb single axle.
This chapter evaluates the current ITD factors to estimate traffic ESALs. It also compares between ESALs
calculated by ITD’s factors and ESALs calculated by factors from states adjacent to Idaho in addition to the
AASHTO factors. Furthermore, this chapter presents the details of the development of new truck factors
for ESAL calculation developed for Idaho based on the analysis of traffic WIM data. Finally, an evaluation
of the current ITD traffic projection method is also presented.
AASHTO 1993 ESAL Calculation
In general, ITD and almost all state DOTs follow the AASHTO 1993 general equation for ESAL calculation
which is shown in Figure 48.
ESAL =
m
1i
i )(LEF)(p (ADT)(T)(365)(D)(F)(G)
where:
ESAL = 18-kip equivalent single axle load
pi = percentage of total repetitions for the ith axle load group
LEF = load equivalency factor for the load group
ADT = base year average daily traffic for each truck class
T = percentage of trucks in the ADT
D = directional distribution factor
F = lane distribution factor
G = growth factor
Figure 48. AASHTO 1993 Formula for ESAL Calculation
The load equivalency factors (LEFs) are based on the axle weights of the axle group and the structural
number (SN) and terminal serviceability of the pavement. The set of equations shown in Figure 49 can be
used to determine the LEF.(35)

Study of the Effectiveness of ITD Pavement Design Method
64
tx
t18
W
WLEF
18
t
x
t
22x
t18
tx
β
G
β
G)4.33log(L)L4.79log(L1)4.79log(18
W
Wlog
1.54.2
p4.2logG t
t
3.23
2
5.19
3.23
2xx
L1SN
)L0.08(L0.40β
where: Wtx = number of applications of given axle Wt18 = number of standard axle passes (18-kip single axle) Lx = load of axle group being evaluated, kip L2 = axle code (1 for single axle, 2 for tandem axle, and 3 for tridem axle)
= value of x when Lx = 18 and L2 = 1 pt = terminal serviceability index (point at which the pavement is considered to be at
the end of its useful life) SN = structural number
Figure 49. AASHTO 1993 Equation to Calculate the Load Equivalency Factor
The sum of all LEFs for each truck is called the truck factor (TF). If the TF is known, the ESAL can be
computed using the formula in Figure 50.
ESAL = (ADT)(T)(365)(D)(F)(G)(TF)
Where: all terms in the above equation are defined in Figure 49.
Figure 50. Equation to Determine ESALs as a Function of Truck Factor
The recommended truck factors for rural and urban roadway systems in the U.S. are shown in Table 30
and Table 31, respectively.
The main difference between state DOTs and AASHTO ESAL calculation is that each state has developed its
own factors (D, F, G, and TF) based on their local conditions.

Chapter 5. Comparison of ITD and Other States ESAL Calculation Methods
65
Table 30. Truck Factors for Different Rural Highways and Vehicles in the U.S.(35)
Vehicle Type Interstate Other
Principal
Minor
Arterial
Major
Collectors
Minor
Collectors Range
Single-Unit Trucks
2-axle, 4-tire 0.003 0.003 0.003 0.017 0.003 0.003-0.017
2-axle, 6-tire 0.21 0.25 0.28 0.41 0.19 0.19-0.41
3-axle or More 0.61 0.86 1.06 1.26 0.45 0.45-1.26
All Single Units 0.06 0.08 0.08 0.12 0.03 0.03-0.12
Tractor Semi-Trailers
4-axle or Less 0.62 0.92 0.62 0.37 0.91 0.37-0.91
5-axle 1.09 1.25 1.05 1.67 1.11 1.05-1.67
6-axle or More 1.23 1.54 1.04 2.21 1.35 1.04-2.21
All Multiple Units 1.04 1.21 0.97 1.52 1.08 0.97-1.52
All Trucks 0.52 0.38 0.21 0.30 0.12 0.12-0.52
Table 31. Truck Factors for Different Urban Highways and Vehicles in the U.S.(35)
Vehicle Type Interstate Other
Freeways
Other
Principal
Minor
Arterial
All
Collectors Range
Single-Unit Trucks
2-axle, 4-tire 0.002 0.015 0.002 0.006 - 0.006-0.015
2-axle, 6-tire 0.17 0.13 0.24 0.23 0.13 0.12-0.24
3-axle or More 0.61 0.74 1.02 0.76 0.72 0.61-1.02
All Single Units 0.05 0.06 0.09 0.04 0.16 0.04-0.16
Tractor Semi-Trailers
4-axle or Less 0.98 0.48 0.71 0.46 0.40 0.40-0.98
5-axle 1.07 1.17 0.97 0.77 0.63 0.63-1.17
6-axle or More 1.05 1.19 0.90 0.64 - 0.64-1.19
All Multiple Units 1.05 0.96 0.91 0.67 0.53 0.53-1.05
All Trucks 0.39 0.23 0.21 0.07 0.24 0.07-0.39
ITD ESAL Calculation
ITD usually designs flexible pavements for 20 years. In order to calculate ESALs, ITD first classifies traffic
into passenger traffic and commercial traffic. Commercial traffic includes all types of trucks (Truck Class 4
to 14). In order to forecast the future 20 years of traffic volume, ITD uses a simple technique. ITD assumes
that past trends in percent increase in traffic volume each year will continue in the future. This applies on
both types of traffic (passenger and commercial) separately.
To estimate the traffic volume in the design lane, ITD assumes a directional distribution of 50/50 or 60/40
and a lane distribution factor based on the number of lanes in each direction as shown in Table 32.

Study of the Effectiveness of ITD Pavement Design Method
66
Table 32. ITD Lane Distribution Factors(2)
Number of Lanes Per Direction
Percent CADT* in Design Lane
1 100
2 70 – 100
3 60 – 80
4 50 - 75
* CADT = Commercial Average Daily Traffic
Once the cumulative commercial traffic in the design lane during the service life of the pavement is
determined, ESALs are then calculated by multiplying the percent Commercial Average Daily Traffic (CADT)
by the TF. ITD’s TF vary by commercial traffic class and the year of interest. According to ITD, commercial
traffic is classified into “Heavy,” “Medium,” and “Light” based on the percentages of two- and five-axle
trucks within the CADT according to Table 33.
Table 33. ITD Commercial Traffic Classification(2)
Classification Percent of Commercial Truck Volume (CADT)
Two-Axle Five-Axle
Heavy 30 - 50 25 - 40
Medium 50 - 70 10 – 25
Light 70 - 100 0 - 10
Notes: If the two-axle classification differs from the five-axle, use the higher classification
for design. Interstate highways are always classified as ‘Heavy”
It should be noted that, this classification was first developed in 1964 and was slightly revised in 1984.(17) It
was developed originally based on relating the 5 kip-EWL to the distribution of the 2-axle and 5-axle
commercial vehicles.(16, 17, 41) Current ITD truck factors for each commercial traffic class and year of interest
(1970 through 2060) are shown graphically in Figure 51. One can see that both passenger cars and light
commercial traffic class truck factors are constant, while the truck factors for all other commercial traffic
classes increase linearly from year to year (TF growth). There is also a shift in the TF starting in 1991, which
may reflect an update in these factors around that time.

Chapter 5. Comparison of ITD and Other States ESAL Calculation Methods
67
Figure 51. ITD Current Truck Factors
Washington State Department of Transportation ESAL Calculation
Washington State Department of Transportation (WSDOT) estimates their design ESALs for specific
pavement section by first forecasting the traffic the pavement will be subjected to over its design life.
Then, they convert the traffic volume to ESALs based on truck factors developed for each truck class.
WSDOT classifies trucks into three categories; single units, double units, and trains.(36) These truck
categories are simplified version of the FHWA truck classes shown in Figure 52.(37) WSDOT truck factors
from their Pavement Management System (PMS) and the equivalent FHWA truck classes are illustrated in
Table 34.(36) This table shows the TF developed based on the initial analysis of 10 WIM site data in
Washington. A comparison between these TF shows that TF based on the WIM analysis are a little lower
than those from WSDOT PMS.
0.0
0.5
1.0
1.5
2.0
2.5
3.0
3.5
1960 1970 1980 1990 2000 2010 2020 2030 2040 2050 2060 2070
Tru
ck F
acto
r
Year
HeavyLight-HeavyMediumLightPassenger Traffic

Study of the Effectiveness of ITD Pavement Design Method
68
Figure 52. FHWA Vehicle Classes Used for Collecting Traffic Data(37)
Table 34. WSDOT Truck Factors from PMS and WIM Analysis(36)
WSDOT Category FHWA Classes TF from PMS TF from WIM Analysis
Single Units 4, 5, 6, 7 0.40 0.37
Double Units 8, 9, 10 1.00 1.02
Trains 11, 12, 13 1.75 1.22
WSDOT also developed truck factors based on data collected between 1960 and 1983. These truck factors
are shown in Table 35. These factors were calculated based on data from limited number of weigh stations
using the AASHTO 1993 equation for LEF (Figure 49 in this report) at a structure number (SN = 5) and a
terminal serviceability (pt = 2.5). It was noted that these truck factors may be biased.(36)

Chapter 5. Comparison of ITD and Other States ESAL Calculation Methods
69
Table 35. Typical WSDOT Truck Factors Based on Measurement(36)
Highway System
Truck Factors
Single
Units
Combination
Units Buses
Individual
Axle
Overall Trucks
(Excludes Buses)
Interstate 0.30 1.20 1.60 0.25 1.10
Non-Interstate
Rural 0.50 1.40 1.60 0.25 1.40
Non-Interstate
Urban 0.25 1.20 1.60 0.25 1.00
WSDOT’s applies ESAL growth rate using the equation in Figure 53.
Total ESAL Growth Rate = (1 + G)(1 + 0.016) - 1.0
where:
G = traffic growth rate (2% minimum)
0.016 = additional growth rate assumed to account for the increase in per-tire load.
Figure 53. WSDOT Equation for ESAL Growth Rate
Utah Department of Transportation ESAL Estimation
Utah Department of Transportation (UDOT) uses the following sampling process to produce the design
factors and growth rates for volume, vehicle classifications and WIM data for ESALs for each vehicle
classification to be used in the UDOT design process.(14) Traffic volume is collected at over 5,000 sites, with
one third (1,667) of the sites collected annually. At 3 sites, volume is collected for a minimum of 48 hours.
From the volume sites, 300 random sites were selected for a traffic classification count. These counts are
performed over a 3-year period, with 100 of the classification counts performed annually. A total of
90 WIM sites were selected out of the 300 classification sites in order to calculate TF for different roadway
functional classes. For sites with no traffic data, manual counts are performed. The AASHTO 1993
equation (Figure 48) is used to calculate ESALs in Utah. The growth factor (G) is calculated using the
equation in Figure 54:
r
rG
n11
where:
r = growth rate
n = design period (years)
Figure 54. Equation to Calculate the Growth Factor

Study of the Effectiveness of ITD Pavement Design Method
70
UDOT’s directional distribution factors are 0.5 for two-way and 1.0 for one-way traffic. UDOT
recommended lane distribution factors are a function of the number of lanes and the Annual Average
Daily Traffic (AADT) as shown in Table 36.
Table 36. UDOT Recommended Lane Distribution Factors(14)
Number of Lanes Lane Distribution Factor
3 or Less 1
4 to 5 2.275 (AADT)-0.1054
6 or More 2.484 (AADT)-0.1312
The truck factors for UDOT are determined based on the functional classification of the roadway as shown in Table 37. UDOT default truck factors for rural and urban highways are shown in Table 38 and Table 39 respectively. An ESAL growth rate on the TF is applied as illustrated in Table 40.
Table 37. UDOT Functional Classification Code(14)
Code Rural Functional Class Code Urban Functional Class
01 Interstate System 11 Interstate System
02 Other Principal Arterials 12 Other Freeways and Expressways
06 Minor Arterial Systems 14 Other Principal Arterials
07 Major Collector 16 Minor Arterial Systems
08 Minor Collector 17 Collector System
09 Local System 19 Local System

Chapter 5. Comparison of ITD and Other States ESAL Calculation Methods
71
Table 38. Truck Factors for the Rural Functional Classes(14)
Axle Class Functional Class
01 02 06 07 08 09
1-2 0.0002 0.0002 0.0002 0.0002 0.0002 0.0002
3 0.03 0.03 0.03 0.03 0.03 0.03
4 0.88 0.88 0.88 0.88 0.88 0.88
5-7 0.4718 0.1996 0.2896 0.2798 0.2798 0.2798
8-10 2.8744 1.7796 1.641 1.0079 1.0079 1.0079
11-13 3.6942 1.3596 1.7199 0.6400 0.6400 0.6400
Table 39. Truck Factors for the Urban Functional Classes(14)
Axle Class
Functional Class
11 12 14 16 17 19
1-2 0.0002 0.0002 0.0002 0.0002 0.0002 0.0002
3 0.03 0.03 0.03 0.03 0.03 0.03
4 0.88 0.88 0.88 0.88 0.88 0.88
5-7 0.3529 0.3529 0.1912 0.3529 0.3529 0.1912
8-10 1.6884 1.6884 1.8133 2.6028 2.6028 2.6028
11-13 2.5203 2.5203 1.9288 3.3584 3.3584 3.3584
Table 40. ESAL Growth Rate(14)
FHWA Truck Class Truck Factor Adjustment
1 to 4 TF
5 to 7 TF+0.1
8 to 13 TF+0.3

Study of the Effectiveness of ITD Pavement Design Method
72
California Department of Transportation ESAL Calculation
Caltrans also follows the AASHTO 1993 equation for ESAL calculation. The main difference is in the TF used
by Caltrans. The default truck factors used by Caltrans for ESAL calculation are shown in Table 41.
Table 41. Caltrans Default Truck Factors(38)
Vehicle Type (By Axle Classification) TF
2-Axle Trucks or Buses 0.189
3-Axle Trucks or Buses 0.504
4-Axle Trucks 0.805
5 or More-Axle Trucks 1.888
Comparison of ITD and Other States ESAL Calculation Methods
Classified 2009 traffic count data from 3 different WIM sites in Idaho was used to calculate ESAL using
ITD’s, UDOT’s, WSDOT’s, Caltrans’, and AASHTO 1993 methods. Passenger cars were not taken into
account when ESALs were calculated because their contribution to ESALs is insignificant.
Table 42 provides the location, and highway functional classification for each WIM site.
Table 42. WIM Locations
WIM
Number Functional Class Route Mile Post Closest City
134 Principal Arterial - Other (Rural) US-30 425.785 Georgetown
137 Principal Arterial - Other (Rural) US-95 37.075 Homedale
192 Principal Arterial - Other (Rural) US-93 16.724 Rogerson
The ADTT per truck class for the 3 investigated WIM sites is given in Table 43. This data shows that FHWA Truck Class 9 is the predominant truck class at each of these WIM sites.

Chapter 5. Comparison of ITD and Other States ESAL Calculation Methods
73
Table 43. Average Daily Truck Traffic by Truck Class
FHWA Truck Class ADTT for WIM Site No.
134 137 192
4 19 22 19
5 184 35 27
6 16 47 11
7 3 1 3
8 48 28 39
9 526 214 410
10 29 36 20
11 2 3 2
12 2 1 2
13 34 26 9
ESALs were calculated based on this data using the prescribed methods assuming a design period of
20 years and with no growth in traffic. When ITD’s method was used for ESAL calculation, the design
period was assumed to start at 2010 and end at 2030. This is important to note as ITD truck factors
increase from year to year i.e., if the design period is from 2015 to 2035, ITD’s method will result in
different ESALs. The directional distribution factor was assumed as 0.5, while the lane distribution factor
was taken as 1.0. Comparison between ESALs calculated using ITD, WSDOT, UDOT, Caltrans, and
AASHTO 1993 using data corresponding to the prescribed WIM sites are shown in Figure 55 through
Figure 57.
Figure 55. Comparison of ITD, WSDOT, UDOT, Caltrans, and AASHTO 1993
Calculated ESALs for Traffic Data Corresponding to WIM Site 134
0
1,000,000
2,000,000
3,000,000
4,000,000
5,000,000
6,000,000
7,000,000
ITD WSDOT UDOT Caltrans AASHTO 1993
Cal
cula
ted
ESA
Ls
ESALs Calculation Method

Study of the Effectiveness of ITD Pavement Design Method
74
Figure 56. Comparison of ITD, WSDOT, UDOT, Caltrans, and AASHTO 1993
Calculated ESALs for Traffic Data Corresponding to WIM Site 137
Figure 57. Comparison of ITD, WSDOT, UDOT, Caltrans, and AASHTO 1993
Calculated ESALs for Traffic Data Corresponding to WIM Site 192
0
500,000
1,000,000
1,500,000
2,000,000
2,500,000
3,000,000
3,500,000
ITD WSDOT UDOT Caltrans AASHTO 1993
Cal
cula
ted
ESA
Ls
ESALs Calculation Method
0
500,000
1,000,000
1,500,000
2,000,000
2,500,000
3,000,000
3,500,000
4,000,000
4,500,000
ITD WSDOT UDOT Caltrans AASHTO 1993
Cal
cula
ted
ESA
Ls
Design Method

Chapter 5. Comparison of ITD and Other States ESAL Calculation Methods
75
These figures clearly show that ITD’s truck factors are more conservative when compared to WSDOT’s,
UDOT’s, Caltrans’, and AASHTO 1993. These figures suggest that current ITD’s TF and truck classification
system needs to be revised.
Development of Truck Factors from MEPDG Axle Load Spectra
Axle Load Spectra (ALS) present the percentage of the total axle applications within each load interval for
each axle type (single, tandem, tridem, and quad) and vehicle class (FHWA vehicle class 4 to 13).(4) ALS can
only be determined from WIM data. As a part of the ITD’s RP 193 Research Project, a total of 14 WIM site
data located on different highways in Idaho were analyzed in order to develop ALS for MEPDG.(8) These
WIM Sites are shown in Table 44.
Table 44. WIM Sites Used for the Development of ITD Axle Load Spectra
WIM Site
Number Functional Classification Route Mile Post Closest City
79 Principal Arterial-Interstate (Rural) I-15 27.7 Downey
93 Principal Arterial-Interstate (Rural) I-86 25.05 Massacre Rocks
96 Principal Arterial-Other (Rural) US-20 319.2 Rigby
117 Principal Arterial-Interstate (Rural) I-84 231.7 Cottrell
129 Principal Arterial-Other (Rural) US-93 59.8 Jerome
134 Principal Arterial-Other (Rural) US-30 425.785 Georgetown
137 Principal Arterial-Other (Rural) US-95 37.075 Homedale
138 Principal Arterial-Other (Rural) US-95 22.72 Marsing
148 Principal Arterial-Other (Rural) US-95 363.89 Potlatch
155 Minor Arterial (Rural) US-30 229.62 Hansen
156 Minor Arterial (Rural) SH-33 21.94 Howe
169 Principal Arterial-Other (Rural) US-95 56.002 Parma
185 Principal Arterial-Other (Rural) US-12 163.01 Powell
192 Principal Arterial-Other (Rural) US-93 16.724 Rogerson
In order to develop site-specific ALS for each WIM site, all truck weight record files for all 12 months of
2009 were uploaded and ran with the TrafLoad software. The software, which was developed as a part of
the NCHRP 1-39 project to process traffic data from WIM data into MEPDG, outputs the load spectrum for
each axle type and vehicle class per month of the analysis year.(39)
Site specific and statewide ALS values were developed for Idaho based on the analysis of the traffic data
from the 14 WIM sites. In addition, these 14 WIM sites were further classified, based on similarity of load
groups, into 3 different truck weight road groups (TWRGs). The TWRGs representing Idaho traffic loading
characteristics are as follows:

Study of the Effectiveness of ITD Pavement Design Method
76
Primarily loaded- in which there is bimodal distribution of the axle weights with a large
percentage of the trucks are heavily loaded.
Moderately Loaded-in which there is a bimodal distribution of the axle weights with
almost similar percentages of the heavy and light axle weights.
Lightly loaded-in which there is a bimodal distribution of the axle weights with a large
percentages of the trucks are empty or partially loaded.
Table 45 illustrates the WIM sites belonging to each of the developed TWRG.
Table 45. WIM Sites Associated with Idaho Truck Weight Road Groups
Idaho Truck Weight Road Groups (TWRGs) WIM Site
Primarily Loaded 79, 117, 134, 148, 155
Moderately Loaded 93, 137, 138, 156, 169, 185
Lightly Loaded 96, 129, 192
The set of equations in Figure 49 along with the average number of axles per truck type and axle group
developed from the ITD’s WIM data shown in Table 46 were used to develop the TF for each of the 3 WIM
data. They were also used to compute the TF for the statewide and primary, moderately, and lightly
loaded TWRGs. A structure number (SN = 5) and terminal serviceability index (pt = 2.5) were used in the
development of the TF. It should be noted that the AASHTO 1993 equation for ESAL calculation did not
include a code for Quad axles. Because this study has quad axles, a code of four was assumed for this axle
type. This assumption may not significantly affect the final results because there were very few quad axles
in comparison to the other axle types.
Table 46. Average Number of Axles per Truck and Axle Group Based on ITD’s WIM Data
Truck Class Single Axle Tandem Axle Tridem Axle Quad Axle
4 1.59 0.34 0.00 0.00
5 2.00 0.00 0.00 0.00
6 1.00 1.00 0.00 0.00
7 1.00 0.22 0.83 0.10
8 2.52 0.60 0.00 0.00
9 1.25 1.87 0.00 0.00
10 1.03 0.85 0.95 0.26
11 4.21 0.29 0.01 0.00
12 3.24 1.16 0.07 0.01
13 3.32 1.79 0.14 0.02

Chapter 5. Comparison of ITD and Other States ESAL Calculation Methods
77
The developed TF for the 3 ITD TWRGs and the developed statewide TF are shown in Table 47. Figure 59
to Figure 61 compares the ESAL calculations based on the current ITD factors, TF from actual WIM site
ALS, statewide ALS and the TWRG ALS for WIM sites 134, 137, and 192, respectively. The error in the ESAL
calculation normalized based on the ESALs calculated from truck factors corresponding to the actual load
spectra of the site was calculated for the current and the statewide and TWRG truck factors. This is shown
in Figure 58.
where:
NE = absolute value of the normalized error, percent
Xa = ESALs calculated based on the TF from actual ALS of the site
Xs = ESALs calculated based on the TF from statewide or TWRG ALS
Figure 58. Equation to Calculate the Normalized Error
The normalized error plots for the 3 WIM sites are shown in Figure 62 to Figure 64. These figures show
that the current ITD’s ESAL calculation method produces high errors (66 percent to 74 percent) on the
conservative side for the moderately and lightly loaded sites. The minimum normalized error for the
primarily loaded site was 9.7 percent. The statewide developed ALS produced normalized error in the
range of 20 percent to 39 percent compared to the ESALs calculated based on the actual ALS for a specific
site. The minimum normalized error found when using the TF corresponding to the specific TWRG was
1 percent to less than 9 percent.
Table 47. Developed Truck Factors Based on WIM Data Analysis for ITD
FHWA Vehicle Class Truck Weight Road Group (TWRG)
Statewide Lightly Loaded Moderately Loaded Primarily Loaded
4 0.644 0.677 1.611 1.016
5 0.182 0.491 0.995 0.620
6 0.436 0.723 1.360 0.903
7 0.654 0.890 1.735 1.052
8 0.404 0.532 1.415 0.852
9 1.209 1.454 2.217 1.704
10 0.809 1.076 2.962 1.726
11 0.615 1.389 3.678 2.043
12 1.148 0.818 2.523 1.508
13 2.150 1.520 2.901 2.119

Study of the Effectiveness of ITD Pavement Design Method
78
Figure 59. Comparison of ESALs Based on Current ITD, Actual, Statewide,
and Primarily Loaded TWRG Truck Factors from WIM Site 134
Figure 60. Comparison of ESALs Based on Current ITD, Actual, Statewide,
and Moderately Loaded TWRG Truck Factors from WIM Site 137
0
1,000,000
2,000,000
3,000,000
4,000,000
5,000,000
6,000,000
7,000,000
Current ITD Actual WIM Data Primarily LoadedTWRG
Statewide WIMData
Cal
cula
ted
ESA
Ls
ESALs Calculation Method
0
500,000
1,000,000
1,500,000
2,000,000
2,500,000
3,000,000
3,500,000
Current ITD Actual WIM Data ModeratelyLoaded TWRG
Statewide WIMData
Ca
lcu
late
d E
SALs
ESALs Calculation Method

Chapter 5. Comparison of ITD and Other States ESAL Calculation Methods
79
Figure 61. Comparison of ESALs Based on Current ITD, Actual, Statewide,
and Lightly Loaded TWRG Truck Factors from WIM Site 192
Figure 62. ESALs Normalized Error for WIM Site 134
0
500,000
1,000,000
1,500,000
2,000,000
2,500,000
3,000,000
3,500,000
4,000,000
4,500,000
Current ITD Actual WIM Data Lightly LoadedTWRG
Statewide WIMData
Cal
cula
ted
ESA
Ls
ESALs Calculation Method
-25
-20
-15
-10
-5
0
5
10
15
Current ITD Statewide WIM Data Primarily Loaded TWRG
No
rmal
ized
Err
or,
%
ESALs Calculation Method

Study of the Effectiveness of ITD Pavement Design Method
80
Figure 63. ESALs Normalized Error for WIM Site 137
Figure 64. ESALs Normalized Error for WIM Site 192
-10
0
10
20
30
40
50
60
70
80
Current ITD Statewide WIM Data Moderately Loaded TWRG
No
rmal
ized
Err
or,
%
ESALs Calculation Method
-10
0
10
20
30
40
50
60
70
80
Current ITD Statewide WIM Data Lightly Loaded TWRG
No
rma
lize
d E
rro
r, %
ESALs Calculation Method

Chapter 5. Comparison of ITD and Other States ESAL Calculation Methods
81
Development of Truck Factors for a Simplified Truck Classification
In order to facilitate the implementation of the developed TF for ITD, a simplified truck traffic classification
similar to the one used by WSDOT is suggested. This simplified classification divides trucks into three
classes; single units, double units, and trains. The FHWA truck classes that fall into the 3 simple classes are
shown in Table 48. Based on this simplified truck traffic classification, TF were established using the
weighted average of the truck factor for each FHWA class. These developed TF for the simplified
classification are also summarized in Table 48.
Table 48. Developed ITD Truck Factors Based on WIM Data Analysis for Simplified Truck Classification
FHWA Vehicle
Class
Simplified
Truck Class Light Medium Heavy Statewide
4
Single Units 0.269 0.559 1.230 0.743 5
6
7
8
Double Units 1.041 1.302 2.270 1.623 9
10
11
Trains 1.991 1.494 2.948 2.063 12
13
Current ITD Traffic Projection Method
In pavement design, forecasted values of AADT directly affect the estimation of design ESALs. A direct
result of this is either under or over design of pavement. An under-designed project may lead to a
premature failure of the pavement. An over-designed project may lead to a waste in funds that could be
used on different projects.
Flexible pavement design life in Idaho is always 20 years, and traffic volume is projected 20 years in the
future. Forecast traffic 20 years in the future, ITD assumes that past trends will continue in the future as a
percent increase. A graphic explanation of ITD’s current traffic projection method is shown in Figure 65.

Study of the Effectiveness of ITD Pavement Design Method
82
Figure 65. Example Showing Current ITD Traffic Projection Method
Idaho Traffic Volume Data
Traffic volume data is one of the primary components of the traffic data. ITD collects traffic volume data in
terms of AADT and CAADT. Traffic counts are performed in Idaho using different methods such as
Automatic Traffic Recorders (ATR) and WIM. The data used to investigate the accuracy of the current ITD
traffic projection method were from ATRs and WIM stations. In Idaho, there are approximately 173 ATR
sites and 25 WIM sites.
Accuracy of the Current ITD Traffic Projection Method
In order to investigate the accuracy of the current ITD traffic volume projection method, traffic volume
data expressed in AADT from about 92 different ATRs and WIM stations located statewide were gathered.
The source of the data is ITD’s Planning Website.(40) The data covers from 1990 through 2009. Only 92 ATR
and WIM sites were used in this analysis. Many of the ATR/WIM sites had data missing and could not be
used for analysis. The ATR site AADT database used in this analysis is compiled in Appendix E.
The AADT used in this analysis contained data for the years between 1990 and 2009. The trends in the
traffic between the years 1990 and 1995 were used to forecast the AADT for the year 2009. In general,
5 years of known traffic volume were used to project the traffic 14 years in the future. Some ATR sites did
not have the traffic volume recorded in 2009; in such a case, traffic volume from 2008 was used in the
analysis.
A comparison was made between the projected traffic and the actual recorded (observed) traffic from
2009. This comparison is depicted in Figure 66. This figure shows that current ITD traffic projection
0
5000
10000
15000
20000
25000
1985 1990 1995 2000 2005 2010 2015 2020 2025
AA
DT
Year
Past Traffic
Projected Traffic

Chapter 5. Comparison of ITD and Other States ESAL Calculation Methods
83
method significantly overestimates future traffic. The average absolute error between actual and
projected traffic was found to be 42.11 percent. If traffic projections are for 20 years in the future, this
error is expected to be higher. This analysis shows that the current ITD projection method produces highly
significant errors in the projected traffic volume. There are several traffic forecasting methods that ITD
may investigate. These methods include: time series forecasting, regression, clustering, and neural
networks. More details regarding these methods and other models developed for Idaho can be found in
studies done by Dixon and Kyte.(42, 43)
Figure 66. Observed Versus Projected AADT Based on Current ITD Traffic Projection Method
y = 1.3011x - 314.99R² = 0.7482
0
10000
20000
30000
40000
50000
60000
70000
80000
90000
0 10000 20000 30000 40000 50000 60000 70000 80000 90000
Pro
ject
ed
AA
DT
Observed AADT
Projected Versus Observed
Line of Equlity
Trend Line

Study of the Effectiveness of ITD Pavement Design Method
84

Chapter 6. Analysis of ITD Climatic Factors
85
Chapter 6
Analysis of ITD Climatic Factors
Pavement performance is significantly affected by environmental conditions. The two environmental
characteristics that greatly affect the pavement performance are temperature and moisture. Both AASHO
and the Western Association of State Highway Officials (WASHO) road tests showed great seasonal
variations in the deflection measurements under wheel loads. During hot summer months, asphalt layer(s)
modulus can reach 100,000 psi, while during cold weather it can reach up to 2 to 3 million psi.(4) This has a
direct effect on the state of stress within the asphalt layer(s) and all layers beneath them. Unbound
base/subbase layers and subgrade soil resilient modulus values are affected by the moisture variation. In
freezing temperatures, water in the soil freezes and its resilient modulus could reach values 20 to 120
times higher than the value of the modulus before freezing.(4) In addition, during the thawing process, a
huge reduction in the pavement strength occurs.
This chapter presents how environmental conditions are addressed in ITD’s design method and compares
it with AASHTO 1993 and MEPDG methods.
ITD Climatic and Environmental Factors
Thirty years of Idaho’s monthly data concerning temperature, precipitation, and freeze periods were used
to create different climactic regions (zones) in Idaho.(41) An evaluation of the spring breakup periods by
Idaho District Maintenance Engineers was also used in creating these climatic zones. Each of these zones
was assigned a regional (climatic) factor. These climatic factors represent the percentage increase (from 0
to 15 percent) in the total required pavement structure thickness. The factors were selected based on the
severity of the climatic or environmental conditions in each zone to provide additional protection during
winter and spring conditions. These climatic factors were developed using the recommendations from
AASHO Committee on Design.(41) The Idaho climatic zones map is divided into 4 zones (1 to 4) with each
zone assigned a regional factor (1 to 1.15). The map is shown in Figure 67.
AASHTO 1993 Climatic and Environmental Factors
AASHTO’s 1993 guide handles the environmental effects through the influence of the seasonal
temperature and moisture variation on material properties.(3) It incorporates the effective roadbed soil
resilient modulus to account for the influence of seasonal variation in moisture on the modulus of the
subgrade using relative damage approach. It also incorporates drainage coefficients for the unbound base
and subbase granular layers to account for the subsurface water drainage.

Study of the Effectiveness of ITD Pavement Design Method
86
Figure 67. Current Idaho Climatic Zones Along with Climatic Factors(2)

Chapter 6. Analysis of ITD Climatic Factors
87
MEPDG Climatic and Environmental Factors
MEPDG utilizes an advanced climatic modeling tool called the Enhanced Integrated Climatic Model (EICM).
EICM is a one-dimensional coupled heat and moisture flow program.(4) It consists of 3 major components:
Climatic-Materials-Structural Model (CMS Model).
CRREL Frost Heave and Thaw Settlement Model (CRREL Model).
Infiltration and Drainage Model (ID Model).
EICM predicts the hourly temperature and moisture variations within each pavement layer and foundation
over the entire design life of the pavement. It also estimates resilient modulus adjustment factors, pore
water pressure, water content, frost and thaw depth, frost heave, and drainage performance. Hourly
weather-related data required by EICM to perform analysis are: air temperature, precipitation, wind
speed, percentage sunshine, and relative humidity. This data is available from 851 weather stations across
the U.S. for locations where weather station is not available, a virtual weather station is created to provide
the climatic data needed by MEPDG.
The water table depth is another important climatic input required by MEPDG. This input is important for
the overall accuracy of the foundation/pavement moisture contents.
MEPDG Climatic and Environmental Factors for Idaho
In Idaho, a total of 12 weather station sites are included in the MEPDG national database. Weather
stations in bordering states may also be used. The location information and the number of months of
available data and missing data for the stations in Idaho are summarized in Table 49.
A summary of the mean annual air temperature and rainfall, average annual number of freeze-thaw
cycles, average wind speed, and percent average sunshine for MEPDG climatic locations in Idaho is shown
in Table 50.

Study of the Effectiveness of ITD Pavement Design Method
88
Table 49. Summary of Idaho Weather Stations Currently Available in MEPDG Software Version 1.1(4)
Weather Station
Station Location Latitude
(Degree.Minutes) Longitude
(Degree.Minutes) Elevation
(ft)
Months of Available
Data
Boise Boise Air Terminal/ Gowen Field Airport
43.34 -116.13 2861 116
Burley Burley Municipal
Airport 42.32 -113.46 4151 64
Challis Challis Airport 41.31* -114.13 5042 90
Idaho Falls Idaho Falls Regional
Airport 43.31 -112.04 4768 97
Jerome Jerome County Airport 42.44 -114.28 4012 109
Lewiston Lewiston-Nez Perce
County Airport 46.22 -117.01 1447 116
McCall McCall Municipal
Airport 44.53 -116.06 5032 101
Mullan Pass VOR
Mullan Pass 47.28 -115.38 6074 116
Pocatello Pocatello Regional
Airport 42.55 -112.34 4454 116
Rexburg Rexburg-Madison
County Airport 43.5 -111.53 4875 97
Twin Falls Joslin Field-
Magic Valley Regional Airport
42.29 -114.29 4148 105
Pullman /Moscow
Pullman/Moscow Regional Airport
46.44 -117.07 2540 93
* The latitude for Challis Airport should be 44.3 according to Google Earth and www.airnav.com.
This should be corrected in MEPDG

Chapter 6. Analysis of ITD Climatic Factors
89
Table 50. Summary of the Climatic Data for the MEPDG Weather Stations Located in Idaho
Location Mean Annual
Air Temperature (ºF)
Mean Annual Rainfall
(in.)
Air-Freezing
Index (ºF-days)
Average Annual
Number of Freeze/Thaw
Cycles
Average Wind Speed (mph)
Average Sunshine
(%)
Boise 53.26 11.20 229.86 75 6.6 72.27
Burley 48.09 9.38 592.93 98 7.3 71.72
Challis 44.08 6.70 1400.51 119 3.7 67.69
Idaho Falls 44.93 8.57 1132.89 109 7.6 62.35
Pullman/Moscow 48.01 12.40 272.8 75 6.7 60.47
Lewiston 53.46 13.97 121.38 47 4.8 62.61
McCall 39.68 24.64 1471.71 140 3.5 57.43
Mullan Pass 37.62 37.67 1419.06 59 5.3 45.04
Pocatello 47.74 10.89 730.58 108 8.3 64.99
Investigating the Accuracy of the ITD Climatic Zones and Factors
To investigate the accuracy of the current ITD climatic zones, six different MEPDG weather station data
were selected and MEPDG was run for a typical pavement section. The US-93 section data presented in
Chapter 4 was used for this analysis. All inputs were kept constant except the weather station. Depth to
groundwater table was also held constant in all MEPDG simulation runs. It is important to note that, the
6 weather stations were selected such that 2 are located in each of 3 ITD climatic zones. This is shown in
Table 51. The Logan-Cache airport weather station is located in Utah but is very close to the southern
border of Idaho.
Table 51. Selected MEPDG Weather Stations and Corresponding ITD Climatic Zone
Weather Station Station Location ITD Climatic Zone
Pocatello Pocatello Regional Airport 2
Idaho Falls Idaho Falls Regional Airport 2
Logan, Utah Logan-Cache Airport 3
Pullman/Moscow Pullman/Moscow Regional Airport 3
McCall McCall Municipal Airport 4
Mullan Pass Mullan Pass 4

Study of the Effectiveness of ITD Pavement Design Method
90
Figure 68 through Figure 74 present a comparison of MEPDG predicted distresses and smoothness for the
4 MEPDG computer simulations runs using the 2 different weather stations located in ITD Climatic Zone 3.
Figure 75 through Figure 81 present a comparison of MEPDG predicted distresses and smoothness for the
conducted MEPDG runs using the 4 different weather stations located in Climatic Zones 2 and 4. Figure 68
to Figure 70 show that although Logan and Pullman/Moscow weather stations are located within the
same ITD Climatic Zone 3, there is a significant difference in the predicted longitudinal cracking and total
rutting. Furthermore, Figure 75 and Figure 78 show that although McCall and Mullan Pass weather
stations are located in ITD Climatic Zone 4, there is a significant difference in the predicted longitudinal
cracking and AC rutting. Idaho Falls and Pocatello weather stations which are located in ITD Climatic Zone
2 yielded fairly similar distresses and smoothness. This analysis shows that the current climatic zones
developed for Idaho are not consistent and need revisions. Redefining these climatic zones is important
for accurate design. In addition, as previously explained, the current ITD climatic factors are empirical
factors developed to provide additional protection during winter and spring conditions. MEPDG takes into
account the influence of hourly change in moisture and temperature on the fundamental materials
properties.
Figure 68. MEPDG Predicted Longitudinal Cracking for the
Investigated Climatic Locations in ITD Zone 3
0
50
100
150
200
250
300
350
0 50 100 150 200 250
Lon
gitu
din
al C
rack
ing,
ft/
mile
Pavement Age, Months
Pullman-Moscow (Zone 3)
Logan (Zone 3)

Chapter 6. Analysis of ITD Climatic Factors
91
Figure 69. MEPDG Predicted Alligator Cracking for the
Investigated Climatic Locations in ITD Zone 3
Figure 70. MEPDG Predicted Total Rutting for the
Investigated Climatic Locations in ITD Zone 3
0
0.1
0.2
0.3
0.4
0.5
0.6
0.7
0.8
0 50 100 150 200 250
Alli
gato
r C
rack
ing,
%
Pavement Age, Months
Pullman-Moscow (Zone 3)
Logan (Zone 3)
0.00
0.10
0.20
0.30
0.40
0.50
0.60
0 50 100 150 200 250
Tota
l Ru
ttin
g, in
.
Pavement Age, Months
Pullman-Moscow (Zone 3)
Logan (Zone 3)

Study of the Effectiveness of ITD Pavement Design Method
92
Figure 71. MEPDG Predicted AC Rutting for the
Investigated Climatic Locations in ITD Zone 3
Figure 72. MEPDG Predicted Unbound Granular Layers Rutting
For the Investigated Climatic Locations in ITD Zone 3
0.00
0.05
0.10
0.15
0.20
0.25
0.30
0.35
0 50 100 150 200 250
AC
Ru
ttin
g, in
.
Pavement Age, Months
Pullman-Moscow (Zone 3)
Logan (Zone 3)
0.00
0.02
0.04
0.06
0.08
0.10
0.12
0.14
0 50 100 150 200 250
Un
bo
un
d B
ase
/Su
bb
ase
Ru
ttin
g, in
.
Pavement Age, Months
Pullman-Moscow (Zone 3)
Logan (Zone 3)

Chapter 6. Analysis of ITD Climatic Factors
93
Figure 73. MEPDG Predicted Subgrade Rutting for the
Investigated Climatic Locations in ITD Zone 3
Figure 74. MEPDG Predicted IRI for the Investigated
Climatic Locations in ITD Zone 3
0.00
0.02
0.04
0.06
0.08
0.10
0.12
0 50 100 150 200 250
Sub
grad
e R
utt
ing,
in.
Pavement Age, Months
Pullman-Moscow (Zone 3)
Logan (Zone 3)
60
70
80
90
100
110
120
0 50 100 150 200 250
IRI,
in./
mile
Pavement Age, Months
Pullman-Moscow (Zone 3)
Logan (Zone 3)

Study of the Effectiveness of ITD Pavement Design Method
94
Figure 75. MEPDG Prediceted Longitudinal Cracking for the
Investigated Climatic Locations in Zones 2 and 4
Figure 76. MEPDG Predicted Alligator Cracking for the
Investigated Climatic Locations in Zones 2 and 4
0
100
200
300
400
500
600
700
0 50 100 150 200 250
Lon
gitu
din
al C
rack
ing,
ft/
mile
Pavement Age, Months
McCall (Zone 4)
Mullan Pass (Zone 4)
Idaho Falls (Zone 2)
Pocatello (Zone 2)
0
0.1
0.2
0.3
0.4
0.5
0.6
0.7
0.8
0 50 100 150 200 250
Alli
gato
r C
rack
ing,
%
Pavement Age, Months
McCall (Zone 4)
Mullan Pass (Zone 4)
Idaho Falls (Zone 2)
Pocatello (Zone 2)

Chapter 6. Analysis of ITD Climatic Factors
95
Figure 77. MEPDG Predicted Total Rutting for the
Investigated Climatic Locations in Zones 2 and 4
Figure 78. MEPDG Predicted AC Rutting for the Investigated
Climatic Locations in ITD Zones 2 and 4
0.00
0.05
0.10
0.15
0.20
0.25
0.30
0.35
0.40
0.45
0 50 100 150 200 250
Tota
l Ru
ttin
g, in
.
Pavement Age, Months
McCall (Zone 4)
Mullan Pass (Zone 4)
Idaho Falls (Zone 2)
Pocatello (Zone 2)
0.00
0.05
0.10
0.15
0.20
0.25
0 50 100 150 200 250
AC
Ru
ttin
g, in
.
Pavement Age, Months
McCall (Zone 4)
Mullan Pass (Zone 4)
Idaho Falls (Zone 2)
Pocatello (Zone 2)

Study of the Effectiveness of ITD Pavement Design Method
96
Figure 79. MEPDG Predicted Unbound Granular Layers Rutting for the
Investigated Climatic Locations in ITD Zones 2 and 4
Figure 80. MEPDG Predicted Subgrade Rutting for the
Investigated Climatic Locations in ITD Zones 2 and 4
0.00
0.02
0.04
0.06
0.08
0.10
0.12
0.14
0 50 100 150 200 250
Un
bo
un
d B
ase
/Su
bb
ase
Ru
ttin
g, in
.
Pavement Age, Months
McCall (Zone 4)
Mullan Pass (Zone 4)
Idaho Falls (Zone 2)
Pocatello (Zone 2)
0.00
0.02
0.04
0.06
0.08
0.10
0.12
0.14
0 50 100 150 200 250
Sub
grad
e R
utt
ing,
in.
Pavement Age, Months
McCall (Zone 4)
Mullan Pass (Zone 4)
Idaho Falls (Zone 2)
Pocatello (Zone 2)

Chapter 6. Analysis of ITD Climatic Factors
97
Figure 81. MEPDG Predicted IRI for the Investigated
Climatic Locations in ITD Zones 2 and 4
60
70
80
90
100
110
120
0 50 100 150 200 250
IRI,
in./
mile
Pavement Age, Months
McCall (Zone 4)
Mullan Pass (Zone 4)
Idaho Falls (Zone 2)
Pocatello (Zone 2)

Study of the Effectiveness of ITD Pavement Design Method
98
Chapter 7. Summary, Conclusions, and Recommendations
99
Chapter 7
Summary, Conclusions, and Recommendations
Summary
In this study, researchers evaluated ITD’s pavement design and compared it to the American Association
of State Highway and Transportation Officials (AASHTO) 1993 design guide and to Mechanistic-Empirical
Pavement Design Guide (MEPDG). This study also included a review of Equivalent Single Axle Loads (ESAL)
calculation methods and an evaluation of ITD climatic factors. To conduct the analysis, eight in-service
pavement sections located in different regions of Idaho were selected. All sections were redesigned using
ITD, AASHTO 1993, and MEPDG procedures. The designs by AASHTO 1993 and MEPDG were conducted at
50 and 85 percent reliability levels. The nationally calibrated MEPDG (Version 1.1) was used to predict the
performance of the three design methods. Input data required by the three design methods were
collected from several sources. Level 2 Hot Mix Asphalt (HMA) and subgrade material characterization
inputs were used in MEPDG analysis. All other MEPDG inputs were Level 3. Performance indicators
predicted using MEPDG related to the 3 design methods were compared to each other. MEPDG
performance predictions were also compared to measured field performance. ITD ESAL calculation and
traffic volume projection methods were studied and compared to other states. New truck factors were
developed for ITD based on the analysis of Idaho’s Weigh-In-Motion (WIM) data. ITD climatic factors were
also analyzed and compared with MEPDG.
Conclusions
Based on the results and analyses presented in this research, the following observations and conclusions
are made:
Evaluation of ITD Design Method for Flexible Pavement
In general, both ITD and AASHTO 1993 flexible pavement design methods yielded pavement
structures that conform to MEPDG recommended design criteria.
The unbound granular layer thicknesses resulting from ITD’s design method were much greater
(2 to 4.5 times as thick) than those recommended using AASHTO 1993 and MEPDG design
methods.
ITD’s design method is more sensitive to the subgrade strength compared to AASHTO 1993 and
MEPDG methods.
The 3 design methods yielded reasonably similar asphalt layer thicknesses at 50 percent reliability.
However, at higher reliability levels, MEPDG yielded greater asphalt concrete (AC) thickness
compared to the other two methods, especially in cases of very weak subgrade strength.

Study of the Effectiveness of ITD Pavement Design Method
100
At 50 percent reliability, a reasonable agreement was found between the AASHTO 1993 and
MEPDG design methods regarding the resulting pavement structure.
No thermal cracking was predicted for any of the studied pavement sections using MEPDG.
The resulting structural design for each of the investigated pavement sections, using MEPDG with
national calibration factors, was found to be governed by the predicted total pavement rutting.
Predicted alligator fatigue cracking, thermal cracking, and IRI were much lower than MEPDG
recommended threshold values for the investigated sections.
At the 85 percent reliability level, MEPDG designs generally yielded the least amount of cracking
for sections with thicker AC. This indicates that AC layer thickness has more significant influence
on the alligator cracking than does unbound layer thickness.
ITD ESAL Calculation Method
ITD’s Truck Factors (TF) used in ESAL calculations are conservative when compared to other state
DOTs and AASHTO factors.
Current ITD TF are highly conservative compared to the regional and statewide factors developed
based on the analysis of WIM site data from various Idaho locations.
Current ITD truck classification is based on equivalent wheel load (EWL) and does not accurately
represent the current truck traffic.
Current ITD traffic volume projection method yields highly conservative traffic volumes.
ITD Pavement Performance Management Information System
ITD’s current method of pavement evaluation combines thermal cracking, bottom-up alligator
fatigue cracking, and top-down longitudinal cracking into one Cracking Index. In addition, ITD’s
crack ratings are measured and reported differently compared to MEPDG cracking measurement
requirements. MEPDG calibration requires a separate value for each one of these distresses.
Longitudinal and thermal cracking in MEPDG are predicted in units of ft/mile. Alligator fatigue
cracking is computed as the area of cracking (ft2/500 ft/lane width) and expressed as a
percentage.
For rutting evaluation, ITD measures the total rutting at the AC surface. Total rutting includes,
HMA and rutting in the unbound and subgrade layers. MEPDG predicts the rutting within each
layer separately.

Chapter 7. Summary, Conclusions, and Recommendations
101
MEPDG Predicted Performance for Idaho Conditions
Comparison between total rutting predicted using the nationally calibrated MEPDG and actual
measured field rutting for the investigated projects revealed that MEPDG’s nationally calibrated
rutting models are significantly over predicting total rutting. This is mostly true with predicted
subgrade rutting.
MEPDG traffic characterization through axle load spectra (ALS) yielded significantly higher cracking
and rutting compared to traffic characterization in terms of ESALs.
MEPDG predicted alligator cracking was found very low compared to the threshold values. These
results agree with the reported crack index (CI) for the investigated pavement sections.
The trends in MEPDG predicted alligator cracking were found to agree with the trends in the
reported CI for the investigated pavement sections.
MEPDG distress prediction and smoothness models need to be locally calibrated for Idaho
conditions.
ITD Climatic Zones and Factors
Analysis of pavement sections in the same climatic zones did not reveal similar performance in
some zones while it revealed similar performance in others. The analysis indicates that Idaho’s
current climatic zones are not consistent and need to be revised. Current ITD climatic factors are
empirical factors developed to provide additional protection during winter and spring conditions.
MEPDG takes into account the influence of the hourly change in moisture and temperature on the
fundamental materials properties.
Recommendations
Based on the findings of this research the following are recommended:
It is recommended that ITD proceed with the implementation and calibration of the MEPDG for
Idaho to replace the ITD’s current design method as soon as practical.
To ensure consistency with MEPDG distress prediction, it is recommended that ITD perform
pavement condition surveys and update their Pavement Performance Management Information
System (PPMIS) in accordance with LTPP method of data collection.
It is recommended to replace the current ITD truck classification system with the FHWA truck
classification system or a simplified system derived from it.
It is recommended to replace Idaho’s current TF with the newly developed truck factors based on
the analysis of Idaho WIM site data.

Study of the Effectiveness of ITD Pavement Design Method
102
It is recommended that ITD’s current method for projecting future traffic volume needs to be
changed as it consistently over predicts traffic volume. There are several traffic forecasting
methods that ITD may investigate. These methods include: time series forecasting, regression,
clustering, and neural networks.

References
103
References
1. Highway Research Board. The AASHO Road Test Report 5: Pavement Research, Washington, D.C.:
Highway Research Board, 1962.
2. Idaho Transportation Department. Materials Manual, Section 500.00-Pavement Design. Boise, ID:
Idaho Transportation Department, July 2009.
3. American Association of State Highways and Transportation Officials. AASHTO Guide for Design
of Pavement Structures, Washington, D.C: American Association of State Highways and
Transportation Officials, 1993.
4. ARA, Inc., ERES Consultants Division. Guide for Mechanistic-Empirical Design of New and
Rehabilitated Pavement Structures. Prepared for National Cooperative Highway Research
Program, NCHRP 1-37A Final Report,” Washington, D.C.: March 2004.
5. Crawford, G. “National Update of MEPDG Activities,” 88th Annual TRB Meeting, Washington, D.C.:
Transportation Research Board, 2009.
6. Wagner, C. “AASHTO MEPDG - What’s in it for You?,” PowerPoint Presentation at North Central
Asphalt User/Producer Group, Springfield, Illinois, (January 2007).
http://cobweb.ecn.purdue.edu/~spave/NCAUPG/Activities/2008/presentations/, Accessed March
2010.
7. Federal Highway Administration, Office of Pavement Technology. Design Guide Implementation
Survey. Washington, D. C.: Federal Highway Administration, Office of Pavement Technology.
2004. www.fhwa.dot.gov/pavement/dgit/dgitsurv.htm, Accessed March 2010.
8. Bayomy, F., S. El-Badawy, and A. Awed. Implementation of the MEPDG for Flexible Pavements in
Idaho. Moscow, ID: National Institute for Advanced Transportation Technology, University of
Idaho, Quarterly Progress Report-QR3, submitted to the Idaho Transportation Department, ITD
RP 193, (October 2010).
9. Arizona Department of Transportation. Materials Preliminary Engineering and Design Manual.
Arizona Department of Transportation, Highways Division, Materials Section, 3rd Edition, Phoenix,
Arizona, 1989.
10. Colorado Department of Transportation. 2012 Pavement Design Manual,
http://www.coloradodot.info/business/designsupport/bulletins_manuals/Complete%202012%20
Pavement%20Design%20Manual%20Tables%20_6-25-2009_.pdf, Accessed November 2011.
11. Mokwa, R., and M. Akin. Easement and Evaluation of Subgrade Parameters: Phase I – Synthesis
of Literature. Helena, Montana: Montana Department of Transportation, Research Report
FHWA/MT-09-006/8199, (September 2009).
12. Tarefder, R., N. Saha, and J. Stormont. Evaluation of Subgrade Strength and Pavement Designs for
Reliability. Journal of Transportation Engineering, Vol. 136, No. 4, (2010): 379-391.

Study of the Effectiveness of ITD Pavement Design Method
104
13. Oregon Department of Transportation. ODOT Pavement Design Guide, Pavement Services Unit,
Salem, OR: Oregon Department of Transportation: (August 2011),
ftp://ftp.odot.state.or.us/Portland_Harbor/104(e)Letter/Materials/Asphalt/odot_pavement_desig
n_guide_2007.pdf, Accessed November 2011.
14. Utah Department of Transportation. Pavement Management and Pavement Management Design
Manual. Salt Lake City, UT: Utah Department of Transportation, (March 2008).
15. Li, J., J. Uhlmeyer, J. Mahoney, and S. Muench. Use of the 1993 AASHTO Guide, MEPDG and
Historical Performance to Update the WSDOT Pavement Design Catalog, Tumwater, Washington:
Washington State Department of Transportation, Research report WA-RD 779.1, (September
2011).
16. Juola, R. C., and R. Kilchoer. Load Distribution Factors for Idaho Highways – The Role of Load
Analysis in Pavement Design. Boise, ID: Idaho Transportation Department, Division of Highways,
Internal Report, 1984.
17. Pavement Management Systems Limited. The Feasibility of Updating the Idaho Department of
Transportation’s Pavement Design Procedure. Cambridge, ON: Pavement Management Systems
Limited, 1986.
18. Carvalho, R., and C. Schwartz. “Comparison of Flexible Pavement Designs: AASHTO Empirical
Versus NCHRP Project 1-37A Mechanistic-Empirical.” Transportation Research Record, Journal of
the Transportation Research Board, No. 1947 (2006): 167-174.
19. American Association of State Highways and Transportation Officials. Mechanistic-Empirical
Pavement Design Guide,” A Manual of Practice, Interim Edition. Washington, D.C.: American
Association of State Highways and Transportation Officials, July 2008.
20. Idaho Transportation Department. Idaho Transportation Department, Transportation Planning &
Programming, TPP,
http://itd.idaho.gov/planning/GIS/MapBook/2010MapBook/Section1Maps/Functional_Class2015.
pdf, Accessed June 2011.
21. Idaho Transportation Department. Idaho Transportation System 2009 Performance Report. Boise,
ID: Idaho Transportation Department, Division of Transportation Planning, 2009,
http://itd.idaho.gov/planning/pm/ITD_2009_Performance_Report.pdf, Accessed October 2010.
22. Idaho Transportation Department. Idaho Transportation Department, Pavement Management
System Study (SYSTDY) Report. http://itd.idaho.gov/planning/pm/, Accessed September, 2010.
23. Google Earth. Google Earth Software, Version 5.2.1.1588.
24. Idaho Transportation Department. ITD Highway Information.
http://gis.itd.idaho.gov/highwayinfo/, Accessed September 2010.
25. United Stated Geological Survey. National Water Information System: Web Interface.
http://nwis.waterdata.usgs.gov/id/nwis/gwlevels?search_criteria=lat_long_bounding_box&submi
tted_form=introduction, Accessed November, 2010.

References
105
26. Asphalt Institute. Research and Development of the Asphalt Institute’s Thickness Design Manual
9th Edition. College Park, MD: The Asphalt Institute, Research Report No. 82-2, 1982.
27. WSDOT Pavement Guide, Washington State Department of Transportation, http://training.ce.washington.edu/wsdot/Modules/06_structural_design/1993_aashto_flexible.htm, Accessed January 2010.
28. Witczak, M., A. Patni, and S. El-Badawy. Development of a Rational Methodology to Assess
Performance Related Pay Factors for Asphalt Pavements, ASU-ADOT Research Project, Phoenix,
AZ: Arizona Department of Transportation, November 2006.
29. El-Badawy, S., F. Bayomy, M. Santi, and C. Clawson. “Comparison of Idaho Pavement Design
Procedure with AASHTO 1993 and MEPDG Methods.” pp 586-595 In: T&DI Congress 2011: 1st
Integrated Transportation and Development for a Better Tomorrow. Chicago, IL: American Society
of Civil Engineers, (2011)
30. El-Basyouny M., M. Witczak, and S. El-Badawy. “Verification for the Calibrated Permanent
Deformation Models for the 2002 Design Guide,” Journal of the Association of Asphalt Paving
Technologists, Vol. 74, (2005): 601-652.
31. ARA, Inc., ERES Consultants Division. “Appendix GG-2: Sensitivity Analysis for Permanent
Deformation for Flexible Pavements,” In Guide for Mechanistic-Empirical Design of New and
Rehabilitated Pavement Structures, Washington, D.C.: National Cooperative Highway Research
Program, NCHRP 1-37A, (2004).
32. Idaho Transportation Department. Idaho Transportation Department, Life Cycle Cost Analysis.
http://apps.itd.idaho.gov/apps/materials/Software.aspx, Accessed April, 2011.
33. Idaho Transportation Department. Idaho Transportation Department, Pavement Rating Manual.
Boise, ID: Idaho Transportation Department. 2010.
34. Federal Highway Administration. Distress Identification Manual for the Long-Term Pavement
Performance Program. Washington, D.C.: U.S. Department of Transportation. Federal Highway
Administration, Publication No. FHWA-RD-03-031, June 2003.
35. Huang, Y. H. Pavement Analysis and Design, 2nd ed., Upper Saddle River, NJ: Pearson-Prentice
Hall, 2004.
36. Muench, S., J. Mahoney, and L. Pierce. WSDOT Pavement Guide, Design Parameters. Olympia,
WA: Washington State Department of Transportation.
http://training.ce.washington.edu/wsdot/Modules/04_design_parameters/04-3_body.htm,
Accessed September 2010.
37. Federal Highway Administration. Guide to LTPP Traffic Data Collection and Processing, McLean,
VA: Federal Highway Administration, (2001).
38. California Department of Transportation, Caltrans. “Flexible Pavement” Chapter 630 In: Highway
Design Manual Sacramento, CA: California Department of Transportation, (July 2008)
http://www.dot.ca.gov/hq/oppd/hdm/pdf/english/chp0630.pdf, Accessed March 2011.
39. Cambridge Systematics Inc. Traffic Data Collection, Analysis, and Forecasting for Mechanistic
Pavement Design. NCHRP Report 538, Washington, D.C.: Cambridge Systematics Inc. 2005.

Study of the Effectiveness of ITD Pavement Design Method
106
40. Idaho Transportation Department. Idaho Transportation Roadway Data Section Webpage. Boise,
ID: Idaho Transportation Department, http://dot.idaho.gov/planning/roadwaydata/, Accessed
January 2011.
41. Erickson, L. F. An Evaluation of Flexible Pavement Design Methods. Boise, ID: State of Idaho
Department of Highways, Research Project 20, (May 1964).
42. Dixon, M. The Effects of Errors in Annual Average Daily Traffic Forecasting: Study of Highways in
Rural Idaho. Boise, ID: Idaho Transportation Department, Research Report 167, (September
2004).
43. Kyte, M. Forecasting Travel Demand on Idaho Highways: Summary of Time-Series Analysis
Methodology. Boise, ID: Idaho Transportation Department, Research Report 111D, (September
1993).
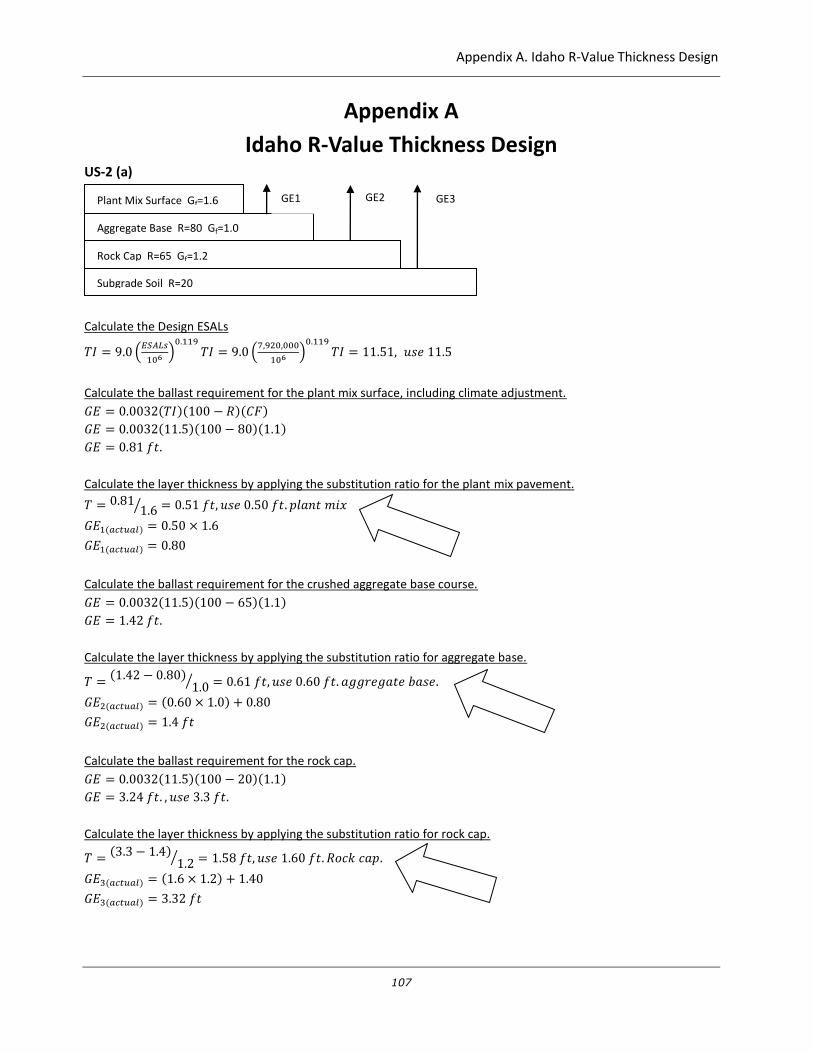
Appendix A. Idaho R-Value Thickness Design
107
Appendix A
Idaho R-Value Thickness Design US-2 (a)
Calculate the Design ESALs
Calculate the ballast requirement for the plant mix surface, including climate adjustment.
Calculate the layer thickness by applying the substitution ratio for the plant mix pavement.
Calculate the ballast requirement for the crushed aggregate base course.
Calculate the layer thickness by applying the substitution ratio for aggregate base.
Calculate the ballast requirement for the rock cap.
Calculate the layer thickness by applying the substitution ratio for rock cap.
Plant Mix Surface Gf=1.6
Aggregate Base R=80 Gf=1.0
Rock Cap R=65 Gf=1.2
Subgrade Soil R=20
GE1 GE2 GE3
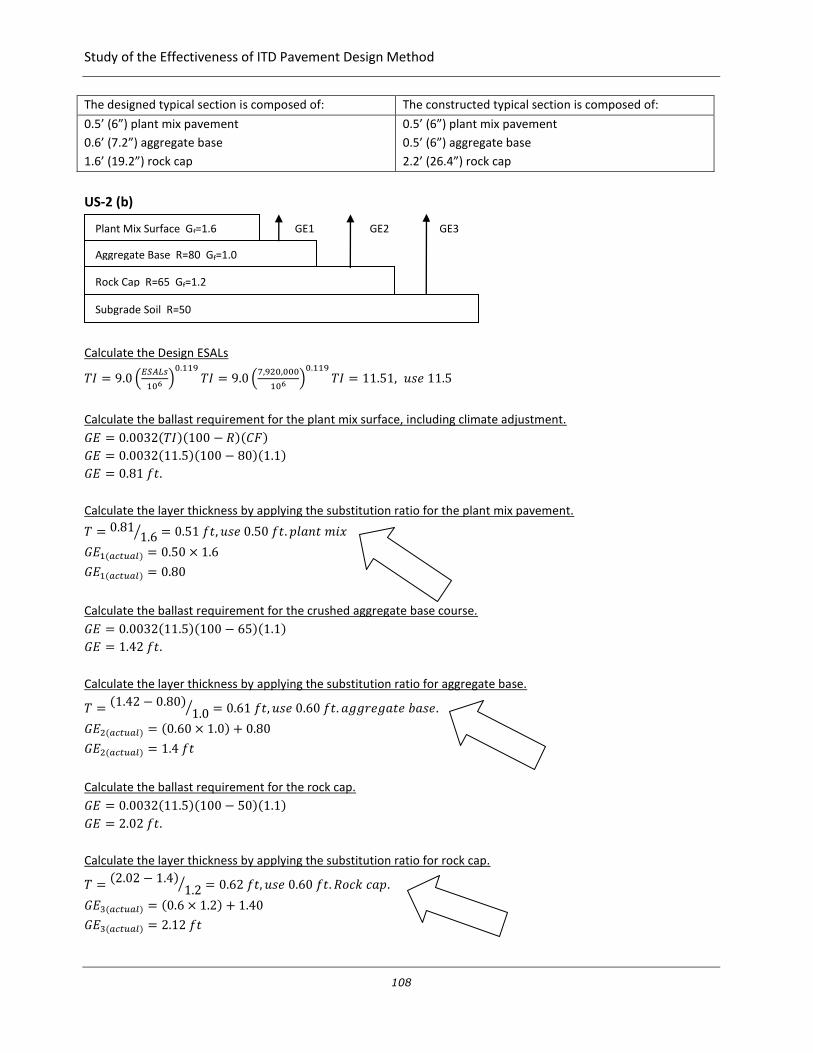
Study of the Effectiveness of ITD Pavement Design Method
108
The designed typical section is composed of: The constructed typical section is composed of:
0.5’ (6”) plant mix pavement
0.6’ (7.2”) aggregate base
1.6’ (19.2”) rock cap
0.5’ (6”) plant mix pavement
0.5’ (6”) aggregate base
2.2’ (26.4”) rock cap
US-2 (b)
Calculate the Design ESALs
Calculate the ballast requirement for the plant mix surface, including climate adjustment.
Calculate the layer thickness by applying the substitution ratio for the plant mix pavement.
Calculate the ballast requirement for the crushed aggregate base course.
Calculate the layer thickness by applying the substitution ratio for aggregate base.
Calculate the ballast requirement for the rock cap.
Calculate the layer thickness by applying the substitution ratio for rock cap.
Plant Mix Surface Gf=1.6
Aggregate Base R=80 Gf=1.0
Rock Cap R=65 Gf=1.2
Subgrade Soil R=50
GE1 GE2 GE3

Appendix A. Idaho R-Value Thickness Design
109
The designed typical section is composed of: The constructed typical section is composed of:
0.5’ (6”)plant mix pavement
0.6’ (7.2”) aggregate base
0.6’ (7.2”) rock cap
0.5’ (6”) plant mix pavement
0.5’ (6”) aggregate base
0.75’ (9”) rock cap
US-2 (c)
Calculate the Design ESALs
Calculate the ballast requirement for the plant mix surface, including climate adjustment.
Calculate the layer thickness by applying the substitution ratio for the plant mix pavement.
Calculate the ballast requirement for the crushed aggregate base course.
Calculate the layer thickness by applying the substitution ratio for aggregate base.
Calculate the ballast requirement for the rock cap.
Calculate the layer thickness by applying the substitution ratio for rock cap.
Plant Mix Surface Gf=1.6
Aggregate Base R=80 Gf=1.0
Rock Cap R=65 Gf=1.2
Subgrade Soil R=15
GE1 GE2 GE3

Study of the Effectiveness of ITD Pavement Design Method
110
The designed typical section is composed of: The constructed typical section is composed of:
0.5’ (6”) plant mix pavement
0.6’ (7.2”) aggregate base
1.75’ (21”) rock cap
0.5’ (6”) plant mix pavement
0.5’ (6”) aggregate base
2.5’ (30”) rock cap
SH-62
Calculate the Design ESALs
Calculate the ballast requirement for the plant mix surface, including climate adjustment.
Calculate the layer thickness by applying the substitution ratio for the plant mix pavement.
Calculate the ballast requirement for the rock cap.
Calculate the layer thickness by applying the substitution ratio for rock cap.
The designed typical section is composed of: The constructed typical section is composed of:
0.35’ (4.2”) plant mix pavement
1.85’ (22.2”) rock cap
0.35’ (4.2”) plant mix pavement
1.85’ (22.2”) rock cap
Plant Mix Surface Gf=1.8
Rock Cap R=80 Gf=1.2
Subgrade Soil R=8
GE1 GE2

Appendix A. Idaho R-Value Thickness Design
111
SH-3
Calculate the Design ESALs
Calculate the ballast requirement for the plant mix surface, including climate adjustment.
Calculate the layer thickness by applying the substitution ratio for the plant mix pavement.
Calculate the ballast requirement for the rock cap.
Calculate the layer thickness by applying the substitution ratio for rock cap.
The designed typical section is composed of: The constructed typical section is composed of:
0.45’ (5.4”) plant mix pavement
1.5’ (18”)rock cap
0.45’ (5.4”) plant mix pavement
1.6’ (19.2) rock cap
Plant Mix Surface Gf=1.6
Rock Cap R=80 Gf=1.2
Subgrade Soil R=25
GE1 GE2

Study of the Effectiveness of ITD Pavement Design Method
112
SH-19
Calculate the Design ESALs
Calculate the ballast requirement for the plant mix surface, including climate adjustment.
Calculate the layer thickness by applying the substitution ratio for the plant mix pavement.
Calculate the ballast requirement for the crushed aggregate base course.
Calculate the layer thickness by applying the substitution ratio for aggregate base.
Calculate the ballast requirement for the granular subbase.
Calculate the layer thickness by applying the substitution ratio for granular subbase.
The designed typical section is composed of: The constructed typical section is composed of:
0.35’ (4.2”) plant mix pavement
0.45’ (5.4”) aggregate base
0.85’ (10.2”) granular subbase
0.35’ (4.2”) plant mix pavement
0.45’ (5.4”) aggregate base
1.0’ (12”) granular subbase
Plant Mix Surface Gf=1.8
Aggregate Base R=80 Gf=1.0
Granular Subbase R=65 Gf=0.85
Subgrade Soil R=44
GE1 GE2 GE3

Appendix A. Idaho R-Value Thickness Design
113
US-95
Calculate the Design ESALs
Calculate the ballast requirement for the plant mix surface, including climate adjustment.
Calculate the layer thickness by applying the substitution ration for the plant mix pavement.
Calculate the ballast requirement for the crushed aggregate base course.
Calculate the layer thickness by applying the substitution ratio for aggregate base.
Calculate the ballast requirement for the rock cap.
Calculate the layer thickness by applying the substitution ratio for rock cap.
The designed typical section is composed of: The constructed typical section is composed of:
0.35’ (4.2”) plant mix pavement
0.65’ (7.8”) aggregate base
1.5’ (18”) rock cap
0.3’ (3.6”) plant mix pavement
0.5’ (6”) aggregate base
2.5’ (30”) rock cap
Plant Mix Surface Gf=1.8
Aggregate Base R=80 Gf=1.0
Granular Subbase R=65 Gf=0.85
Subgrade Soil R=5
GE1 GE2 GE3

Study of the Effectiveness of ITD Pavement Design Method
114
US-93
Calculate the Design ESALs
Calculate the ballast requirement for the plant mix surface, including climate adjustment.
Calculate the layer thickness by applying the substitution ration for the plant mix pavement.
Calculate the ballast requirement for the crushed aggregate base course.
Calculate the layer thickness by applying the substitution ratio for aggregate base.
Calculate the ballast requirement for the rock cap.
Calculate the layer thickness by applying the substitution ratio for rock cap.
The designed typical section is composed of: The constructed typical section is composed of:
0.45’ (5.4”) plant mix pavement
0.65’ (7.8”) aggregate base
0.45’ (5.4”) granular subbase
0.5’ (6”) plant mix pavement
0.75’ (9”)aggregate base
0.5’ (6”) granular subbase
Plant Mix Surface
Gf=1.0 Aggregate Base R=80
Gf=1.0 Granular Subbase R=60
Gf=1.0 Subgrade Soil R=50
GE1 GE2 GE3

Appendix B. Comparison of MEPDG Predicted Distresses and Smoothness at 50 Percent Reliability
115
Appendix B Comparison of MEPDG Predicted Distresses and
Smoothness at 50 Percent Reliability
The figures presented in this appendix show a comparison of MEPDG predicted distresses and smoothness
for structures designed using ITD, MEPDG, and AASHTO 1993 at 50 percent reliability.
Figure 82. Comparison of the Predicted Alligator Cracking, US-2(a) Project
0.0
1.0
2.0
3.0
4.0
5.0
6.0
7.0
8.0
9.0
0 24 48 72 96 120 144 168 192 216 240 264
Alli
gato
r C
rack
ing
(%
)
Pavement Age (Months)
ITD
AASHTO 1993
MEPDG

Study of the Effectiveness of ITD Pavement Design Method
116
Figure 83. Comparison of the Predicted Longitudinal Cracking, US-2(a) Project
Figure 84. Comparison of the Predicted Total Rutting, US-2(a) Project
0
50
100
150
200
250
300
0 24 48 72 96 120 144 168 192 216 240 264
Lon
gitu
din
al C
rack
ing
(ft
/mile
)
Pavement Age (Months)
ITD
AASHTO 1993
MEPDG
0.00
0.10
0.20
0.30
0.40
0.50
0.60
0 24 48 72 96 120 144 168 192 216 240 264
Tota
l Ru
ttin
g (i
n.)
Pavement Age (Months)
ITD
AASHTO 1993
MEPDG

Appendix B. Comparison of MEPDG Predicted Distresses and Smoothness at 50 Percent Reliability
117
Figure 85. Comparison of the Predicted AC Layer Rutting, US-2(a) Project
Figure 86. Comparison of the Predicted Unbound Granular Layer(s) Rutting, US-2(a) Project
0.00
0.10
0.20
0.30
0.40
0.50
0.60
0 24 48 72 96 120 144 168 192 216 240 264
AC
Ru
ttin
g (i
n.)
Pavement Age (Months)
ITD
AASHTO 1993
MEPDG
0.00
0.10
0.20
0.30
0.40
0.50
0.60
0 24 48 72 96 120 144 168 192 216 240 264
Gra
nu
lar
Laye
r R
utt
ing,
(in
.)
Pavement Age (Months)
ITD
AASHTO 1993
MEPDG

Study of the Effectiveness of ITD Pavement Design Method
118
Figure 87. Comparison of the Predicted Subgrade Layer Rutting, US-2(a) Project
Figure 88. Comparison of the Predicted IRI, US-2(a) Project
0.00
0.10
0.20
0.30
0.40
0.50
0.60
0 24 48 72 96 120 144 168 192 216 240 264
Sub
grad
e R
utt
ing
(in
.)
Pavement Age (Months)
ITD
AASHTO 1993
MEPDG
60
70
80
90
100
110
120
0 24 48 72 96 120 144 168 192 216 240 264
IRI (
in./
mile
)
Pavement Age (Months)
ITD
AASHTO 1993
MEPDG

Appendix B. Comparison of MEPDG Predicted Distresses and Smoothness at 50 Percent Reliability
119
Figure 4. Comparison of the Predicted Alligator Cracking, US-2(b) Project
Figure 90. Comparison of the Predicted Longitudinal Cracking, US-2(b) Project
0.0
2.0
4.0
6.0
8.0
10.0
12.0
14.0
16.0
0 24 48 72 96 120 144 168 192 216 240 264
Alli
gato
r C
rack
ing
(%
)
Pavement Age (Months)
ITD
AASHTO 1993
MEPDG
0
500
1000
1500
2000
2500
0 24 48 72 96 120 144 168 192 216 240 264
Lon
gitu
din
al C
rack
ing
(ft
/mile
)
Pavement Age (Months)
ITD
AASHTO 1993
MEPDG

Study of the Effectiveness of ITD Pavement Design Method
120
Figure 91. Comparison of the Predicted Total Rutting, US-2(b) Project
Figure 92. Comparison of the Predicted AC Layer Rutting, US-2(b) Project
0.00
0.10
0.20
0.30
0.40
0.50
0.60
0 24 48 72 96 120 144 168 192 216 240 264
Tota
l Ru
ttin
g (
in.)
Pavement Age (Months)
ITD
AASHTO 1993
MEPDG
0.00
0.10
0.20
0.30
0.40
0.50
0.60
0 24 48 72 96 120 144 168 192 216 240 264
AC
Ru
ttin
g (
in.)
Pavement Age (Months)
ITD
AASHTO 1993
MEPDG

Appendix B. Comparison of MEPDG Predicted Distresses and Smoothness at 50 Percent Reliability
121
Figure 93. Comparison of the Predicted Unbound Granular Layer(s) Rutting, US-2(b) Project
Figure 94. Comparison of the Predicted Subgrade Layer Rutting, US-2(b) Project
0.00
0.10
0.20
0.30
0.40
0.50
0.60
0 24 48 72 96 120 144 168 192 216 240 264
Gra
nu
lar
Laye
r R
utt
ing
(in
.)
Pavement Age (Months)
ITD
AASHTO 1993
MEPDG
0.00
0.10
0.20
0.30
0.40
0.50
0.60
0 24 48 72 96 120 144 168 192 216 240 264
Sub
grad
e R
utt
ing
(in
.)
Pavement Age (Months)
ITD
AASHTO 1993
MEPDG
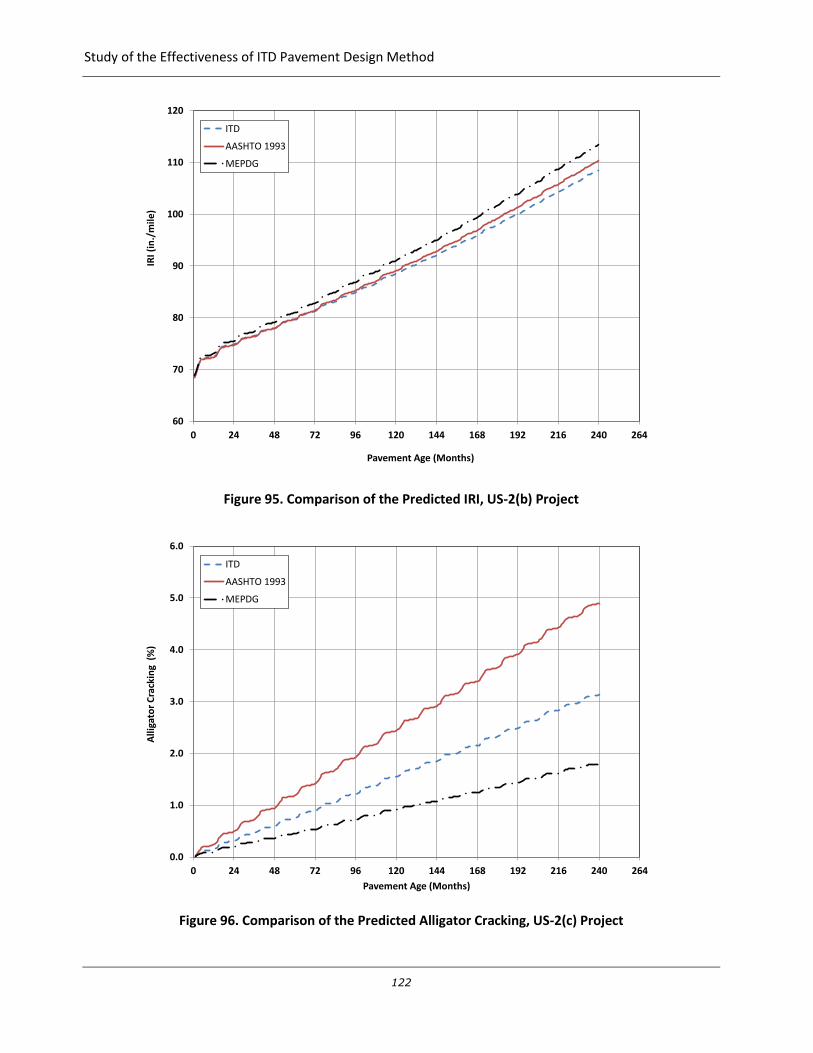
Study of the Effectiveness of ITD Pavement Design Method
122
Figure 95. Comparison of the Predicted IRI, US-2(b) Project
Figure 96. Comparison of the Predicted Alligator Cracking, US-2(c) Project
60
70
80
90
100
110
120
0 24 48 72 96 120 144 168 192 216 240 264
IRI (
in./
mile
)
Pavement Age (Months)
ITD
AASHTO 1993
MEPDG
0.0
1.0
2.0
3.0
4.0
5.0
6.0
0 24 48 72 96 120 144 168 192 216 240 264
Alli
gato
r C
rack
ing
(%
)
Pavement Age (Months)
ITD
AASHTO 1993
MEPDG

Appendix B. Comparison of MEPDG Predicted Distresses and Smoothness at 50 Percent Reliability
123
Figure 97. Comparison of the Predicted Longitudinal Cracking, US-2(c) Project
Figure 98. Comparison of the Predicted Total Rutting, US-2(c) Project
0
10
20
30
40
50
60
70
0 24 48 72 96 120 144 168 192 216 240 264
Lon
gitu
din
al C
rack
ing
(ft
/mile
)
Pavement Age (Months)
ITD
AASHTO 1993
MEPDG
0.00
0.10
0.20
0.30
0.40
0.50
0.60
0 24 48 72 96 120 144 168 192 216 240 264
Tota
l Ru
ttin
g (i
n.)
Pavement Age (Months)
ITD
AASHTO 1993
MEPDG

Study of the Effectiveness of ITD Pavement Design Method
124
Figure 99. Comparison of the Predicted AC Layer Rutting, US-2(c) Project
Figure 100. Comparison of the Predicted Unbound Granular Layer(s) Rutting, US-2(c) Project
0.00
0.10
0.20
0.30
0.40
0.50
0.60
0.70
0 24 48 72 96 120 144 168 192 216 240 264
AC
Ru
ttin
g (i
n.)
Pavement Age (Months)
ITD
AASHTO 1993
MEPDG
0.00
0.10
0.20
0.30
0.40
0.50
0.60
0.70
0 24 48 72 96 120 144 168 192 216 240 264
Gra
nu
lar
Laye
r R
utt
ing
(in
.)
Pavement Age (Months)
ITD
AASHTO 1993
MEPDG

Appendix B. Comparison of MEPDG Predicted Distresses and Smoothness at 50 Percent Reliability
125
Figure 101. Comparison of the Predicted Subgrade Layer Rutting, US-2(c) Project
Figure 102. Comparison of the Predicted IRI, US-2(c) Project
0.00
0.10
0.20
0.30
0.40
0.50
0.60
0.70
0 24 48 72 96 120 144 168 192 216 240 264
Sub
grad
e R
utt
ing
(in
.)
Pavement Age (Months)
ITD
AASHTO 1993
MEPDG
60
70
80
90
100
110
120
130
0 24 48 72 96 120 144 168 192 216 240 264
IRI (
in./
mile
)
Pavement Age (Months)
ITD
AASHTO 1993
MEPDG
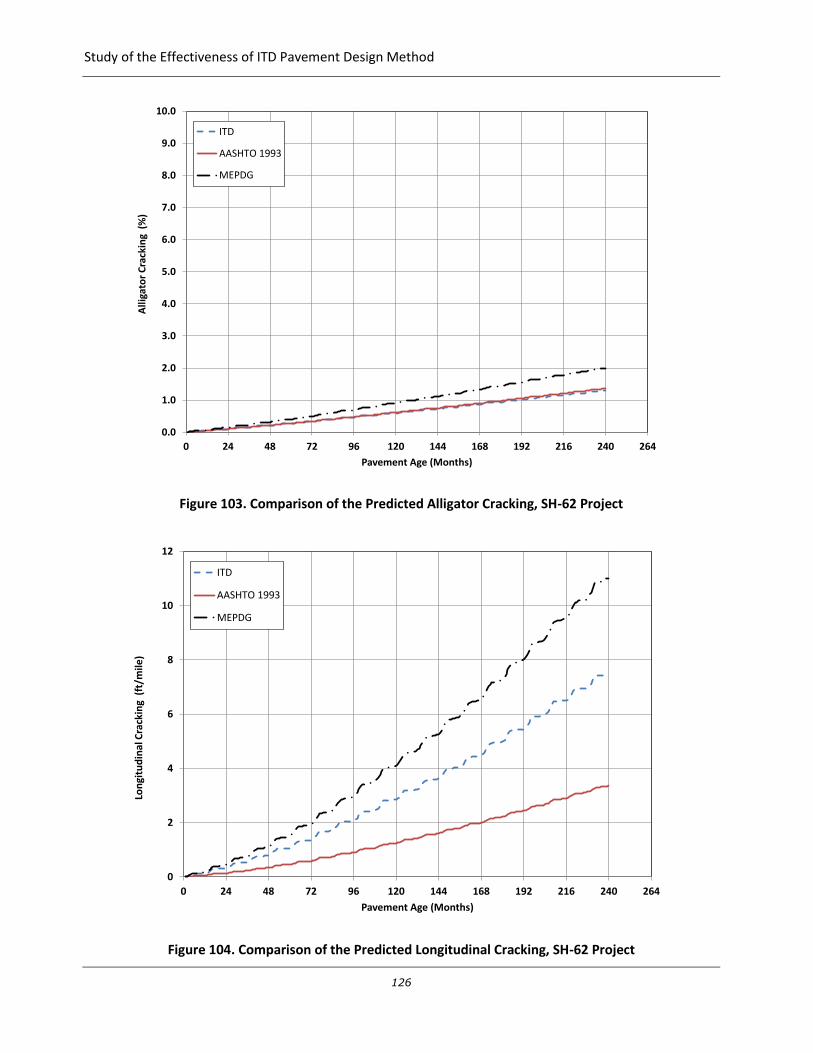
Study of the Effectiveness of ITD Pavement Design Method
126
Figure 103. Comparison of the Predicted Alligator Cracking, SH-62 Project
Figure 104. Comparison of the Predicted Longitudinal Cracking, SH-62 Project
0.0
1.0
2.0
3.0
4.0
5.0
6.0
7.0
8.0
9.0
10.0
0 24 48 72 96 120 144 168 192 216 240 264
Alli
gato
r C
rack
ing
(%
)
Pavement Age (Months)
ITD
AASHTO 1993
MEPDG
0
2
4
6
8
10
12
0 24 48 72 96 120 144 168 192 216 240 264
Lon
gitu
din
al C
rack
ing
(ft
/mile
)
Pavement Age (Months)
ITD
AASHTO 1993
MEPDG
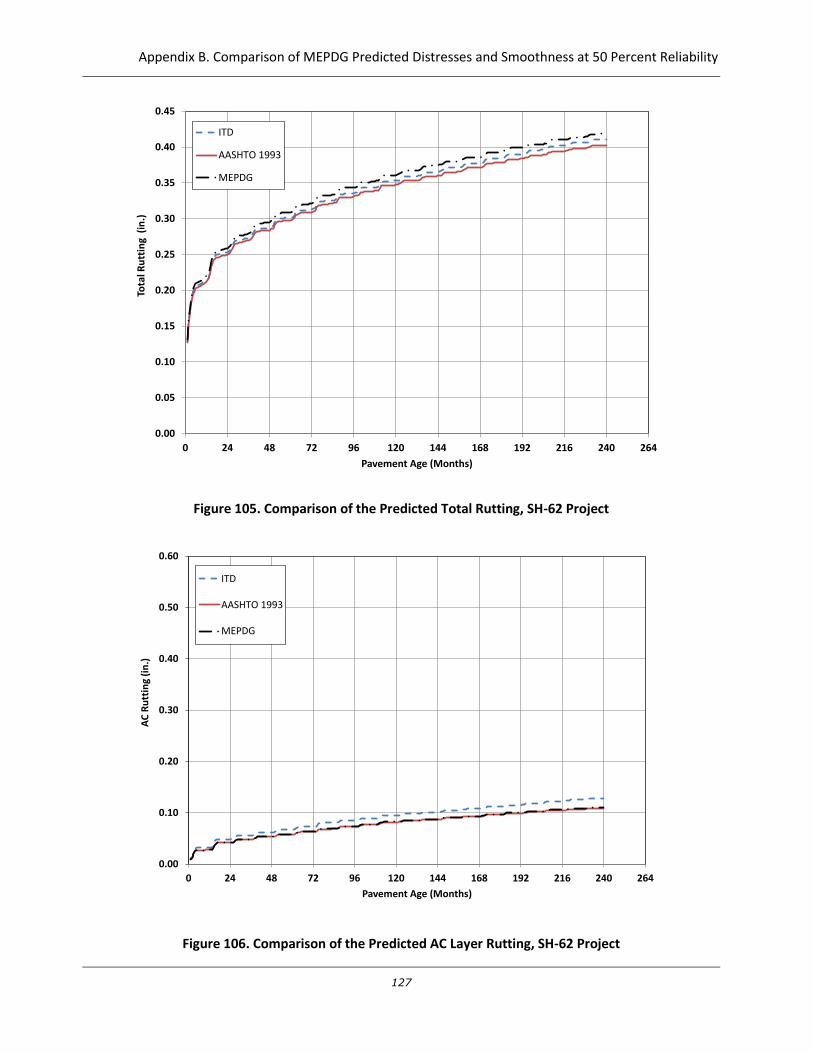
Appendix B. Comparison of MEPDG Predicted Distresses and Smoothness at 50 Percent Reliability
127
Figure 105. Comparison of the Predicted Total Rutting, SH-62 Project
Figure 106. Comparison of the Predicted AC Layer Rutting, SH-62 Project
0.00
0.05
0.10
0.15
0.20
0.25
0.30
0.35
0.40
0.45
0 24 48 72 96 120 144 168 192 216 240 264
Tota
l Ru
ttin
g (
in.)
Pavement Age (Months)
ITD
AASHTO 1993
MEPDG
0.00
0.10
0.20
0.30
0.40
0.50
0.60
0 24 48 72 96 120 144 168 192 216 240 264
AC
Ru
ttin
g (i
n.)
Pavement Age (Months)
ITD
AASHTO 1993
MEPDG

Study of the Effectiveness of ITD Pavement Design Method
128
Figure 107. Comparison of the Predicted Unbound Granular Layer(s) Rutting, SH-62 Project
Figure 108. Comparison of the Predicted Subgrade Layer Rutting, SH-62 Project
0.00
0.10
0.20
0.30
0.40
0.50
0.60
0 24 48 72 96 120 144 168 192 216 240 264
Gra
nu
lar
Laye
r R
utt
ing
(in
.)
Pavement Age (Months)
ITD
AASHTO 1993
MEPDG
0.00
0.10
0.20
0.30
0.40
0.50
0.60
0 24 48 72 96 120 144 168 192 216 240 264
Sub
grad
e R
utt
ing
(in
.)
Pavement Age (Months)
ITD
AASHTO 1993
MEPDG

Appendix B. Comparison of MEPDG Predicted Distresses and Smoothness at 50 Percent Reliability
129
Figure 109. Comparison of the Predicted IRI, SH-62 Project
Figure 110. Comparison of the Predicted Alligator Cracking, SH-3 Project
60
70
80
90
100
110
120
0 24 48 72 96 120 144 168 192 216 240 264
IRI (
in./
mile
)
Pavement Age (Months)
ITD
AASHTO 1993
MEPDG
0.0
1.0
2.0
3.0
4.0
5.0
6.0
7.0
8.0
9.0
10.0
0 24 48 72 96 120 144 168 192 216 240 264
Alli
gato
r C
rack
ing
(%
)
Pavement Age (Months)
ITD
AASHTO 1993
MEPDG
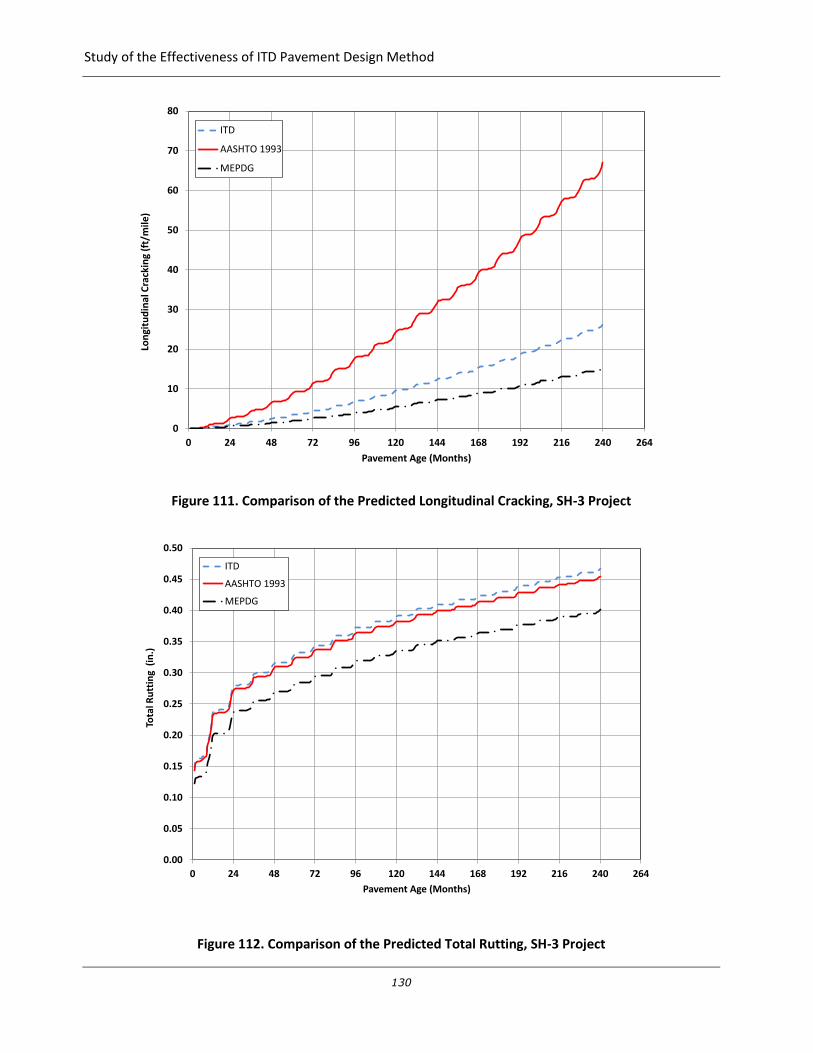
Study of the Effectiveness of ITD Pavement Design Method
130
Figure 111. Comparison of the Predicted Longitudinal Cracking, SH-3 Project
Figure 112. Comparison of the Predicted Total Rutting, SH-3 Project
0
10
20
30
40
50
60
70
80
0 24 48 72 96 120 144 168 192 216 240 264
Lon
gitu
din
al C
rack
ing
(ft/
mile
)
Pavement Age (Months)
ITD
AASHTO 1993
MEPDG
0.00
0.05
0.10
0.15
0.20
0.25
0.30
0.35
0.40
0.45
0.50
0 24 48 72 96 120 144 168 192 216 240 264
Tota
l Ru
ttin
g (
in.)
Pavement Age (Months)
ITD
AASHTO 1993
MEPDG

Appendix B. Comparison of MEPDG Predicted Distresses and Smoothness at 50 Percent Reliability
131
Figure 113. Comparison of the Predicted AC Layer Rutting, SH-3 Project
Figure 114. Comparison of the Predicted Unbound Granular Layer(s) Rutting, SH-3 Project
0.00
0.10
0.20
0.30
0.40
0.50
0.60
0 24 48 72 96 120 144 168 192 216 240 264
AC
Ru
ttin
g (i
n.)
Pavement Age (Months)
ITD
AASHTO 1993
MEPDG
0.00
0.10
0.20
0.30
0.40
0.50
0.60
0 24 48 72 96 120 144 168 192 216 240 264
Gra
nu
lar
Laye
r R
utt
ing
(in
.)
Pavement Age (Months)
ITD
AASHTO 1993
MEPDG

Study of the Effectiveness of ITD Pavement Design Method
132
Figure 115. Comparison of the Predicted Subgrade Layer Rutting, SH-3 Project
Figure 116. Comparison of the Predicted IRI, SH-3 Project
0.00
0.10
0.20
0.30
0.40
0.50
0.60
0 24 48 72 96 120 144 168 192 216 240 264
Sub
grad
e R
utt
ing
(in
.)
Pavement Age (Months)
ITD
AASHTO 1993
MEPDG
60
65
70
75
80
85
90
95
100
105
110
0 24 48 72 96 120 144 168 192 216 240 264
IRI (
in./
mile
)
Pavement Age (Months)
ITD
AASHTO 1993
MEPDG

Appendix B. Comparison of MEPDG Predicted Distresses and Smoothness at 50 Percent Reliability
133
Figure 117. Comparison of the Predicted Alligator Cracking, SH-19 Project
Figure 118. Comparison of the Predicted Longitudinal Cracking, SH-19 Project
0.0
1.0
2.0
3.0
4.0
5.0
6.0
7.0
8.0
9.0
10.0
0 24 48 72 96 120 144 168 192 216 240 264
Alli
gato
r C
rack
ing
(%)
Pavement Age (Months)
ITD
AASHTO 1993
MEPDG
0
20
40
60
80
100
120
140
160
0 24 48 72 96 120 144 168 192 216 240 264
Lon
gitu
din
al C
rack
ing
(ft/
mile
)
Pavement Age (Months)
ITD
AASHTO 1993
MEPDG

Study of the Effectiveness of ITD Pavement Design Method
134
Figure 119. Comparison of the Predicted Total Rutting, SH-19 Project
Figure 120. Comparison of the Predicted AC Layer Rutting, SH-19 Project
0.00
0.05
0.10
0.15
0.20
0.25
0.30
0.35
0.40
0 24 48 72 96 120 144 168 192 216 240 264
Tota
l Ru
ttin
g (i
n.)
Pavement Age (Months)
ITD
AASHTO 1993
MEPDG
0.00
0.05
0.10
0.15
0.20
0.25
0.30
0.35
0.40
0 24 48 72 96 120 144 168 192 216 240 264
AC
Ru
ttin
g (i
n.)
Pavement Age (Months)
ITD
AASHTO 1993
MEPDG

Appendix B. Comparison of MEPDG Predicted Distresses and Smoothness at 50 Percent Reliability
135
Figure 121. Comparison of the Predicted Unbound Granular Layer(s) Rutting, SH-19 Project
Figure 122. Comparison of the Predicted Subgrade Layer Rutting, SH-19 Project
0.00
0.05
0.10
0.15
0.20
0.25
0.30
0.35
0.40
0 24 48 72 96 120 144 168 192 216 240 264
Gra
nu
lar
Laye
r R
utt
ing
(in
.)
Pavement Age (Months)
ITD
AASHTO 1993
MEPDG
0.00
0.05
0.10
0.15
0.20
0.25
0.30
0.35
0.40
0 24 48 72 96 120 144 168 192 216 240 264
Sub
grad
e R
utt
ing
(in
.)
Pavement Age (Months)
ITD
AASHTO 1993
MEPDG

Study of the Effectiveness of ITD Pavement Design Method
136
Figure 123. Comparison of the Predicted IRI, SH-19 Project
Figure 124. Comparison of the Predicted Alligator Cracking, US-95 Project
60
65
70
75
80
85
90
95
100
105
110
0 24 48 72 96 120 144 168 192 216 240 264
IRI (
in./
mile
)
Pavement Age (Months)
ITD
AASHTO 1993
MEPDG
0.0
0.5
1.0
1.5
2.0
2.5
3.0
3.5
4.0
4.5
0 24 48 72 96 120 144 168 192 216 240 264
Alli
gato
r C
rack
ing
(%
)
Pavement Age (Months)
ITD
AASHTO 1993
MEPDG

Appendix B. Comparison of MEPDG Predicted Distresses and Smoothness at 50 Percent Reliability
137
Figure 125. Comparison of the Predicted Longitudinal Cracking, US-95 Project
Figure 126. Comparison of the Predicted Total Rutting, US-95 Project
0
2
4
6
8
10
12
14
16
18
0 24 48 72 96 120 144 168 192 216 240 264
Lon
gitu
din
al C
rack
ing
(ft
/mile
)
Pavement Age (Months)
ITD
AASHTO 1993
MEPDG
0.00
0.10
0.20
0.30
0.40
0.50
0.60
0 24 48 72 96 120 144 168 192 216 240 264
Tota
l Ru
ttin
g (
in.)
Pavement Age (Months)
ITD
AASHTO 1993
MEPDG

Study of the Effectiveness of ITD Pavement Design Method
138
Figure 127. Comparison of the Predicted AC Layer Rutting, US-95 Project
Figure 128. Comparison of the Predicted Unbound Granular Layer(s) Rutting, US-95 Project
0.00
0.10
0.20
0.30
0.40
0.50
0.60
0 24 48 72 96 120 144 168 192 216 240 264
AC
Ru
ttin
g (
in.)
Pavement Age (Months)
ITD
AASHTO 1993
MEPDG
0.00
0.10
0.20
0.30
0.40
0.50
0.60
0 24 48 72 96 120 144 168 192 216 240 264
Gra
nu
lar
Laye
r R
utt
ing
(in
.)
Pavement Age (Months)
ITD
AASHTO 1993
MEPDG

Appendix B. Comparison of MEPDG Predicted Distresses and Smoothness at 50 Percent Reliability
139
Figure 129. Comparison of the Predicted Subgrade Layer Rutting, US-95 Project
Figure 130. Comparison of the Predicted IRI, US-95 Project
0.00
0.10
0.20
0.30
0.40
0.50
0.60
0 24 48 72 96 120 144 168 192 216 240 264
Sub
grad
e R
utt
ing
(in
.)
Pavement Age (Months)
ITD
AASHTO 1993
MEPDG
60
70
80
90
100
110
120
0 24 48 72 96 120 144 168 192 216 240 264
IRI (
in./
mile
)
Pavement Age (Months)
ITD
AASHTO 1993
MEPDG

Study of the Effectiveness of ITD Pavement Design Method
140
Figure 131. Comparison of the Predicted Alligator Cracking, US-93 Project
Figure 132. Comparison of the Predicted Longitudinal Cracking, US-93 Project
0.0
1.0
2.0
3.0
4.0
5.0
6.0
7.0
8.0
9.0
10.0
0 24 48 72 96 120 144 168 192 216 240 264
Alli
gato
r C
rack
ing
(%
)
Pavement Age (Months)
ITD
AASHTO 1993
MEPDG
0
50
100
150
200
250
300
350
400
0 24 48 72 96 120 144 168 192 216 240 264
Lon
gitu
din
al C
rack
ing
(ft
/mile
)
Pavement Age (Months)
ITD
AASHTO 1993
MEPDG

Appendix B. Comparison of MEPDG Predicted Distresses and Smoothness at 50 Percent Reliability
141
Figure 133. Comparison of the Predicted Total Rutting, US-93 Project
Figure 134. Comparison of the Predicted AC Layer Rutting, US-93 Project
0.00
0.10
0.20
0.30
0.40
0.50
0.60
0 24 48 72 96 120 144 168 192 216 240 264
Tota
l Ru
ttin
g (i
n.)
Pavement Age (Months)
ITD
AASHTO 1993
MEPDG
0.00
0.10
0.20
0.30
0.40
0.50
0.60
0 24 48 72 96 120 144 168 192 216 240 264
AC
Ru
ttin
g (i
n.)
Pavement Age (Months)
ITD
AASHTO 1993
MEPDG

Study of the Effectiveness of ITD Pavement Design Method
142
Figure 135. Comparison of the Predicted Unbound Granular Layer(s) Rutting, US-93 Project
Figure 136. Comparison of the Predicted Subgrade Layer Rutting, US-93 Project
0.00
0.10
0.20
0.30
0.40
0.50
0.60
0 24 48 72 96 120 144 168 192 216 240 264
Gra
nu
lar
Laye
r R
utt
ing
(in
.)
Pavement Age (Months)
ITD
AASHTO 1993
MEPDG
0.00
0.10
0.20
0.30
0.40
0.50
0.60
0 24 48 72 96 120 144 168 192 216 240 264
Sub
grad
e R
utt
ing
(in
.)
Pavement Age (Months)
ITD
AASHTO 1993
MEPDG
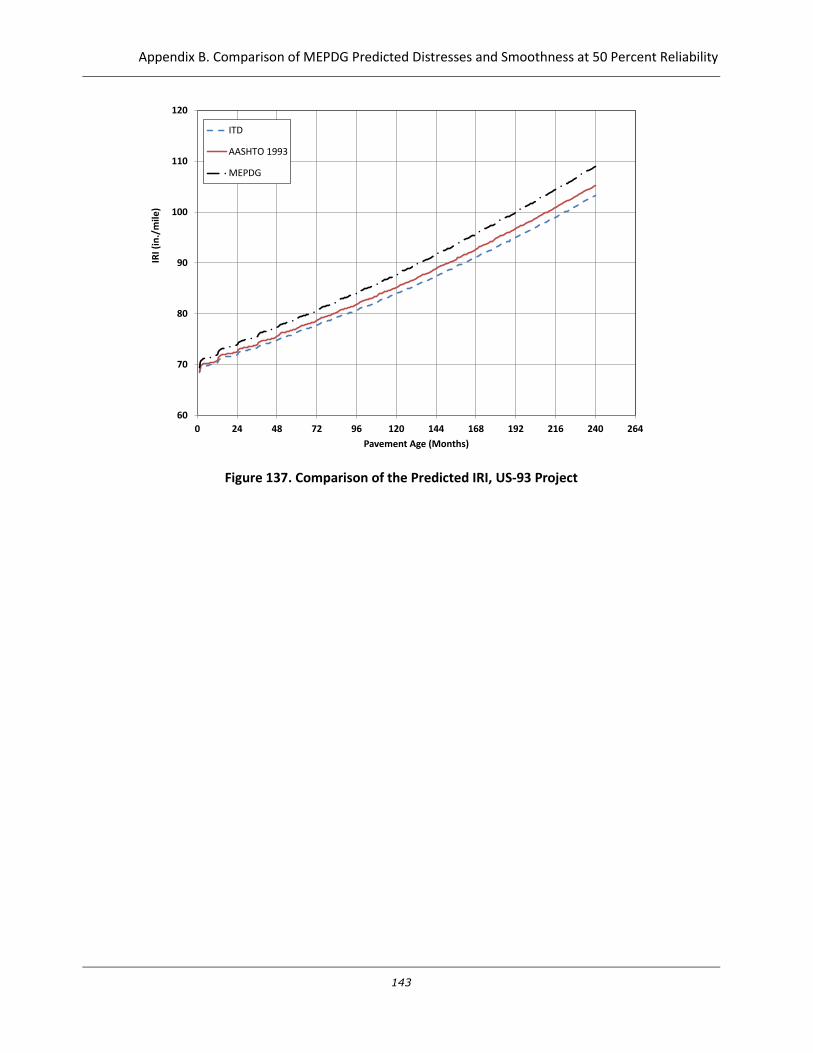
Appendix B. Comparison of MEPDG Predicted Distresses and Smoothness at 50 Percent Reliability
143
Figure 137. Comparison of the Predicted IRI, US-93 Project
60
70
80
90
100
110
120
0 24 48 72 96 120 144 168 192 216 240 264
IRI (
in./
mile
)
Pavement Age (Months)
ITD
AASHTO 1993
MEPDG

Study of the Effectiveness of ITD Pavement Design Method
144

Appendix C. Comparison of MEPDG Predicted Distresses and Smoothness at 85 Percent Reliability
145
Appendix C
Comparison of MEPDG Predicted Distresses and
Smoothness at 85 Percent Reliability
The figures presented in this appendix show a comparison of MEPDG predicted distresses and smoothness
for structures designed using MEPDG and AASHTO 1993 at 85 percent reliability compared to structures
designed using ITD design method which does not incorporate reliability.
Figure 138. Comparison of the Predicted Alligator Cracking, US-2(a) Project
0.0
0.5
1.0
1.5
2.0
2.5
3.0
3.5
4.0
4.5
5.0
0 24 48 72 96 120 144 168 192 216 240 264
Alli
gato
r C
rack
ing
(%
)
Pavement Age (Months)
ITD
AASHTO 1993
MEPDG

Study of the Effectiveness of ITD Pavement Design Method
146
Figure 139. Comparison of the Predicted Longitudinal Cracking, US-2(a) Project
Figure 140. Comparison of the Predicted Total Rutting, US-2(a) Project
0
20
40
60
80
100
120
0 24 48 72 96 120 144 168 192 216 240 264
Lon
gitu
din
al C
rack
ing
(ft
/mile
)
Pavement Age (Months)
ITD
AASHTO 1993
MEPDG
0.00
0.10
0.20
0.30
0.40
0.50
0.60
0 24 48 72 96 120 144 168 192 216 240 264
Tota
l Ru
ttin
g (i
n.)
Pavement Age (Months)
ITD
AASHTO 1993
MEPDG
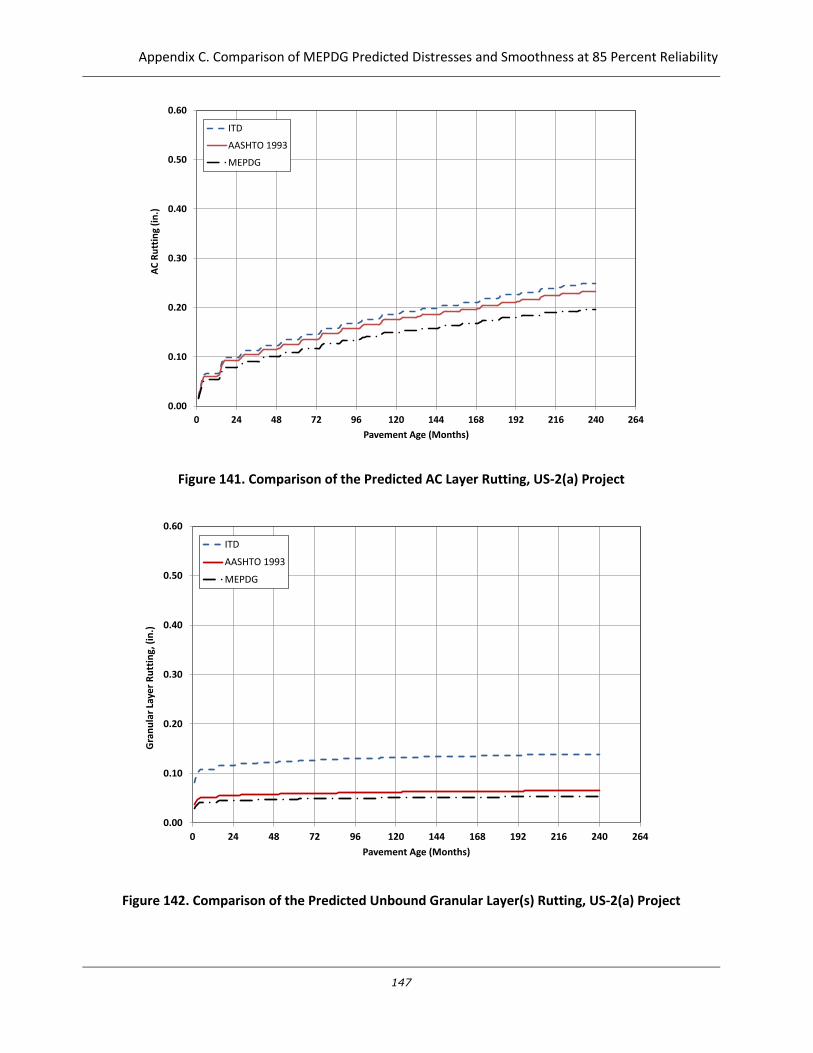
Appendix C. Comparison of MEPDG Predicted Distresses and Smoothness at 85 Percent Reliability
147
Figure 141. Comparison of the Predicted AC Layer Rutting, US-2(a) Project
Figure 142. Comparison of the Predicted Unbound Granular Layer(s) Rutting, US-2(a) Project
0.00
0.10
0.20
0.30
0.40
0.50
0.60
0 24 48 72 96 120 144 168 192 216 240 264
AC
Ru
ttin
g (i
n.)
Pavement Age (Months)
ITD
AASHTO 1993
MEPDG
0.00
0.10
0.20
0.30
0.40
0.50
0.60
0 24 48 72 96 120 144 168 192 216 240 264
Gra
nu
lar
Laye
r R
utt
ing,
(in
.)
Pavement Age (Months)
ITD
AASHTO 1993
MEPDG
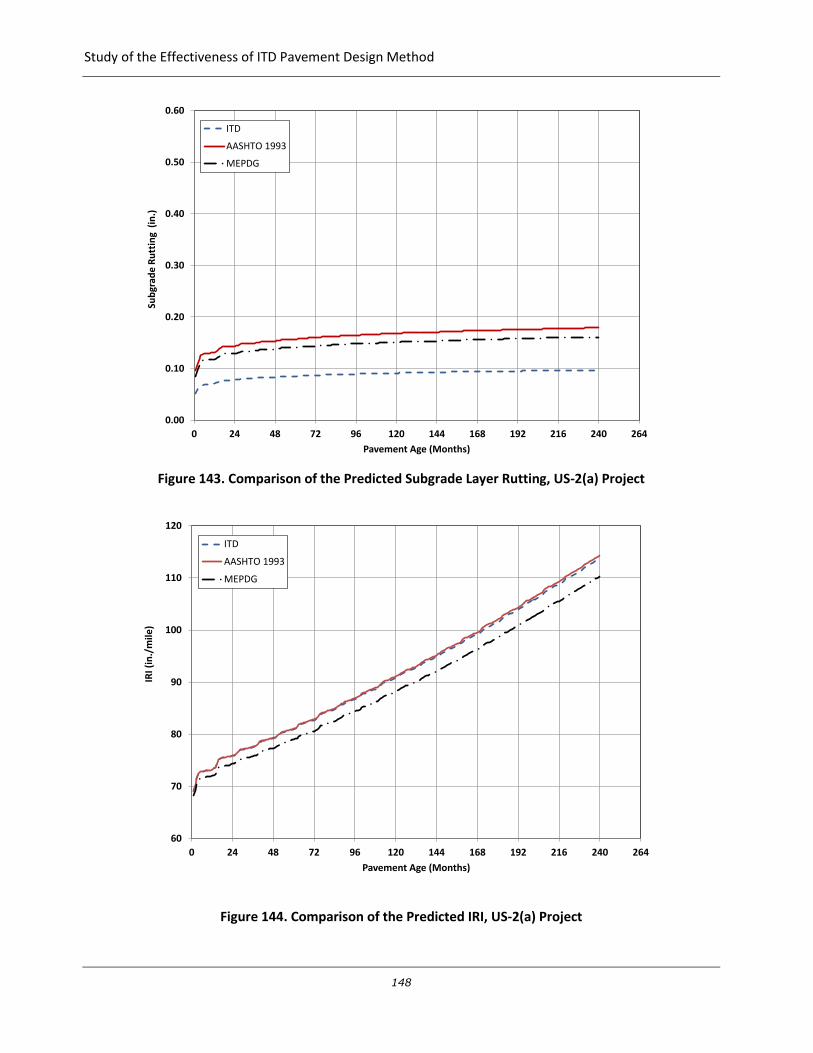
Study of the Effectiveness of ITD Pavement Design Method
148
Figure 143. Comparison of the Predicted Subgrade Layer Rutting, US-2(a) Project
Figure 144. Comparison of the Predicted IRI, US-2(a) Project
0.00
0.10
0.20
0.30
0.40
0.50
0.60
0 24 48 72 96 120 144 168 192 216 240 264
Sub
grad
e R
utt
ing
(in
.)
Pavement Age (Months)
ITD
AASHTO 1993
MEPDG
60
70
80
90
100
110
120
0 24 48 72 96 120 144 168 192 216 240 264
IRI (
in./
mile
)
Pavement Age (Months)
ITD
AASHTO 1993
MEPDG
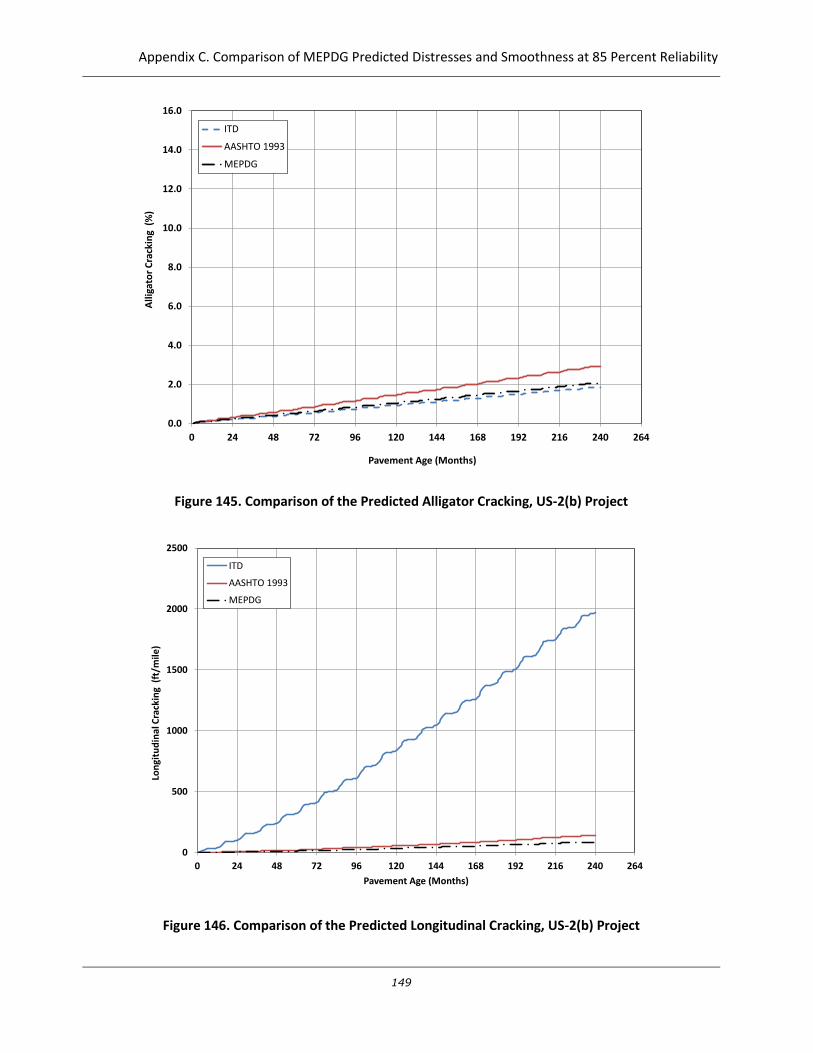
Appendix C. Comparison of MEPDG Predicted Distresses and Smoothness at 85 Percent Reliability
149
Figure 145. Comparison of the Predicted Alligator Cracking, US-2(b) Project
Figure 146. Comparison of the Predicted Longitudinal Cracking, US-2(b) Project
0.0
2.0
4.0
6.0
8.0
10.0
12.0
14.0
16.0
0 24 48 72 96 120 144 168 192 216 240 264
Alli
gato
r C
rack
ing
(%
)
Pavement Age (Months)
ITD
AASHTO 1993
MEPDG
0
500
1000
1500
2000
2500
0 24 48 72 96 120 144 168 192 216 240 264
Lon
gitu
din
al C
rack
ing
(ft
/mile
)
Pavement Age (Months)
ITD
AASHTO 1993
MEPDG

Study of the Effectiveness of ITD Pavement Design Method
150
Figure 147. Comparison of the Predicted Total Rutting, US-2(b) Project
Figure 148. Comparison of the Predicted AC Layer Rutting, US-2(b) Project
0.00
0.10
0.20
0.30
0.40
0.50
0.60
0 24 48 72 96 120 144 168 192 216 240 264
Tota
l Ru
ttin
g (
in.)
Pavement Age (Months)
ITD
AASHTO 1993
MEPDG
0.00
0.10
0.20
0.30
0.40
0.50
0.60
0 24 48 72 96 120 144 168 192 216 240 264
AC
Ru
ttin
g (
in.)
Pavement Age (Months)
ITD
AASHTO 1993
MEPDG

Appendix C. Comparison of MEPDG Predicted Distresses and Smoothness at 85 Percent Reliability
151
Figure 149. Comparison of the Predicted Unbound Granular Layer(s) Rutting, US-2(b) Project
Figure 150. Comparison of the Predicted Subgrade Layer Rutting, US-2(b) Project
0.00
0.10
0.20
0.30
0.40
0.50
0.60
0 24 48 72 96 120 144 168 192 216 240 264
Gra
nu
lar
Laye
r R
utt
ing
(in
.)
Pavement Age (Months)
ITD
AASHTO 1993
MEPDG
0.00
0.10
0.20
0.30
0.40
0.50
0.60
0 24 48 72 96 120 144 168 192 216 240 264
Sub
grad
e R
utt
ing
(in
.)
Pavement Age (Months)
ITD
AASHTO 1993
MEPDG

Study of the Effectiveness of ITD Pavement Design Method
152
Figure 151. Comparison of the Predicted IRI, US-2(b) Project
Figure 152. Comparison of the Predicted Alligator Cracking, US-2(c) Project
60
70
80
90
100
110
120
0 24 48 72 96 120 144 168 192 216 240 264
IRI (
in./
mile
)
Pavement Age (Months)
ITD
AASHTO 1993
MEPDG
0.0
1.0
2.0
3.0
4.0
5.0
6.0
0 24 48 72 96 120 144 168 192 216 240 264
Alli
gato
r C
rack
ing
(%
)
Pavement Age (Months)
ITD
AASHTO 1993
MEPDG

Appendix C. Comparison of MEPDG Predicted Distresses and Smoothness at 85 Percent Reliability
153
Figure 153. Comparison of the Predicted Longitudinal Cracking, US-2(c) Project
Figure 154. Comparison of the Predicted Total Rutting, US-2(c) Project
0
10
20
30
40
50
60
70
0 24 48 72 96 120 144 168 192 216 240 264
Lon
gitu
din
al C
rack
ing
(ft
/mile
)
Pavement Age (Months)
ITD
AASHTO 1993
MEPDG
0.00
0.10
0.20
0.30
0.40
0.50
0.60
0 24 48 72 96 120 144 168 192 216 240 264
Tota
l Ru
ttin
g (i
n.)
Pavement Age (Months)
ITD
AASHTO 1993
MEPDG

Study of the Effectiveness of ITD Pavement Design Method
154
Figure 155. Comparison of the Predicted AC Layer Rutting, US-2(c) Project
Figure 156. Comparison of the Predicted Unbound Granular Layer(s) Rutting, US-2(c) Project
0.00
0.10
0.20
0.30
0.40
0.50
0.60
0.70
0 24 48 72 96 120 144 168 192 216 240 264
AC
Ru
ttin
g (i
n.)
Pavement Age (Months)
ITD
AASHTO 1993
MEPDG
0.00
0.10
0.20
0.30
0.40
0.50
0.60
0.70
0 24 48 72 96 120 144 168 192 216 240 264
Gra
nu
lar
Laye
r R
utt
ing
(in
.)
Pavement Age (Months)
ITD
AASHTO 1993
MEPDG
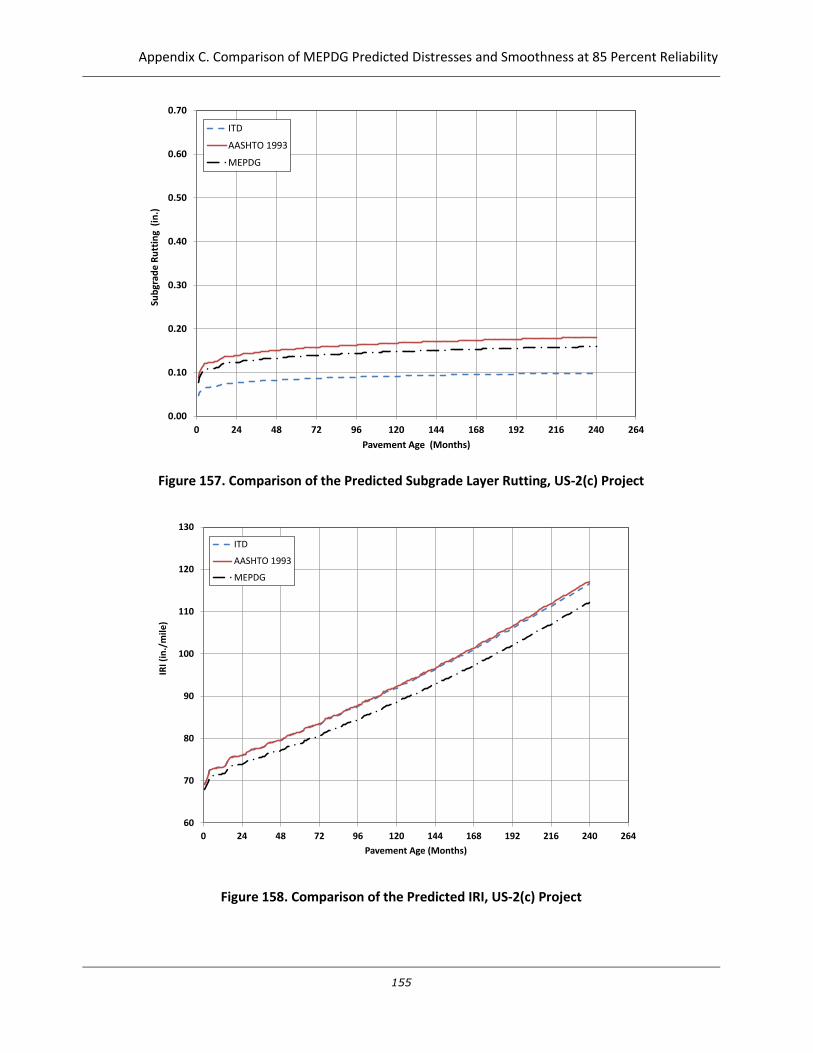
Appendix C. Comparison of MEPDG Predicted Distresses and Smoothness at 85 Percent Reliability
155
Figure 157. Comparison of the Predicted Subgrade Layer Rutting, US-2(c) Project
Figure 158. Comparison of the Predicted IRI, US-2(c) Project
0.00
0.10
0.20
0.30
0.40
0.50
0.60
0.70
0 24 48 72 96 120 144 168 192 216 240 264
Sub
grad
e R
utt
ing
(in
.)
Pavement Age (Months)
ITD
AASHTO 1993
MEPDG
60
70
80
90
100
110
120
130
0 24 48 72 96 120 144 168 192 216 240 264
IRI (
in./
mile
)
Pavement Age (Months)
ITD
AASHTO 1993
MEPDG

Study of the Effectiveness of ITD Pavement Design Method
156
Figure 159. Comparison of the Predicted Alligator Cracking, SH-62 Project
Figure 160. Comparison of the Predicted Longitudinal Cracking, SH-62 Project
0.0
1.0
2.0
3.0
4.0
5.0
6.0
7.0
8.0
9.0
10.0
0 24 48 72 96 120 144 168 192 216 240 264
Alli
gato
r C
rack
ing
(%
)
Pavement Age (Months)
ITD
AASHTO 1993
MEPDG
0
2
4
6
8
10
12
0 24 48 72 96 120 144 168 192 216 240 264
Lon
gitu
din
al C
rack
ing
(ft
/mile
)
Pavement Age (Months)
ITD
AASHTO 1993
MEPDG

Appendix C. Comparison of MEPDG Predicted Distresses and Smoothness at 85 Percent Reliability
157
Figure 161. Comparison of the Predicted Total Rutting, SH-62 Project
Figure 162. Comparison of the Predicted AC Layer Rutting, SH-62 Project
0.00
0.05
0.10
0.15
0.20
0.25
0.30
0.35
0.40
0.45
0 24 48 72 96 120 144 168 192 216 240 264
Tota
l Ru
ttin
g (
in.)
Pavement Age (Months)
ITD
AASHTO 1993
MEPDG
0.00
0.10
0.20
0.30
0.40
0.50
0.60
0 24 48 72 96 120 144 168 192 216 240 264
AC
Ru
ttin
g (i
n.)
Pavement Age (Months)
ITD
AASHTO 1993
MEPDG

Study of the Effectiveness of ITD Pavement Design Method
158
Figure 163. Comparison of the Predicted Unbound Granular Layer(s) Rutting, SH-62 Project
Figure 164. Comparison of the Predicted Subgrade Layer Rutting, SH-62 Project
0.00
0.10
0.20
0.30
0.40
0.50
0.60
0 24 48 72 96 120 144 168 192 216 240 264
Gra
nu
lar
Laye
r R
utt
ing
(in
.)
Pavement Age (Months)
ITD
AASHTO 1993
MEPDG
0.00
0.10
0.20
0.30
0.40
0.50
0.60
0 24 48 72 96 120 144 168 192 216 240 264
Sub
grad
e R
utt
ing
(in
.)
Pavement Age (Months)
ITD
AASHTO 1993
MEPDG

Appendix C. Comparison of MEPDG Predicted Distresses and Smoothness at 85 Percent Reliability
159
Figure 165. Comparison of the Predicted IRI, SH-62 Project
Figure 166. Comparison of the Predicted Alligator Cracking, SH-3 Project
60
70
80
90
100
110
120
0 24 48 72 96 120 144 168 192 216 240 264
IRI (
in./
mile
)
Pavement Age (Months)
ITD
AASHTO 1993
MEPDG
0.0
1.0
2.0
3.0
4.0
5.0
6.0
7.0
8.0
9.0
10.0
0 24 48 72 96 120 144 168 192 216 240 264
Alli
gato
r C
rack
ing
(%
)
Pavement Age (Months)
ITD
AASHTO 1993
MEPDG

Study of the Effectiveness of ITD Pavement Design Method
160
Figure 167. Comparison of the Predicted Longitudinal Cracking, SH-3 Project
Figure 168. Comparison of the Predicted Total Rutting, SH-3 Project
0
10
20
30
40
50
60
70
80
0 24 48 72 96 120 144 168 192 216 240 264
Lon
gitu
din
al C
rack
ing
(ft/
mile
)
Pavement Age (Months)
ITD
AASHTO 1993
MEPDG
0.00
0.05
0.10
0.15
0.20
0.25
0.30
0.35
0.40
0.45
0.50
0 24 48 72 96 120 144 168 192 216 240 264
Tota
l Ru
ttin
g (
in.)
Pavement Age (Months)
ITD
AASHTO 1993
MEPDG

Appendix C. Comparison of MEPDG Predicted Distresses and Smoothness at 85 Percent Reliability
161
Figure 169. Comparison of the Predicted AC Layer Rutting, SH-3 Project
Figure 170. Comparison of the Predicted Unbound Granular Layer(s) Rutting, SH-3 Project
0.00
0.10
0.20
0.30
0.40
0.50
0.60
0 24 48 72 96 120 144 168 192 216 240 264
AC
Ru
ttin
g (i
n.)
Pavement Age (Months)
ITD
AASHTO 1993
MEPDG
0.00
0.10
0.20
0.30
0.40
0.50
0.60
0 24 48 72 96 120 144 168 192 216 240 264
Gra
nu
lar
Laye
r R
utt
ing
(in
.)
Pavement Age (Months)
ITD
AASHTO 1993
MEPDG

Study of the Effectiveness of ITD Pavement Design Method
162
Figure 171. Comparison of the Predicted Subgrade Layer Rutting, SH-3 Project
Figure 172. Comparison of the Predicted IRI, SH-3 Project
0.00
0.10
0.20
0.30
0.40
0.50
0.60
0 24 48 72 96 120 144 168 192 216 240 264
Sub
grad
e R
utt
ing
(in
.)
Pavement Age (Months)
ITD
AASHTO 1993
MEPDG
60
65
70
75
80
85
90
95
100
105
110
0 24 48 72 96 120 144 168 192 216 240 264
IRI (
in./
mile
)
Pavement Age (Months)
ITD
AASHTO 1993
MEPDG

Appendix C. Comparison of MEPDG Predicted Distresses and Smoothness at 85 Percent Reliability
163
Figure 173. Comparison of the Predicted Alligator Cracking, SH-19 Project
Figure 174. Comparison of the Predicted Longitudinal Cracking, SH-19 Project
0.0
1.0
2.0
3.0
4.0
5.0
6.0
7.0
8.0
9.0
10.0
0 24 48 72 96 120 144 168 192 216 240 264
Alli
gato
r C
rack
ing
(%)
Pavement Age (Months)
ITD
AASHTO 1993
MEPDG
0
20
40
60
80
100
120
140
160
0 24 48 72 96 120 144 168 192 216 240 264
Lon
gitu
din
al C
rack
ing
(ft/
mile
)
Pavement Age (Months)
ITD
AASHTO 1993
MEPDG

Study of the Effectiveness of ITD Pavement Design Method
164
Figure 175. Comparison of the Predicted Total Rutting, SH-19 Project
Figure 176. Comparison of the Predicted AC Layer Rutting, SH-19 Project
0.00
0.10
0.20
0.30
0.40
0.50
0.60
0 24 48 72 96 120 144 168 192 216 240 264
Tota
l Ru
ttin
g (i
n.)
Pavement Age (Months)
ITD
AASHTO 1993
MEPDG
0.00
0.05
0.10
0.15
0.20
0.25
0.30
0.35
0.40
0 24 48 72 96 120 144 168 192 216 240 264
AC
Ru
ttin
g (i
n.)
Pavement Age (Months)
ITD
AASHTO 1993
MEPDG

Appendix C. Comparison of MEPDG Predicted Distresses and Smoothness at 85 Percent Reliability
165
Figure 177. Comparison of the Predicted Unbound Granular Layer(s) Rutting, SH-19 Project
Figure 178. Comparison of the Predicted Subgrade Layer Rutting, SH-19 Project
0.00
0.05
0.10
0.15
0.20
0.25
0.30
0.35
0.40
0 24 48 72 96 120 144 168 192 216 240 264
Gra
nu
lar
Laye
r R
utt
ing
(in
.)
Pavement Age (Months)
ITD
AASHTO 1993
MEPDG
0.00
0.05
0.10
0.15
0.20
0.25
0.30
0.35
0.40
0 24 48 72 96 120 144 168 192 216 240 264
Sub
grad
e R
utt
ing
(in
.)
Pavement Age (Months)
ITD
AASHTO 1993
MEPDG

Study of the Effectiveness of ITD Pavement Design Method
166
Figure 179. Comparison of the Predicted IRI, SH-19 Project
Figure 180. Comparison of the Predicted Alligator Cracking, US-95 Project
60
65
70
75
80
85
90
95
100
105
110
0 24 48 72 96 120 144 168 192 216 240 264
IRI (
in./
mile
)
Pavement Age (Months)
ITD
AASHTO 1993
MEPDG
0.0
0.5
1.0
1.5
2.0
2.5
3.0
3.5
4.0
4.5
0 24 48 72 96 120 144 168 192 216 240 264
Alli
gato
r C
rack
ing
(%
)
Pavement Age (Months)
ITD
AASHTO 1993
MEPDG

Appendix C. Comparison of MEPDG Predicted Distresses and Smoothness at 85 Percent Reliability
167
Figure 181. Comparison of the Predicted Longitudinal Cracking, US-95 Project
Figure 182. Comparison of the Predicted Total Rutting, US-95 Project
0
2
4
6
8
10
12
14
16
18
0 24 48 72 96 120 144 168 192 216 240 264
Lon
gitu
din
al C
rack
ing
(ft
/mile
)
Pavement Age (Months)
ITD
AASHTO 1993
MEPDG
0.00
0.10
0.20
0.30
0.40
0.50
0.60
0 24 48 72 96 120 144 168 192 216 240 264
Tota
l Ru
ttin
g (
in.)
Pavement Age (Months)
ITD
AASHTO 1993
MEPDG
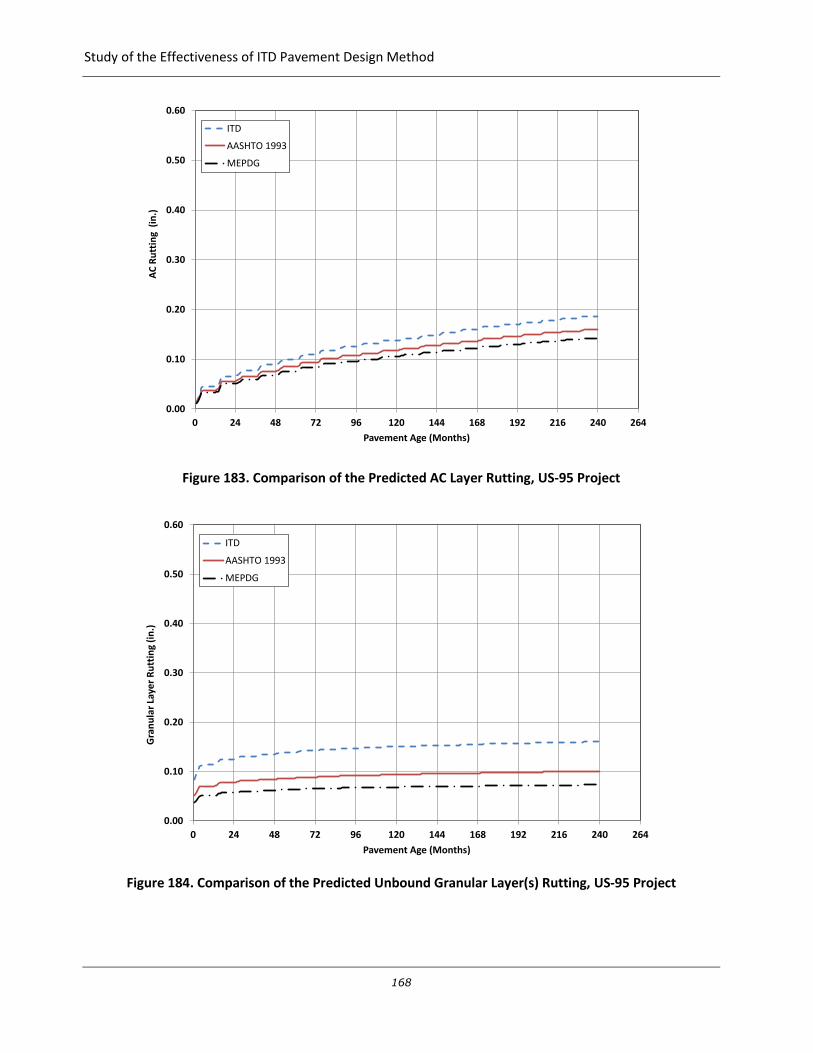
Study of the Effectiveness of ITD Pavement Design Method
168
Figure 183. Comparison of the Predicted AC Layer Rutting, US-95 Project
Figure 184. Comparison of the Predicted Unbound Granular Layer(s) Rutting, US-95 Project
0.00
0.10
0.20
0.30
0.40
0.50
0.60
0 24 48 72 96 120 144 168 192 216 240 264
AC
Ru
ttin
g (
in.)
Pavement Age (Months)
ITD
AASHTO 1993
MEPDG
0.00
0.10
0.20
0.30
0.40
0.50
0.60
0 24 48 72 96 120 144 168 192 216 240 264
Gra
nu
lar
Laye
r R
utt
ing
(in
.)
Pavement Age (Months)
ITD
AASHTO 1993
MEPDG
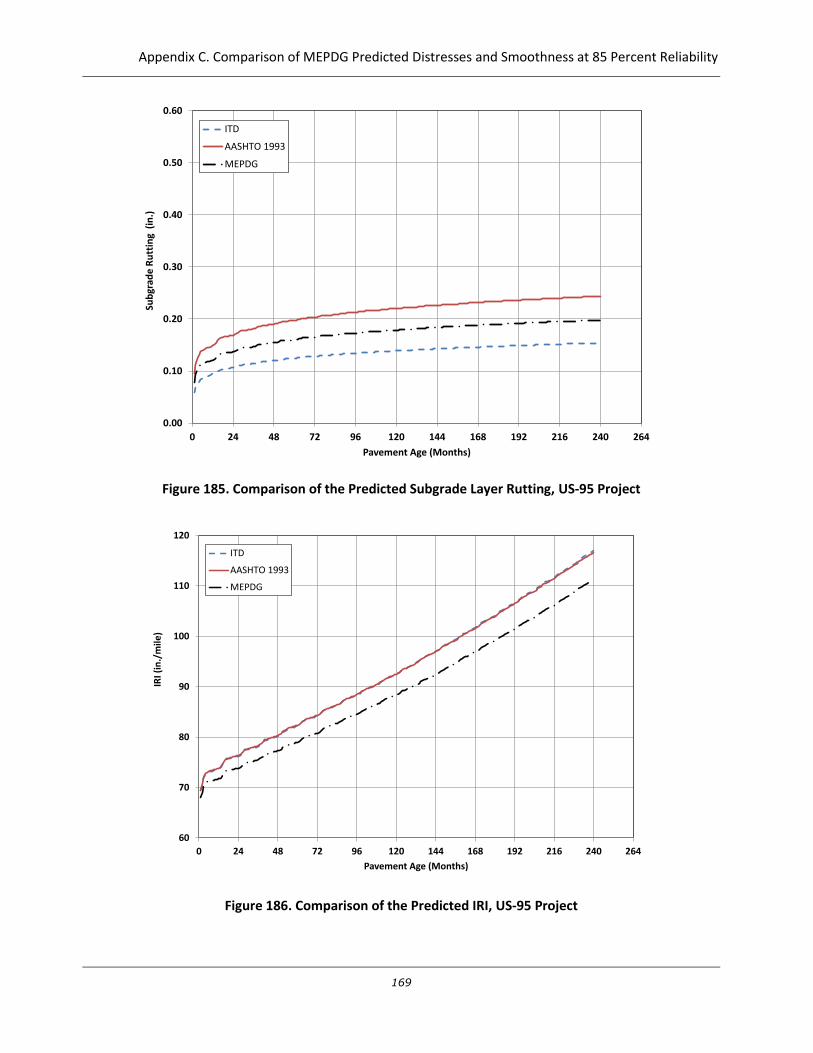
Appendix C. Comparison of MEPDG Predicted Distresses and Smoothness at 85 Percent Reliability
169
Figure 185. Comparison of the Predicted Subgrade Layer Rutting, US-95 Project
Figure 186. Comparison of the Predicted IRI, US-95 Project
0.00
0.10
0.20
0.30
0.40
0.50
0.60
0 24 48 72 96 120 144 168 192 216 240 264
Sub
grad
e R
utt
ing
(in
.)
Pavement Age (Months)
ITD
AASHTO 1993
MEPDG
60
70
80
90
100
110
120
0 24 48 72 96 120 144 168 192 216 240 264
IRI (
in./
mile
)
Pavement Age (Months)
ITD
AASHTO 1993
MEPDG

Study of the Effectiveness of ITD Pavement Design Method
170
Figure 187. Comparison of the Predicted Alligator Cracking, US-93 Project
Figure 188. Comparison of the Predicted Longitudinal Cracking, US-93 Project
0.0
1.0
2.0
3.0
4.0
5.0
6.0
7.0
8.0
9.0
10.0
0 24 48 72 96 120 144 168 192 216 240 264
Alli
gato
r C
rack
ing
(%
)
Pavement Age (Months)
ITD
AASHTO 1993
MEPDG
0
20
40
60
80
100
120
140
0 24 48 72 96 120 144 168 192 216 240 264
Lon
gitu
din
al C
rack
ing
(ft
/mile
)
Pavement Age (Months)
ITD
AASHTO 1993
MEPDG
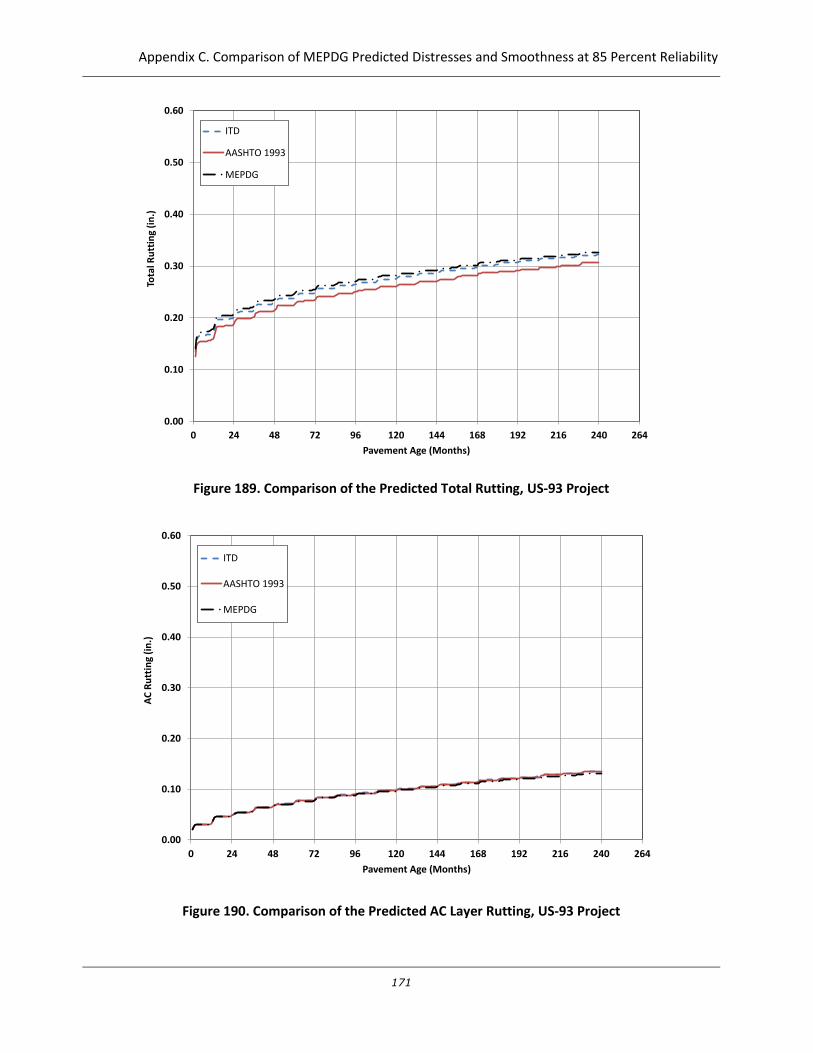
Appendix C. Comparison of MEPDG Predicted Distresses and Smoothness at 85 Percent Reliability
171
Figure 189. Comparison of the Predicted Total Rutting, US-93 Project
Figure 190. Comparison of the Predicted AC Layer Rutting, US-93 Project
0.00
0.10
0.20
0.30
0.40
0.50
0.60
0 24 48 72 96 120 144 168 192 216 240 264
Tota
l Ru
ttin
g (i
n.)
Pavement Age (Months)
ITD
AASHTO 1993
MEPDG
0.00
0.10
0.20
0.30
0.40
0.50
0.60
0 24 48 72 96 120 144 168 192 216 240 264
AC
Ru
ttin
g (i
n.)
Pavement Age (Months)
ITD
AASHTO 1993
MEPDG

Study of the Effectiveness of ITD Pavement Design Method
172
Figure 191. Comparison of the Predicted Unbound Granular Layer(s) Rutting, US-93 Project
Figure 192. Comparison of the Predicted Subgrade Layer Rutting, US-93 Project
0.00
0.10
0.20
0.30
0.40
0.50
0.60
0 24 48 72 96 120 144 168 192 216 240 264
Gra
nu
lar
Laye
r R
utt
ing
(in
.)
Pavement Age (Months)
ITD
AASHTO 1993
MEPDG
0.00
0.10
0.20
0.30
0.40
0.50
0.60
0 24 48 72 96 120 144 168 192 216 240 264
Sub
grad
e R
utt
ing
(in
.)
Pavement Age (Months)
ITD
AASHTO 1993
MEPDG

Appendix C. Comparison of MEPDG Predicted Distresses and Smoothness at 85 Percent Reliability
173
Figure 193. Comparison of the Predicted IRI, US-93 Project
60
65
70
75
80
85
90
95
100
105
110
0 24 48 72 96 120 144 168 192 216 240 264
IRI (
in./
mile
)
Pavement Age (Months)
ITD
AASHTO 1993
MEPDG

Study of the Effectiveness of ITD Pavement Design Method
174

Appendix D. ATR Stations AADT Database
175
Appendix D
ATR Stations AADT Database
ATR Year AADT ATR Year AADT ATR Year AADT ATR Year AADT ATR Year AADT
1 1990 28475 3 1990 7733 5 1990 3623 8 1990 8134 10 1990 4077
1 1991 31213 3 1991 7801 5 1991 3700 8 1991 8596 10 1991 4403
1 1992 33224 3 1992 7956 5 1992 3846 8 1992 9306 10 1992 4951
1 1993 36983 3 1993 8164 5 1993 3871 8 1993 9789 10 1993 5237
1 1994 36922 3 1994 7677 5 1994 3993 8 1994 10199 10 1994 5539
1 1995
3 1995 7890 5 1995 3984 8 1995
10 1995 5701
1 1996
3 1996 8400 5 1996 3968 8 1996 10262 10 1996 5704
1 1997 40812 3 1997 8677 5 1997 4059 8 1997 10358 10 1997
1 1998 42326 3 1998 9018 5 1998 4065 8 1998 10980 10 1998 6053
1 1999 42474 3 1999 9215 5 1999 4364 8 1999 11090 10 1999 6189
1 2000
3 2000 9090 5 2000
8 2000 11050 10 2000 6297
1 2001 43008 3 2001 9025 5 2001 4289 8 2001 11199 10 2001 6536
1 2002 44645 3 2002 9055 5 2002 4422 8 2002 11341 10 2002 6767
1 2003 45531 3 2003 9080 5 2003 4328 8 2003 11430 10 2003 7002
1 2004 47195 3 2004
5 2004 4325 8 2004 11724 10 2004 7190
1 2005 48877 3 2005 8871 5 2005 4415 8 2005
10 2005 7440
1 2006 50615 3 2006 9047 5 2006 4141 8 2006 11406 10 2006 7484
1 2007 50785 3 2007
5 2007 4197 8 2007
10 2007 7679
1 2008 47946 3 2008 9284 5 2008
8 2008 10489 10 2008
1 2009 48603 3 2009 9439 5 2009 4396 8 2009 10976 10 2009 6802
2 1990 13006 4 1990 10303 6 1990 8151 9 1990 5311 11 1990 1426
2 1991 13745 4 1991 10862 6 1991 8356 9 1991 5346 11 1991 1472
2 1992 14962 4 1992 11562 6 1992 8705 9 1992 5476 11 1992 1566
2 1993 15597 4 1993 11974 6 1993 9230 9 1993 6034 11 1993 1568
2 1994 16042 4 1994 12720 6 1994 9312 9 1994 5990 11 1994 1653
2 1995 16776 4 1995 13395 6 1995
9 1995
11 1995 1687
2 1996
4 1996 13591 6 1996 9664 9 1996
11 1996
2 1997
4 1997 14158 6 1997 10149 9 1997 7251 11 1997 1610
2 1998 18779 4 1998
6 1998 10284 9 1998 7345 11 1998 1642
2 1999 19687 4 1999 15310 6 1999 10643 9 1999 7526 11 1999 1680
2 2000 19787 4 2000 15150 6 2000 10342 9 2000 7672 11 2000 1700
2 2001 20163 4 2001 15127 6 2001 10399 9 2001 7823 11 2001 1688
2 2002 20937 4 2002 15659 6 2002 10677 9 2002 8058 11 2002 1634
2 2003 20598 4 2003 15731 6 2003 10541 9 2003 7929 11 2003 1612
2 2004
4 2004 15623 6 2004 10460 9 2004 7813 11 2004 1588
2 2005 20606 4 2005 15529 6 2005 10380 9 2005 8056 11 2005 1522
2 2006 21340 4 2006 15796 6 2006 10294 9 2006 8629 11 2006 1556
2 2007
4 2007 16041 6 2007 10158 9 2007 8527 11 2007 1644
2 2008
4 2008
6 2008
9 2008 7902 11 2008 1457
2 2009 20658 4 2009 15768 6 2009 10391 9 2009 7583 11 2009 1538

Study of the Effectiveness of ITD Pavement Design Method
176
ATR Year AADT ATR Year AADT ATR Year AADT ATR Year AADT ATR Year AADT
12 1990 2292 14 1990 2376 17 1990 1870 19 1990 1824 22 1990 5037
12 1991 2384 14 1991 2352 17 1991 1900 19 1991 1914 22 1991 5367
12 1992 2534 14 1992 2390 17 1992 1951 19 1992 1978 22 1992 5878
12 1993 2662 14 1993 2487 17 1993 1943 19 1993 2062 22 1993 6211
12 1994 2712 14 1994 2640 17 1994 2037 19 1994 2143 22 1994 6537
12 1995 2790 14 1995
17 1995 2073 19 1995 2091 22 1995 6870
12 1996 2716 14 1996 2897 17 1996 1985 19 1996 1969 22 1996 7081
12 1997 2819 14 1997
17 1997 1974 19 1997 2064 22 1997 7348
12 1998 2990 14 1998 3180 17 1998 1942 19 1998 2167 22 1998 7881
12 1999 3208 14 1999 3308 17 1999 2025 19 1999 2200 22 1999 8248
12 2000 3287 14 2000 3450 17 2000 2028 19 2000 2121 22 2000 8223
12 2001 3359 14 2001
17 2001 2021 19 2001 2120 22 2001
12 2002 3428 14 2002 3613 17 2002 2139 19 2002
22 2002
12 2003 3458 14 2003 3668 17 2003 2087 19 2003 2101 22 2003 8716
12 2004 3484 14 2004 3778 17 2004 2057 19 2004 2169 22 2004
12 2005 3546 14 2005 3807 17 2005 1980 19 2005 2064 22 2005 8858
12 2006 3660 14 2006 3911 17 2006 1877 19 2006 2003 22 2006 9017
12 2007 3981 14 2007 3904 17 2007 1986 19 2007 2050 22 2007 9244
12 2008 3740 14 2008 3526 17 2008 1826 19 2008
22 2008 8770
12 2009 3729 14 2009 3400 17 2009 1954 19 2009 1970 22 2009 9391
13 1990 2156 15 1990 1981 18 1990 4501 21 1990 8045 24 1990 13708
13 1991 2099 15 1991 2063 18 1991 4729 21 1991 8653 24 1991 14470
13 1992 2250 15 1992 2246 18 1992 4860 21 1992 9641 24 1992 15105
13 1993 2319 15 1993 2342 18 1993 5207 21 1993 10421 24 1993 15679
13 1994 2656 15 1994 2447 18 1994 5321 21 1994 10850 24 1994 16206
13 1995 2934 15 1995
18 1995 5279 21 1995 11413 24 1995 16940
13 1996 2787 15 1996 2421 18 1996 5473 21 1996 11542 24 1996
13 1997 2832 15 1997 2541 18 1997 5788 21 1997 11750 24 1997 18205
13 1998 2733 15 1998 2585 18 1998 6101 21 1998 12333 24 1998 19257
13 1999 2650 15 1999 2754 18 1999 6252 21 1999 13101 24 1999 20060
13 2000 2742 15 2000
18 2000 6193 21 2000
24 2000 20402
13 2001 2619 15 2001 2598 18 2001 6228 21 2001 13078 24 2001 20250
13 2002 2621 15 2002 2620 18 2002 6439 21 2002 13377 24 2002
13 2003 2707 15 2003 2688 18 2003
21 2003 13657 24 2003 21343
13 2004 2756 15 2004 2768 18 2004 6262 21 2004 14206 24 2004 21095
13 2005 2735 15 2005 2638 18 2005 6299 21 2005 14315 24 2005 20703
13 2006 2688 15 2006 2734 18 2006 6464 21 2006 14804 24 2006 21197
13 2007 2700 15 2007 2763 18 2007 6631 21 2007 15136 24 2007 21837
13 2008 2523 15 2008 2638 18 2008 6201 21 2008
24 2008 20633
13 2009 2545 15 2009
18 2009 6376 21 2009 14074 24 2009 21945

Appendix D. ATR Stations AADT Database
177
ATR Year AADT ATR Year AADT ATR Year AADT ATR Year AADT ATR Year AADT
25 1990 11362 27 1990 1080 29 1990 3211 31 1990 912 34 1990 613
25 1991 11863 27 1991 1127 29 1991 3359 31 1991 932 34 1991 621
25 1992 12788 27 1992 1225 29 1992 3574 31 1992 980 34 1992 665
25 1993 13226 27 1993 1324 29 1993 3588 31 1993 975 34 1993 708
25 1994 13332 27 1994 1344 29 1994 3750 31 1994 1081 34 1994 719
25 1995 14064 27 1995 1423 29 1995
31 1995 1128 34 1995 707
25 1996 14230 27 1996 1434 29 1996 3644 31 1996
34 1996 699
25 1997 14502 27 1997 1452 29 1997 3846 31 1997 1318 34 1997 681
25 1998 15499 27 1998 1461 29 1998 3900 31 1998 1309 34 1998 677
25 1999 16902 27 1999 1456 29 1999 3906 31 1999 1551 34 1999
25 2000 17069 27 2000 1503 29 2000 3803 31 2000 1530 34 2000 646
25 2001 17343 27 2001 1603 29 2001
31 2001 1566 34 2001 644
25 2002 18023 27 2002 1587 29 2002 3872 31 2002 1689 34 2002
25 2003 17976 27 2003 1617 29 2003 3801 31 2003 1711 34 2003
25 2004 17754 27 2004 1621 29 2004 3738 31 2004
34 2004 621
25 2005 17951 27 2005 1599 29 2005 3656 31 2005 1693 34 2005 605
25 2006 18621 27 2006 1607 29 2006 3683 31 2006 1770 34 2006 609
25 2007
27 2007 1593 29 2007 3747 31 2007
34 2007 568
25 2008 17629 27 2008 1363 29 2008 3430 31 2008
34 2008
25 2009 17985 27 2009 1375 29 2009 3455 31 2009 1747 34 2009 594
26 1990 2679 28 1990 1108 30 1990 4279 32 1991 2354 35 1990 1004
26 1991 2848 28 1991 1173 30 1991 4373 32 1992 2478 35 1991 1011
26 1992 3019 28 1992 1238 30 1992 4600 32 1993 2533 35 1992 1096
26 1993 3124 28 1993 1176 30 1993 4638 32 1994 2841 35 1993 1071
26 1994 3362 28 1994 1248 30 1994 5011 32 1995
35 1994 1143
26 1995 3507 28 1995 1246 30 1995 5192 32 1996 2951 35 1995 1132
26 1996 3453 28 1996 1235 30 1996 5258 32 1997 2953 35 1996 1152
26 1997 3359 28 1997 1202 30 1997 5558 32 1998 2921 35 1997 1216
26 1998 3659 28 1998 1224 30 1998 5787 32 1999
35 1998 1264
26 1999 3747 28 1999 1267 30 1999 6137 32 2000 3069 35 1999 1282
26 2000 3633 28 2000 1278 30 2000 6077 32 2001
35 2000 1261
26 2001 3672 28 2001 1348 30 2001 6230 32 2002
35 2001 1318
26 2002 4052 28 2002 1396 30 2002
32 2003 3161 35 2002 1322
26 2003 4048 28 2003 1284 30 2003
32 2004 3232 35 2003 1357
26 2004 4111 28 2004 1247 30 2004 6575 32 2005 3120 35 2004 1276
26 2005 4080 28 2005 1218 30 2005 6786 32 2006 3180 35 2005 1211
26 2006 4103 28 2006 1184 30 2006 6987 32 2007 3359 35 2006 1228
26 2007 4279 28 2007 1170 30 2007 6941 32 2008 3164 35 2007 1280
26 2008 3798 28 2008 1056 30 2008 6582 32 2009
35 2008 1243
26 2009 3711 28 2009 1077 30 2009 6871
35 2009 1299

Study of the Effectiveness of ITD Pavement Design Method
178
ATR Year AADT ATR Year AADT ATR Year AADT ATR Year AADT ATR Year AADT
25 1990 11362 27 1990 1080 29 1990 3211 31 1990 912 34 1990 613
25 1991 11863 27 1991 1127 29 1991 3359 31 1991 932 34 1991 621
25 1992 12788 27 1992 1225 29 1992 3574 31 1992 980 34 1992 665
25 1993 13226 27 1993 1324 29 1993 3588 31 1993 975 34 1993 708
25 1994 13332 27 1994 1344 29 1994 3750 31 1994 1081 34 1994 719
25 1995 14064 27 1995 1423 29 1995
31 1995 1128 34 1995 707
25 1996 14230 27 1996 1434 29 1996 3644 31 1996
34 1996 699
25 1997 14502 27 1997 1452 29 1997 3846 31 1997 1318 34 1997 681
25 1998 15499 27 1998 1461 29 1998 3900 31 1998 1309 34 1998 677
25 1999 16902 27 1999 1456 29 1999 3906 31 1999 1551 34 1999
25 2000 17069 27 2000 1503 29 2000 3803 31 2000 1530 34 2000 646
25 2001 17343 27 2001 1603 29 2001
31 2001 1566 34 2001 644
25 2002 18023 27 2002 1587 29 2002 3872 31 2002 1689 34 2002
25 2003 17976 27 2003 1617 29 2003 3801 31 2003 1711 34 2003
25 2004 17754 27 2004 1621 29 2004 3738 31 2004
34 2004 621
25 2005 17951 27 2005 1599 29 2005 3656 31 2005 1693 34 2005 605
25 2006 18621 27 2006 1607 29 2006 3683 31 2006 1770 34 2006 609
25 2007
27 2007 1593 29 2007 3747 31 2007
34 2007 568
25 2008 17629 27 2008 1363 29 2008 3430 31 2008
34 2008
25 2009 17985 27 2009 1375 29 2009 3455 31 2009 1747 34 2009 594
26 1990 2679 28 1990 1108 30 1990 4279 32 1991 2354 35 1990 1004
26 1991 2848 28 1991 1173 30 1991 4373 32 1992 2478 35 1991 1011
26 1992 3019 28 1992 1238 30 1992 4600 32 1993 2533 35 1992 1096
26 1993 3124 28 1993 1176 30 1993 4638 32 1994 2841 35 1993 1071
26 1994 3362 28 1994 1248 30 1994 5011 32 1995
35 1994 1143
26 1995 3507 28 1995 1246 30 1995 5192 32 1996 2951 35 1995 1132
26 1996 3453 28 1996 1235 30 1996 5258 32 1997 2953 35 1996 1152
26 1997 3359 28 1997 1202 30 1997 5558 32 1998 2921 35 1997 1216
26 1998 3659 28 1998 1224 30 1998 5787 32 1999
35 1998 1264
26 1999 3747 28 1999 1267 30 1999 6137 32 2000 3069 35 1999 1282
26 2000 3633 28 2000 1278 30 2000 6077 32 2001
35 2000 1261
26 2001 3672 28 2001 1348 30 2001 6230 32 2002
35 2001 1318
26 2002 4052 28 2002 1396 30 2002
32 2003 3161 35 2002 1322
26 2003 4048 28 2003 1284 30 2003
32 2004 3232 35 2003 1357
26 2004 4111 28 2004 1247 30 2004 6575 32 2005 3120 35 2004 1276
26 2005 4080 28 2005 1218 30 2005 6786 32 2006 3180 35 2005 1211
26 2006 4103 28 2006 1184 30 2006 6987 32 2007 3359 35 2006 1228
26 2007 4279 28 2007 1170 30 2007 6941 32 2008 3164 35 2007 1280
26 2008 3798 28 2008 1056 30 2008 6582 32 2009
35 2008 1243
26 2009 3711 28 2009 1077 30 2009 6871
35 2009 1299

Appendix D. ATR Stations AADT Database
179
ATR Year AADT ATR Year AADT ATR Year AADT ATR Year AADT ATR Year AADT
36 1990 1246 39 1990 2194 41 1990 5261 43 1990 2484 45 1990 568
36 1991 1277 39 1991 2266 41 1991 5665 43 1991 2683 45 1991 556
36 1992 1362 39 1992 2425 41 1992 6239 43 1992 2928 45 1992 558
36 1993 1383 39 1993 2507 41 1993 6527 43 1993 2898 45 1993 525
36 1994 1345 39 1994 2607 41 1994 7359 43 1994 2858 45 1994 580
36 1995 1363 39 1995
41 1995 7712 43 1995 3095 45 1995 552
36 1996 1366 39 1996 2560 41 1996
43 1996 2996 45 1996 515
36 1997 1402 39 1997 2610 41 1997 7533 43 1997 2909 45 1997 513
36 1998 1462 39 1998 2723 41 1998 7865 43 1998 3023 45 1998 510
36 1999 1487 39 1999 2724 41 1999 7966 43 1999 3005 45 1999 501
36 2000 1507 39 2000 2714 41 2000 8034 43 2000 3079 45 2000 503
36 2001 1518 39 2001 2788 41 2001 8149 43 2001 3077 45 2001 517
36 2002 1915 39 2002 2908 41 2002 8445 43 2002 3208 45 2002 525
36 2003 1883 39 2003 2943 41 2003 8574 43 2003 3393 45 2003 566
36 2004 1428 39 2004 2969 41 2004 8772 43 2004 3780 45 2004 566
36 2005 1420 39 2005 2941 41 2005 8966 43 2005 4138 45 2005 571
36 2006 1391 39 2006 2960 41 2006 9284 43 2006 4324 45 2006 558
36 2007 1486 39 2007 2972 41 2007 9498 43 2007 4325 45 2007 522
36 2008 1359 39 2008 2790 41 2008
43 2008 3579 45 2008 482
36 2009 1248 39 2009 2927 41 2009
43 2009 3495 45 2009 489
38 1990 1364 40 1990 3896 42 1990 1682 44 1990 3616 47 1990 6235
38 1991 1386 40 1991 4133 42 1991 1792 44 1991 3882 47 1991 6051
38 1992 1503 40 1992 4520 42 1992 1964 44 1992
47 1992 6613
38 1993 1442 40 1993 4760 42 1993 2087 44 1993
47 1993 6609
38 1994 1478 40 1994 5214 42 1994 2177 44 1994 4337 47 1994 7062
38 1995
40 1995
42 1995
44 1995 4743 47 1995 7011
38 1996 1357 40 1996 5429 42 1996 2124 44 1996 4924 47 1996
38 1997 1417 40 1997 5768 42 1997 2100 44 1997 4916 47 1997 7418
38 1998 1385 40 1998
42 1998 2248 44 1998 5217 47 1998 7512
38 1999 1422 40 1999 6135 42 1999 2308 44 1999 5435 47 1999 7607
38 2000 1400 40 2000 6386 42 2000 2203 44 2000 5294 47 2000 7201
38 2001 1432 40 2001 6218 42 2001 2227 44 2001 5414 47 2001 7131
38 2002 1524 40 2002 6260 42 2002 2322 44 2002 5676 47 2002 7454
38 2003 1547 40 2003 6433 42 2003 2338 44 2003 5758 47 2003 7560
38 2004 1576 40 2004 6640 42 2004 2388 44 2004 5905 47 2004 7724
38 2005 1651 40 2005 6771 42 2005 2567 44 2005 5876 47 2005 7744
38 2006 1650 40 2006 6787 42 2006 2801 44 2006 5991 47 2006 7719
38 2007 1615 40 2007 6950 42 2007 2840 44 2007 6010 47 2007 7807
38 2008 1457 40 2008 6662 42 2008 2653 44 2008 5590 47 2008 7021
38 2009 1513 40 2009 6795 42 2009
44 2009 5912 47 2009 6882

Study of the Effectiveness of ITD Pavement Design Method
180
ATR Year AADT ATR Year AADT ATR Year AADT ATR Year AADT ATR Year AADT
48 1990
50 1990 1018 53 1990 2238 55 1990 445 57 1990 2234
48 1991
50 1991 1043 53 1991 2121 55 1991 452 57 1991 2428
48 1992 24080 50 1992 1067 53 1992 2253 55 1992 483 57 1992 2404
48 1993 25480 50 1993 1023 53 1993 2529 55 1993 467 57 1993 2391
48 1994 27789 50 1994 1091 53 1994 2543 55 1994 534 57 1994 2470
48 1995
50 1995 1094 53 1995 2883 55 1995 541 57 1995 2179
48 1996 26267 50 1996 1061 53 1996 2862 55 1996 530 57 1996 1963
48 1997 26981 50 1997 1098 53 1997 3128 55 1997 547 57 1997 2011
48 1998
50 1998
53 1998 3097 55 1998 547 57 1998 1957
48 1999 28978 50 1999
53 1999 3055 55 1999 550 57 1999 2085
48 2000 29702 50 2000 1113 53 2000 3106 55 2000 525 57 2000
48 2001 30815 50 2001 1121 53 2001 3257 55 2001 540 57 2001
48 2002 29798 50 2002
53 2002 3196 55 2002 534 57 2002 2139
48 2003 30809 50 2003 1144 53 2003 3143 55 2003 556 57 2003 2227
48 2004 32823 50 2004 1125 53 2004 3157 55 2004 546 57 2004 2269
48 2005 34293 50 2005 1083 53 2005 3153 55 2005 540 57 2005 2307
48 2006 32992 50 2006
53 2006 3266 55 2006 534 57 2006 2207
48 2007 30847 50 2007 1018 53 2007 3181 55 2007 564 57 2007 2359
48 2008 29405 50 2008 952 53 2008 2845 55 2008
57 2008 2111
48 2009
50 2009 966 53 2009 2853 55 2009 555 57 2009
49 1990 1614 51 1990 9775 54 1990 1462 56 1990 432 58 1990 434
49 1991 1604 51 1991 10040 54 1991 1459 56 1991 442 58 1991 444
49 1992 1780 51 1992 11043 54 1992 1513 56 1992 462 58 1992 476
49 1993 1742 51 1993 11356 54 1993 1521 56 1993 448 58 1993 458
49 1994 1850 51 1994 11888 54 1994 1719 56 1994 466 58 1994 502
49 1995 1875 51 1995 12321 54 1995
56 1995 489 58 1995
49 1996 1762 51 1996 12398 54 1996 1759 56 1996 475 58 1996 479
49 1997 1740 51 1997 13416 54 1997 1813 56 1997 511 58 1997 499
49 1998 1866 51 1998 14413 54 1998 1823 56 1998 499 58 1998 519
49 1999
51 1999 14607 54 1999 1871 56 1999 524 58 1999 538
49 2000 1783 51 2000 14535 54 2000
56 2000 540 58 2000 540
49 2001 1879 51 2001 15035 54 2001 1892 56 2001 522 58 2001 551
49 2002
51 2002 16381 54 2002 1864 56 2002 529 58 2002
49 2003 1967 51 2003 17536 54 2003 1907 56 2003 555 58 2003
49 2004 1979 51 2004 18349 54 2004 1880 56 2004 544 58 2004 542
49 2005 1942 51 2005 18546 54 2005 1850 56 2005 508 58 2005 524
49 2006 2008 51 2006 19259 54 2006 1827 56 2006 466 58 2006 506
49 2007 2038 51 2007 19998 54 2007 1903 56 2007 495 58 2007 506
49 2008 1845 51 2008 18549 54 2008 1674 56 2008 463 58 2008 466
49 2009 1931 51 2009 19350 54 2009 1768 56 2009 475 58 2009 502

Appendix D. ATR Stations AADT Database
181
ATR Year AADT ATR Year AADT ATR Year AADT ATR Year AADT ATR Year AADT
59 1990 1324 61 1990 3419 68 1990 8931 80 1990 4142 82 1990 620
59 1991 1352 61 1991 3549 68 1991 8675 80 1991 4413 82 1991 623
59 1992 1455 61 1992 3685 68 1992 8830 80 1992 4653 82 1992 629
59 1993 1444 61 1993 3813 68 1993 7607 80 1993 4906 82 1993 615
59 1994 1575 61 1994 3839 68 1994 9034 80 1994 5266 82 1994 814
59 1995 1746 61 1995 4013 68 1995 10911 80 1995 5471 82 1995
59 1996 1606 61 1996 3998 68 1996 11313 80 1996 5622 82 1996 789
59 1997 1676 61 1997 4295 68 1997 11605 80 1997 3798 82 1997 748
59 1998 1688 61 1998 4397 68 1998 11894 80 1998 3722 82 1998 743
59 1999 1794 61 1999 4509 68 1999 12336 80 1999
82 1999 692
59 2000 1761 61 2000
68 2000 12687 80 2000
82 2000 671
59 2001 1890 61 2001 4572 68 2001 12756 80 2001 3993 82 2001 651
59 2002 1951 61 2002 4753 68 2002 13008 80 2002 3964 82 2002 659
59 2003 1949 61 2003 4916 68 2003 13405 80 2003 4101 82 2003 695
59 2004 1976 61 2004 4875 68 2004
80 2004 4115 82 2004 689
59 2005 2041 61 2005 4770 68 2005 13457 80 2005 4147 82 2005 691
59 2006 2202 61 2006 4834 68 2006 13091 80 2006 4187 82 2006 719
59 2007 2597 61 2007 4923 68 2007 13258 80 2007 4253 82 2007 770
59 2008 2164 61 2008 4695 68 2008 12514 80 2008 4379 82 2008 732
59 2009 2053 61 2009 4886 68 2009
80 2009 4351 82 2009 694
60 1990 3772 67 1990 9026 72 1990 4471 81 1990 350 83 1990 354
60 1991 3909 67 1991 9492 72 1991 4671 81 1991 343 83 1991 467
60 1992 4200 67 1992 9895 72 1992 5035 81 1992 441 83 1992 568
60 1993 4175 67 1993 10176 72 1993 5058 81 1993 405 83 1993 593
60 1994 4099 67 1994 10684 72 1994 5546 81 1994 385 83 1994 689
60 1995
67 1995
72 1995
81 1995
83 1995 746
60 1996 4439 67 1996
72 1996
81 1996 413 83 1996 692
60 1997 4571 67 1997 11492 72 1997 5651 81 1997
83 1997 557
60 1998 4647 67 1998 12079 72 1998
81 1998 373 83 1998 639
60 1999 4812 67 1999 12297 72 1999 5915 81 1999
83 1999 686
60 2000 4889 67 2000 12154 72 2000 6070 81 2000 416 83 2000 685
60 2001
67 2001 12063 72 2001 6077 81 2001 463 83 2001 720
60 2002 4678 67 2002 12300 72 2002
81 2002 435 83 2002 726
60 2003 4663 67 2003
72 2003 6370 81 2003
83 2003 720
60 2004 4519 67 2004 11966 72 2004 6364 81 2004 444 83 2004 709
60 2005 4450 67 2005 11974 72 2005 6392 81 2005 427 83 2005 691
60 2006 4421 67 2006 12070 72 2006 6503 81 2006 414 83 2006 658
60 2007 4580 67 2007 12215 72 2007 6657 81 2007 434 83 2007 677
60 2008
67 2008 11461 72 2008 6101 81 2008
83 2008 623
60 2009 4453 67 2009 11763 72 2009 6320 81 2009 436 83 2009 663
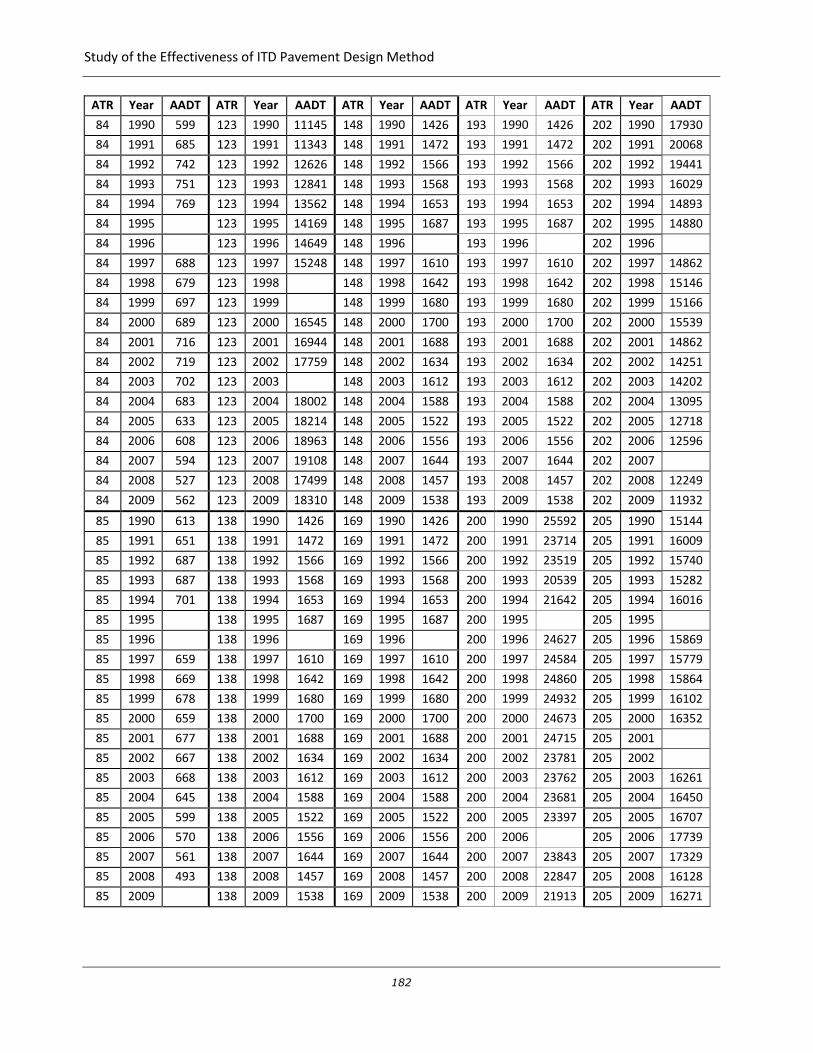
Study of the Effectiveness of ITD Pavement Design Method
182
ATR Year AADT ATR Year AADT ATR Year AADT ATR Year AADT ATR Year AADT
84 1990 599 123 1990 11145 148 1990 1426 193 1990 1426 202 1990 17930
84 1991 685 123 1991 11343 148 1991 1472 193 1991 1472 202 1991 20068
84 1992 742 123 1992 12626 148 1992 1566 193 1992 1566 202 1992 19441
84 1993 751 123 1993 12841 148 1993 1568 193 1993 1568 202 1993 16029
84 1994 769 123 1994 13562 148 1994 1653 193 1994 1653 202 1994 14893
84 1995
123 1995 14169 148 1995 1687 193 1995 1687 202 1995 14880
84 1996
123 1996 14649 148 1996
193 1996
202 1996
84 1997 688 123 1997 15248 148 1997 1610 193 1997 1610 202 1997 14862
84 1998 679 123 1998
148 1998 1642 193 1998 1642 202 1998 15146
84 1999 697 123 1999
148 1999 1680 193 1999 1680 202 1999 15166
84 2000 689 123 2000 16545 148 2000 1700 193 2000 1700 202 2000 15539
84 2001 716 123 2001 16944 148 2001 1688 193 2001 1688 202 2001 14862
84 2002 719 123 2002 17759 148 2002 1634 193 2002 1634 202 2002 14251
84 2003 702 123 2003
148 2003 1612 193 2003 1612 202 2003 14202
84 2004 683 123 2004 18002 148 2004 1588 193 2004 1588 202 2004 13095
84 2005 633 123 2005 18214 148 2005 1522 193 2005 1522 202 2005 12718
84 2006 608 123 2006 18963 148 2006 1556 193 2006 1556 202 2006 12596
84 2007 594 123 2007 19108 148 2007 1644 193 2007 1644 202 2007
84 2008 527 123 2008 17499 148 2008 1457 193 2008 1457 202 2008 12249
84 2009 562 123 2009 18310 148 2009 1538 193 2009 1538 202 2009 11932
85 1990 613 138 1990 1426 169 1990 1426 200 1990 25592 205 1990 15144
85 1991 651 138 1991 1472 169 1991 1472 200 1991 23714 205 1991 16009
85 1992 687 138 1992 1566 169 1992 1566 200 1992 23519 205 1992 15740
85 1993 687 138 1993 1568 169 1993 1568 200 1993 20539 205 1993 15282
85 1994 701 138 1994 1653 169 1994 1653 200 1994 21642 205 1994 16016
85 1995
138 1995 1687 169 1995 1687 200 1995
205 1995
85 1996
138 1996
169 1996
200 1996 24627 205 1996 15869
85 1997 659 138 1997 1610 169 1997 1610 200 1997 24584 205 1997 15779
85 1998 669 138 1998 1642 169 1998 1642 200 1998 24860 205 1998 15864
85 1999 678 138 1999 1680 169 1999 1680 200 1999 24932 205 1999 16102
85 2000 659 138 2000 1700 169 2000 1700 200 2000 24673 205 2000 16352
85 2001 677 138 2001 1688 169 2001 1688 200 2001 24715 205 2001
85 2002 667 138 2002 1634 169 2002 1634 200 2002 23781 205 2002
85 2003 668 138 2003 1612 169 2003 1612 200 2003 23762 205 2003 16261
85 2004 645 138 2004 1588 169 2004 1588 200 2004 23681 205 2004 16450
85 2005 599 138 2005 1522 169 2005 1522 200 2005 23397 205 2005 16707
85 2006 570 138 2006 1556 169 2006 1556 200 2006
205 2006 17739
85 2007 561 138 2007 1644 169 2007 1644 200 2007 23843 205 2007 17329
85 2008 493 138 2008 1457 169 2008 1457 200 2008 22847 205 2008 16128
85 2009
138 2009 1538 169 2009 1538 200 2009 21913 205 2009 16271

Appendix D. ATR Stations AADT Database
183
ATR Year AADT ATR Year AADT ATR Year AADT ATR Year AADT ATR Year AADT
209 1990 32404 212 1990 17795 217 1990 24757 221 1990 13199 224 1990 1116
209 1991 31135 212 1991
217 1991 25488 221 1991 13260 224 1991 1361
209 1992 16983 212 1992
217 1992 28675 221 1992 15632 224 1992
209 1993 15298 212 1993 19731 217 1993 28352 221 1993 15359 224 1993
209 1994 15905 212 1994 20820 217 1994 31480 221 1994 15932 224 1994 2292
209 1995 14817 212 1995 21614 217 1995
221 1995 16939 224 1995 2407
209 1996
212 1996 20991 217 1996
221 1996
224 1996 2477
209 1997 13759 212 1997 20811 217 1997 32955 221 1997 18570 224 1997 2428
209 1998 12453 212 1998 20298 217 1998 35856 221 1998 19051 224 1998 2600
209 1999 13858 212 1999 20909 217 1999 35119 221 1999 20542 224 1999 2742
209 2000 13719 212 2000 20895 217 2000 33938 221 2000 21335 224 2000 3100
209 2001 11960 212 2001 20027 217 2001 34064 221 2001 21665 224 2001 3492
209 2002 11356 212 2002 19176 217 2002 34654 221 2002 27233 224 2002 3862
209 2003 10788 212 2003 19641 217 2003 36968 221 2003 21520 224 2003 4457
209 2004 10686 212 2004 19598 217 2004 37244 221 2004 21891 224 2004 5017
209 2005
212 2005 19541 217 2005 37698 221 2005 23528 224 2005 5708
209 2006 12592 212 2006
217 2006 38586 221 2006 27455 224 2006 7101
209 2007 12534 212 2007 19550 217 2007
221 2007
224 2007
209 2008 12139 212 2008 18901 217 2008 36430 221 2008
224 2008 6106
209 2009 11986 212 2009 18591 217 2009 34415 221 2009 19127 224 2009 6110
210 1990 29972 213 1990 31652 218 1990 18978 223 1990 3359 225 1990 1294
210 1991 14621 213 1991 35425 218 1991 20302 223 1991 3086 225 1991 1785
210 1992 26804 213 1992 37769 218 1992 20327 223 1992 4333 225 1992 1613
210 1993 19105 213 1993 41097 218 1993 20719 223 1993 4011 225 1993 1641
210 1994 19852 213 1994 42607 218 1994 22359 223 1994 4228 225 1994 1721
210 1995
213 1995 43309 218 1995 25125 223 1995 4468 225 1995 2095
210 1996 19790 213 1996
218 1996 22717 223 1996 4782 225 1996 2247
210 1997 19626 213 1997 44856 218 1997 20890 223 1997 4701 225 1997 2990
210 1998 19552 213 1998
218 1998 20545 223 1998 5066 225 1998 2793
210 1999 18833 213 1999 44690 218 1999 21541 223 1999
225 1999
210 2000 17845 213 2000 42987 218 2000 25981 223 2000 5598 225 2000 3757
210 2001 17410 213 2001 31802 218 2001 25883 223 2001 5838 225 2001 4141
210 2002 16728 213 2002 27657 218 2002 27113 223 2002 5533 225 2002 4567
210 2003 13968 213 2003 27861 218 2003 26971 223 2003 6384 225 2003 4887
210 2004 15272 213 2004 26243 218 2004
223 2004 7134 225 2004 4967
210 2005 15614 213 2005
218 2005 26480 223 2005 7972 225 2005 5106
210 2006 15665 213 2006 26471 218 2006 26396 223 2006 10265 225 2006 5927
210 2007 15572 213 2007 26004 218 2007 26307 223 2007 7117 225 2007 6332
210 2008 14891 213 2008 24867 218 2008 24988 223 2008 6823 225 2008 5943
210 2009 14717 213 2009 24324 218 2009 25173 223 2009 6101 225 2009 6758
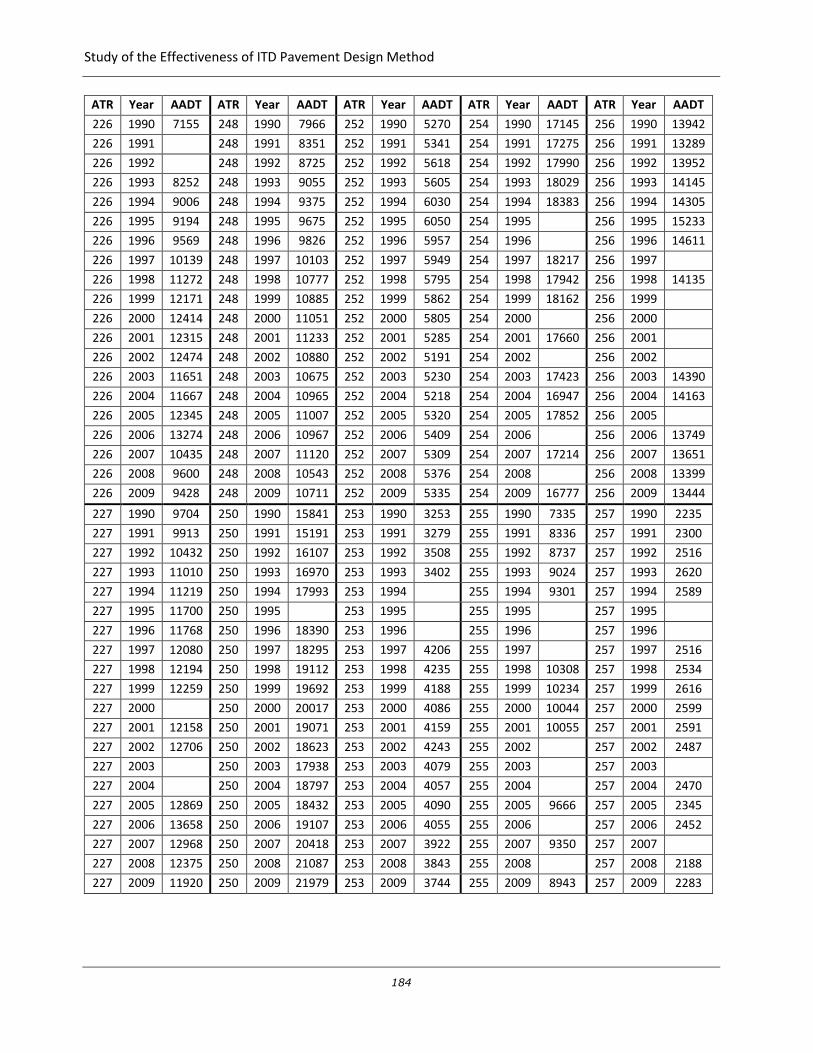
Study of the Effectiveness of ITD Pavement Design Method
184
ATR Year AADT ATR Year AADT ATR Year AADT ATR Year AADT ATR Year AADT
226 1990 7155 248 1990 7966 252 1990 5270 254 1990 17145 256 1990 13942
226 1991
248 1991 8351 252 1991 5341 254 1991 17275 256 1991 13289
226 1992
248 1992 8725 252 1992 5618 254 1992 17990 256 1992 13952
226 1993 8252 248 1993 9055 252 1993 5605 254 1993 18029 256 1993 14145
226 1994 9006 248 1994 9375 252 1994 6030 254 1994 18383 256 1994 14305
226 1995 9194 248 1995 9675 252 1995 6050 254 1995
256 1995 15233
226 1996 9569 248 1996 9826 252 1996 5957 254 1996
256 1996 14611
226 1997 10139 248 1997 10103 252 1997 5949 254 1997 18217 256 1997
226 1998 11272 248 1998 10777 252 1998 5795 254 1998 17942 256 1998 14135
226 1999 12171 248 1999 10885 252 1999 5862 254 1999 18162 256 1999
226 2000 12414 248 2000 11051 252 2000 5805 254 2000
256 2000
226 2001 12315 248 2001 11233 252 2001 5285 254 2001 17660 256 2001
226 2002 12474 248 2002 10880 252 2002 5191 254 2002
256 2002
226 2003 11651 248 2003 10675 252 2003 5230 254 2003 17423 256 2003 14390
226 2004 11667 248 2004 10965 252 2004 5218 254 2004 16947 256 2004 14163
226 2005 12345 248 2005 11007 252 2005 5320 254 2005 17852 256 2005
226 2006 13274 248 2006 10967 252 2006 5409 254 2006
256 2006 13749
226 2007 10435 248 2007 11120 252 2007 5309 254 2007 17214 256 2007 13651
226 2008 9600 248 2008 10543 252 2008 5376 254 2008
256 2008 13399
226 2009 9428 248 2009 10711 252 2009 5335 254 2009 16777 256 2009 13444
227 1990 9704 250 1990 15841 253 1990 3253 255 1990 7335 257 1990 2235
227 1991 9913 250 1991 15191 253 1991 3279 255 1991 8336 257 1991 2300
227 1992 10432 250 1992 16107 253 1992 3508 255 1992 8737 257 1992 2516
227 1993 11010 250 1993 16970 253 1993 3402 255 1993 9024 257 1993 2620
227 1994 11219 250 1994 17993 253 1994
255 1994 9301 257 1994 2589
227 1995 11700 250 1995
253 1995
255 1995
257 1995
227 1996 11768 250 1996 18390 253 1996
255 1996
257 1996
227 1997 12080 250 1997 18295 253 1997 4206 255 1997
257 1997 2516
227 1998 12194 250 1998 19112 253 1998 4235 255 1998 10308 257 1998 2534
227 1999 12259 250 1999 19692 253 1999 4188 255 1999 10234 257 1999 2616
227 2000
250 2000 20017 253 2000 4086 255 2000 10044 257 2000 2599
227 2001 12158 250 2001 19071 253 2001 4159 255 2001 10055 257 2001 2591
227 2002 12706 250 2002 18623 253 2002 4243 255 2002
257 2002 2487
227 2003
250 2003 17938 253 2003 4079 255 2003
257 2003
227 2004
250 2004 18797 253 2004 4057 255 2004
257 2004 2470
227 2005 12869 250 2005 18432 253 2005 4090 255 2005 9666 257 2005 2345
227 2006 13658 250 2006 19107 253 2006 4055 255 2006
257 2006 2452
227 2007 12968 250 2007 20418 253 2007 3922 255 2007 9350 257 2007
227 2008 12375 250 2008 21087 253 2008 3843 255 2008
257 2008 2188
227 2009 11920 250 2009 21979 253 2009 3744 255 2009 8943 257 2009 2283

Appendix D. ATR Stations AADT Database
185
ATR Year AADT
264 1990 46263
264 1991 50538
264 1992 53057
264 1993 52405
264 1994 52325
264 1995
264 1996
264 1997 62617
264 1998 66817
264 1999 68958
264 2000 71662
264 2001 72205
264 2002 71836
264 2003 71632
264 2004 72735
264 2005 73992
264 2006
264 2007
264 2008 66672
264 2009
272 1990 3538
272 1991 3624
272 1992 3548
272 1993 3779
272 1994 4197
272 1995 4407
272 1996 4672
272 1997 4851
272 1998 5485
272 1999 5538
272 2000 5661
272 2001 5867
272 2002 6316
272 2003 6406
272 2004 6937
272 2005 8187
272 2006 9136
272 2007 9549
272 2008 8547
272 2009 8567