study of mutual improvement of completed weathered
TRANSCRIPT

Study of Mutual Improvement of Completed Weathered Phyllite and Red ClayBased on Neutralization Effects of Swelling and Shrinkage Deformation
Xiushao Zhao1, Qijing Yang1,2,*, Jianglong Rao1, Daxin Geng1 and Zhouyong Tan1
1Engineering Research & Development Centre for Underground Technology of Jiangxi Province, East China Jiaotong University,Nanchang, 330013, China2Arcadis AustraliaPacific Pty Ltd., Sydney, Australia*Corresponding Author: Qijing Yang. Email: [email protected]
Received: 19 January 2021 Accepted: 19 February 2021
ABSTRACT
Completely weathered phyllite (CWP) soil is a kind of special soil with high swell potential, while red clay is aspecial soil with high shrinkage. This means that these two kinds of special soils are usually not suitable for directuse as subgrade fill. To reduce the swell index of the CWP soil and the shrinkage of red clay at the same time, itwas proposed to blend the CWP soil with red clay to improve their basic characteristics. A series of swell indextests and dry-wet cycle tests of the blended soils have been carried out at varying blending ratios, compactioncoefficients and moisture contents. The test results show that the free swell index of the blended soil decreaseswith the increase of red clay, moisture content and compaction coefficient, respectively. The fissure density ofthe blended soil first decreases and then increases with the blending ratio, with the lowest being zero whenthe blending ratio is ranging from 20% to 40%. Through particle microscopic analysis and elemental compositionanalysis, it is found that the neutralization effect, the dilution effect of swell minerals, and the partition effect ofcoarse particles play an important role in restraining expansion and shrinkage deformation of the blended soil.Based on the liquid limit requirement of Chinese Railway Design Code (TB 10001-2016), the optimal blendingratio of red clay has been proposed to be 50%. Compared with the CWP soil, the free load swell index of theblended soil is reduced by 45.0% and the fissure density is reduced by 99.3% compared with that of red clay.Therefore, it is feasible to improve the CWP soil by blending it with red clay at an optimal ratio of 50% by usingthe neutralization effect of the expansion of CWP and shrinkage of red clay.
KEYWORDS
Completely weathered phyllite; red clay; swell index; fissure density; neutralization effect; blending improvement method
1 Introduction
The completed weathered phyllite (CWP) soil and red clay are widely distributed in south China, includingJiangxi Province and Zhejiang Province. The CWP soil is the product of complete weathering of phyllite andhas a high level of expansibility when soaking [1−3]. Moisture content and mineral components havesignificant effects on physical and mechanical properties of phyllite [4,5]. X-ray fluorescence (XRF), X-raydiffraction (XRD), transmission electron microscopy (TEM) and scanning electron microscopy (SEM) areoften used to detect the mineral components or micro-structure of phyllite [6].
This work is licensed under a Creative Commons Attribution 4.0 International License, whichpermits unrestricted use, distribution, and reproduction in any medium, provided the originalwork is properly cited.
DOI: 10.32604/jrm.2022.015854
ARTICLE
echT PressScience
Subgrade fill with red clay is often subjected to dry-wet cyclic process due to periodical variations inmoisture content, leading to development of fissures within the soil matrix [7]. Fissures resulting fromshrinkage can lead to reduction of the shear strength [8−11]. Therefore, lime [12], cement [13], sand [14],polymer [15] or fiber [16,17] have been used by many researchers to treat red clay to reduce itsshrinkage. An optimum ratio of clay to sand was proposed after considering both the shrinkage andcompressive strength results [18].
Both weathered phyllite and red clay are not suitable for the direct use as subgrade fill material due totheir high moisture content, high liquid limit and high shrinkage. These two kinds of soils are often classifiedas unsuitable without any improvement. Therefore, lime or cement is often used to stabilize weatheredphyllite, and some engineering properties of weathered phyllite have been enhanced [19−22]. However,production of lime and cement will not only require a lot of energy, but also cause substantial airpollution [23,24]. Furthermore, the cementation process usually needs a long time to be fulfilled [25],which is often not convenient for rapid subgrade construction using locally won soils. Recently a newblending method of the CWP soil with red clay at an optimal ratio has been proposed by Zhao et al. toeffectively improve the shear strength of the subgrade [26].
In recent years, as more and more governmental authorities attach great importance to environmentalprotection, some high energy consuming industries producing reinforcement agents are restricted, whichleads to a rapid rise in the price of reinforcement agents such as cement and lime [27−29]. Furthermore,with the increase of unsuitable soil disposal resulting from rapid development of infrastructures such asrailway and highway construction, it is of vital importance to find a new way of re-using natural butpoor-quality site won materials for subgrade fill during construction.
The traditional improvement method of enhancing unsuitable soils such as CWP soil and red clay entailsusing cement and lime as a reinforcement agent. This has attracted many researchers and has become widelyaccepted in the construction industry over the past few decades. In this paper, an improvement method basedon deformation neutralization effects of CWP and red clay has been proposed so that the strength of theblended CWP soil with red clay can meet the minimum requirements of subgrade set out by the currentcode of practice. That is, the use of an appropriate amount of red clay will be able to stabilize the CWPsoil by reducing its expansibility. Simultaneously, CWP will reduce the fissure rate of red clay, thusproviding mutual enhancements of the basic characteristics of these two kinds of unsuitable soils. Theresearch findings of this paper indicate that this new improvement method will enable the use ofrenewable materials for subgrade for railway and highways in large scale construction, hence reducingthe use of cement and/or lime, resulting in savings in energy consumption and emission reduction.
2 Laboratory Investigations
2.1 Experimental Material and Blending Ratio DesignThe completed weathered phyllite (CWP) soil and red clay in this study were obtained from south of
Nanchang City, Jiangxi Province, China. The basic physical properties of CWP and red clay are shown inTab. 1, and all tests were undertaken in accordance with the code for soil test of railway engineering (TB10102-2010) [30].
The shear strength of CWP can be greatly and rapidly improved by adding red clay into CWP at variousblending ratios [26]. The experimental proportioning method was designed as follows: Based on the dryweight of CWP soil (m0 ) and a blending ratio (λ), a portion of red clay at 0%, 20%, 40%, 60%, 80% and100% was added into phyllite soil, respectively. The blending ratio, λ = 0% represents pure CWP and100% pure red clay. The four blending ratios, λ = 20%, 40%, 60% and 80% respectively, represent thedry weight ratio of CWP soil to red clay being at 5:1, 5:2, 5:3 and 5:4, respectively.
204 JRM, 2022, vol.10, no.1

In order to study the influence of initial moisture content (w0), compaction coefficient (K), and blendingratio (λ), on the performance of a blended soil, it was necessary to consider the design of these key parametersfor sampling and laboratory testing. Considering the permitted variation of wop ± 2% by ChineseRailway Code-TB 10001-2016, the moisture contents of test samples were set as 16%, 18% and 20%,respectively, and the compaction coefficients (K) were selected to be at 89%, 91% and 93%, respectively.
2.2 Swell TestsThe swell tests of the blended soils of CWP with red clay include free swell index test and free load swell
index test.
Free swell index (δef) is the ratio of the increased volume to the original volume of the soil sample whenimmersed in water without any constraint. The instrument used in this test is a 50 ml measuring cylinder, andthe volume after expansion is determined by observing the scale of the cylinder at the interface of soil andliquid after stabilization.
The free load swell index (δep) is defined as the ratio of the deformation caused by the vertical expansionof the soil sample to the original height of the sample under the condition of no overlying load but with lateralrestraint. The equipment used for δep test was the WZ-2 type dilatometer manufactured by Nanjing SoilInstrument Factory, in which the diameter of sample was 61.8 mm and the height 20 mm. After thesample was prepared, pure water was poured into the water tank of the WZ-2 dilatometer, with the watersurface being maintained 5 mm above the top surface of the sample. During this soaking process, the dialgauge reading was taken once every 2 h until the difference between two readings is less than 0.01 mm.The total expansion deformation, Dh, was recorded and then the free load swell index is calculated as theratio of Dh to the original height of the sample (20.0 mm).
2.3 Dry-Wet Cycle TestRailway subgrade engineering generally requires compaction at the optimum moisture content (wop),
and the degree of compaction is not less than 91%. As such test samples were prepared as follows: Initialmoisture content (w0) is 18%, compaction degree (K) is 91%, diameter is 152 mm, and height is 100 mm.
To simulate the maximum ground surface temperature of about 55°C in Nanchang in summer, thesamples were continuously dried for 12 h in an oven at 55°C. After 12 h, the drying process wascompleted by measuring the weight of the sample every hour until its weight unchanged, and themoisture content reaches soaking moisture content (wsat). The wetting process was completed by placingthe sample in a tank for 12 h soaking, which simulates continuous rainfall events in Nanchang City,Jiangxi Province, China. The drying and wetting process is a complete dry-wet cycle test. According tothis method, each sample was tested for 1, 2, 3, 4, 5 and 6 dry-wet cycles. The moisture content of dry-wet cycle path is shown in Fig. 1.
Table 1: The basic physical properties indexes of CWP and red clay
Name
of soils
Particle size component content (%) Liquid limit (%) Plastic limit (%) Plasticity
index
Natural moisture
content (%)
Relative density Natural density
(g.cm-3)Sand group
>0.075 mm
Silt group
0.005–0.075 mm
Clay group
<0.005 mm
CWP 29 54.5 16.5 43.3 28.9 14.4 8.48 2.76 2.01
Red clay 2 72.8 25.2 48.4 26.4 22.0 22.31 2.69 1.81
JRM, 2022, vol.10, no.1 205

Based on the dry-wet cycle path of Fig. 1, the surface of the sample was photographed after each dry-wetcycle was completed. In doing so, the change pattern of fissure development can be obtained after eachdry-wet cycle.
3 Factors Affecting Swell Indexes
3.1 Blending Ratio Affecting on Swell IndexThe free swell index test results show that the free swell index of the CWP soil is 21.5%, and that of red
clay is 6.0%. The variation of free swell index with blending ratio is shown in Fig. 2.
The free swell index of the blended soil is lower than 40%, which is the threshold of the expansive soilclassification parameter. It can be seen from Fig. 2 that the blended soil is non-expansive soil and has thepotential to be used as subgrade fill. As demonstrated in Fig. 2, the free swell index of the blended soildecreases approximately linearly with the increase of the blending ratio, with the correlation between δefand λ being shown in Eq. (1).
def ¼ �0:1671�þ 22:0238 (1)
When the blending ratio of red clay to CWP is 40%, the free swell index is reduced by 27.9%, which isvery beneficial to control the swelling deformation of CWP soil.
3.2 Analysis of Influencing Factors of Free Load Swell Index3.2.1 Effect of Soaking Time on the Free Load Swell Index
Taking blended soil samples with w0 = 18% and K = 89% as examples, the relationship between the freeload swell index (δep) and time (in hours) is shown in Fig. 3.
It can be seen from Fig. 3 that the blended soil swells rapidly after being soaked in water, and most of theexpansion occurs within 0.5 h. Taking the CWP soil as an example, 85.7% of the final swell was attained at
1 2 3 4 5
w0
wsat
Dry-wet cycle times
Dry process
Wet process
6
Moi
stur
e co
nten
tFigure 1: Dry-wet cycle path diagram
δef = - 0.1671 λ + 22.0238
R2 = 0.9860
0
5
10
15
20
25
0 20 40 60 80 100
Blending ratio (%)
Free
sw
ell i
ndex
(%
)
Figure 2: Variation of free swell index with blending ratio
206 JRM, 2022, vol.10, no.1

0.5 h, 91.0% at 1 h, and the expansion was quasi-stable at 4 h. It can be seen from the test results that the swelldeformation can be completed in a relatively short period of time after soaking in water. Therefore,waterproof measures should be taken in the construction of subgrade in rainy season to avoid swellingand subsequent reduction or loss of shear strength.
3.2.2 The Influence of Blending Ratio on Free Load Swell IndexIn order to study the influence of blending ratio on δep, the relationship between δep and λ was studied
experimentally when the moisture content w0 = 16%, 18% and 20%, and the results are shown in Fig. 4.
As shown in Fig. 4, δep decreases with the increase of λ. When λ = 0%, w0 = 16%, and K = 89%, δepreaches the maximum of 20.2%; When λ = 100%, w0 = 20% and K = 93%, δep is 1.5% and the smallest.Taking the sample with w0 = 18% and K = 91% as examples, the maximum δep is about 10.6 times of theminimum value, so adding red clay into CWP soil can greatly reduce the swell performance of the CWPsoil. Through data regression analysis, it can be concluded that the free load swell index decreasesquadratically with the increase of red clay blending ratio, and the correlation can be expressed by Eq. (2).
dep ¼ a�2 þ b�þ c (2)
In Eq. (2): a, b and c are quadratic function fitting coefficients.
The fitted quadratic curve is shown in Fig. 4, and the fitting coefficients and correlation coefficients areranging from 0.978 to 0.997, as shown in Tab. 2.
0
5
10
15
20
0 1 2 3 4 5 6
Time(hours)
λ = 0%
λ = 20%
λ = 40%
λ = 60%
λ = 80%
λ = 100%
Free
load
sw
ell i
ndex
(%)
Figure 3: The relationship between δep and time (w0 = 18%, K = 91%)
(c)
0
5
10
15
20
25
0 20 40 60 80 100
89
91
93
K (%)
(a) (b)
0
5
10
15
20
25
0 20 40 60 80 100
Blending ratio (%)
89
91
93
K (%)
0
5
10
15
20
25
0 20 40 60 80 100
Blending ratio (%)
89
91
93
K (%)
Free
load
sw
ell i
ndex
(%
)
Free
load
sw
ell i
ndex
(%
)
Blending ratio (%)
Free
load
sw
ell i
ndex
(%
)
Figure 4: The variation law of δep – λ (a) w0 = 16% (b) w0 = 18% (c) w0 = 20%
JRM, 2022, vol.10, no.1 207
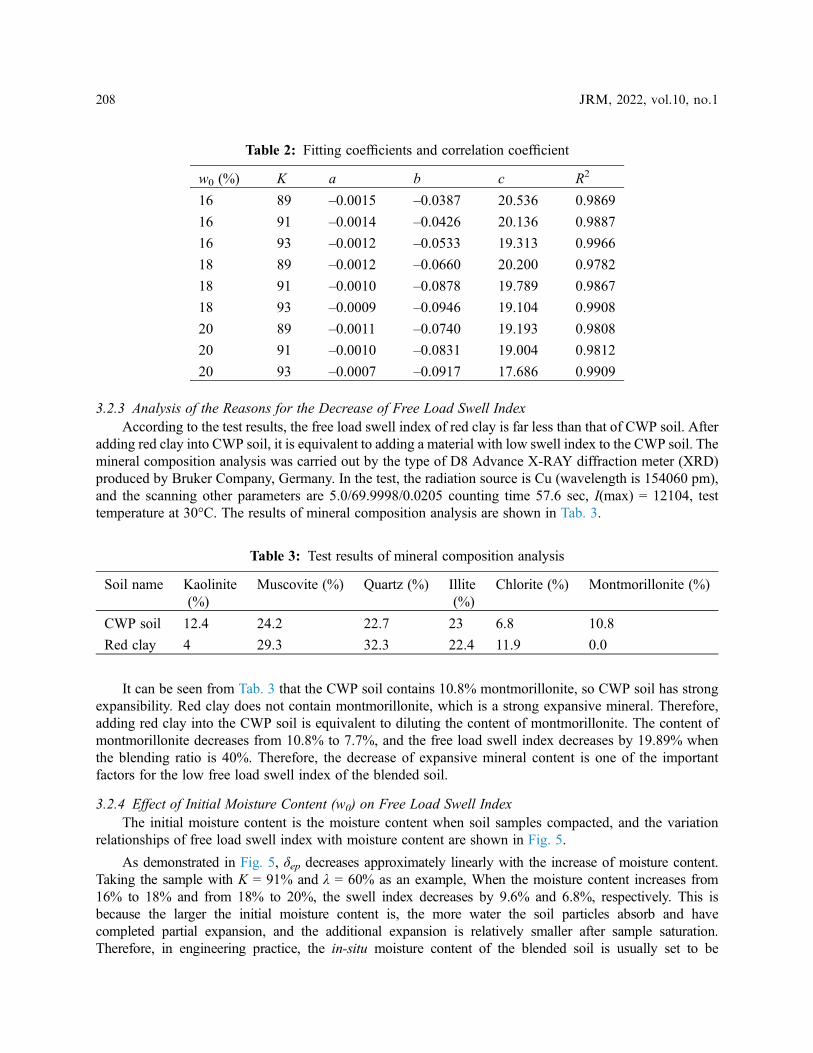
3.2.3 Analysis of the Reasons for the Decrease of Free Load Swell IndexAccording to the test results, the free load swell index of red clay is far less than that of CWP soil. After
adding red clay into CWP soil, it is equivalent to adding a material with low swell index to the CWP soil. Themineral composition analysis was carried out by the type of D8 Advance X-RAY diffraction meter (XRD)produced by Bruker Company, Germany. In the test, the radiation source is Cu (wavelength is 154060 pm),and the scanning other parameters are 5.0/69.9998/0.0205 counting time 57.6 sec, I(max) = 12104, testtemperature at 30°C. The results of mineral composition analysis are shown in Tab. 3.
It can be seen from Tab. 3 that the CWP soil contains 10.8% montmorillonite, so CWP soil has strongexpansibility. Red clay does not contain montmorillonite, which is a strong expansive mineral. Therefore,adding red clay into the CWP soil is equivalent to diluting the content of montmorillonite. The content ofmontmorillonite decreases from 10.8% to 7.7%, and the free load swell index decreases by 19.89% whenthe blending ratio is 40%. Therefore, the decrease of expansive mineral content is one of the importantfactors for the low free load swell index of the blended soil.
3.2.4 Effect of Initial Moisture Content (w0) on Free Load Swell IndexThe initial moisture content is the moisture content when soil samples compacted, and the variation
relationships of free load swell index with moisture content are shown in Fig. 5.
As demonstrated in Fig. 5, δep decreases approximately linearly with the increase of moisture content.Taking the sample with K = 91% and λ = 60% as an example, When the moisture content increases from16% to 18% and from 18% to 20%, the swell index decreases by 9.6% and 6.8%, respectively. This isbecause the larger the initial moisture content is, the more water the soil particles absorb and havecompleted partial expansion, and the additional expansion is relatively smaller after sample saturation.Therefore, in engineering practice, the in-situ moisture content of the blended soil is usually set to be
Table 2: Fitting coefficients and correlation coefficient
w0 (%) K a b c R2
16 89 –0.0015 –0.0387 20.536 0.9869
16 91 –0.0014 –0.0426 20.136 0.9887
16 93 –0.0012 –0.0533 19.313 0.9966
18 89 –0.0012 –0.0660 20.200 0.9782
18 91 –0.0010 –0.0878 19.789 0.9867
18 93 –0.0009 –0.0946 19.104 0.9908
20 89 –0.0011 –0.0740 19.193 0.9808
20 91 –0.0010 –0.0831 19.004 0.9812
20 93 –0.0007 –0.0917 17.686 0.9909
Table 3: Test results of mineral composition analysis
Soil name Kaolinite(%)
Muscovite (%) Quartz (%) Illite(%)
Chlorite (%) Montmorillonite (%)
CWP soil 12.4 24.2 22.7 23 6.8 10.8
Red clay 4 29.3 32.3 22.4 11.9 0.0
208 JRM, 2022, vol.10, no.1

slightly higher than the optimum moisture content, which is beneficial to control the swell index of general fillafter saturation.
3.2.5 Influence of Compaction Coefficient K on δepThe variation relationships of free load swell index with compaction coefficient are shown in Fig. 6.
As demonstrated in Fig. 6, δep decreases approximately linearly with the increase of compactioncoefficient. The larger the compaction coefficient of fine-grained soil, the higher the cohesive force [26]of soil matrix is, requiring a greater force to overcome the expansion.
3.2.6 Analysis of the Influence of w0, K and λ on δepFrom the previous analysis, the free load swell index δep has a quadratic function relationship with λ, and
has a linear relationship with w0 and K. The relationship among δep and w0, K and λ can be obtained by usingExcel’s regression method. The 95% confidence level is adopted, and the results are shown in Eq. (3).
dep ¼ �0:417w0 � 0:281K � 0:0011�2 � 0:070�þ 52:471 (3)
When Eq. (3) is used to predict the free load swell index of each blended soil, the average relative error is11.7%. When the blending ratio is less than or equal to 80%, the prediction accuracy is better. When theblending ratio is 100%, the maximum relative error reaches 108%, noting the relative error between thepredicted value and the measured value is very large. This is because the maximum free load swell index
(a) (b) (c)
0
5
10
15
20
25
16 18 20
0
20
40
60
80
100
Moisture content (%)
λ (%)
0
5
10
15
20
25
16 18 20
0 20
40 60
80 100
Moisture content (%)
λ (%)
0
5
10
15
20
25
16 18 20
0
20
40
60
80
100
Moisture content (%)
λ (%)
Free
load
sw
ell i
ndex
(%
)
Free
load
sw
ell i
ndex
(%
)
Free
load
sw
ell i
ndex
(%
)
Figure 5: The variation law of δep- w0 (a) K = 89% (b) K = 91% (c) K = 93%
(a) (b) (c)
0
5
10
15
20
25
89 91 93
Compaction coefficient (%)
0
20
40
60
80
100
0
5
10
15
20
25
89 91 93
Compaction coefficient (%)
0
20
40
60
80
1000
5
10
15
20
25
89 91 93
Compaction coefficient (%)
0
20
40
60
80
100
Free
load
sw
ell i
ndex
(%
)
Free
load
sw
ell i
ndex
(%
)
Free
load
sw
ell i
ndex
(%
)λ (%) λ (%) λ (%)
Figure 6: The variation law of δep- K (a) w0 = 16% (b) w0 = 18% (c) w0 = 20%
JRM, 2022, vol.10, no.1 209

of the red clay itself is only 1.8%. When the absolute error is small, it may cause a large relative error. As thepurpose of this research is to investigate the engineering properties of blended soils rather than the expansionof pure red clay, nine sets of data have been considered for regression analysis, with 100% blending ratio ofred clay being discarded. Regression analysis of the data shows that the analysis and prediction model can beexpressed by Eq. (4).
dep ¼ �0:477w0 � 0:320K � 0:0018�2 � 0:023�þ 54:810 (4)
The absolute and relative errors of δep are shown in Fig. 7. In Fig. 7, N is test number.
The maximum absolute error between the estimated value and the measured value calculated by Eq. (4)is 1.25%, with the maximum relative error of 12.96%, the average relative error of 4.18%, and the correlationcoefficient of 0.985. From the point of view of fitting error, it is feasible to use Eq. (4) to predict the amount offree load swell index of blended soils with different blending ratios.
3.3 Influencing Factors of Fissure Development of Blended SoilRed clay is a kind of typical soil with fissures caused by moisture change and shrinkage. When water
penetrates the subgrade through the fissures, the strength of subgrade will be greatly reduced.
The fissure density is often used to evaluate the evolution of the micro-structure within the red clay afterthe dry-wet cycle [31,32]. The fissure density is often defined as the ratio of the total area of fissures on thesurface to the cross-sectional area of the test sample. Thus it is often calculated by Eq. (5) below:
dfA ¼Pn
i¼1Ai
A� 100% (5)
where δfA is the fissure density, A is the cross-sectional area of sample, Ai is the area occupied by the ith
fissure, and the n is the total number of fissures observed.
Fissure density calculation method can be realized by programming. Firstly, the color image is convertedinto black and white two-color image by algorithm, and the fissure density is calculated by the proportion ofblack and white pixels. For specific calculation method, refer to reference [33].
Fissure length index is another important parameter reflecting the degree of fissure development. Thelonger the fissure length per unit area, the higher the degree of fissure development is. Fissure lengthindex can be defined as the total length of fissure per unit area, which can be expressed by Eq. (6).
(a) (b)
Δ2
-1.5
-1
-0.5
0
0.5
1
1.5
0 10 20 30 40 50
N
-15
-10
-5
0
5
10
15
0 10 20 30 40 50
N
Δ1
Figure 7: δep absolute error and relative error (excluded red clay) (a) δep absolute error (b) δep relative error
210 JRM, 2022, vol.10, no.1

dfL ¼Pn
i¼1Li
A� 100% (6)
where δfL is the fissure length index, Li is the length of the i-th fissure, A is the cross-sectional area of sampleand n is the total number of fissures observed.
During dry-wet cycles, some blended soil samples produced irregular fissures on the surface, and it isdifficult to count the length of fissures by traditional methods. It can be measured by AutoCAD multi-segment line tracking method, and then the actual length of cracks can be obtained by unit conversion [33].
The factors that affect the fissure development include diameter of the sample, blending ratio, moisturecontent, compaction coefficient, dry-wet cycles and so on, which are discussed in the following sections.
3.3.1 Effect of Sample Diameter on Fissure DevelopmentIn all blended soils, red clay has the largest number of fissures developed, so red clay samples were used
to illustrate the influence of sample diameter on the fissure development. The diameters of samples preparedin laboratory are 61.8 mm, 100.0 mm, and 152.0 mm, respectively, and the shrinkage fissures developed withdifferent sample diameters are shown in Figs. 8a–8c.
By comparing the fissure development between the samples in laboratory and subgrade in field (seeFig. 8d), the sample with greater diameter was found to better simulate the actual subgrade situation.Therefore, the statistical analysis was based on samples with a diameter of 152 mm in this research.
Figure 8: Comparison of fissure development between test sample and subgrade (a) d = 61.8 mm (b)d = 100 mm (c) d = 152 mm (d) Fissures development in subgrade
JRM, 2022, vol.10, no.1 211

3.3.2 Effect of Dry-Wet Cycles on Fissure DensityThe fissure density of blended soil samples increases with the increase of dry-wet cycles, but after five
drying and wetting cycles, as shown in Fig. 9, the fissure density tends to reach an asymptote without anyappreciable increase by the 6th cycle.
3.3.3 Characteristics of Fissure Development in Blended SoilAccording to the results of dry-wet cycle test, the fissure development of laboratory test soil sample
nearly stopped after five dry-wet cycles, and the sixth test was taken as the result of blended soil fissures.After six dry-wet cycles, the fissure development status of the blended soil samples with differentblending ratios is shown in Fig. 10.
As can be seen from Fig. 10, the fissure development can be divided into the following three Types.Type I)-Many isolated pores induced by expansion: When the blending ratio is 0% (pure CWP soil), dueto the relatively large swell index of the CWP soil, there are some bulging holes on the surface of thesample. After six drying and wetting cycles, the bulging holes remain on the surface of the sample,forming some discontinuous holes, as shown in Fig. 10a. Type II)-No detectable fissure type: When the
0
10
20
30
40
0 1 2 3 4 5 6 7
Number of dry-wet cycles
λ = 60%
λ = 80 %
λ = 100%
λ = 0%
Fiss
ure
dens
ity (
%)
Figure 9: Variation of fissure density with dry-wet cycles
Figure 10: Final fissure diagram of the sample at different blend ratios (a) λ = 0% (b) λ = 20% (c) λ = 40%(d) λ = 60% (e) λ = 80% (f) λ = 100%
212 JRM, 2022, vol.10, no.1

blending ratio was 20%, 40%, 60%, there was no detectable fissures after six times dry-wet cycles (see Figs.10b–10d. Type III)-Extensive fissure type: When the blending ratio is at 80% and 100%, there are largenumber of fissures developed on the surface of the sample after six dry-wet cycles. A mesh-like networkof fissures is evident on the surface, and two larger fissures with a width of more than 7 mm observed ata blending ratio of 100%, as shown in Figs. 10e and 10f.
3.3.4 Influence of Blending Ratio on Fissure DensityBy analyzing the fissure density of the blended soil with 6 different blending ratios after 6 dry-wet
cycles, the relationship between the fissure density and the the blending ratio can be obtained for theblended soils, as shown in Fig. 11.
During dry-wet cycles, a large number of bulging holes remain on the surface of the CWP soil samples(Fig. 10a), which can also be regarded as a channel for water immersion into subgrade, and thus can beregarded as a form of fissure. As shown in Fig. 11, the fissure density of red clay can reach 33.64% andthat of the CWP soil can reach 7.51%, and the fissure density decreases first and then increases with theincrease of blending ratio. When the blending ratio are 20% and 40%, there is no visible fissures onthe surface of the samples, so the fissure density is virtually zero. When the blending ratio of red clay inthe blended soil is reduced from 100% to 80% and 60%, the fissure density decreases to 15.63% and0.476%, respectively, which is 53.54% and 98.59% lower than that of red clay. Therefore, it can beinferred that after adding red clay into the CWP soil, the fissure density is significantly reduced, and theswell deformation of the CWP soil can also be reduced at the same time.
3.3.5 Effect of Blending Ratio of Red Clay on Fissure Length IndexThe variation of fissure length index with blending ratio is shown in Fig. 12.
0
10
20
30
40
0 20 40 60 80 100
Blending ratio (%)
Fiss
ure
dens
ity (
%)
Figure 11: Variation of fissure density with blending ratios in blended soils
0
10
20
30
0 20 40 60 80 100
Blending ratio (%)
Fiss
ure
leng
th in
dex
(mm
.cm
-2)
Figure 12: Variation law of fissure length index with blending ratios
JRM, 2022, vol.10, no.1 213

It can be seen from Fig. 10a that the CWP soil is a discontinuous hole due to expansion, and the hole hasdiscontinuity, so the fissure length index is not counted. As shown in Fig. 12, the fissure length index of purered clay is 20.15 mm/cm2. When the bending ratio of red clay is reduced from 100% to 80% and 60%, thefissure length index is reduced to 9.50 mm/cm2 and 0.43 mm/cm2, respectively, which are 51.60% and97.88% lower than that of pure red clay. When the bending ratio is reduced to 40% and 20%, the fissurelength index decreases to zero. Therefore, in view of the fissure development against the blending ratios,the best blending ratio is 20% and 40%, and the reduction in fissure length index of the blended soil isalso very significant with a blending ratio 60%.
4 Discussion of Neutralization Effects
4.1 Effects on Decrease of Swell Property of CWP SoilThe chemical reactions in ion exchange follow the law of mass action, but the reactions are restricted
by the number of exchange sites on the mineral and by the strength of the bonding of the exchangeablecations to the mineral surface [34], Ordinary high valence cations can exchange low valence cations ofsoil and make the diffusion layer thinner [35−37]. The test results of element content analysis of theCWP soil and red clay are shown in Tab. 4, and the analysis shows that the iron content in red clay ismuch higher than that in the CWP soil. When the CWP soil is blended with red clay, a certain amount ofiron ions (Fe3+) can be precipitated from the red clay under certain conditions, which can exchange withthe CWP soil. Fe3+ replaces K+ in montmorillonite and illite, making the diffusion layer of expansivemineral particles in the CWP soil thinner, greatly reducing the free swell index of the CWP soil andreducing the liquid limit of CWP soil. In addition, according to the above, the free swell index of redclay is far less than that of the CWP soil. Adding red clay into CWP soil is equivalent to diluting thecontent of expansive minerals, which is also an important reason for reducing the free swell index.
4.2 Effects on Decrease of Fissure Development in Red ClayAccording to the dry-wet cycle test results, the fissure density of blended soil samples is far less than that
of red clay. Further there is no visible fissure developed in the soil samples when the blending ratio of red clayis between 20% and 40%. The CWP soil has strong expansibility after soaking, and it still retains the originalswell deformation after dry-wet cycles (see Fig. 10a). On the contrary, red clay has strong shrinkage,resulting in a lot of developed fissures resided in the soil matrix after dry-wet cycles. After blending theCWP soil with red clay, expansion of the CWP soil and shrinkage deformation of red clay producesneutralization effects, resulting in far lower rates of fissure development in the blended soil than that ofpure red clay.
Table 4: Quantitative analysis of elements content
Red clay CWP soil
Elements Mass percent (%) Oxide Oxide percentage (%) Elements Mass percent (%) Oxide Oxide percentage (%)
O 31.98 – O 54.89 –
Al 18.88 Al2O3 17.05 Mg 0.33 MgO 0.62
Si 27.18 SiO2 23.57 Al 12.49 Al2O3 27.48
K 5.9 K2O 3.68 Si 23.83 SiO2 59.25
Fe 16.06 Fe2O3 7.0 K 2.42 K2O 2.56
Fe 6.04 Fe2O3 10.09
214 JRM, 2022, vol.10, no.1

The other reason for the decrease of fissure development is that the particle size of the CWP soil is largerthan that of red clay, resulting in contraction and tension isolation effect. The characteristics of the particleswere measured by the JSM 6701F type field emission scanning electron microscope with energyspectrometer produced by Japan Electronics Company. Fig. 13 shows the SEM images of CWP soilparticles and red clay particles in the blended soil (λ = 80%) with magnification of 2,000 times and10,000 times, respectively. According to the analysis results in the Fig. 13, the grain size of the CWP soilis ranging from 10 µm to 45 µm, and that of red clay 1 µm to 4 µm. According to the previous research,adding sand into red clay can significantly reduce the fissure density of red clay [14]. In the blended soil,it is equivalent to adding coarser CWP soil particles into the red clay, and the proportion of the CWP soilparticles in the blended soil is prevalent, thus the connection interfaces among most of the red clay particleshas been cut off by CWP particles. The shrinkage stresses caused by the contraction of red clay particlesare also reduced accordingly, resulting in less fissure development comparing with that of pure clay.
4.3 Determination of Optimum Blending RatioThe high liquid limit clay has poor water stability, easy to expand and soften when meeting water,
therefore, the liquid limit value is an important standard for filler selection in China Railway Code (TB10001-2016) [38]. The liquid plastic limit test results of mixed soil are shown in Tab. 5.
Figure 13: Comparison of micro particle size of blended soil (λ = 80%) (a) 2000x (b) 10000x
Table 5: Test results of liquid plastic limit of mixed soil
Blending ratio (%) Plastic limit (%) Liquid limit (%) Plasticity index
0 (pure CWP) 28.9 43.3 14.4
20 24.4 39.6 15.3
40 23.1 37.1 14.0
60 25.0 42.6 17.6
80 24.8 44.3 19.4
100 (pure red clay) 26.4 48.4 22.0
JRM, 2022, vol.10, no.1 215

Considering that the requirement of liquid limit is less than 40% in the code TB 10001-2016, theblending ratio of red clay should be in a controlled range from 13% to 52% [26]. The free load swellindex decreases with the increase of the blending ratio, and the bearing capacity of the compactedsubgrade increases with the increase of the blending ratio when the blending ratio is in the range of 13%–
52%. The fissure density of blended soil can be ignored when the blending ratio is in the range of 20%–
60%. Therefore, the optimum blending ratio can be considered as 52%, and the applied optimumblending ratio can be taken as 50% for ease of engineering applications. Under the conditions of themoisture content of subgrade compaction is 18%; the compaction coefficient is 91%; and the blendingratio is 50%, it can be obtained from the analysis of the test results that the free load swell index is10.5%; fissure density is 0.238% and the fissure length index is 38.8 mm/cm2. According to the data inthis research, the free load swell index of the CWP soil is reduced by about 45% and the fissure densityis reduced by 99.3% compared with that of red clay. Therefore, the free load swell index and shrinkagecan be effectively suppressed by considering the blending ratio of 50%.
In summary, the neutralization effects of expansion deformation of the CWP soil and shrinkagedeformation of red clay can not only reduce the expansion, but also the fissure development of a blendedsoil. This improves the overall performance of the blended soil when immersed in water. Furthermore,the liquid limit of the blended soil has been found to be less than 40%, meaning it is now classified asgroup C fill as per railway code. Use of the blended soil will thus reduce the disposal volume ofunsuitable materials of both CWP and red clay with liquid limits of more than 40%. The in-situ trial testresults also show that the shear strength and bearing capacity of the CWP soil can be greatly improvedby adding red clay into CWP [26]. This blending method can achieve a higher bearing capacityimmediately after rolling compaction is completed, which is fundamentally different from the traditionallime and cement stabilization methods which need a certain curing time to achieve the higher strength.
5 Conclusions
Through this experimental research, the following conclusions can be drawn:
(1) The free load swell index (δep) of the blended soil decreases with the increase of the blending ratio ina quadratic function and decreases almost linearly with the increase of the compaction coefficient and themoisture content. If the blending ratio of 100% (pure red clay) is removed, a generalized mathematicalmodel can be established for variation of δep with λ, K, and w0. It is found that an increase in blendingratio, compaction coefficient, and moisture content is beneficial to control δep of the blended soil.
(2) Red clay easily develops fissures under the action of dry-wet cycles, and the fissure density can reach 33.4%for the tested samples. The fissure density is greatly reduced when the CWP soils are blended with red clay. Thefissure density is reduced by 100% relative to the red clay when the blending ratio ranges between 20% and 40%,and the fissure density of the blended soil is relatively reduced by 97.88% when the blending ratio is 60%.
(3) Through the blending of the CWP soil with red clay, the swell and shrinkage deformations have beenneutralized to a certain extent. That is, the swell index of the CWP soil is reduced, and the fissuredevelopment of the red clay is also greatly reduced simultaneously. Based on the liquid limit of theblended soil required in the Chinese railway code, the optimum blending ratio of 50% has been proposedfor practical applications. Under the condition of λ = 50%, δep of the blended soil is reduced by 45%relative to the CWP soil, and the fissure density is reduced by 99.3% relative to the pure red clay.
(4) This research has shown that it is feasible to use the neutralization effect of expansion and contractionof two unsuitable soils to suppress the free load swell index of the CWP soil and fissure development densityof red clay. The results also show that the shear strength of the blended soil at the proposed optimum blendingratio of 50% for roadbed can meet the requirements of the subgrade standard. As such, the improvementmethod by means of neutralizing the CWP soil and red clay will not only greatly reduce the amount of
216 JRM, 2022, vol.10, no.1

disposal of two unsuitable soils but also the amount of lime and/or cement used in the conventionalstabilization method. This will reduce costs while significantly increasing environmental benefits.
Funding Statement: This work is supported by the National Natural Science Foundation of China(Grant Nos. 52068027, 51668018, 51768021).
Conflicts of Interest: The authors declare that they have no conflicts of interest to report regarding thepresent study.
References1. Liu, F. F., Mao, X. S., Zhang, H., Liu, L., Wu, Q. (2020). Investigating the deformation property of weathered
phyllite filling subgrade. Journal of Testing and Evaluation, 48(5), 20170743. DOI 10.1520/JTE20170743.
2. Feng, W., Huang, R., Li, T. (2012). Deformation analysis of a soft-hard rock contact zone surrounding a tunnel.Tunnelling and Underground Space Technology, 32(4), 190–197. DOI 10.1016/j.tust.2012.06.011.
3. Phartiyal, B., Sharma, A. (2009). Soft−sediment deformation structures in the late quaternary sediments of ladakh:Evidence for multiple phases of seismic tremors in the north western himalayan region. Journal of Asian EarthSciences, 34(6), 761–770. DOI 10.1016/j.jseaes.2008.11.008.
4. Li, X. Z., Wang, G. F., Cao, L. (2014). Test research on influence of water and mineral composition on physical andmechanical properties of phyllite. Applied Mechanics and Materials, 496, 2398–2401. DOI 10.4028/www.scientific.net/AMM.496−500.2398.
5. Hu, K., Feng, Q., Wang, X. (2017). Experimental research on mechanical property of phyllite tunnel surroundingrock under different moisture state. Geotechnical and Geological Engineering, 35(1), 303–311. DOI 10.1007/s10706-016-0107-6.
6. Garzón, E., Sánchez, P. J., Romero, E. (2010). Physical and geotechnical properties of clay phyllites. Applied ClayScience, 48(3), 307–318. DOI 10.1016/j.clay.2009.12.022.
7. Du, B., Bai, H. B., Wu, G. M. (2019). Dynamic compression properties and deterioration of red−sandstone subjectto cyclic wet−dry treatment. Journal of Advances in Civil Engineering, 2(1), 1–9. DOI 10.30659/jacee.2.1.01-14.
8. Zhao, Y. L., Gao, Y., Zhang, Y. L., Jia, Y. S. (2018). Effect of fines on the drying crack resistance of composite soilstabilizer−stabilized gravel soil. Road Materials and Pavement Design, 20(6), 1255–1274. DOI 10.1080/14680629.2018.1439766.
9. Subhradeep, D., Monowar, H. (2018). The strength behaviour of lime−stabilized plastic fibre−reinforced clayeysoil. Road Materials and Pavement Design, 20(8), 1757–1778. DOI 10.1080/14680629.2018.1468803.
10. Tirupan, M., Tuncer, B. E., James, M. T. (2017). Study on flexural strength, modulus, and fatigue cracking ofcementitiously stabilized materials. Road Materials and Pavement Design, 19(7), 1546–1562. DOI 10.1080/14680629.2017.1325772.
11. Xu, Y. W., David, J. W., Mehdi, S. (2020). Investigation of shear strength of interface between roadbase andgeosynthetics using large−scale single−stage and multi−stage direct shear test. Road Materials and PavementDesign, 21(6), 1588–1611. DOI 10.1080/14680629.2018.1561378.
12. Stoltz, G., Cuisinier, O., Masrouri, F. (2012). Multi−scale analysis of the swelling and shrinkage of a lime−treatedexpansive clayey soil. Applied Clay Science, 61(4), 44–51. DOI 10.1016/j.clay.2012.04.001.
13. Sabir, B. B., Wild, S., Bai, J. (2001). Metakaolin and calcined clays as pozzolans for concrete: A review. Cementand Concrete Composites, 23(6), 441–454. DOI 10.1016/S0958-9465(00)00092-5.
14. Omidi, G. H., Prasad, T. V., Thomas, J. C., Brown, K. W. (1996). The influence of amendments on the volumetricshrinkage and integrity of compacted clay soils used in landfill liners.Water, Air, and Soil Pollution, 86(1−4), 263–274. DOI 10.1007/BF00279161.
15. Azzam, W. R. (2014). Utilization of polymer stabilization for improvement of clay microstructures. Applied ClayScience, 93(3), 94–101. DOI 10.1016/j.clay.2014.03.006.
16. Fatahi, B., Le, T. M., Fatahi, B., Khabbaz, H. (2013). Shrinkage properties of soft clay treated with cement andgeofibers. Geotechnical and Geological Engineering, 31(5), 1421–1435. DOI 10.1007/s10706-013-9666-y.
JRM, 2022, vol.10, no.1 217

17. Zhang, D. B., Zhang, Y., Cheng, T. (2018). Measurement of grass root reinforcement for copper slag mixed soilusing improved shear test apparatus and calculating formulas. Measurement, 118(1), 14–22. DOI 10.1016/j.measurement.2018.01.005.
18. Emiroğlu, M., Yalama, A., Erdoğdu, Y. (2015). Performance of ready−mixed clay plasters produced with differentclay/sand ratios. Applied Clay Science, 115, 221–229. DOI 10.1016/j.clay.2015.08.005.
19. Garzón, E., Cano, M., O’Kelly, B. C., O’Kelly, B. C., Sanchez, P. J. (2015). Phyllite clay-cement compositeshaving improved engineering properties and material applications. Applied Clay Science, 114(9), 229–233. DOI10.1016/j.clay.2015.06.006.
20. Garzón, E., Cano, M., O’Kelly, B. C., Sanchez, P. J. (2016). Effect of lime on stabilization of phyllite clays.Applied Clay Science, 123(9), 329–334. DOI 10.1016/j.clay.2016.01.042.
21. de Oliveira, T. F., Beck,M. H., Escosteguy, P. V., Bortoluzzi, E. C., Modolo,M. L. (2015). The effect of the substitution ofhydrated lime with phyllite on mortar quality. Applied Clay Science, 105(1), 113–117. DOI 10.1016/j.clay.2014.12.028.
22. Garzón, E., Sánchez−Soto, P. J. (2015). An improved method for determining the external specific surface area andthe plasticity index of clayey samples based on a simplified method for non−swelling fine−grained soils. AppliedClay Science, 115, 97–107. DOI 10.1016/j.clay.2015.07.015.
23. Zhang, S., Worrell, E., Crijnsgraus, W. (2015). Evaluating co-benefits of energy efficiency and air pollutionabatement in China’s cement industry. Applied Energy, 147, 192–213. DOI 10.1016/j.apenergy.2015.02.081.
24. Michael, E. B., Stefanie, H. (2010). Identifying improvement potentials in cement production with life cycleassessment. Environmental Science & Technology, 44(23), 9143–9149. DOI 10.1021/es100771k.
25. Yao, K., Chen, Q. S., Xiao, H. W., Liu, Y. (2020). Small−strain shear modulus of cement−treated marine clay.Journal of Materials in Civil Engineering, 32(6), 04020114. DOI 10.1061/(ASCE)MT.1943-5533.0003153.
26. Zhao, X. S., Fu, Z. T., Yang, Q. J., Yao, K., Geng, D. X. et al. (2020). Subgrade fill strength and bearingcharacteristics of weathered phyllite blended with red clay. Road Materials and Pavement Design, 3(4), 1–20.DOI 10.1080/14680629.2020.1773906.
27. Gu, Z. H., Fang, A. G., Hua, S. D., Zhao, Q. Z., Sun, L. D. et al. (2021). Development of a soil stabilizer for roadsubgrade based on original phosphogypsum. Journal of Renewable Materials, 9(2), 253–268. DOI 10.32604/jrm.2021.011912.
28. Li, W., Gao, S. (2018). Prospective on energy related carbon emissions peak integrating optimized intelligentalgorithm with dry process technique application for China’s cement industry. Energy, 165(1), 33–54. DOI10.1016/j.energy.2018.09.152.
29. Shan, Y., Liu, Z., Guan, D. (2016). CO2 emissions from China’s lime industry. Applied Energy, 166, 245–252. DOI10.1016/j.apenergy.2015.04.091.
30. Ministry of Railways of the People’s Republic of China (2010). Code for soil test of railway engineering (TB10102−2010). China Railway Publishing House, Beijing, China.
31. Li, J. H., Zhang, L. M., Wang, Y., Fredlund, D. G. (2009). Permeability tensor and representative elementaryvolume of saturated cracked soil. Canadian Geotechnical Journal, 46(8), 928–942. DOI 10.1139/T09-037.
32. Kishné, A. S., Morgan, C. L., Miller, W. L. (2009). Vertisol crack extent associated with gilgai and soil moisture in theTexas Gulf Coast Prairie. Soil Science Society of America Journal, 73(4), 1221–1230. DOI 10.2136/sssaj2008.0081.
33. Zhao, X. S., Wang, Z. Y., Chen, K. S., Yang, Q. J. (2020). Measurement and calculation of fissure area and densityfor shrinkage soil. Earth and Environmental Science, 560, 012088. DOI 10.1088/1755.
34. Carroll, D. (1959). Ion exchange in clays and other minerals. GSA Bulletin, 70(6), 749–779. DOI 10.1130/0016.
35. Vasil’ev, N. G., O’vcharenko, F. D. (1977). The chemistry of the surfaces of the acid forms of natural layersilicates. Russian Chemical Reviews, 46(8), 775–788. DOI 10.1070/RC1977v046n08ABEH002172.
36. Meunier, A., Lanson, B., Velde, B. (2004). Composition variation of illite−vermiculite smectite mixed−layerminerals in a bentonite bed from Charente. Clay Minerals, 39(3), 317–332. DOI 10.1180/0009855043930137.
37. Yakovleva, A. A., Tu, V. D. (2012). Ion exchange on clay minerals from some deposits of Irkutsk region. RussianJournal of Applied Chemistry, 85(3), 348–351. DOI 10.1134/S1070427212030044.
38. Ministry of Railways of the People’s Republic of China (2016). Code for design of railway earth structure (TB10001−2016). China Railway Publishing House, Beijing, China.
218 JRM, 2022, vol.10, no.1