study of enhanced college advising in upward bound
TRANSCRIPT

U.S. Department of Education October 2018
Study of Enhanced College Advising in Upward Bound:
Impacts on Steps Toward College
Alina Martinez Mathematica Policy Research
Tamara Linkow Hannah Miller
Amanda Parsad Abt Associates

This page has been left blank for double–sided copying.

Study of Enhanced College Advising in Upward Bound:
Impacts on Steps Toward College
October 2018
Alina Martinez Mathematica Policy Research
Tamara Linkow Hannah Miller Amanda Parsad Abt Associates
Marsha Silverberg Project Officer Institute of Education Sciences
NCEE 2019-4002 U.S. DEPARTMENT OF EDUCATION

U.S. Department of Education
Betsy DeVos
Secretary
Institute of Education Sciences
Mark Schneider
Director
National Center for Education Evaluation and Regional Assistance
October 2018
This report was prepared for the Institute of Education Sciences under Contract ED-IES-12-C-0087. The project officer is Marsha Silverberg in the National Center for Education Evaluation and Regional Assistance.
IES evaluation reports present objective information on the conditions of implementation and impacts of the programs being evaluated. IES evaluation reports do not include conclusions or recommendations or views with regard to actions policymakers or practitioners should take in light of the findings in the report.
This report is in the public domain. Authorization to reproduce it in whole or in part is granted. While permission to reprint this publication is not necessary, the citation should read: Martinez, A., Linkow, T., Miller, H., & Parsad, A. (2018). Study of Enhanced College Advising in Upward Bound: Impacts on Steps Toward College (NCEE 2019-4002). Washington, DC: National Center for Education Evaluation, Institute of Education Sciences, U.S. Department of Education.
This report is available on the Institute of Education Sciences website at http://ies.ed.gov/ncee.
Alternate Formats: Upon request, this report is available in alternate formats, such as Braille, large print, audiotape, or computer diskette. For more information, please contact the Department’s Alternate Format Center at 202-260-9895 or 202-205-8113.
CONTENTS
First Report: Enhanced College Advising in Upward Bound ▌pg. i
Acknowledgements .................................................................................................................................... iv
Disclosure of Potential Conflicts of Interest ............................................................................................. v
Executive Summary ................................................................................................................................... vi
1. Overview: Studying a Strategy for Enhanced College Advising to Improve CollegeOutcomes in Upward Bound ......................................................................................................... 1 1.1 Rationale: Concern about College Selectivity and Undermatch ............................................ 1 1.2 Upward Bound: A Federal College Access Program Seeking to Improve College
Outcomes ............................................................................................................................... 4 1.3 Find the Fit: A Research-Based Approach to Enhance College Advising ............................ 5
1.3.1 Addresses Three Key Challenges through Research-Based Approaches ................. 6 1.3.2 Comprises Three Components .................................................................................. 7
1.4 Study Design: Evaluating the Effectiveness of Find the Fit ................................................ 10 1.4.1 Conceptual Framework for the Study ..................................................................... 10 1.4.2 Projects and Students in the Study Sample ............................................................. 11 1.4.3 Random Assignment: Dividing Projects into a Treatment and a Control Group .... 14 1.4.4 Data Sources ........................................................................................................... 14 1.4.5 Measures of Interim Outcomes and Implementation .............................................. 16 1.4.6 Analytic Methods .................................................................................................... 17
2. Effects on Early Indicators of College Going ............................................................................ 20
3. Implementation of the Enhanced College Advising Strategy .................................................. 35
4. Looking Ahead ............................................................................................................................. 41
References .................................................................................................................................................. 42

CONTENTS
First Report: Enhanced College Advising in Upward Bound ▌pg. ii
Exhibits
Exhibit ES: Impact of Find the Fit on Early Indicators of College Going ................................................. vii Exhibit 1.1: College Academic Undermatch Nationally among 2004 High School Graduating Seniors, by Socioeconomic Status ................................................................................................................ 2 Exhibit 1.2: Upward Bound Required Services ............................................................................................ 4 Exhibit 1.3: Percentage of College-Going Upward Bound Seniors Who Enrolled at the Institution Hosting their Upward Bound Project, by Type of Host Institution .............................................................. 5 Exhibit 1.4: Content in Find the Fit Components Mapped to the Three Challenges Addressed by Find the Fit ................................................................................................................................................... 9 Exhibit 1.5: Study’s Conceptual Framework of How Find the Fit Influences Outcomes .......................... 11 Exhibit 1.6: Upward Bound Host Institution Characteristics for Participating Projects and All Eligible Projects .......................................................................................................................................... 12 Exhibit 1.7: Upward Bound Student Characteristics for Students in Participating Projects and in All Eligible Projects .......................................................................................................................................... 13 Exhibit 1.8: Data Sources Used in This Report .......................................................................................... 15 Exhibit 1.9: Interim Outcome Measures Examined in This Report ............................................................ 16 Exhibit 1.10: Implementation and College Advising Measures Examined in This Report ........................ 17 Exhibit 1.11: Student and Project Subgroups, Rationale for Inclusion, and Sample Size .......................... 19 Exhibit 2.1: Impact of Find the Fit on Whether Students Applied to Four or More Colleges ................... 21 Exhibit 2.2: Impact of Find the Fit on Whether Students Applied to Four or More Colleges, by Student Subgroup ........................................................................................................................................ 22 Exhibit 2.3: Impact of Find the Fit on Whether Students Applied to Four or More Colleges, by Project Subgroup ......................................................................................................................................... 23 Exhibit 2.4: Impact of Find the Fit on Selectivity Level of Colleges to which Students Applied ............. 24 Exhibit 2.5: Impact of Find the Fit on Selectivity Level of Colleges to which Students Applied, by Student Subgroup ........................................................................................................................................ 26 Exhibit 2.6: Impact of Find the Fit on Selectivity Level of Colleges to which Students Applied, by Project Subgroup ......................................................................................................................................... 27 Exhibit 2.7: Impact of Find the Fit on Whether Academic Quality was Very Important to Students in Choosing a College ..................................................................................................................................... 28 Exhibit 2.8: Impact of Find the Fit on Whether Academic Quality was Very Important to Students in Choosing a College, by Student Subgroup ................................................................................................. 29 Exhibit 2.9: Impact of Find the Fit on Whether Academic Quality was Very Important to Students in Choosing a College, by Project Subgroup .................................................................................................. 30 Exhibit 2.10: Impact of Find the Fit on Whether Students Completed the FAFSA by March 15 .............. 31 Exhibit 2.11: Impact of Find the Fit on Whether Students Completed the FAFSA by March 15, by Student Subgroup ........................................................................................................................................ 33 Exhibit 2.12: Impact of Find the Fit on Whether Students Completed the FAFSA by March 15, by Project Subgroup ......................................................................................................................................... 34 Exhibit 3.1: Treatment Group Projects’ Overall Implementation of Find the Fit ...................................... 36

CONTENTS
First Report: Enhanced College Advising in Upward Bound ▌pg. iii
Exhibit 3.2: Treatment Group Projects’ Level of Implementation of Find the Fit Components ................ 37 Exhibit 3.3: Duration that Treatment Group Students Were Sent Find the Fit Messages .......................... 38 Exhibit 3.4: Students’ Reported Receipt of Text Messages from Their Upward Bound Project ................ 38 Exhibit 3.5: Effects of Find the Fit on College Advising in Upward Bound Projects ................................ 40

First Report: Enhanced College Advising in Upward Bound ▌pg. iv
Acknowledgements
We gratefully acknowledge the contributions of many individuals in conducting the study and producing the report.
We appreciate the efforts of the Upward Bound project staff and students that participated in the data collection for this study. Input from the Council for Opportunity in Education (COE) during the planning and implementation phases was invaluable. Gregory Walton of Stanford University and Benjamin Castleman of the University of Virginia provided essential guidance about enhancing college advising practices. Throughout this study, we received helpful input from Jessica Howell from the College Board, Gregory Kienzl from ACT, and Catherine Lamberton of the University of Pittsburgh.
We are fortunate to have the advice of our expert technical working group members: Bridget Terry Long, Harvard University; Patricia McDonough, University of California at Los Angeles; Laura Perna, University of Pennsylvania; Gregory Peterson, Long Beach City College; Bruce Sacerdote, Dartmouth College; Jeffrey Smith, University of Michigan: Melissa Roderick, University of Chicago; and Heather Wathington, University of Virginia.
The report would not have been possible without the contributions of many staff at Abt Associates, American Institutes for Research (AIR), Survey Research Management (SRM), and Decision Information Resources (DIR) as well as our colleagues Rob Olsen and Rita Kirshstein. At Abt, we thank Jennifer Ash, Amy Checkoway, Sarah Costelloe, Hayley Didriksen, Brian Freeman, Bry Pollack, Cristopher Price, Lisa Setrakian, Daniel Weiss, and Anne Wolf. At AIR, we thank Amanda DeFrancisco, Ben Kalina, and Fausto Lopez. At SRM, we thank Linda Kuhn and Tony Lavender. At DIR, we thank Sylvia Epps, Natalia Ibanez, and Cynthia Walsh.
First Report: Enhanced College Advising in Upward Bound ▌pg. v
Disclosure of Potential Conflicts of Interest
The research team for this evaluation included staff from Abt Associates and subcontractors, American Institutes for Research (AIR), Survey Research Management (SRM), and Decision Information Resources (DIR). None of the research team members has financial interests that could be affected by findings from the evaluation of Enhanced College Advising in Upward Bound. No one on the eight-member technical working group, convened by the research team three times to provide advice and guidance, has financial interests that could be affected by findings from the evaluation.

EXECUTIVE SUMMARY
First Report: Enhanced College Advising in Upward Bound ▌pg. vi
Executive Summary
Where students go to college, not just whether they go, is key to their educational attainment and later economic success (Bowen, Chingos, and McPherson 2009; Dillon and Smith 2017; Hoxby 2001). However, 41 percent of students nationally undermatch—meaning they do not attend college or they choose a college that is less selective than their academic credentials would allow. This issue is more acute among students from lower socioeconomic backgrounds (Smith, Pender, and Howell 2013), for whom cost, application logistics, and concerns about falling short are real barriers to their attending more selective colleges.
Concern about undermatching prompted the U.S. Department of Education (ED) to test whether promising advising strategies, drawn together in a low cost package called Find the Fit, could improve college outcomes for students in its college access programs, including Upward Bound. The Upward Bound program, designed to help high school students from disadvantaged backgrounds prepare to enroll in and complete postsecondary education, reports high rates of college going among its project participants (U.S. Department of Education, n.d.). However, these students, like many low-income students, may miss opportunities to enroll in more selective or higher quality colleges, and Find the Fit was intended to address this concern.
The study of Find the Fit involved 194 regular Upward Bound projects, serving almost 4,500 high school seniors, that volunteered to participate. These projects were randomly assigned so that half were able to integrate Find the Fit into their regular Upward Bound services for their rising 2015-16 seniors (the treatment group) while the other half continued to provide their regular Upward Bound services without access to Find the Fit until after the study period ended (the control group). The rising 2015-16 seniors in both groups of projects are being tracked over time, using surveys and administrative records, so that their outcomes can be compared to determine the impact of Find the Fit. This report, the first of three that will be released from the study, presents the impacts on early indicators of college going (i.e., behaviors and considerations prior to actual college enrollment that are hypothesized to affect undermatching), and examines how Upward Bound projects implemented the Find the Fit advising strategies. Key findings include:
• Find the Fit increased the share of students who applied to four or more colleges. Becauseapplying to more colleges is associated with higher chances of enrolling in college (Smith 2013a)and of attending a more selective one (Pallais 2015), Find the Fit advising included arecommendation to apply to at least four. Overall, students in treatment group projects were 9percentage points more likely to report that they applied to four or more colleges than werestudents in control group projects (53 percent versus 44 percent; Exhibit ES Panel 1). Thispositive impact was consistent across most subgroups of students and projects examined.
• Find the Fit resulted in students applying to colleges of higher selectivity levels. A first stepin reducing academic undermatch is ensuring students apply to colleges ranging in selectivity orquality (i.e., not just ones they consider “safety” schools but also those that are a good “match” or
was made available to students throughthree components:
(1) college planning materials organized in personalized student folders with someinformation tailored to their likely college opportunities;
(2) text or email messages customized to where students were applying; and
(3) training webinars for their Upward Boundadvisors.
EXECUTIVE SUMMARY
First Report: Enhanced College Advising in Upward Bound ▌pg. vii
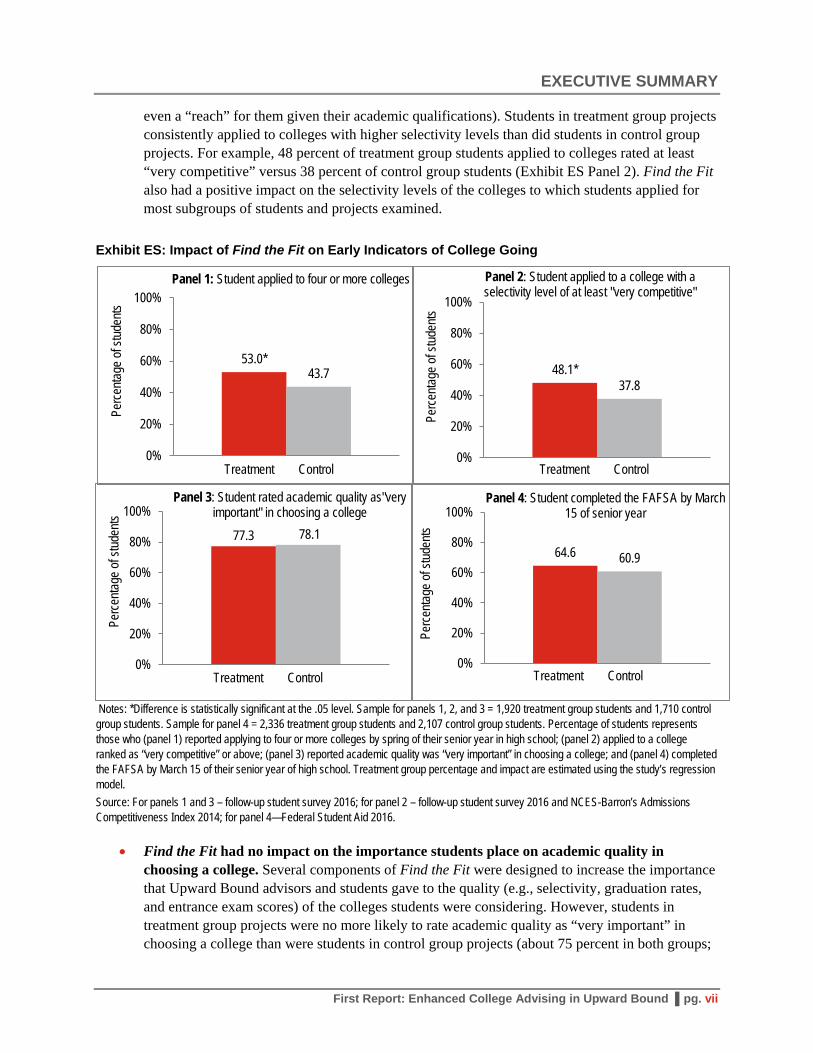
even a “reach” for them given their academic qualifications). Students in treatment group projects consistently applied to colleges with higher selectivity levels than did students in control group projects. For example, 48 percent of treatment group students applied to colleges rated at least “very competitive” versus 38 percent of control group students (Exhibit ES Panel 2). Find the Fit also had a positive impact on the selectivity levels of the colleges to which students applied for most subgroups of students and projects examined.
Exhibit ES: Impact of Find the Fit on Early Indicators of College Going
*Difference is statistically significant at the .05 level. Sample for panels 1, 2, and 3 = 1,920 treatment group students and 1,710 control group students. Sample for panel 4 = 2,336 treatment group students and 2,107 control group students. Percentage of students represents those who (panel 1) reported applying to four or more colleges by spring of their senior year in high school; (panel 2) applied to a college ranked as “very competitive” or above; (panel 3) reported academic quality was “very important” in choosing a college; and (panel 4) completed the FAFSA by March 15 of their senior year of high school. Treatment group percentage and impact are estimated using the study’s regression model.
53.0*43.7
0%
20%
40%
60%
80%
100%
Perce
ntage
ofstu
dents
Panel 1: Student applied to four or more colleges
Treatment Control
48.1*37.8
0%
20%
40%
60%
80%
100%
Perce
ntage
ofstu
dents
Panel 2: Student applied to a college with a selectivity level of at least "very competitive"
Treatment Control
77.3 78.1
0%
20%
40%
60%
80%
100%
Perce
ntage
ofstu
dents
Panel 3: Student rated academic quality as"very important" in choosing a college
Treatment Control
64.6 60.9
0%
20%
40%
60%
80%
100%
Perce
ntage
ofstu
dents
Panel 4: Student completed the FAFSA by March 15 of senior year
Treatment Control
Notes:
Source: For panels 1 and 3 – follow-up student survey 2016; for panel 2 – follow-up student survey 2016 and NCES-Barron’s Admissions Competitiveness Index 2014; for panel 4—Federal Student Aid 2016.
• Find the Fit had no impact on the importance students place on academic quality inchoosing a college. Several components of Find the Fit were designed to increase the importancethat Upward Bound advisors and students gave to the quality (e.g., selectivity, graduation rates,and entrance exam scores) of the colleges students were considering. However, students intreatment group projects were no more likely to rate academic quality as “very important” inchoosing a college than were students in control group projects (about 75 percent in both groups;

EXECUTIVE SUMMARY
First Report: Enhanced College Advising in Upward Bound ▌pg. viii
Exhibit ES Panel 3). There were generally no significant impacts within student and project subgroups for this outcome.
• Find the Fit did not have a significant effect on the overall share of students completing theFree Application for Federal Student Aid (FAFSA) by March 15 of their senior year, but itmay have increased completion among some student subgroups underrepresented incollege. Because financial aid may be a factor in whether students can attend a more selectivecollege, Find the Fit urged students to complete the FAFSA by a date when not only federal butalso most state and individual colleges’ aid is still available. Similar percentages of students intreatment and control group projects completed the FAFSA by Find the Fit’s target completiondate (65 percent and 61 percent, respectively; Exhibit ES Panel 4). However, treatment groupstudents who were Black or had low college entrance exam scores (a proxy for academicperformance) were between 8 and 10 percentage points more likely to complete the FAFSA byMarch 15 than their peers in control group projects. Given that the overall effect was notsignificant it is important to note that when a large number of tests are conducted, such as thelarge number of subgroups examined in this study (16 in total), some differences may be detectedas significant due to chance.
• Find the Fit was implemented to varying degrees across participating Upward Boundprojects, and it had positive effects on two of seven advising practices directly related to theprogram. All treatment group projects implemented at least some parts of Find the Fit. Projectsreported using, on average, 9 of the 13 materials in the student folders, over three-quarters ofprojects had staff attend all three webinar trainings, and 92 percent of students were sent at leastone text or email message. Because the delivery of Upward Bound core services varies acrossprojects (Epps et al. 2016), Find the Fit did not require that all of its components and materials beused or used in specific ways. Instead it offered suggestions for how the materials could extendthe college advising that already existed in each project; in some projects Find the Fit materialsmay have simply replaced those already being used to convey similar messages and concepts.According to student reports of their project’s advising practices, Find the Fit translated intoUpward Bound advisors (1) encouraging more students to submit four or more collegeapplications (57 percent for the treatment group versus 51 percent for the control group) and (2)encouraging more students to complete the FAFSA by March 15 (44 percent versus 38 percent).There was no effect on the extent to which advisors encouraged students to consider colleges’ netcost or other advising practices measured.
The implementation patterns and effects on early indicators of college going in this report suggest that Find the Fit may be more effective at changing concrete behaviors rather than students’ or advisors’ mindsets. Specifically, it increased the number of college applications students submitted, the selectivity level of the colleges to which they applied, and, perhaps, early completion of the FAFSA for some groups. But Find the Fit did not, for example, change the consideration that students said they gave to the academic quality of the colleges they were interested in attending.
These findings support some of the hypothesized pathways to reducing college undermatch among Upward Bound students, but also raise some questions to be explored in future analyses. The next two reports will investigate whether the effects on interim outcomes translate into improved college outcomes, specifically reduced undermatch, increased enrollment in colleges of higher selectivity, and longer-term

EXECUTIVE SUMMARY
First Report: Enhanced College Advising in Upward Bound ▌pg. ix
college persistence. To add context these later reports also will examine other characteristics of the colleges in which students enrolled, including their cost.
Summary of Study Design What was evaluated? Find the Fit packages multiple strategies showing promise in prior research into a single program approach designed to enhance the college advising Upward Bound projects already provide to their students. Find the Fit consists of three components: student materials organized in personalized folders; semi-customized text or email messages sent to students; and live training webinars for Upward Bound advisors. Find the Fit was intended to enhance the college advising already offered by Upward Bound projects; as such, the use of all the materials was not mandated. Who was involved? Of the 702 eligible Upward Bound projects that received fiscal year 2012 grants from ED, 194 projects volunteered and took the necessary steps to participate. These projects included 4,443 rising 2015-16 seniors who were the focus of Find the Fit and the study. The characteristics of the participating projects and students were similar to those of all eligible Upward Bound projects and students.
How was the evaluation conducted? The study randomly assigned about half of the participating Upward Bound projects to receive Find the Fit to use with their rising 2015-16 seniors as they transitioned to senior year (treatment group). The other half of the projects (control group) were not provided Find the Fit during the study period. The outcomes for students in the two groups of projects were compared to determine the impacts of Find the Fit. Impacts were estimated for projects and students overall (the “average effect” of Find the Fit), and for subgroups of students that might be of particular interest to policymakers or Upward Bound project directors, including those defined based on students’ race/ethnicity, gender, baseline academic achievement, Upward Bound project locale, and Upward Bound host institution type (e.g., four-year vs. two-year college). Impacts on subgroups, although exploratory, may provide useful information for future use of Find the Fit.
What outcomes were measured? The primary outcome of interest in the study is reduced college academic undermatch among Upward Bound students. This report examines early indicators of college going hypothesized to reduce undermatch: whether students applied to four or more colleges, the selectivity of colleges to which students applied, the importance students place on academic quality in choosing a college, and whether students completed the FAFSA by March 15 of their senior year.
What data were used? The study draws on data from three surveys conducted for this study, as well as on administrative data from ED and other sources. The surveys consisted of a baseline student survey administered prior to random assignment (spring 2015), and a follow-up student survey and a survey of Upward Bound staff conducted in the spring of students’ senior year of high school (2016). Administrative data maintained by ED included the Annual Performance Reports (APR) submitted by Upward Bound projects, the Integrated Postsecondary Education Data System (IPEDS), NCES-Barron’s Admissions Competitiveness Index, and Federal Student Aid (FSA) office data. Additional data came from the College Board, ACT, and Find the Fit monitoring data from webinar attendance and text messaging. Availability of data varied across these sources: response rates to the surveys ranged from 81 to 95 percent; APRs were available from all projects and included data for 99 percent of students; FSA data recording FAFSA completion were available for all students; college entrance exam scores from the College Board or ACT were available for 73 percent of students; IPEDS data covered 100 percent of the colleges that hosted participating Upward Bound projects; the Barron’s Competitiveness Index data were available for 100 percent of the accredited four-year colleges to which students applied; and monitoring data were available for 100 percent of projects in the treatment group.

OVERVIEW
First Report: Enhanced College Advising in Upward Bound ▌pg. 1
1. Overview: Studying a Strategy for Enhanced College Advising toImprove College Outcomes in Upward Bound
Where students go to college,1 not just whether they go, is key to their educational attainment and later economic success (Bowen, Chingos, and McPherson 2009; Dillon and Smith 2017; Hoxby 2001). Undermatching—when a student does not attend college or chooses a college that is less selective than the student’s academic credentials would allow—is particularly acute among low-income students, who often have limited information about colleges’ affordability and outcomes, and for whom cost, application logistics, and concerns about falling short are real barriers to their attending more selective colleges (Avery 2013; Bowen et al. 2009; Hoxby and Avery 2013; Walton and Cohen 2011).
Because research suggests that certain college advising approaches targeted to these challenges hold promise in addressing undermatch, the U.S. Department of Education (ED) sought to understand whether combining and adapting these strategies could benefit low-income and would-be first-generation college-going students, including those in its key college access program, Upward Bound.2 An evaluation of these strategies—together called Find the Fit—was conducted with about 200 Upward Bound projects to determine whether the enhanced college advising reduced undermatching. This chapter provides important background on the study, including its purpose and context (Upward Bound), and more detail on Find the Fit and how the evaluation of it was conducted.
The remaining chapters of the report present findings of Find the Fit’s effects on early indicators of college going (Chapter 2), findings about the implementation of Find the Fit (Chapter 3), and the questions that will be investigated in a future report and how they relate to the findings presented here (Chapter 4).3
1.1 Rationale: Concern about College Selectivity and Undermatch
Researchers have called attention to college undermatching—defined as students failing to enroll in a college that is aligned with their academic talents or better—as a significant problem with potentially far-ranging consequences (Bowen et al. 2009; Byndloss and Reid 2013; Roderick et al. 2008). The most recent national estimate suggests that around 40 percent of all students undermatch, and undermatch occurs more often among students from lower socioeconomic households (Exhibit 1.1) and those whose parents do not have a college degree (Smith, Pender, and Howell 2013; Hudes 2016; Ovink, Kalogrides, Nanney, and Delaney 2017).4 Although not enrolling in college is the most common form of
1 In this document “college” is used to refer to all institutions of higher education. 2 This kind of study also fulfills a congressional mandate in the 2008 Higher Education Opportunity Act that ED
rigorously assess promising practices that might help to improve its college access programs. 3 The appendices provide additional details about the Find the Fit intervention (Appendix A), the methods used
to carry out the evaluation (Appendix B), and details on the measures of and impacts on the early indicators of college going described in Chapter 2 (Appendix C) and implementation described in Chapter 3 (Appendix D).
4 Researchers define and measure undermatch in a variety of ways, many of which result in different estimates of the extent of undermatch (see Bastedo and Flaster 2014 for a summary and critique of different approaches). This study examines academic undermatch, which compares a student’s college choice to where the student’s

OVERVIEW
First Report: Enhanced College Advising in Upward Bound ▌pg. 2
undermatching (Page and Iriti 2016), students who enroll in college also undermatch. For example, between 13 and 19 percent of students enrolled in four-year colleges are undermatched (Dillon and Smith 2017; Howell and Pender 2016; Howell, Pender, and Kumar 2016). Underlying this focus on undermatch is the recognition that the quality of colleges varies and students play a role in choosing which colleges they attend.
Exhibit 1.1: College Academic Undermatch Nationally among 2004 High School Graduating Seniors, by Socioeconomic Status
Notes: Percentage of students represents those students who undermatch in their choice of college. Lower-socioeconomic status (SES) students are defined as those below the median SES determined by the National Center for Education Statistics’ (NCES) index of students’ parents’ income, education, and occupation; higher-SES students are those above the median. Source: Data are cited in Smith, Pender, and Howell (2013), who draw on data from the Education Longitudinal Study of 2002.
A student’s choice of college matters because where students go may affect their academic and career outcomes, though the research designs of most studies on this topic do not allow for definitive conclusions about how much of the outcomes are related to the colleges themselves versus the characteristics of the students. Nonetheless, research consistently shows a strong, positive relationship between college selectivity5 (a common metric for quality) and graduation rates and time-to-degree.
academic credentials (SAT/ACT scores, GPA, and high school coursetaking) suggest she has a high probability of being admitted. Students who attend a less selective college than they could attend, or do not attend college at all, are considered undermatched. This definition and approach to measuring undermatch are most similar to those used in Roderick et al. (2011) and Smith, Pender, and Howell (2013).
5 A widely used measure of selectivity, and the one incorporated into this study, is Barron’s Admissions Competitiveness Index, which includes seven selectivity levels (“most competitive,” “highly competitive,” “very competitive,” “competitive,” “somewhat competitive,” “noncompetitive,” and “special/missing”) for four-year colleges. Two-year colleges and some four-year colleges are not ranked by Barron’s, but these are added as additional selectivity levels for this study.
49.6
34.0Nationalaverage
0%
20%
40%
60%
80%
100%
Lower-socioeconomicstatus students
Higher-socioeconomicstatus students
Perce
ntage
ofstu
dents
OVERVIEW
First Report: Enhanced College Advising in Upward Bound ▌pg. 3
Seventy-five percent of first-time, full-time, bachelor’s degree-seeking students who attend very selective four-year colleges graduate within six years, compared with 36 percent of those who attend minimally selective four-year colleges (Horn and Carroll 2006). Students at more selective colleges complete their degrees, on average, one year earlier than do students who attend less selective colleges (Bound, Lovenheim, and Turner 2012). Not only are they more likely to graduate and graduate in less time, graduates of more selective institutions are more likely to find employment and earn more. The differences in earnings can be stark; for example, graduates from the most selective colleges have incomes 37 percent greater than graduates from minimally selective colleges (Witteveen and Attewell 2017).
The advantages of attending higher quality colleges appear to persist even when pre-college characteristics are taken into account. Compared with similar students, those who attend colleges with higher average entering SAT scores (Bowen et al. 2009; Howell and Pender 2016; Smith 2013b) or higher graduation rates (Goodman, Hurwitz, and Smith 2017) are more likely to complete a bachelor’s degree. For example, starting at a four-year college at the 75th percentile of college quality6 rather than a college of average quality is associated with a 7 to 8 percentage point higher likelihood of graduating within five years for the average student (Dillon and Smith 2017).
Research findings vary with respect to how much attending a more selective college is estimated to pay off in terms of earnings.7 Accounting for various student pre-college characteristics (e.g., ability, ambition, race, gender), the annual earnings for students who attend the most selective colleges compared to those who attend the least selective have been estimated to be 20 percent higher (Hoxby 2001; Witteveen and Attewell 2017). Other research has estimated no overall advantage to attending a more selective college, yet found an earnings advantage for Black and Hispanic students and for those whose parents have only a high school degree, with students from these groups earning over 5 percent more annually if they attended a more selective four-year college (Dale and Krueger 2014).
Some researchers have raised concerns that the benefits to attending a more selective college could come at a financial cost, if students leave college with higher debt than if they attended less selective and potentially less expensive colleges (Bastedo and Flaster 2014; Dillon and Smith 2017; Howell and Pender 2016; Page and Iriti 2016; Radford and Howell 2014). Howell and Pender (2016) found that the potential higher costs of attending more selective colleges may be warranted, for some groups of students, given the higher rates of graduation at these colleges. However more research on this topic is necessary.
6 The authors measured quality by an index that combined the mean SAT score of entering students, the percentage of applicants rejected, the average salary of all faculty engaged in instruction, and the undergraduate faculty-student ratio.
7 In addition to differences in earnings across the selectivity levels, differences in earnings exist within selectivity levels and within college themselves, driven in large part by differences across majors (Carnevale, Fasules, Huie, and Troutman 2017; Schneider and Columbus 2017).
OVERVIEW
First Report: Enhanced College Advising in Upward Bound ▌pg. 4
1.2 Upward Bound: A Federal College Access Program Seeking to Improve College Outcomes
Upward Bound is an important context in which to test strategies to increase the quality of colleges students attend and reduce college undermatch, for several reasons. First, it serves a population of high policy interest. Like other federal TRIO programs8, Upward Bound is designed to help prepare students from disadvantaged backgrounds to enroll in and complete postsecondary education. To be eligible for Upward Bound, a student must come from a household with income below 150 percent of the poverty level or in which no parent in the household holds a bachelor’s degree; two-thirds of any Upward Bound project’s participants must satisfy both criteria. Most Upward Bound participants enter the program in 9th or 10th grade.
Second, the range and intensity of Upward Bound program services (and therefore its costs) creates an emphasis on documenting and continually improving participants’ outcomes. Upward Bound projects must offer an array of academic supports and college preparation services, including college advising and application help (Exhibit 1.2). In the most recent Upward Bound program report, which covered projects active in fiscal year 2016, those projects had served more than 61,000 high school students at an average cost of more than $4,300 per student (U.S. Department of Education 2016).
Exhibit 1.2: Upward Bound Required Services
• Academic tutoring and instruction to prepare students to complete secondary or postsecondary courses.
• Guidance on high school course selection.
• College advising.
• Assistance in preparing for college entrance exams (e.g., SAT, ACT) and completing college admission applications.
• Information on all federal student financial aid programs and benefits, as well as resources for locating public andprivate scholarships.
• Assistance in completing financial aid applications.
• Education or counseling services to improve the financial and economic literacy of students or their parents, includingfinancial planning for postsecondary education.
Third, Upward Bound projects vary in how they carry out their college advising and application help, and there is some evidence that college quality or selectivity is not a significant priority for projects in advising their students about which college to attend (Epps, Jackson, Olsen, Shivji, and Roy 2016). For example, though almost all regular Upward Bound projects in 2014 provided students support in researching colleges to which they might apply, fewer than two-thirds provided services that helped students assess colleges’ outcomes as part of their research. Only 10 percent of projects emphasized college ranking or selectivity as among the most important characteristics for students to consider when choosing where to apply.
8 TRIO is the proper name for a set of eight programs (originally three programs) to increase progress through the academic pipeline to higher education for individuals from disadvantaged backgrounds.

OVERVIEW
First Report: Enhanced College Advising in Upward Bound ▌pg. 5
Finally, increasing the numbers of students who attend more selective colleges is one clear way to raise outcomes in this key college access program. The large majority of Upward Bound seniors (85 percent of 2012–13 seniors, according to project-submitted data) already enroll in some college immediately after high school graduation (U.S. Department of Education n.d.). Despite Upward Bound’s high college enrollment rates, its participants, like many low-income students, may miss opportunities to enroll in more selective colleges. Indeed, a previous study of Upward Bound found that only 11 percent of Upward Bound students enrolled in colleges classified as “most competitive,” “highly competitive,” or “very competitive” (Seftor, Mamun, and Schirm 2009), about half the rate of students nationally (Schmitt 2015). In addition, a substantial share of Upward Bound seniors end up attending the college that operates (or “hosts”) their Upward Bound project, particularly among students participating at projects hosted by two-year colleges (Exhibit 1.3).9
Exhibit 1.3: Percentage of College-Going Upward Bound Seniors Who Enrolled at the Institution Hosting their Upward Bound Project, by Type of Host Institution
Notes: Sample = 16,587 high school seniors in 2011 who participated in Upward Bound at a project hosted by a college and who enrolled in college within two years of expected high school graduation. Percentage of students represents those 2011 college-going Upward Bound seniors who enrolled in the college that hosted their Upward Bound project. Source: Upward Bound APR 2007-08 to 2010-2011; National Student Clearinghouse.
1.3 Find the Fit: A Research-Based Approach to Enhance College Advising
Find the Fit—assembled for the study—packages multiple promising college advising strategies to address key challenges that low-income and first-generation college goers face.10 The package has three components—student materials, messages to students, and training webinars for advisors. The objective was for Find the Fit to be integrated with existing Upward Bound college advising activities to help
9 Some ten percent of Upward Bound students participate in an Upward Bound program that is not hosted by a college; these students were not included in this analysis.
10 The components of Find the Fit drew on existing materials tested with other populations and found to be beneficial for at least some students (see Section A.1 in Appendix A for details). These components were assembled through a collaboration involving Abt Associates, American Institutes for Research, Dr. Cait Lamberton of the University of Pittsburgh, and ED staff. Input also was solicited from the Council for Opportunity in Education, the College Board, and ACT. The combined components of Find the Fit were pilot tested with six Upward Bound projects (not involved in the study) in the year prior to the start of the study.
52.1
26.3
0%
20%
40%
60%
80%
100%
Two-year college Four-year college
Perce
ntage
ofstu
dents
Host institution

OVERVIEW
First Report: Enhanced College Advising in Upward Bound ▌pg. 6
Upward Bound students find a good college fit. Because the delivery of services varies across Upward Bound projects (Epps et al. 2016), Find the Fit did not prescribe how its materials should be integrated, nor did it require that all materials be used, and instead offered some suggestions for how they could be used to supplement or extend the college advising that already existed in each project.
1.3.1 Addresses Three Key Challenges through Research-Based Approaches
Find the Fit aimed to address three challenges that low-income and first-generation college goers can face in finding and enrolling in a college that is a good fit for them. Drawing on research that has demonstrated the effectiveness of strategies to overcome challenges with other populations and in other settings, Find the Fit incorporated practical help on the logistics of applying to colleges (e.g., deadlines and plans), supports to reduce the financial hurdles in applying for financial aid and scholarships and in understanding costs, and approaches to widen and raise students’ aspirations and expectations regarding college choice.11 (See Section A.1 in Appendix A for more detail on the underlying research for Find the Fit and how research-based strategies were adapted to suit the Upward Bound program model and student population.)
Logistics of Applying
Applying to college involves a series of coordinated steps, including keeping track of deadlines and materials that need to be submitted to individual colleges. Low-income students need supports to navigate the college application process, especially because applying to more than one or two colleges can be costly and logistically complicated (Avery and Kane 2004; Carrell and Sacerdote 2013; Hoxby and Turner 2013; Roderick et al. 2008).
Strategies: (1) identify key milestones in the application process and provide tools to track steps; (2) send students text messages with real-time reminders and prompts customized to college(s) students intended to apply to and/or enroll in; (3) encourage students to apply to four or more colleges
• Research base: Presenting students with semi-customized packets, including information aboutthe college application process and key milestones, increases enrollment at selective colleges(Hoxby and Turner 2013).
• Research base: Sending text messages with customized content to students in the summer beforecollege can increase college enrollment (Castleman and Page 2015).
• Research base: Sending students text messages with information about financial aid improvescollege persistence into sophomore year (Castleman and Page 2016).
• Research base: Applying to more colleges is associated with better college-going outcomes,including enrolling in college (Smith 2013a) and attending a more selective college (Pallais2015).
11 Academic preparation also can be a hurdle to low-income and first-generation college students’ success; however, Find the Fit did not target this.

OVERVIEW
First Report: Enhanced College Advising in Upward Bound ▌pg. 7
Financial Hurdles and Misperceptions about College Costs
Students often misestimate the actual costs of attending various colleges (Horn, Chen, and Chapman 2003). Some low-income students may not realize that if they apply for financial aid, they may not have to pay the full costs that colleges charge. Also, because the financial aid application process—in particular completion of the Free Application for Federal Student Aid (FAFSA)—is complex, students may not find and apply to all sources of aid available to them, limiting their affordable college options (Bettinger, Long, Oreopoulos, and Sanbonmatsu 2012; Dynarski and Scott-Clayton 2006).
Strategies: (1) provide students with information about college net costs versus sticker price; (2) encourage students to complete the FAFSA early
• Research base: Completing the FAFSA no later than spring of their senior year opens up the mostopportunities for institutional and state aid, as well as gives students accurate information aboutreal costs before making a college decision (Cannon and Goldrick-Rab 2016; Feeney and Heroff2013).
• Research base: Providing students with semi-customized packets, including customizedinformation about net cost versus sticker price at colleges where students are likely admissible,increases enrollment at selective colleges (Hoxby and Turner 2013).
Limited Expectations
Students may have constrained perceptions of where they might be admitted and which colleges match their ability level (Roderick et al. 2008; Sherwin 2012). This can lead them to not consider applying to unfamiliar schools that might be a good fit for them. Local and familiar colleges are often their default (Avery, Howell, and Page 2014); however, the most familiar colleges may not be the best match for every student or offer the highest potential for achieving desirable outcomes (Bowen et al. 2009; Hoxby and Turner 2013; Roderick et al. 2008).
Strategies: (1) expand students’ knowledge of college quality; (2) engage students in short interactive activities to foster the ability to learn, grow, and adapt in unfamiliar situations
• Research base: Presenting students with customized information comparing quality and cost atcolleges where they are likely admissible increases enrollment at selective colleges (Hoxby andTurner 2013).
• Research base: Providing guidance on selecting colleges that meet students’ academicqualifications and have high graduation rates is important to increasing college enrollment anddegree completion (Avery 2013; Roderick et al. 2008).
• Research base: Engaging students in short writing and discussion activities can reduce students’fears of the unfamiliar and of fitting in, and result in higher college achievement (Walton andCohen 2011; Yeager et al. 2014).
1.3.2 Comprises Three Components
These research-based strategies were made available to Upward Bound projects through three Find the Fit components: student materials provided to students in a personalized folder with some information tailored to their likely college opportunities; text or email messages sent to students customized to where they were applying to college; and training webinars for Upward Bound advisors. An overview of these

OVERVIEW
First Report: Enhanced College Advising in Upward Bound ▌pg. 8
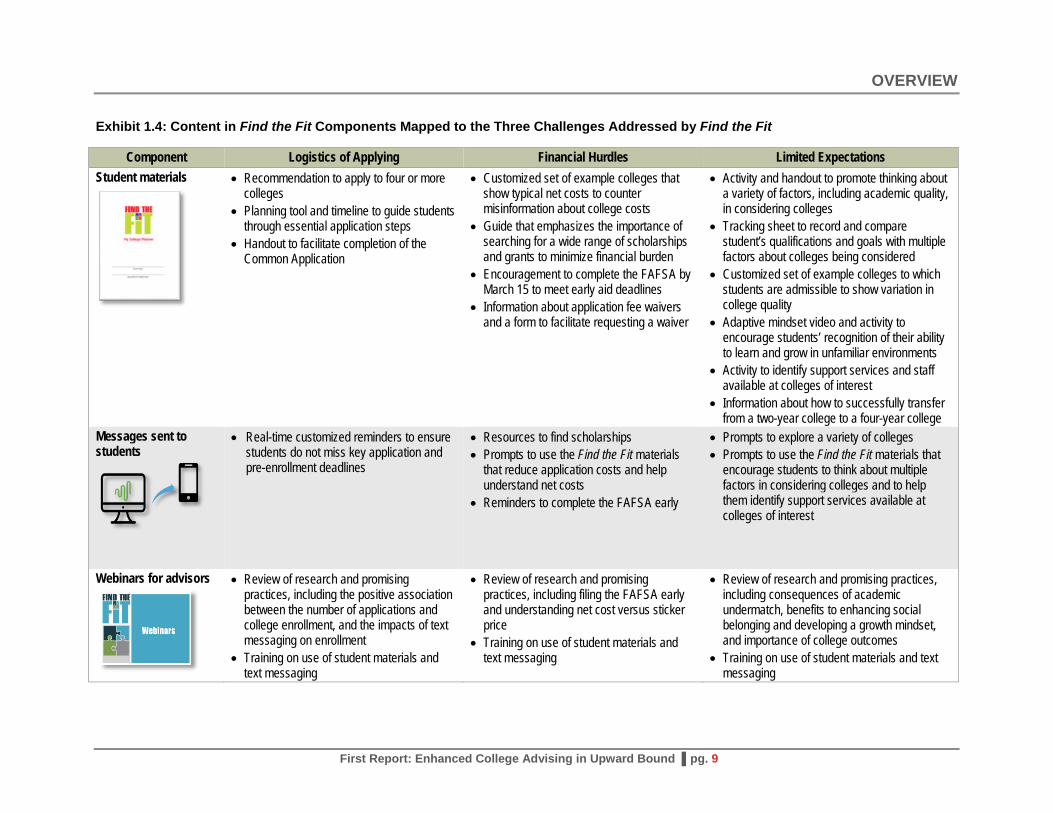
components is presented below, and Exhibit 1.4 displays how the content of these components maps onto the challenges addressed.12
Student Materials
Find the Fit’s student materials comprised activities, exercises, and handouts to support Upward Bound students in dealing with challenges related to logistics, costs, and expectations in applying to and enrolling in college. Modeled on information folders like the ones evaluated by Hoxby and Turner (2013), some of the materials were customized for each student based on the student’s academic preparation and geographic location (e.g., scholarships available in their state). Assembled in personalized folders, the materials were mailed to the Upward Bound projects in the treatment group for advisors to distribute to their students. These materials were intended to be integrated into the college advising those Upward Bound projects already offered. It was anticipated that versions of some of the materials—for example, the application timeline and information on college application fee waivers—likely were available to many projects even before Find the Fit but they were included to connect other items in the folder. Thus for each of the materials, projects could decide whether to add it to the resources they used with students, replace an existing resource they previously used, or not use the material.
Messages Sent to Students
A set of programmed, semi-customized text messages were sent to students about twice a month from the end of their junior year through the end of their senior year or, if they were in an Upward Bound project that offered a summer bridge program after high school graduation, through the end of that summer program. Messages were sent to the students via a texting platform where accounts had been set up for their Upward Bound projects. Messages were customized using information about where each student intended to apply to college and were programmed to originate from their project’s account. The messages included reminders about application and enrollment deadlines, Find the Fit materials students could use, and links to financial aid resources. If a student’s mobile phone number was not available, email messages were sent.13
Training Webinars for Advisors
Training consisted of three live webinars and an accompanying handbook offered to the college advisors in the treatment group projects. The training introduced them to the student materials, offered suggestions for how to integrate the materials into existing activities, and reviewed the underlying research and promising practices on which Find the Fit was based.
12 See Section A.2 in Appendix A for more details about the components of Find the Fit. 13 About one-quarter received email messages for this reason.
OVERVIEW
First Report: Enhanced College Advising in Upward Bound ▌pg. 9
Exhibit 1.4: Content in Find the Fit Components Mapped to the Three Challenges Addressed by Find the Fit
Component Logistics of Applying Financial Hurdles Limited Expectations Student materials • Recommendation to apply to four or more
colleges• Planning tool and timeline to guide students
through essential application steps• Handout to facilitate completion of the
Common Application
• Customized set of example colleges thatshow typical net costs to countermisinformation about college costs
• Guide that emphasizes the importance ofsearching for a wide range of scholarshipsand grants to minimize financial burden
• Encouragement to complete the FAFSA byMarch 15 to meet early aid deadlines
• Information about application fee waiversand a form to facilitate requesting a waiver
• Activity and handout to promote thinking abouta variety of factors, including academic quality,in considering colleges
• Tracking sheet to record and comparestudent’s qualifications and goals with multiplefactors about colleges being considered
• Customized set of example colleges to whichstudents are admissible to show variation incollege quality
• Adaptive mindset video and activity toencourage students’ recognition of their abilityto learn and grow in unfamiliar environments
• Activity to identify support services and staffavailable at colleges of interest
• Information about how to successfully transferfrom a two-year college to a four-year college
Messages sent to students
• Real-time customized reminders to ensurestudents do not miss key application andpre-enrollment deadlines
• Resources to find scholarships• Prompts to use the Find the Fit materials
that reduce application costs and helpunderstand net costs
• Reminders to complete the FAFSA early
• Prompts to explore a variety of colleges• Prompts to use the Find the Fit materials that
encourage students to think about multiplefactors in considering colleges and to helpthem identify support services available atcolleges of interest
Webinars for advisors • Review of research and promising practices, including the positive association between the number of applications and college enrollment, and the impacts of text messaging on enrollment
• Training on use of student materials andtext messaging
• Review of research and promisingpractices, including filing the FAFSA earlyand understanding net cost versus stickerprice
• Training on use of student materials andtext messaging
• Review of research and promising practices,including consequences of academicundermatch, benefits to enhancing socialbelonging and developing a growth mindset,and importance of college outcomes
• Training on use of student materials and textmessaging

OVERVIEW
First Report: Enhanced College Advising in Upward Bound ▌pg. 10
1.4 Study Design: Evaluating the Effectiveness of Find the Fit
The evaluation of Find the Fit responds to a congressional mandate to rigorously assess promising strategies for improving ED’s TRIO programs.14 This study tests the effectiveness of Find the Fit and answers three key questions:
1. Did Find the Fit improve the interim outcomes and, ultimately, reduce college academicundermatch among Upward Bound students? This central question will determine whether Findthe Fit could be a strategy for Upward Bound program improvement. The current report addressesFind the Fit’s effect on the behaviors and considerations prior to actual college enrollment that arehypothesized to affect undermatching, while the study’s next report will address whether Find the Fithad an effect on undermatch.
2. To what extent did Upward Bound projects implement Find the Fit, and how did thatimplementation affect the college advising received by their students? These findings provideinsight into how projects adopt Find the Fit and the extent to which it changes their practices.
3. Are there impacts of Find the Fit for some subgroups of Upward Bound students or projectsand not others?15 This information could be useful to the program office in providing technicalassistance or to individual Upward Bound projects trying to determine if adopting Find the Fit isappropriate for them.
1.4.1 Conceptual Framework for the Study
The study was grounded in the conceptual framework of how Find the Fit would affect students’ college-related outcomes. Because the delivery of Upward Bound services varies across projects (Epps et al. 2016), Find the Fit did not dictate exactly how projects should incorporate or use it though some suggestions were provided in the training and handbook. Projects could choose to use Find the Fit to supplement the college advising they offered, replace materials they already were using, or not use the materials. Exhibit 1.5 illustrates how the Find the Fit components, when projects choose to integrate them into their college advising activities, are expected to influence project implementation and interim outcomes, which can serve as early indicators of college going. Ultimately, the goal of Find the Fit is to reduce academic undermatch among Upward Bound students. Finally, decreased undermatch, through increased college enrollment and enrollment at more selective colleges, is expected to lead to higher rates of college persistence and completion. Whether Find the Fit met these longer-term goals will be described in later reports.
14 20 USC § 1070a-18 15 The subgroups the study examined were defined based on students’ race/ethnicity, gender, baseline academic
achievement, Upward Bound host institution locale, and Upward Bound host institution type. Section 1.4.6 describes the rationale for examining each of these subgroups.

OVERVIEW
First Report: Enhanced College Advising in Upward Bound ▌pg. 11
Exhibit 1.5: Study’s Conceptual Framework of How Find the Fit Influences Outcomes
Notes: Arrows show how Find the Fit’s components, if integrated by Upward Bound projects into their college advising activities, are expected to influence advising and interim outcomes and how the interim outcomes might influence the later outcomes. The dashed red box outlines the focus of this current report, which is on Find the Fit’s implementation and its effects on interim outcomes.
1.4.2 Projects and Students in the Study Sample
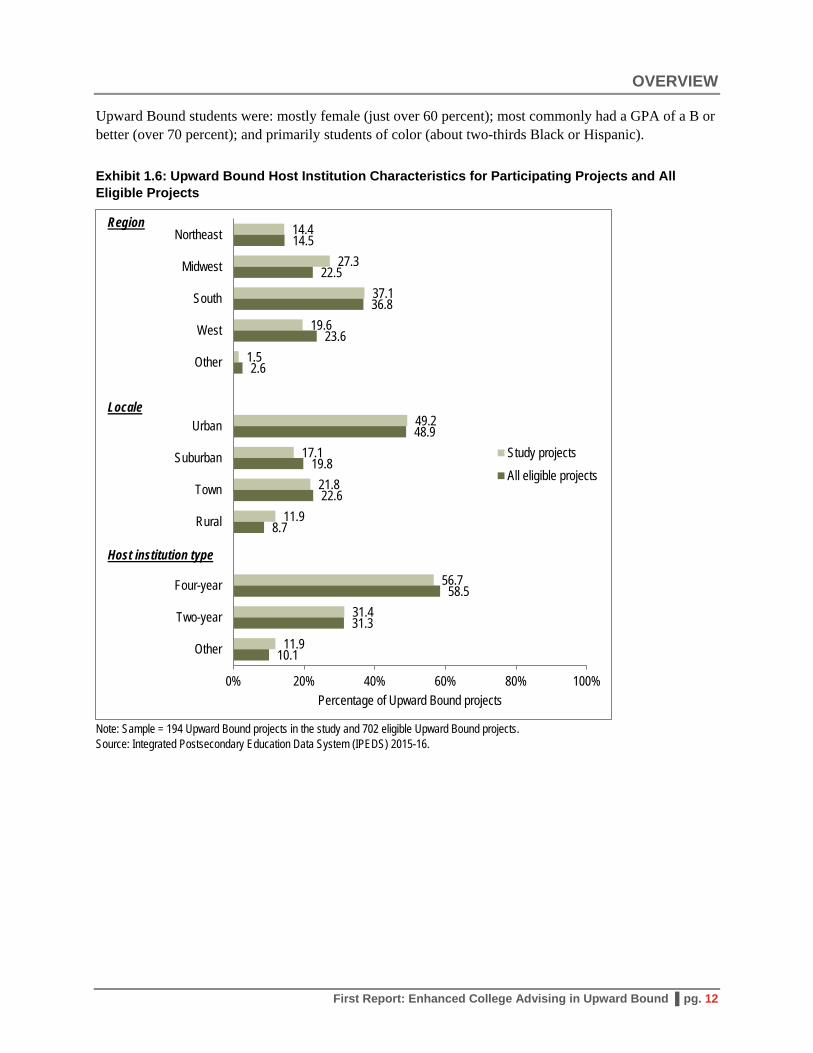
Of the 702 Upward Bound projects eligible for the study in spring 2015, 194 projects volunteered to participate.16 At that time, these projects served 4,443 students (at the end of their high school junior year) who would be the rising seniors targeted for the enhanced advising of Find the Fit. Though those participating were not randomly selected from the full set of eligible projects to statistically represent the Upward Bound program overall, the projects in the study were similar to all eligible Upward Bound projects on important dimensions—spanning all regions in the United States, mostly located in urban settings (49 percent), and primarily hosted by four-year colleges (57 percent) (Exhibit 1.6).17
Students who were rising seniors in the participating projects were also similar to rising seniors in all eligible Upward Bound projects (Exhibit 1.7). Both in the program overall and in participating projects,
16 All 823 regular Upward Bound awards funded with FY 2012 funds were eligible to participate in the study. Awards that shared staff or brought together students across awards to provide services were treated as single projects for this study. Thus, those 823 awards formed 702 eligible Upward Bound projects. The target for recruitment was 200 projects (see Section B.4 in Appendix B for statistical analyses to determine the needed sample size).
17 Exhibits B.1 and B.2 in Appendix B contain comparisons of projects and students on a fuller set of characteristics.
OVERVIEW
First Report: Enhanced College Advising in Upward Bound ▌pg. 12
Upward Bound students were: mostly female (just over 60 percent); most commonly had a GPA of a B or better (over 70 percent); and primarily students of color (about two-thirds Black or Hispanic).
Exhibit 1.6: Upward Bound Host Institution Characteristics for Participating Projects and All Eligible Projects
Note: Sample = 194 Upward Bound projects in the study and 702 eligible Upward Bound projects. Source: Integrated Postsecondary Education Data System (IPEDS) 2015-16.
14.4
27.3
37.1
19.6
1.5
49.2
17.1
21.8
11.9
56.7
31.4
11.9
14.5
22.5
36.8
23.6
2.6
48.9
19.8
22.6
8.7
58.5
31.3
10.1
0% 20% 40% 60% 80% 100%
Northeast
Midwest
South
West
Other
Urban
Suburban
Town
Rural
Four-year
Two-year
Other
Percentage of Upward Bound projects
Study projectsAll eligible projects
Region
Locale
Host institution type

OVERVIEW
First Report: Enhanced College Advising in Upward Bound ▌pg. 13
Exhibit 1.7: Upward Bound Student Characteristics for Students in Participating Projects and in All Eligible Projects
Note: Sample = 4,443 students in Upward Bound projects in the study and 18,487 students in all eligible Upward Bound projects. Source: Upward Bound APR 2012-13 to 2014-15.
64.0
36.0
18.4
52.4
26.2
2.8
0.2
25.8
23.4
38.6
12.2
87.6
91.7
64.0
36.0
16.5
55.3
25.5
2.5
0.3
30.1
21.4
37.4
11.1
88.1
92.2
0% 20% 40% 60% 80% 100%
Female
Male
A
B
C
D
F
Hispanic
White
Black
Other
Low-income
First generation to college
Percentage of students
Students in study projectsStudents in all eligible projects
Gender
GPA
Race/ethnicity
Household characteristics

OVERVIEW
First Report: Enhanced College Advising in Upward Bound ▌pg. 14
1.4.3 Random Assignment: Dividing Projects into a Treatment and a Control Group
The study used random assignment (a lottery) in spring 2015 to determine which of the 194 participating Upward Bound projects would be able to implement Find the Fit during the study period (the treatment group) and which would have access to Find the Fit only after the study ended (the control group).18 Because random chance and not the characteristics, intentions, or performance of the projects determined the group assignment, any differences between the treatment and control groups in their students’ outcomes are due to Find the Fit and not something else. The impact findings can, therefore, be used with confidence.
Random assignment resulted in 98 treatment group projects (including 2,336 treatment group students) and 96 control group projects (2,107 control group students). (See Section B.1.3 in Appendix B for details on the random assignment process, and Exhibit B.3 for a diagram illustrating the flow of projects and students through random assignment and the study’s data collection.) The two groups, as well as the students they served, were similar in key characteristics measured before random assignment, suggesting that the random assignment worked as planned to create two statistically similar groups (see Exhibit B.5 and Exhibit B.6 in Appendix B).
1.4.4 Data Sources
The study draws on data from three surveys conducted for this study, as well as on administrative data from ED and other sources (Exhibit 1.8).19 The baseline student survey was administered prior to random assignment, and the follow-up student survey and survey of Upward Bound staff were conducted in the spring of students’ senior year of high school. Administrative data maintained by ED included the Annual Performance Reports (APR) submitted by Upward Bound projects, Integrated Postsecondary Education Data System (IPEDS), NCES-Barron’s Admissions Competitiveness Index, and Federal Student Aid (FSA) records on FAFSA completion. Additional data came from the College Board, ACT, and intervention monitoring data.
Pre-Find the Fit data on student and project characteristics came from the baseline student survey, APR, College Board and ACT college entrance exam data, and IPEDS. Data to measure implementation of Find the Fit came from the follow-up student survey, survey of Upward Bound staff, and intervention monitoring data. Early indicators of college going came from the follow-up student survey, NCES-Barron’s Admissions Competitiveness Index, and FSA data. Response rates to the surveys ranged from 81 to 95 percent, and rates were similar between the treatment and control groups. FAFSA completion data were available for all students in the study; college entrance exam scores were available for 73 percent of students; and IPEDS data covered 100 percent of the colleges that hosted the Upward Bound projects. Prior to Find the Fit implementation, there were few differences between the treatment and
18 Students in both treatment and control group projects continued to receive regular Upward Bound services. Control group projects were not provided Find the Fit during the study period, but were given access to it to implement with future groups of students, if desired. Access was granted after students involved in the study had graduated and were no longer being served by Upward Bound.
19 Additional details of the study’s data sources and how they were used in the study are included in Section B.2 in Appendix B.

OVERVIEW
First Report: Enhanced College Advising in Upward Bound ▌pg. 15
control group students for whom data were available (see Section B.2.1 in Appendix B for details on missing data and the baseline equivalence of the analytic samples).20
Exhibit 1.8: Data Sources Used in This Report
Data Source Target Sample
Timeframe Content Study Surveysa Baseline student survey (pre-Find the Fit)
4,443 students Spring 2015
• College-going expectations and plans; socioeconomic status anddemographic characteristics
Follow-up student survey 4,443 students Late spring 2016
• College advising that students received; college applicationbehaviors (i.e., number of applications submitted); use of Find the Fitmaterials (treatment only); colleges to which students applied
Project surveyb 194 project directors Spring 2016
• Features of the college advising offered to students over the studyperiod; use of Find the Fit materials by projects (treatment only)
Administrative and National Data Student rosters 194 projects
Winter 2014 • Records of students who would be rising seniors active in the
Upward Bound projects in the Find the Fit studyUpward Bound Annual Performance Reports (APR)
194 projects SY 2014-15
• Reports submitted annually to ED by each Upward Bound project,which include an entry for each student who ever entered theprogram
College Board and ACT college entrance exam data
4,443 students SY 2013-14 SY 2014-15
• Records of student scores on the SAT, ACT, PSAT, and PLAN priorto June 2015
Federal Student Aid (FSA) data
4,443 students Spring 2016
• Student-level information on FAFSA completion
NCES-Barron’s Admissions Competitiveness Index
4,443 students 2014
• Classifications of four-year U.S. colleges by relative competitivenessof admissions
Integrated Postsecondary Education Data System (IPEDS)
194 projects SY 2015-16
• Data on institutional characteristics of colleges
Intervention monitoring data
94 treatment projects; 2,336 students SY 2015-16
• Records of advisors’ attendance in training webinars, and analyticsfrom the texting platform on messages sent to and received bystudents
SY is school year. a Versions of the study survey instruments can be found at: https://www.reginfo.gov/public/do/PRAICList?ref_nbr=201508-1850-001 b Project directors were asked to complete the survey themselves or assign it to the staff person who was most familiar with their project’s advising. About 63 percent of project surveys were completed by project directors.
20 For the next report, data from FSA, the National Student Clearinghouse (NSC), and the Education Longitudinal Study of 2002 (ELS:2002) will be used to identify students’ college enrollment and the selectivity of colleges to which they might have been admissible.

OVERVIEW
First Report: Enhanced College Advising in Upward Bound ▌pg. 16
1.4.5 Measures of Interim Outcomes and Implementation
The conceptual framework for Find the Fit hypothesizes that it would lead to improved college outcomes through interim outcomes that may influence whether and where a student attends college. These interim outcomes, the early indicators of college going examined in this report, include the factors that students consider when choosing colleges and specific college application behaviors (Exhibit 1.9).21
Exhibit 1.9: Interim Outcome Measures Examined in This Report
Outcome Data Source Definition Whether students apply to four or more colleges
Follow-up student survey Indicator of whether a student applied to four or more colleges by spring of his/her senior year, based on count of student-reported college applications
Selectivity level of colleges to which students apply
Follow-up student survey, NCES-Barron’s Admissions Competitiveness Index
Indicator of whether a student applied to a college of at least a given selectivity level (e.g., at least a “very competitive” college) based on the Barron’s selectivity levels of colleges in student-reported applications list.a At every selectivity level, the percentage of students who applied to a college at that level or above is included
Importance students place on academic quality in choosing a college
Follow-up student survey Student rated academic quality or reputation as “very important” in choosing a college
Whether students complete the FAFSA by March 15
Federal Student Aid (FSA) office data
Administrative record of whether student completed the FAFSA by March 15
a As of 2014, Barron’s seven levels for rated four-year colleges were “most competitive,” “highly competitive,” “very competitive,” “competitive,” “somewhat competitive,” “noncompetitive,” and “special/missing.” For purposes of this study, unranked four-year colleges were considered more selective than two-year colleges but less selective than four-year colleges ranked as “somewhat competitive” by Barron’s; and two-year colleges were considered the least competitive institution type.
Given that Upward Bound projects differ in what advising topics and materials they already use (Epps et al. 2016), Find the Fit student materials were purposely designed to be flexible enough to accommodate individual project needs, allowing projects to pick and choose how and when to implement. Therefore, it was unclear whether projects would implement Find the Fit in its entirety—and, consequently, whether all of the interim outcomes would be affected as hypothesized. To learn more about implementation, the project survey and follow-up student survey included questions asking which Find the Fit student materials had been used. Information on advisors’ participation in training webinars and students’ receipt of text/email messages came from intervention monitoring data (Exhibit 1.10).
21 The study’s key initial college-going outcome of undermatch will be investigated in the next report.

OVERVIEW
First Report: Enhanced College Advising in Upward Bound ▌pg. 17
Exhibit 1.10: Implementation and College Advising Measures Examined in This Report
Measure Data Source Description Use of student materials Project survey Whether project reported use of the individual Find the Fit student
materials Number of student materials used
Project survey Number of Find the Fit student materials that project reported using
Number of students sent messages
Intervention monitoring data
Number of students who were sent any Find the Fit messages
Date through which students were sent messages
Intervention monitoring data
Period through which student was sent messages, calculated using dates on which student was sent programmed text or email messages
Number of webinars attended Intervention monitoring data
Number of training webinars that at least one advisor from the project attended
Encouraged student to consider net cost
Follow-up student survey
Upward Bound staff encouraged student “a lot” to consider the cost of college after scholarships, grants, and financial aid are taken into account
Encouraged student to consider college match
Follow-up student survey
Upward Bound staff encouraged student “a lot” to consider how well his/her test scores and GPA match with average student test scores and GPA at the college
Encouraged student to consider college graduation or employment rate
Follow-up student survey
Upward Bound staff encouraged student “a lot” to consider the college’s graduation rate or employment rate
Encouraged student to think about ability to adapt to college
Follow-up student survey
Upward Bound staff encouraged student “a lot” to think about his/her ability to adjust to the social and academic challenges of college
Discussed six key milestones with student
Follow-up student survey
Upward Bound staff discussed all of the following six college application-related milestones with student: (1) how to choose colleges to apply to, (2) admissions requirements (e.g., SAT/ACT scores, transcripts, and recommendations) for different colleges, (3) timelines for applying to college, (4) ways to prepare for the SAT/ACT, (5) how to complete the Common Application, and (6) how to complete the FAFSA
Encouraged student to apply to four or more colleges
Follow-up student survey
Upward Bound staff recommended student apply to four or more colleges
Encouraged student to complete the FAFSA by March 15
Follow-up student survey
Upward Bound staff encouraged student to complete the FAFSA by a certain date; and the date was March 15 or earlier
1.4.6 Analytic Methods
This report includes findings from two types of analyses:
1. Descriptive: To depict the characteristics of projects or students, or the level of Find the Fitimplementation, descriptive analyses were used. These analyses used basic statistics, such ascalculating averages or tabulating percentages. When comparing the statistics across groups (e.g.,treatment versus control), a common statistical test was applied to determine whether differenceswere real (“statistically significant”) or likely due to chance.
2. Impact: To determine the effects of Find the Fit on advising practices or student outcomes, impactanalyses were conducted. For each advising practice and student outcome, the average value for the

OVERVIEW
First Report: Enhanced College Advising in Upward Bound ▌pg. 18
treatment group was compared with that of the control group, using a statistical (regression) model that took into account the demographic and academic characteristics of participating students and projects before random assignment (at baseline).22 Additional analyses were conducted to see how sensitive the impact findings were to specific features of the statistical model.23 The difference in outcomes—the impact—was also tested for statistical significance using a probability threshold of .05, a level used by most researchers (i.e., a 95 percent likelihood that an impact observed by the study was not due to chance). Differences that did not meet the study’s threshold for statistical significance (p < .05) but were just short of it (p < .10) were consistently identified throughout the report.
Impacts were computed for projects and students overall, and for key subgroups of them that could be of interest to policymakers or Upward Bound project directors.24 Because the number of students in each subgroup is smaller than the number of students in the study overall these subgroup impact estimates are exploratory, but important. Prior research suggests that some groups of students are likely to have higher rates of college undermatch or face greater challenges in attending college or in attending more selective, higher quality institutions. Exposure to Find the Fit could affect these groups of students differently than those with fewer challenges. This information could be useful for targeting technical assistance or other aspects of program improvement. Exploratory analyses were also conducted to investigate whether impacts varied by levels of Find the Fit implementation. Exhibit 1.11 describes the rationale for examining each subgroup and the number of students in each group.
22 The seven student characteristics included in the regression models help improve the precision of the impact estimates and allow for the assessment of impacts for specific subgroups of students. The regression models also took into account that the outcomes being analyzed came from students who were grouped (clustered) within projects. Section B.3 of Appendix B presents more detail about the model and the student and project characteristics included.
23 Section B.3.3 in Appendix B describes the sensitivity analyses in more detail. 24 There are five student and project characteristics that define the subgroups: race/ethnicity, gender, baseline
college entrance exam score, host institution locale, and host institution type. Given the number of subgroups examined, some differences may be detected as significant due to chance. Details about subgroup variable construction are included in Section B.2.3 in Appendix B.

OVERVIEW
First Report: Enhanced College Advising in Upward Bound ▌pg. 19
Exhibit 1.11: Student and Project Subgroups, Rationale for Inclusion, and Sample Size
Subgroup Rationale Number of Students by Subgroup Category (%)
Gender Male students are more likely to undermatch than female students (Smith et al. 2013) and their college enrollment rates are lower (Bailey and Dynarski 2011); thus identifying strategies that improve male students’ enrollment is of particular policy interest.
Male: 1,592 (36.0%) Female: 2,828 (64.0%)
Race/ethnicity Students’ race/ethnicity is related to their probability of undermatch; for example, controlling for other factors, Black students are less likely to undermatch than other students (Roderick, Coca, and Nagaoka 2011; Smith et al. 2013). Latino students are particularly likely to attend local colleges (Hurtado, Saenz, Santos, and Cabrera 2008), potentially creating a barrier to reducing undermatch.
Hispanic: 1,139 (25.8%) White: 1,031 (23.4%) Black: 1,704 (38.6%) Other: 536 (12.2%)
College entrance exam score
Scores on exams like the SAT and ACT are used by many colleges as a factor for admission and a proxy for academic preparation in high school. Given that some approaches to address undermatch have focused exclusively on students with high academic qualifications (e.g., Hoxby and Turner 2013), one purpose of this study is to understand whether undermatch can be ameliorated for students with varying levels of academic qualifications.
Highest quartile: 218 (4.9%) Second quartile: 533 (12.0%) Third quartile: 826 (18.6%) Lowest quartile: 1,667 (37.5%) Missing score: 1,199 (27.0%)
Rural host institution
Students in rural areas may have fewer colleges to choose from nearby, which may partly explain why students from rural areas are more likely to undermatch in their college choices (Smith et al. 2013).
Rural: 461 (10.4%) Non-rural: 3,982 (89.6%)
Host institution type
The study’s analysis of historical Annual Performance Report data found that where students enroll in college is related to where their Upward Bound project is hosted. Students at Upward Bound projects hosted by two-year colleges enroll at their host institution at a higher rate than do students at projects hosted by four-year colleges.
Four-year college: 2,819 (63.4%) Two-year college: 1,069 (24.1%) Other: 555 (12.5%)

IMPACT FINDINGS
First Report: Enhanced College Advising in Upward Bound ▌pg. 20
2. Effects on Early Indicators of College Going
Find the Fit is hypothesized to lead to reduced college undermatch through changes in college application behaviors and choices, which may serve as early indicators of college going because they may influence whether and where a student attends college.
To understand whether Find the Fit affected these early indicators, the study compared differences between students in treatment and control group projects on four measures: (1) whether students applied to four or more colleges; (2) the selectivity levels of the colleges to which students applied; (3) the importance students place on academic quality in choosing a college; and (4) whether students completed the FAFSA by March 15. This chapter presents these impact findings.25
Find the Fit increased the share of students who applied to four or more colleges.
Research suggests that applying to more than one or two colleges increases students’ chances of enrolling (Smith 2013a) and of attending a more selective one (Pallais 2015). Based on this research, Find the Fit provided student materials and information to Upward Bound advisors and students on how expanding the number of colleges that students apply to can have these benefits. The materials specified a target of four or more colleges. The follow-up survey asked students to name up to eight colleges where they had applied by the spring of their senior year. The colleges students reported applying to were counted to create the interim outcome of whether or not students applied to at least four.
• Overall, students in treatment group projects were 9 percentage points more likely to report thatthey applied to four or more colleges (53 percent) than were students in control group projects (44percent) (Exhibit 2.1).
25 Appendix C contains the underlying data for each exhibit in this chapter, as well as sensitivity analyses for each estimate of Find the Fit’s overall impact on these interim outcomes.
Key Findings • Find the Fit increased the share of
students who applied to four or morecolleges, both for students overall andamong most student and projectsubgroups.
• Find the Fit resulted in studentsapplying to colleges of higherselectivity levels, both for studentsoverall and for most student andproject subgroups.
• Find the Fit did not increase theimportance students place onacademic quality in choosing acollege.
• Find the Fit did not increase the shareof students completing the FAFSA byMarch 15; but it did increase FAFSAcompletion by March 15 for Blackstudents and students in the lowestquartile of college entrance examscores.

IMPACT FINDINGS
First Report: Enhanced College Advising in Upward Bound ▌pg. 21
Exhibit 2.1: Impact of Find the Fit on Whether Students Applied to Four or More Colleges
Notes: *Difference is statistically significant at the .05 level. Sample = 1,920 treatment group students and 1,710 control group students. Percentage of students represents those who reported applying to four or more colleges by spring of their senior year in high school. Treatment group percentage and impact are estimated using the study’s regression model. Source: Follow-up student survey 2016.
• This positive impact on the number of college applications was consistent across subgroups(Exhibit 2.2 and Exhibit 2.3), with statistically significant effects for students of color (Black andHispanic), both male and female students, those with low and somewhat higher levels ofacademic preparation (as measured by college entrance exam scores), and students from projectshosted by two-year colleges and by institutions other than colleges and regardless of whetherprojects were located in rural or non-rural areas. The impact for students at Upward Boundprojects hosted by four-year colleges, which represent just under 60 percent of Upward Boundprojects in the study and in the program overall, was positive but just short of the threshold forstatistical significance.26
26 The p-value (.09) was greater than the study’s threshold for statistical significance (p-value < .05).
53.0*43.7
0%
20%
40%
60%
80%
100%Pe
rcenta
ge of
stude
nts
Treatment Control

IMPACT FINDINGS
First Report: Enhanced College Advising in Upward Bound ▌pg. 22
Exhibit 2.2: Impact of Find the Fit on Whether Students Applied to Four or More Colleges, by Student Subgroup
Notes: *Difference is statistically significant at the .05 level. Sample = 1,920 treatment group students and 1,710 control group students for college entrance exam score, 1,909 treatment group students and 1,704 control group students for race/ethnicity, and 1,913 treatment group students and 1,707 control group students for gender. Percentage of students represents those who reported applying to four or more colleges by spring of their senior year in high school. Treatment group percentage and impact are estimated using the study’s regression model. Source: Follow-up student survey 2016; APR 2014-15; college entrance exam data 2015; baseline student survey 2015.
70.5
66.3*
59.9*
50.5*
42.7*
56.6*
42.4
58.2*
52.1
55.2*
49.1*
66.7
52.6
51.4
40.5
34.8
44.5
35.8
49.0
43.6
46.3
39.1
0% 20% 40% 60% 80% 100%
Highest quartile
Second quartile
Third quartile
Lowest quartile
Missing score
Hispanic
White
Black
Other
Female
Male
Percentage of students
TreatmentControl
College entrance exam score
Race/ethnicity
Gender

IMPACT FINDINGS
First Report: Enhanced College Advising in Upward Bound ▌pg. 23
Exhibit 2.3: Impact of Find the Fit on Whether Students Applied to Four or More Colleges, by Project Subgroup
Notes: *Difference is statistically significant at the .05 level. ~Difference is not statistically significant but would be significant at the .10 level. Sample = 1,920 treatment group students and 1,710 control group students. Percentage of students represents those who reported applying to four or more colleges by spring of their senior year in high school. Treatment group percentage and impact are estimated using the study’s regression model. Source: Follow-up student survey 2016; APR 2014-15; IPEDS 2015-16.
Find the Fit resulted in students applying to colleges of higher selectivity levels.
Not only is the number of colleges that students apply to important in increasing college going and reducing undermatch, so too is where students apply (Hoxby and Turner 2013). To maximize the chances of enrolling in a college that matches or exceeds their academic qualifications, students should apply to colleges for which they are academically qualified—and even better colleges—even if these colleges are farther away, unfamiliar, or seem costly based on published tuition amounts. Find the Fit included activities directed at helping students understand how their academic qualifications and financial needs can intersect at more selective colleges with better outcomes for their students, including high graduation and employment rates.
The follow-up survey asked students to name up to eight colleges where they applied. To identify the selectivity level of the colleges each student applied to, each college first was linked to data in the NCES-Barron’s Admissions Competitiveness Index. Then, for students who applied to multiple colleges, the highest selectivity level among the student’s applications was identified.27 The study tested whether
27 Barron’s rankings include only four-year colleges, and some four-year colleges are not ranked. As of 2014, Barron’s seven rankings were “most competitive,” “highly competitive,” “very competitive,” “competitive,” “somewhat competitive,” “noncompetitive,” and “special/missing.” For purposes of this study, unranked four-year colleges were considered more selective than two-year colleges but less selective than four-year colleges ranked as “somewhat competitive” in the index; and two-year colleges were considered the least competitive
51.5~
47.5*
71.6*
44.0*
54.1*
45.2
36.4
52.2
26.2
46.0
0% 20% 40% 60% 80% 100%
Four-year
Two-year
Other
Rural
City/suburb/town
Percentage of students
TreatmentControl
Host institution type
Locale
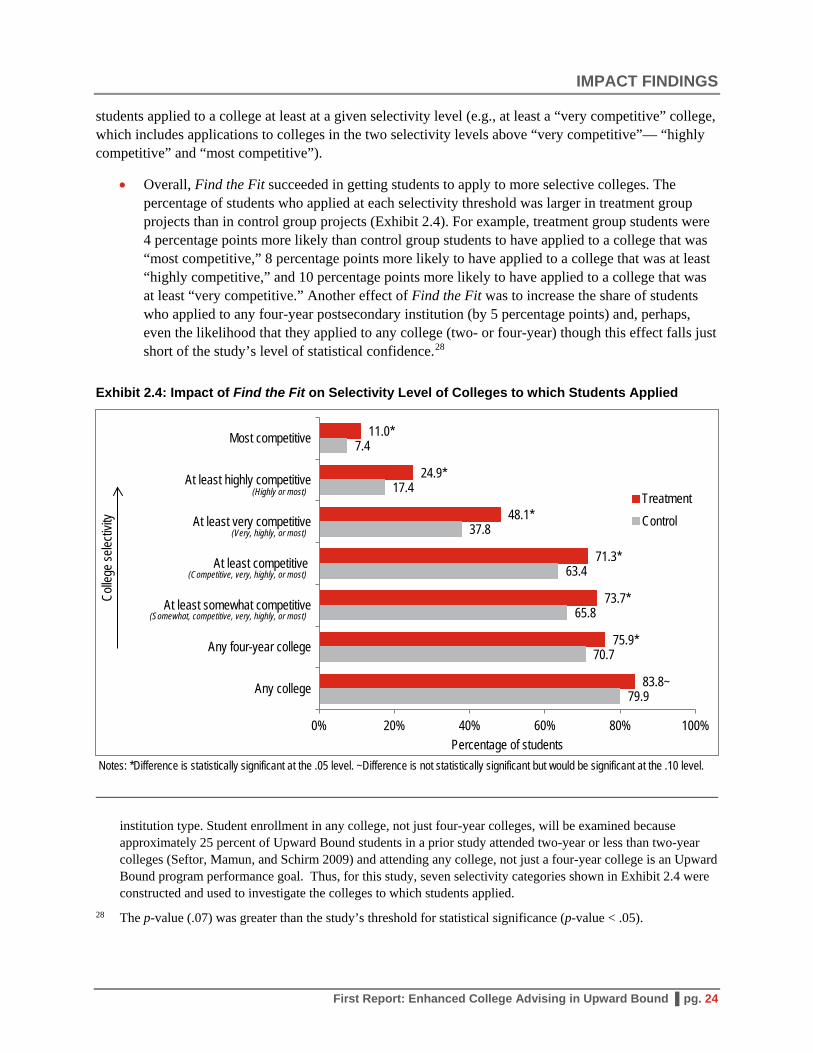
IMPACT FINDINGS
First Report: Enhanced College Advising in Upward Bound ▌pg. 24
students applied to a college at least at a given selectivity level (e.g., at least a “very competitive” college, which includes applications to colleges in the two selectivity levels above “very competitive”— “highly competitive” and “most competitive”).
• Overall, Find the Fit succeeded in getting students to apply to more selective colleges. Thepercentage of students who applied at each selectivity threshold was larger in treatment groupprojects than in control group projects (Exhibit 2.4). For example, treatment group students were4 percentage points more likely than control group students to have applied to a college that was“most competitive,” 8 percentage points more likely to have applied to a college that was at least“highly competitive,” and 10 percentage points more likely to have applied to a college that wasat least “very competitive.” Another effect of Find the Fit was to increase the share of studentswho applied to any four-year postsecondary institution (by 5 percentage points) and, perhaps,even the likelihood that they applied to any college (two- or four-year) though this effect falls justshort of the study’s level of statistical confidence.28
Exhibit 2.4: Impact of Find the Fit on Selectivity Level of Colleges to which Students Applied
Notes: *Difference is statistically significant at the .05 level. ~Difference is not statistically significant but would be significant at the .10 level.
institution type. Student enrollment in any college, not just four-year colleges, will be examined because approximately 25 percent of Upward Bound students in a prior study attended two-year or less than two-year colleges (Seftor, Mamun, and Schirm 2009) and attending any college, not just a four-year college is an Upward Bound program performance goal. Thus, for this study, seven selectivity categories shown in Exhibit 2.4 were constructed and used to investigate the colleges to which students applied.
28 The p-value (.07) was greater than the study’s threshold for statistical significance (p-value < .05).
11.0*
24.9*
48.1*
71.3*
73.7*
75.9*
83.8~
7.4
17.4
37.8
63.4
65.8
70.7
79.9
0% 20% 40% 60% 80% 100%
Most competitive
At least highly competitive
At least very competitive
At least competitive
At least somewhat competitive
Any four-year college
Any college
Percentage of students
Colle
ge se
lectiv
ity
TreatmentControl
(Highly or most)
(Very, highly, or most)
(Competitive, very, highly, or most)
(Somewhat, competitive, very, highly, or most)

IMPACT FINDINGS
First Report: Enhanced College Advising in Upward Bound ▌pg. 25
Sample = 1,920 treatment group students and 1,710 control group students. Treatment group percentage and impact are estimated using the study’s regression model. Percentage of students represents those who applied to a college of at least a given selectivity level (e.g., at least a “very competitive” college includes applications to colleges at the two selectivity levels above “very competitive”, “highly competitive” and “most competitive”). Differences were tested at each level by combining students who had applied to colleges at that selectivity level and the levels above. Source: Follow-up student survey 2016; NCES-Barron’s Admissions Competitiveness Index 2014.
• The positive impact on the selectivity of college applications was experienced by most groups ofstudents (Exhibit 2.5 and Exhibit 2.6). The exhibits’ pattern of some dark gray-shaded cells—indicating significant differences—for all subgroups but White students suggests Find the Fitincreased the selectivity level of applications, though not necessarily at every level for everygroup. As an example, among students with the highest SAT and ACT scores (the “highestquartile” of college entrance exam scores), Find the Fit increased the share who applied to the topschools in the country (e.g., “most competitive” colleges such as Harvard, Princeton, CarnegieMellon, and the University of California, Los Angeles and “highly competitive” colleges such asBoston University, Furman University, and the University of Wisconsin-Madison), but did notsignificantly increase the share of students who applied to colleges at lower selectivity levels.

IMPACT FINDINGS
First Report: Enhanced College Advising in Upward Bound ▌pg. 26
Exhibit 2.5: Impact of Find the Fit on Selectivity Level of Colleges to which Students Applied, by Student Subgroup
College Selectivity
Gender Race/Ethnicity College Entrance Exam Score
Female Male Hispanic White Black Other Highest Quartile
Second Quartile
Third Quartile
Lowest Quartile
Missing Score
Most competitive 4.3* 2.4 4.4~ 3.4 4.9* –2.1 18.7* 4.1 5.2* 1.9 2.0 At least highly competitive 8.3* 6.3* 11.4* 2.0 9.2* 5.8 13.2* 8.2* 7.7* 5.2~ 9.4* At least very competitive 11.3* 8.6* 13.4* 6.6 11.4* 8.6~ 8.7 16.5* 8.0* 10.4* 9.4* At least competitive 8.4* 7.3* 9.9* 6.5 7.0~ 10.3* 6.2 11.4* 5.6 7.0* 9.6* At least somewhat competitive 8.4* 6.9* 8.8* 7.2~ 7.3* 8.8~ 7.7 10.6* 6.6~ 7.2* 8.4* Any four-year college 5.6* 4.6 4.1 6.2 5.2 5.9 6.8 7.3~ 5.2 3.4 6.3~ Any college 3.9~ 4.1 –0.7 3.6 6.9* 5.2 6.8 5.4 6.3~ 2.3 3.5 Notes: *Difference is statistically significant at the .05 level (shaded dark gray). ~Difference is not statistically significant but would be significant at the .10 level (shaded light gray). Sample = 1,913 treatment group students and 1,707 control group students for gender, 1,909 treatment group students and 1,704 control group students for race/ethnicity, and 1,920 treatment group students and 1,710 control group students for college entrance exam score. Treatment group percentage and impact are estimated using the study’s regression model. The estimates are the percentage point difference between the percentage of students in the treatment group and control group who applied to a college a college of at least a given selectivity level (e.g., at least a “very competitive” college, which includes applications to colleges at the two selectivity levels above “very competitive”, “highly competitive” and “most competitive”). Source: Follow-up student survey 2016; NCES-Barron’s Admissions Competitiveness Index 2014; APR 2014-15; college entrance exam data 2015; baseline student survey 2015.

IMPACT FINDINGS
First Report: Enhanced College Advising in Upward Bound ▌pg. 27
Exhibit 2.6: Impact of Find the Fit on Selectivity Level of Colleges to which Students Applied, by Project Subgroup
College Selectivity
Host Institution Type Locale Four-Year College
Two-Year College Other Rural
City/ Suburb/ Town
Most competitive 3.2 3.1 7.4~ 5.5 3.4* At least highly competitive 5.6~ 8.6* 15.2* 7.5 7.6* At least very competitive 7.5* 11.8* 20.6* 16.4* 9.5* At least competitive 4.1 11.0* 19.6* 19.1* 6.5* At least somewhat competitive 4.5 10.9* 16.7* 15.3~ 6.8* Any four-year college 0.3 10.9* 14.8* 9.8 4.6~ Any college 1.5 5.6 11.6~ –3.3 4.9* Notes: *Difference is statistically significant at the .05 level (shaded dark gray). ~Difference is not statistically significant but would be significant at the .10 level (shaded light gray). Sample = 1,920 treatment group students and 1,710 control group students. Treatment group percentage and impact are estimated using the study’s regression model. The estimates are the percentage point difference between the percentage of students in the treatment group and control group who applied to a college a college of at least a given selectivity level (e.g., at least a “very competitive” college, which includes applications to colleges at the two selectivity levels above “very competitive”, “highly competitive” and “most competitive”). Source: Follow-up student survey 2016; NCES-Barron’s Admissions Competitiveness Index 2014; APR 2014-15; IPEDS 2015-16.

IMPACT FINDINGS
First Report: Enhanced College Advising in Upward Bound ▌pg. 28
Find the Fit had no significant impact on the importance students place on academic quality when choosing a college.
One avenue for improving the quality of the colleges that Upward Bound students ultimately attend is to help them understand the importance of this aspect of college fit for their long-term success (Roderick et al. 2008). That is, because attending more selective, higher quality colleges makes graduation and higher future earnings more likely (Bound et al. 2010; Bowen et al. 2009; Horn and Carroll 2006; Hoxby 2001), students should consider the highest quality colleges that their academic qualifications will allow.
Find the Fit emphasized the research supporting this link in the training webinars for Upward Bound advisors, provided activities for advisors to use with students to underscore how quality varies across colleges to which students could be admitted, and provided opportunities for students to explore and keep track of quality indicators as they conducted their college search. To measure whether Find the Fit had an effect on students’ thinking, the follow-up survey asked students to rate how important academic quality was to them in choosing a college.29
• Overall, slightly more than three-quarters of students in both the treatment and control groupsreported that college quality was “very important” to them (Exhibit 2.7). Thus, Find the Fit didnot affect the value students placed on this college attribute even as it increased the selectivity ofthe colleges to which students applied, as described above. This may indicate that the positiveimpacts on college applications were the result of other aspects of Find the Fit, not the result ofits efforts to change students’ thinking about college quality, or that the survey did not adequatelycapture students’ views.
Exhibit 2.7: Impact of Find the Fit on Whether Academic Quality was Very Important to Students in Choosing a College
Notes: Sample = 1,920 treatment group students and 1,710 control group students. Percentage of students represents those who reported academic quality is “very important” in choosing a college. Treatment group percentage and impact are estimated using the study’s regression model. Source: Follow-up student survey 2016.
29 Students were asked to rate the importance, to them, of “academic quality or reputation” in choosing a college to attend on a three-point scale of “not at all important,” “somewhat important,” or “very important”; the response of “very important” was used to test the impact. Impact results were similar when “somewhat important” and “very important” were combined. (See Exhibit C.8 in Appendix C.)
77.3 78.1
0%
20%
40%
60%
80%
100%
Perce
ntage
ofstu
dents
Treatment Control

IMPACT FINDINGS
First Report: Enhanced College Advising in Upward Bound ▌pg. 29
• There were no significant impacts for any subgroups of students or projects (Exhibit 2.8 andExhibit 2.9, respectively); for all of the student and project subgroups examined, a similarpercentage of students in the treatment and control groups reported that colleges’ academicquality was “very important.”
Exhibit 2.8: Impact of Find the Fit on Whether Academic Quality was Very Important to Students in Choosing a College, by Student Subgroup
Notes: Sample = 1,920 treatment group students and 1,710 control group students for college entrance exam score, 1,909 treatment group students and 1,704 control group students for race/ethnicity, and 1,913 treatment group students and 1,707 control group students for gender. Percentage of students represents those who reported academic quality is “very important” in choosing a college. Treatment group percentage and impact are estimated using the study’s regression model. Source: Follow-up student survey 2016; APR 2014-15; college entrance exam data 2015; baseline student survey 2015.
72.9
76.4
72.1
78.4
80.0
74.3
72.1
84.6
72.7
79.0
74.4
80.0
78.9
75.4
78.6
78.7
76.5
73.0
84.2
73.9
80.5
73.7
0% 20% 40% 60% 80% 100%
Highest quartile
Second quartile
Third quartile
Lowest quartile
Missing score
Hispanic
White
Black
Other
Female
Male
Percentage of students
TreatmentControl
College entrance exam score
Race/ethnicity
Gender

IMPACT FINDINGS
First Report: Enhanced College Advising in Upward Bound ▌pg. 30
Exhibit 2.9: Impact of Find the Fit on Whether Academic Quality was Very Important to Students in Choosing a College, by Project Subgroup
Notes: Sample = 1,920 treatment group students and 1,710 control group students. Percentage of students represents those who reported academic quality is “very important” in choosing a college. Treatment group percentage and impact are estimated using the study’s regression model. Source: Follow-up student survey 2016; APR 2014-15; IPEDS 2015-16.
Find the Fit had no significant impact on completing the FAFSA by March 15 for students overall, though it may have improved FAFSA completion rates for some student subgroups underrepresented in college.
Knowing what financial support is available to them can ease students’ concerns about college affordability, which may help students feel more comfortable applying to, and ultimately enrolling in, more selective colleges. The majority of Upward Bound students are low income (88 percent), likely making them eligible for need-based federal, state, and local aid. To take advantage of most forms of financial aid, students must complete the FAFSA. The earlier they do so, the more aid may be available to them, as state and local aid is often distributed on a first-come, first-served basis.
To help students access all financial aid for which they are eligible and have accurate information about the net costs of college, the Find the Fit student materials and message reminders, as well as the training webinars, recommend completing the FAFSA before March 15 of students’ senior year, which is before many state financial aid deadlines.30 Data from the Federal Student Aid (FSA) office’s records were used to determine whether the student had completed the FAFSA by this date.
30 The federal FAFSA deadline is not until the end of the academic year for which the student is applying. For example, in this study, students were applying for aid for the 2016-17 academic year. The federal deadline for
77.2
75.7
81.5
73.9
77.7
76.7
80.2
80.9
75.9
78.4
0% 20% 40% 60% 80% 100%
Four-year
Two-year
Other
Rural
City/suburb/town
Percentage of students
TreatmentControl
Host institution type
Locale

IMPACT FINDINGS
First Report: Enhanced College Advising in Upward Bound ▌pg. 31
• There was no significant difference between the percentages of treatment and control groupstudents who completed the FAFSA by Find the Fit’s target date of March 15 of students’ senioryear (Exhibit 2.10).31 About 65 percent of students in treatment group projects and about 61percent of students in control group projects met the target date.
Exhibit 2.10: Impact of Find the Fit on Whether Students Completed the FAFSA by March 15
Note: Sample = 2,336 treatment group students and 2,107 control group students. Percentage of students represents those who completed the FAFSA by March 15 of their senior year of high school. Treatment group percentage and impact are estimated using the study’s regression model. Source: FSA 2016.
• There were no significant impacts for most groups of students. However, Find the Fit may havehad a positive impact on FAFSA completion for two student subgroups that are typicallyunderrepresented in higher education (Exhibit 2.11): Black students and students with the leastacademic preparation (those scoring in the lowest quartile of college entrance exam scoresnationally). Black students in treatment group projects were 10 percentage points more likely tocomplete the FAFSA by March 15 than their peers in control group projects. Likewise, amongstudents with the least academic preparation, those in treatment group projects were 8 percentagepoints more likely to complete the FAFSA by March 15 than their control group counterparts. Itis possible that these statistically significant subgroup effects were a result of random chancestemming from the large number of subgroups examined, though treatment group completion ofthe FAFSA was also higher than in the control group for 11 of the other 14 subgroups (just not
that academic year was June 30, 2017. States and colleges often have separate deadlines that are in the spring prior to the academic year in which the student is applying for aid. For example, Florida’s FAFSA deadline for the 2016-17 academic year was May 15, 2016. Therefore, Florida students who completed the FAFSA by Find the Fit’s target date of March 15 would meet the state’s financial aid deadline.
31 Patterns for submitting (rather than completing) the FAFSA by March 15 were also examined. When a student submits a FAFSA, the application can subsequently be rejected by FSA if it is missing key pieces of information; applications that are not rejected are considered complete. FAFSA submission rates were about 5 percentage points higher than FAFSA completion rates for students in both the treatment and control groups. The impact of Find the Fit was similar for both submission and completion.
64.6 60.9
0%
20%
40%
60%
80%
100%
Perce
ntage
ofstu
dents
Treatment Control

IMPACT FINDINGS
First Report: Enhanced College Advising in Upward Bound ▌pg. 32
statistically significant). Positive impacts on early FAFSA completion were promising – just short of the bar for significant – for female students, who comprise 64 percent of Upward Bound participants, and for students from the 31 percent of Upward Bound projects that are hosted by two year colleges.32
32 The p-values (.08 and .07, respectively) were greater than the study’s threshold for statistical significance (p-value < .05).
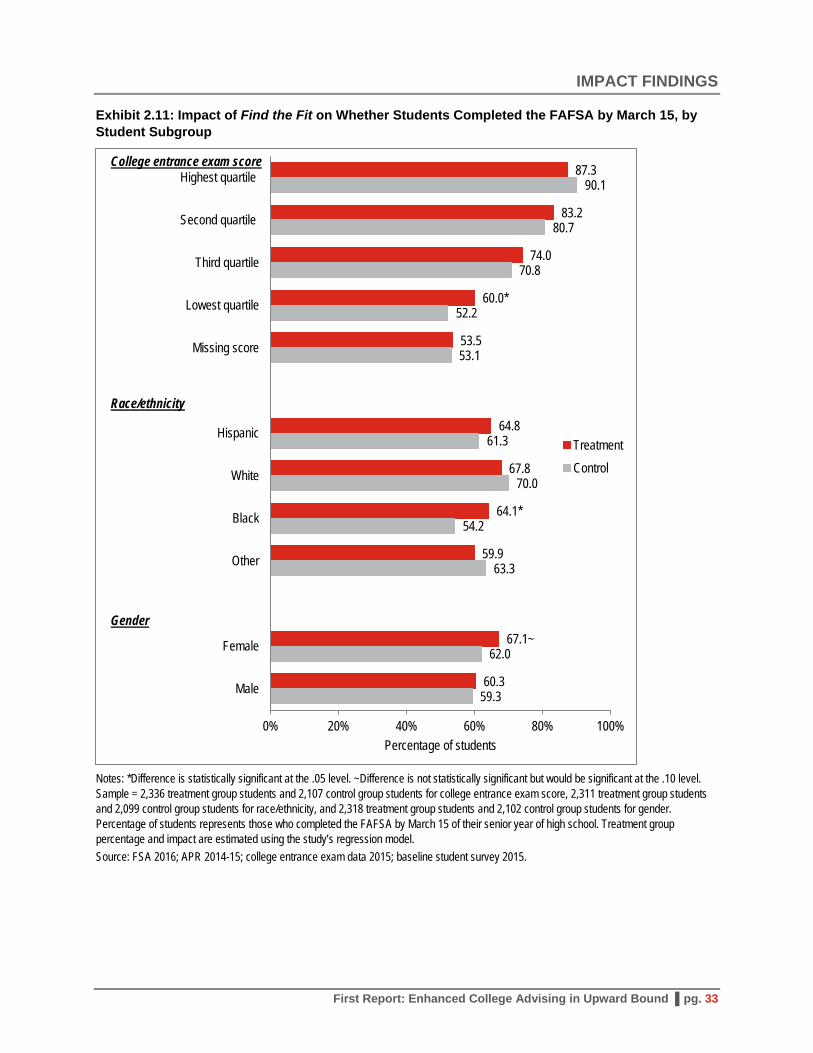
IMPACT FINDINGS
First Report: Enhanced College Advising in Upward Bound ▌pg. 33
Exhibit 2.11: Impact of Find the Fit on Whether Students Completed the FAFSA by March 15, by Student Subgroup
Notes: *Difference is statistically significant at the .05 level. ~Difference is not statistically significant but would be significant at the .10 level. Sample = 2,336 treatment group students and 2,107 control group students for college entrance exam score, 2,311 treatment group students and 2,099 control group students for race/ethnicity, and 2,318 treatment group students and 2,102 control group students for gender. Percentage of students represents those who completed the FAFSA by March 15 of their senior year of high school. Treatment group percentage and impact are estimated using the study’s regression model. Source: FSA 2016; APR 2014-15; college entrance exam data 2015; baseline student survey 2015.
87.3
83.2
74.0
60.0*
53.5
64.8
67.8
64.1*
59.9
67.1~
60.3
90.1
80.7
70.8
52.2
53.1
61.3
70.0
54.2
63.3
62.0
59.3
0% 20% 40% 60% 80% 100%
Highest quartile
Second quartile
Third quartile
Lowest quartile
Missing score
Hispanic
White
Black
Other
Female
Male
Percentage of students
TreatmentControl
College entrance exam score
Race/ethnicity
Gender

IMPACT FINDINGS
First Report: Enhanced College Advising in Upward Bound ▌pg. 34
Exhibit 2.12: Impact of Find the Fit on Whether Students Completed the FAFSA by March 15, by Project Subgroup
Notes: ~Difference is not statistically significant but would be significant at the .10 level. Sample = 2,336 treatment group students and 2,107 control group students. Percentage of students represents those who completed the FAFSA by March 15 of their senior year of high school. Treatment group percentage and impact are estimated using the study’s regression model. Source: FSA 2016; APR 2014-15; IPEDS 2015-16.
.
64.4
61.5~
68.7
67.7
64.2
63.7
52.2
64.3
55.6
61.6
0% 20% 40% 60% 80% 100%
Four-year
Two-year
Other
Rural
City/suburb/town
Percentage of students
TreatmentControl
Host institution type
Locale

IMPLEMENTATION FINDINGS
First Report: Enhanced College Advising in Upward Bound ▌pg. 35
3. Implementation of the Enhanced College Advising Strategy
Given the diversity in Upward Bound projects’ approaches to college advising (Epps et al. 2016) and the flexibility to use Find the Fit as they deemed best, it was important to investigate the extent to which Find the Fit was implemented and affected college advising in expected ways. This chapter describes these findings, to provide context for the impacts on early indicators of college going presented in the previous chapter and to explore the potential ways in which those impacts may have come about.
All projects implemented Find the Fit, but they implemented to varying degrees.
For Find the Fit to plausibly affect students’ college-going behavior, the components of the package needed to be used by advisors and students in the treatment group projects to at least some extent.
Information on implementation of Find the Fit came from surveys of treatment group project staff and intervention monitoring data, such as records of which projects attended advisor trainings and which students received text or email messages.33 To summarize the extent of implementation, treatment group projects were divided into three categories— “high,” “low,” and “moderate” —based on how much they carried out each of the three components of Find the Fit.
High implementation: Projects that implemented 75 percent or more of each component—meaning the project had to: (1) report that it used at least three-quarters—10 of 13—of the materials with students; (2) send text or email messages to at least three-quarters of its students; and (3) have some project staff in attendance at over three-quarters—all three—of the training webinars for advisors.
Low implementation: Projects that implemented less than 25 percent of any one component.
Moderate implementation: Projects that implemented more than a quarter but not necessarily 75 percent of each component—that is, they were in the moderate or high category for each component but were not high on all components. 34
33 Details of Find the Fit are included in Appendix A. 34 Four projects did not respond to the project survey, so the number of student materials they used was unknown.
Of these projects, one did not attend any webinars, placing it in the low overall implementation category. The other three had moderate or high implementation on two of the three components (i.e., student messaging and
Key Findings • Find the Fit was implemented to some extent
by all treatment projects:
− Over half of projects used at least 10 of the 13 Find the Fit student materials.
− Over three-quarters of projects had staff in attendance at all three training webinars.
− At least three-quarters of students were sent text or email messages in all but three projects.
• Find the Fit increased the emphasis projectsgave to two of seven advising practices:encouraging students to apply to four ormore colleges, and to complete the FAFSAby March 15. It had no effects on the otherpractices measured.

IMPLEMENTATION FINDINGS
First Report: Enhanced College Advising in Upward Bound ▌pg. 36
• Over one-third (37 percent) of treatment group projects implemented Find the Fit at a high level,according to this definition, and an additional 51 percent implemented to a moderate extent(Exhibit 3.1). Just 12 percent of projects were low implementers.
Exhibit 3.1: Treatment Group Projects’ Overall Implementation of Find the Fit
Notes: Sample = 98 treatment group projects. Percent represents the share of treatment group projects that were high, moderate, and low implementers of Find the Fit. Four projects did not respond to the project survey, so the number of student materials they used was unknown. Of these projects, one did not attend any webinars, indicating that it had low overall implementation. The other three had moderate or high implementation on two of the three components (i.e., student messaging and webinar attendance), so they were coded as having moderate overall implementation despite the missing data on their use of student materials. Source: Project survey 2016; intervention monitoring data 2015-16.
• Across projects, there was a high degree of implementation of two of the three Find the Fitcomponents (Exhibit 3.2). Almost all treatment group projects sent messages to at least three-quarters of their students (97 percent) and had staff attend all three training webinars (77 percent).
Implementation varied mainly in the extent to which projects used the student materials (Exhibit 3.2). Just over half of the projects reported using at least three-quarters of the materials in students’ personalized folders (10 of 13); another 40 percent of projects reported using between 4 and 9 materials; and five percent of projects used 3 or fewer of them. On average, projects used 9 of the 13 materials (not shown). The four most commonly used student materials were a handout about the various aspects of college fit (e.g., academic, social), the college application timeline, a handout on how to search for scholarships and grants, and a planner to record college search information including indicators of college quality. Each was reportedly used by more than 80 percent of projects (see Exhibit D.1in Appendix D). These four materials addressed the three challenges that Find the Fit aims to help students overcome: logistics of applying, financial hurdles, and limited expectations. The variation in use of these and the other student materials may reflect differences in projects’ regular advising practices—in their capacities to carry out
webinar attendance), so they were coded as having moderate overall implementation despite the missing data on their use of student materials.
High, 37%
Moderate, 51%
Low, 12%

IMPLEMENTATION FINDINGS
First Report: Enhanced College Advising in Upward Bound ▌pg. 37
the enhanced strategies (e.g., levels of staffing, frequency of project meetings), and/or in their students’ needs–but the study did not collect information about why projects made the choices they did. Exploratory analyses investigating whether impacts varied by level of implementation did not find consistent patterns across these levels (see Appendix D).
Exhibit 3.2: Treatment Group Projects’ Level of Implementation of Find the Fit Components
Component Treatment Group Projects
(%) (N) Projects’ Use of Student Materials Low (0 to 3 materials) 5.3 5 Moderate (4 to 9 materials) 41.5 39 High (10 or more materials) 53.2 50 Percentage of Projects’ Students Who Were Sent Text or Email Messages Low (25% or less of students) 0.0 0 Moderate (26% to 74% of students) 3.1 3 High (75% or more of students) 96.9 95 Projects’ Webinar Attendance Low (0 webinars) 7.1 7 Moderate (1 to 2 webinars) 16.3 16 High (3 webinars) 76.5 75 Notes: Sample = 94 treatment group projects for number of student materials that projects reported using, 98 treatment group projects for percentage of students who were sent text or email messages, and 98 treatment group projects for number of webinars attended. For each component, low implementation is defined as implementing 25 percent or less of the component, moderate implementation is defined as implementing between 26 and 74 percent of the component, and high implementation is defined as implementing 75 percent or more of the component. Source: Project survey 2016; intervention monitoring data 2015-16.
Find the Fit had a significant impact on the number of messages students reported receiving from their Upward Bound project.
The Find the Fit programmed messages sent to students via text or email reminded them of key steps in the college search, application, and enrollment processes. Some of these messages were tailored to where individual students intended to enroll, if they provided that information. While Upward Bound projects might ordinarily communicate with students in various electronic ways, it was expected that the Find the Fit messages would alter the frequency and content of the communications.
The system used for Find the Fit implementation generated information on which students in treatment group projects received messages and for how long. On the follow-up survey, students in both the treatment and control group projects were asked how many text messages they had received from staff at their Upward Bound project since the start of their senior year of high school; the survey did not gather information about the content of these communications.
• Almost all treatment group students (92 percent) were sent at least one message via text or email,according to intervention monitoring data (Exhibit 3.3). The vast majority of students (86percent) were sent messages through the end of their senior year in high school. Just 61 percent ofstudents were sent messages through the end of the summer after their senior year because only

IMPLEMENTATION FINDINGS
First Report: Enhanced College Advising in Upward Bound ▌pg. 38
87% 61%86%92%
the 65 projects that included a post-12th-grade summer bridge program could participate in the summer portion of Find the Fit’s messaging component.35
Exhibit 3.3: Duration that Treatment Group Students Were Sent Find the Fit Messages
Initial Message Through March 15 FAFSA
Target Through End of Senior
YearThrough Summer After
Expected HS Graduation
Note: Sample = 2,336 treatment group students. Percent represents the share of students who were sent text or email messages at each time point. Source: Intervention monitoring data 2015-16
• Students in the treatment group reported receiving significantly more messages from theirUpward Bound project than did those in the control group (Exhibit 3.4). More control groupstudents (21 percent) reported receiving no text message from their Upward Bound compared totreatment group students (14 percent). Also, while just under half of the control group (48percent) received 11 or more messages, more than 60 percent of the treatment group did.
Exhibit 3.4: Students’ Reported Receipt of Text Messages from Their Upward Bound Project
Number of Messages
Treatment Group Students
(%)
Control Group Students
(%) None 14.0 21.0 1–5 10.3 15.6 6–10 14.7 14.6 11–20 17.7 12.6 More than 20 43.4 36.1 F-test of differencea p=.001 a The p-value shown in this row is for a test of whether impacts statistically differed between the categories indicated in the rows above. Notes: Sample = 1,911 treatment group students and 1,707 control group students. Percentage of students represents those who reported receiving the corresponding number of text messages from their Upward Bound project. Source: Follow-up student survey 2016.
35 Only 66 percent of treatment projects had an after 12th-grade summer program.

IMPLEMENTATION FINDINGS
First Report: Enhanced College Advising in Upward Bound ▌pg. 39
Find the Fit had a significant impact on two of seven target advising practices as reported by students.
Find the Fit was expected to affect students’ college outcomes through the advising Upward Bound staff delivered and students received. Find the Fit provided advisors training on promising strategies and materials to enhance their advising practices. To examine how, if at all, Find the Fit influenced advisors’ practices, the follow-up student survey asked treatment and control group students about the content of the advising they experienced in Upward Bound. Seven specific areas of advising were measured because they were considered likely avenues through which Find the Fit might influence students’ college-going behaviors.
• More students in treatment group projects (about 57 percent) than in control group projects (51percent) reported that staff from their Upward Bound project encouraged them to apply to four ormore colleges (Exhibit 3.5). This impact on advising is consistent with the finding reported inChapter 2 that Find the Fit increased the share of students who applied to four or more colleges(see Exhibit 2.1).
• More students in treatment group projects than in control group projects (44 versus 38 percent)reported that staff from their Upward Bound project encouraged them to complete the FAFSA byMarch 15. This was reflected in the improved FAFSA completion rates for some subgroups ofstudents—those who are Black and academically low performing (see Exhibit 2.11).
• Find the Fit had no significant impacts on projects’ advising on several advising topics that theconceptual framework shown in Exhibit 1.5 hypothesized would affect interim outcomes. Forexample, relatively few students in either the treatment group or control group (just over a third)reported being encouraged by project staff to consider indicators of college quality—graduationor employment rates—in choosing where to apply. Conversely, the majority of students in boththe treatment group and the control group (about three-quarters) reported being encouraged byproject staff to consider net costs in choosing where to apply.

IMPLEMENTATION FINDINGS
First Report: Enhanced College Advising in Upward Bound ▌pg. 40
Exhibit 3.5: Effects of Find the Fit on College Advising in Upward Bound Projects
a The six milestones are: (1) how to choose colleges to apply to; (2) admissions requirements (e.g., SAT/ACT scores, transcripts, and recommendations) for different colleges; (3) timelines for applying to college; (4) ways to prepare for the SAT/ACT; (5) how to complete the Common Application; and (6) how to complete the FAFSA. Notes: *Difference is statistically significant at the .05 level. Sample =1,910 treatment group students and 1,702 control group students for encouraged to consider net costs, 1,816 treatment group students and 1,627 control group students for encouraged to consider college match, 1,819 treatment group students and 1,629 control group students for encouraged to consider graduation/employment rates, 1,897 treatment group students and 1,698 control group students for encouraged to think about ability to adapt to college, 1,890 treatment group students and 1,686 control group students for discussed all six milestones with advisor, 1,773 treatment group students and 1,593 control group students for encouraged to apply to four or more colleges, and 1,903 treatment group students and 1,696 control group students for encouraged to complete the FAFSA by March 15. Percentage represents the share of students who reported experiencing each advising practice. Treatment group percentage and impact are estimated using the study’s regression model. Source: Follow-up student survey 2016.
76.8
47.5
36.1
60.3
78.1
57.4*
44.1*
75.0
47.8
35.2
61.7
78.9
51.2
38.3
0% 20% 40% 60% 80% 100%
Encouraged to consider net costs
Encouraged to consider college match
Encouraged to consider graduation/employmentrates
Encouraged to think about ability to adapt tocollege
Discussed six key milestones with advisor
Encouraged to apply to four or more colleges
Encouraged to complete the FAFSA by March 15
Percentage of students
TreatmentControl
a

LOOKING AHEAD
First Report: Enhanced College Advising in Upward Bound ▌pg. 41
4. Looking Ahead
The implementation patterns and effects on early indicators of college going in this report suggest that Find the Fit may be more effective at changing concrete behaviors rather than changing students’ or advisors’ mindsets. Specifically, Find the Fit increased the number of college applications students submitted, the selectivity level of the colleges to which they applied, and, perhaps, early completion of the FAFSA for some groups. But Find the Fit did not, for example, change the consideration that students said they gave to the academic quality of the colleges they were interested in attending.
These findings support some of the hypothesized pathways to reducing college undermatch among Upward Bound students, but also raise some questions to be explored in future analyses. The next two reports will investigate whether the effects on interim outcomes translate into improved college outcomes, specifically reduced college academic undermatch, increased enrollment in colleges of higher selectivity, and longer-term college persistence. To add context these later reports also will examine other characteristics of the colleges in which students enrolled, including their cost since it remains unknown whether improving college selectivity can have adverse consequences.

REFERENCES
First Report: Enhanced College Advising in Upward Bound ▌pg. 42
References
Aronson, J., Fried, C.B., and Good, C. (2002). Reducing the Effects of Stereotype Threat on African American College Students by Shaping Theories of Intelligence. Journal of Experimental Social Psychology, 38(2): 113-125.
Avery, C. (2013). Evaluation of the College Possible Program: Results from a Randomized Controlled Trial (NBER No. w19562). Cambridge, MA: National Bureau of Economic Research.
Avery, C., Howell, J.S., and Page, L. (2014). A Review of the Role of College Applications on Students’ Postsecondary Outcomes (College Board Research Brief). New York, NY: The College Board. https://research.collegeboard.org/sites/default/files/publications/2015/1/college-board-research-brief-review-role-college-applications-postsecondary-outcomes.pdf
Avery, C., and Kane, T.J. (2004). Student Perceptions of College Opportunities: The Boston COACH Program. In C. Hoxby (Ed.), College Choices: The Economics of Where to Go, When to Go, and How to Pay for It. Chicago: University of Chicago Press.
Bailey, M.J., and Dynarski, S.M. (2011). Gains and Gaps: Changing Inequality in U.S. College Entry and Completion. (Education Policy Initiative Working Paper 05-2011). Ann Arbor, MI: Gerald R. Ford School of Public Policy. http://edpolicy.umich.edu/files/05-2011_gains-and-gaps.pdf
Bastedo, M. N., & Flaster, A. (2014). Conceptual and Methodological Problems in Research on College Undermatch. Educational Researcher, 43(2), 93-99.
Bettinger, E.P., Long, B.T., Oreopoulos, P., and Sanbonmatsu, L. (2012). The Role of Application Assistance and Information in College Decisions: Results from the H&R Block FAFSA Experiment. Quarterly Journal of Economics, 127(3): 1205-1242.
Bound, J., Lovenheim, M.F., and Turner, S. (2012). Increasing Time to Baccalaureate Degree in the United States. Association for Education Finance and Policy, 7(4): 375-424.
Bound, J., Lovenheim, M.F., and Turner, S. (2010). Why Have College Completion Rates Declined? An Analysis of Changing Student Preparation and Collegiate Resources. American Economic Journal: Applied Economics, 2(3): 129-157.
Bowen, W.G., Chingos, M.M., and McPherson, M.S. (2009). Crossing the Finish Line: Completing College at America’s Public Universities. Princeton, NJ: Princeton University Press.
Byndloss, D.C., and Reid, C. (2013). Promoting College Match for Low-Income Students: Lessons for Practitioners (MDRC Policy Brief). New York: MDRC. http://www.mdrc.org/sites/default/files/college_match_brief.pdf
Cannon, R., and Goldrick-Rab, S. (2016). Too Late? Too Little: The Timing of Financial Aid Applications (Wisconsin HOPE Lab). https://www.luminafoundation.org/files/resources/too-late-too-little.pdf
Carnevale, A., Fasules, M.L., Huie, S.B., and Troutman, D.R. (2017). Majors Matter Most. The Economic Value of Bachelor’s Degrees from The University of Texas System. Washington, DC: Center on Education and the Workforce.
Carrell, S.E., and Sacerdote, B. (2013). Why do College Going Interventions Work? (NBER Working Paper No. 19031). Cambridge, MA: National Bureau of Economic Research. http://www.nber.org/papers/w19031.pdf
Castleman, B.L., and Page, L.C. (2016). Freshman Year Financial Aid Nudges: An Experiment to Increase FAFSA Renewal and College Persistence. Journal of Human Resources, 51(2): 389-415.

REFERENCES
First Report: Enhanced College Advising in Upward Bound ▌pg. 43
Castleman, B.L., and Page, L.C. (2015). Summer Nudging: Can Personalized Text Messages and Peer Mentor Outreach Increase College Going among Low-Income High School Graduates? Journal of Economic Behavior & Organization, 115: 144-160.
Dale, S.B., and Krueger, A.B. (2014). Estimating the Effects of College Characteristics over the Career Using Administrative Earnings Data. Journal of Human Resources, 49(2): 323-358.
Dillon, E.W., and Smith, J.A. (2017). The Consequences of Academic Match between Students and Colleges (CESifo Working Paper No. 6344). Munich, Germany: Center for Economic Studies and Ifo Institute (CESifo). http://hdl.handle.net/10419/155586
Dynarski, S.M., and Scott-Clayton, J.E. (2006). The Cost of Complexity in Federal Student Aid: Lessons from Optimal Tax Theory and Behavioral Economics. National Tax Journal, 59(2): 319-356.
Eagan, K., Stolzenberg, E.B., Bates, A.K., Aragon, M.C., Suchard, M.R., and Rios-Aguilar, C. (2015). The American Freshman: National Norms Fall 2015. Los Angeles: Higher Education Research Institute, University of California, Los Angeles.
Epps, S.R., Jackson, R.H., Olsen, R.O., Shivji, A., and Roy, R. (2016). Upward Bound at 50: Reporting on Implementation Practices Today (NCEE 2017-4005). Washington, DC: National Center for Education Evaluation, Institute of Education Sciences, U.S. Department of Education.
Feeney, M., and Heroff, J. (2013). Barriers to Need-Based Financial Aid: Predictors of Timely FAFSA Completion among Low-Income Students. Journal of Student Financial Aid, 43(2): 65-85.
Glazerman, S., Protik, A., Teh, B., Bruch, J., and Max, J. (2013). Transfer Incentives for High-Performing Teachers: Final Results from a Multisite Randomized Experiment (NCEE 2014-4003). Washington, DC: National Center for Education Evaluation and Regional Assistance, Institute of Education Sciences, U.S. Department of Education.
Goodman, J., Hurwitz, M., and Smith, J. (2017). Access to 4-Year Public Colleges and Degree Completion. Journal of Labor Economics, 35(3): 829-867.
Horn, L.J., Chen, X., and Chapman, C. (2003). Getting Ready to Pay for College: What Students and Their Parents Know about the Cost of College Tuition and What They Are Doing to Find Out (NCES 2003-030). Washington, DC: National Center for Education Statistics, Institute of Education Sciences, U.S. Department of Education.
Horn, L., and Carroll, C.D. (2006). Placing College Graduation Rates in Context: How 4-Year College Graduation Rates Vary with Selectivity and the Size of Low-Income Enrollment. Postsecondary Education Descriptive Analysis Report. Washington, DC: National Center for Education Statistics, Institute of Education Sciences, U.S. Department of Education. http://nces.ed.gov/pubs2007/2007161.pdf
Howell, J.S., and Pender, M. (2016). The Costs and Benefits of Enrolling in an Academically Matched College. Economics of Education Review, 51: 152-168.
Howell, J.S., Pender, M., and Kumar, A. (2016). Academic Match and Fit: What Can We Learn from Stated Preferences, Student Actions, and Collegiate Outcomes? In A.P. Kelly, J.S. Howell, and C. Sattin-Bajaj (Eds.), Matching Students to Opportunity: Expanding College Choice, Access, and Quality. Cambridge, MA: Harvard University Press.
Hoxby, C. (2001). The Return of Attending a More Selective College: 1960 to the Present. In M. Devlin and J. Meyerson (Eds.), Forum Futures: Exploring the Future of Higher Education, 2000 Papers. San Francisco: Jossey-Bass.
REFERENCES
First Report: Enhanced College Advising in Upward Bound ▌pg. 44
Hoxby, C., and Avery, C. (2013). The Missing “One-Offs”: The Hidden Supply of High-Achieving, Low-Income Students. Brookings Papers on Economic Activity, 2013(1): 1-65.
Hoxby, C., and Turner, S. (2013). Expanding College Opportunities for High-Achieving, Low Income Students (SIEPR Discussion Paper No. 12-014). Stanford, CA: Stanford Institute for Economic Policy Research.
Hudes, R.P. (2016). Student-College Match and Bachelor’s Degree Completion (dissertation). South Orange, NJ: Seton Hall University.
Hurtado, S., Saenz, V.B., Santos, J.L., and Cabrera, N.L. (2008). Advancing in Higher Education: A Portrait of Latina/o College Freshmen at Four-Year Institutions, 1975-2006. Los Angeles, CA: Higher Education Research Institute, University of California, Los Angeles. https://www.heri.ucla.edu/PDFs/pubs/TFS/Special/Monographs/AdvancingInHigherEducation-LatinoTrends.pdf
Judkins, D.R., and Porter, K.E. (2015). Robustness of Ordinary Least Squares in Randomized Clinical Trials. Statistics in Medicine, 20(35): 1763-1773.
Max, J., Constantine, J., Wellington, J., Hallgren, K., Glazerman, S., Chiang, H., and Speroni, C. (2014). Evaluation of the Teacher Incentive Fund: Implementation and Early Impacts of Pay-for-Performance after One Year (NCEE 2014-4019). Washington, DC: National Center for Education Evaluation and Regional Assistance, Institute of Education Sciences, U.S. Department of Education.
Ovink, S., Kalogrides, D., Nanney, M., and Delaney, P. (2017). College Match and Undermatch: Assessing Student Preferences, College Proximity, and Inequality in Post-College Outcomes. Research in Higher Education, 1-38.
Page, L.C., Castleman, B.L., and Meyer, K. (2016). Customized Nudging to Improve FAFSA Completion and Income Verification. Available at SSRN: https://ssrn.com/abstract=2854345
Page, L.C., and Iriti, J.E. (2016). On Undermatching and College Cost: A Case Study of the Pittsburgh Promise. In A.P. Kelly, J.S. Howell, and C. Sattin-Bajaj (Eds.), Matching Students to Opportunity: Expanding College Choice, Access, and Quality. Cambridge, MA: Harvard University Press.
Pallais, A. (2015). Small Differences that Matter: Mistakes in Applying to College. Journal of Labor Economics, 33(2): 493-520.
Puma, M.J., Olsen, R.B., Bell, S.H., and Price, C. (2009). What to Do When Data Are Missing in Group Randomized Controlled Trials (NCEE 2009-0049). Washington, DC: National Center for Education Evaluation and Regional Assistance, Institute of Education Sciences, U.S. Department of Education.
Radford, A., and Howell, J. (2014). Addressing Undermatch: Creating Opportunity and Social Mobility. In R.D. Kahlenberg (Ed.), The Future of Affirmative Action: New Paths to Higher Education Diversity after Fisher v. University of Texas. New York, NY: Century Foundation Press.
Roderick, M., Coca, V., and Nagaoka, J. (2011). Potholes on the Road to College: High School Effects in Shaping Urban Students’ Participation in College Application, Four-Year College Enrollment, and College Match. Sociology of Education, 84(3): 178-211.
Roderick, M., Nagaoka, J., Coca, V., Moeller, E., Roddie, K., Gilliam, J., and Patton, D. (2008). From High School to the Future: Potholes on the Road to College. Chicago, IL: The University of Chicago Consortium on Chicago School Research.
Schmitt, C.M. (2015). Documentation for the Restricted-Use NCES–Barron’s Admissions Competitiveness Index Data Files: 1972, 1982, 1992, 2004, 2008, and 2014 (NCES 2015-333).

REFERENCES
First Report: Enhanced College Advising in Upward Bound ▌pg. 45
Washington, DC: National Center for Education Statistics, Institute of Education Sciences, U.S. Department of Education.
Schneider, M. and Columbus R. (2017). Degrees of Opportunity. Lessons Learned from State-Level Data on Postsecondary Earnings Outcomes. Washington, DC: American Enterprise Institute.
Seftor, N.S., Mamun, A., and Schirm, A. (2009). The Impacts of Regular Upward Bound on Postsecondary Outcomes Seven to Nine Years after Scheduled High School Graduation. Princeton, NJ: Mathematica Policy Research. http://files.eric.ed.gov/fulltext/ED505850.pdf
Sherwin, J. (2012). Make Me a Match: Helping Low-Income and First-Generation Students Make Good College Choices (MDRC Policy Brief). New York: MDRC. http://www.mdrc.org/sites/default/files/policybrief_24.pdf
Smith, J. (2013a). The Effect of College Applications on Enrollment. B.E. Journal of Economic Analysis & Policy, 14(1): 151-188.
Smith, J. (2013b). Ova and Out: Using Twins to Estimate the Educational Returns to Attending a Selective College. Economics of Education Review, 36: 166-180.
Smith, J., Pender, M., and Howell, J. (2013). The Full Extent of Student-College Academic Undermatch. Economics of Education Review, 32(2013): 247-261.
U.S. Department of Education. (2016). Upward Bound Program FY2016 Grantees. Washington, DC: Author. https://www2.ed.gov/programs/trioupbound/awards.html
U.S. Department of Education. (n.d.). Upward Bound and Upward Bound Math-Science Grantee-Level Performance Results: 2013-14. Washington, DC: Author. https://www2.ed.gov/programs/trioupbound/ubgranteelevel-exp1314.pdf
Walton, G.M., and Cohen, G.L. (2011). A Brief Social-Belonging Intervention Improves Academic and Health Outcomes of Minority Students. Science, 331: 1447-1451.
Witteveen, D. and Attewell, P. (2017). The Earnings Payoff from Attending a Selective College. Social Science Research, 66: 154-169.
Yeager, D.S., Johnson, R., Spitzer, B.J., Trzesniewski, K.H., Powers, J., and Dweck, C.S. (2014). The Far-Reaching Effects of Believing People Can Change: Implicit Theories of Personality Shape Stress, Health, and Achievement during Adolescence. Journal of Personality and Social Psychology, 106: 867-884.

This page has been left blank for double–sided copying.
