study of different operating parameters of fcc unit …
TRANSCRIPT

1
STUDY OF DIFFERENT OPERATING
PARAMETERS OF FCC UNIT WITH
ASPEN-HYSYS
A thesis submitted in partial fulfillment of the requirements for
the degree of
Bachelor of Technology
in
Chemical Engineering
by
ASHISH S. KHANDEPARKER
Roll No: 108CH022
Under the Guidance of
Prof. Arvind Kumar
DEPARTMENT OF CHEMICAL ENGINEERING
NATIONAL INSTITUTE OF TECHNOLOGY, ROURKELA
May, 2012
brought to you by COREView metadata, citation and similar papers at core.ac.uk
provided by ethesis@nitr
2
CERTIFICATE
This is to certify that the project report entitle “Study of different operating
parameters of FCC unitwith Aspen-HYSYS” submitted by ASHISH S.
KHANDEPARKER (ROLL NO: 108CH022) in the partial fulfillment of the
requirement for the degree of the B.Tech in Chemical Engineering, National
Institute of Technology, Rourkela is an authentic work carried out by him under
my super vision. To the best of my knowledge the matter embodied in the report
has not been submitted to any other university/institute for any degree.
DATE: 11th
May 2012 Dr. Arvind Kumar
Department Of Chemical Engineering
National Institute of Technology,
Rourkela,
Pin-769008.

3
ACKNOWLEDGEMENT
I avail this opportunity to express my indebtedness to my guide Dr. Arvind Kumar, Chemical
Engineering Department, National Institute of Technology, Rourkela, for his valuable
guidance, constant encouragement and help at various stages for the execution of this project.
I also express my sincere gratitude to Prof. R. K. Singh (HOD) and Prof. Dr. H.M. Jena
(Project Coordinator), of Department of Chemical Engineering, National Institute of
Technology, Rourkela, for their valuable guidance and timely suggestions during the entire
duration of my project work, without which this work would not have been possible.
Submitted By:
Ashish S. Khandeparker
Roll No: 108CH022
Chemical Engineering Department
National Institute Of Technology, Rourkela
Rourkela-769008

4
ABSTRACT
Fluid catalytic cracking unit (FCCU) is known as the heart of the modern refinery process.
An FCC gives a product specific process eliminating undesired products to a larger extent.
While it is mostly used to increase the production of gasoline, it also has the ability to give
different products like propylene and butylene under different conditions. Crude oil contains
hundreds of hydrocarbons from light gases to molecules boiling above 343 °C, most of the
molecules being in the higher end. About 30 % of the feed to the distillation column cannot
be separated into usable fractions in the market. FCC uses this as its feed, the atmospheric gas
oil and vacuum gas oil. An FCC is used to produce low molecular weight compounds like
gasoline from heavier molecules by the process of catalytic cracking. In this project, a basic
refinery process was designed and the atmospheric gas oil from the distillation column was
used as feed in the FCC unit.The plant data was referred from the plant data collected by
Theologous et al. in which few changes were made in order to achieve proper simulation. A
variation of certain parameters was also carried out to give a view of the effect of these
parameters on the production of Naphtha, coke and the total conversion in the FCC unit. Two
different catalysts were also used and product yield was noted. The effect of dual riser with
respect to one riser was also carried under a specific range.
.
Keywords: Fluidized Catalytic Cracking Unit, Naphtha, Coke, Conversion, catalyst, riser.
5
Table of Contents ACKNOWLEDGEMENT ............................................................................................................................. 3
ABSTRACT ................................................................................................................................................ 4
LIST OF FIGURES ...................................................................................................................................... 6
LIST OF TABLES ........................................................................................................................................ 7
1. INTRODUCTION ............................................................................................................................... 8
2. LITERATURE REVIEW ..................................................................................................................... 11
2.1. Prominent Components in a Typical Refinery ...................................................................... 11
2.1.1. Crude distillation unit (CDU): ........................................................................................ 11
2.1.2. Vacuum distillation unit: ............................................................................................... 12
2.1.3. Separators: .................................................................................................................... 12
2.1.4. Blending pools: .............................................................................................................. 12
2.1.5. Fluidized Catalytic Cracking Unit: .................................................................................. 12
2.2. Pseudo-components ............................................................................................................. 14
2.3. Catalysts ................................................................................................................................ 15
3. DESCRIPTION OF THE SIMULATION .............................................................................................. 17
3.1. PROBLEM DESCRIPTION ........................................................................................................ 17
3.2. ASPEN HYSYS SIMULATION ................................................................................................... 17
3.3. SIMULATION.......................................................................................................................... 17
3.3.1. Process Flow Diagram ................................................................................................... 17
3.3.2. The Process ................................................................................................................... 20
3.3.3. The components or the blocks or the equipments ....................................................... 21
4. RESULTS AND DISCUSSION: .......................................................................................................... 24
4.1. Effects of C/O Ratio ............................................................................................................... 24
4.2. Effect of Feed Temperature .................................................................................................. 26
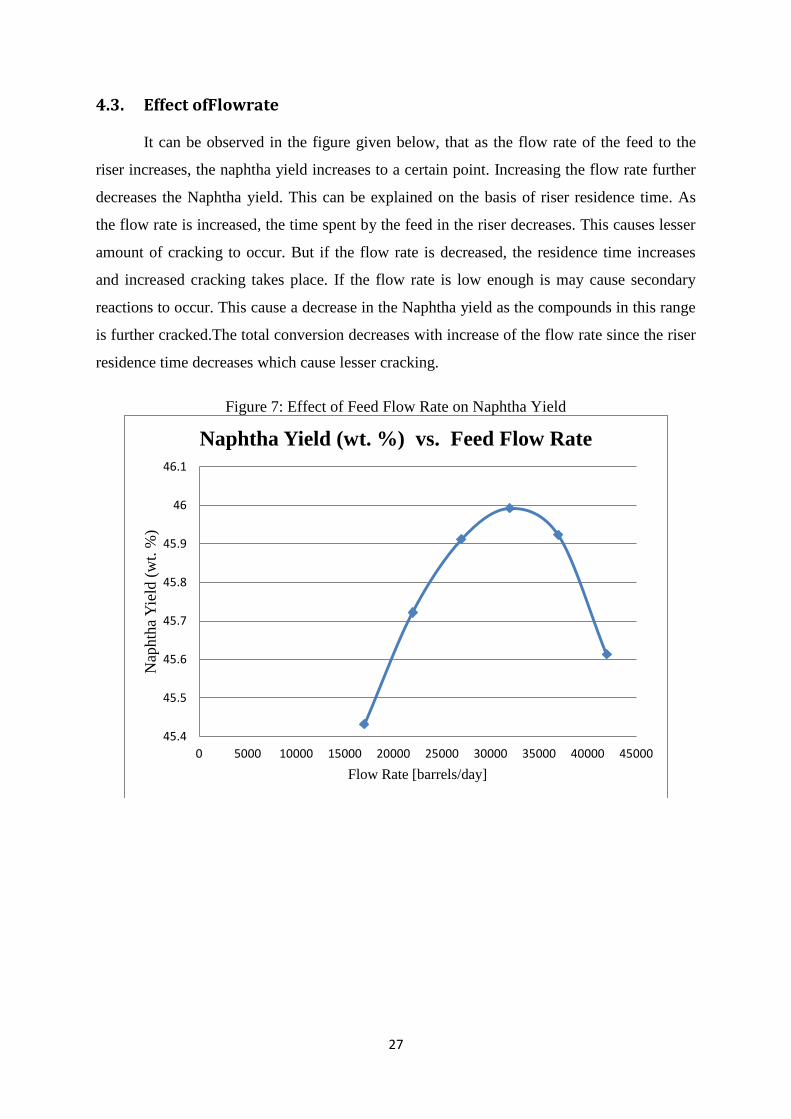
4.3. Effect of Flowrate .................................................................................................................. 27
4.4. Effect of Reactor Pressure .................................................................................................... 28
4.5. Effect of Flowrate on Reactors.............................................................................................. 29
4.6. Comparison between One-Riser and Dual Riser ................................................................... 30
4.7. Effect of Riser Height ............................................................................................................ 32
5. CONCLUSION ................................................................................................................................. 33
6. REFERENCES: ................................................................................................................................. 34
7. APPENDIX ...................................................................................................................................... 36
6
LIST OF FIGURES
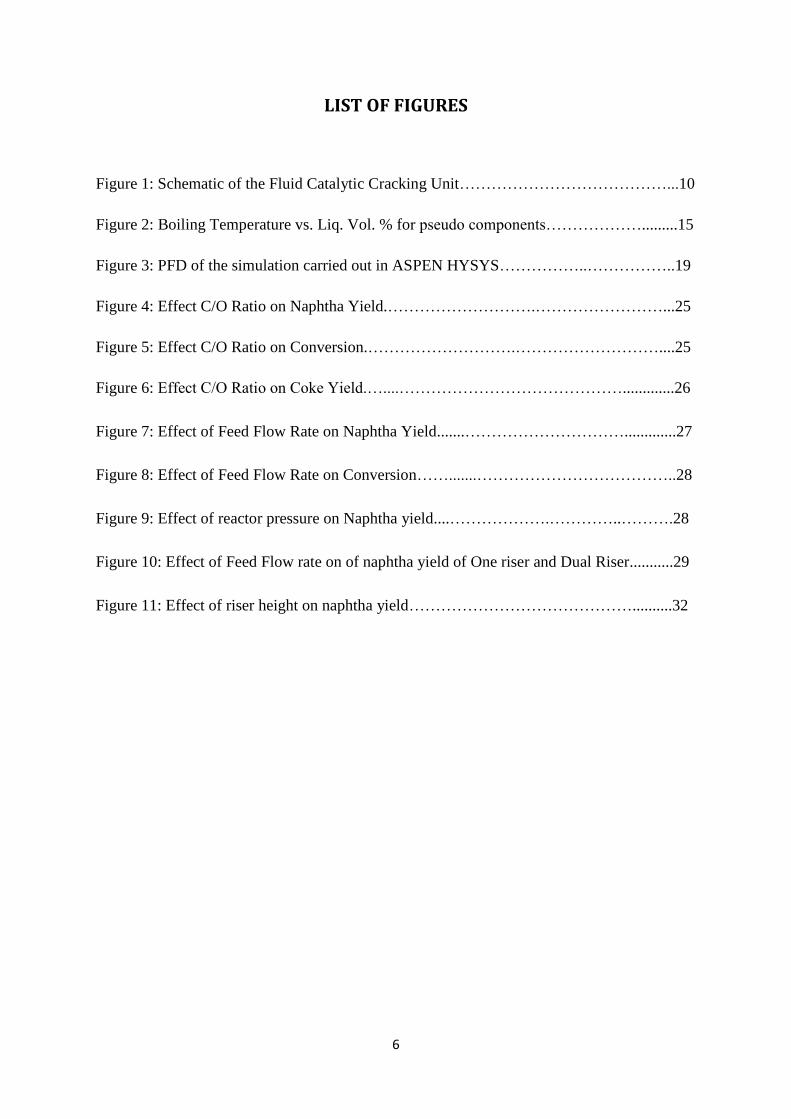
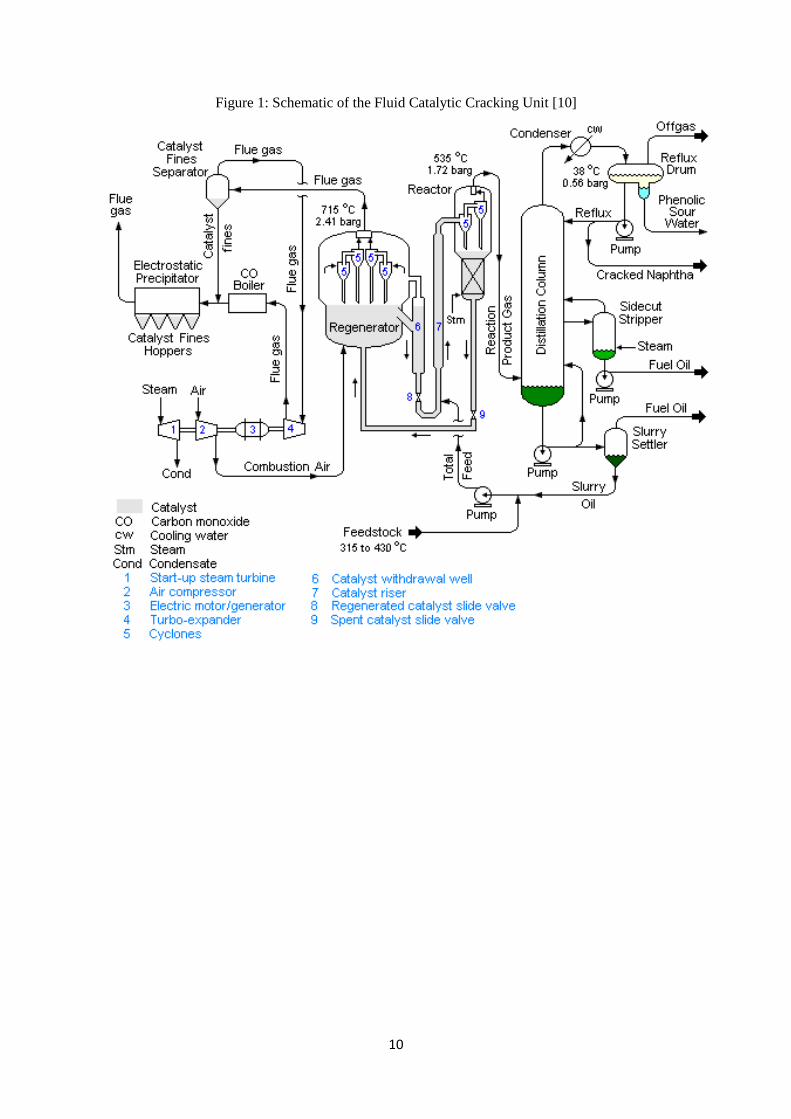
Figure 1: Schematic of the Fluid Catalytic Cracking Unit…………………………………...10
Figure 2: Boiling Temperature vs. Liq. Vol. % for pseudo components……………….........15
Figure 3: PFD of the simulation carried out in ASPEN HYSYS……………..……………..19
Figure 4: Effect C/O Ratio on Naphtha Yield.……………………….……………………...25
Figure 5: Effect C/O Ratio on Conversion.……………………….………………………....25
Figure 6: Effect C/O Ratio on Coke Yield.…....…………………………………….............26
Figure 7: Effect of Feed Flow Rate on Naphtha Yield.......………………………….............27
Figure 8: Effect of Feed Flow Rate on Conversion…….......………………………………..28
Figure 9: Effect of reactor pressure on Naphtha yield....……………….…………..……….28
Figure 10: Effect of Feed Flow rate on of naphtha yield of One riser and Dual Riser...........29
Figure 11: Effect of riser height on naphtha yield……………………………………..........32
7
LIST OF TABLES
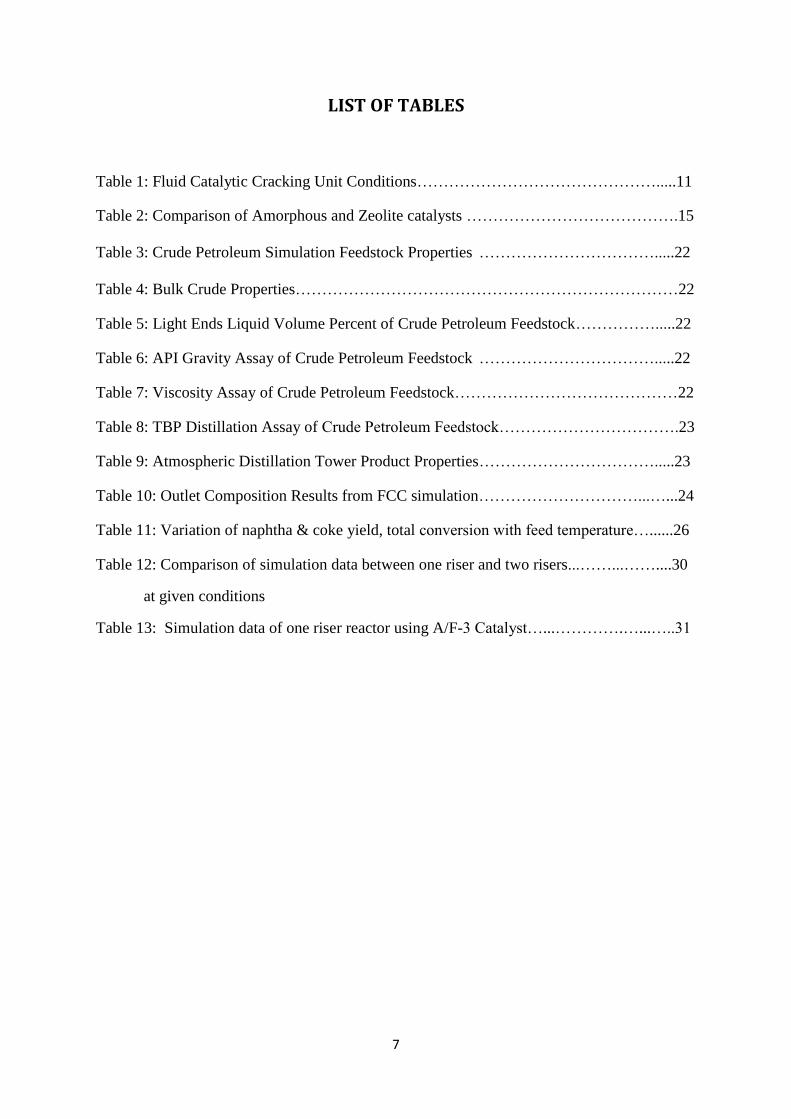
Table 1: Fluid Catalytic Cracking Unit Conditions……………………………………….....11
Table 2: Comparison of Amorphous and Zeolite catalysts ………………………………….15
Table 3: Crude Petroleum Simulation Feedstock Properties …………………………….....22
Table 4: Bulk Crude Properties………………………………………………………………22
Table 5: Light Ends Liquid Volume Percent of Crude Petroleum Feedstock…………….....22
Table 6: API Gravity Assay of Crude Petroleum Feedstock …………………………….....22
Table 7: Viscosity Assay of Crude Petroleum Feedstock……………………………………22
Table 8: TBP Distillation Assay of Crude Petroleum Feedstock…………………………….23
Table 9: Atmospheric Distillation Tower Product Properties…………………………….....23
Table 10: Outlet Composition Results from FCC simulation…………………………...…...24
Table 11: Variation of naphtha & coke yield, total conversion with feed temperature…......26
Table 12: Comparison of simulation data between one riser and two risers...……...……....30
at given conditions
Table 13: Simulation data of one riser reactor using A/F-3 Catalyst…...………….…...…..31

8
1. INTRODUCTION A refinery industry consists of various units like atmospheric distillation column,
vacuum distillation column, Hydrotreater, Meroxtreater, fluidized catalytic cracking (FCC)
unit etc. Among these, the FCC is one of the main units of the industry giving several
advantages over conventional cracking units by decreasing the temperature needed for
cracking the molecules of higher boiling point into molecules of lower boiling
point.According to studies in United States fluidized catalytic cracking process (FCC)
provides about 35 to 45% of the blending stocks in refinery of gasoline [1, 7].In conventional
processing of the petroleum, cracking was achieved by thermal cracking process, which has
now been replaced by fluidized catalytic process because of its high efficiency and
selectivityi.e. gasoline can now be produced with higher octane rating and more liquid
products instead of gaseous ones. The light gases produced in the process contain more
olefin hydrocarbons than those by the thermal cracking process [2, 7]. It is widely used to
convert the high-boiling, high-molecular weight hydrocarbon fractions of petroleum crude
oils to more valuable gasoline, olefinic gases, and other products [7].
As of 2006, FCC units were in operation at 400 petroleum refineries worldwide and
about one-third of the crude oil refined in those refineries is processed in an FCC to produce
high-octane gasoline and fuel oils[4]. During 2007, the FCC units in the United States
processed a total of 5,300,000 barrels (834,300,000 liters) per day of feedstock[5]and FCC
units worldwide processed about twice that amount.
The catalytic cracking process can be classified into two major units the moving bed
reactor and the fluidized cracking reactor of which the fluidized bed cracker reactor has taken
over the majority of the production scale now days. The details of FCC units will be
discussed later on.
Fluidized catalytic cracking unit is the primary and the most important conversion
unit in the refinery process. Crude oil as obtained from the ground is processed through
several separation process like atmospheric distillation column, vacuum distillation column
and finally oils of different boiling point ranges are obtained like gasoline (naphtha’s), diesel
oil, LPG etc. including heavy oil (atmospheric gas oil or vacuum gas oil) are produced which
has a boiling point 343°Cto 565°C. These heavy oils are cracked in the FCC reactr to form
economically valuable petroleum products like gasoline, Liquefied Petroleum Gas and lighter

9
olefins. The FCC unit is much preferred than the conventional thermal cracking process
because it produces petroleum products of higher octane value and has a higher efficiency.
The cracking reaction in the catalytic reactor produces coke (carbon), which remains
on the surface of the catalyst which decreases the efficiency of the catalyst and its activity
decreases. To maintain the activity of the catalyst it is necessary to burn off the deposited
carbon on the catalyst. This was done on a regenerator and the active catalyst is further fed
back to the reactor. As known, the cracking reaction is endothermic so the energy required
for the process comes from the regenerator where catalyst is burned off in presence of air
which is an exothermic reaction. Some units like FCC are designed to use the supply of heat
from the regenerator for the cracking purpose. These are known as “heatbalance “units[3].
Due to the high release of energy in the regenerator during the burring of coke deposit
on the catalyst particles, over-heating can occur. Regulation of the temperature is carried out
by maintaining a fixed CO2/CO ratio at the exit or the temperature of the regenerator can be
fixed according to the supply of oxygen.
The FCC process employs a catalyst in the form of very fine particles (size of the
catalyst is about 70micrometers (microns)), which behave as a fluid when aerated with vapor
at high velocity.Hence, the catalyst here acts as an agent for both the mass transfer operations
and the heat transfer operations. Catalyst moves from regenerator to riser and reactor to
regenerator as fresh or spent catalyst and provide heat to the reactor. Usually, two types of
FCC units are used on industrial scales which are side by side-type and stacked-type reactor.
In side-by-side reactor which will be used in this project for simulation purposes,the reactor
and regenerator isa separated vessel placed side by side. In case of stacked type reactor rector
and regenerator are mounted together, the later mounted above the former.
About 95 % of the cracking takes place in the riser while the remaining takes place in
the reactor. This is because cracking reactions occur at a very high rate which causes
maximum reaction to take place in the riser itself. The temperature in the riser also plays a
role in this.
10
Figure 1: Schematic of the Fluid Catalytic Cracking Unit [10]

11
2. LITERATURE REVIEW Most fluid catalytic cracking units are operated to maximize conversion to gasoline
and LPG [15]. This is usually the case during peak gasoline demand season. Maximum
conversion percentage that can be achieved is usually limited by both unit design constraints
(i.e. riser height, temperature, etc.) and the processing objectives. Here, the unit operator has
many operating and catalyst composition variables to select o achieve maximum conversion.
The product yield can be represented both by weight percentage and volume
percentage. In the current project, only weight percentage is noted down as coke formation is
calculated only in terms of weight percentage.
In the discussion given below Naphtha Yield, Coke Yield and total conversion is
considered and noted.
Conversion =100 – (LCO + Bottoms); Where LCO = Light Cycle Oil
A low conversion rate for maximum production of light cycle oil is typically 40 to60%, while
a high conversion operation for maximum gasoline production is 70 to85% [15]. But this is
dependent on the different factors like character of feedstock. Given below are some of the
conditions used in typical FCC Units and the product yields obtained.
Table 1: Fluid Catalytic Cracking Unit Conditions [7]
Parameter Value
Catalyst to Oil Ratio (wt.) 5 - 16
Reactor Temperature
°F
°C
885 – 950
475 – 510
Regenerator Temperature
°F
°C
1200 – 1500
650 – 815
Reactor Pressure (psig) 8 – 30
Regenerator Pressure (psig) 15 – 30
2.1. Prominent Components in a Typical Refinery
2.1.1. Crude distillation unit (CDU):
This unit enables the separation of crude into various marketable fractions. It consists
of the main atmospheric distillation column, side strippers, reboiler, and condenser as
the main process. Usually, five products are generated from the CDU namely gas +
naphtha, kerosene, light gas oil, heavy gas oil and atmospheric residue [11]. The
products naphtha (major feedstock for high octane gasoline) and kerosene has the
highest value in the market. Kerosene is widely used to power jet engines of aircrafts
and some rocket engines along with being used as a cooking and lighting fuel.

12
2.1.2. Vacuum distillation unit:
The atmospheric residue when processed at lower pressures does not allow
decomposition of the atmospheric residue and therefore yields LVGO, HVGO and
vacuum residue [11]. These products are then subjected to cracking to give lighter
products.
2.1.3. Separators:
These units are used to separate the gas fractions from the stream and require stage
wise separation of the gas fraction.
2.1.4. Blending pools:
All refineries need to meet tight product specifications in the form of ASTM
temperatures, viscosities, octane numbers, flash point and pour point [11]. To achieve
the desired specification of these parameters, blending is carried out.
2.1.5. Fluidized Catalytic Cracking Unit:
The FCC unit can be divided into few major units which are given below:
a) Preheat system
The feed to the FCC reactor, mostly atmospheric gas oil and vacuum gas oil, are to be
preheated before entering into the reactor. This is done by the feed preheat system which
heats both the fresh and recycled feed. Pre-heating is done through several heat exchangers
and the temperature maintained is about 500-700 °F (270 - 375 °C)
b) Reactor
Until about 1965, units were designed with a dense phase fluidized bed in the reactor
vessel. The units were modeled and also operated so that all the reaction occurs in the reactor
section. Now it has been developed that majority of the reaction occurs in the riser as the
catalyst activity and temperature were at their highest there. No significant attempts were
made for controlling the riser operation. But after the usage of the reactive zeolite catalyst the
amount of cracking occurring in the riser has been enhanced. Now the reactor is used for the
separation purpose of both the catalyst and outlet products. Reaction in the riser is optimized
by increasing the regenerated catalyst velocity to a desired value in the riser reactor and
injecting the feed into the riser through spray nozzles.

13
The fresh feed and the recycled streams are preheated by heat exchangers or a furnace
and then enter to the riser where they were mixed with the hot regenerated catalyst. The heat
from the catalyst vaporizes the feed and required temperature for the reactor has been
attained. The mixture of catalyst and hydrocarbon vapor travels up the riser into the separator.
The cracking reaction starts when the feed is in contact with the hot catalyst in the riser and
continues until oil vapors are separated from the catalyst in the reactor separator. The
hydrocarbons are then sent to the fractionator for the separation of liquid and the gaseous
products. In the reactor the catalyst to oil ratio has to be maintained properly because it
changes the selectivity of the product .the catalyst sensible heat is not only used for the
cracking reaction but also for the vaporization of the feed. The ideal riser diameter would be
about 2 meters and length is about 30 to 35 meters. During simulation the effect of the riser is
presumed as plug flow reactor where there is minimal back mixing, but practically there is
both downward and upward slip due to drag force of vapor[6, 8].
c) Regenerator
The catalyst flow to the reactor is maintained through the catalyst standpipe.
Regenerator maintains the activity of the catalyst by burning the coke deposits on the
catalyst. The heat released here is supplied to the riser-reactor section. The coke deposition
on the surface of the catalyst is dependent on the feed stock quality. This caused physical
catalyst poisoning which is manageable by burning the coke off from the surface of the
catalyst thus reactivating its active sites. Air is blown through the regenerator through a
distributor plate and a fluidized state of the bed is maintained. This causes the coke to burn
off as a mixture of carbon-monoxide and carbon-dioxide. Heat is produced due to the
combustion of the coke which is utilized in the catalytic cracking reactions taking place in the
riser.
The flue gas from the regenerator is passed through several stages of cyclone
separators which segregate the solid catalyst particles from the gaseous stream. Hence most
of the catalyst is recovered. Heat is carried to the riser-reactor by the catalyst as sensible heat.
The regenerator is designed and modeled for burning the coke into carbon monoxide or
carbon dioxide. Before conversion of carbon to carbon monoxide was done as half of the air
supply required for the process so that the capital cost will be minimum but now a days air is
supplied in such scale that carbon is converted into carbon dioxide .in this case the capital
cost will be higher but the regenerated catalyst will have a minimum coke content on it. This
gives a more efficient and selective catalyst in the riser.

14
d) Catalyst System
Catalyst particles lower than 20 microns escape during the burning process as air is
supplied with a high velocity. The catalyst escaping from the regenerator was stopped and
controlled by electrostatic precipitator. It screens the escaping catalyst and sends it back tothe
regenerator. The same way, catalyst particles also escape from the reactor. These particles are
collected at the bottom of the fractionating tower as slurry oil.
e) Flue gas system
It is the heat recovery system of the FCC unit. Flue gas is mainly obtained from the
regenerator due to the burning of coke from the catalyst. The flue gases like carbon monoxide
are burned off in a carbon monoxide furnace (waste heat boiler) to carbon dioxide and the
available energy is recovered. The hot gases can be used to generate steam or to power
expansion turbines to compress the regeneration air and generate power.The flue gas is
finally processed through an electrostatic precipitator (ESP) to remove residual particulate
matter to comply with any applicable environmental regulations regarding particulate
emissions. The ESP removes particulates in the size range of 2 to 20 microns from the flue
gas [12].
The components used in the simulation are separator, heater, crude distillation column,
Fluidized catalytic cracker unit (detailed process description is given in the introduction).
2.2. Pseudo-components Crude oil constitutes hundreds of molecules of varying molecular weight and
properties along with it. In order to evaluate the mass balance from volume balance, average
°API is to be estimated which is usually done from the °API curve and TBP curve. This
information can then be used to calculate the mass flow rate from the volume flow rate and
vice versa.
The pseudo component theory is needed to aid the refinery since a process cannot
consider all 50-100 components. In order to average properties of the oil and to reduce the
number of components and variables to manageable numbers, pseudo-components are used.
This is done by characterizing the crude oil into components whose average properties can be
represented by the TBP, °API and sulfur content of the streams. In order to estimate the
average °API and sulfur content of a crude/product stream, it is essential tocharacterize the
TBP curve of the crude/product using the concept of pseudo-components [11]. A
15
pseudo‐component is defined as a component that can represent the average mid volume
boiling point and its average properties such as °API and percentage sulphur content. The aim
of the creation of pseudo-components is to model the substance as accurately as possible.
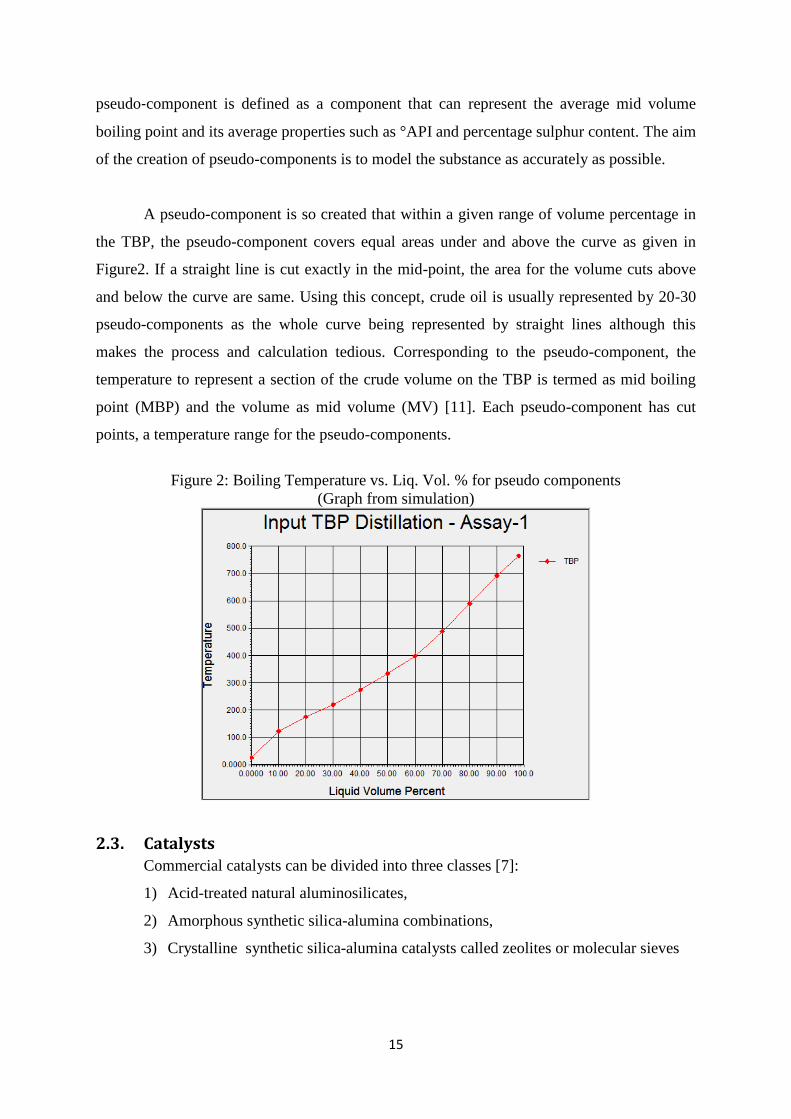
A pseudo-component is so created that within a given range of volume percentage in
the TBP, the pseudo-component covers equal areas under and above the curve as given in
Figure2. If a straight line is cut exactly in the mid-point, the area for the volume cuts above
and below the curve are same. Using this concept, crude oil is usually represented by 20-30
pseudo-components as the whole curve being represented by straight lines although this
makes the process and calculation tedious. Corresponding to the pseudo-component, the
temperature to represent a section of the crude volume on the TBP is termed as mid boiling
point (MBP) and the volume as mid volume (MV) [11]. Each pseudo-component has cut
points, a temperature range for the pseudo-components.
Figure 2: Boiling Temperature vs. Liq. Vol. % for pseudo components
(Graph from simulation)
2.3. Catalysts
Commercial catalysts can be divided into three classes [7]:
1) Acid-treated natural aluminosilicates,
2) Amorphous synthetic silica-alumina combinations,
3) Crystalline synthetic silica-alumina catalysts called zeolites or molecular sieves

16
Table 2: Comparison of Amorphous and Zeolite catalysts [7]
Component Amorphous Zeolite
Coke, wt. % 4 4
Conversion, vol. % 55 65
C5 + gasoline, vol. % 38 51
C3 – Gas, wt. % 7 6
C4, vol. % 17 16
There are several advantages of zeolite catalysts over natural and synthetic amorphous
catalysts, like:
- Zeolite catalyst have higher activity, which means it requires lesser residence time
and has resulted in most cracking units being adopted to riser cracking operations
[7].
- It also gives a higher gasoline yield at a given total conversion’
Catalysts are required to have certain properties in order to withstand the process in
the FCC. They should be stable to impact, loading, thermal shocks and attrition during the
process. Attrition mainly occurs in the regenerator since a fluidized bed state is
maintained..Modern FCC catalysts are fine powders with a bulk density of 0.8 t 0.96 g/cc and
having a particle size distribution ranging from 10 to 150 μm and an average particle size of
60 to 100 μm [13, 14].For the selectivity of the product zeolite is the essential part which
ranges about 10 to 25 % of the catalyst and the remainder is the amorphous past. But
amorphous catalysts have cheaper than zeolite catalyst and have better attrition resistance. A
proper blend of both these gives the best catalyst as it has the cost of the cheaper amorphous
catalyst along with the higher activity and selectivity of amorphous catalysts.
Nickel, iron, vanadium,copper and other metal contaminants,in the FCC feedstocks in
the ppm range, have detrimental effects on the activity of the catalysts and its performance.
Nickel and vanadium are particularly poisonous for the catalysts.
The coke yieldand other catalytic activity depend on the acidic strength of the zeolite.
Higher acidic strength infers an increase in coke yield while at the same time it also infers a
higher hydrogen transfer reaction.
17
3. DESCRIPTION OF THE SIMULATION
3.1. PROBLEM DESCRIPTION
The effects of various operating and design conditions were to be tested and its effects on
naphtha yield, coke yield and total conversion were to be noted.
Conditions for the given problem are given below. Preheat crudeis passed through a
separator into a vapour and liquid. The flash evaporator flashes the liquid crude oil into a
vapour + liquid mixture of about 50%. Both the components passed through mixer and then
to the fractionating column. Atmospheric gas oil goes to the FCC Unit for cracking. Further
description is given below.
3.2. ASPEN HYSYSSIMULATION The FCC unit works through various cracking reaction in parallel in the riser reactor section
of this unit. Different types of FCCreactors are available in ASPEN HYSYS such as:
1. One riser
2. Two riser
3. Risers with mid-point injection
4. One stage regenerator
5. Two stage regenerator(flue gas in series)
6. Two stage regenerator(separate flue gas)
In order to operate theFCC unit the feed input to the unit is required which is why
entire process of distillation was done. Various components were used to perform the
process.
3.3. SIMULATION The main purpose of the project includes the effect of variation of process conditions
on the production of naphtha yield in the FCC. For the present study, a refinery process was
simulated in order to assist in the simulation. The data was referred from the plant data
collected by Theologous et al. in which few changes were made in order to achieve proper
simulation. The details are discussed below:
3.3.1. Process Flow Diagram
To represent the refinery process + FCC unit in Aspen HYSYS, the first step is to
make a process flow diagram (PFD). In Simulation Basic Manager, a fluid package was

18
selected along with the components which are to be in the input stream. In the process, Peng-
Robinson was selected as the fluid package as it is able to handle hypothetical components
(pseudo-components).
The non-oil components used for the process were H20, C3, i-C4, n-C4, i-C5 and n-
C5. The pseudo-components were created by supplying the data to define the assay. The fluid
package contains 44 components (NC: 44): 6 pure components (H2O plus five Light Ends
components) and 38 petroleum hypocomponents). In order to go to the PFD screen of the
process the option “Enter to simulation Environment” was clicked on. An object palette
appeared at right hand side of the screen displaying various operations and units.
The PFD of the process is given below:
Where,
PreFlash is a separator.
Furnace is a heater.
Mixer is a mixer.
Atmos Tower is a distillation column operated at 1 atm.
Reactor Section is the FCC Unit in which AGO (Atmospheric Gas Oil) is used as the feed.

19
Figure 3: PFD of the simulation carried out in ASPEN HYSYS

20
3.3.2. The Process
A Crude Oil enters the PreFlash unit, a separator used to split the feed stream into its
liquid and vapour phases at 450 F and 75 psia having a molecular weight of 300 and °API of
48.75. The crude stream separates into the PreFlashVap and PreFlashLiq consisting of purely
vapour and liquid respectively. The PreFlashLiq enters the crude furnace flashing part of the
liquid to vapour which comes out as stream, HotCrude having a temperature of 650 F. The
PreFlashVap and HotCrude streams are then inlet into the Mixer resulting into the formation
of the TowerFeed. The Atmos Tower is a column having Side Stripper systems to draw out
Kerosene, Diesel and Atmospheric Gas Oil. Naphtha is drawn from the condenser and
Residue from the reboiler. The Atmospheric Gas Oil (AGO) is then used as the feed to the
Reactor Section, the FCC unit. The FCC Unit was configured to have one or two risers with
the geometry as per the plant data collected by Theologus and Markatos. It was assumed that
no heat loss occurs in the FCC unit. Catalyst was decided upon and operating conditions were
set.
Results were noted for the variation of Naphtha Yield, Coke (wt. %) and Total conversion
with change in the following operating conditions:
i) C/O ratio
ii) Feed Temperature
iii) Feed Flow Rate
iv) Reactor Pressure
v) Riser Height
vi) Flow Rate on one-riser and dual-riser
Total conversion is attributed to the conversion of the feedstock to the FCC into H2S, Fuel
Gas, Propane, Propylene, n-Butane, i-Butane, Naphtha, Butenes and Coke while the
conversion of feedstock to Light Cycle Oil and Bottoms is not considered in the calculation
of total conversion.

21
3.3.3. The components or the blocks or the equipments
Description of various components used in the PFD and the conditions at which they are
operated are described here:
a) Separator (PreFlash)
No heat loss was assumed for the separator of volume 70.63 ft3. Preheat Crude entered at 450
F and 75 psia with a 100,000 barrels/day flow rate containing mostly liquid. It had a
molecular weight of 300 and API Gravity of 48.75. The Preheat Crude was separated into
PreFlashLiq (450 F, 75 psia) and PreFlashVap (450 F, 75 psia).
b) Heater (Furnace)
No heat loss was assumed for the Heater. PreFlashLiq entered the furnace at 450 F and 75
psia. Its main purpose was to partially vaporize the feed and increase its temperature to the
feed conditions needed for the distillation column. The outlet stream Hotcrude had conditions
650 F, 65 psia.
c) Mixer (Mixer)
The main purpose of the Mixer was to mix two streams, HotCrude (650 F, 65 psia) and
PreFlashVap (450 F, 75 psia) to give on stream, TowerFeed (641.5 F, 65 psia) which is the
feed stock to the distillation column.
d) Distillation Column (Atmos Tower)
The feed to the column enters at 641.5 F, 65 psia. The column separates the feed into six
fractions namely: Off Gas, Naphtha, Kerosene, Diesel, Atmospheric Gas Oil and Residue.
The main column consists of 29 trays having 3 side strippers, each having 3 stages (total of
40 stages including reboiler and condenser)
e) Fluidized Catalytic Cracking Unit (Reactor Section)
The Atmospheric Gas Oil was taken as the feed for this Unit. Initial conditions are given in
the appendix attached. Results are shown in the Results and Discussion section.
For the simulation of the FCC unit a simulated feedstock was used in order to get the
composition of the AGO feed for the FCC unit. For the feedstock for the FCCU, Crude
Petroleum, data was obtained from ASPEN HYSYS. The feed of molecular weight 300 and
API Gravity 48.75 was used at a temperature of 450 °F and pressure of 75 psia.

22
Given below are the properties used for the crude petroleum feedstock:
Table 3: Crude Petroleum Simulation Feedstock Properties
Preheat Crude (Feedstock)
Temperature [°F] 450
Pressure [psia] 75
Liquid Volume Flow
[barrels/day] 100000
Table 4: Bulk Crude Properties
Bulk Crude Properties
MW 300.00
API Gravity 48.75
Table 5: Light Ends Liquid Volume Percent of Crude Petroleum Feedstock
Light Ends Liquid Volume Percent
i-Butane 0.19
n-Butane 0.11
i-Pentane 0.37
n-Pentane 0.46
Table 6: API Gravity Assay of Crude Petroleum Feedstock
API Gravity Assay
LiqVol% Distilled API Gravity
13.0 63.28
33.0 54.86
57.0 45.91
74.0 38.21
91.0 26.01
Table 7: Viscosity Assay of Crude Petroleum Feedstock
Viscosity Assay
Liquid Volume
Percent
Distilled
Viscosity (cP)
100°F
Viscosity (cP)
210°F
10.0 0.20 0.10
30.0 0.75 0.30
50.0 4.20 0.80
70.0 39.00 7.50
90.0 600.00 122.30

23
Table 8: TBP Distillation Assay of Crude Petroleum Feedstock
TBP Distillation Assay
Liquid Volume
Percent
Distilled
Temperature (°F) Molecular
Weight
0.0 80.0 68.0
10.0 255.0 119.0
20.0 349.0 150.0
30.0 430.0 182.0
40.0 527.0 225.0
50.0 635.0 282.0
60.0 751.0 350.0
70.0 915.0 456.0
80.0 1095.0 585.0
90.0 1277.0 713.0
98.0 1410.0 838.0
The feed was simulated through the process explained above and the product properties for
the Atmospheric Distillation Tower were obtained. The Distillation Tower had six outlets out
of which the top gaseous product stream had no mass flow. Hence only properties for the five
outlet streams which consisted of Naphtha, Kerosene, Diesel, Atmospheric Gas Oil (AGO)
and Residue were obtained. The AGO stream was then used in a 1-riser FCC unit to obtain
the Naphtha Weight percentage and total conversion by varying different parameters such as
reactor temperature and mass flow rate. The conditions under which the FCC unit was
operated are given in Appendix 1.
Table9: Atmospheric Distillation Tower Product Properties
Atmospheric Distillation Tower Product Properties
Product
Name
Liquid
Volume
Flow
[barrels/day]
Molecular
Weight
Mass
Density
[API]
Temperature
[°F]
Pressure
[psia]
Naphtha 20000 138.4 86.12 163.9 19.7
Kerosene 13000 210.1 118.8 449.2 29.84
Diesel 16998 289.1 109.6 478.4 30.99
AGO 5017 390.1 114.6 567.2 31.7
Residue 41322 614.6 83.21 657.1 32.7
24
4. RESULTS AND DISCUSSION:
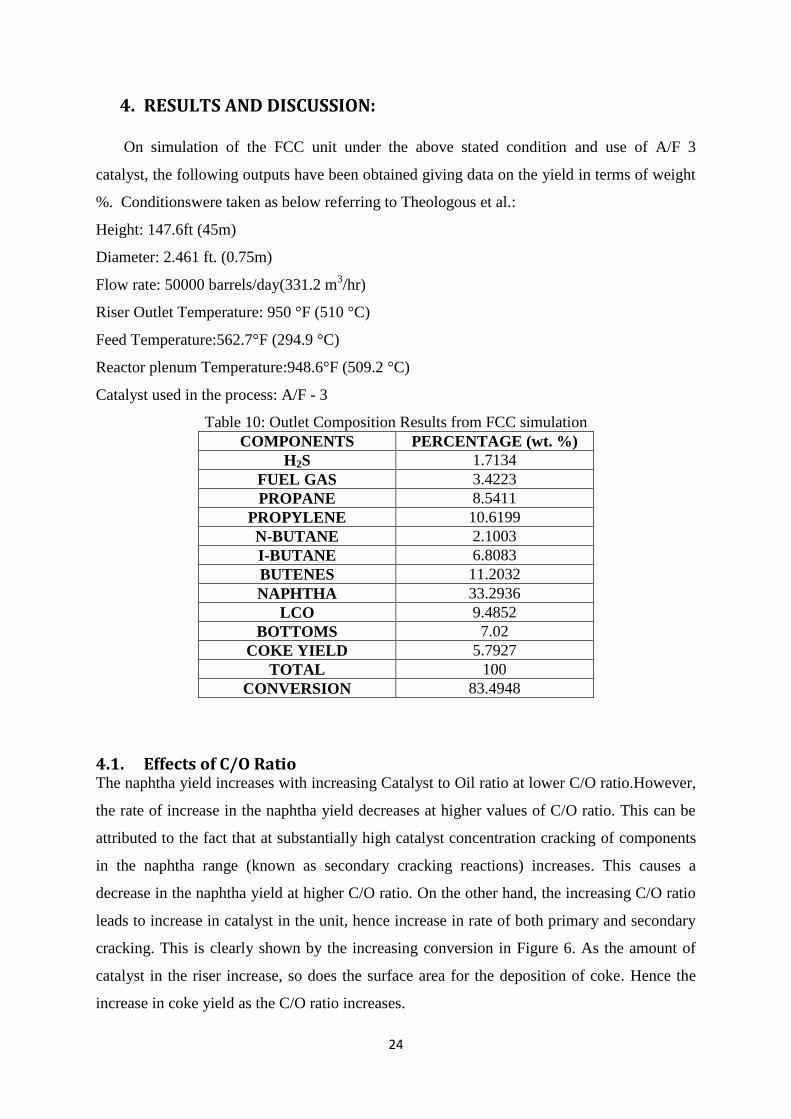
On simulation of the FCC unit under the above stated condition and use of A/F 3
catalyst, the following outputs have been obtained giving data on the yield in terms of weight
%. Conditionswere taken as below referring to Theologous et al.:
Height: 147.6ft (45m)
Diameter: 2.461 ft. (0.75m)
Flow rate: 50000 barrels/day(331.2 m3/hr)
Riser Outlet Temperature: 950 °F (510 °C)
Feed Temperature:562.7°F (294.9 °C)
Reactor plenum Temperature:948.6°F (509.2 °C)
Catalyst used in the process: A/F - 3
Table 10: Outlet Composition Results from FCC simulation
COMPONENTS PERCENTAGE (wt. %)
H2S 1.7134
FUEL GAS 3.4223
PROPANE 8.5411
PROPYLENE 10.6199
N-BUTANE 2.1003
I-BUTANE 6.8083
BUTENES 11.2032
NAPHTHA 33.2936
LCO 9.4852
BOTTOMS 7.02
COKE YIELD 5.7927
TOTAL 100
CONVERSION 83.4948
4.1. Effects of C/O Ratio
The naphtha yield increases with increasing Catalyst to Oil ratio at lower C/O ratio.However,
the rate of increase in the naphtha yield decreases at higher values of C/O ratio. This can be
attributed to the fact that at substantially high catalyst concentration cracking of components
in the naphtha range (known as secondary cracking reactions) increases. This causes a
decrease in the naphtha yield at higher C/O ratio. On the other hand, the increasing C/O ratio
leads to increase in catalyst in the unit, hence increase in rate of both primary and secondary
cracking. This is clearly shown by the increasing conversion in Figure 6. As the amount of
catalyst in the riser increase, so does the surface area for the deposition of coke. Hence the
increase in coke yield as the C/O ratio increases.

25
Figure 4: Effect C/O Ratio on Naphtha Yield
Figure 5: Effect C/O Ratio on Conversion
0
10
20
30
40
50
60
0 2 4 6 8 10 12
Nap
hth
a Y
ield
(w
t. %
)
C/O Ratio
Naphtha Yield (wt. %) vs. C/O Ratio
79.5
80
80.5
81
81.5
82
82.5
83
83.5
8.6 8.8 9 9.2 9.4 9.6
Conver
sion (
wt.
%)
C/O Ratio
Conversion (wt. %) vs. C/O Ratio

26
Figure 6: Effect C/O Ratio on Coke Yield
4.2. Effect of Feed Temperature
To study the variation of Naphtha yield, coke yield and total conversion a temperature
difference of 20 ⁰C was used.As the feed temperature increases, the difference in temperature
between the feed and the riser decreases. This causes lesser quantity of catalyst to flow
through the standpipe and into the riser hence a low C/O ratio.
Table 11: Variation of naphtha & coke yield, total conversion with feed temperature
FEED
TEMPERATURE
(⁰C)
NAPHTHA
(wt. %)
TOTAL
CONVERSION
(wt. %)
COKE YIELD
(wt. %)
200 46.1734 68.8834 5.9633
240 45.1407 67.5331 5.5385
280 43.4680 64.5317 5.0685
320 41.4875 63.0871 4.8232
360 39.1612 58.1258 4.0465
6
6.05
6.1
6.15
6.2
6.25
6.3
6.35
6.4
6.45
6.5
8 8.5 9 9.5 10
Co
ke
yie
ld (
wt.
%)
C/O Ratio
Coke Yield (wt. %) vs. C/O Ratio
27
4.3. Effect ofFlowrate
It can be observed in the figure given below, that as the flow rate of the feed to the
riser increases, the naphtha yield increases to a certain point. Increasing the flow rate further
decreases the Naphtha yield. This can be explained on the basis of riser residence time. As
the flow rate is increased, the time spent by the feed in the riser decreases. This causes lesser
amount of cracking to occur. But if the flow rate is decreased, the residence time increases
and increased cracking takes place. If the flow rate is low enough is may cause secondary
reactions to occur. This cause a decrease in the Naphtha yield as the compounds in this range
is further cracked.The total conversion decreases with increase of the flow rate since the riser
residence time decreases which cause lesser cracking.
Figure 7: Effect of Feed Flow Rate on Naphtha Yield
45.4
45.5
45.6
45.7
45.8
45.9
46
46.1
0 5000 10000 15000 20000 25000 30000 35000 40000 45000
Nap
hth
a Y
ield
(w
t. %
)
Flow Rate [barrels/day]
Naphtha Yield (wt. %) vs. Feed Flow Rate

28
Figure 8: Effect of Feed Flow Rate on Conversion
4.4. Effect of Reactor Pressure
The change in naphtha yield with respect to reactor pressure is almost consistent with
the riser-reactor temperature. A change in reactor first increases the Naphtha Yield and from
40psia and reaches a maximum at about 58psia. The Yield then decreases on further
increasing the reactor pressure. This change is although insignificant.
Figure 9: Effect of reactor pressure on Naphtha yield
77
78
79
80
81
82
83
84
0 5000 10000 15000 20000 25000 30000 35000 40000 45000
Conver
sion (
wt.
%)
Flow Rate [barrels/day]
Conversion (wt. %) vs. Feed Flow Rate
43
43.1
43.2
43.3
43.4
43.5
43.6
43.7
43.8
43.9
44
0 20 40 60 80
Nap
hth
a Y
ield
(w
t. %
)
Reactor Pressure (Psia)
Naphtha Yield (wt. %) vs. Reactor Pressure
29
4.5. Effect ofFlowrate on Reactors
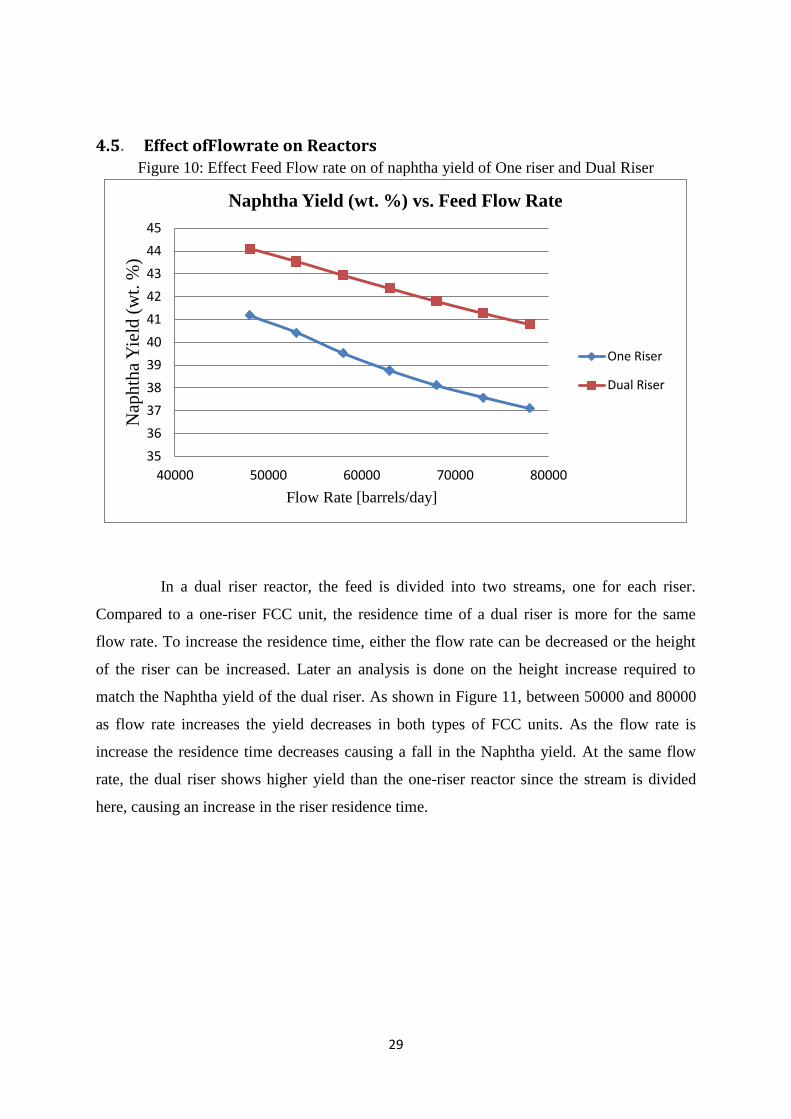
Figure 10: Effect Feed Flow rate on of naphtha yield of One riser and Dual Riser
In a dual riser reactor, the feed is divided into two streams, one for each riser.
Compared to a one-riser FCC unit, the residence time of a dual riser is more for the same
flow rate. To increase the residence time, either the flow rate can be decreased or the height
of the riser can be increased. Later an analysis is done on the height increase required to
match the Naphtha yield of the dual riser. As shown in Figure 11, between 50000 and 80000
as flow rate increases the yield decreases in both types of FCC units. As the flow rate is
increase the residence time decreases causing a fall in the Naphtha yield. At the same flow
rate, the dual riser shows higher yield than the one-riser reactor since the stream is divided
here, causing an increase in the riser residence time.
35
36
37
38
39
40
41
42
43
44
45
40000 50000 60000 70000 80000
Nap
hth
a Y
ield
(w
t. %
)
Flow Rate [barrels/day]
Naphtha Yield (wt. %) vs. Feed Flow Rate
One Riser
Dual Riser

30
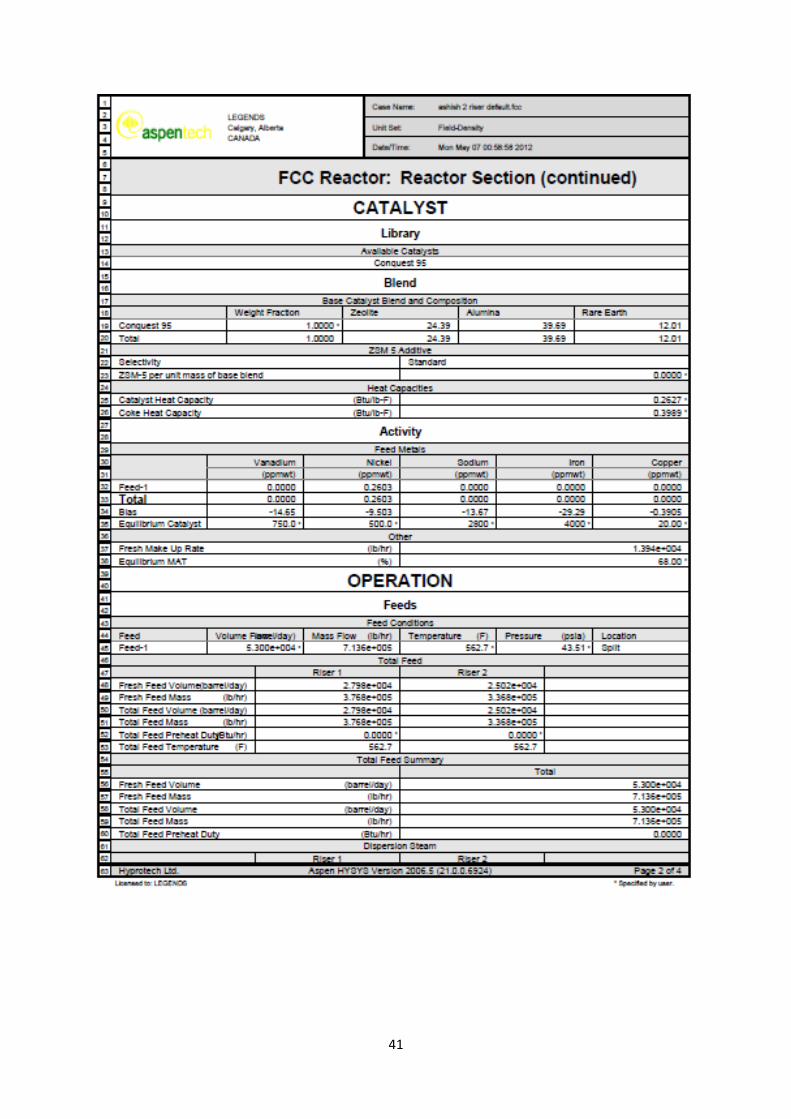
4.6. ComparisonbetweenOne-Riserand Dual Riser Simulation was done using conquest 95 catalyst in 2 types of riser reactor i.e. one riser
reactor and dual riser reactor at process condition as followsreferring to Theologous et al. [9].
Height: 147.6ft (45m)
Diameter: 2.461 ft.(0.75m)
Flow rate: 50000 barrels/day(331.2 m3/hr)
Riser Outlet Temperature: 950 °F (510 °C)
Feed Temperature:562.7°F (294.9 °C)
Reactor plenum Temperature:948.6°F (509.2 °C)
Catalyst used in the process: Conquest95
Table 12:Comparison of simulation data between one riser and two risers at given conditions.
Component One riser (wt. %) Dual riser (wt. %)
H2S 1.2146 0.4153
FUEL GAS 2.4330 2.2907
PROPANE 1.2834 1.0077
PROPYLENE 3.0338 4.0296
N-BUTANE 1.3154 0.9602
I-BUTANE 2.2570 1.9621
BUTENES 4.2738 5.7550
NAPHTHA 42.7707 43.8870
LCO 16.9496 16.2800
BOTTOMS 19.5818 18.3753
COKE YIELD 4.8871 5.0372
TOTAL 100 100
CONVERSION 63.4686 65.3447
As observed in Table 12,the gasoline yield is more in case of dual riser reactor
(43.8870% as compared to 42.7707% in one riser). The overall conversion and coke yield is
also more in the dual reactor.
Table 13: Simulation data of one riser reactor using A/F-3 Catalyst
COMPONENTS PERCENTAGE (%)
31
H2S 1.7134
FUEL GAS 3.4223
PROPANE 8.5411
PROPYLENE 10.6199
N-BUTANE 2.1003
I-BUTANE 6.8083
BUTENES 11.2032
NAPHTHA 33.2936
LCO 9.4852
BOTTOMS 7.02
COKE YIELD 5.7927
TOTAL 100
CONVERSION 83.4948
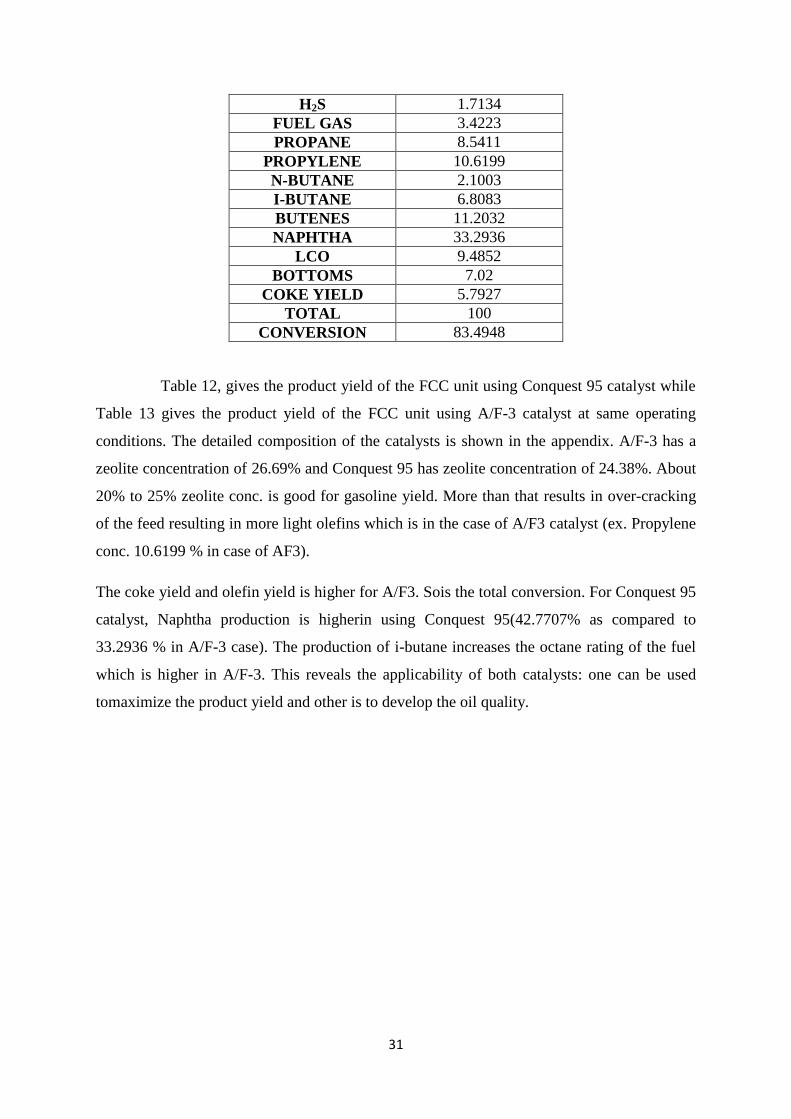
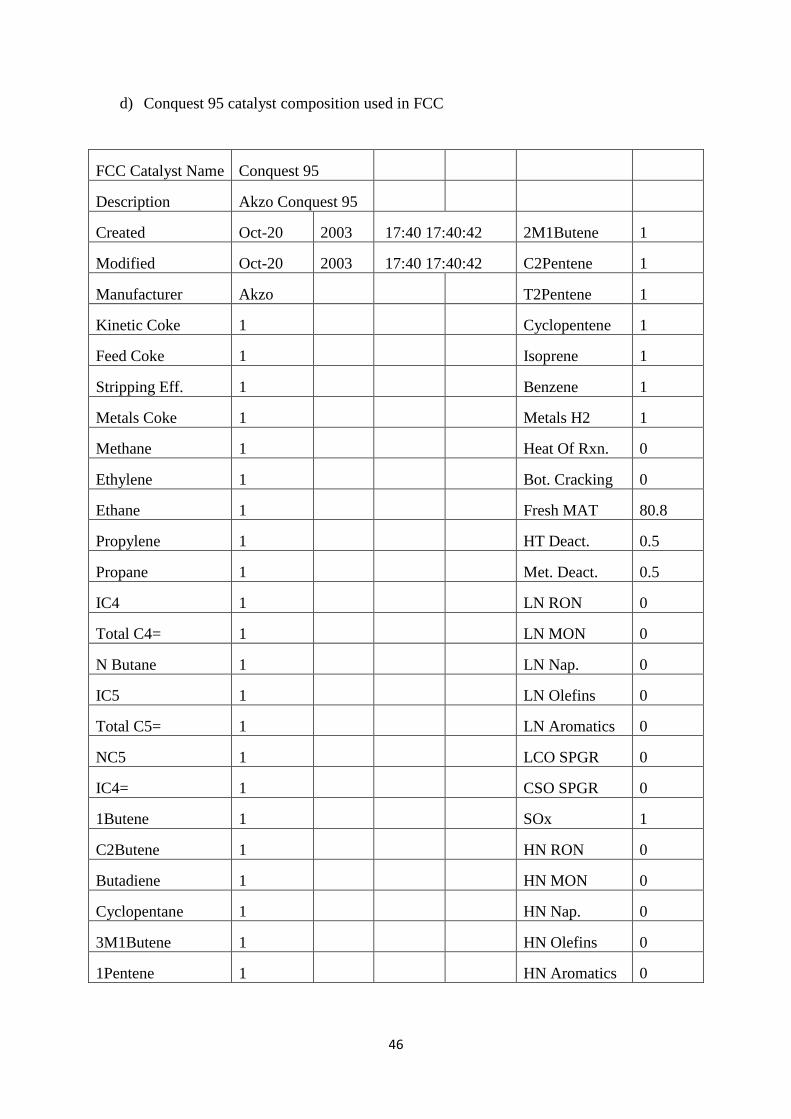
Table 12, gives the product yield of the FCC unit using Conquest 95 catalyst while
Table 13 gives the product yield of the FCC unit using A/F-3 catalyst at same operating
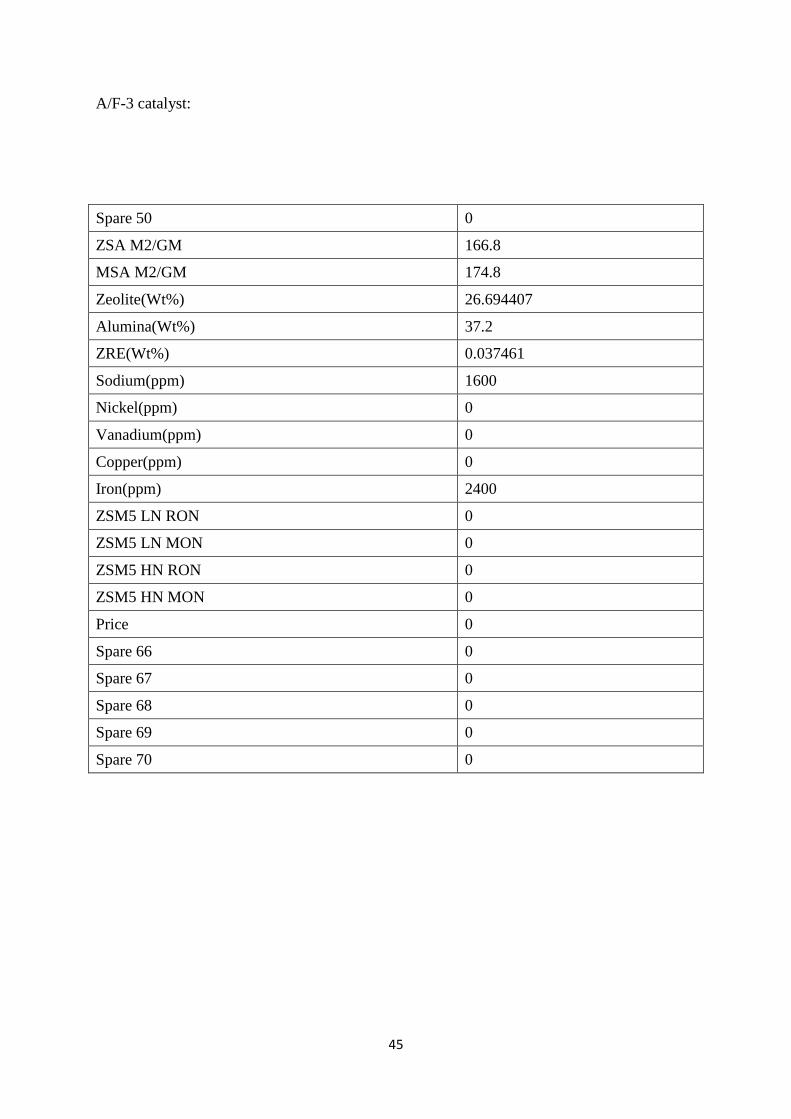
conditions. The detailed composition of the catalysts is shown in the appendix. A/F-3 has a
zeolite concentration of 26.69% and Conquest 95 has zeolite concentration of 24.38%. About
20% to 25% zeolite conc. is good for gasoline yield. More than that results in over-cracking
of the feed resulting in more light olefins which is in the case of A/F3 catalyst (ex. Propylene
conc. 10.6199 % in case of AF3).
The coke yield and olefin yield is higher for A/F3. Sois the total conversion. For Conquest 95
catalyst, Naphtha production is higherin using Conquest 95(42.7707% as compared to
33.2936 % in A/F-3 case). The production of i-butane increases the octane rating of the fuel
which is higher in A/F-3. This reveals the applicability of both catalysts: one can be used
tomaximize the product yield and other is to develop the oil quality.
32
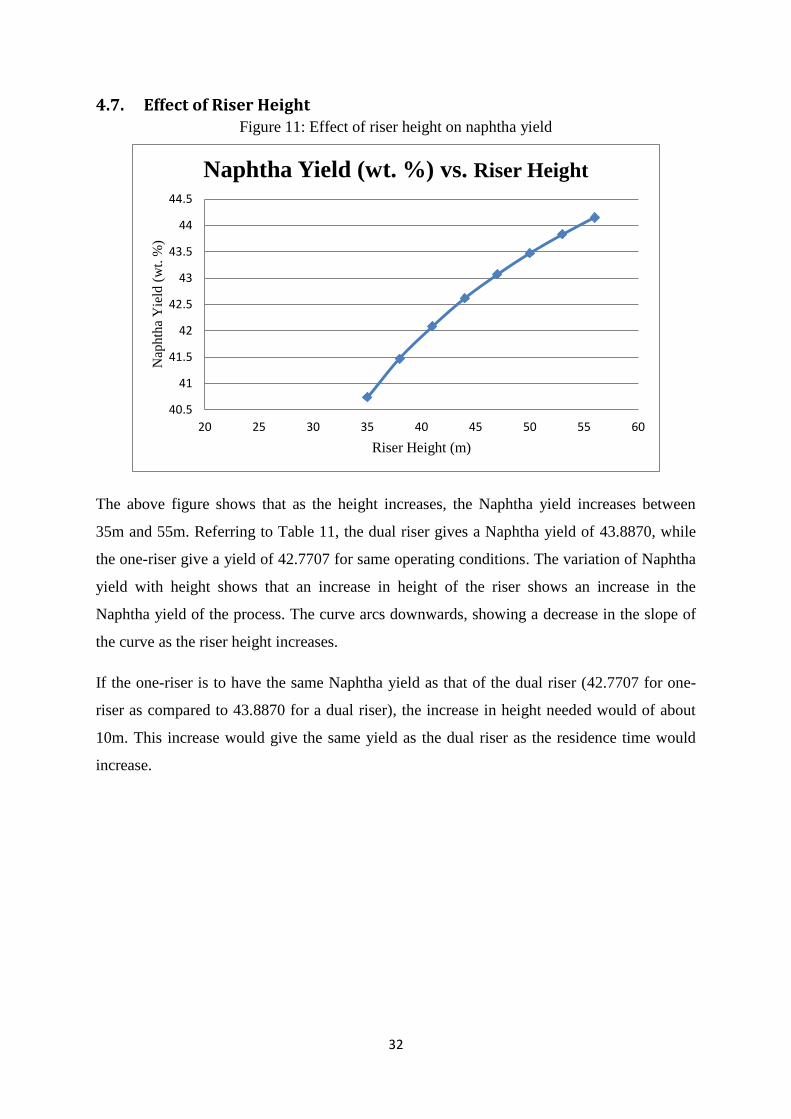
4.7. Effect of Riser Height Figure 11: Effect of riser height on naphtha yield
The above figure shows that as the height increases, the Naphtha yield increases between
35m and 55m. Referring to Table 11, the dual riser gives a Naphtha yield of 43.8870, while
the one-riser give a yield of 42.7707 for same operating conditions. The variation of Naphtha
yield with height shows that an increase in height of the riser shows an increase in the
Naphtha yield of the process. The curve arcs downwards, showing a decrease in the slope of
the curve as the riser height increases.
If the one-riser is to have the same Naphtha yield as that of the dual riser (42.7707 for one-
riser as compared to 43.8870 for a dual riser), the increase in height needed would of about
10m. This increase would give the same yield as the dual riser as the residence time would
increase.
40.5
41
41.5
42
42.5
43
43.5
44
44.5
20 25 30 35 40 45 50 55 60
Nap
hth
a Y
ield
(w
t. %
)
Riser Height (m)
Naphtha Yield (wt. %) vs. Riser Height
33
5. CONCLUSION
Simulation of the FCC unit was done and the results of the output were obtained.Naphtha
yield was been obtained (33.2936) for conditions specified above. Operating parameters: C/O
Ratio, Feed flow rate, Feed temperature and reactor pressure were varied and their effect on
the Naphtha yield, coke yield and total conversion for a one-riser FCC unit was studied.The
graphs peaked at a certain point and then decreased due to explanations given before.
Two catalysts were used in the process and their effects were studied. It was also shown that
in order to achieve the same yield for a one-riser FCC as compared to that of a dual riser
FCC, an increase in height of the riser is needed.
.
34
6. REFERENCES:
1. O'Connor, P. et al. “Improve Residue Processing,” Hydrocarbon Processing, Vol. 70,
No. 11, 1991, pp. 76-84
2. Nelson, W.L., Petroleum refinery engineering, 4th
ed., pp.759-810, New York,
McGraw –Hill Book Co., 1958.
3. AL-Khattaf, S and de Lasa, H.I., “Catalytic Cracking of Cumene in a Riser Simulator,
A catalyst activity decay model”, Ind. Eng. Chem. Res, 40, pp5398-5404, (2001).
4. David S.J. Jones and Peter P. Pujado. Handbook of Petroleum Processing (First ed.).
The Netherlands, Springer, 2006
5. U.S. Downstream Processing of Fresh Feed Input by Catalytic Cracking Units.
Energy Information Administration, U.S. Dept. of Energy, 2012
6. Blazek, J.J., Davidson, Catalagram. Gas jets in fluidized beds. Hydrocarbon
Processing, Vol. 63, pp., 2-10, 1981,
7. Gary J.H., Handwerk G.E., Petroleum refining technology and economics (4th
ed.),
New York. Basel. Marcel Dekker, Inc. 2001
8. Gupta, A., and SubbaRao, D.Effect of feed atomization on FCC performance:
simulation of entire unit. Chem. Eng. Sci., 58 (2003), 4567-4579.
9. Theologos, K.N., and Markatos, N.C. Advanced modeling of fluid catalytic cracking
riser-type reactors. AIChE J., 39, 1007-1017, 1993
10. Milton Beychok, Fluid catalytic cracking, 9 May 2008,
http://en.wikipedia.org/wiki/Fluid_catalytic_cracking, (visited 10, November, 2011)
11. Uppaluri R., Refinery Process Design. Guwahati. AICTE. 2010, p. 12-13
35
12. Sadeghbeigi, R. Fluid Catalytic Cracking Handbook: Design, Operation and
Troubleshooting of FCC Facilities (2nd ed.). Houston, Gulf Publishing, 2000.
13. Kogel, J.E.,Trivedi, N.C., Barber, J.M. Krukowsk, S.T. Industrial Minerals & Rocks:
Commodities, Markets and Uses (Seventh ed.). Colorado, Society of Mining,
Metallurgy and Exploration, 2006.
14. Wen-Ching Yang (2003). Handbook of Fluidization and Fluid Particle Systems. New
York, Marcel Dekker, Inc., 2003.
15. Speight, J.G. The Refinery of the Future. Oxford, Gulf Professional Publishing, 2011.

36
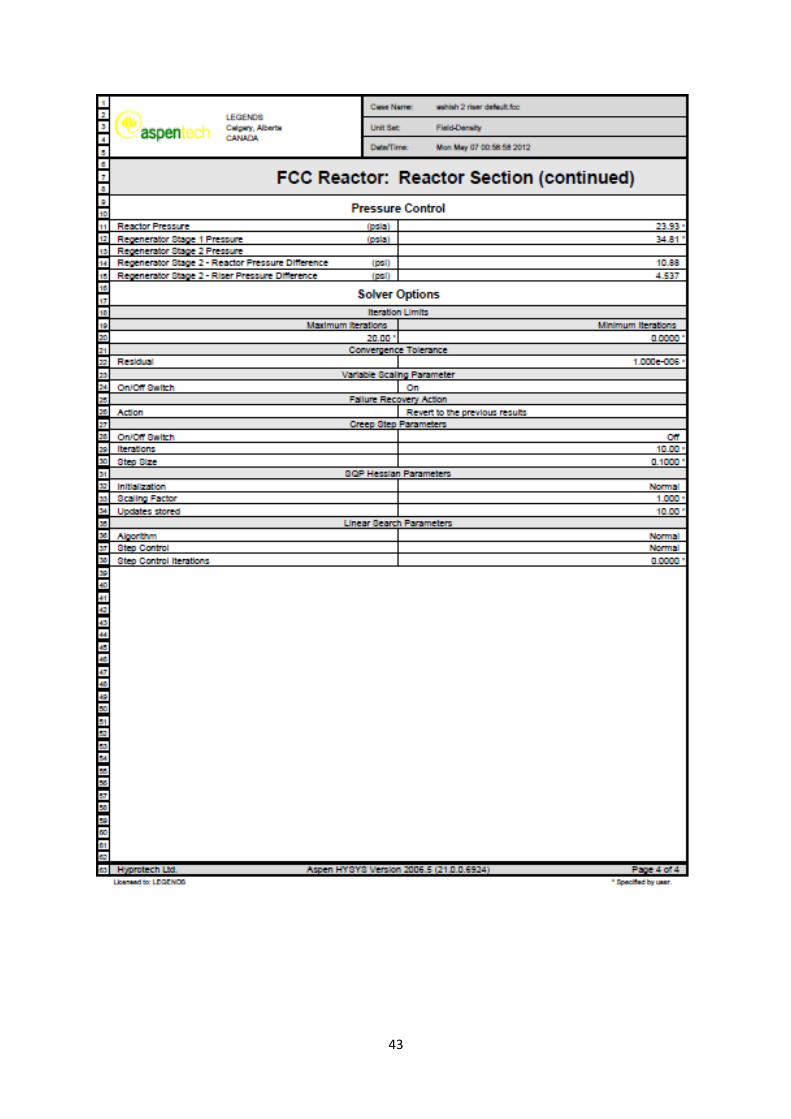
7. APPENDIX a) Conditions for One Riser FCC Unit

37

38

39

40
b) Conditions for Dual Riser FCC Unit
41

42
43

44
c) A/F-3 catalyst composition used in FCC:
FCC Catalyst Name A/F-3
2M1Butene 1.058146
Description Akzo A/F-3
C2Pentene 0.938267
Created Oct-20 2003 17:24 17:24:55 T2Pentene 0.957186
Modified Oct-20 2003 17:24 17:24:55 Cyclopentene 1.046789
Manufacturer Akzo
Isoprene 0.958755
Kinetic Coke 1.045989
Benzene 1.5625
Feed Coke 1.166873
Metals H2 1.563636
Stripping Eff. 0.999811
Heat Of Rxn. 0
Metals Coke 1.057143
Bot. Cracking -0.03785
Methane 1.307692
Fresh MAT 76.05
Ethylene 1.489796
HT Deact. 1.006145
Ethane 1.121951
Met. Deact. 0.611945
Propylene 1.351955
LN RON 2.412
Propane 1.517483
LN MON 1.194
IC4 1.27598
LN Nap. -0.34
Total C4= 1.318519
LN Olefins 7.28
N Butane 1.051095
LN Aromatics 1.155
IC5 1.235693
LCO SPGR -0.00837
Total C5= 1.38799
CSO SPGR -0.0091
NC5 1.017909
SOx 1.037847
IC4= 1.189059
HN RON 2.377714
1Butene 0.943844
HN MON 1.211143
C2Butene 0.947135
HN Nap. -0.895
Butadiene 1.398742
HN Olefins 1.337143
Cyclopentane 0.793549
HN Aromatics 7.283571
3M1Butene 1.052484
LN SPGR 0.005483
1Pentene 0.92546
HN SPGR 0.007414
45
A/F-3 catalyst:
Spare 50 0
ZSA M2/GM 166.8
MSA M2/GM 174.8
Zeolite(Wt%) 26.694407
Alumina(Wt%) 37.2
ZRE(Wt%) 0.037461
Sodium(ppm) 1600
Nickel(ppm) 0
Vanadium(ppm) 0
Copper(ppm) 0
Iron(ppm) 2400
ZSM5 LN RON 0
ZSM5 LN MON 0
ZSM5 HN RON 0
ZSM5 HN MON 0
Price 0
Spare 66 0
Spare 67 0
Spare 68 0
Spare 69 0
Spare 70 0
46
d) Conquest 95 catalyst composition used in FCC
FCC Catalyst Name Conquest 95
Description Akzo Conquest 95
Created Oct-20 2003 17:40 17:40:42 2M1Butene 1
Modified Oct-20 2003 17:40 17:40:42 C2Pentene 1
Manufacturer Akzo
T2Pentene 1
Kinetic Coke 1
Cyclopentene 1
Feed Coke 1
Isoprene 1
Stripping Eff. 1
Benzene 1
Metals Coke 1
Metals H2 1
Methane 1
Heat Of Rxn. 0
Ethylene 1
Bot. Cracking 0
Ethane 1
Fresh MAT 80.8
Propylene 1
HT Deact. 0.5
Propane 1
Met. Deact. 0.5
IC4 1
LN RON 0
Total C4= 1
LN MON 0
N Butane 1
LN Nap. 0
IC5 1
LN Olefins 0
Total C5= 1
LN Aromatics 0
NC5 1
LCO SPGR 0
IC4= 1
CSO SPGR 0
1Butene 1
SOx 1
C2Butene 1
HN RON 0
Butadiene 1
HN MON 0
Cyclopentane 1
HN Nap. 0
3M1Butene 1
HN Olefins 0
1Pentene 1
HN Aromatics 0

47
Conquest95 catalyst used in FCC
LN SPGR 0
HN SPGR 0
Spare 50 0
ZSA M2/GM 141.7
MSA M2/GM 183.3
Zeolite(Wt%) 24.38689
Alumina(Wt%) 39.69
ZRE(Wt%) 12.01465
Sodium(ppm) 2100
Nickel(ppm) 0
Vanadium(ppm) 0
Copper(ppm) 0
Iron(ppm) 2500
ZSM5 LN RON 0
ZSM5 LN MON 0
ZSM5 HN RON 0
ZSM5 HN MON 0
Price 0
Spare 66 0
Spare 67 0
Spare 68 0
Spare 69 0
Spare 70 0