study of 8the d( 7be, b)n reaction - michigan … first, i would like to thank my advisor, prof....
TRANSCRIPT

STUDY OF THE d(7Be,8B)n REACTION
By
Christopher F. Powell
A DISSERTATION
Submitted toMichigan State University
in partial fulfillment of the requirementsfor the Degree of
DOCTOR OF PHILOSOPHY
Department of Chemistry
1998

ABSTRACT
STUDY OF THE d(7Be,8B)n REACTION
By
Christopher F. Powell
A number of previous experiments have been performed which were designed to
study the structure of the 8B nucleus and to determine whether or not it exhibits a proton
halo. These studies have reached conflicting conclusions, and have arrived at very
different values for basic properties of the 8B nucleus, such as its radius. We have
performed a different type of experiment in order to determine whether such a
measurement can provide additional information about the 8B nucleus. We approached
the problem using a traditional technique in the study of nuclear structure: a
single-nucleon transfer reaction.
In the present study we have performed two experiments designed to measure the
cross section of the reaction transferring a single proton from deuterium to 7Be, forming
8B and a neutron: the d(7Be,8B)n reaction. A kinematically complete study of this reaction
has been made, measuring the angle and energy of both reaction products. We have also
measured the scattering cross section of the two reactants: d(7Be,7Be)d. The measured
cross sections were compared to the results of calculations made in the Optical Model
framework. The results of DWBA calculations using several Optical Potentials from the

literature are compared to the measurements, and potentials have been fit to the scattering
cross section.
We have also made similar measurements for the proton transfer reaction from
deuterium to 12C forming 13N, and the scattering of 12C from deuterium. The results of
additional DWBA calculations using Optical Potentials from the literature were compared
to the measured cross sections.

To my parents
iv

ACKNOWLEDGMENTS
First, I would like to thank my advisor, Prof. Dave Morrissey, for the guidance,
support, and friendship he has given me. You were always there with help when I needed
it, and have been an excellent teacher and advocate.
Thanks to Vic Viola and Kris Kwiatkowski, my undergraduate research advisors
at IUCF. You gave me my start in research, and gave me confidence in my abilities that
even grad school couldn't erase.
Thanks to the A1200 post-docs of a few years ago who helped me in my formative
years, Maggie Hellström and Jim Brown. Both of you taught me a great deal, and always
found answers for my questions.
Thanks to the former grad students at IUCF, Kevin Morley, Dave Bracken, and
Erin Foxford. The three of you were great role models for a young scientist.
Thanks to Prof. Paul Mantica, who has been a good friend, a great source of
knowledge, and a tenacious defender in the post.
Special thanks to my chemistry friends: Dr. Per Askeland, Dr. Matt Gardner, Dr.
Sara Helvoigt, and Prof. Michelle Mac. You guys were my classmates, my roommates,
my teammates, and my soul mates. After some of those nights at Dag's we probably
mated in other unspeakable ways as well. More thanks to Greg, Mike, Sue, Rob, and
Kerry.
More special thanks to my cyclotron friends: Don Anthony, Jac Caggiano, and Jon
Kruse. You have been great friends, and knowing you guys were around made it a little
v

easier to drag myself into work (most) every moring. You have also been great teachers;
I've learned at least as much from you as from my research. More thanks to Pat, Barry,
Njema, Erik, Heiko, Mike, Raman, and Mathias.
Still more special thanks to my parents, Joseph and Francyne Powell. You have
always been a source of love, support, and understanding. Everything I have
accomplished has been made possible by the integrity, self-respect, and self-confidence
that you have instilled in me. I owe you my deepest gratitude, and share with you my
deepest love.
Love and thanks to the rest of my family: Rob, Barb, Sue, Carolyn, Mike, Jen,
Steve, Cathy, Al, Don, Glenn, Karen, Beth, Michael, Rachael, Thomas, Emily, Abby,
Danielle, Christina, Katie, and all of those still to come.
Finally, I thank Jennifer Hudson for her patience and her love. You've been my
inspiration and my dearest friend. You kept me going through the best and the worst.
Thank you for sharing it all with me.
vi
Contents
xLIST OF TABLES..................................................................................................
xiiiLIST OF FIGURES................................................................................................
11 Introduction...................................................................................................
11.1 Physics with Radioactive Nuclear Beams...........................................
31.2 Nuclear Halos........................................................................................
61.3 Previous Experiments on the Exotic Nucleus 8B................................
81.4 Purpose of the Present Work...............................................................
112 Experimental Equipment.........................................................................
122.1 The A1200 Fragment Separator..........................................................
142.2 Detectors for the Study of d,n in Inverse Kinematics.......................
172.2.1 Target Ladder.............................................................................
182.2.2 Heavy Fragment Detectors.........................................................
232.2.3 Neutron Detector Array..............................................................
273 Results and Analysis...................................................................................
283.1 NSCL Experiment 93045.....................................................................
283.1.1 TDC Calibration.........................................................................
vii

293.1.2 Measurement of the Neutron Detection Efficiency....................
353.1.3 Determination of the Neutron Flight Path..................................
363.1.4 Identification of the Reaction Products......................................
443.1.5 Normalization of Beam Flux......................................................
443.1.6 Measurement of the Fragment Angle.........................................
453.1.7 Learning From Experiment 93045.............................................
463.2 NSCL Experiment 96019.....................................................................
463.2.1 TDC Calibration.........................................................................
473.2.2 Measurement of the Neutron Detection Efficiency....................
503.2.3 Determination of the Neutron Flight Path..................................
513.2.4 Normalization of Beam Flux......................................................
553.2.5 Identification of the Reaction Products......................................
613.2.6 Energy Calibration of the Neutron Detectors.............................
633.2.7 Calibration of Fragment Telescopes by Elastic Scattering.........
653.2.8 Extraction of the Scattering and Reaction Cross Sections.........
774 Discussion of Optical Model Analysis...................................................
774.1 Theoretical Background of the Optical Model..................................
794.2 Practical Application of the Optical Model........................................
844.3 Survey of Published Optical Potential Parameters...........................
904.4 Variation of Optical Potential Parameters.........................................
934.5 Estimate of the Contribution of Projectile Excitation.......................
964.6 Estimate of the Contribution of Target Excitation............................
viii

994.7 Fitting of Optical Potentials to the Scattering Data..........................
1024.8 Optical Model Calculations of the Transfer Reaction......................
1105 Conclusions....................................................................................................
1105.1 Measurement and Analysis of the Scattering Reaction....................
1115.2 Measurement and Analysis of the Transfer Reaction ......................
114A Fabrication of Thin Polyethylene Foils ...............................................
116B Sample Input for the FRESCO Code .......................................................
120BIBLIOGRAPHY ..................................................................................................
ix

List of Tables
52Determination of the number of 12C nuclei hitting the reaction targetduring the study of d(12C,13N)n. The total number of 12C nuclei hitting theCD2 target was 2.30 1010, the total number hitting the C target was 2.73
109. Correcting these counts for the live-time of the data acquisition,the number of 'computer-live' hits was 1.50 1010 for the CD2 target and1.44 109 for the C target.
3.4
50Flight path lengths to neutron detectors determined by the decay of 17N.3.3
36Ejectile energies from the decay of 17N. Corresponding velocities, and thepeak position in Figure 3.5 are also shown. These values are used todetermine the length of the neutron flight path.
3.2
34Detection efficiencies for neutron detector number 9. From the measuredN and Nn, and the known branching ratios and geometric efficiency, theintrinsic efficiency is determined.
3.1
16Detector placement for experiment 96019. Note that the neutrondetectors subtend 4.35 degrees in the lab frame.
2.3
16Detector placement for experiment 93045. Note that the neutrondetectors subtend 4.35 degrees in the lab frame.
2.2
14Secondary beams from the A1200 and their production. These results area summary of measurements made in NSCL Experiments 93045 and96019.
2.1
8RMS Radii of the 8B nucleus from several experiments.1.2
4Measured momentum distributions and extracted radii for 19,18,17Cperformed by Bazin et al. The very narrow momentum distribution of thebreakup products of 19C reflect the large radius of its neutron halo.
1.1
x

87Parameters of the Gaussian potential used to bind the deuteron in theDWBA calculations. The potential has the functional form used in the
Fresco code:
1 exp 2 1/3
3
2
4.4
87Parameters of the Woods-Saxon potentials used to bind the products ofthe (d,n) reactions.
4.3
83Optical Model Potential parameters used for the calculations ofd(7Be,7Be)d and d(7Be,8B)n described in this chapter.
4.2
83Optical Model Potential parameters used for the calculations ofd(12C,12C)d and d(12C,13N)n described in this chapter.
4.1
76Peak areas and calculated reaction cross sections from the detectors usedin the measurement of d(7Be,8B)n at 25 MeV/A.
3.11
75Peak areas and calculated reaction cross sections from the detectors usedin the measurement of d(12C,13N)n at 21 MeV/A.
3.10
74Peak areas and calculated reaction cross sections from the detectors usedin the measurement of d(7Be,7Be)d at 25 MeV/A.
3.9
73Peak areas and calculated reaction cross sections from the detectors usedin the measurement of d(12C,12C)d at 21 MeV/A.
3.8
69Normalization of the data taken with the 7Be beam using CD2 and Ctargets during the study of d(7Be,7Be)d and d(7Be,8B)n. When the dataobtained from the C target is multiplied by the normalization factor, thetwo data sets are normalized to the same number of incident beam atomsand the same number of carbon atoms in the target.
3.7
69Normalization of the data taken with the 12C beam using CD2 and Ctargets during the study of d(12C,12C)d and d(12C,13N)n. When the dataobtained from the C target is multiplied by the normalization factor, thetwo data sets are normalized to the same number of incident beam atomsand the same number of carbon atoms in the target.
3.6
54Determination of the number of 7Be nuclei hitting the reaction targetduring the study of d(7Be,8B)n. The total number of 7Be nuclei hitting theCD2 target was 2.00 1010, the total number hitting the C target was 2.80
109. Correcting these counts for the live-time of the data acquisition,the number of 'computer-live' hits was 1.08 1010 for the CD2 target and1.38 109 for the C target.
3.5
xi

108Calculation of S17(0) from the d(7Be,8B)n transfer reaction. A separatevalue of S17(0) is extracted for each of the calculations in Figures 4.11and 4.12. Those using the entrance channel potential includecorrections for deuteron excitation, those using the potential do not.
4.5
xii

List of Figures
22Schematic of the data acquisition electronics for the Fragment Detectorsused in experiment 96019. This schematic represents the setup for boththe Fragment Detector the beam axis ("Top") and the FragmentDetector the beam axis ("Bottom").
2.4
21Beam view of the Heavy Fragment Detectors. Each of the two detectorsis divided into 16 different pixel groups based on the lab angle of thepixel. In this figure, different colors indicate the different pixel groups.In the remainder of this document, these groups are referred to as GroupsTop 1-16 and Bottom 1-16.
2.3
15Side view of detectors used in Experiment 96019. The figure shows theneutron detector numbering scheme and their positions. Also shown isthe angular coverage of the fragment telescopes in the lab andcenter-of-mass frame. The exact angles of all detectors are given in Table2.3. The triangles show the allowed angular range for neutrons inkinematic coincidence. If a 8B hits the Bottom Fragment Detector, thecoincidence neutron is emitted at an angle within the triangle above thebeam axis.
2.2
13The A1200 Fragment Separator.2.1
5Schematic of the variation of potential energy as a function of distancefrom the center of a nucleus for both a proton and a neutron. The solidcurves are square-well potentials, the dashed lines are Woods-Saxonpotentials. Vc is the Coulomb potential inside the nucleus. Adapted fromreference [Fr81].
1.2
2The Chart of the Nuclides. Stable nuclei are shown as solid squares, withnuclei that have been observed bound by the solid lines. The dashed linesshow the predicted positions of the proton and neutron drip lines. Theclosed proton and neutron shells at 2, 8, 20, 28, 50, 82, 126, and 162 areindicated.
1.1
xiii

41Neutron events in coincidence with 13N events in the forward telescope.Data shown is from Neutron Detector #1. The neutron energy isdetermined by the reaction kinematics and the detector's angularcoverage.
3.10
39Measured total energy of 8B fragments detected in the top telescope. Flatbackground is due to scattered beam impurities hitting detector, peak is 8Bevents from the (d,n) reaction.
3.9
38Fragments detected in the Top Fragment Detector from 7Be + CD2.3.8
38Subset of the fragments detected in the Top Fragment Detector from 12C +CD2.
3.7
35Neutron detection efficiency curve for neutron detector #9. Datameasured using the decay of 17N, along with Monte Carlo results scaledby 1.357, are plotted. The fit to these points is used to determinedetection efficiency at arbitrary neutron energies.
3.6
33Typical time-of-flight spectrum from -delayed neutron decay of 17N.Prompt beta peak at known energy determines time of decay, areas ofneutron peaks determine detection efficiency at each energy.
3.5
33Light output from Beam-Stopping Scintillator. Spectrum shows eventscollected during both BEAM ON and BEAM OFF cycles. Integration ofthe peak determines the number of 17N decays observed (N =1.57 106
2 104).
3.4
32Side view of the neutron detector efficiency calibration using thebeta-delayed neutron decay of 17N.
3.3
30Schematic of the beta-delayed neutron decay of 17N.3.2
29Time Calibration of TDC channel for Neutron Detector 2. Time betweenpeaks is known to be 10 ns, TDC is set at 200 ns full scale.
3.1
26Schematic of the data acquisition electronics used for each of the 16Neutron Detectors in experiment 96019.
2.6
25Temperature of the PMT base in several configurations as a function of
time.
2.5
xiv

59Subset of the fragments detected in the Bottom Fragment Detector from7Be + C.
3.24
59Subset of the fragments detected in the Bottom Fragment Detector from7Be + CD2.
3.23
58Neutrons in Coincidence with 13N produced from 12C + CD2.Times-of-flight for each of the six neutron detectors are shown.
3.22
57Fragments detected in the Bottom Fragment Detector from 12C + C.3.21
57Subset of the fragments detected in the Bottom Fragment Detector from12C + CD2.
3.20
53Flux calibration for the 7Be beam. Radiation damage caused the changeof the response of the A1200 Target Monitor throughout the study. Thesefigures span approximately 80 hours of beam on target.
3.19
52Flux calibration for the 12C beam. This calibration remained constantthroughout the study of d(12C,13N)n.
3.18
49Fit to measured neutron detection efficiencies and monte carlo data forneutron detector #8. The function used for this fit is = 24.66 +8.14( E)- 7.97( E)2 + 1.05( E)3.
3.17
49Measured neutron detection efficiencies for all neutron detectors at eachneutron energy.
3.16
48Time of flight spectrum from the decay of 17N.3.15
47Time pulses used for TDC calibration of neutron detector #8. Timebetween peaks is known to be 10 ns, the TDC is set at 200 ns full scale.
3.14
43Measured energies of neutrons in coincidence with 8B, along with thereaction kinematics.
3.13
42Measured energies of neutrons in coincidence with 13N, along with thereaction kinematics.
3.12
41Neutron events in coincidence with 8B events in the forward telescope.Data shown is from Neutron Detector #1. The neutron energy isdetermined by the reaction kinematics and the detector's angularcoverage.
3.11
xv

91DWBA calculations of the quasi-elastic scattering of 12C from deuteriumat 21 MeV/u. The solid line in each panel represents the calculation madeusing the global deuteron parameters of Daehnick et al. [Da80]. In eachpanel, one of the parameters of the real or imaginary potentials is varied.
4.3
89DWBA calculations of the d(7Be,7Be)d quasi-elastic and d(7Be,8B)ntransfer reactions at 25 MeV/u. Each line represents a differentcombination of entrance and exit channel parameters from the literature.
4.2
88DWBA calculations of the d(12C,12C)d quasi-elastic and d(12C,13N)ntransfer reactions at 21 MeV/u. Each line represents a differentcombination of entrance and exit channel parameters from the literature.
4.1
72Measured Differential Reaction Cross section for d(7Be,8B)n at 25MeV/A.
3.34
72Measured Differential Reaction Cross section for d(12C,13N)n at 21MeV/A.
3.33
71Measured Differential Reaction Cross section for d(7Be,7Be)d at 25MeV/A.
3.32
71Measured Differential Reaction Cross section for d(12C,12C)d at 21MeV/A.
3.31
70Relative detection efficiency of all detectors used in the measurement ofd(7Be,8B)n. These were calculated using a Monte Carlo simulation of thedetector geometries and intrinsic efficiencies. Similar calculations wereperformed using the kinematics of d(12C,12C)d, d(7Be,7Be)d, and d(12C,13N)n. Note that the scatter in this plot is caused by the irregulargrouping of pixels as shown in Figure 2.3
3.30
64Kinematics of 8B fragments in coincidence with neutrons.3.29
64Kinematics of 13N fragments in coincidence with neutrons.3.28
62Neutron kinematics from d(7Be,8B)n.3.27
62Neutron kinematics from d(12C,13N)n.3.26
60Neutrons in Coincidence with 8B produced from 7Be + CD2.Times-of-flight for each of the twelve neutron detectors are shown.
3.25
xvi

101Scattering cross section of d(7Be,7Be)d which has been corrected for theeffect of deuteron excitation. The points represent the calculateddeuteron excitation cross section (Figure 4.7) subtracted from themeasured scattering cross section (Figure 3.32). The curve is a DWBAcalculation using a potential which has been fitted to the corrected data.The data point at the largest center-of-mass angle has been discarded.The parameters of the potential are given in Table 4.2.
4.10
100Measured d(7Be,7Be)d scattering cross section and DWBA calculations ofthe elastic scattering using 3 potentials which were fit to themeasurement. The parameters of these potentials are given in Table 4.2.
4.9
98The scattering cross section of 7Be from deuterium leaving the deuteronin an unbound excited state. The solid line represents a calculation of thiscross section, the open circle is the observed cross section. The dashedline shows the result of scaling the calculation to match the measurement.Note that the large uncertainty in the angle of the deuteron breakupmeasurement represents the angular range over which the measurement isaveraged. The solid data points are the measured scattering cross section,shown for comparison. Because of the limited energy resolution,deuteron excitation events will contribute to the measured scattering crosssection.
4.7
95DWBA calculations of the scattering of 7Be from deuterium at 25 MeV/u.Calculations are shown for both the ground and excited states of 7Be.
4.6
95DWBA calculations of the scattering of 12C from deuterium at 21 MeV/u.Calculations are shown for both the ground and first excited states of 12C.The sum of these two processes is the solid line, referred to as thequasi-elastic scattering.
4.5
92DWBA calculations of the elastic and inelastic scattering of 7Be fromdeuterium at 25 MeV/u. The solid line in each panel represents thecalculation made using the global deuteron parameters of Daehnick et al.[Da80]. In each panel, one of the parameters of the real or imaginarypotentials is varied.
4.4
xvii

118Sample input for the FRESCO code which was used to calculate the crosssections of d(7Be,7Be)d and d(7Be,8B)n. This calculation produces thecross sections shown as the solid lines in Figure 4.2.
B2
117Sample input for the FRESCO code which was used to calculate the crosssections of d(12C,12C)d and d(12C,13N)n. This calculation produces thecross sections shown as the solid lines in Figure 4.1.
B1
109The contribution to the total d(7Be,8B)n cross section of partial waveswith certain values of orbital angular momentum . The points are joinedwith lines. The solid line shows the contribution to the cross section forall values of the radius. The dashed line shows the contribution to thecross section from radii greater than 1 fm. The figure shows that nearlyall of the transfer reaction cross section comes from interactions at radiiless than 2 fm.
4.14
108Exploration of the effect of different 8B binding potentials on thecalculated cross section. In each calculation, a different potential hasbeen used to bind the 8B product. The parameters of these 8B bindingpotentials are given in Table 4.3. For all calculations, the entranceand exit channel potentials were used. A very precise measurementof the transfer reaction cross section extending to very small angles wouldbe required to pick from among these different binding potentials.
4.13
105Figure 4.12 DWBA calculations of the d(7Be,8B)n transfer reaction withcorrections for deuteron excitation. The entrance channel potential is
, which was fit to the scattering data corrected by the calculateddeuteron excitation cross section. The exit channel potentials were takenfrom the literature. These potentials are described in Table 4.2. For allcalculations the potential was used to bind the 8B, which is describedin Table 4.3. In the upper panel, the raw results are shown. The lowerpanel shows the results of the calculation multiplied by the givenSpectroscopic Factor Sly..
4.12
104DWBA calculations of the d(7Be,8B)n transfer reaction. The entrancechannel potential is , which was fit to the measured scattering data,and the exit channel potentials were taken from the literature. Thesepotentials are described in Table 4.2. For all calculations the potential was used to bind the 8B, which is described in Table 4.3. In theupper panel, the raw results are shown. The lower panel shows the resultsof the calculation multiplied by the given Spectroscopic Factor Sly..
4.11
xviii

Chapter 1
Introduction
1.1 Physics with Radioactive Nuclear Beams
Traditional studies of the atomic nucleus could only be made using ion beams of
naturally abundant nuclei and stable targets. Thus, experimental programs were limited
to working with those nuclei which are stable and can be found in nature. With the
advent of radioactive beam facilities, a much broader range of nuclei can be utilized.
These facilities allow beams of 'exotic' nuclei to be produced, and studies of their
structure and reactions to be performed. While fewer than 300 nuclei are stable and can be
found in nature, predictions show that about 7,000 nuclei should be particle stable, with
lifetimes long on the nuclear time scale. The broad range of these nuclei is illustrated in
Figure 1.1, the chart of the nuclides. Stable nuclei are indicated by the solid squares,
while nuclei that have been observed experimentally lie between the two solid lines. The
two dashed lines indicate the predicted limits of nuclear stability, the proton and neutron
driplines.
19

Figure 1.1 The Chart of the Nuclides. Stable nuclei are shown as solid squares, withnuclei that have been observed bound by the solid lines. The dashed lines show thepredicted positions of the proton and neutron driplines. The closed proton and neutronshells at 2, 8, 20, 28, 50, 82, 126, and 162 are indicated.
With the utilization of both stable and unstable nuclei in experimental programs,
the tools available for study of the nucleus are greatly expanded. Direct study of 'exotic'
nuclei is now possible, and their properties can be compared to those of the stable nuclei.
Since existing models of the nucleus and its structure were formulated based on properties
of the stable nuclei, the application of these models to 'exotic' nuclei is a very stringent
test of their validity. As nuclei are produced and studied that are further and further from
stability, nuclear models can be accepted, rejected, or refined to account for new data.
In addition to providing new data to test existing models, the study of exotic
nuclei has also led to the discovery of features not found among naturally-occurring
20

nuclei. For example, because of their large -decay energies, many nuclei far from
stability have been found to decay via -delayed particle emission. Nuclei beyond the
drip lines can decay via proton or neutron emission. And in nuclei near the neutron drip
line, such as 11Li and 19C, 'nuclear halos' have been observed. The study of these new
properties can lead to a much deeper understanding of the atomic nucleus.
1.2 Nuclear Halos
As one moves from the valley of nuclear stability toward the proton or neutron
dripline, the average binding energy of individual nucleons decreases. At the very limits
of stability, a nucleus might have one bound state very near to the continuum. The small
single-particle separation energy, combined with the short range of the nuclear force, can
lead to tunneling of the nucleon far outside the normal nuclear radius. This phenomenon
was first discovered in the 11Li nucleus by a measurement of its interaction cross section
[Ta85]. The long tail in the matter distribution leads to a greatly enhanced probability of
interaction with the target nucleus, and a very large RMS radius was determined (3.27
fm). This feature of the structure of 11Li was termed a 'neutron halo'. Similar structures
have also been found in other nuclei near the neutron dripline [Ba95, Fu91, Ta85, Za93]
In addition to measurements of interaction cross sections, the properties of neutron
halos have been studied in several ways. Experiments have been performed in which the
halo is stripped from the core, and the momentum distribution of the breakup products is
measured. The momentum distribution of the fragments reflects the internal momentum
21

distribution before the breakup, which is related by the Uncertainty Principle to the size of
the original nucleus. Therefore, a very narrow momentum distribution reflects a very
broad nucleus. Table 1.1 contains results from a series of measurements performed by
Bazin . to study the halo nucleus 19C. Momentum distributions for the breakup
products of a series of carbon isotopes were measured, and the nuclear radii were
extracted [Ba95]. These data show a strong enhancement in the radius of the 19C nucleus,
a sign of its one-neutron halo.
Table 1.1 Measured momentum distributions and extracted radii for 19,18,17Cperformed by Bazin et al. The very narrow momentum distribution of the breakupproducts of 19C reflect the large radius of its neutron halo.
3.0 0.63.0882.517C3.14110.318C
6.0 0.93.2044.319C
r2 1/2 (fm)
Expected Radius(R=r0A1/3) (fm)
Momentum DistributionFWHM (MeV/c) (lab)
Nucleus
Halos have been found and studied in a small number of cases near the neutron
drip line. However, there has been controversy over whether or not a halo might be
formed by one or more protons. Figure 1.2 shows the qualitative shapes of the nuclear
potential as seen by both a proton and a neutron. In the case of a proton, the coulomb
barrier is expected to keep the proton confined near the center of the nucleus. Still, for a
very weakly bound proton (Sp 0), tunneling through this barrier could be significant,
and substantial proton density outside the nuclear core might be observed.
Proton binding energy is weakest near the proton dripline, which is experimentally
accessible only for light nuclei. 8B is therefore the lightest and most accessible
22

proton-halo candidate. Because of the very weak binding of its valence proton (Sp = 138
keV), and because it is experimentally accessible at radioactive beam facilities throughout
the world, the 8B nucleus and its structure have been the focus of much study in the last
several years. A summary of these results is presented in the next section.
Figure 1.2 Schematic of the variation of potential energy as a function of distance fromthe center of a nucleus for both a proton and a neutron. The solid curves are square-wellpotentials, the dashed lines are Woods-Saxon potentials. Vc is the Coulomb potentialinside the nucleus. Adapted from reference [Fr81].
23

1.3 Previous Experiments on the Exotic Nucleus 8B
A number of different experiments have been performed which were designed to
study the structure of the 8B nucleus, and determine whether or not it exhibits a proton
halo. One of the first measured 8B's interaction cross section [Ta88]. The experiment
found an interaction cross section very similar to those of the neighboring boron isotopes,
and the deduced interaction radius followed the A1/3 dependence typically seen in 'normal'
nuclei. These results for the 8B nucleus were in contrast to measured interaction radii of
nuclei found to have neutron halos (which showed much larger than expected interaction
radii). This early result caused many to dismiss the possibility that 8B might contain a
proton halo.
Another early experiment designed as a probe of the structure of 8B was a
measurement of the quadrupole moment [Mi92]. The quadrupole moment was found to
be Q(8B) = 68.3 2.1 mb, which was anomalously large compared to shell model
predictions. This large value of the quadrupole moment was interpreted by the authors as
evidence for a proton halo within the 8B nucleus. However, later calculations showed that
E2 polarization of the 7Be core by the electric field present during the experiment could
enhance the quadrupole moment, and therefore the large quadrupole moment in the 8B
nucleus was not necessarily indicative of a proton halo [Na94].
Experiments studying the momentum distributions of the breakup products of 8B
were also performed in order to study its structure. The breakup of 8B into 7Be and a
proton was studied, and the momentum distribution of the 7Be products was measured.
24

The first such experiment was done by Schwab et al. [Sc95], and the measured
momentum distribution was found to be very narrow when compared to those obtained
from the breakup of 12C and 16O. The deduced RMS radius for the valence proton in 8B of
6.83 fm was much larger than would be expected for a normally bound proton, and was
thought to be a clear sign of a proton halo.
A second study of the momentum distributions of products from the breakup of 8B
was performed by Kelley et al. [Ke96] In this experiment, the measured momentum
distribution of the 7Be fragments was found to be similar to that obtained by Schwab et
al., but after accounting for absorption by the 7Be core, they deduced an RMS radius for
the valence proton in 8B of 4.24 fm. Though this radius is larger than the systematic
behavior of nuclear radii (r0A1/3 2.5 fm), it is much smaller than the RMS halo radius
observed for the neutron halo nucleus 11Li of 6.2 fm [Or92]. These results were
interpreted as evidence against a large proton halo in 8B.
A study of quasi-elastic scattering of 8B from 12C was performed with the goal of
studying the structure of 8B [Pe95]. The measured scattering cross sections were fitted
using Optical Model potentials, and the matter distribution determined. The deduced
RMS matter radius of 2.207 fm for the 8B nucleus was small, and the authors interpreted
this as evidence against a substantial proton halo in 8B.
Table 1.2 summarizes the RMS radii of 8B determined using several different
experimental techniques. Because of the large discrepancies among these values, and the
uncertainty they brought to the question of 8B's structure, we performed a new
experimental study of the 8B nucleus.
25

Table 1.2 RMS Radii of the 8B nucleus from several experiments.
2.21Quasielastic ScatteringPe954.242.39Breakup p-distributionKe966.832.78Breakup p-distributionSc95
2.98Quadrupole MomentMi922.72Total Reaction Wa95
2.38 0.04Interaction Ta88
valenceproton
r2 1/2
7Be core r2 1/2
8B r2 1/2
Experimental Method
Reference
1.4 Purpose of the Present Work
The goal of the present work is to study the structure of the 8B nucleus. Given the
discrepancies among the results of previous work, we chose a different experimental
approach to the problem: the use of a single-nucleon transfer reaction as a probe of 8B's
structure. Such nucleon transfer reactions are a very powerful probe of the structure of
the product nucleus, and have been used for many years in the study of nuclear structure.
The transfer of a single nucleon probes the single-particle states of the product nucleus,
and measurement of the transfer reaction's cross section over a range of angles can reveal
a great deal about the single-particle wave functions. Such a measurement can determine
the angular momentum transfer and thus the spin quantum numbers, the energies of the
single-particle orbits, and a measure of the nuclear radius. In addition, since the
single-particle wave functions are one component of the total final-state wave function,
information about the final-state wave function can also be determined [Fe92].
26
A traditional study of the valence proton state of 8B would use a 7Be target, and
the reaction transferring a proton from projectile to target to form 8B would be studied.
However, with 7Be's somewhat short half-life (53 days), production of such a target
would be difficult. If instead we produce a beam of 7Be and use a deuterium target, the
study of this reaction becomes more tractable. Modern radioactive beam facilities allow
studies of a variety of such reactions in inverse kinematics.
For the present work, we chose the reaction d(7Be,8B)n. This reaction transfers a
single proton from deuterium to 7Be, forming 8B. The reaction probes the proton
single-particle states in the 8B nucleus, and measurement of the reaction cross section over
a range of angles gives information about these states. In this way, the wave function of
the 8B ground state can be determined, and its structure understood. Our goal, then, is to
produce the d(7Be,8B)n reaction, measure its cross section over a range of angles, and
analyze the measured cross section to determine the implications for the structure of 8B.
Another study of d(7Be,8B)n at a much lower bombarding energy (E7Be= 26 MeV)
has recently been published by Liu et al. [Li96]. The focus of their work was not to study
the structure of 8B, but rather to measure the astrophysical S17(0) factor for the 7Be(p, )8B
reaction. The value of S17(0) plays an important role in the solar neutrino problem, since
the 7Be(p, )8B reaction is the source of the high energy neutrinos measured [Ba92]. It
has been previously shown by Xu . that the proton-pickup reaction of 7Be at low
energies can be used to measure S17(0) [Xu94]. Liu . obtained a value of S17(0) = 27.4
4.4 eV b, which is significantly higher than the currently accepted value of S17(0) = 19
eV b [IN97]. As a secondary goal, our work will attempt to use the measurement of42
27

the d(7Be,8B)n reaction cross section to determine the astrophysical S17(0) factor for the
7Be(p, )8B reaction using the method described by Xu . However, there is a general
loss of sensitivity to the value of S17(0) at higher bombarding energies because the nuclei
penetrate more deeply into one another. For this reason, our work is likely to be more
sensitive to the internal structure of 8B than to reactions at the surface of the nucleus.
28

Chapter 2
Experimental Equipment
This study of d(7Be,8B)n consisted of two experiments which took place at the
National Superconducting Cyclotron Laboratory (NSCL) at Michigan State University.
NSCL Experiment 93045 took place in June 1995, and was an exploratory test of the
techniques and detector systems used to make a measurement of a reaction cross section
in inverse kinematics. This experiment was followed in July 1996 by NSCL Experiment
96019, which built upon the results of 93045, and improved upon the shortcomings of the
first.
In order to make the best possible measurement of the reaction cross section, an
array of detectors was assembled to observe products of the (d,n) reaction. In this
way, two measurements of the cross section are obtained, one from the number of 8B
products, and one from the number of neutrons in coincidence with 8B. The observation
of both products in kinematic coincidence (at the correct angles and energies) is the
strongest possible test that the desired transfer reaction took place. Agreement between
these two measures would indicate proper handling of systematic corrections, while the
redundant measurements decrease statistical uncertainties.
29

This chapter describes the experimental equipment used to make the coincidence
measurement of the d(7Be,8B)n reaction in inverse kinematics. This includes the
production of the 7Be beam, and several detector components to identify the products of
the (d,n) reaction. These are detailed in the following sections.
2.1 The A1200 Fragment Separator
Prior to the development of radioactive beam facilities, study of the d(7Be,8B)n
reaction was extremely difficult. However, with today's fragment separators the reaction
can be performed in 'inverse' kinematics, using 7Be as the beam and deuterium as the
target. In studies of the (d,n) reaction, inverse kinematics actually has many advantages
over 'normal' kinematics. In inverse kinematics, the heavy product has enough kinetic
energy to exit even a moderately thick target, and the neutron is moving slowly enough to
allow a high probability for its detection. In contrast, normal kinematics (energetic
deuteron and heavy target) would leave the heavy product trapped in all but the thinnest
targets, and eject an energetic (thus difficult to detect) neutron.
In this study, the energetic 7Be beam was produced in the A1200 Fragment
Separator at the National Superconducting Cyclotron Laboratory operating in
momentum-loss achromat mode [Sh91]. Figure 2.1 shows the schematic design of this
device. A 60 MeV/A 12C beam from the K1200 Cyclotron was focussed onto a 587
mg/cm2 9Be target placed at the medium acceptance target position. The target thickness
was chosen to optimize production of 7Be. The fragmentation products of the collision
between beam and target were separated on the basis of A/Z by the first dipole pair of the
30

A1200, which were set to maximize the transmission of 7Be (B 1=1.567). The beam then
passed through an achromatic 425 mg/cm2 Al wedge, producing a momentum shift
described by the energy loss relation of Bethe:
2
This momentum shift gives each isotope a distinct A, Z, and E, allowing relatively
unambiguous separation in the final pair of dipoles (B 2=1.279). In this work, the
primary beam current was typically 400 nA 12C3+ (133 pnA) using the ECR ion source.
This produced a 7Be count rate in the N3 vault of 335,000 s-1. This beam consisted of
96% 7Be and 4% 8B impurity. Several other secondary beams were produced during
NSCL experiments 93045 and 96019 for reference measurements and calibrations. Their
production is summarized in Table 2.1
Figure 2.1 The A1200 Fragment Separator.
31
Dipole Pair
Dipole PairProductionTarget
FinalFocus
Wedge
and
A1200Target Monitors
QuadrupoleMagnets

Table 2.1 Secondary beams from the A1200 and their production. These results are asummary of measurements made in NSCL Experiments 93045 and 96019.
96 % 7Be, 4% 8B100 % 12C100 % 17NBeam Composition3.4 105 s-18 105 s-11.5 103 s-1Secondary Beam Rate
1.281.341.75B 2
425 mg/cm2 Al300 mg/cm2 Al425 mg/cm2 AlWedge1.571.712.24B 1
587 mg/cm2 9Be790 mg/cm2 9Be587 mg/cm2 9BeProduction Target133 pnA133 pnAPrimary Current
12C @ 60 MeV/A12C @ 60 MeV/A18O @ 60 MeV/APrimary Beam
7Be @ 25 MeV/A12C @ 21 MeV/A17N @ 25 MeV/A
2.2 Detectors for the Study of (d,n) in Inverse Kinematics
In order to perform the coincidence measurement of the (d,n) reaction in inverse
kinematics, a diverse array of detector systems was needed. The detector array had to
identify the particles, and measure their energy and angle of emission. Figure 2.2 shows a
schematic of the detectors used for the study of d(7Be,8B)n in Experiment 96019. The
laboratory and center-of-mass angles of these detectors are reported in Tables 2.2 and 2.3
for NSCL Experiments 93045 and 96019, respectively. These detector arrays consisted
of three major components: target ladder, heavy fragment detectors, and neutron
detectors. Each of these is detailed in the following sections.
32

! " # $ % ! " # $ % ! " # $ % ! " # $ % ! " # $ % ! " # $ % ! " # $ % ! " # $ % ! " # $ % ! " # $ % ! " # $ % ! " # $ % ! " # $ % ! " # $ % ! " # $ % ! " # $ % ! " # $ % ! " # $ %
# 1 # 2
# 8# 4
# 5 # 6
# 7
# 9# 1 0
# 1 1
# 1 2
# 1 3
# 1 4
# 1 5
# 1 6
Neutron Detectors
Neutron Detectors
Top
Fragment Detector
Fragment DetectorBottom
Target
BeBeam7
8B
n1.0 to 3.9 degrees(6.5 to 25.5 degrees c.m.)
2.6 to 5.5 degrees(16.8 to 36.7 degrees c.m.)
Figure 2.2 Side view of detectors used in Experiment 96019. The figure shows theneutron detector numbering scheme and their positions. Also shown is the angularcoverage of the fragment telescopes in the lab and center-of-mass frame. The exactangles of all detectors are given in Table 2.3. The triangles show the allowed angularrange for neutrons in kinematic coincidence. If a 8B hits the Bottom Fragment Detector,the coincidence neutron is emitted at an angle within the triangle above the beam axis.
33

Table 2.2 Detector placement for experiment 93045. Note that the neutron detectorssubtend 4.35 degrees in the lab frame.
34.5103.5Neutron 1428.1112.5Neutron 1322.7121.5Neutron 12
20 - 482.0 - 4.5Bottom Fragment20 - 482.0 - 4.5Top Fragment
CM Angle for d(7Be,8B)n@ 25 MeV/u
Lab AngleDetector
Table 2.3 Detector placement for experiment 96019. Note that the neutron detectorssubtend 4.35 degrees in the lab frame.
35103.5Neutron 1631108Neutron 1528112.5Neutron 1425117Neutron 1323121.5Neutron 1220126Neutron 1118130.5Neutron 1014139.5Neutron 87157.5Neutron 79153Neutron 611148.5Neutron 512144Neutron 418130.5Neutron 223121.5Neutron 1
18 - 362.6 - 5.5Bottom Fragment7 - 251.0 - 3.9Top Fragment
CM Angle for d(7Be,8B)nLab AngleDetector
34

2.2.1 Target Ladder
The target ladder at the center of the detector array was used to position various
devices in the path of the incoming beam. Devices mounted on the ladder included two
targets (reaction and background), a beam normalization detector, and a beam-stopping
scintillator.
The reaction target was an 18 mg/cm2 deuterated polyethylene (CD2) foil, made at
the NSCL from commercially available enriched polyethylene. Details of the fabrication
process can be found in Appendix A. The background target was a 31 mg/cm2 carbon
foil, used to subtract any effect of the carbon atoms in the CD2 target from the measured
reaction cross section.
The Beam Normalization Detector consisted of a 500 m silicon diode masked by
an aluminum target frame thick enough to stop the beam, making the active area the same
size and shape as the reaction and background targets. During several runs over the
course of the experiment, this detector was inserted into the path of the incoming beam to
measure beam intensity. This intensity measurement was used to calibrate and monitor
the response of the A1200 Target Monitors (see Figure 2.1), which continuously
measured the primary beam intensity. With this proportionality, the A1200 Target
Monitors gave a continuous measure of the flux at the reaction target. Because the beam
normalization detector was a silicon diode, its response could be used to measure the
energy loss of the ions passing through it. In this way, the identity of the beam
35

components was determined, and the beam purity at the reaction target was also
measured.
The beam-stopping scintillator consisted of a fast-plastic scintillator (BC412)
3mm thick, 25mm 20mm in area, mounted between two Hammamatsu photomultiplier
tubes (H3167). It was used to stop a beam of 17N from the A1200 and to count betas from
its beta-delayed neutron decay. The neutrons emitted after the beta decay of 17N were
used to calibrate the detection efficiency of the NSCL Neutron Array. The neutron array
is described in section 2.2.3, and the calibration procedure is detailed in section 3.2.1.
2.2.2 Heavy Fragment Detectors
The heavy fragment detectors were designed to identify and to measure the angle
and energy of the heavy product of the (d,n) reaction. Two different systems were used to
accomplish this in experiments 93045 and 96019.
For the first experiment (93045), the heavy fragment detectors consisted of a
Parallel-Plate Avalanche Counter (PPAC) and a pair of silicon diodes. A PPAC is a
gas-filled, position-sensitive counter that was used to determine the angle of the outgoing
fragment; its design is described in [Sw94]. Behind the PPAC were two silicon diodes,
each 500 m thick. The first silicon diode measured the energy loss of the ion in the fixed
thickness of the detector, the second stopped the ion to measure its remaining kinetic
energy. This measure of E-E allowed unique identification of the penetrating ion, along
with its kinetic energy. Unfortunately, the PPACs proved to be inefficient at detecting the
36

high-energy, low-charge ions used in this experiment, and the angles of the reaction
products could not be accurately determined. The shortcomings of this detector system
are discussed more fully in Section 3.1.
For the second experiment (96019), the heavy fragment detectors were changed to
overcome limitations of the PPACs. The new fragment telescopes consisted of a 5
cm2 double-sided silicon-strip detector placed 100 cm from the reaction target, followed
by a 5 cm2 stopping silicon diode. The silicon strip detector is coated with conducting
stripes, dividing the detector into 16 horizontal strips on the front surface, and 16 vertical
strips on the back surface, which in effect, divides the detector into 256 pixels. Each of
the strips is connected to its own channel of linear electronics. Ionization from a particle
passing through any point on the detector will be collected primarily by one horizontal
strip on the front, and one vertical strip on the back. In this way, the position and E of
the ion can be determined by the strip detector. The remaining kinetic energy of the ion is
deposited in the stopping silicon diode, allowing the identity and energy of the ion to be
determined.
The first element of the Top Fragment Detector was a 500 m thick silicon-strip
detector, specially manufactured with a supporting frame surrounding only 3 sides of the
detector. On the fourth side, the active area extended to the edge of the detector, allowing
its placement very near to the beam axis. Behind this strip detector was a 500 m silicon
diode. The Bottom Fragment Detector consisted of a 300 m silicon-strip detector
followed by a pair of 500 m silicon diodes.
37

In order to decrease statistical uncertainties, the data from pixels with similar
angles from the beam axis were combined offline. This formed 16 pixel in each
of the top and bottom detectors. The grouping of pixels is illustrated in Figure 2.3
A schematic of the electronics used for the fragment detector data acquisition is
shown in Figure 2.4.
38

Figure 2.3 Beam view of the Heavy Fragment Detectors. Each of the two detectors isdivided into 16 different pixel groups based on the lab angle of the pixel. In this figure,different colors indicate the different pixel groups. In the remainder of this document,these groups are referred to as Groups Top 1-16 and Bottom 1-16.
39

PA SA
BIT REGISTER
MASTER GATE
SCALER
CFD
Slow
Fast
TFA CFD TDC STOP"Top Time"
or "Bottom Time"
ADC"Top 1-32"
or"Bottom 1-32"
SCALER
& ' ( ) * + , - . / & ' ( ) * + , - . / & ' ( ) * + , - .& ' ( ) * + , - . / & ' ( ) * + , - . / & ' ( ) * + , - .
x32
PA SA
TPO Slow
Fast
DISCFast
Slow
HeavyFragment
∆E
E
TPO Time Pick-OffPA Preamplif ier (NSCL 16-chan)SA Shaping Amplifier (NSCL Quad)CFD Constant-Fraction Discriminator (TC455)ADC Analog-to-Digital ConverterTFA Timing Filter Amplifier (TC241S)DISC Discriminator (MSU Quad CFD)
ADC"Top E"
or"Bottom E"
Figure 2.4 Schematic of the data acquisition electronics for the Fragment Detectors usedin experiment 96019. This schematic represents the setup for both the Fragment Detector
the beam axis ("Top") and the Fragment Detector the beam axis ("Bottom").
40

2.2.3 Neutron Detector Array
In order to measure the angle and energy of the neutron products of the d,n
reaction, the NSCL Neutron Time-of-Flight Array was positioned at backward angles.
This neutron detection system is described in detail in [Ha92]. The array consisted of 16
bars of scintillating fast-plastic (BC412) 157 cm 7.6 cm 2.54 cm. The bars are bent
with a one meter radius of curvature to enable an equal flight path from the target to all
points along the detector. Each scintillator bar was read out by two photomultiplier tubes
(Thorn EMI 9821), one at each end. The calculated mean time from the two
photomultiplier tubes (PMTs) served as the stop signal for the neutron time-of-flight,
while the time difference between the two PMT signals allowed the determination of the
position of the neutron's interaction along the length of the detector. With the bars
positioned one meter from the reaction target, each bar subtended a solid angle of 119.3
msr.
The Neutron TOF Array was designed to be used at atmospheric pressure, and the
requirements of the (d,n) coincidence experiment called for it to be placed inside the 92"
chamber under vacuum. This presented several problems. First, the PMT bases
contained electrolytic capacitors that can fail under vacuum. These capacitors were
replaced with ceramic disks in all 32 PMT bases. Second, under vacuum the lack of
convection might heat the PMTs to high temperatures, causing instability in their
photocathodes and dynodes. To prevent this problem, the equilibrium operating
temperature of the PMT bases was measured at a test station under various conditions.
41

Figure 2.5 shows the PMT base temperature as a function of the elapsed time after voltage
was applied. The equilibrium temperature of the base at atmospheric pressure and
ambient temperature was determined to be 28 C. Under vacuum, this rose to 34.5 C.
After connection of a heat sink to the base, this temperature decreased to 31 C. In
Experiments 93045 and 96019, a steel strap ( 50 cm long) was used to connect each PMT
base to the aluminum support structure to serve as a heat sink. The temperature of one of
the PMT bases (#16) was monitored throughout the experiment, and averaged 26 C in
this configuration.
An unexpected problem with high-voltage connections was discovered in
Experiment 96019. The tight-fitting SHV electrical connectors trapped a volume of gas
inside the connector which slowly leaked out under vacuum. Sparking was observed
inside these connectors, and voltage could not be applied to the detectors until the
connectors were allowed to outgas.
A schematic diagram of the electronics used for the neutron detector data
acquisition is shown in Figure 2.6.
42

Figure 2.5 Temperature of the PMT base in several configurations as a function of time.
43

C F D2 0 0 n s
S C A L E R
A N D N E U T R O N B I TR E G I S T E R
T D C S T O P" L e f t T i m e "
F O
C F D F O T D C S T O P" R i g h t T i m e "
S C A L E R
2 0 0 n s
L e f tP M T
R i g h tP M T
G D GN e u t r o nD e t e c t o r
L O
L O
C F D C o n s t a n t - F r a c t i o n D i s c r i m i n a t o r ( T C 4 5 5 )F O L o g i c F a n - O u tL O N S C L L o g i c B o xG D G G a t e - D e l a y G e n e r a t o r
Figure 2.6 Schematic of the data acquisition electronics used for each of the 16 NeutronDetectors in experiment 96019.
44

Chapter 3
Results and Analysis
In order to make a reliable measurement of the d(7Be,8B)n cross section, several
preliminary calibrations needed to be made. These include TOF calibrations, beam flux
calibrations, and neutron detection efficiency calibrations. Once these measurements
were made, we decided to make a measurement of another (d,n) reaction: d(12C,13N)n.
This is a transfer reaction whose cross section has been measured previously [Pe72, Sc84,
Be93], and involves nuclei which have been studied extensively. The measurement of
d(12C,13N)n serves as a proof-of-concept; if the cross section we measure agrees with
previous works, it will lend validity to our measurement of d(7Be,8B)n.
Experiments 93045 and 96019 were performed in several parts. First, calibrations
of the detector systems were made. This was followed by the measurement of
d(12C,13N)n, and then by the study of d(7Be,8B)n. Section 3.1 details this process for
Experiment 93045, while Section 3.2 describes Experiment 96019.
45

3.1 NSCL Experiment 93045
NSCL Experiment 93045 was our first attempt to study the d(7Be,8B)n reaction.
The experiment was also the first of its kind, attempting to make a coincidence
measurement of a reaction cross section using a radioactive beam. The experiment was
performed in June 1995, and consisted of 120 hours of K1200 primary beam time which
was divided into several parts, each of which are described in the following sections.
3.1.1 TDC Calibrations
In order to make time-of-flight (TOF) measurements of the neutron kinetic
energy, it was necessary to calibrate the response of all Time-to-Digital Converter (TDC)
channels used in the experiment. This was done using an Ortec 462 Time Calibrator, a
NIM electronics module that outputs electronic pulses at fixed time intervals. The 'start'
pulse was directed into the common TOF START, and the 'stop' pulses were input to each
of the 32 TDC channels used to determine the neutron TOF. A sample time spectrum for
this calibration is shown in Figure 3.1. By measuring the channel number of each peak,
and fitting it to the known elapsed time, the number of channels per nanosecond is
determined. All 32 TDC channels were found to be quite linear and quite similar, with an
average of 2.9773 channels/ns for a 512 channel histogram, with an average uncertainty
of 0.0008 channels/ns.
46

Figure 3.1 Time Calibration of TDC channel for Neutron Detector 2. Time betweenpeaks is known to be 10 ns, TDC is set at 200 ns full scale.
3.1.2 Measurement of the Neutron Detection Efficiency
The detection efficiency of the NSCL Neutron Array is strongly dependent upon
the readout electronics. It is therefore necessary to calibrate the neutron detection
efficiency for every new application. This calibration utilized the well-studied
beta-delayed neutron decay of 17N as the calibration standard, a process described in detail
in [Sc93].
17N - decays to one of several neutron-unbound states of 17O with known
branching ratios. The strongest of these states emit neutrons with kinetic energies of
1.689, 1.161, and 0.384 MeV. A schematic of this beta-delayed neutron decay is shown
in Figure 3.2. An efficiency calibration is obtained by counting the total number of 17N
decays, and the neutrons detected at each energy. Figure 3.3 shows a schematic of this
measurement and the associated detectors.
47

17N
17O
16O + n
Nβ
k1N
β
k3N
β
Figure 3.2 Schematic of the beta-delayed neutron decay of 17N.
In order to make the 17N decay measurement, the primary beam from the K1200
cyclotron was cycled on and off. The electronic setup for this procedure is identical to
that used by Harkewicz, and a schematic can be found in [Ha92]. During BEAM ON
cycles ( 4 seconds), a beam of 17N @ 25 MeV/A produced in the A1200 Fragment
Separator was implanted into the beam-stopping scintillator at the target position. During
the BEAM OFF cycles ( 8 seconds), the beta-delayed neutron decay of the implanted
nuclei was observed (t1/2 = 4.17s). The emitted - was detected in the beam-stopping
scintillator, serving as a count of the number of decays (N ) and also as the START signal
for a neutron time-of-flight (TOF) measurement. A spectrum of light-output from this
detector is shown in Figure 3.4. After the beta decay of 17N, the unbound 17O daughter
48

immediately emitted a neutron. If this neutron interacted with one of the neutron
detectors, the time signal from the detector served as the neutron TOF STOP, with the
elapsed time serving as a measure of the neutron energy. Figure 3.5 shows a sample
neutron time-of-flight spectrum from one of the neutron detectors (Detector #9). Peaks
corresponding to neutrons with energies of 1.689 and 1.161 MeV are clearly separated,
and their integration counts the number of detected neutrons at each energy (Nn). The
intrinsic neutron detection efficiency is given for each energy by:
εεβ
=∋ ∋
where is the geometric efficiency of the detector, and is the branching ratio to the
neutron-unbound state. Table 3.1 gives the areas of the neutron peaks from Figure 3.5,
the branching ratios, and the corresponding detection efficiencies.
49

0 1 2 3 4 5 6 7 8 9 : ; < = > ? @ A B C : ; < = > ? @ A B C : ; < = > ? @ A B C : ; : ; < = > ? @ A B C : ; < = > ? @ A B C : ; < = > ? @ A B C : ; : ; < = > ? @ A B C : ; < = > ? @ A B C : ; < =D E F G H I J 1 7 N2 5 M e V / A
N e u t r o nD e t e c t o r s
B e a m - S t o p p i n gS c i n t i l l a t o r
BeamON
(Implant)
BeamOFF
(Decay)
B e a m - S t o p p i n gS c i n t i l l a t o r
β
n
N e u t r o nD e t e c t o r s
1 m e t e r
Figure 3.3 Side view of the neutron detector efficiency calibration using thebeta-delayed neutron decay of 17N.
50

β
Figure 3.4 Light output from Beam-Stopping Scintillator. Spectrum shows eventscollected during both BEAM ON and BEAM OFF cycles. Integration of the peakdetermines the number of 17N decays observed (N =1.57 106 2 104).
β
51

Figure 3.5 Typical time-of-flight spectrum from -delayed neutron decay of 17N.Prompt beta peak at known energy determines time of decay, areas of neutron peaksdetermine detection efficiency at each energy.Table 3.1 Detection efficiencies for neutron detector number 9. From the measured Nand Nn, and the known branching ratios and geometric efficiency, the intrinsic efficiencyis determined.
0.28 0.010.009492080 4250.11.1610.302 0.0070.00949311 176.91.689
DetectionEfficiency
GeometricEfficiency
NeutronCounts
Branching Ratio (%)
NeutronEnergy
Measuring the decay of 17N allows the determination of the neutron detection
efficiency at neutron energies of 1.689 and 1.161 MeV. However, in the study of the
d(7Be,8B)n reaction at 25 MeV/A, the neutrons to be measured ranged in energy from
3.5 MeV to 12 MeV. It was necessary to extend the measured efficiencies to higher
energies. This was done using a Monte Carlo calculation [Ce79] of the neutron detectors,
and scaling the results to the measured data. This extension of the measured neutron
efficiencies to higher energies was performed by Harkewicz, and was shown to give good
agreement between calculated and measured efficiencies [Ha92].
Figure 3.6 shows the dependence of the neutron detector efficiency on neutron
energy for neutron detector #9. Measured efficiencies determined from the decay of 17N
are plotted, along with the results of the Monte Carlo calculation which were scaled to
match the measured values. The fit to these points was used for calculation of neutron
detection efficiency at arbitrary energies.
52

Figure 3.6 Neutron detection efficiency curve for neutron detector #9. Data measuredusing the decay of 17N, along with Monte Carlo results scaled by 1.357, are plotted. Thefit to these points is used to determine detection efficiency at arbitrary neutron energies.
3.1.3 Determination of the Neutron Flight Path
In addition to the peaks from the beta-delayed neutrons, Figure 3.5 also shows that
the neutron detectors occasionally detected the - from 17N decay, and measured its TOF.
Since the energies of the ejectiles from the 17N decay are known, the measured TOF's can
be used to determine the flight path from the beam-stopping scintillator to each neutron
detector. Table 3.2 shows the ejectiles from the decay of 17N, along with their energies
and the corresponding velocities. The flight path is given by
53

= vn [(Cn - C ) k + ]
where vn is the neutron velocity, Cn and C are the peak centroids of the neutron and the
beta, k is the TDC calibration in ns/channel (Section 3.1.1), and is the flight time of the
beta. Note, the kinetic energy of the particle is much larger than its rest mass, and it
travels at essentially the speed of light. In experiment 93045, the average flight path for
neutron detectors 1-14 was determined to be 101.3 0.4 cm, and 91.8 0.3 cm for
detectors 15 and 16.
Table 3.2 Ejectile energies from the decay of 17N. Corresponding velocities, and thepeak position in Figure 3.5 are also shown. These values are used to determine the lengthof the neutron flight path.
-0.8570.384n1469.21.4901.161n1241.31.7981.689n189.429.73.3
Peak Centroid (Figure 3.5)
Velocity(cm/ns)
Kinetic Energy(MeV)
Ejectile
3.1.4 Identification of the Reaction Products
Once the calibration of the neutron detectors was completed, measurements of the
(d,n) reaction cross sections were attempted for both d(12C,13N)n and d(7Be,8B)n.
Collision of the secondary beams with the CD2 target led to a wide variety of reaction
products. These were identified by the fragment telescopes. Figure 3.7 and Figure 3.8
54

show the values of E-E from the fragment telescopes for both 12C +CD2 and 7Be + CD2.
These figures indicate the identification of the nuclei detected at the fragment telescopes,
and the clear separation between isotopes.
The events leading to the detection of the (d,n) reaction product 13N are clearly
visible in Figure 3.7, and are easily isolated from the other fragments hitting this detector.
Integration of these events will lead to the measure of the cross section for the d(12C,13N)n
reaction.
The 8B events are also clearly visible in figure 3.8, and are separable from other
events in this detector. However, in addition to production from the (d,n) reaction, 8B
events also resulted from the scattering of the 8B beam contaminant into the detectors. In
order to determine the reaction cross section in the case of d(7Be,8B)n, the 8B reaction
product had to be isolated from the background events. This process was straightforward,
and is illustrated in Figure 3.9. Because the 8B product was ejected at specific energies
defined by the reaction kinematics, the projection of the 8B total energy shows a strong
peak at the allowed energies. The scattered beam contaminant, however, was evenly
distributed over a range of energies. Subtracting this flat background from the total
energy spectrum gives the true reaction yield for the range of angles covered by this
detector.
55

Figure 3.7 Subset of the fragments detected in the Top Fragment Detector from 12C +CD2.
Figure 3.8 Fragments detected in the Top Fragment Detector from 7Be + CD2.
56
100
100
Total Energy (channels)
Ene
rgy
Loss
(ch
anne
ls)
BeB
300200
200
400
B
LiHe
C
N
Total Energy (channels)
Ene
rgy
Loss
(ch
anne
ls)
100 200 300
50
100
He
Li
Be
B

Figure 3.9 Measured total energy of 8B fragments detected in the top telescope. Flatbackground is due to scattered beam impurities hitting detector, peak is 8B events fromthe (d,n) reaction.
Once the heavy reaction products had been separated from the other events in the
forward telescopes, their correlation with events in the neutron detectors could be
observed. Figure 3.10 shows events in neutron detector #9 correlated with 13N events in
the fragment detectors. This neutron TOF spectrum shows a sharp peak at a particular
neutron energy which is defined by the detector's position and the reaction kinematics.
Similar correlation is seen in Figure 3.11 with neutron detector #9 and 8B events. Figures
3.12 and 3.13 show the energies of the neutron peaks plotted against the angles of the
neutron detectors. The measured neutron energies correlate well with the kinematics for
57

each reaction. This is a clear signal that the peaks in the neutron detectors result from the
reactions we intended to study. Integration of these peaks could lead to a second
measurement of the reaction cross sections of d(12C,13N)n and d(7Be,8B)n.
58

Figure 3.10 Neutron events in coincidence with 13N events in the forward telescope.Data shown is from Neutron Detector #1. The neutron energy is determined by thereaction kinematics and the detector's angular coverage.
Figure 3.11 Neutron events in coincidence with 8B events in the forward telescope. Datashown is from Neutron Detector #1. The neutron energy is determined by the reactionkinematics and the detector's angular coverage.
59

Figure 3.12 Measured energies of neutrons in coincidence with 13N, along with thereaction kinematics.
60

Figure 3.13 Measured energies of neutrons in coincidence with 8B, along with thereaction kinematics.
61

3.1.5 Determination of the Beam Flux
In order to make a measurement of a reaction cross section, it is critical to measure
the flux of incident particles with high precision. Unfortunately, the A1200 Target
Monitors (see Section 2.2.1) failed during the course of Experiment 93045, which
prevented an absolute measurement of the flux of the incident beams. Without
knowledge of the incident beam flux, the absolute reaction cross sections of d(12C,13N)n
and d(7Be,8B)n could not be measured.
3.1.6 Measurement of the Fragment Angle
The goal of Experiment 93045 was to measure the differential cross sections of
d(12C,13N)n and d(7Be,8B)n over a range of angles. As described in Section 2.2.2, the
experiment used PPAC's to measure the position and thus the angle of the reaction
products. Unfortunately, the position resolution of the PPAC's for 8B ions @ 25 MeV/A
was much poorer than expected ( 8 mm FWHM). This position resolution corresponded
to an uncertainty in the fragment angle of 0.5 in the lab, and 5.0 in the center-of-mass
frame. It is thought that the high energy and low nuclear charge of the ion led to weak
ionization in the very thin detectors, and a low signal-to-noise ratio. This poor position
resolution made it impossible to accurately determine the angular distribution of the
reaction cross sections.
Another inherent limitation of the PPAC is the large aluminum frame surrounding
the active area of the detector. This frame prevented placing the detector's active area at
62

angles very near to the beam axis. In order to keep the PPAC frame out of the path of the
incident beam, the smallest angle that could be measured is about 2.0 in the lab.
3.1.7 Learning From Experiment 93045
Although Experiment 93045 failed to make a measurement of the reaction cross
sections of d(12C,13N)n and d(7Be,8B)n, the experiment showed that such a study was
feasible, and pointed to improvements that could be made in subsequent measurements.
The E-E plots (Figures 3.7 and 3.8) showed clear identification of the heavy reaction
products, and that they could be isolated from other events. The angular dependence of
the coincidence neutron energies (Figures 3.12 and 3.13) showed clear evidence of the
(d,n) reactions. Integration of both the heavy fragment and neutron events could lead to
redundant measurements of the reaction cross sections. Counting rates of both reaction
products were measured for various primary beam intensities, which would be used to
estimate the time needed to make a statistically precise measurement of the cross sections.
However, it was clear that greater care needed to be taken to obtain precise normalization
of the incident beam, and that detector systems for measurement of the heavy fragment
angle needed improvement.
63

3.2 NSCL Experiment 96019
NSCL Experiment 96019 was proposed as an improvement to Experiment 93045,
and was approved by NSCL PAC-20 for 126 hours of K1200 Cyclotron time.
Experiment 96019 took place in July 1996.
In order to improve the measurement of d(7Be,8B)n, the Fragment Detectors were
modified by replacing the PPAC's with Silicon Strip detectors. The poor position
resolution of the PPAC's, along with the large frame surrounding the detector's active
area, prevented an accurate measure of the cross section at small angles. The Strip
Detectors were purchased without a frame surrounding the active area on one edge of the
detector. This allowed the active area to be placed very near to the beam axis ( 1.0 ),
allowing measurement of the reaction cross section at angles nearer to 0 . In addition, the
segmented detector assures a position resolution of 1.6 mm. With these detectors, the
measurement of d(7Be,8B)n could be made over a broader range of angles with better
angular resolution.
As with 93045, Experiment 96019 was divided into several parts, each of which
is described in the following sections.
3.2.1 TDC Calibration
In order to accurately measure the neutron TOF, it was necessary to calibrate the
response of all TDC channels. The method used is identical to that used in Experiment
93045, as described in Section 3.1.1. Particular effort was made to cover the entire range
64

of each TDC channel, as can be seen in Figure 3.14. This assured us of linearity over the
entire time range. The measurement calibrated the response for each of the TDC
channels, all were found to be quite linear and consistent. For a 512 channel histogram,
the average of all 32 channels was found to be 2.540 channels/ns with an uncertainty of
0.001 channels/ns.
Figure 3.14 Time pulses used for TDC calibration of neutron detector #8. Timebetween peaks is known to be 10 ns, the TDC is set at 200 ns full scale.
3.2.2 Measurement of the Neutron Detection Efficiency
In order to determine the intrinsic detection efficiency of the neutron detectors
used in Experiment 96019, the beta-delayed neutron decay of 17N was again measured
(see Section 3.1.2). Particular effort was made in this experiment to set electronic
thresholds as low as possible, therefore increasing detection efficiency of lower-energy
65

neutrons. This resulted in the detection of the beta-delayed neutron at 0.384 MeV, in
addition to those neutrons at 1.689 and 1.161 MeV. This can be seen in Figure 3.15, a
sample TOF spectrum. From the integration of these peaks, the neutron efficiency is
measured at three different neutron energies. Figure 3.16 shows measured detection
efficiencies for all of the neutron detectors at each neutron energy. Because of their
anomalously low detection efficiencies, as seen in Figure 3.16, Neutron Detectors 12, 15,
and 16 were determined to be somewhat unreliable. The detection of the 0.4 MeV peak
adds an additional point (compared to the fit shown in Figure 3.6) to the fit of detection
efficiency versus neutron energy, seen in Figure 3.17.
β
Figure 3.15 Time of flight spectrum from the decay of 17N.
66

ε
ε
ε
Figure 3.16 Measured neutron detection efficiencies for all neutron detectors at eachneutron energy.
Figure 3.17 Fit to measured neutron detection efficiencies and monte carlo data forneutron detector #8. The function used for this fit is = 24.66 +8.14( E) - 7.97( E)2 +1.05( E)3.
67

3.2.3 Determination of the Neutron Flight Path
Because the neutron energies from the decay of 17N are known, their measured
peak positions in the TOF spectra can be used to determine the length of their flight path
to each detector (see Section 3.1.3). Table 3.3 shows the distances determined from the
neutron TOF spectra for each of the neutron detectors.
Table 3.3 Flight path lengths to neutron detectors determined by the decay of 17N.
1.006 0.016161.073 0.017151.010 0.019141.070 0.020131.005 0.016121.073 0.020111.010 0.019101.010 0.01991.019 0.01981.015 0.01971.082 0.02061.013 0.01951.082 0.02041.007 0.01920.924 0.0171
Distance from Reaction Target (m)
Neutron Detector Number
68

3.2.4 Normalization of the Beam Flux
An accurate count of the incident beam particles is necessary for determination of
the reaction cross section. In Experiment 96019, this was achieved by comparing the
response of the A1200 Target Monitors to the Beam Normalization Detector at various
beam intensities. Much care was taken with this calibration, and it was repeated every 24
hours.
Figure 3.18 shows the flux calibration of the 12C beam made during the first few
hours of the experiment. This calibration was repeated several times throughout the study
of d(12C,13N)n, and the response of the A1200 target monitors was found to have remained
constant.
Figure 3.19 shows the results of a series of flux calibrations made during the study
of d(7Be,8B)n. The figure shows the result of radiation damage to the response of the
A1200 target monitors during the experiment. Repeating the calibration over the course
of the study proved to be crucial to obtaining an accurate normalization of the 7Be beam.
In fact, three of the four target monitors had failed completely by the end of the
experiment due to the exposure to radiation from the production target.
From the flux calibrations in Figures 3.18 and 3.19, the number of beam particles
reaching the reaction target can be determined for each experimental run. These results
are tabulated for the study of d(12C,13N)n in Table 3.4, and for d(7Be,8B)n in Table 3.5.
69

Figure 3.18 Flux calibration for the 12C beam. This calibration remained constantthroughout the study of d(12C,13N)n.
Table 3.4 Determination of the number of 12C nuclei hitting the reaction target duringthe study of d(12C,13N)n. The total number of 12C nuclei hitting the CD2 target was 2.30 1010, the total number hitting the C target was 2.73 109. Correcting these counts for thelive-time of the data acquisition, the number of 'computer-live' hits was 1.50 1010 for theCD2 target and 1.44 109 for the C target.
1.59 109100173.959130700C693.21 109100173.9518457000CD2683.93 109100173.9522608620CD2673.46 109100173.9519876518CD2665.18 109100173.9529799852CD2651.47 109100173.958458663CD2563.65 109100173.9520994624CD2542.14 109100173.9512311391CD253
Number of 12Con Target
BeamPurity (%)
Slope of FluxCalibration
A1200 TargetMonitorCounts
ReactionTarget
RunNumber
70

1.14 109100173.956580443C70
Figure 3.19 Flux calibration for the 7Be beam. Radiation damage caused the change ofthe response of the A1200 Target Monitor throughout the study. These figures spanapproximately 80 hours of beam on target.
71
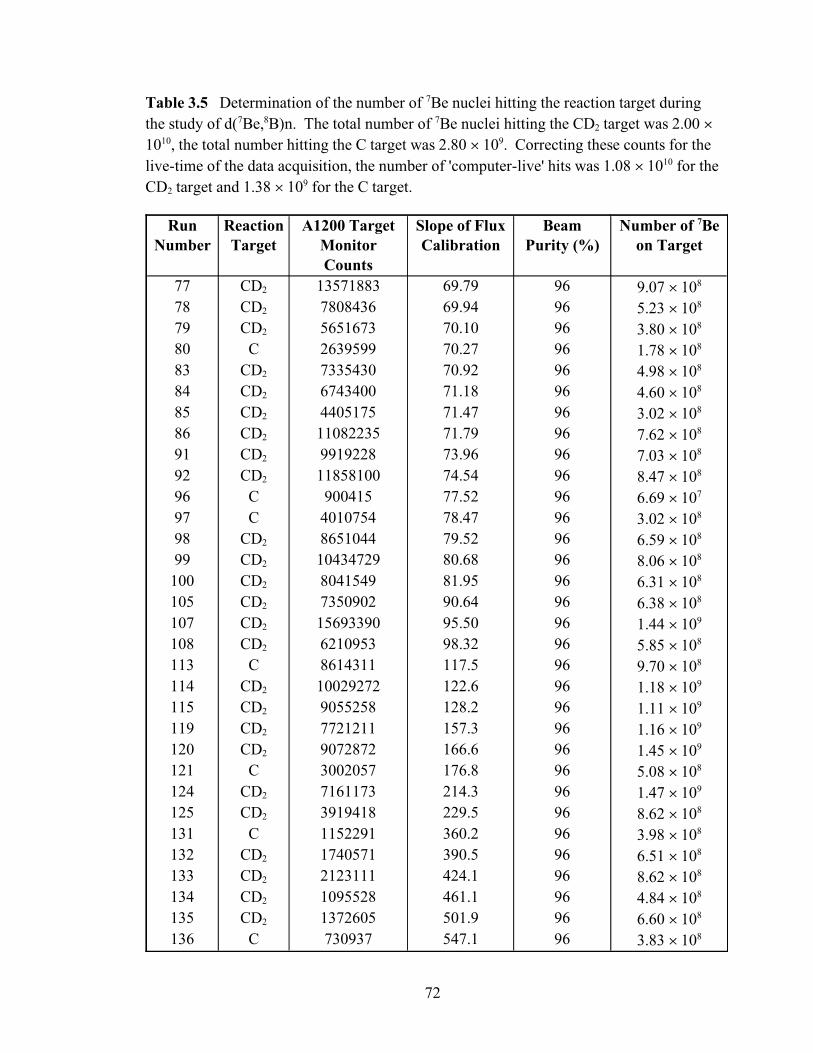
Table 3.5 Determination of the number of 7Be nuclei hitting the reaction target duringthe study of d(7Be,8B)n. The total number of 7Be nuclei hitting the CD2 target was 2.00 1010, the total number hitting the C target was 2.80 109. Correcting these counts for thelive-time of the data acquisition, the number of 'computer-live' hits was 1.08 1010 for theCD2 target and 1.38 109 for the C target.
3.83 10896547.1730937C1366.60 10896501.91372605CD21354.84 10896461.11095528CD21348.62 10896424.12123111CD21336.51 10896390.51740571CD21323.98 10896360.21152291C1318.62 10896229.53919418CD21251.47 10996214.37161173CD21245.08 10896176.83002057C1211.45 10996166.69072872CD21201.16 10996157.37721211CD21191.11 10996128.29055258CD21151.18 10996122.610029272CD21149.70 10896117.58614311C1135.85 1089698.326210953CD21081.44 1099695.5015693390CD21076.38 1089690.647350902CD21056.31 1089681.958041549CD21008.06 1089680.6810434729CD2996.59 1089679.528651044CD2983.02 1089678.474010754C976.69 1079677.52900415C968.47 1089674.5411858100CD2927.03 1089673.969919228CD2917.62 1089671.7911082235CD2863.02 1089671.474405175CD2854.60 1089671.186743400CD2844.98 1089670.927335430CD2831.78 1089670.272639599C803.80 1089670.105651673CD2795.23 1089669.947808436CD2789.07 1089669.7913571883CD277
Number of 7Beon Target
BeamPurity (%)
Slope of FluxCalibration
A1200 TargetMonitorCounts
ReactionTarget
RunNumber
72

3.2.5 Identification of the Reaction Products
Figure 3.20 shows the correlated E-E signals obtained by the Fragment
Telescopes from the interaction of the 12C beam with the CD2 target. Figure 3.21 shows
similar results from 12C + C. If the gate around the 13N events shown in Figure 3.20 is
projected onto the neutron detectors, sharp peaks in the neutron TOF result, as shown in
Figure 3.22. These peaks come from neutrons in coincidence with 13N from the
d(12C,13N)n reaction.
Similar results were seen using the 7Be beam. Figure 3.23 and 3.24 show the
E-E plots from 7Be + CD2 and 7Be + C, respectively. Applying the gate around the 8B
events shown in Figure 3.23 to the neutron detectors gives Figure 3.25, the coincidence
neutron TOF from the d(7Be,8B)n reaction.
One notable difference between the data sets resulting from the 12C beam and
those from the 7Be beam is the amount of background measured from the C target. The
E-E plots from 12C + C show few 13N events, while the plots from 7Be + C show a large
number of 8B events over a range of energies. These events result from the main impurity
of the 7Be beam: 8B. The 8B contaminant scatters throughout the beamline, creating a
background of 8B nuclei over a broad range of energies and angles. Subtraction of the 8B
background events will be crucial to obtain an accurate measure of the reaction cross
section using the data from the forward telescopes. The 8B background should not be in
coincidence with neutrons, however, so the cross section determined from the neutron
data will be free of background from the beam impurity. Comparison of the two
73

measurements of the cross section will show whether or not the background subtraction
was done correctly.
Other features are evident in the E-E plots corresponding to the combinations of
various beams and targets. Events resulting from the elastic scattering of beam from the
target are shown in Figures 3.21 and 3.24. These events were used to make energy
calibrations of the Fragment Telescopes, a process detailed in Section 3.2.7.
74

Figure 3.20 Subset of the fragments detected in the Bottom Fragment Detector from 12C+ CD2.
Figure 3.21 Fragments detected in the Bottom Fragment Detector from 12C + C.
75
50 150 200
100
200
100
Total Energy (channels)
Ene
rgy
Loss
(ch
anne
ls)
LiBe
B
C
N
50 150 200
100
200
100
Total Energy (channels)
Ene
rgy
Loss
(ch
anne
ls)
LiBe B
C
N
C Elastics

Figure 3.22 Neutrons in Coincidence with 13N produced from 12C + CD2.Times-of-flight for each of the six neutron detectors are shown.
76

Figure 3.23 Subset of the fragments detected in the Bottom Fragment Detector from 7Be+ CD2.
Figure 3.24 Subset of the fragments detected in the Bottom Fragment Detector from 7Be+ C.
77
50 150 200
100
100
Total Energy (channels)
Ene
rgy
Loss
(ch
anne
ls)
Be
B
150
50
50 150 200
100
100
Total Energy (channels)
Ene
rgy
Loss
(ch
anne
ls)
BeB
150
50
B ElasticsBe Elastics

Figure 3.25 Neutrons in Coincidence with 8B produced from 7Be + CD2.Times-of-flight for each of the twelve neutron detectors are shown.
78

3.2.6 Energy Calibration of the Neutron Detectors
In order to measure the energy of the neutrons emitted from the (d,n) reaction, it
was necessary to calibrate the neutron TOF. The slope of the TOF calibration is
determined by the TDC calibrations described in Section 3.2.1, and the peaks from
relativistic particles ( , ) in the neutron spectra determine the intercept. The validity of
the calibration is shown in Figures 3.26 and 3.27. In these figures, the energies of the
coincidence neutron peaks show very good agreement with the reaction kinematics for
both d(12C,13N)n and d(7Be,8B)n systems.
79

Figure 3.26 Neutron kinematics from d(12C,13N)n.
Figure 3.27 Neutron kinematics from d(7Be,8B)n.
80

3.2.7 Calibration of Fragment Telescopes by Elastic Scattering
In order to determine the energies of the heavy products of the (d,n) reactions, the
response of the Fragment Telescopes had to be calibrated. This was done using the elastic
scattering of the beam nuclei from the carbon target, the locus of which are marked in
Figures 3.21 and 3.24. The kinematics of the elastic scattering are known, therefore each
pixel of the Fragment Telescopes (a specific angle) records elastically scattered particles
with a specific energy. Three elastic scattering reactions were used to calibrate each
pixel: 12C(12C,12C)12C, 7Be(12C,12C)7Be, and 8B(12C,12C)8B, and thus we have a three-point
calibration for the energy scale.
The validity of the energy calibration is demonstrated in Figures 3.28 and 3.29.
The coincidence neutron events from each neutron detector are projected onto the
Fragment Telescopes. This defines a particular energy for each fragment group based on
the lab angle of the neutron detector. In Figures 3.28 and 3.29, the calibrated energies for
the 13N and 8B reaction products are plotted versus the neutron detector angle, along with
the reaction kinematics. The agreement between the calculated energy and the kinematics
show the calibration's validity. Note that the large error bars in these figures are a
systematic effect resulting from the angular coverage of the neutron detectors and the
expanded scale of the figure.
81

Figure 3.28 Kinematics of 13N fragments in coincidence with neutrons.
82

Figure 3.29 Kinematics of 8B fragments in coincidence with neutrons.3.2.8 Extraction of the Scattering and Reaction Cross Sections
A single procedure for extracting reaction cross sections was used for all reaction
and scattering processes studied. This section details the methods for measuring the
scattering cross sections of d(12C,12C)d and d(7Be,7Be)d, and the reaction cross sections of
d(12C,13N)n and d(7Be,8B)n.
All measurements from Experiment 96019 made using the CD2 target contain
events resulting from beam interacting with deuterium, which we wish to study, and
events resulting from the beam interacting with carbon. For this reason, all measurements
using the CD2 target were repeated with a target of pure carbon. This allowed the
contribution of the carbon nuclei to be measured and removed from the CD2 target data.
83

In order to perform this subtraction, the data must be normalized to the same number of
incident beam particles and the same number of carbon atoms in each target. Table 3.6
and Table 3.7 contain the details of the normalization process for the 12C and 7Be beams,
respectively.
The carbon-subtraction was performed on the histograms of the fragment total
energy. These histograms were obtained by projecting the data falling into the fragment
gates onto the total energy axis for each of 32 pixel groups in the fragment telescopes.
The fragment gates are shown in Figure 3.20 for 13N, Figure 3.21 for 12C, Figure 3.23 for
8B, and Figure 3.24 for 7Be. The values in the histograms from the carbon target were
multiplied by the normalization factor, then subtracted from the CD2 target data. The
resulting histograms should include only the contribution of the beam + deuterium, and
Gaussian functions were fitted to these peaks. Fitting and integration of the peaks gives
the number of detected product nuclei for each of the 32 pixel groups in the fragment
telescopes. The measured peak areas are tabulated in Tables 3.8, 3.9, 3.10 and 3.11 for
d(12C,12C)d, d(7Be,7Be)d, d(12C,13N)n, and d(7Be,8B)n systems, respectively.
For the transfer reactions d(12C,13N)n and d(7Be,8B)n, the number of coincidence
neutrons served as an additional measure of the reaction cross sections. Because very few
neutrons were observed with the carbon target (as opposed to the CD2 target), subtraction
of the carbon target data from the coincidence neutron data was deemed unnecessary.
Integration of the neutron TOF peaks in each detector gives the number of neutrons
resulting from the (d,n) reactions. The areas of these neutron peaks are tabulated in Table
3.10 for d(12C,13N)n and in Table 3.11 for d(7Be,8B)n.
84

In order to compare the yields for different groups of pixels in each detector, their
solid angles must be normalized. The normalization was obtained through a Monte Carlo
computer simulation of the detector geometries. In this way, the relative geometric and
intrinsic efficiencies of all detectors can be easily accounted for. Figure 3.30 shows the
results of these simulations for the d(7Be,8B)n reaction kinematics, the other reactions are
similar. The figure shows the relative detection efficiencies (both geometric and intrinsic
combined) for the fragment and neutron detectors. Note that the scatter in this plot is
caused by the irregular grouping of pixels as shown in Figure 2.3.
The measured peak areas divided by the relative detector efficiency give the
angular distribution of the reaction yield. The yield can be converted to a differential
cross section using the beam flux (described in Section 3.2.4), the deuterium density in
the target (1.33 1021 cm-2 for 18 mg/cm2 CD2), and the calculated solid angle of one of
the detectors. The absolute cross sections for the remaining detectors were determined
based on their relative yields. The measured angular distribution of the scattering cross
sections for d(12C,12C)d and d(7Be,7Be)d are plotted in Figures 3.31 and 3.32, and
tabulated in Tables 3.8 and 3.9. The measured angular distribution of the transfer reaction
cross sections for d(12C,13N)n and d(7Be,8B)n are plotted in Figures 3.33 and 3.34, and
tabulated in Tables 3.10 and 3.11.
For all cross section measurements, a discrepancy was found between the absolute
normalization of the Top and Bottom Fragment Detectors. It was noted during the
experiment that a constant-fraction discriminator used in the acquisition electronics had
behaved erratically. It is suspected that this led to the loss of events by the Top Fragment
85

Detector. In addition, better particle identification was achieved with the Bottom
Fragment Detector. For these reasons, the absolute normalization of the data was taken
from the Bottom Fragment Detector. The results from the Top Fragment Detector were
normalized to the results from the Bottom Fragment Detector, and were used to increase
the angular coverage of the measurement.
The measurements of the scattering cross sections d(12C,12C)d and d(7Be,7Be)d
have an important limitation at angles very near to the beam axis. The angular divergence
of the 12C and 7Be beams caused beam to hit the detectors at very small lab
angles. This caused very high count rates of 12C or 7Be in the pixel groups closest to the
beam. These events cannot be separated from the elastic scattering events, and led to very
high measured cross sections in these pixel groups. At twice the angular divergence of
the beam (2 lab frame), this effect was estimated to be negligible. Therefore, data from
those pixel groups which have lab angles smaller than 2 (Top 1 through Top 6) were
removed from the measurements of the d(12C,12C)d and d(7Be,7Be)d scattering cross
sections.
A limitation of the measurements of d(12C,12C)d, d(7Be,7Be)d, and d(12C,13N)n is
the inability to resolve events leading to excited states of the products. Because of the
energy spread of the incident beam (6% 15 MeV for the 12C beam, 6% 10 MeV for the
7Be beam), the energy resolution of the system was insufficient to identify nuclei in their
low-lying excited states based on the energy deposited in the fragment detectors. 12C, 13N,
and 7Be all have bound excited states, and the deuteron can be excited to unbound
continuum states above 2.2 MeV. The reported cross sections for these reactions may
86

therefore contain contributions from interactions leading to both ground and excited states
of the products.
For the d(7Be,8B)n reaction, however, the measurement will be of the pure ground
state to ground state transition. This is because 8B contains no bound excited states, and
any excitation would cause it to break up before reaching the Fragment Detectors.
87

Table 3.6 Normalization of the data taken with the 12C beam using CD2 and C targetsduring the study of d(12C,12C)d and d(12C,13N)n. When the data obtained from the C targetis multiplied by the normalization factor, the two data sets are normalized to the samenumber of incident beam atoms and the same number of carbon atoms in the target.
-9.99 10301.50 10106.66 102018 mg/cm2 CD2
4.442.25 10301.44 1091.56 102131 mg/cm2 C
NormalizationFactor
Beam atoms target atom
Total 12C beamatoms hitting
target
Carbonsper cm2 in
target
Target
Table 3.7 Normalization of the data taken with the 7Be beam using CD2 and C targetsduring the study of d(7Be,7Be)d and d(7Be,8B)n. When the data obtained from the C targetis multiplied by the normalization factor, the two data sets are normalized to the samenumber of incident beam atoms and the same number of carbon atoms in the target.
-7.19 10301.08 10106.66 102018 mg/cm2 CD2
3.352.15 10301.38 1091.56 102131 mg/cm2 C
NormalizationFactor
Beam atoms target atom
Total 7Be beamatoms hitting
target
Carbonsper cm2 in
target
Target
88

Figure 3.30 Relative detection efficiency of all detectors used in the measurement ofd(7Be,8B)n. These were calculated using a Monte Carlo simulation of the detectorgeometries and intrinsic efficiencies. Similar calculations were performed using thekinematics of d(12C,12C)d, d(7Be,7Be)d, and d(12C,13N)n. Note that the scatter in this plotis caused by the irregular grouping of pixels as shown in Figure 2.3
89

σω
Figure 3.31 Measured Differential Reaction Cross section for d(12C,12C)d at 21 MeV/A.
σω
Figure 3.32 Measured Differential Reaction Cross section for d(7Be,7Be)d at 25 MeV/A.
90

σω
Figure 3.33 Measured Differential Reaction Cross section for d(12C,13N)n at 21 MeV/A.
σω
Figure 3.34 Measured Differential Reaction Cross section for d(7Be,8B)n at 25 MeV/A.
91

Table 3.8 Peak areas and calculated reaction cross sections from the detectors used inthe measurement of d(12C,12C)d at 21 MeV/A.
12.3±76.3405±5654.040.68±40.24Bottom 1625.97±97.651716±7679.360.68±38.67Bottom 1514.83±97.13344±6970.360.53±37.21Bottom 1413.93±89.68374±6569.850.52±35.85Bottom 1312.49±84.21263±7436.460.67±34.4Bottom 1211.52±74.66318±5834.150.54±32.98Bottom 1114.58±97.21304±7494.540.53±31.64Bottom 1014.28±94.84345±7973.480.52±30.3Bottom 914.01±93.89375±9451.380.66±28.88Bottom 812.85±85.63287±6976.810.41±27.6Bottom 713.02±87.45306±8083.770.49±26.35Bottom 611.41±75.78391±8655.240.65±24.96Bottom 518.19±116.93601±10255.560.46±23.7Bottom 417.28±115.78673±16241.560.67±22.33Bottom 323.62±156.15612±13329.860.28±21.05Bottom 234.17±224.87736±15767.020.41±19.89Bottom 1
14.71±87.881352±15704.471.04±27.38Top 1613.68±90.2749±15309.680.67±25.59Top 1516.28±104.321051±17207.280.65±24.06Top 1424.22±166.631135±43938.740.94±22.24Top 1328.07±191.09972±31630.220.48±20.5Top 1244.23±248.254540±43035.720.43±19.25Top 1138.04±06075±59978.760.45±18.02Top 1083.56±408.6816820±115099.90.81±16.57Top 9140.58±687.1619321±132427.80.4±15.25Top 8117.94±759.3812194±201706.30.48±14.09Top 7
19750±320426.30.37±12.87Top 65875±3124910.23±11.97Top 540283±745759.80.28±11.21Top 471425±20656680.35±10.16Top 3173178±50940150.35±9Top 2305002±55637880.3±7.78Top 1
ReactionCross Section
(mb/sr)
Area ofGaussian
Fit
Centerof MassAngleDetector
92

Table 3.9 Peak areas and calculated reaction cross sections from the detectors used inthe measurement of d(7Be,7Be)d at 25 MeV/A.
14.18±105.2377±19020.4±25.35Bottom 1630.08±226.55148±43440.4±24.42Bottom 1537.09±281.67143±50080.32±23.55Bottom 1444.47±341.47136±62780.31±22.74Bottom 1353.07±411.01156±90100.4±21.87Bottom 1267.38±521.8150±101300.32±21.02Bottom 1179.88±620.67154±126790.32±20.21Bottom 1093.14±724.76177±155100.32±19.4Bottom 9114.67±894.59258±222070.4±18.54Bottom 8132.28±1026.58254±201610.24±17.75Bottom 7144.95±1129.78326±271220.3±16.99Bottom 6146.59±1146.84318±317000.4±16.14Bottom 5206.45±1609.25400±370000.28±15.36Bottom 4197.68±1551.57540±541010.41±14.51Bottom 3203.87±1588.79405±364400.18±13.72Bottom 2233.33±1799.58640±344040.25±13Bottom 1
153.94±1168.551000±290000.64±17.08Top 16180.96±1388.71000±349000.4±15.99Top 15208.5±1606.411000±387000.4±15.05Top 14232.97±1797.22000±707000.58±13.93Top 13256.31±1989.611000±486000.29±12.85Top 12286.67±2234.731000±573000.27±12.07Top 11295.15±2252.132000±617000.29±11.3Top 10247.8±1922.72000±802000.49±10.4Top 9306.04±2395.441000±683000.25±9.56Top 8244.08±1831.713000±717000.32±8.84Top 7
160000±2510000.24±8.06Top 64000±727000.17±7.51Top 510000±2160000.19±7.01Top 4100000±17000000.22±6.33Top 3100000±128000000.23±5.58Top 2400000±185000000.2±4.78Top 1
ReactionCross Section
(mb/sr)
Area ofGaussian
Fit
Center ofMassAngleDetector
93

Table 3.10 Peak areas and calculated reaction cross sections from the detectors used inthe measurement of d(12C,13N)n at 21 MeV/A.
0.09±0.264±131.43±28.01Neutron 140.19±0.879±740.9±13.96Neutron 80.19±0.848±600.79±10.47Neutron 50.19±0.888±660.84±12.16Neutron 40.18±0.848±711.03±17.93Neutron 20.13±0.577±501.21±22.57Neutron 1
0.04±0.149±371.12±60.6Bottom 160.04±0.187±461.12±58.02Bottom 150.04±0.26±480.87±55.63Bottom 140.06±0.258±610.85±53.41Bottom 130.05±0.2111±601.08±51.07Bottom 120.07±0.2414±630.86±48.77Bottom 110.06±0.2310±580.84±46.62Bottom 100.05±0.218±570.82±44.5Bottom 90.07±0.2814±841.04±42.26Bottom 80.06±0.2111±520.63±40.24Bottom 70.06±0.2711±790.76±38.3Bottom 60.05±0.2211±731±36.14Bottom 50.09±0.3615±970.71±34.21Bottom 40.08±0.3714±1511.03±32.11Bottom 30.09±0.4111±1050.42±30.16Bottom 20.09±0.3812±860.62±28.41Bottom 1
0.09±0.2222±571.64±39.9Top 160.06±0.2311±571.03±37.11Top 150.08±0.2715±621±34.76Top 140.1±0.4617±1771.44±31.97Top 130.1±0.3616±830.73±29.33Top 120.12±0.5813±1390.64±27.45Top 110.14±0.6720±1730.67±25.6Top 100.11±0.5122±1941.2±23.46Top 90.2±119±2570.58±21.52Top 80.19±0.9131±3300.7±19.82Top 70.22±1.1326±3810.53±18.05Top 60.2±0.9622±2190.33±16.76Top 50.22±1.123±3200.4±15.66Top 40.23±1.1728±3680.5±14.17Top 30.22±0.942±2680.49±12.53Top 20.46±0.7789±1540.42±10.82Top 1
ReactionCross Section
(mb/sr)
Area ofGaussian
Fit
Center ofMassAngleDetector
94

Table 3.11 Peak areas and calculated reaction cross sections from the detectors used inthe measurement of d(7Be,8B)n at 25 MeV/A.
0.6±2.487±541.42±28.17Neutron 140.64±2.688±591.32±25.34Neutron 130.61±2.68±671.12±20.31Neutron 110.57±2.337±501.04±18.07Neutron 101.48±6.7411±1190.9±14.06Neutron 80.8±3.6210±1040.74±7.37Neutron 71.1±5.0411±1250.77±8.92Neutron 61.31±6.0812±1440.8±10.54Neutron 51.68±7.711±1250.85±12.25Neutron 41.22±5.4410±921.04±18.07Neutron 20.75±3.117±541.21±22.72Neutron 1
0.12±0.236±130.61±37.05Bottom 160.24±0.1613±90.61±35.64Bottom 150.56±0.7728±400.48±34.32Bottom 140.38±0.720±390.48±33.09Bottom 130.5±1.822±1150.61±31.78Bottom 120.56±2.1121±1210.49±30.49Bottom 110.75±2.8331±1770.48±29.27Bottom 101.08±3.4254±2210.47±28.06Bottom 91.13±3.5664±2570.6±26.77Bottom 80.7±2.7326±1600.36±25.6Bottom 71.05±3.8553±2830.44±24.48Bottom 60.91±3.6646±3050.59±23.21Bottom 51.03±4.3240±2970.41±22.06Bottom 41.02±3.6872±3680.6±20.81Bottom 30.58±2.2924±1530.26±19.65Bottom 20.83±3.6723±2150.37±18.6Bottom 1
0.86±3.2825±1470.95±24.61Top 160.92±4.2118±1870.59±22.99Top 150.93±4.1918±1760.59±21.6Top 140.94±4.0635±2850.85±19.95Top 131.09±4.3829±1920.42±18.37Top 121.13±4.3135±2010.39±17.24Top 11
0.42±16.12Top 101.24±4.4764±3300.71±14.82Top 9
0.35±13.61Top 81.43±5.5365±3890.46±12.57Top 7
0.35±11.45Top 62.19±6.3882±2920.24±10.67Top 5
0.27±9.95Top 40.31±8.98Top 30.33±7.91Top 20.29±6.78Top 1
ReactionCross Section
(mb/sr)
Area ofGaussian
Fit
Center ofMassAngleDetector
95

Chapter 4
Optical Model Analysis
In order to understand the data from Experiment 96019, Optical Model
calculations were performed and the results were compared to the measured scattering
and transfer reaction data. Such an analysis allows the measured cross sections to be
related to structural properties of the nuclei involved.
4.1 Theoretical Background of the Optical Model
The Optical Model is an effective model in which the interactions of an incident
particle with the nucleons of the nucleus are replaced by the interaction of the incident
particle with a potential-energy well. The aim is to find a potential that can reproduce the
measured scattering cross section. The features of this potential then give information
about the general or average structure of the nuclei involved in the reaction.
Nuclear scattering can be divided into two categories: elastic scattering in which
only the direction of the incoming particle is changed, and inelastic scattering in which
the particle is scattered into an exit channel different from the incident one. The Optical
Model treats these two possibilities analogously to the study of optical waves, with elastic
96

scattering corresponding to of the wave at the surface of the potential, and
inelastic scattering corresponding to . As is the case with optics, a complex
potential is used to describe the nucleus, with refraction caused by the real potential, and
absorption caused by the imaginary part. A more complete description of the Optical
Model can be found in [Wo90].
In order to calculate nuclear scattering cross sections, an Optical Model potential
is chosen to describe the nuclear potential. The Schrodinger equation for the scattering is
then given by
KMLONQPSRTNVUXWYKMZ[U]\ N_^`acbed KfZgUXWYKfZ[U
where is the sum of the Coulomb potential and the Optical Model Potential, is the
reduced mass of the projectile and target, and is the relative momentum. The solution to
this equation can be expressed as
hYifjgk]lnmporq_sut vxwzy_|~x iMjjukifjuk_hiMjrk_[pj
where G(r,r') is a Green's Function. The scattering amplitude ( ) determined by this
wave function is given by
fz Mxe r¡_¢V£ ¤_¥u¦ M§¨u p r¡_©ª£ ¤_¥¬«[ §¨
The scattering amplitude is then directly related to the differential cross section by the
simple expression
97

®M¯®_°x±M²T³V´¶µ]·¹¸ ºQ±M²»³p´¶µ¸ ¼
A variety of more complicated reactions are possible, from transfer of a single
particle between the nuclei, to the complete absorption of the projectile and the formation
of the compound nucleus. The single nucleon transfer reactions are powerful probes of
nuclear structure because detailed analyses are possible in an Optical Model framework.
On the other hand, compound nuclear reactions probe the average statistical properties of
nuclei.
4.2 Practical Application of the Optical Model
In practice, the Phenomenological Optical Model is often used to interpret the
results of direct reactions. In the analysis of data with this technique, a trial potential is
used to make an initial calculation of the cross section, and the parameters of the trial
potential are then adjusted to fit the calculated cross section to the measured data. This
trial potential is then refined and the general properties of the wave functions can be
determined.
It has been found that Optical Model potentials with a Woods-Saxon shape do a
good job of reproducing measured cross sections for a wide range of data. The
Woods-Saxon potential has the form
98

½¿¾MÀ[Á] ÃÄÅ_Æ»ÇÉÈcʶËfÌÎÍÏÌ ÄÑÐÒÎÓuÔÕ Öwhere 0 is the well depth, 0 is the reduced radius, and is the diffuseness. The
Woods-Saxon form has 3 adjustable parameters ( 0, 0, ), thus an Optical potential
containing both real and imaginary Woods-Saxon potentials has 6 free parameters ( , V,
V, , W, W).
Trial potentials can be obtained either from a microscopic calculation [Wo90], or
from a previous experiment involving nearby nuclei at a similar bombarding energy.
Several compilations of phenomenological Optical Model potentials have been published,
including those by Becchetti & Greenlees [Be69] and Perey & Perey [Pe76]. In addition,
global fits have been made to these compilations, parameterizing the behavior of optical
potentials over a range of projectiles, targets, and incident energies. These global
parameter sets allow extrapolation to new energies and targets. Such global optical
potential sets have been formulated for common light projectiles, including protons
[Va91], neutrons [Ra82, Va91], and deuterons [Bo88, Da80]. Note that these global sets
were all formulated using data on heavier targets than those in this work.
For a simple scattering process, the entrance channel is identical to the exit
channel, and only one Optical potential is needed to describe the reaction. During a
transfer reaction, however, the identity of the nuclei are changed by the reaction, and a
second potential is needed to describe the exit channel. For example, analysis of the
d(12C,13N)n reaction requires one optical potential to describe the 12C + d entrance
99

channel, and another potential to describe the 13N + n exit channel. Thus, there are 12 free
parameters in the calculation of the d(12C,13N)n cross section, and a larger uncertainty for
each parameter.
In order to reduce the number of free parameters in the calculation of a transfer
reaction cross section, it is advantageous to measure the elastic scattering of the entrance
channel at the same center-of-mass energy. In this way, an Optical potential can be fit to
the elastic scattering data, and that potential can be used as the entrance channel potential
in the calculation of the transfer reaction, reducing the number of free parameters in the
transfer reaction calculation. In the same way, the elastic scattering of the reverse
reaction (exit channel) could be measured, fixing all of the parameters of the transfer
reaction calculation.
In this work, we have measured the reaction cross sections of both d(12C,13N)n and
d(7Be,8B)n, and the scattering cross sections of d(12C,12C)d and d(7Be,7Be)d. Though the
experiment was not designed specifically to measure the scattering cross sections, the
scattering products were detected in the forward telescopes, and the scattering cross
sections could be extracted over a certain angular range. Measurement of the neutron exit
channels would be helpful for calculations of the transfer reaction cross section, but such
measurements would be rather difficult, and were beyond the scope of the experiment.
Our goal is to use the measurements of the d(12C,12C)d and d(7Be,7Be)d scattering cross
sections to determine Optical potentials for the entrance channels of the d(12C,13N)n and
d(7Be,8B)n reactions. Then, the transfer reaction cross section can be calculated, and the
exit channel Optical potentials can be fitted.
100
There were no data for our reaction systems at comparable energies in the
literature. A large number of calculations were performed using a variety of Optical
Model potentials for similar reactions at similar energies and with potentials obtained
from global analyses. These Finite-Range Distorted-Wave Born Approximation
(DWBA) calculations were performed using the code FRESCO [Th88]. Table 4.1 and
Table 4.2 list the parameters of the Optical Potentials used in the remainder of this work
for the analysis of d(12C,13N)n and d(7Be,8B)n, respectively. Sample input for the code
can be found in Appendix B.
101

Table 4.1 Optical Model Potential parameters used for the calculations of d(12C,12C)d and d(12C,13N)n described in this chapter.
1.30.571.12110.481.269.190.661.3144.813N + n[Sc84]sche1.30.930.8950.791.526.110.930.8911812C + d[Sc84]sche
0.630.835.90.691.155.530.691.1514.20.691.1542.5213N + n[Va91]CH890.630.825.90.691.155.060.691.1515.50.691.1542.3912C + d[Va91]CH890.751.016.20.591.2900.591.310.20.661.242.8113N + n[Ra82]rap0.870.8760.821.2710.20.821.2700.721.1875.0812C + d[Bo88]bojo
1.30.661.075.870.671.3111.20.671.312.110.771.1778.5312C + d[Da80]daeh
rCasorsoVsoaWsurfrWsurfWsurfaWvolrWvolWvolaVrVVNucleiReferenceName
Table 4.2 Optical Model Potential parameters used for the calculations of d(7Be,7Be)d and d(7Be,8B)n described in this chapter.
1.250.561.11.250.61.63.470.621.0249.418B + n[Ol90]olss1.970.654.281.820.561.4315.90.811.0437.447Be + dnunC1.750.573.811.620.70.7724.40.851.5642.277Be + dnun51.880.423.712.050.881.9631.637Be + dnun31.970.413.861.510.541.3813.20.971.2451.737Be + dnun11.30.630.745.90.691.126.740.691.1213.090.691.1443.868B + n[Va91]CH891.30.630.715.90.691.113.440.691.1113.020.691.1338.647Be + d[Va91]CH891.30.771.136.20.661.4311.330.721.1348.198B + n[Li96]liu11.30.811.6470.761.3116.340.291.6414.840.861.02138.747Be + d[Li96]liu11.30.751.016.20.591.290.530.591.2911.360.661.244.318B + n[Ra82]rap1.30.850.8560.811.279.340.811.270.630.71.1872.367Be + d[Bo88]bojo1.30.661.075.610.651.3110.570.651.312.970.781.1775.757Be + d[Da80]daehrCasorsoVsoaWsurfrWsurfWsurfaWvolrWvolWvolaVrVVNucleiReferenceName
102

4.3 Survey of Published Optical Potential Parameters
In order test the applicability of previous work on the present data, calculations
were made using a variety of Optical potentials found in the literature. Calculations were
performed for both scattering and transfer reactions. Additional calculations of the
scattering processes will be discussed in Section 4.7, and additional calculations of the
transfer reactions will be discussed in Section 4.8. The literature potential parameters
used are tabulated in Table 4.1 and Table 4.2 for d(12C,13N)n and d(7Be,8B)n, respectively.
Figure 4.1 shows the measured cross sections of the d(12C,12C)d quasi-elastic
scattering and the d(12C,13N)n transfer reaction (The sum of elastic and inelastic scattering
is referred to as scattering, a term which will be used in the remainder of this
document). Also shown are the results of several DWBA calculations using published
optical potentials. For the 12C + d entrance channel potentials, the blue curves use the
global deuteron potentials described by Bojowald et al. [Bo88], while the red curves use
the global deuteron potential described by Daehnick et al. For the 13N + n exit channel
potentials, the solid lines use the global neutron potential described by Rapaport [Ra82],
while the dashed lines use the global neutron potential [Va91]. Also shown is a
calculation using entrance and exit channel potentials from a previous measurement of
d(12C,13N)n by Schelin et al. [Sc84]. This measurement was made at 13 MeV, so it is not
expected that potentials determined for such a low energy will reproduce the present data.
103

Each of these calculations uses a Woods-Saxon potential to bind the 13N, the
parameters of which are tabulated in Table 4.3. A Gaussian potential is used to bind the
deuteron, the parameters of this potential are given in Table 4.4.
The overall agreement between calculation and measurement seems good, but not
excellent. The curves do not follow the quasi-elastic scattering data, having deeper
minima. The calculations also overestimate the transfer reaction cross section.
Figure 4.2 shows the measured cross sections of the d(7Be,7Be)d scattering to the
ground and first excited states of 7Be, and the d(7Be,8B)n transfer reaction. Also shown
are the results of several DWBA calculations using several published optical potentials.
For the 7Be + d entrance channel potentials, the blue curves use the global deuteron
potentials described by Bojowald et al. [Bo88], while the red curves use the global
deuteron potential described by Daehnick et al. For the 8B + n exit channel potentials, the
solid lines use the global neutron potential described by Rapaport [Ra82], while the
dashed lines use the CH89 global neutron potential [va91]. Also shown is a calculation
using entrance and exit channel potentials from a previous measurement of d(7Be,8B)n by
Liu et al. [Li96] The measurement of d(7Be,8B)n by Liu et al. was made at 7.4 MeV, so
the potentials are not expected to reproduce the present data, but are included for
completeness.
Each of these calculations uses the Woods-Saxon potential calculated by
Tombrello [To65] to bind the 8B, the parameters of which are tabulated in Table 4.3. A
Gaussian potential is used to bind the deuteron, the parameters of this potential are given
104

in Table 4.4. The input file for the calculation using the Daehnick entrance channel and
Rapaport exit channel parameters is given in Appendix B.
As shown in Figure 4.1 and Figure 4.2, none of the potentials derived from
previous work give an adequate description of the measured cross sections. Thus, it is
necessary to use these potentials as a starting point, and determine if the calculations can
describe the measurements with adjusted parameters.
105

Table 4.3 Parameters of the Woods-Saxon potentials used to bind the products of the(d,n) reactions.
0.651.25508Bstnd8.240.521.4832.12[Ki87]8Bkim
0.521.5432.62[To65]8Btomb0.521.5432.62[To65]13Ntomb
VSOarVReferenceNucleusName
Table 4.4 Parameters of the Gaussian potential used to bind the deuteron in theDWBA calculations. The potential has the functional form used in the Fresco code:
1 exp 2 1/3
3
2
11.48072.15AP3P2P1
106

σΩ
Figure 4.1 DWBA calculations of the d(12C,12C)d quasi-elastic and d(12C,13N)n transferreactions at 21 MeV/u. Each line represents a different combination of entrance and exitchannel parameters from the literature.
107

σΩ
Figure 4.2 DWBA calculations of the d(7Be,7Be)d quasi-elastic and d(7Be,8B)n transferreactions at 25 MeV/u. Each line represents a different combination of entrance and exitchannel parameters from the literature.
108

4.4 Variation of Optical Potential Parameters
In order to try to reproduce the experimentally measured cross section in the
DWBA framework, the parameters of the optical potential were adjusted to the data. In
order to understand the effect each parameter has on the shape of the calculated DWBA
cross section, the parameters were explored individually. The results of these calculations
are shown in Figure 4.3 for the d(12C,12C)d scattering and in Figure 4.4 for the d(7Be,7Be)d
scattering to the ground and first excited states of 7Be. The solid line represents the
calculation using the global deuteron optical potentials of Daehnick et al, and in each
panel the dashed and dotted lines show the effect of varying one parameter of either the
real or imaginary potential.
The results of this search indicated that the observed data cannot be adequately
described by simply changing the values of the parameters in the potentials. This
realization led to an exploration of the effects of projectile (heavy nucleus) excitation and
deuteron breakup on the present data.
109

σΩ
Figure 4.3 DWBA calculations of the quasi-elastic scattering of 12C from deuterium at21 MeV/u. The solid line in each panel represents the calculation made using the globaldeuteron parameters of Daehnick et al. [Da80]. In each panel, one of the parameters ofthe real or imaginary potentials is varied.
110

σΩ
Figure 4.4 DWBA calculations of the elastic and inelastic scattering of 7Be fromdeuterium at 25 MeV/u. The solid line in each panel represents the calculation madeusing the global deuteron parameters of Daehnick et al. [Da80]. In each panel, one of theparameters of the real or imaginary potentials is varied
111

4.5 Estimate of the Contribution of Projectile Excitation
Because of the limited energy resolution of the measurement of the heavy
fragment, the observed scattering cross sections contain contributions from both elastic
and inelastic scattering. In order to estimate the relative contribution of the inelastic
processes, DWBA calculations were performed using the FRESCO code [Th88].
Figure 4.5 shows the results of the DWBA calculation of the d(12C,12C)d scattering
to both the ground and first excited states of 12C. The calculation uses the global deuteron
Optical potential as described by Daehnick et al. [Da80]. The 2+ state of 12C is populated
via Coulomb excitation, the calculation uses a deformation length of 1.648 fm ( 0.58),
a deformation which has been shown to be valid for this state [Kh95]. The calculation
shows that at small angles, the elastic scattering is dominant, but near 20 inelastic
scattering to the 2+ state becomes important. At these angles, the measurement of
d(12C,12C)d is likely to contain a significant contribution from both the ground and first
excited state of 12C. Any fitting of Optical potentials will have to include the
contributions from scattering to this 2+ state.
Figure 4.6 shows a similar calculation for the d(7Be,7Be)d scattering. The global
deuteron Optical potential described by Daehnick et al. [Da80] was again used. The
DWBA calculation uses the 7Be deformation 0.566, a deformation calculated in
[Do97]. Similar DWBA calculations have also been performed with = 0.383, a value
calculated in [Va97], which decreases the cross section to the 7Be first excited state. Both
calculations show that scattering to the excited state of 7Be is likely to be a small
112

contribution to the measured cross section. In the fitting of Optical parameters,
contributions from scattering to this state can be ignored. Thus, in order to understand the
discrepancy between measured and calculated cross sections, the contribution from
excitation of the deuterium target must be examined.
113

σΩ
Figure 4.5 DWBA calculations of the scattering of 12C from deuterium at 21 MeV/u.Calculations are shown for both the ground and first excited states of 12C. The sum ofthese two processes is the solid line, referred to as the quasi-elastic scattering.
σΩ
Figure 4.6 DWBA calculations of the scattering of 7Be from deuterium at 25 MeV/u.Calculations are shown for both the ground and excited states of 7Be.
114

4.6 Estimate of the Contribution of Target Excitation
In addition to internal excitation of the scattered particle, the deuterium target can
also be excited in the scattering process. However, the deuteron does not have any bound
excited states and will be broken up in the excitation process. Such target excitations are
a complication of the inverse kinematics measurement that was not present in traditional
forward kinematics studies. In a forward kinematics experiment, if the deuteron is
detected, then it was not excited. In inverse kinematics the deuteron is not measured, and
only with a precise measurement of the energy of the scattered particle can its excitation
be detected. With the limited energy resolution of the current study, these events could
not be isolated from the elastic scattering events. We will rely on a calculation to estimate
the contribution of deuteron excitation to the measured cross sections.
A calculation of the scattering cross section of 7Be + d leading to continuum states
of the deuteron has been performed by F. Nunes [Nu98]. The results of these calculations
are shown in Figure 4.7, along with the measured d(7Be,7Be)d scattering cross section.
The calculation shows that deuteron excitation events are likely to be a significant part of
the measured cross section, particularly at angles >15 . In the fitting of Optical
parameters, contributions from scattering events that excite the deuteron target cannot be
ignored. In order to resolve the elastic data, the calculated deuteron excitation cross
section should be subtracted from the measured cross section, leaving the purely elastic
cross section.
115

A measurement of the deuteron excitation cross section has also been extracted
from the data. Neutrons in coincidence with 7Be events in the Bottom Fragment Detector
were observed in Neutron Detectors 14, 15, and 16. A Monte Carlo simulation of the 7Be
inelastic scattering and subsequent deuteron breakup was performed, and the energies of
the observed neutrons were found to be consistent with an average deuteron excitation
energy of ~5.5 MeV, which agrees very well with the calculation of deuteron excitation
discussed above. The simulation also calculated the geometric acceptance of the neutron
detectors for the deuteron breakup, and the average cross section for deuteron excitation
was determined over the angular coverage of the Bottom Fragment Detector (11 24
CM). The observed cross section for this angular range is plotted in Figure 4.7. Note that
the large uncertainty in the angle of this measurement reflects the angular range over
which the measurement is averaged. While the measured cross section is significantly
lower than the calculation, it suggests that deuteron excitation is still likely to be a
significant contribution to the measured cross section, particularly at large angles.
116

σω
Figure 4.7 The scattering cross section of 7Be from deuterium leaving the deuteron in anunbound excited state. The solid line represents a calculation of this cross section, theopen circle is the observed cross section. The dashed line shows the result of scaling thecalculation to match the measurement. Note that the large uncertainty in the angle of thedeuteron breakup measurement represents the angular range over which the measurementis averaged. The solid data points are the measured scattering cross section, shown forcomparison. Because of the limited energy resolution, deuteron excitation events willcontribute to the measured scattering cross section.
117

4.7 Fitting of Optical Potentials to the Scattering Data
In order to obtain Optical Potentials that reproduce the measured cross sections,
the parameters were adjusted to fit the data. This was performed using the code CUPID
[Co78]. There were no restrictions on the Optical parameters in these fits. Fits to the 7Be
+ d scattering data have been made with and without corrections for deuteron excitation.
In Figure 4.9, the measured cross section (without correction for deuteron
excitation) is shown, along with three potentials that have been fit to the data. The
parameters of these potentials ( ) are tabulated in Table 4.2. The
calculations using these potentials reproduce the measured cross section rather well, but
the data cannot distinguish between these three very different Optical Potentials.
Measurement of the cross section at larger angles would have reduced these ambiguities.
Figure 4.10 shows the scattering data that has been corrected for the effect of
deuteron excitation. The correction was made by subtracting the calculated cross section
for deuteron excitation (Figure 4.7) from the measured d(7Be,7Be)d scattering cross
section (Figure 3.32). An Optical potential was fitted to this corrected data (which should
be purely elastic), and the resulting DWBA cross section is shown. The parameters of the
fitted Optical potential ( ) are given in Table 4.2.
Fits to the 12C + d quasi-elastic data have not been performed. As discussed in
Section 4.5 and Section 4.6, the contributions of both projectile and target excitations are
expected to contribute significantly to the measured cross section. Fitting of Optical
potentials to this data is likely to lead to large uncertainties in the parameters.
118

σΩ
Figure 4.9 Measured d(7Be,7Be)d scattering cross section and DWBA calculations of theelastic scattering using 3 potentials which were fit to the measurement. The parameters ofthese potentials are given in Table 4.2.
119

σΩ
Figure 4.10 Scattering cross section of d(7Be,7Be)d which has been corrected for theeffect of deuteron excitation. The points represent the calculated deuteron excitationcross section (Figure 4.7) subtracted from the measured scattering cross section (Figure3.32). The curve is a DWBA calculation using a potential which has been fitted to thecorrected data. The data point at the largest center-of-mass angle has been discarded.The parameters of the potential are given in Table 4.2.
120

4.8 Optical Model Calculations of the Transfer Reaction
In Figure 4.1 and Figure 4.2, the results of DWBA calculations for the scattering
and transfer reactions using several potentials from the literature were presented. The
agreement between these calculations and the data was unsatisfactory, and led us to adjust
the potentials to fit the scattering data. Potentials were fit to the observed scattering data,
and also to the data corrected for deuteron excitation. These scattering potentials can now
be used as entrance channel potentials for the d(7Be,8B)n transfer reaction calculations,
and exit channel potentials can be explored.
Figure 4.11 shows the DWBA calculations using the potential for the
entrance channel, and several different literature potentials for the exit channel. The
potential was fit to the measured d(7Be,7Be)d scattering cross section, without corrections
for deuteron excitation. The calculations overestimate the reaction cross section, and
none of the exit channel potentials reproduce the shape of the angular distribution. The
Spectroscopic Factor Slj can be extracted from the comparison of the experimental and
calculated cross sections. Slj is given by
0 0
where ex( 0) and DWBA( 0) are the experimental and calculated cross sections near zero
degrees. Figure 4.11 includes the extracted value of Slj for each calculation, and the effect
of multiplying the measured cross section is shown in the lower panel of the figure.
Figure 4.12 shows the results of DWBA calculations using the potential for
the entrance channel, and several literature potentials for the exit channel. The
121

potential was fit to the d(7Be,7Be)d cross section which was corrected by subtracting the
calculated deuteron excitation cross section. Again, the calculations overestimate the
reaction cross section and fail to reproduce the shape of the angular distribution. Also
shown is the result of multiplying the calculated cross section by the indicated
Spectroscopic Factors, Slj.
122

σΩ
Figure 4.11 DWBA calculations of the d(7Be,8B)n transfer reaction. The entrancechannel potential is , which was fit to the measured scattering data, and the exitchannel potentials were taken from the literature. These potentials are described in Table4.2. For all calculations the potential was used to bind the 8B, which is described inTable 4.3. In the upper panel, the raw results are shown. The lower panel shows theresults of the calculation multiplied by the given Spectroscopic Factor Slj.
123

σΩ
Figure 4.12 DWBA calculations of the d(7Be,8B)n transfer reaction with corrections fordeuteron excitation. The entrance channel potential is , which was fit to thescattering data corrected by the calculated deuteron excitation cross section. The exitchannel potentials were taken from the literature. These potentials are described in Table4.2. For all calculations the potential was used to bind the 8B, which is described inTable 4.3. In the upper panel, the raw results are shown. The lower panel shows theresults of the calculation multiplied by the given Spectroscopic Factor Slj.
124

Figure 4.13 explores the sensitivity of the measured d(7Be,8B)n data to the
potential used to bind the 8B in the DWBA calculation. The figure shows several DWBA
calculations using the entrance and exit channel potentials. In each
calculation, a different potential is used to bind the 8B product. The parameters of the
binding potentials are listed in Table 4.3. Though none of the calculations reproduce the
experimental cross section, it can be seen that the calculation has very little sensitivity to
the binding potential used. In order to discriminate between these binding potentials, very
precise data at small angles is needed. It can also be seen that the choice of binding
potential has little effect on the value of the Spectroscopic Factor Slj.
Following the method described by Xu et al., the d(7Be,8B)n transfer reaction can
be used to calculate the S17(0) factor for the 7Be(p, )8B reaction [Xu94]. This method
uses the Asymptotic Normalization Coefficient Clj to calculate S17(0). Clj is given by
1/2
where Slj is the Spectroscopic Factor, and lj is the normalization coefficient of the
asymptotic part of the 8B wave function, which is determined by the 8B binding potential.
The astrophysical factor S17(0) is has been shown by Barker to be almost directly
proportional to Clj2, such that Clj
2/S17(0) 0.026 [Ba80]. The value of S17(0) has been
extracted for each of the calculations shown in Figures 4.11 and 4.12, the results are given
in Table 4.5. The values of S17(0) determined from this work are much lower than the
currently accepted value S17(0) = 19 eV b [IN97].42
A partial wave analysis of the calculated cross section illustrates the reason for the
lack of sensitivity of the current work to the value of S17(0). Figure 4.14 shows the
125

contribution of various values of the orbital angular momentum to the total calculated
cross section. The solid line represents the contribution of all partial waves to the cross
section. The other lines show the effect on the cross section of removing the partial
waves inside of a certain radius, for example the dashed line includes contributions to the
total cross section at radii greater than 1 fm. It can be seen from this figure that
contributions to the cross section from radii greater than 2 fm are very small. At 25
MeV/u, the transfer reaction probes very deeply into the nucleus, and the contribution
from transfer reactions at the nuclear surface is small. Because the determination of
S17(0) from the d(7Be,8B)n reaction relies on a peripheral reaction sampling the tail of the
wave function [Xu94], this measurement is not a sensitive probe of the value of S17(0).
126

σΩ
Figure 4.13 Exploration of the effect of different 8B binding potentials on the calculatedcross section. In each calculation, a different potential has been used to bind the 8Bproduct. The parameters of these 8B binding potentials are given in Table 4.3. For allcalculations, the entrance and exit channel potentials were used. A veryprecise measurement of the transfer reaction cross section extending to very small angleswould be required to pick from among these different binding potentials.
127
Table 4.5 Calculation of S17(0) from the d(7Be,8B)n transfer reaction. A separate value ofS17(0) is extracted for each of the calculations in Figures 4.11 and 4.12. Those using the
entrance channel potential include corrections for deuteron excitation, those usingthe potential do not.
5.24.66.96.96.610.6S17(0)0.140.120.180.180.170.28Clj
2
0.78380.78380.78380.78380.78380.7838lj
0.220.200.300.300.280.45Slj
nunC/rapnunC/olssnunC/CH89nun1/rapnun1/olssnun1/CH89calculation

Figure 4.14 The contribution to the total d(7Be,8B)n cross section of partial waves withcertain values of orbital angular momentum . The points are joined with lines. Thesolid line shows the contribution to the cross section for all values of the radius. Thedashed line shows the contribution to the cross section from radii greater than 1 fm. Thefigure shows that nearly all of the transfer reaction cross section comes from interactionsat radii less than 2 fm.
128

Chapter 5
Conclusions
This work was the first of its kind: a coincidence measurement of a transfer
reaction in inverse kinematics using a radioactive beam. As such, its successes and
failures can be helpful in the planning of future experiments. The primary results of this
work are the measurements of two cross sections, the scattering of 7Be from deuterium,
and the transfer reaction d(7Be,8B)n.
5.1 Measurement and Analysis of the Scattering Reaction
The measurement of the d(7Be,7Be)d scattering cross section was limited by the
inability to clearly resolve the inelastic contributions to the measured cross sections.
While the use of silicon telescopes gave an accurate identification of the scattering
products, their limited energy resolution prevented us from resolving inelastic scattering
to excited states of the projectile. In addition, their small angular coverage only allowed
the scattering cross section to be measured over a small range of angles. The use of a
spectrometer (such as the S800 at the NSCL) would avoid these limitations in future
studies.
129

In addition to inelastic contributions from the excitation of 7Be, scattering events
leading to excitation of the deuteron have also been shown to make an important
contribution to the measured scattering cross section. Because deuteron excitation is a
continuum process, a precise measurement of the energy of the scattered particle (such as
with a spectrometer) cannot resolve these events from other inelastic processes above the
2.2 MeV binding energy of the deuteron. In order to quantify the contribution of
deuteron excitation, it is necessary to measure this process. We have shown that this can
be accomplished by measurement of the neutron from deuteron breakup. Alternatively,
the elastic scattering process could be resolved by measuring the recoiling deuteron in
coincidence with the scattered projectile.
The limitations due to inelastic contributions to the measured scattering cross
section, along with the limited angular range of the scattering measurement, have led to
significant uncertainty in the Optical Model analysis of the scattering cross sections.
Several different potentials have been presented that reproduce the scattering cross
section with equal accuracy. This uncertainty in the analysis of the scattering process
contributed to the uncertainty in the analysis of the transfer reaction.
5.2 Measurement and Analysis of the Transfer Reaction
This study of d(7Be,8B)n was the first to make a kinematically-complete
coincidence measurement of the reaction cross section. The coincidence measurement
was quite successful, with very good agreement between the cross section measured using
130

the 8B events and the cross section measured using the neutrons in coincidence with 8B.
We have shown that such a measurement is feasible, it reduces the statistical uncertainty,
and it provides a good check for self-consistency.
The Optical Model analysis of the measured d(7Be,8B)n cross section was limited
by uncertainty of the entrance channel potential, as discussed above, and also by
uncertainty in the exit channel potential. The lack of available data for neutron scattering
from 8B has forced us to use exit channel potentials derived from studies of other nuclei.
Several different exit channel potentials have been shown to predict similar reaction cross
sections.
From the measured d(7Be,8B)n cross section and the DWBA calculations, the
Spectroscopic Factor for this reaction has been determined to be 0.29 0.09. This is in
contrast to the measurement of the Spectroscopic Factor for the mirror reaction
7Li(d,p)8Li (Ed= 12 MeV) which has been shown to be 0.87 [Sc67].
It has been shown by Xu et al. that the cross section of d(7Be,8B)n can be used to
determine the value of the Astrophysical S17(0) Factor [Xu94]. We have demonstrated
that because of the high bombarding energy, our work is not particularly sensitive to the
value of S17(0).
131

BIBLIOGRAPHY
132

Bibliography
[Al95] J. S. Al-Khalili ., Nucl. Phys. A581, 331 (1995).
[Ba80] F. C. Barker, Aust. J. Phys. 33, 177 (1980).
[Ba92] J. N. Bahcall and M. Pinsonneault., Rev. Mod. Phys. 64, 885 (1992).
[Ba95] D. Bazin ., Phys. Rev. Lett. 74, 3569 (1995).
[Be69] F. D. Becchetti, Jr. and G. W. Greenlees, Phys. Rev. 182, 1190 (1969).
[Be93] Yu. A. Berezhnoy and V. Yu. Korda, Nucl. Phys. A556, 453 (1993).
[Bo88] J. Bojowald ., Phys. Rev. C38, 1153 (1988).
[Ce79] R. A. Cecil, B. D. Anderson, and R. Madey, Nucl. Inst. Meth. 161, 439 (1979).
[Co78] J. R. Comfort, Computer Phys. Commun. 16, 35 (1978).
[Da80] W. W. Daehnick ., Phys. Rev. C21, 2253 (1980).
[Do97] A. Doté ., Phys. Rev. C56, 1844 (1997).
[Fe92] Herman Feshbach, (Wiley-Interscience, New York, 1992) pp 455-463.
[Fr81] G. Friedlander, J. W. Kennedy, E. S. Macias, J. M. Miller, (Wiley-Interscience, New York, 1981) p32.
[Fu91] M. Fukuda ., Phys. Lett. B268, 339 (1991).
[Ha92] R. Harkewicz, Ph.D. Thesis, NSCL (1992).
[IN92] INT Workshop on Solar Fusion Cross Sections, Rev. Mod. Phys., to be published October 1998.
[Ke96] J. H. Kelley ., Phys. Rev. Lett. 77, 5020 (1996).
133

[Ki87] K. H. Kim ., Phys. Rev. C35, 363 (1987).
[Li91] W. Z. Liu, Ph.D. Thesis, University of Michigan (1991).
[Li96] W. Liu ., Phys. Rev. Lett. 77, 611 (1996).
[Mi92] T. Minamisono ., Phys. Rev. Lett. 69, 2058 (1992).
[Na94] H. Nakada and T. Otsuka, Phys. Rev. C49, 886 (1994).
[Nu98] F. Nunes, private communication (1998).
[Ol90] N. Olsson ., Nucl. Phys. A509, 161 (1990).
[Or92] N. A. Orr ., Phys. Rev. Lett. 69, 2050 (1992).
[Pe72] C. A. Pearson ., Nucl. Phys. A191, 1 (1972).
[Pe76] C. M. Perey and F. G. Perey, Atom. Data and Nucl. Data Tab. 17, 1 (1976).
[Pe95] I. Pecina ., Phys. Rev. C52, 191 (1995).
[Ra82] J. Rapaport, Phys. Rep. 87, 25 (1982).
[Sc67] J. P. Schiffer ., Phys. Rev. 164, 1274 (1967).
[Sc84] H. R. Schelin ., Nucl. Phys. A414, 67 (1984).
[Sc93] K. W. Scheller, Ph.D. Thesis, Notre Dame (1993).
[Sc95] W. Schwab ., Z. Phys. A350, 283 (1995).
[Sh91] B. M. Sherrill, D. J. Morrissey, J. A. Nolen, Jr. and J. A. Winger, Nucl. Inst. Meth. B56/57, 1106 (1991).
[St95] M. Steiner, Ph.D. Thesis, Michigan State University (1995).
[Sw94] D. Swan, J. Yurkon, D. J. Morrissey, Nucl. Inst. Meth. A348, 314 (1994).
[Ta85] I. Tanihata ., Phys. Rev. Lett. 55, 2676 (1985).
[Ta88] I. Tanihata ., Phys. Lett. B206, 592 (1988).
134

[To65] T. A. Tombrello, Nucl. Phys. 71, 459 (1965).
[Th88] I. J. Thompson, Comp Phys. Rep. 7, 167 (1988).
[Va91] R. L. Varner ., Phys. Rep. 201, 57 (1991).
[Va97] K. Varga ., Nucl. Phys. A616, 383c (1997).
[Wa95] R. E. Warner ., Phys. Rev. C52, R1166 (1995).
[Wo90] Samuel S. M. Wong, (Prentice-Hall, New Jersey, 1990) pp 336-354.
[Xu94] H. M. Xu ., Phys. Rev. Lett. 73, 2027 (1994).
[Za93] M. Zahar ., Phys. Rev. C48, R1484 (1993).
135

APPENDICES
136

Appendix A
Fabrication of Thin Polyethylene Foils
The preparation of thin foils for use as target materials is an important technique
in experimental nuclear physics. Targets must be of uniform thickness, and thin enough to
minimize energy straggling. In some instances targets must have a large area, and in the
case of isotopically enriched targets, must be manufactured with efficient use of
expensive raw materials. A recent effort to produce thin polyethylene targets at the
NSCL was motivated by the desire to use 13C as the target nucleus in reaction studies
using radioactive nuclear beams. Enriched polyethylene (in either 13C or deuterium) is
commercially available from several sources, and the raw material can be fashioned into
target quality films. We describe a technique developed to prepare thin foils of
polyethylene meeting the above criteria.
The first successful method used at the NSCL for fabrication of polyethylene foils
is described in [St95]. This technique used several stages of melting under vacuum to
remove trapped air from the sample, then the sample was clamped between two heated
blocks of steel. The technique was able to produce foils with thickness as small as 40 m
137
( 4 mg/cm2 polyethylene), but the uniformity was difficult to control and a minimum of
24 hours was required to produce a single foil.
Another technique developed previously to produce polyethylene foils is
described in [Li91]. This method involves dissolving the polyethylene in xylene, pouring
onto a glass plate, and heating to drive off the xylene, leaving a film of polyethylene
behind. This technique was reported to produce films down to a thickness of 10 m ( 1
mg/cm2 polyethylene), but attempts at the NSCL failed to produce a target of acceptable
quality.
Our most successful method to date to produce thin foils of polyethylene involves
forming the target using a heated hydraulic press (Carver Model 2112). The raw material
( 200 mg for a 30 m target of 10 cm2 ) is placed between two pieces of highly polished
steel, with brass shim stock used as a spacer between the plates to set the desired target
thickness. The plates are placed in the heated press and compressed under 15,000 lbs of
force at 250 F for three minutes. The heat and high pressure consistently produce foils of
high quality in a very short period of time. Thicknesses as small as 30 m ( 3 mg/cm2
polyethylene) and thickness uniformity of 3% FWHM over an area of 10 cm2 have been
produced.
The choice of raw material is important for target fabrication. Enriched
polyethylene can be purchased in either low or high-density forms. High-density
polyethylene is much more rigid and has a higher melting point (>300 F), which led to
difficulty in constructing quality targets. Enriched polyethylene obtained from ISOTEC,
138

Inc. proved to be very suitable for target fabrication. The fine powder produced foils
without problems caused by air inclusion.
139

Appendix B
Sample Input for the FRESCO Code
This Appendix contains sample input for the FRESCO code [Th88] which was used
to calculate the scattering and transfer reaction cross sections presented in this work.
Figure B1 shows the input used for the calculations of d(12C,12C)d and d(12C,13N)n,
which are shown as the solid red lines in Figure 4.1. This calculation uses the global
deuteron potential described by Daehnick et al. [Da80] for the 12C + d entrance channel,
and the global neutron potential described by Rapaport [Ra82] for the 13N + n exit
channel. These potentials are listed as and , respectively, in Table 4.1. The
potential listed as in Table 4.3 is used to bind the 13N product, while the gaussian
potential used to bind the deuteron is given in Table 4.4.
Figure B2 shows the input used for the calculations of d(7Be,7Be)d and d(7Be,8B)n
which are shown as the solid red lines in Figure 4.2. This calculation uses the global
deuteron potential described by Daehnick et al. [Da80] for the 7Be + d entrance channel,
and the global neutron potential described by Rapaport [Ra82] for the 8B + n exit channel.
These potentials are listed as and , respectively, in Table 4.2. The calculation
140

uses the potential described by Tombrello [To65] to bind the 8B product, which is listed
as b in Table 4.3. The potential used to bind the deuteron is given in Table 4.4.
cat > params.$$ << EOF PARAMETER (MXP=3, MXX=7, MXPEX=10, MLOC=70, MAXIT=10, MSP=15, # MAXN=400, MAXNLN=200, MAXNLO=60, LMAX1=40, MAXNNU=36, # MAXCH=50, MAXB=60, MAXF=150, MFNL=150, MAXQRN=60, # MAXV=1500000, INH = 0, MPAIR=1)EOFcat > data.$$ << EOF12C(d,n)13N-dwba-Finite Range-Ed=42 MeV-daeh,rap params, arbitrary 13N binding0.100 35.00 0.20 0.2000 4.900 +0.20 0. 30. .01 F F0 0.0 90. 1.0 0.00.0 1 1 0 36 00 00 0.05 -4.0 0.01 0 0 0 0 1 1 0 0 0 0DEUT 2.0141 1.0 2 12C 12.0000 6.0 0.00001.0 +1 0.00000 1 0.0 +1 0.000 1 1 2.0 +1 4.439 NEUTRON 1.00866 0.0 1 13N 13.0057 7.0 -0.281 0.5 +1 0.00000 2 0.5 -1 0.000
1 0 0 12.0 0.00 1.30 1 1 0 78.53 1.17 0.77 2.11 1.31 0.67 111 10 1.648 1 2 0 11.2 1.312 0.666 111 10 1.648 1 4 0 5.87 1.07 0.66 2 0 0 13.0 0.00 1.30 2 1 0 42.81 1.2 0.66 10.2 1.3 0.59 2 2 0 0.0 1.295 0.59 2 4 0 6.2 1.01 0.75 3 0 0 1.000 1.25 3 1 2 72.15 0.00 1.4840 4 0 0 12.0 1.25 4 1 0 50.00 1.25 0.65
1 1 2 1 0 1 0 0.5 0.5 3 0 2.225 1 0 0 1 0.000 2 1 2 2 0 1 1 0.5 0.5 4 0 1.944 1 0 0 1 0.000 -2 1 7 0 0 0 1 1 1 1 1.00 2 1 1 2 1.0
0 1 1 1 1 141.63EOF/usr/users/powell/bin/frxp params.$$ < data.$$
Figure B1 Sample input for the FRESCO code which was used to calculate the cross
141

sections of d(12C,12C)d and d(12C,13N)n. This calculation produces the cross sectionsshown as the solid lines in Figure 4.1.
cat > params.$$ << EOF PARAMETER (MXP=3, MXX=7, MXPEX=10, MLOC=70, MAXIT=10, MSP=15, # MAXN=400, MAXNLN=200, MAXNLO=60, LMAX1=40, MAXNNU=36, # MAXCH=50, MAXB=60, MAXF=150, MFNL=150, MAXQRN=60, # MAXV=1500000, INH = 0, MPAIR=1)EOFcat > data.$$ << EOF7Be(d,n)8B-dwba-Finite Range-Ed=50 MeV-daeh,rap params-tombrello 8B binding0.100 35.00 0.20 0.2000 4.900 +0.20 0. 30. .01 F F0 0.0 90. 1.0 0.00.0 1 1 0 36 00 00 0.05 -4.0 0.01 0 0 0 0 1 1 0 0 0 0DEUT 2.0141 1.0 1 7Be 7.0000 4.0 0.00001.0 +1 0.00000 1 1.5 -1 0.000 NEUTRON 1.0086 0.0 1 8B 8.0000 5.0 -2.088 0.5 +1 0.00000 2 2.0 +1 0.000
1 0 0 7.0 0.00 1.3 1 1 0 75.75 1.17 0.78 2.97 1.31 0.65 1 2 0 10.6 1.305 0.654 1 4 0 5.61 1.07 0.66 2 0 0 8.0 0.00 1.3 2 1 0 44.31 1.2 0.66 11.4 1.3 0.59 2 2 0 0.53 1.295 0.59 2 4 0 6.2 1.01 0.75 3 0 0 1.000 1.25 3 1 2 72.15 0.00 1.4840 4 0 0 7.0 1.25 4 1 0 32.62 1.54 0.52
1 1 2 1 0 1 0 0.5 0.5 3 0 2.225 1 0 0 1 0.0000 2 1 2 2 0 1 1 0.5 1.5 4 0 0.137 1 0 0 1 0.000 -2 1 7 0 0 0 1 1 1 1 1.00 2 1 1 2 1.0
0 1 1 1 1 150.0EOF/usr/users/powell/bin/frxp params.$$ < data.$$
Figure B2 Sample input for the FRESCO code which was used to calculate the cross
142

sections of d(7Be,7Be)d and d(7Be,8B)n. This calculation produces the cross sectionsshown as the solid lines in Figure 4.2.
143
