study and evaluation of groundwater quality of malwa
TRANSCRIPT

41
DOI: 10.15415/jce.2015.21003
Journal of Chemistry, Environmental Sciences
and its Applications Vol. 2, No. 1
September 2015 pp. 41–58
Study and Evaluation of Groundwater Quality of Malwa Region, Punjab (North India)
Jyoti ShAh1, RAJEEV ShARmA2* ANd iNdu ShARmA3
1 Environmental Science Research Laboratory, multani mal modi College, Patiala-147001
2* PG department of Chemistry, multani mal modi College, Patiala-147001
3 department of Biotechnology, mm university, mullana, Ambala
*Email: [email protected]
Received: July 10, 2015| Revised: September 9, 2015| Accepted: September 17, 2015
Published online: September 30, 2015 the Author(s) 2015. this article is published with open access at www.chitkara.edu.in/publications
1. INTRODUCTION
Water is the most valuable, basic human need, prime natural resource and a precious asset. Water is indeed required in all aspect of life and health for domestic purposes, drinking, cooking, bathing, washing clothes, utensils, producing food, agricultural activity, energy generation, maintenance of environment and development for life. Water plays important role in several metabolic, physiological and other activities in human body as well as in other living beings (mittal and Arora, 2014).
Groundwater is the major source of drinking water in both urban and rural areas and is used for agriculture, irrigation and industrial purposes. Anthropogenic activities i.e. human activities that involve urbanization, industrialization, agricultural development, over use of fertilizers, pesticides, inadequate management of land use and improper sewage disposal have directly or indirectly affected the quality of ground water and make it unfit for domestic purposes. increasing population and necessities have led to the deterioration of Ground water (Pranavam, 2011). the major undesirable substances found in water include tdS, tSS, tS, chloride, calcium, magnesium, viruses, bacteria and heavy metals etc. these contaminants are the major concern throughout the world (Sarkar et al., 2011). the accumulation of heavy metals in water and soil is of increasing concern due to the safety issues of drinking water and food which imposing potential health risks and is unfavorable for the ecosystem (Pillai et al., 2000). the most commonly reported heavy metal contaminants
Shah, J.Sharma, R.Sharma, i.
42
are arsenic, cadmium, chromium, lead, nickel etc. (Jayabaratha et al., 2009). Water is polluted on all over the earth and malwa region in Punjab (North india) is no exception to this phenomenon. hence, it is necessary to study the physico-chemical properties of ground water to evaluate the quality of water in order to asses its suitability for various uses and to evolve the policies for the best use of water resources. According to World health organization safe drinking water could prevent 1.4 million child deaths.
malwa region of Punjab is facing problems related to deteriorating health of people due to unavailability of clean and safe drinking water. the malwa belt of Punjab records very high incidence of cancer cases (107 cancer cases/lakh populations in comparison to national average of 80cases/lakh population). the top three districts of malwa region e.g. muktsar, mansa and Bathinda have the highest number of cancer cases. the region also recorded high incidence of other health issues, involving neurological and cardio vascular disorders. Studies of this region have also highlighted a sharp increase in many other pesticide-related diseases, such as mental retardation and reproductive disorders. the most affected individuals are the agricultural workers who are directly exposed to pesticides. the malwa region of Punjab, india, is less than 15% of the total area of Punjab (only 0.5% of the total geographical area of india), but it consumes nearly 75% of the total pesticides used in Punjab. the high use of pesticides, along with environmental and social factors, is responsible for the high concentration of pesticide residues in the food chain of this region. however, the great majority of exposure occurs through naturally contaminated groundwater that is used for drinking purposes, food preparation and to irrigate food crops, particularly rice. hence it is necessary to conduct the research on alleviation measures of water pollution. With this objective present work is planned to assess the quality of ground water in malwa region, Punjab (North india) from 15 different locations. Ground water was analyzed for its physical and chemical parameters and the results are compared with the standards given by indian Standards and Who, determined the extent of pollution in malwa region of Punjab.
1.1 Study Area (Malwa region, Punjab)
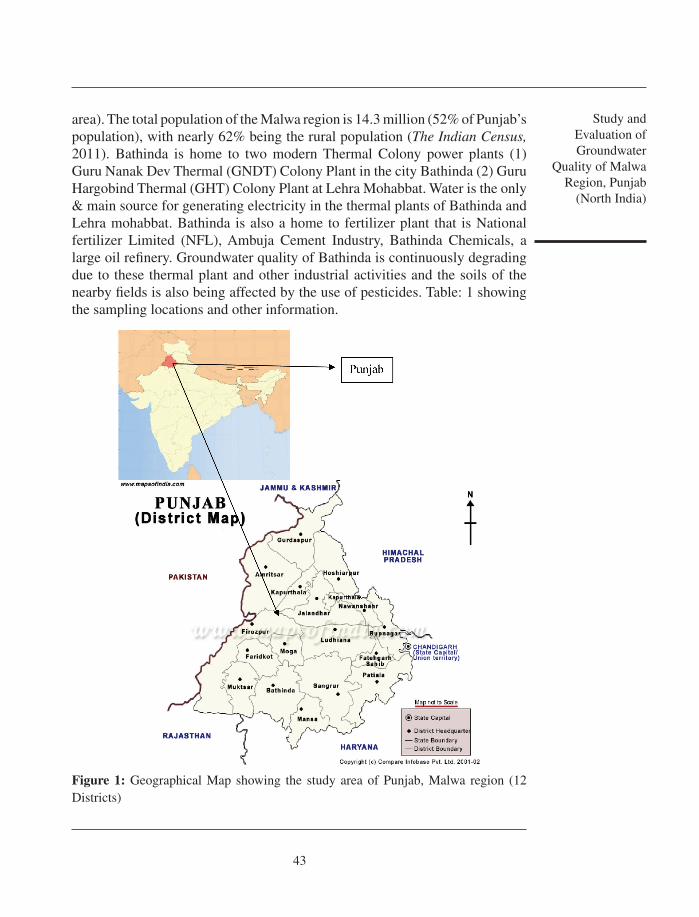
the malwa region is the largest part of the three main divisions (the other two being majha and doaba) of the present Punjab state of india. the malwa region geographically lies between 29°-30’ and 31°-10’ North latitudes and 73°-50’ and 76°-50’ East longitudes. Figure 1 showing that malwa region includes 12 districts of the districts of Fazilka, Bathinda, mansa, moga, Faridkot, Patiala, Sangrur, Barnala, Ferozepur, muktsar, Ludhiana and Navan Shehar (Shaheed Bhagat Singh, Nagar), that comprise an area of 32,808 km2 (65.1% of Punjab’s
Study and Evaluation of Groundwater
Quality of malwa Region, Punjab
(North india)
43
area). the total population of the malwa region is 14.3 million (52% of Punjab’s population), with nearly 62% being the rural population (The Indian Census, 2011). Bathinda is home to two modern thermal Colony power plants (1) Guru Nanak dev thermal (GNdt) Colony Plant in the city Bathinda (2) Guru hargobind thermal (Ght) Colony Plant at Lehra mohabbat. Water is the only & main source for generating electricity in the thermal plants of Bathinda and Lehra mohabbat. Bathinda is also a home to fertilizer plant that is National fertilizer Limited (NFL), Ambuja Cement industry, Bathinda Chemicals, a large oil refinery. Groundwater quality of Bathinda is continuously degrading due to these thermal plant and other industrial activities and the soils of the nearby fields is also being affected by the use of pesticides. table: 1 showing the sampling locations and other information.
Figure 1: Geographical map showing the study area of Punjab, malwa region (12 districts)

Shah, J.Sharma, R.Sharma, i.
44
Table 1: Showing the sampling locations, source and depth
S. No
Location Source Depth Type of water
1 Guru Nanak dev thermal Colony, Bathinda
hand Pump 100 Ground water
2 National Fertilizer Limited (NFL), Bathinda
hand pump 80 Ground water
3 Ambuja Cement Factory, Colony, Bathinda
hand pump 60 Ground water
4 GhtP Colony, Lehra mohabbat tube Well (Field)
150 Ground water
5 Sangrur (Bus stand) hand pump 100 Ground water
6 mohali (Bus stand) hand pump 100 Ground water
7 Barnala (Guru Nanak Nagar) hand pump 150 Ground water
8 Patiala (Sabji mandi) hand pump 100 Ground water
9 moga (Civil lines) hand pump (Field)
95 Ground water
10 mansa (Arvind Nagar) Submersible 200 Ground water
11 Ludhiana (dugri) tube Well (Field)
80 Ground water
12 Ferozpur (Railway Colony) hand Pump 130 Ground water
13 Saheed Bhagat Singh Nagar (SBS) (Vikas Nagar)
hand pump 90 Ground water
14 Roopnagar/Roper (Railway Station) hand pump 100 Ground water
15 muktsar (Field near Adesh Nagar) hand Pump (Field)
- Ground water
2. MATERIAL AND METHODS
Groundwater samples were collected from fifteen different locations of malwa region, Punjab in the month of may and June, 2015. Borosilicate glassware, distilled water and E-merk reagents were used throughout the experiment. Samples were collected in pre sterilized screw-capped polyethylene bottles

Study and Evaluation of Groundwater
Quality of malwa Region, Punjab
(North india)
45
of two liter capacity, were properly labeled, record was prepared (table1) and analyzed in laboratory for their physico-chemical parameters. if immediate analysis is not possible store the samples at 4ºC till further analysis. Parameters analyzed by standard methods (APhA, AWWA, WEF, 1998, APhA, AWWA, WEF, 1995, APhA 1992). Various physico-chemical parameters and techniques for their analysis are given in the table 2.
Table 2: table showing the parameters analyzed and methods used
Parameters Methods
odor Physiological Sense
temperature ◦C thermometer
Ph ph metry
turbidity (Ntu) turbidity meter
EC (μ mhos/cm Conductometry
tdS (mg/l) Standard methods by APhA, AWWA, WEF, 1998
tSS (mg/l) Standard methods by APhA, AWWA, WEF, 1998
tS (mg/l) Standard methods by APhA, AWWA, WEF, 1998; iS, 2003
do(mg/l) iodometric method (Winkler-Azide method)
Bod(mg/l) iodide Azide method
Cod(mg/l) Potassium dichromate Reflux method
Cl (mg/l) Silver nitrate method
Ca (mg/l EdtA titration
Arsenic iCPE (inductively Coupled Plasma Atomic Emission Spectrometer)
Cadmium iCPE (inductively Coupled Plasma Atomic Emission Spectrometer)
Chromium iCPE (inductively Coupled Plasma Atomic Emission Spectrometer)
Nickel iCPE (inductively Coupled Plasma Atomic Emission Spectrometer)
Lead iCPE (inductively Coupled Plasma Atomic Emission Spectrometer)
3. RESULTS AND DISCUSSION
the Ground water had no color, odor and turbidity. Physical parameters analyzed were ph, temperature, turbidity, conductivity and tdS, tSS and tS. Chemical characteristics analyzed such as odor do, Bod, Cod, chlorides, calcium, and heavy metals such as arsenic, cadmium, chromium, nickel, and lead etc. table 3 showing the guidelines for drinking quality recommendations, Who and BiS (1998) standards, iS :10500, 1991

Shah, J.Sharma, R.Sharma, i.
46
Table 3: table showing the guidelines for drinking water
Parameters WHO standard Indian Standard EPA guidelines
Color - 5- 10 (min-max) hazen units -
odor unobjectionable unobjectionable -
temperature - - -
Ph 6.5 – 8.5 6.5-8.5 (min), 6.5- 9.5 (max)
6.5 – 9.5
turbidity 5-10 Ntu (min-max)
Electrical conductivity 300 us/cm 300 us/cm 2500 us/cm
total dissolved Solids 500-1000 (min-max)
500-1000 (min-max)
-
total Suspended Solids 50 mg/l 50 mg/l -
total Solids - - -
dissolved oxygen - 30 mg/l -
Biological oxygen demand 5 mg/l 5 mg/l 5 mg/l
Chemical oxygen demand 10 mg/l 10 mg/l 40
Chlorides 200 mg/l(min)-600mg/l
(max)
250 mg/l (min)-1000 mg/l (max)
250 mg/l
Calcium - 75 mg/l (min)-200 mg/l (max)
-
Arsenic 0.01 mg/l 0.05 mg/l
Cadmium - 0.01 mg/l -
Chromium - 0.05 mg/l -
Nickel - 0.02 mg/l -
Lead - 0.05 mg/l -
4. PHYSICAL PARAMETERS
pH: ph is the hydrogen ion activity and a measure of acidity and alkalinity in aquatic bodies. the desirable ph range necessary for drinking water is from 6.5-8.5. All the samples have value higher than 7. the ph value of water samples in the study area ranged from minimum of 7.40 ± 0.17 (Ambuja cement factory) to maximum of 8.45 ± 0.44 (muktsar). on an average all the samples have ph values within the desirable limit as prescribed for drinking water standard (BiS, 1998). this shows that that ph of water samples was

Study and Evaluation of Groundwater
Quality of malwa Region, Punjab
(North india)
47
Tabl
e 4:
tab
le s
how
ing
the
aver
age
resu
lts o
f Ph
ysic
al P
aram
eter
s of
gro
und
wat
er a
nd c
ompa
riso
n w
ith d
rink
ing
wat
er s
tand
ards
B
iS (
1998
).
Par
amet
ers
GN
DT
, C
olon
yBat
hind
aN
FL
, B
athi
nda
Am
buja
C
emen
t F
acto
ry
GH
TP
P,
Col
ony,
L
ehra
M
ohab
bat
Sang
rur
Des
irab
le li
mit
(I
S st
anda
rd)
Max
. P
erm
issi
ble
Lim
it (
IS
Stan
dard
)
odo
ro
dorl
ess
odo
rles
so
dorl
ess
odo
rles
so
dorl
ess
uno
bjec
tiona
ble
uno
bjec
tiona
ble
ph7.
85±
0.3
7 7.
73±
0.1
2 7.
40±
0.1
7 8.
03±
0.1
5 8.
37±
0.5
5 6.
5-8.
56.
5-9.
5
tem
pºC
26.1
3± 0
.15
26.7
3± 0
.64
26.4
3± 0
.49
25.6
8± 1
.11
27.0
3± 0
.95
--
tur
bidi
ty
(Nt
u)
0.70
± 0
.44
1.20
± 0
.26
1.43
± 0
.21
0.90
± 0
.10
1.13
± 0
.15
5 N
tu
10 N
tu
EC
(µS
/cm
)11
03.3
3± 5
.77
1762
.67±
2.
52
1480
.00±
1.
00
714.
33±
3.0
6 12
44.0
0±
1.73
300
us/c
m-
td
S32
3.33
± 1
.53
429.
00±
2.0
0 49
0.33
± 2
.08
444.
00±
2.6
5 55
6.67
± 3
.250
0 m
g/l
1000
mg/
l
tSS
41.3
3± 1
.53
67.0
7± 3
.00
58.0
0± 2
.00
46.0
0± 2
.00
57.0
0± 1
.00
50 m
g/l
-
tS
364.
67±
0.5
8 49
6.00
± 5
.00
548.
00±
2.0
049
1.00
± 1
.00
614.
00±
3.0
0 -
-
Res
ults
of
phys
icoc
hem
ical
pro
pert
ies
of s
ampl
es g
iven
in t
he t
able

Shah, J.Sharma, R.Sharma, i.
48
Par
amet
ers
Moh
ali
Bar
nala
Pat
iala
Mog
aM
ansa
P
erm
issi
ble
limit
(B
IS s
tand
ard)
Max
. P
erm
issi
ble
Lim
it (
BIS
St
anda
rd)
odo
ro
dorl
ess
odo
rles
so
dorl
ess
odo
rles
so
dorl
ess
uno
bjec
tiona
ble
uno
bjec
tiona
ble
tem
pºC
27
.48±
0.3
7 28
.43±
0.6
7 26
.42±
0.6
2 27
.42±
0.2
9 27
.23±
0.2
3 -
-
ph7.
80±
0.2
0 8.
07±
0.5
7 7.
65±
0.3
5 7.
70±
0.2
6 7.
67±
0.4
9 6.
5-8.
56.
5-9.
5
tur
bidi
ty (
Nt
u)
1.33
± 0
.49
1.47
± 0
.21
1.40
± 0
.26
1.13
± 0
.32
0.93
± 0
.49
5 N
tu
10 N
tu
EC
(μS
/cm
)83
4.00
± 2
.65
904.
00±
1.0
0 70
4.00
± 3
.61
403.
00±
3.0
0 13
05.0
0±
2.00
30
0 us
/cm
-
td
S58
0.83
± 2
.93
301.
63±
2.0
3 32
2.80
± 1
.71
347.
77±
1.3
7 54
9.40
± 1
.51
500
mg/
l10
00 m
g/l
tSS
60.3
0± 0
.61
44.8
7± 2
.20
52.5
3± 1
.50
65.4
0± 1
.97
63.4
7± 1
.36
50 m
g/l
-
tS
641.
13±
3.2
3 34
6.50
± 0
.50
375.
10±
2.8
2 41
3.07
± 1
.68
612.
80±
1.3
1 -
-
Tabl
e 4
cont
inue
d
Study and Evaluation of Groundwater
Quality of malwa Region, Punjab
(North india)
49
Par
amet
ers
Lud
hian
aF
eroz
pur
SBS
Nag
arR
oop
Nag
arM
ukts
arP
erm
issi
ble
limit
(B
IS s
tand
ard)
Max
. P
erm
issi
ble
Lim
it (
BIS
St
anda
rd)
odo
ro
dorl
ess
odo
rles
so
dorl
ess
odo
rles
so
dorl
ess
uno
bjec
tiona
ble
uno
bjec
tiona
ble
tem
pºC
26
.80±
0.1
7 27
.45±
1.0
3 25
.80±
1.2
1 27
.51±
0.2
9 25
.54±
0.5
5-
-
ph7.
80±
0.2
0 8.
05±
0.4
8 7.
77±
0.2
1 8.
33±
0.4
9 8.
55±
0.4
4 6.
5-8.
56.
5-9.
5
tur
bidi
ty (
Nt
u)
0.67
± 0
.29
1.10
± 0
.36
0.90
± 0
.30
0.87
± 0
.12
0.73
± 0
.25
5 N
tu
10 N
tu
EC
(μS
/cm
)61
2.67
±
2.31
59
3.00
±
3.46
80
3.00
± 2
.00
1005
.00±
2.
65
934.
67±
0.5
8 30
0 us
/cm
-
td
S40
2.70
±
1.47
45
1.20
±
1.93
413.
90±
1.0
146
7.13
± 1
.80
519.
83±
1.6
1 50
0 m
g/l
1000
mg/
l
tSS
54.6
3± 2
.03
59.6
7± 2
.31
46.5
0± 1
.80
72.5
3± 1
.29
66.6
0± 1
.87
50 m
g/l
-
tS
457.
33±
1.
15
510.
87±
4.
23
460.
40±
2.6
9 53
9.63
± 0
.78
586.
47±
0.8
4 -
-
Tabl
e 4
cont
inue
d
Shah, J.Sharma, R.Sharma, i.
50
Tabl
e 5:
Res
ults
of
Che
mic
al p
aram
eter
s fr
om m
alw
a re
gion
, Pun
jab
Par
amet
ers
GN
DT
, C
olon
yBat
hind
aN
FL
, B
athi
nda
Am
buja
C
emen
t F
acto
ry
GH
TP
P,
Col
ony,
L
ehra
M
ohab
bat
Sang
rur
Per
mis
sibl
e lim
it (
BIS
st
anda
rd)
Max
. P
erm
issi
ble
Lim
it (
BIS
St
anda
rd)
odo
ro
dorl
ess
odo
rles
so
dorl
ess
odo
rles
so
dorl
ess
uno
bjec
tiona
ble
uno
bjec
tiona
ble
do
(mg/
l)4.
80±
0.1
0 4.
73±
0.1
2 4.
50±
0.2
6 7.
77±
0.1
5 7.
40±
0.1
03
mg/
l-
Bo
d (
mg/
l)8
106
1210
5 m
g/l
-
Co
d (
mg/
l)17
.43±
0.1
5 19
.80±
1.7
1 14
.53±
0.4
2 23
.37±
0.4
7 21
.60±
0.
6010
mg/
l-
Cl (
mg/
l)12
2.67
± 2
.52
160.
00±
3.
00
118.
33±
3.
5117
5.00
±
3.00
61
.00±
1.
00
250
mg/
l10
00 m
g/l
Ca
(mg/
l44
.00±
2.0
0 50
.67±
1.1
5 89
.03±
1.0
5 87
.38±
1.4
8 61
.33±
1.
53
75 m
g/l
200
mg/
l
Ars
enic
(m
g/l)
0.01
310.
050
0.03
2N
d
0.00
890.
05 m
g/l
No
Rel
axat
ion
Cad
miu
m
(mg/
l)0.
0047
7 0.
0099
0.
002
0.04
5 N
d
0.01
mg/
lN
o R
elax
atio
n
Chr
omiu
m
(mg/
l)N
d
0.07
0 0.
0253
0.
0364
N
d
0.05
mg/
lN
o R
elax
atio
n
Nic
kel
(mg/
l)0.
019
0.01
5 0.
050
0.02
6N
d0.
02 m
g/l
No
Rel
axat
ion
Lea
d (m
g/l)
0.01
3 0.
028
0.01
1 0.
015
0.03
6 0.
05 m
g/l
No
Rel
axat
ion
Study and Evaluation of Groundwater
Quality of malwa Region, Punjab
(North india)
51
Tabl
e 5
cont
inue
d
Par
amet
ers
Moh
ali
Bar
nala
Pat
iala
Mog
aM
ansa
P
erm
issi
ble
limit
(B
IS s
tand
ard)
Max
. P
erm
issi
ble
Lim
it (
BIS
St
anda
rd)
odo
ro
dorl
ess
odo
rles
so
dorl
ess
odo
rles
so
dorl
ess
uno
bjec
tiona
ble
-
do
(m
g/l)
4.51
± 0
.50
3.82
± 0
.75
4.54
± 0
.50
4.63
± 0
.78
9.50
± 1
.32
--
Bo
d (
mg/
l)5.
28.
65.
817
16.6
5 m
g/l
-
Co
d (
mg/
l)13
.50±
0.4
6 32
.50±
0.5
011
.30±
0.6
6 27
.83±
0.7
6 18
.10±
1.3
5 10
mg/
l-
Cl (
mg/
l)19
0.00
± 2
.00
91.0
0± 1
.00
117.
33±
2.0
8 10
9.00
± 1
.73
197.
00±
2.6
5 25
0 m
g/l
1000
mg/
l
Ca
(mg/
l)75
.00±
1.0
0 81
.07±
1.1
1 75
.50±
1.8
0 84
.69±
1.1
7 81
.26±
308
75
mg/
l20
0 m
g/l
Ar
se
ni
c (m
g/l)
0.01
520.
0439
0.
0055
0.12
00.
0093
0.05
mg/
lN
o R
elax
atio
n
Ca
dm
ium
(m
g/l)
Nd
0.
0016
N
d
0.02
0.
0012
0.
01 m
g/l
No
Rel
axat
ion
Ch
rom
ium
(m
g/l)
0.01
64
0.01
89
Nd
0.
045
0.50
6 0.
05 m
g/l
No
Rel
axat
ion
Nic
kel (
mg/
l)0.
02
0.28
N
d
0.04
0.
02
0.02
mg/
lN
o R
elax
atio
n
Lea
d (m
g/l)
0.02
48
0.05
5 N
d
0.04
2 0.
0151
0.
05 m
g/l
No
Rel
axat
ion

Shah, J.Sharma, R.Sharma, i.
52
Tabl
e 5
cont
inue
d
Par
amet
ers
Lud
hian
aF
eroz
pur
SBS
Nag
arR
oop
Nag
arM
ukts
arP
erm
issi
ble
limit
(B
IS s
tand
ard)
Max
. P
erm
issi
ble
Lim
it (
BIS
St
anda
rd)
odo
ro
dorl
ess
odo
rles
so
dorl
ess
odo
rles
so
dorl
ess
uno
bjec
tiona
ble
-
do
(m
g/l)
5.13
± 0
.81
5.01
± 0
.39
6.13
± 0
.81
8.01
± 4
04.
15±
0.5
0-
-
Bo
d (
mg/
l)12
.29.
810
.47.
211
.65
mg/
l-
Co
d (
mg/
l)24
.63±
0.5
5 20
.07±
0.9
0 20
.53±
0.2
5 15
.27±
0.4
0 23
.33±
0.4
210
mg/
l-
Cl (
mg/
l)13
0.00
± 3
.00
159.
67±
2.5
2 19
0.00
± 4
.00
215.
00±
1.0
0 12
2.00
± 2
.65
250
mg/
l10
00 m
g/l
Ca
(mg/
l64
.30±
2.4
6 59
.17±
1.2
6 15
.27±
0.4
020
.53±
0.2
5 80
.33±
0.4
2 75
mg/
l20
0 m
g/l
Ar
se
ni
c (m
g/l)
0.00
410.
0022
Nd
0.03
00.
017
0.05
mg/
lN
o R
elax
atio
n
Ca
dm
ium
(m
g/l)
Nd
0.
0030
N
dN
d
0.00
5 0.
01 m
g/l
No
Rel
axat
ion
Ch
rom
ium
(m
g/l)
0.02
58
Nd
0.
013
0.06
9 0.
080.
05 m
g/l
No
Rel
axat
ion
Nic
kel (
mg/
l)N
d
0.01
N
d
0.00
48
0.00
258
0.02
mg/
lN
o R
elax
atio
n
Lea
d (m
g/l)
0.01
0 0.
034
0.01
15N
d
Nd
0.
05 m
g/l
No
Rel
axat
ion
Study and Evaluation of Groundwater
Quality of malwa Region, Punjab
(North india)
53
slightly alkaline and if ph is above 7 than water is probably hard and contains calcium and magnesium (david, 2004).
Temperature: Results shows that the temperature fluctuated between minimum value of 25.54 ± 0.55 ºC (muktsar) to maximum 28.43 ± 0.67ºC (Patiala). the temperature of water affects the efficiency of treatment units e.g. in cold temperature, the viscosity increases which diminishes the efficiency of settling of the solids that the water may contain because of the resistance that the high viscosity offers to the downward motion of the particles as they settle. Pressure drops also increases in the operation of filtration units again because of the resistance that the higher viscosity offer (Arcadio and Gregoria, 2003).
Turbidity: turbidity is the measure of suspended matter in water. Suspended matter often includes mud, clay and slit. All the samples analyzed were clear and is within the permissible limit that vary from 0-10 Ntu (WRC, 2003). the minimum turbidity value was recorded (0.7 Ntu) at GNdt colony plant, Bathinda and maximum turbidity value of 1.47 Ntu was recorded in ground water sample of Barnala. the excessive turbidity in water causes problems with water purification process.
Electrical conductivity: it is a measurement of water’s capacity for carrying electrical current and is directly related to the concentrations of ionized substance in the water. Levels affected by the electrical conductivity of water are a direct function of its tdS, organic compounds and temperature. Lowest value of 403 μs/cms was obtained in ground water sample of moga and highest value of 1762.67 μs/cms in ground water sample of National Fertilizer Limited (NFL), Bathinda. Results Shows that all the values of EC are beyond the permissible limits of BiS Standard value of 300 μs/cms (BiS, 1998). Conductivity is not a problem in itself and just above certain level does not mean that the water will cause illness (Jayalakshmi et al., 2011).
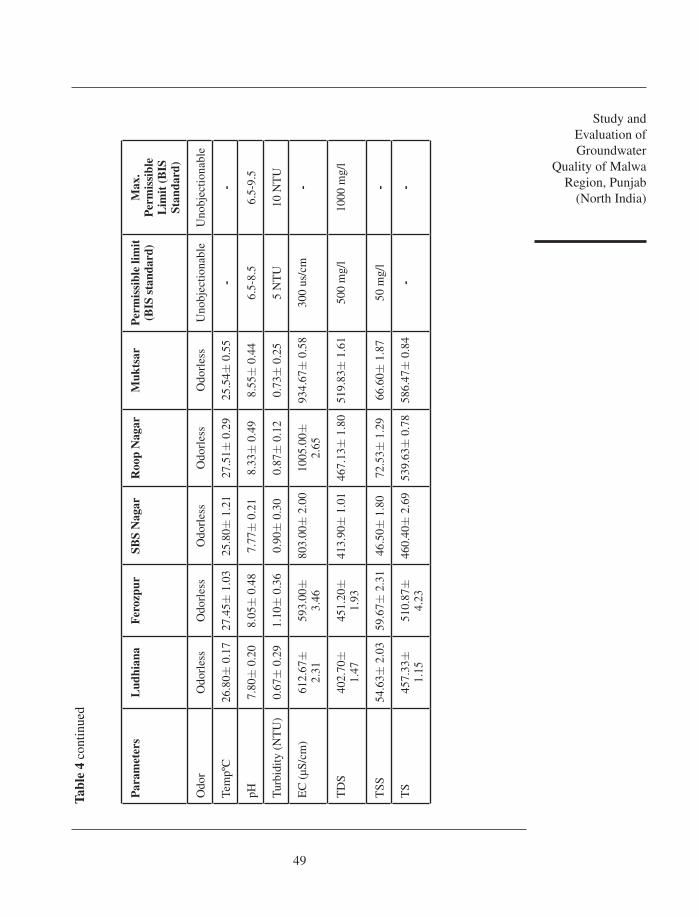
Total Dissolved Solids (TDS): the fluctuations in electrical conductivity correlated positively with the total dissolved solids which are the common indicators of polluted waters (Jayalakshmi, 2011). total dissolved solids ranged from 301.63 mg/l (Barnala) to 580.83 mg/l (mohali, bus stand). Sample of Sangrur, mohali, mansa and muktsar shows the tdS value 556.67 mg/l, 580.83 mg/l, 549.40 mg/l and 519.83 mg/l respectively that are beyond the permissible limit of BiS Standard value of 500 mg/l. the permissible limit of tdS of drinking water is 500mg/l (Who, 2004). the observation shows that the tdS is above the permissible range as prescribed by Who (2004). Total Suspended Solids (TSS): tSS is materials that are not dissolved in water and are not filterable in nature. Results of tSS fluctuates in between minimum
Shah, J.Sharma, R.Sharma, i.
54
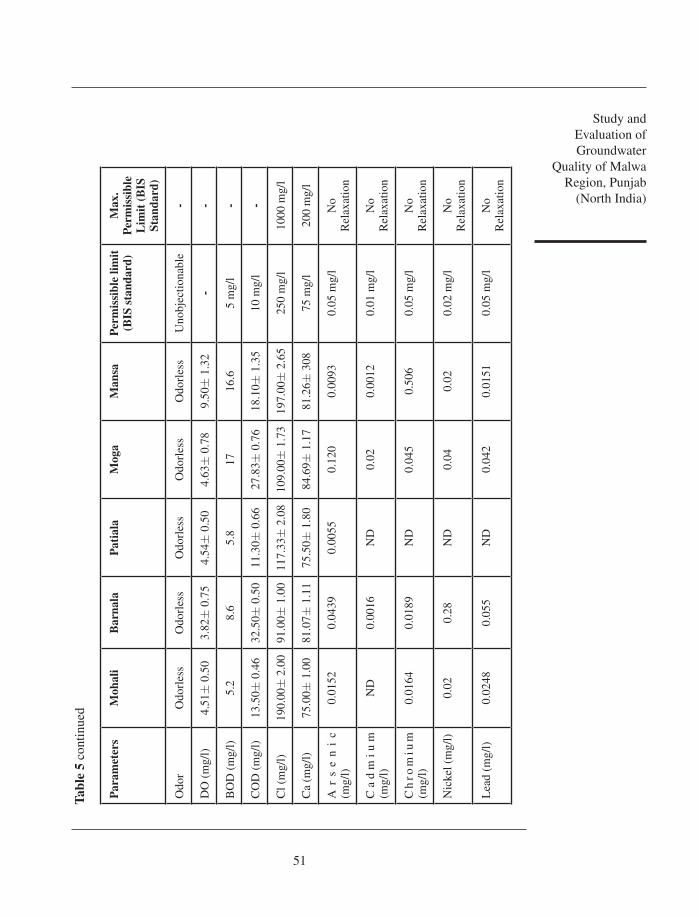
of 41.33 ± 1.53 (Guru Nanak dev tharmal Power Plant, Bathinda) to maximum value of 72.53 ± 1.29 mg/l (Roper). the permissible limit for tSS is 50 mg/l (Who and BiS, 1998; iSi, 1991). Samples of NFL, Bathinda (67.07 ± 3.00 mg/l), Ambuja cement factory, Bathinda (58.00 ± 2.00), Sangrur (57.00 ± 1.00), Barnala (60.30 ± 0.61mg/l), Patiala (52.53 ± 1.50 mg/l), moga (65.40 ± 1.97 mg/l), mansa (63.47 ± 1.36 mg/l), Ludhiana (54.63 ± 2.03 mg/l), Ferozpur (59.67 ± 2.31mg/l) and muktsar (66.60 ± 1.87 mg/l) have tSS values greater than the prescribed limit for drinking water (Who and BiS, 1998, iSi, 1991).
Total Solids (TS): total solids are summation of tdS and tSS. it is the material suspended or dissolved in water that can physically remove either through filteration or evaporation. Results of tS fluctuates in between minimum of 346.5 ± 0.50 mg/l (Barnala) to maximum of 641.13 ± 3.23 mg/l (mohali). Sangrur (614.00 ± 3.00 mg/l), mansa (612.80 ± 1.31 mg/l), Ferozpur (510.87 ± 4.23 mg/l), Roper (539.63 ± 0.78 mg/l), muktsar (586.47 ± 0.84 mg/l) have higher value of tS.
5. CHEMICAL PARAMETERS
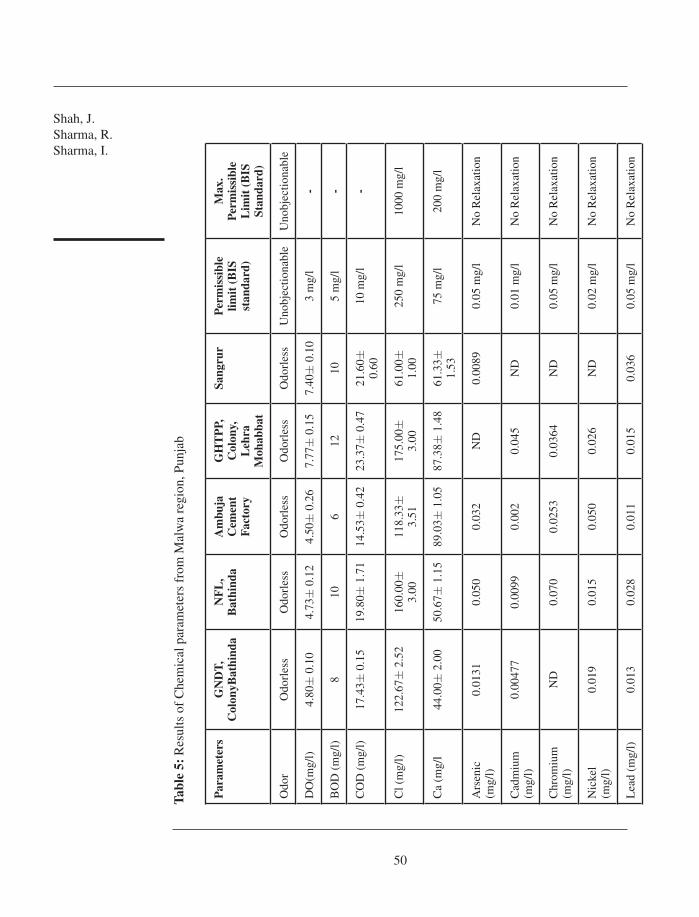
Odour: All the ground water samples were odorless following the BiS drinking standards.
Dissolved Oxygen (DO): Substantial variations were recorded in the do level in the present study. the minimum do values of 3.82 ± 0.75 mg/l (Barnala) and maximum do value of 9.50 ± 1.32 mg/l (mansa). however there is only slight variation in the values of do. the permissible limit for do is 3 mg/l (iS:10500, 1991). the do level is changes due to physical, chemical and biological activities in the water. Samples of ground water which have do values slightly above the permissible limit are GhtP, Lehra mohabbat (7.77 ± 0.15 mg/l), Sangrur (7.40 ± 0.10 mg/l), Ludhiana (5.13 ± 0.81 mg/l), SBS Nagar (6.13 ± 0.81 mg/l) and Roop Nagar (8.01 ± 40 mg/l). the high value of do for water sample may be due to high temperature, wave action, pollution load, organic matter and photosynthetic activity. All the other samples are lower than the prescribed limit for do. the low values observed may be as a result of the increased run off agricultural wastes and industrial effluents discharged into the drains that place high demand on the do.
Biological Oxygen Demand (BOD): Bod represents the amount of oxygen required for microbial degradation of organic matter. the desirable limit of Bod in drinking water is 5 mg/l. minimum Bod value is present in the sample of mohali (5.2 mg/l) and maximum Bod value is present in the sample of moga (17 mg/l). All the samples have Bod value above the prescribed limit of 5 mg/l.
Study and Evaluation of Groundwater
Quality of malwa Region, Punjab
(North india)
55
Chemical Oxygen Demand (COD): Cod variations which changed with seasons and also with the release of chemical substances from agricultural waste and sewage. According to Who and iS permissible limit for Cod is 10 mg/l. the minimum Cod value was recorded at Sabji mandi, Patiala (11.30 mg/l) and the maximum value of 32.50 mg/l was observed Barnala Ground water. high levels of Bod and Cod indicate the presences of agricultural waste in the sample.
Chloride: Prescribed limit for chlorine in drinking water is 200-600 mg/l (Who, 1998) and 250-1000 mg/l (iSi, 1991). Lowest chloride values of 61 mg/l in sample of Sangrur and highest chloride content of 215 mg/l, 190 mg/l, 197 mg/l, 175 mg/l in ground water samples of Roper, Navan Shaher, mansa and Guru hargobind thrmal Power colony plant Lehra mohabbat respectively. All the samples except Roper (215 mg/l) are well within the prescribed limit for drinking water. high concentration of chloride can be attributed to the mixing of industrial effluents in sewage which build up high amounts of organic and inorganic ions like chlorides.
Calcium: the desired limit for calcium in drinking water is 75 mg/l for drinking water (iSi, 1991). Value of calcium ranged between minimum of 15.27 ± 0.40 mg/l) (SBS, Nagar) to maximum of 89.03± 1.05 mg/l (Ambuja Cement factory, Bathinda). Samples which showed the results above the prescribed limit are GhtP, Lehra mohabbat (87.38 ± 1.48 mg/l), Barnala (81.07 ± 1.11 mg/l), moga (84.69 ± 1.73 mg/l), mansa (81.26 ± 3.08 mg/l) and muktsar (80.33 ± 0.42 mg/l). other ground water samples are within the desirable limits.
Arsenic: As per the iSi standard (1991), the desirable limit for arsenic in drinking water is 0.05 mg/l. in the samples of Navan Shehar and GhtP, Lehra mohabbat arsenic was not detected. Arsenic was detected slight above in the sample of NFL, Bathinda (0.050 mg/l). the arsenic concentration in the samples in which it was detected is considerably lower than the desired limit.
Cadmium: As per the Who and BiS standard prescribed for cadmium in drinking water is 0.01 mg/l. Cadmium was absent in the samples of Sangrur, mohali, Patiala, Ludhiana, Navan Shehar, and Roper. Cadmium is present beyond the permissible limit in the sample of moga (0.02 mg/l). in other ground water samples in which cadmium was present was considerably lower than then the desired limits.
Chromium: As per the Who and BiS standards prescribed limit for chromium is 0.05 mg/l. Chromium was not detected in the samples of GNdt colony
Shah, J.Sharma, R.Sharma, i.
56
Plant (Bathinda), Sangrur, Patiala, and Ferozpur. Chromium was present slightly above the desired limit in the ground water samples of NFL, Bathinda (0.070 mg/l), mansa (0.05 mg/l), Roper (0.069 mg/l) and muktsar (0.08 mg/l). Whereas all ground water samples have its chromium concentration was within the prescribed limit.
Nickel: As per the iSi (1991) the desirable limit for Ni in the drinking water is 0.02 mg/l. Nickel was absent the ground water samples of Sangrur, Patiala, Ludhiana, and SBS Nagar, slightly above in the ground water samples of Ambuja Cement Factory, Bathinda (0.050 mg/l), GhtP, Lehra mohabbat (0.026 mg/l), Barnala (0.028 mg/l) and moga (0.04 mg/l). While the other ground water samples have its concentration within the desirable limit.
Lead: the desirable concentration for lead in the ground water is 0.05 mg/l (iSi, 1991). Lead was not detected in the ground water samples of Patiala, Roper, and muktsar. Lead is present above the prescribed limit only in the sample of Barnala (0.055 mg/l). Whereas in all other samples have its concentration within the desirable limit.
6. CONCLUSION
the results of study of ground water show that the ground water of the malwa region is highly contaminated with tdS, tSS and tS. As a result of high concentration of tdS, water loses its portability and reduces the solubility of oxygen in water so unfit for drinking purposes. Ground water of malwa region also contains heavy metals e.g. arsenic, cadmium, chromium, nickel and lead etc. Water of almost all study points is hard and contaminated so people of malwa region especially Bathinda are prone for the immediate health problems such as cancer, gastro-intestinal irritation and neurological disorder etc. the study reveals that contamination due to heavy metals high in groundwater. overall, groundwater quality is not suitable for drinking purposes. therefore, overall, groundwater quality is not suitable for drinking purposes and there is need of some treatment techniques to remove these contaminations.
REFERENCES
[1] APhA, AWWA, WEF (1995). Standard methods for the examination of water and wastewater, 19th ed. Prepared by the American Public health Association, American Water Works Association, and Water Environment Federation.
[2] APhA 1992, APhA (1992). Standard methods of Examination of Water and Waste Water, 18th edition, uSA.
[3] APhA, AWWA, WEF standard (1998)[4] Arcadio P and Gregoria A (2003). Physical and Chemical treatment of Water and
Waste water. Sincero, A.P and G.A. Sincero. u.K.

Study and Evaluation of Groundwater
Quality of malwa Region, Punjab
(North india)
57
[5] B.i.S. (1991). Bureau of indian standards drinking water specification, ist revision, iSS 10500.
[6] david C (2004). Small Water Supplies. Cromwell Press, trowbridge, Wiltshire. india.
[7] Examination of water and waste water, (1998). 20th edition, American Public health Association Washington APhA, AWWA, WEF standard.
[8] Jayalakshmi V, Lakshmi, N and Singara mAC. (2011). int J of Res in Pharmaceutical and Biomed Sci. 2 (3). iSSN: 2229-3701.
[9] Jayabaratha J, S Sundar, R Giridhar, R Arulmurugan, (2009). int J of Biotecol App. 1: 50-54.
[10] iSi (1991). indian standard drinking Water Specifications, New delhi. 5, 16. [11] mittal, S and Arora, SK, (2014). int J of Eng and innova technol (iJEit) 4:1. iSSN:
2277-3754.[12] Pranavam dtS, Venkatesa Rt, Punithavathi L, Karunanithi S and Bhaskaran A
(2011). ind J. Sci. technol. 4 (1): 19-21.domain site:http://www.indjst.org. [13] Pillai A, Sunita G, Gupta, V (2000). Analytica Chimica Acta . 408: 111-115.[14] Sarkar B, A Solaiman, A das, d.Chowdhury (2011). J of Exp Sci. 2: 38-41[15] Water Resource Commission (WRC) (2003). Water Resources management
problems, identification, Analysis and prioritization study CSiR- Water Research institute Accra, Ghana.
[16] iS (Part 15)- Reaffirmed 2003.[17] Who (2004). international standards of drinking water. World health organization,
Geneva.pp:55-79.

58