quantitative evaluation of the aist groundwater-level
TRANSCRIPT
Quantitative Evaluation of the AIST Groundwater-Level Observation Network to Detect Preslip of the Anticipated Tokai Earthquake
Norio Matsumoto, Yuichi Kitagawa and Naoji Koizumi
(Geological Survey of Japan, AIST)
• Introduction: Purpose of this study• Anticipated Tokai earthquake• AIST groundwater observation network• Evaluation method of detectability• Detectabilities of M6.5 and M6 preslips• Conclusions
This presentation

• Introduction: Purpose of this study• Anticipated Tokai earthquake• AIST groundwater observation network• Evaluation method of detectability• Detectabilities of M6.5 and M6 preslips• Conclusions
This presentation

Hydrological precursors in conventional earthquake prediction research
Earthquake
Groundwater level
Only hydrological precursor detection
Anomaly
No method, theory Even if we recognize it as anomalous change in advance, Epicenter?? Occurrence time?? Magnitude??
time
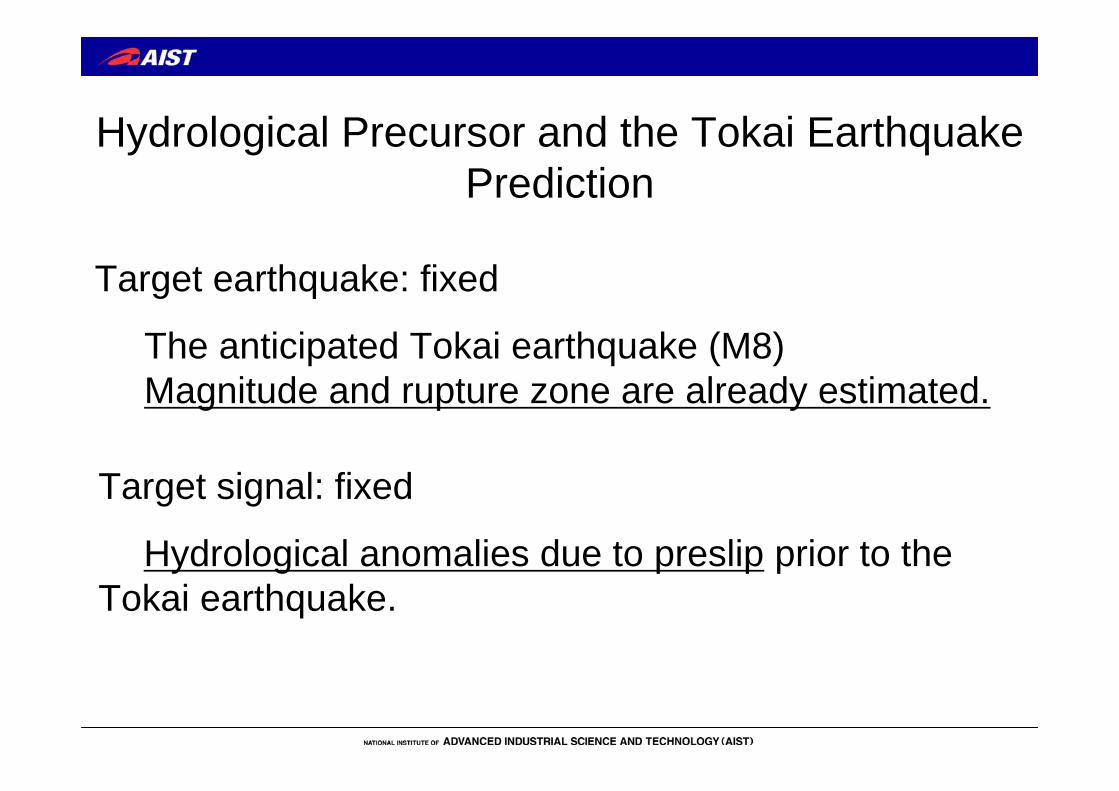
Hydrological Precursor and the Tokai Earthquake Prediction
Target earthquake: fixed
The anticipated Tokai earthquake (M8)Magnitude and rupture zone are already estimated.
Target signal: fixed
Hydrological anomalies due to preslip prior to the Tokai earthquake.

Hydrological Precursor and the Tokai Earthquake Prediction (2)
Theoretical support to estimate an occurrence time: We have!• Preslip to the mainshock: rate- and state-dependent friction
law and numerical simulation (Kato and Hirasawa, 1999)• Relationship between groundwater level and crustal deformation:
poroelasticity
Pore pressure is proportional to volumetric strain.10-8strain contraction: 0.1~10 cm increase in groundwater level
Volmetric strainPore pressure

Hydrological Precursor and the Tokai Earthquake Prediction (3)
GPS
Groundwater level
Strainmeter Data integration to detect preslip
Estimation of occurrence time of the Tokai earthquake (M8)
Leveling, tiltmeter …
In order to contribute Tokai earthquake prediction, We need to evaluate detectability of preslip to the Tokai earthquake in the AIST groundwater observation network.

• Introduction: Purpose of this study• Anticipated Tokai earthquake• AIST groundwater observation network• Evaluation method of detectability• Detectabilities of M6.5 and M6 preslips• Conclusions
This presentation

Historical earthquakes along the Nankai-Suruga Troughs
Osaka
A,B: Nankai EQC,D: Tonankai EQE or C-E: Tokai EQ
Recurrence Interval:90 – 150 yrs
Rupture patten is different.

System of Earthquake Prediction in the Tokai Region
• Japan Meteorological Agency (JMA) is responsible for the prediction of anticipated Tokai earthquake. Director-General of JMA convenes the Earthquake Assessment Committee to predict the Tokai earthquake.
• Groundwater data observed by our institute (AIST) is reported to the Committee once a month, and a part of the data is transferred to JMA by real-time processing.

Hypothetical rupture zone of the Tokai earthquakeand upper boundary of the Philippine Sea slub
Rupture zone: boundary of two platesDepth:10 – 30 km

2-D model for the Tokai earthquakeKato and Hirasawa (1999)
Subduction of Philippine Sea plate
4 cm /year
Numerical simulation in a uniform elastic half-space is done by applying rate- and state-dependent friction law.
Locked area
Main EQ
Accelerated strain rate
We apply this strain history to groundwater level anomalies due to preslip.

Few decades -several years prior to EQ
Interseismic period
4. Strain change due to the preslip(one – several
days to EQ)1. Aseismic sliding Main
EQForeshock(occasionally)
Possible scenario of the Tokai earthquake (based on Kato’s model; JMA, 2003)
3. Preslip(~1% of main EQ)
2. Uplift due to aseismic sliding
(a few years to the EQ)
1. Locked area in overriding plate
becomes difficult to subduct
2.

• Introduction: Purpose of this study• Anticipated Tokai earthquake• AIST groundwater observation network• Evaluation method of detectability• Detectabilities of M6.5 and M6 preslips• Conclusions
This presentation
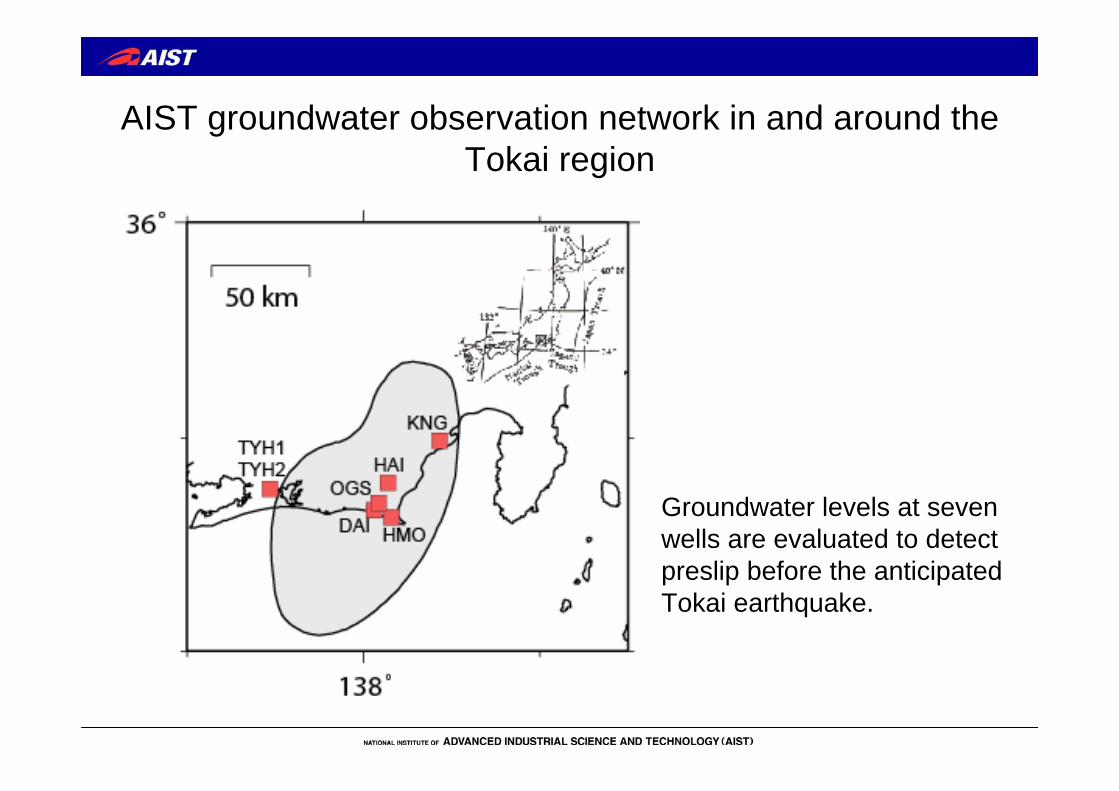
AIST groundwater observation network in and around the Tokai region
Groundwater levels at seven wells are evaluated to detect preslip before the anticipated Tokai earthquake.
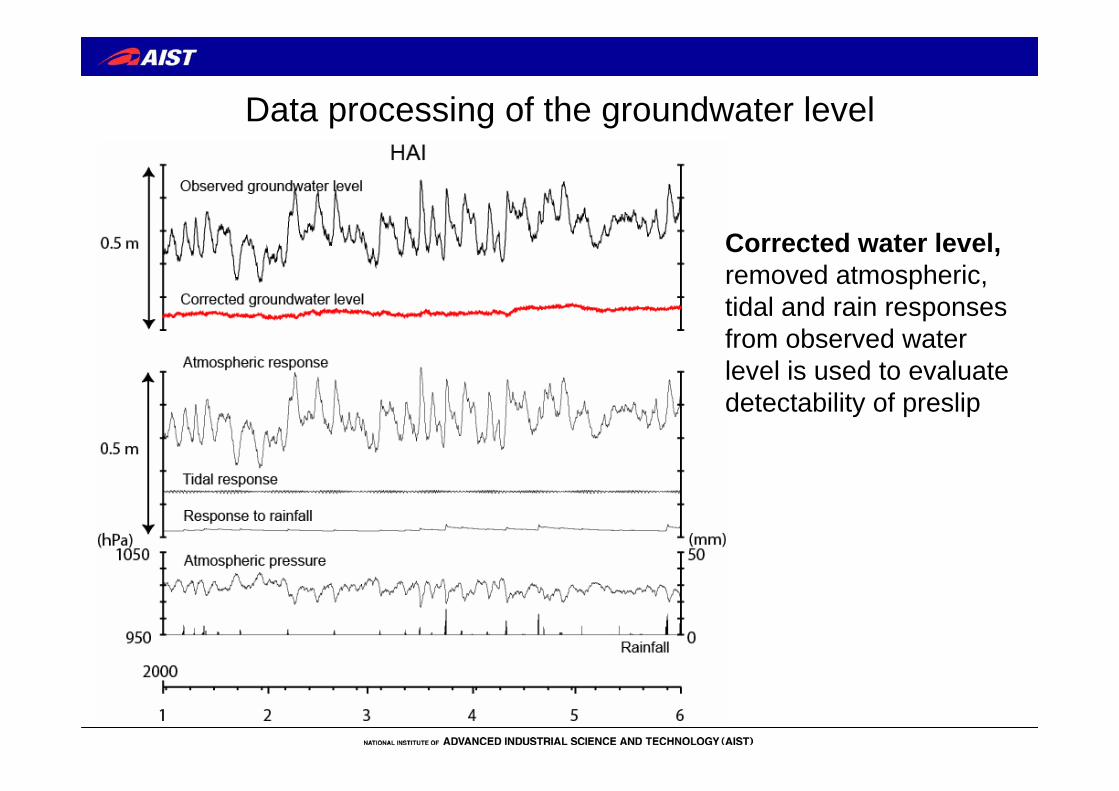
Data processing of the groundwater level
Corrected water level,removed atmospheric, tidal and rain responses from observed water level is used to evaluate detectability of preslip

Strain-converted noise levels in the groundwater levels and noise levels of strainmeters
(1) Data during the period without rainfall(2) Data during the period with rainfall
1.5 x vol. str.No rainfall
1-2 x vol. str. with rainfall
5 x vol. str. with rainfall
noise level: the value to extract the maximum change in usual.

• Introduction: Purpose of this study• Anticipated Tokai earthquake• AIST groundwater observation network• Evaluation method of detectability• Detectabilities of M6.5 and M6 preslips• Conclusions
This presentation

Evaluation method of detectability
At one of 272 grid points M6.5 or M6 preslip is supposed, and we calculate histories of groundwater-level changes due to the preslip at the seven wells.
If an absolute value of groundwater change due to the preslip exceeds the noise level at the wells, we can recognize it as an anomaly of groundwater level at that time.
272 grid points (0.1 x 0.1 degree)
Observation wells
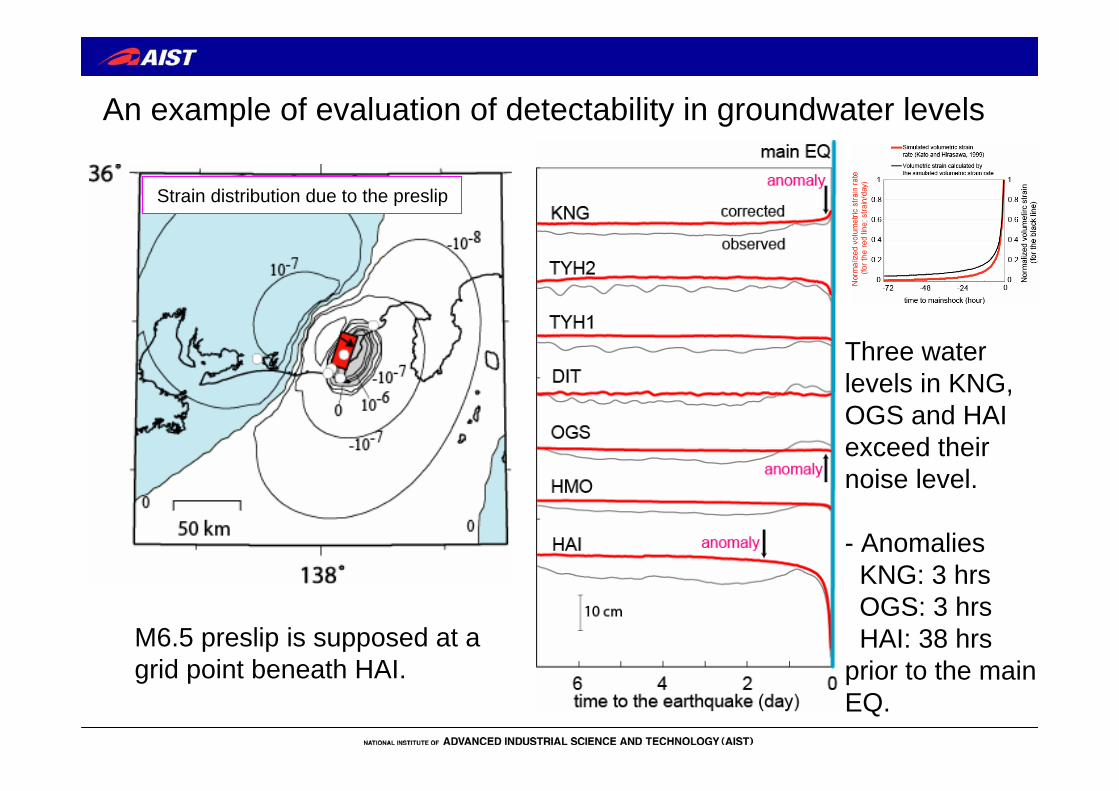
An example of evaluation of detectability in groundwater levels
M6.5 preslip is supposed at a grid point beneath HAI.
Three water levels in KNG, OGS and HAI exceed their noise level.
- AnomaliesKNG: 3 hrsOGS: 3 hrsHAI: 38 hrs
prior to the main EQ.
Strain distribution due to the preslip

• Introduction: Purpose of this study• Anticipated Tokai earthquake• AIST groundwater observation network• Evaluation method of detectability• Detectabilities of M6.5 and M6 preslips• Conclusions
This presentation
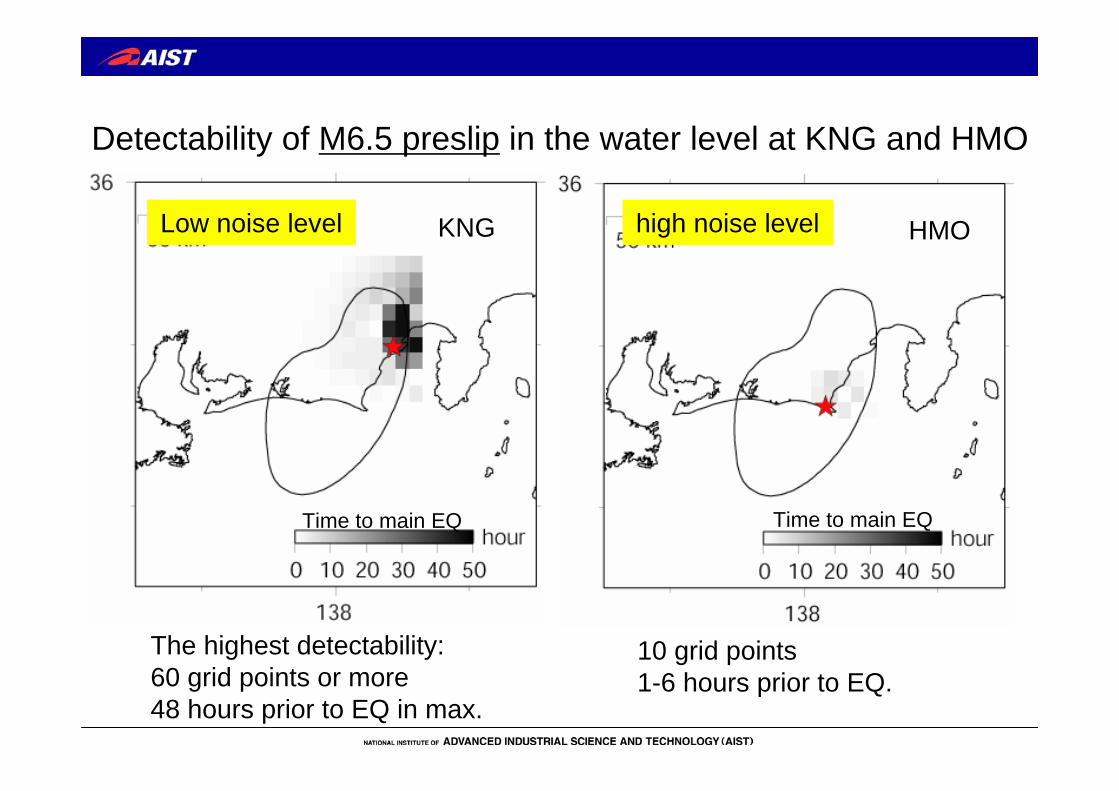
Detectability of M6.5 preslip in the water level at KNG and HMO
KNG HMO
Time to main EQ Time to main EQ
The highest detectability:60 grid points or more48 hours prior to EQ in max.
10 grid points1-6 hours prior to EQ.
Low noise level high noise level

Detection time of anomalies at any two wells due toM6.5 preslip
Time to main EQ87 grid points or more
1-17 hours prior to EQ
If anomalies are detected at two wells or more, detected anomalies are recognized to be reliable.
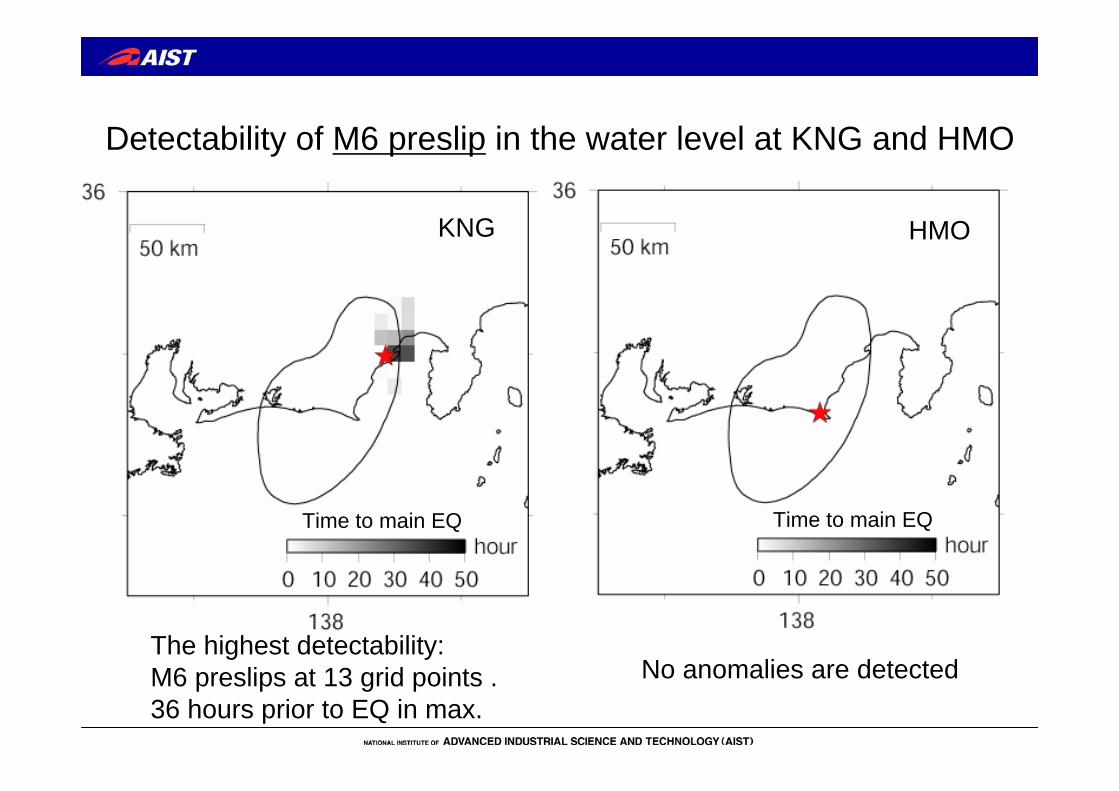
Detectability of M6 preslip in the water level at KNG and HMO
KNG HMO
Time to main EQ Time to main EQ
The highest detectability:M6 preslips at 13 grid points .36 hours prior to EQ in max.
No anomalies are detected

Detection time of anomalies at any two wells due toM6 preslip
Time to main EQ9 grid points or more
1-4 hours prior to EQ

Conclusions• We evaluate a detectability of preslip in the
AIST groundwater monitoring network.
• If M6.5 preslip occurs, any two wells of the AIST network can detect the preslip 1-17 hours prior to the main earthquake beneath the landward side. The network can detect several M6.5 preslips beneath the ocean.
• If M6 preslip occurs, any two wells of the AIST network can detect preslips at 9 grid points 1-4 hours to the mainshock.