student survey powerpiont
TRANSCRIPT

Lesson 8
And
Student Survey

Student Survey Results
What do you think about homeless People
Reasons Replies
Interesting 2
Strange 4
Wired 3
Cant Tell because of government 1

Coronado Foundries CORONADO
FOUNDRIESProduction and Scrap
ReportJune
FactoryUnits
ProducedScrap
Generated*
Colorado 7,259 110
Iowa 1 8,723 129
Iowa 2 10,548 245
Kansas 5,211 50
Nevada 4,527 45
Oklahoma 9,914 149
Texas 1 11,204 190
Texas 2 8,564 100
Texas 3 6,799 75
Utah 1 7,612 150
Utah 2 8,247 125
Total 88,608 1,368
*Scrap is generated during the manufacturing process.
-
50
100
150
200
250
4,000 6,000 8,000 10,000 12,000
Un
its
of
Scr
ap
Units Produced
Production and Scrap Report

Education PaysMedian Income by Education Level
Education Level Men Women
No high school diploma $ 22,138 $ 13,076
High school Diploma $ 31,683 $ 20,179
Some college or associate's degree $ 39,601 $ 25,736
Bachelor's degree $ 53,693 $ 26,250
Graduate or professional degree $ 71,918 $ 47,319
Source: U.S. Census Bureau, 2005 American Community Survey
http://www.census.gov/prod/2006pubs/acs-02.pdf, page 13
$-
$10,000
$20,000
$30,000
$40,000
$50,000
$60,000
$70,000
$80,000
Me
dia
n I
nco
me
Education Level
Education Pays
Men Women

Family Expenses MONTHLY CASH FLOW
Sources of Income
Salary$ 3,200
Expenses
Housing 975
Groceries 315
Taxes 275
Utilities 300
Contributions 200
Insurance 125
Savings 300
Entertainment 225
Total Uses of Cash
$ 2,715
Surplus $485
Housing36%
Groceries12%
Taxes10%
Utilities11%
Contributions7%
Insurance5%
Savings 11%
Entertainment8%
Where Our Money Goes

Grain Sales Annual Sales (in thousands)
Segment Sales
Alfalfa $ 1,723
Corn 3,627
Soybeans 2,785
Wheat 895
Total $ 9,030
Alfalfa19%
Corn40%
Soybeans31%
Wheat10%
Annual Sales by Segment

McDonalds Corporation
McDonald's Corporation
Restaurants
Company operated 8,785
Franchises 18,687
Affiliated 4,195 Manuel Abarca
Total 31,667
28%
59%
13%
Total Restaurants
Company operated Franchises Affiliated

Populations of Large CitiesMost Populated Cities in the World
Population
City (in millions)
Tokyo/Yokohama 33.2
New York 17.8
Sao Paulo 17.7
Seoul/Incheon 17.5
Mexico City 17.4
Osaka/Kobe/Kyoto 16.425
Manila 14.75
Mumbai 14.35
Delhi 14.3
Jakarta 14.25
Series1, 14.25
0
5
10
15
20
25
30
35
Ax
is T
itle
Population in Millions

Study and Grades Student Study Time Test Grade
Anderson 5.25 87
Block 1 56
Chen 5.25 95
Davis 3.25 64
Evans 4.5 75
Franks 4 74
Gomez 4.25 78
Herrera 4.75 88
Ingram 5.5 94
Johnson 0.5 66
Kyle 3 76
Langford 3.75 75
Montrose 3.25 74
Newman 5.5 84
Ross 4.5 85
Theisen 6 90
Williams 2.25 61
Wong 5.75 91
0
10
20
30
40
50
60
70
80
90
100
0 5 10 15 20
Ex
am
s G
rad
es
Hours of Study
Relationship Between Exams Grades and Study Time
Series1 Series2

Triangle Growth(in thousands) Year Ending December 31
2006 2007 2008 2009 2010
Net Revenues $2,700 $3,800 $4,600 $6,000 $8,600
Net Income 700 900 1,200 1,500 2,300
Total Assets 2,700 3,900 5,300 7,300 10,000
Stockholders' Equity 2,200 3,300 4,400 5,200 7,000
Return on Net Revenues 25.9% 23.7% 26.1% 25.0% 26.7%
$0
$1,000
$2,000
$3,000
$4,000
$5,000
$6,000
$7,000
$8,000
$9,000
$10,000
2006 2007 2008 2009 2010
Do
lla
rs i
n T
ho
usa
nd
s
Triangle Software Revenue and Income
Net Revenues Net Income

Concession SalesFood Game 1 Game 2 Game 3 Game 4 Total
Hot Dogs $ 3,500 $ 3,950 $ 4,280 $ 3,850 $ 15,580
Sandwiches 1,450 1,050 950 300 3,750
Chips 2,250 2,100 2,450 2,200 9,000
Popcorn 1,750 1,900 2,100 2,200 7,950
Pretzels 750 775 900 525 2,950
Total $ 9,700 $ 9,775 $ 10,680 $ 9,075 $ 39,230 $-
$500
$1,000
$1,500
$2,000
$2,500
$3,000
$3,500
$4,000
$4,500
Hot Dogs Sandwiches Chips Popcorn Pretzels
Sa
les
in D
oll
ars
Concession Sales
Game 1 Game 2 Game 3 Game 4
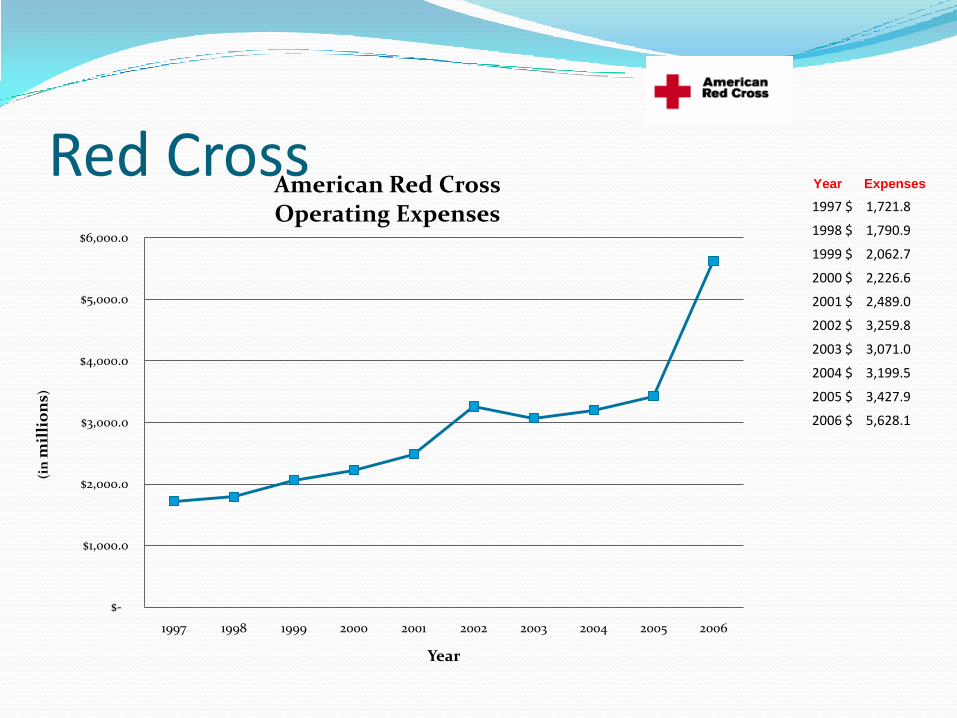
Red CrossYear Expenses
1997 $ 1,721.8
1998 $ 1,790.9
1999 $ 2,062.7
2000 $ 2,226.6
2001 $ 2,489.0
2002 $ 3,259.8
2003 $ 3,071.0
2004 $ 3,199.5
2005 $ 3,427.9
2006 $ 5,628.1
$-
$1,000.0
$2,000.0
$3,000.0
$4,000.0
$5,000.0
$6,000.0
1997 1998 1999 2000 2001 2002 2003 2004 2005 2006
(in
mil
lio
ns)
Year
American Red CrossOperating Expenses

CREDITS Special Thanks to:
MS Excel
Microsoft PowerPoint
Schoology
Google Docs