structured products & financial engineering - imarticus.org study... · structured products...
TRANSCRIPT

Structured Products &
Financial Engineering The Practical Applications of
Financial Innovation
Day 1 Rajat Bhatia

Session 4: Real Life Complex Structured Deals

© RAJAT BHATIA 3
Agenda
In this session, you will learn about: • Practical Application of How to Use a Complex Cross-asset Barrier Option to Help a Client
Reduce their Cost of Hedging Jet Fuel, Interest rate
and Foreign Exchange Risks in an Integrated
Manner.
• Structured Products Proposed by a Leading
Investment Bank to a Major Airline in India will be
discussed.
• Practical Illustration of how a Major Global
Investment Bank Designed a New Bond Issue for a
Sovereign Issuer Along with the Use of Asset Swaps
to Identify Market Mis-pricings, thereby Creating
an Arbitrage.
• The Case of Republic of Italy’s US Dollar Bond Issue along with a Tender Offer to Buy-back Bonds
Issued in Other Currencies will be Discussed.

© RAJAT BHATIA 4
Decoding a Flight
Decoding Airline
Profitability

© RAJAT BHATIA 5
Jet Fuel is 34% of the Total Operating Cost of an Airline
The Airline industry spent more than
34% of its revenue
on Jet Fuel. Oliver Wyman research
It takes the fares of more
than 1/3rd of
passengers on a flight to pay for the gas
© RAJAT BHATIA 6
Tripled the fuel bill
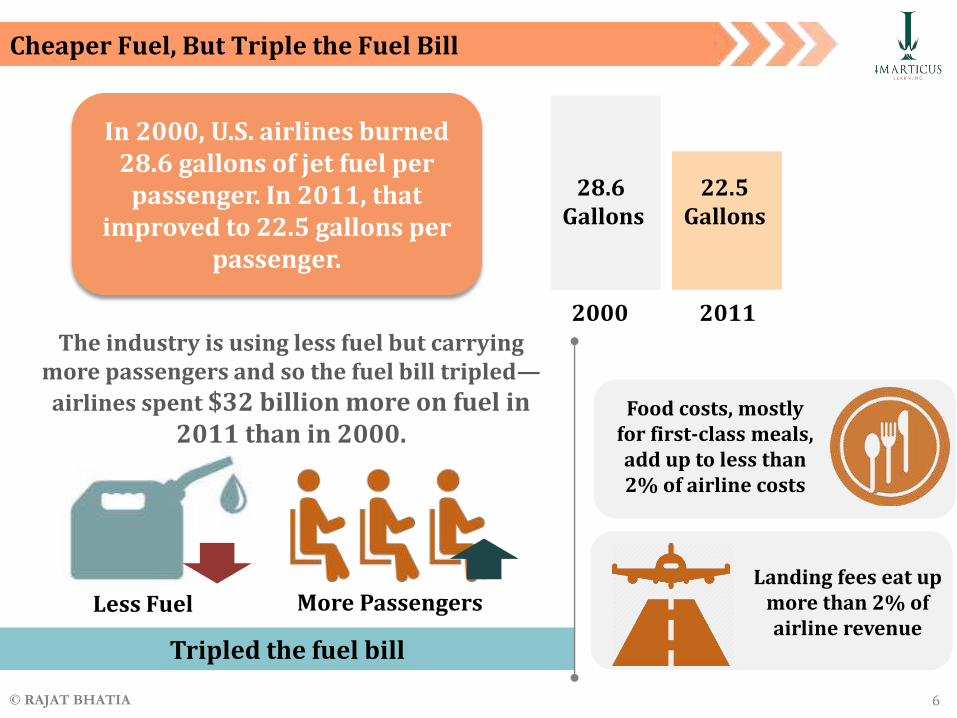
Cheaper Fuel, But Triple the Fuel Bill
In 2000, U.S. airlines burned 28.6 gallons of jet fuel per
passenger. In 2011, that improved to 22.5 gallons per
passenger.
2000
28.6 Gallons
2011
22.5 Gallons
Less Fuel More Passengers
The industry is using less fuel but carrying more passengers and so the fuel bill tripled—airlines spent $32 billion more on fuel in
2011 than in 2000. Food costs, mostly
for first-class meals, add up to less than 2% of airline costs
Landing fees eat up more than 2% of airline revenue

© RAJAT BHATIA 7
According to Airlines for America®, rising Jet Fuel prices contributed to industry-wide annual losses of:
The sharp increase in the price of jet fuel in 2008 was the chief contributor to airline industry losses of about $4.3 billion in the first three quarters of 2008
Rising Jet Fuel Prices are a Key Contributor to Airline Losses
$3.6 billion in
2003
$9.1 billion in
2004
$5.7 billion in
2005
$9.5 billion in
2008

© RAJAT BHATIA 8
Singapore Airlines - Consolidated Income Statement
Fuel costs are the single largest Operating Expense accounting for nearly one-
third of all Operating Expenses of Singapore
Airlines

© RAJAT BHATIA 9
Singapore Airlines: Jet Fuel Price Risk

© RAJAT BHATIA 10
Impact of Jet Fuel Price on Airlines’ Profitability
An increase in price of one USD per barrel of jet fuel affects the annual fuel costs of
Singapore Airlines by $50 million.
$50 Million
Annual Fuel Costs
$1 per barrel
The Group manages this fuel price risk by using jet
fuel swap, option and collar, Brent swap and
crack swap contracts and hedging up to eight quarters forward.

© RAJAT BHATIA 11
Impact of Jet Fuel Price on Airlines’ Profitability
Singapore Airlines had hedged Jet Fuel at an average of $116 per barrel when spot market
rates had fallen to $85 per barrel in 2014.
Spot Market
Rate: $85
Hedged at an
average: $116
Singapore Airlines operating profit fell to S$146.3 million in October-December 2014 from S$151 million a year earlier.
October-December
2013
S$151 million
S$146.3 million
October-December
2014
The result was below an average forecast of S$169.4 million in a Reuters survey of five analysts.

© RAJAT BHATIA 12
Impact of Jet Fuel Price on Airlines’ Profitability
The group had hedged 65 percent of its jet fuel requirements at an average price of $116 per barrel,
leading to a hedging loss of $216 million.
Hedged
65% of its fuel
reqs.
Hedging Loss
$216 million

© RAJAT BHATIA 13
Impact of Jet Fuel Price on Airlines’ Profitability
Singapore Airlines had seen a drop of $105 million (-7.9%) in its Operating Profits from $1.317 Billion in 2005 to $1.213 Billion in 2006 mainly due to rise in higher
jet fuel price.
2005
$1.317 Billion
$1.213 Billion
2006
From this, one can see the profitability of the group lies mainly on its hedging strategy for Jet Fuel Oil Price Risk.
Dropped $105 million (-7.9%)

© RAJAT BHATIA 14
Bankruptcies from Rising Jet Fuel Oil Prices
This shows that management of jet fuel price risk is essential because it is: • Known to be highly volatile and
• Represents a third of Operating Costs
Long list of Airlines that have failed due to rising jet fuel prices
Oil prices going above US$ 100 per
barrel
Within three weeks
Four major airlines in America failed within three weeks of oil prices going
above US$ 100 per barrel • Aloha Airlines – stopped operations on 31
March 2008 • ATA – Filed for Chapter 11 on 2 April 2008 • Skybus - Halted operations on 5 April
2008 • Fronter Airlines – Filed for Chapter 11 on
11 April 2008 • Champion Air – Halted all flights on 31
May 2008

© RAJAT BHATIA 15
Singapore Airlines: Probability of Default
1-year probability of default (PD) for Singapore Airlines (SIA)
against the 1-year aggregate default probability of global airlines.
The near zero probability of default of Singapore Airlines is due to: • A low 3 month SIBOR (Singapore Interbank Offered Rate) rate of 0.37% • Large cash to total asset ratio • Effective jet fuel price risk management

© RAJAT BHATIA 16
Jet Fuel: A Major Risk Factor for All Airlines
• Hedged airlines are better positioned to take advantage of investment opportunities during periods of high jet fuel prices.
• Academic studies have shown that effective jet fuel price risk management increases the value of the firm.
Jet Fuel cost is a major risk factor for all Airlines as it accounts for a third of operating expenses

© RAJAT BHATIA 17
Singapore Airlines Jet Fuel Price Risk
Net fair value gain:
$82.2m

© RAJAT BHATIA 18
Singapore Airlines Foreign Currency Risk
65% of total revenue
69% of total operating
expenses
Foreign currency accounts for:

© RAJAT BHATIA 19
Singapore Airlines Foreign Currency Risk
The Group’s largest exposures are from: • USD • Euro • UK Sterling Pound • Swiss Franc • Australian Dollar • New Zealand Dollar
• Japanese Yen • Indian Rupee • Hong Kong Dollar • Chinese Yuan • Korean Won • Malaysian Ringgit
• Singapore Airlines generates a surplus in all of these currencies, with the exception of USD.
• The deficit in USD is attributable to capital expenditure, fuel costs and aircraft leasing costs – all conventionally denominated and payable in USD.

© RAJAT BHATIA 20
How SIA Manages its Currency Risk
Singapore Airlines manages its foreign
exchange exposure by matching, as far as
possible, receipts and payments in each
individual currency.
The Group also uses forward
foreign currency contracts to hedge
a portion of its future foreign
exchange exposure.
Such contracts provide for the group to sell currencies at
predetermined forward rates, with
settlement dates that range from one month
up to one year.
The Group uses forward
contracts purely as a
hedging tool.

© RAJAT BHATIA 21
Singapore Airlines Interest Rate Risk
Long-Term liabilities • Singapore Airlines leases are charged at LIBOR + 3.19% to 5.18% • SIA Cargo’s leases are charged at LIBOR + 2.88% to 4.74%

© RAJAT BHATIA 22
Singapore Airlines Interest Rate Risk
Non-equity Investments
382.4 million of interest-bearing investments with an
effective annual interest rate of 3.97%

© RAJAT BHATIA 23
The Flip Side of Cheap Oil : Costly Hedges
Some major U.S. airlines including Delta and Southwest are rushing to finance losing bets on oil and revamp fuel hedges as tumbling crude prices leave them with billions of dollars in losses.

© RAJAT BHATIA 24
The Flip Side of Cheap Oil: Costly Hedges
In theory, airlines are among the top
beneficiaries of a six-month slump that
halved crude prices to five-year lows..…. …..But the reality is
different.

© RAJAT BHATIA 25
The Flip Side of Cheap Oil : Costly Hedges
Now, carriers such as Delta and even Southwest Airlines, known for a successful hedging program that locked in cheap fuel prices before they rose a decade ago,
see the benefits of cheap fuel eaten away by hedging costs.
Delta had a $1.7 billion gain from lower fuel prices in
2015 but $1.2 billion in jet fuel hedge losses.
American Airlines, which has not entered any hedge
contracts since late 2013, saw a greater boost to its
bottom line.
vs

© RAJAT BHATIA 26
The Flip Side of Cheap Oil: Costly Hedges
Selling financial options that pay off when oil prices fall
Using the proceeds to buy protection against soaring
fuel costs
That is largely because they have used common but risky hedging strategies, among them a "costless collar":
SELL
BUY
With oil prices tumbling faster and further than anticipated, the collar hedges left airlines
with insurance against high costs they no longer need and on the hook for protection
they sold against a further slide.

© RAJAT BHATIA 27
Is the Costless Collar Really Without Costs?
Jet Fuel Collars looked great when Jet Fuel prices hovered around $100 per barrel for most of the past four years, allowing airlines to cap their fuel costs
without having to pay upfront for the options.
$100 per
barrel
"Costless collars are an effective strategy that works best when prices stay within a range…. …. but it becomes a very different animal when the market goes against that.

© RAJAT BHATIA 28
Is the Costless Collar Really Without Costs?
At Southwest, the world's biggest low-cost carrier, a 25 percent decline of Jet Fuel prices would force it to pay $615 million while Delta would pay $800 million to counterparties if oil fell 20 percent.
Would Pay
$615 million
25% drop in jet fuel
Would Pay
$800 million
20% drop in jet fuel
In reality, Brent has tumbled
more than 50%

© RAJAT BHATIA 29
Is the Costless Collar Really Without Costs?
Save about
80 cents
Save only 60
cents
These hedges weigh on the costs of their future fuel consumption, too.
For every $1 fall in oil prices:
Will reap the full
benefit of cheap fuel

© RAJAT BHATIA 30
Gambling Without a Clear Game Plan
Fuel hedging is a common, yet not always successful, way for airlines to mitigate volatile oil prices. But if well constructed, it need not be an unduly risky strategy.

© RAJAT BHATIA 31
Gambling Without a Clear Game Plan
Emirates Airline fuel risk management program – more accurately described as an oil hedging strategy.
Had saved
$1 billion over eight years
Emirates had to write down annual fuel hedging losses of
US$428 million 2008-2009

© RAJAT BHATIA 32
Gambling Without a Clear Game Plan
This mistake was repeated in airline boardrooms around the world.
In Dublin, shortly after admitting he had screwed up by not hedging when oil was cheap, Ryanair chief executive Michael O'Leary belatedly started locking in $120-
plus per barrel prices just as oil began its rapid descent back down to $40.

© RAJAT BHATIA 33
Gambling Without a Clear Game Plan
In China, the risk-averse government was so
furious about the hedging losses incurred
by its airlines that it banned them from
buying crude oil futures.

© RAJAT BHATIA 34
Gambling Without a Clear Game Plan
• Because airlines sell their tickets several months ahead of the date of travel, and because fuel accounts for more than one third of their expenses, there is a pressing need to insulate themselves from unknown future price movements.
• This is exacerbated by the added risk of buying fuel from refineries, whose jet fuel price may not move in tandem with the underlying price of crude oil.
Airlines sell their tickets several months ahead of the
date of travel
Fuel accounts for more than one third of their
expenses
Pressing need to insulate themselves from unknown
future price movements
1/3rd Of expenses

© RAJAT BHATIA 35
Gambling Without a Clear Game Plan
There was a fear that oil prices were going to go to $200 or $300 a barrel. The fear of being exposed to $200 a barrel was so great that a lot of people convinced themselves prices could
not decline.
Prices were rising so fast that many airlines started hedging without even really thinking about it. It became an emotional, rather than an analytical, decision.
$200 or $300 a barrel

© RAJAT BHATIA 36
Dual, (Hybrid, Outside or Rainbow) Barrier Options
In a Dual Barrier (also known as a Hybrid or Outside Barrier or Rainbow Barrier) Option, the Option Pay off is based on one asset (known as the Pay-off Asset) but the knock-in or knock-out is determined by movements of a different asset (known as the Barrier Asset)
Asset S1
(Pay off asset)
Knock-In or Knock-Out
Option Payoff
Asset S2 (Barrier Asset)

© RAJAT BHATIA 37
Hedging Jet Fuel Price Risk using Hybrid Barrier Options
1
3 2
An Airline
has exposure
to three
major
variables
Jet Fuel Prices (the most critical
determinant of Operating Profits)
Interest Rates Exchange Rates

© RAJAT BHATIA 38
Hedging Jet Fuel Price Risk using Hybrid Barrier Options
The Airline has some intrinsic hedges built into its business, which it can use to construct low cost option strategies without taking on undue risks:
• This is a less expensive hedge than an outright Jet Fuel price cap.
• Yet it offers protection when the Airline is impacted by BOTH higher fuel prices and higher interest rates.
• If Jet Fuel Prices rise but Interest Rates fall, their affect on profitability is offset by each other.
A Jet Fuel Option that knocks-out when interest rates fall
• Again this is a less expensive hedge than an outright Jet Fuel price cap.
• Yet it offers protection when the Airline is impacted by BOTH higher fuel prices and adverse Exchange Rates.
• If Jet Fuel Prices rise but Exchange Rates move adversely, their affect on profitability is offset by each other.
A Jet Fuel Option that knocks-out when Exchange rates move in a
favorable direction

© RAJAT BHATIA 39
Hybrid Barrier Option Strategies for Airlines
Higher Jet Fuel
Lower Interest Rates
Higher Jet Fuel
Favorable FX Rates
Higher Interest Rates
Favorable FX Rates
Buy a Jet Fuel Call which knocks-out when
interest rates fall
Buy a Jet Fuel Call which knocks-out when FX rates
are favorable
Buy an Interest Rate Cap which knocks-out when FX
rates are favorable
Higher Interest Rates
Lower Jet Fuel
Higher Jet Fuel
Adverse FX Rates
Higher Jet Fuel
Adverse Interest Rates
Buy am Interest Rate Cap which knocks-out
when Jet Fuel falls
Buy a Jet Fuel Call which knocks-in when FX rates
are adverse
Buy an Interest Rate Cap which knocks-in when
Interest rates are adverse

© RAJAT BHATIA 40
The Link between Crude Oil Price and US$ Exchange Rate

© RAJAT BHATIA 41
Correlation of Oil and the US Dollar Exchange Rate
Correlation of oil prices and the US Dollar nominal effective exchange rate computed over 6-month moving windows

© RAJAT BHATIA 42
Daily Return on Crude Oil Futures & Financial Investments
Correlations between daily returns on crude oil futures and financial investments
• Oil prices are negatively correlated to the US dollar exchange rate • Oil prices have tended to move in the opposite direction of US Treasury bonds • Oil prices and the S&P 500 have tended to move together • Oil prices are positively correlated with Inflation Expectations
1 U.S. Dollar Index (DXY), which is a weighted index of a basket of currencies, per U.S. dollar. As the dollar strengthens against other currencies, the value of the index rises. 2 U.S. bonds is based on the negative of the change in yield on 30-year U.S. government bonds because as yields rise, bond prices fall. 3 Inflation Expectations are based on daily changes in the 5 year Treasury - TIPS (Treasury Inflation Protected Securities) spread.

© RAJAT BHATIA 43
Rolling Correlation between Exchange Rates and Oil Prices
Rolling correlation between exchange rates and oil prices over time
12-month rolling average correlation between the log-difference of the effective US$ exchange rate and WTI crude oil prices using daily data
from 2 January 1986 to 19 October 2012
Source: European Central Bank working paper on oil Prices, exchange rates and asset Prices by Fratzscher,
Schneider and Van Robays

© RAJAT BHATIA 44
Correlation between US$ Exchange Rates and Oil Prices
Jan 2001 - Oct 2012 Correlation = -0.729
Jan 1986 - Dec 2000 Correlation = -0.226
US Dollar exchange rates
Oil Prices Oil Prices
US Dollar exchange rates
Source: European Central Bank working paper on oil Prices, exchange rates and asset Prices by Fratzscher,
Schneider and Van Robays

© RAJAT BHATIA 45
Relationship between Oil Prices & US$ Exchange Rates
Several hypotheses have been offered that tend to support an
inverse relationship between the exchange value of the dollar relative to other currencies
and crude oil prices.

© RAJAT BHATIA 46
Reasons for Inverse Relationship
Oil benchmarks are traditionally priced in U.S. dollars. A depreciation of the dollar decreases the effective price of oil
outside the United States. This decreased cost may increase consumers' demand for oil, adding upward pressure to prices.
Reason 1
Oil benchmarks are traditionally priced
in U.S. dollars.
Depreciation in Dollar
Decreases the effective price of oil
outside the US
Increased demand for Oil
Upward pressure to prices

© RAJAT BHATIA 47
Reasons for Inverse Relationship
U.S. dollar depreciation will decrease the effective profits of non-U.S. producers, when converted into foreign currencies.
Reason 2
• To counteract this, these countries may target higher dollar prices of oil to maintain real revenue, budget levels, and purchasing power in world markets.
• Dollar depreciation also reduces the returns on dollar-denominated assets, when measured in foreign currencies, which may increase the attractiveness of foreign investing in commodities like oil.
• Commodity investment may also become more attractive to U.S. investors as a hedge against inflation if dollar depreciation tends to increase expectations of greater inflation.
Depreciation in Dollar
GBP
Yen
Rupee
When Converted to Foreign Currencies
Decreased Effective Profit

© RAJAT BHATIA 48
Reasons for Inverse Relationship
A rise in oil prices also expands the U.S. trade imbalance, which can put additional downward pressures on the dollar, again yielding a
negative correlation albeit with causation going in the reverse direction.
Reason 3
Despite these many possible explanations, the actual correlation between oil prices and exchange rates has not been stable over time, and was close to zero for more than half
of the last decade.
Rise in Oil Prices
Expands US Trade Imbalance
Downward pressure on Dollar
Note: