structure and evolution of satpura gondwana basin over ... · pdf filestructure and evolution...
TRANSCRIPT
Structure and evolution of Satpura Gondwana Basin over Central Indian Tectonic Zone: inferences from seismic and gravity data
39
Structure and evolution of Satpura Gondwana Basin over Central Indian Tectonic Zone: inferences from seismic and gravity data
Jyoti Singh1,2, K. Chandrakala1, *A.P. Singh1 and D.M. Mall1
1CSIR-National Geophysical Research Institute, Uppal Road, Hyderabad-5000072Oil and Natural Gas Corporation Ltd., Kaulagarh Road, Dehradun-248195
*Corresponding Author: [email protected]
ABSTRACTSatpura Gondwana Basin is located over the Pachmarhi plateau of Central Indian Tectonic Zone (CITZ) in central India. Its exposition at an unexpected height of 900 m above the granite-gneiss basement rocks encompassing the Pachmarhi plateau distinguishes it from other Gondwana basins of peninsular India. The complete Bouguer anomaly map of the region is characterized by a broad relative gravity low over Satpura Gondwana Basin and high over the CITZ as compared to the adjoining regions. 2½-D gravity modelling across the Satpura Basin, constrained by deep seismic sounding and available well log data, was carried out. Our study establishes more than 5 km thick Gondwana sediments deposited in a fault controlled basin and high density Palaeoproterozoic Mahakoshal belt as a horst along the Precambrian suture between the CITZ and the Bundelkhand craton. Our results also support the earlier studies that have suggested probable presence of about 5 km thick Mesoproterozoic Vindhyan sediments, believed to have been deposited on the southern margin of Bundelkhand Craton as a foreland basin during the convergence phase. Besides a high density (2.91 g/cm3) mid-crustal body, a velocity (6.50 km/s)/density (2.91 g/cm3) layer at the base of the crust and relatively lower velocity (7.9 km/s)/density (3.22 g/cm3) subcrustal mantle are also delineated beneath the region. Complex crustal structure with anomalous velocity/density layers beneath the CITZ suggests probable magmatic underplating due to Deccan volcanism. It is suggested that the Satpura Gondwana Basin, formed as drop down basin over the CITZ, could have been finally uplifted to its present height by the late Cretaceous Deccan volcanism.
INTRODUCTION
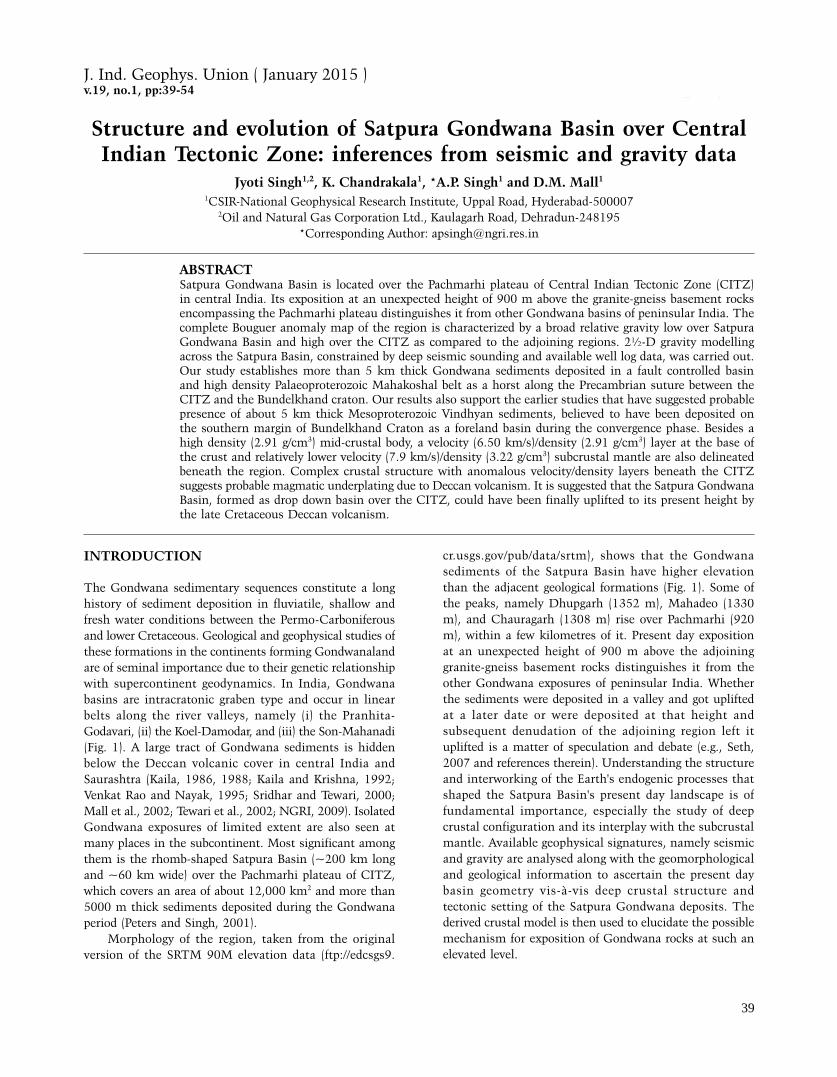
The Gondwana sedimentary sequences constitute a long history of sediment deposition in fluviatile, shallow and fresh water conditions between the Permo-Carboniferous and lower Cretaceous. Geological and geophysical studies of these formations in the continents forming Gondwanaland are of seminal importance due to their genetic relationship with supercontinent geodynamics. In India, Gondwana basins are intracratonic graben type and occur in linear belts along the river valleys, namely (i) the Pranhita-Godavari, (ii) the Koel-Damodar, and (iii) the Son-Mahanadi (Fig. 1). A large tract of Gondwana sediments is hidden below the Deccan volcanic cover in central India and Saurashtra (Kaila, 1986, 1988; Kaila and Krishna, 1992; Venkat Rao and Nayak, 1995; Sridhar and Tewari, 2000; Mall et al., 2002; Tewari et al., 2002; NGRI, 2009). Isolated Gondwana exposures of limited extent are also seen at many places in the subcontinent. Most significant among them is the rhomb-shaped Satpura Basin (~200 km long and ~60 km wide) over the Pachmarhi plateau of CITZ, which covers an area of about 12,000 km2 and more than 5000 m thick sediments deposited during the Gondwana period (Peters and Singh, 2001).
Morphology of the region, taken from the original version of the SRTM 90M elevation data (ftp://edcsgs9.
cr.usgs.gov/pub/data/srtm), shows that the Gondwana sediments of the Satpura Basin have higher elevation than the adjacent geological formations (Fig. 1). Some of the peaks, namely Dhupgarh (1352 m), Mahadeo (1330 m), and Chauragarh (1308 m) rise over Pachmarhi (920 m), within a few kilometres of it. Present day exposition at an unexpected height of 900 m above the adjoining granite-gneiss basement rocks distinguishes it from the other Gondwana exposures of peninsular India. Whether the sediments were deposited in a valley and got uplifted at a later date or were deposited at that height and subsequent denudation of the adjoining region left it uplifted is a matter of speculation and debate (e.g., Seth, 2007 and references therein). Understanding the structure and interworking of the Earth's endogenic processes that shaped the Satpura Basin's present day landscape is of fundamental importance, especially the study of deep crustal configuration and its interplay with the subcrustal mantle. Available geophysical signatures, namely seismic and gravity are analysed along with the geomorphological and geological information to ascertain the present day basin geometry vis-à-vis deep crustal structure and tectonic setting of the Satpura Gondwana deposits. The derived crustal model is then used to elucidate the possible mechanism for exposition of Gondwana rocks at such an elevated level.
J. Ind. Geophys. Union ( January 2015 )v.19, no.1, pp:39-54
Jyoti Singh, K. Chandrakala, A.P. Singh and D.M. Mall
40
GeOlOGICAl SeTTING
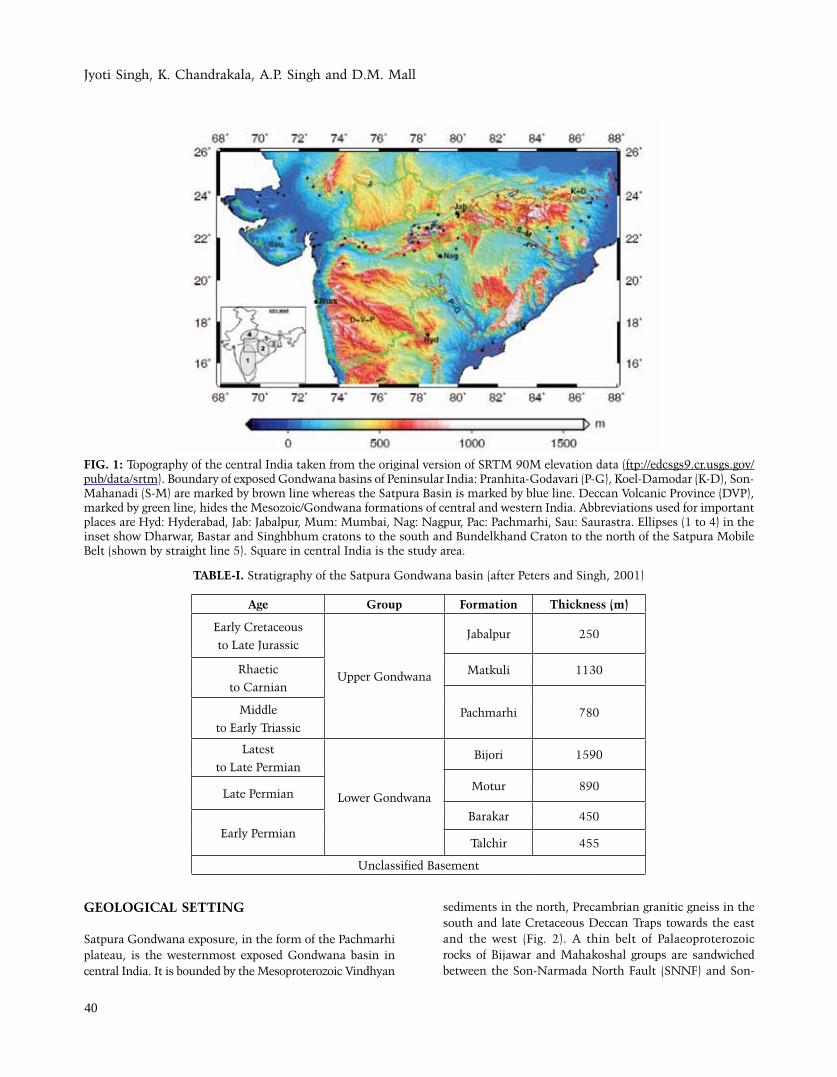
Satpura Gondwana exposure, in the form of the Pachmarhi plateau, is the westernmost exposed Gondwana basin in central India. It is bounded by the Mesoproterozoic Vindhyan
sediments in the north, Precambrian granitic gneiss in the south and late Cretaceous Deccan Traps towards the east and the west (Fig. 2). A thin belt of Palaeoproterozoic rocks of Bijawar and Mahakoshal groups are sandwiched between the Son-Narmada North Fault (SNNF) and Son-
FIG. 1: Topography of the central India taken from the original version of SRTM 90M elevation data (ftp://edcsgs9.cr.usgs.gov/pub/data/srtm). Boundary of exposed Gondwana basins of Peninsular India: Pranhita-Godavari (P-G), Koel-Damodar (K-D), Son-Mahanadi (S-M) are marked by brown line whereas the Satpura Basin is marked by blue line. Deccan Volcanic Province (DVP), marked by green line, hides the Mesozoic/Gondwana formations of central and western India. Abbreviations used for important places are Hyd: Hyderabad, Jab: Jabalpur, Mum: Mumbai, Nag: Nagpur, Pac: Pachmarhi, Sau: Saurastra. Ellipses (1 to 4) in the inset show Dharwar, Bastar and Singhbhum cratons to the south and Bundelkhand Craton to the north of the Satpura Mobile Belt (shown by straight line 5). Square in central India is the study area.
TABle-I. Stratigraphy of the Satpura Gondwana basin (after Peters and Singh, 2001)
Age Group Formation Thickness (m)
Early Cretaceous
to Late Jurassic
Upper Gondwana
Jabalpur 250
Matkuli 1130Rhaetic
to Carnian
Pachmarhi 780Middle
to Early Triassic
Latest
to Late Permian
Lower Gondwana
Bijori 1590
Motur 890Late Permian
Barakar 450Early Permian
Talchir 455
Unclassified Basement
Structure and evolution of Satpura Gondwana Basin over Central Indian Tectonic Zone: inferences from seismic and gravity data
41
Narmada South Fault (SNSF). Satpura Basin comprises thick sequence of lower and upper Gondwana sediments deposited over a Precambrian basement of schist, gneiss and granite (Table-1). The gross thickness of the lower Gondwana rocks (lower Carboniferous to upper Permian) is reported to be around 2160 m and the upper Gondwana rocks (lower Triassic to upper Cretaceous) around 3385 m thick (Shukla and Chakravorty, 1994; Peters and Singh, 2001). Many tholeiitic dyke intrusions of late Cretaceous Deccan flood basalt are exposed in and around the Satpura Basin, majority of which are aligned along the ENE-WSW
trend and represent the oldest intrusive phase. Some of the dykes are seen passing into sills and spread in the form of flows (Bhattacharji et al., 1996; Seth et al., 2009).
Tectonically, the northern and southern limits of the Satpura Basin are demarcated by ENE-WSW trending en-echelon faults, often intersected by transverse faults (Pandey and Tiwari, 1994). There are several other faults of major and minor significance in the basin, which can be grouped into ENE-WSW trending faults parallel to CITZ tectonic grain and NW-SE trending transverse faults aligned along the Dharwarian tectonic grain. Most of these faults are
FIG. 2: Generalized geology and tectonic map of central India showing location of the Satpura Gondwana Basin (marked by white line) and two DSS profiles available in this region (modified after GSI, 1998; Jain et al., 1995; Seth et al., 2009). Gravity profile A-A’, used for the 2½D crustal density modelling, is shown for its geological correlation. Pagariahat-Masod and Hirapur-Mandla DSS profiles cross the gravity profile at B and B', respectively. Abbreviations used are Pag: Pagariahat, Ind: Indore, Kha: Khandwa, Mas: Masod, Pac: Pachmarhi, Chh: Chhindwara, Hir: Hirapur, Kat: Katangi, Jab: Jabalpur, Man: Mandla, SNNF: Son-Narmada North Fault, SNSF: Son-Narmada South Fault, TF: Tapti Fault, GF: Gauligarh Fault, TS: Tan Shear, CIS: Central Indian Shear, SES: Southeast Sakoli Shear. The boreholes and shot points are marked by solid triangles and solid circles, respectively. Legends: 1- Granite, 2- Deccan traps, 3- Bijli rhyolite/Pitepani andesite, 4- Alluvium, 5- Lameta and Jabalpur formations, 6- Gondwana supergroup, 7- Vindhyan supergroup, 8- Penganga group, 9- Bijawar group, 10- Mahakoshal/Sausar group, 11- Amgaon group, 12- Unclassified Gneiss.
Jyoti Singh, K. Chandrakala, A.P. Singh and D.M. Mall
42
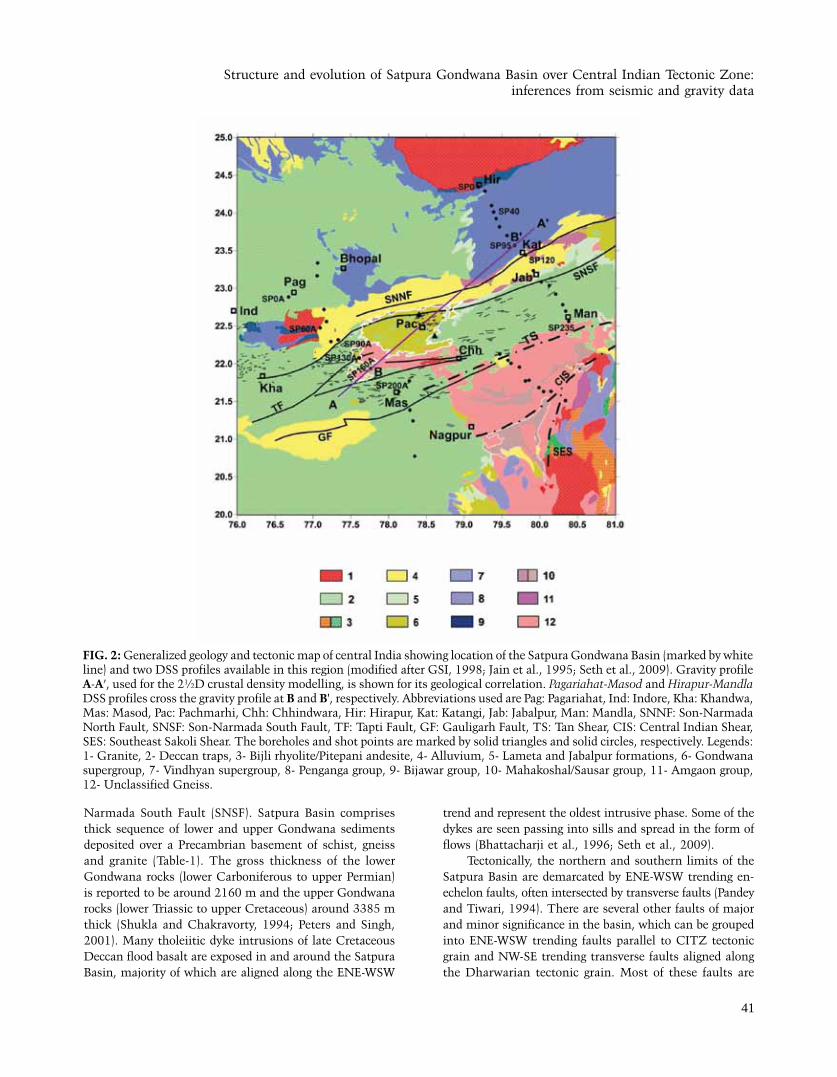
FIG. 3: Terrain corrected Bouguer anomaly map of the central India at 5 mGal interval (GMSI, 2006). 'L' and 'H' show the gravity Gravity low and high, respectively. Profile A-A’, used for the 2½D crustal density modelling, crosses the seismic profiles Pagariahat-Masod at B and Hirapur-Mandla at B'.
normal in nature; however, faults with strike slip are also reported (Shukla and Chakravorty, 1994). The CITZ is a Mesoproterozoic orogenic belt (bounded by SNNF and to the south by the Central Indian Suture) is considered to have played a significant role in development and subsequent tectonic disturbances in the region (Jain et al., 1995; Acharyya, 2003). Wide range of Vindhyan and Gondwana deposition towards the north of SNNF and south of the SNSF, respectively suggests a high magnitude activity associated with Bijawar and Mahakoshal belt both in space and time (Fig. 2) (West, 1962). Fault movements along the SNFs prevented southward extension of the Vindhyan Basin and faulting after eruption of the Deccan Traps lava might have been caused by a warping of great rigid shield of Indian peninsula (Chaube, 1972). Zones of uplift and subsidence in the area involving the crust is also supported by gravity studies (Kailasam, 1979).
Geological and geophysical evidences established CITZ, at the centre of which is located the Satpura Basin, as an orogenic belt where Bundelkhand Craton towards the north and collage of Dharwar, Bastar and Singhbhum cratons towards the south have converged and collided (Naqvi et al., 1974; Radhakrishna and Naqvi, 1986; Mishra et al., 2000; Acharyya, 2003; Naganjaneyulu and Santosh, 2010). Vindhyan sediments are believed to have been deposited on the southern margin of Bundelkhand Craton as a foreland basin abutting the CITZ (Arora et al., 2007; Raza et al., 2009; Mishra 2011). Mesoproterozoic continental collision and crustal shortening of overriding plate must have initiated Mahakoshal and Sausar orogenies in Central India vis-à-vis upliftment of the CITZ while others held Mesozoic igneous activity responsible for the lofty heights and youthful stage of the Satpura mountain ranges (Qureshy, 1971; Yedekar et al., 1990; Mishra,
Structure and evolution of Satpura Gondwana Basin over Central Indian Tectonic Zone: inferences from seismic and gravity data
43
1992). Presence of the feeder dykes for the Deccan Traps (Bahttacharji et al., 1996), the associated aeromagnetic anomalies (Gupta, 1983), magmatic intrusion at mid to lower crustal levels (Reddy et al., 1997; Mishra, 1992; Verma and Banerjee, 1992; Singh and Meissner, 1995; Singh, 1998, 2002; Pant et al., 1999; Mall et al., 1991, 2005), the high heat flow values (Ravi shanker, 1988), a number of hot springs (Krishnaswamy and Ravi Shanker, 1980), and the locus of lower crustal conductors (Arora and Reddy, 1991; Naganjaneyulu et al., 2010) testifies intense crust/mantle interaction beneath the CITZ.
NATURe OF The BOUGUeR ANOMAly
The terrain corrected Bouguer anomaly, also known as complete Bouguer anomaly, map of the region (GMSI, 2006) between Latitude 20 to 250 N and Longitude 76 to 810 E shows two prominent gravity trends that are in conformity with the structural trends of the Protocontinental blocks (Fig. 3). The most significant feature of the Bouguer anomaly map is a linear belt of relative gravity high (H1, H2, and H3) anomalies, which are aligned in ENE-WSW direction. The circular gravity highs (H1) near Khandwa attains peak value of -10 mGal against a regional background of -40 mGal. The gravity high (H3) of an amplitude -10 mGal near Jabalpur is elliptical in shape, extends over a length of nearly 250 km, with a maximum width of nearly 70 km. These two dismembered gravity highs are connected by another gravity high (H2) of an amplitude -25 mGal. These highs of Bouguer anomaly were intuitively ascribed to the basement of shallow in nature (Peter and Singh, 2001). Other possible causative features for these anomalies may be an increase in the thickness of trap or a high density intrusive within the basement (Venkat Rao and Nayak, 1995). Their association with the Satpura hills is an anomalous feature since the topographic high is normally associated with a Bouguer low due to expected isostatic compensation. Qureshy (1971) concluded that the anomaly is indicative of a horst type structure, while others associated it to the crustal upliftment caused by movement of material from the upper mantle into the crust (Mishra, 1992; Verma and Banerjee, 1992; Singh and Meissner, 1995: Singh, 1998, 2002; Pant et al., 1999).
The linear trend of gravity highs is intercepted by the Satpura Gondwana Basin gravity low (L1) of amplitude -90 mGal in the Pachmarhi area. Agarwal et al. (1995) christened the Pachmarhi low (L1) as a triple rift (Narmada-Son-Godavari) junction. They opined that the gravity low (L2) of amplitude -80 mGal is not related to the thicknesses of high density Deccan Traps basalt, Mishra et al. (1989) interpreted it as a manifestation of the subtrappean Gondwana sediments. According to Verma and Banerjee (1992) these lows perhaps represent the northward extension of Gondwana Godavari graben. Two prominent
gravity lows (L3 and L4), having an extreme value of -90 mGal each, are located over the Vindhyan sediments near Indore and Katangi, respectively. Mahakoshal belt, a Mesoproterozoic suture lying between the Vindhyan and Satpura basins, is characterized by a moderate amplitude relative gravity high. Based on deep resistivity probes, gravity modelling and seismic refraction resultant velocity-depth structure (deep seismic sounding (DSS) studies), the Mahakoshal belt is inferred to be underlain by a thick pile of high density mafic-ultramafic rocks that are bounded between two major deep seated faults (Kaila, 1988; Acharyya, 2003). Alternatively, the long linear belt of lows (L3 and L4) and highs (H1 and H3) taken together is interpreted as due to typical ancient collision zones (Arora et al., 2007). The gravity highs over an ancient collision zone are largely attributed to up-thrusted blocks during this process. Other prominent gravity anomaly low (L5) and high (H4) in this map are due to the Bundelkhand massif and sub-Vindhyan Bijawar group of rocks, respectively.
CRUSTAl DePTh DeTeCTION ACROSS The SATPURA BASIN
A southwest-northeast trending profile A-A' crossing the Satpura Gondwana Basin, Mahakoshal belt, Vindhyan Basin and associated faulted contacts (SNSF and SNNF) has been selected for 2½-D gravity modelling (Figs. 2 & 3). Such a profile has been selected particularly, as the granitic basement is either exposed or has very thin overburden on either sides of the Pachmarhi plateau and crosses the two available DSS profiles, namely Pagariahat-Masod and Hirapur-Mandla at B and B', respectively. The upper part of the model along the profile is constrained by the exposed geological formations (Fig. 2) and available bore hole litho-log information (Table-1). This allows minimum uncertainty on the geometry of the exposed sedimentary cover and depth to the upper crustal basement. To tie the deep interfaces to a unified velocity model, the refraction and wide angle reflection data of the two DSS profiles (Kaila, 1986; Kaila et al., 1989), have been reanalysed. The modified seismic depth section helped to fix the depths of various crustal layer boundaries up to the Moho at the crossing points B and B', avoiding as much as possible the non-uniqueness of gravity models.
Seismic constraint: hirapur-Mandla DSS profile
Refraction and wide angle reflection data from 16 Shot Points (SP) is available to delineate the crustal model along this profile. Most of the data were available up to a distance of 30-35 km on either side of the shot points for delineation of crystalline basement, whereas 5 shot points were recorded up to 150 km for crustal velocity structure. The original analog seismograms were analysed by Kaila et
Jyoti Singh, K. Chandrakala, A.P. Singh and D.M. Mall
44
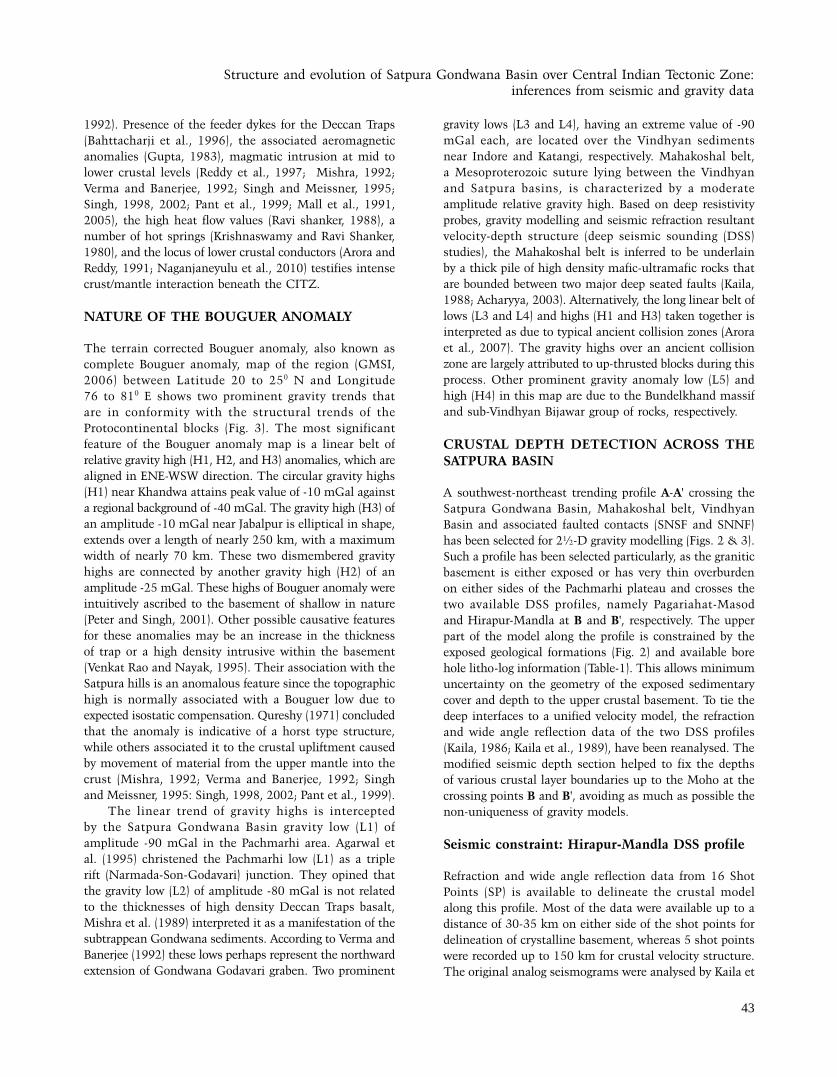
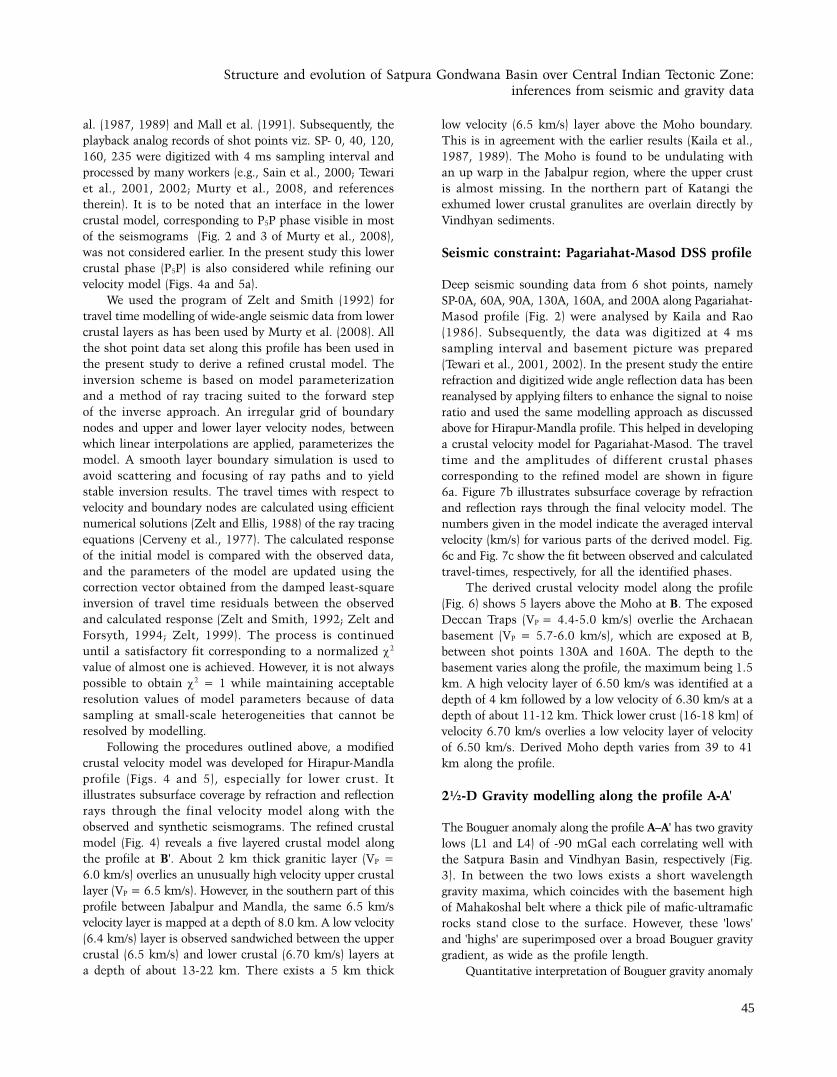
FIG. 4: Normalized record section of SP 235 of Hirapur-Mandla profile showing various reflected phases P2P, P3P, P4P, P5P, PMP from bottom of the layers L2, L3, L4, L5 and Moho respectively are shown in Panel (a). P1, P2, P3 represents the first arrival refraction data and are shown by dots. Horizontal scale is the profile distance; vertical scale is the reduced travel time with the reduction velocity of 6.0 km/s. Ray diagram of corresponding phases is shown in panel (b). Numbers given in the model indicate the laterally averaged interval velocity (km/s) for the corresponding layers and B’ is the crossing point of this profile with the selected gravity profile. Panel (c) show the velocity depth model at the location of B’.
FIG. 5: Normalized record section of SP 120 of Hirapur-Mandla profile showing various reflected phases P2P, P3P, P4P, P5P, PMP from bottom of the layers L2, L3, L4, L5 and Moho respectively are shown in Panel (a). P1, P2, P3 represents the first arrival refraction data and are shown by dots. Horizontal scale is the profile distance; vertical scale is the reduced travel time with the reduction velocity of 6.0km/s. Ray diagram of corresponding phases is shown in panel (b). Numbers given in the model indicate the laterally averaged interval velocity (km/s) for the corresponding layers and B’ is the crossing point of this profile with the selected gravity profile.
Structure and evolution of Satpura Gondwana Basin over Central Indian Tectonic Zone: inferences from seismic and gravity data
45
al. (1987, 1989) and Mall et al. (1991). Subsequently, the playback analog records of shot points viz. SP- 0, 40, 120, 160, 235 were digitized with 4 ms sampling interval and processed by many workers (e.g., Sain et al., 2000; Tewari et al., 2001, 2002; Murty et al., 2008, and references therein). It is to be noted that an interface in the lower crustal model, corresponding to P5P phase visible in most of the seismograms (Fig. 2 and 3 of Murty et al., 2008), was not considered earlier. In the present study this lower crustal phase (P5P) is also considered while refining our velocity model (Figs. 4a and 5a).
We used the program of Zelt and Smith (1992) for travel time modelling of wide-angle seismic data from lower crustal layers as has been used by Murty et al. (2008). All the shot point data set along this profile has been used in the present study to derive a refined crustal model. The inversion scheme is based on model parameterization and a method of ray tracing suited to the forward step of the inverse approach. An irregular grid of boundary nodes and upper and lower layer velocity nodes, between which linear interpolations are applied, parameterizes the model. A smooth layer boundary simulation is used to avoid scattering and focusing of ray paths and to yield stable inversion results. The travel times with respect to velocity and boundary nodes are calculated using efficient numerical solutions (Zelt and Ellis, 1988) of the ray tracing equations (Cerveny et al., 1977). The calculated response of the initial model is compared with the observed data, and the parameters of the model are updated using the correction vector obtained from the damped least-square inversion of travel time residuals between the observed and calculated response (Zelt and Smith, 1992; Zelt and Forsyth, 1994; Zelt, 1999). The process is continued until a satisfactory fit corresponding to a normalized χ2 value of almost one is achieved. However, it is not always possible to obtain χ2 = 1 while maintaining acceptable resolution values of model parameters because of data sampling at small-scale heterogeneities that cannot be resolved by modelling.
Following the procedures outlined above, a modified crustal velocity model was developed for Hirapur-Mandla profile (Figs. 4 and 5), especially for lower crust. It illustrates subsurface coverage by refraction and reflection rays through the final velocity model along with the observed and synthetic seismograms. The refined crustal model (Fig. 4) reveals a five layered crustal model along the profile at B'. About 2 km thick granitic layer (VP = 6.0 km/s) overlies an unusually high velocity upper crustal layer (VP = 6.5 km/s). However, in the southern part of this profile between Jabalpur and Mandla, the same 6.5 km/s velocity layer is mapped at a depth of 8.0 km. A low velocity (6.4 km/s) layer is observed sandwiched between the upper crustal (6.5 km/s) and lower crustal (6.70 km/s) layers at a depth of about 13-22 km. There exists a 5 km thick
low velocity (6.5 km/s) layer above the Moho boundary. This is in agreement with the earlier results (Kaila et al., 1987, 1989). The Moho is found to be undulating with an up warp in the Jabalpur region, where the upper crust is almost missing. In the northern part of Katangi the exhumed lower crustal granulites are overlain directly by Vindhyan sediments.
Seismic constraint: Pagariahat-Masod DSS profile
Deep seismic sounding data from 6 shot points, namely SP-0A, 60A, 90A, 130A, 160A, and 200A along Pagariahat-Masod profile (Fig. 2) were analysed by Kaila and Rao (1986). Subsequently, the data was digitized at 4 ms sampling interval and basement picture was prepared (Tewari et al., 2001, 2002). In the present study the entire refraction and digitized wide angle reflection data has been reanalysed by applying filters to enhance the signal to noise ratio and used the same modelling approach as discussed above for Hirapur-Mandla profile. This helped in developing a crustal velocity model for Pagariahat-Masod. The travel time and the amplitudes of different crustal phases corresponding to the refined model are shown in figure 6a. Figure 7b illustrates subsurface coverage by refraction and reflection rays through the final velocity model. The numbers given in the model indicate the averaged interval velocity (km/s) for various parts of the derived model. Fig. 6c and Fig. 7c show the fit between observed and calculated travel-times, respectively, for all the identified phases.
The derived crustal velocity model along the profile (Fig. 6) shows 5 layers above the Moho at B. The exposed Deccan Traps (VP = 4.4-5.0 km/s) overlie the Archaean basement (VP = 5.7-6.0 km/s), which are exposed at B, between shot points 130A and 160A. The depth to the basement varies along the profile, the maximum being 1.5 km. A high velocity layer of 6.50 km/s was identified at a depth of 4 km followed by a low velocity of 6.30 km/s at a depth of about 11-12 km. Thick lower crust (16-18 km) of velocity 6.70 km/s overlies a low velocity layer of velocity of 6.50 km/s. Derived Moho depth varies from 39 to 41 km along the profile.
2½-D Gravity modelling along the profile A-A'
The Bouguer anomaly along the profile A–A' has two gravity lows (L1 and L4) of -90 mGal each correlating well with the Satpura Basin and Vindhyan Basin, respectively (Fig. 3). In between the two lows exists a short wavelength gravity maxima, which coincides with the basement high of Mahakoshal belt where a thick pile of mafic-ultramafic rocks stand close to the surface. However, these 'lows' and 'highs' are superimposed over a broad Bouguer gravity gradient, as wide as the profile length.
Quantitative interpretation of Bouguer gravity anomaly
Jyoti Singh, K. Chandrakala, A.P. Singh and D.M. Mall
46
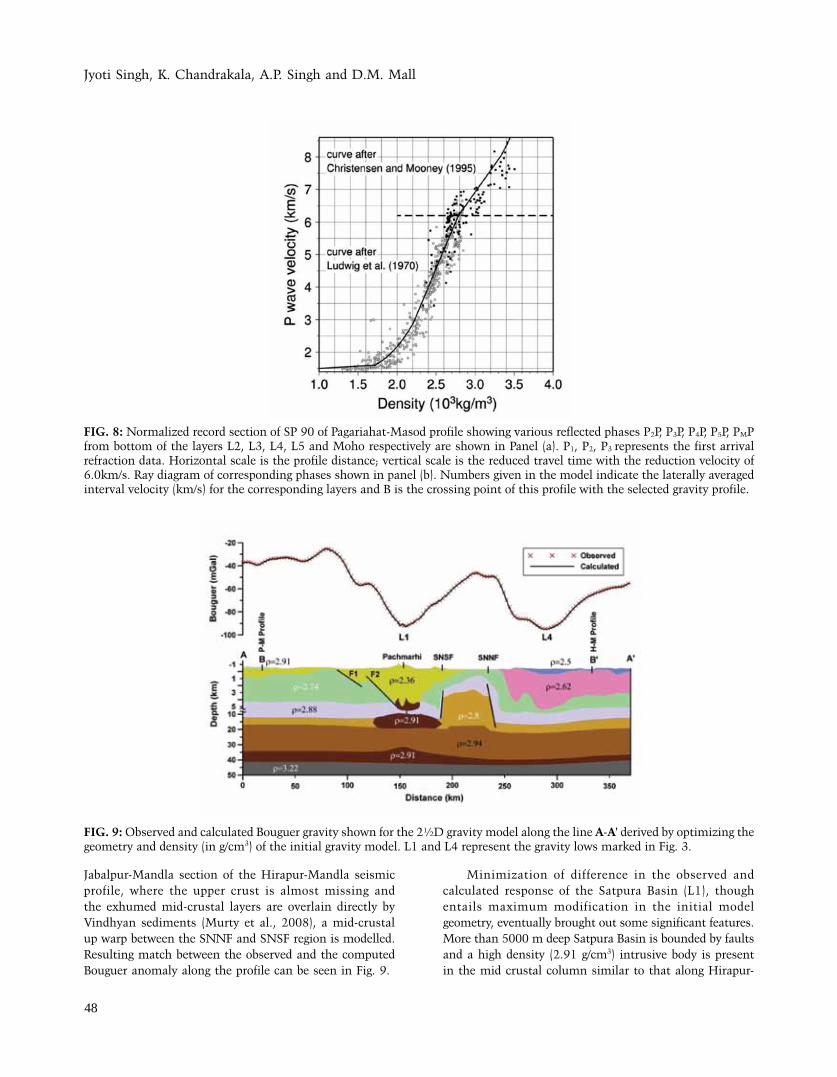
along the selected profile A-A' is reached through inserting a crustal structure well constrained at B and B' by the two reanalysed velocity models (Figs. 4, 5, 6 and7) into a 2½D forward modelling programme “GMSYS” (GEOSOFT). It allows the user to assign finite lateral boundaries to the model polygons, strike of which may or may not be orthogonal to the plane of the profile. To make the initial model geologically more acceptable geometry and bulk density of the Satpura Basin were incorporated into the model from the available isopach map from the drill hole information (Peters and Singh, 2001). Bulk density values for deeper seismic layers were obtained by converting P-wave velocities to densities using the conversion function shown in Fig. 8. The bulk density value selected initially for
the causative bodies range from 2.0 g/cm3 in the crust to 3.30 g/cm3 in the mantle. Holding the initial configuration of crustal geometry, bulk density of the individual layer was inverted within the logical limits of velocity to match the calculated values, with the observed gravity anomalies to the maximum possible extent. Density values optimised by least-squares inversion were finally taken as 2.0, 2.36, 2.50, 2.62, 2.74, 2.80, 2.88, and 2.94 g/cm3 for various crustal layers. Maintaining a compatibility with the adjoining regions a density of 2.91 g/cm3 is assigned to the layer at the base of the crust (Nageswara Rao et al., 2011). Least-square inversion of sub-crustal velocity of 7.8-7.9 km/s yields an optimal bulk density of 3.22 g/cm3 for the sub-crustal mantle, if allowed to be uniform throughout
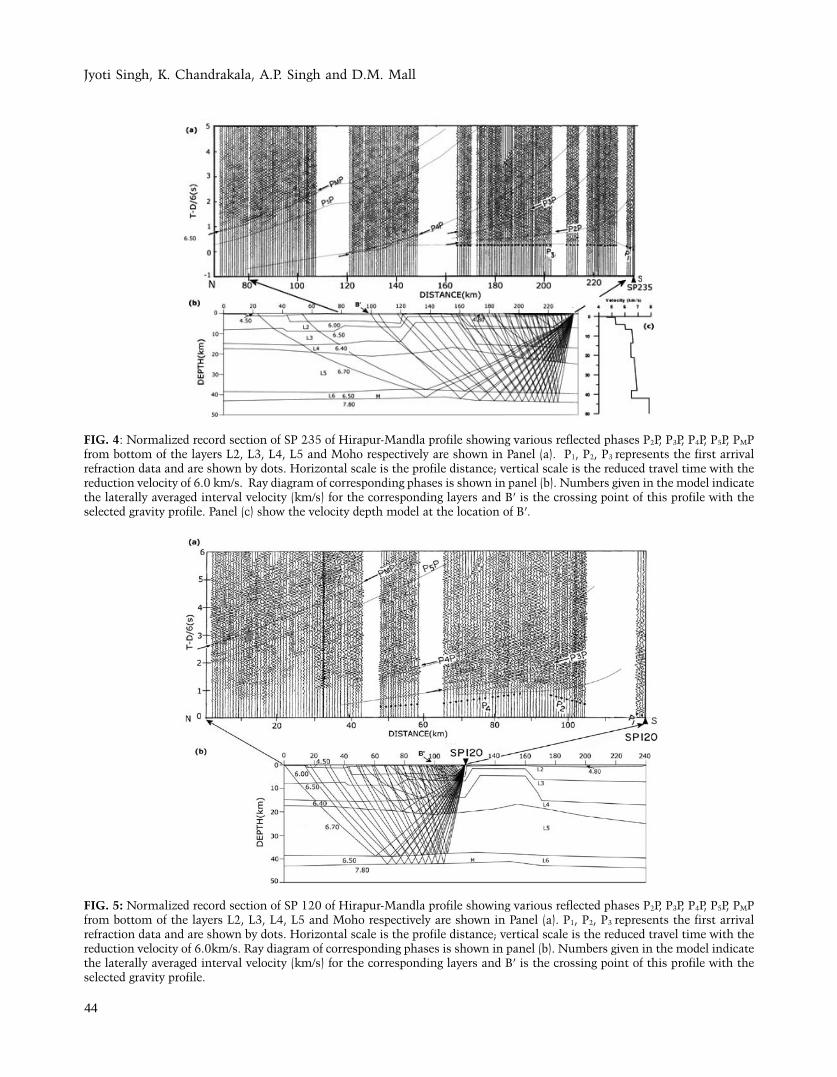
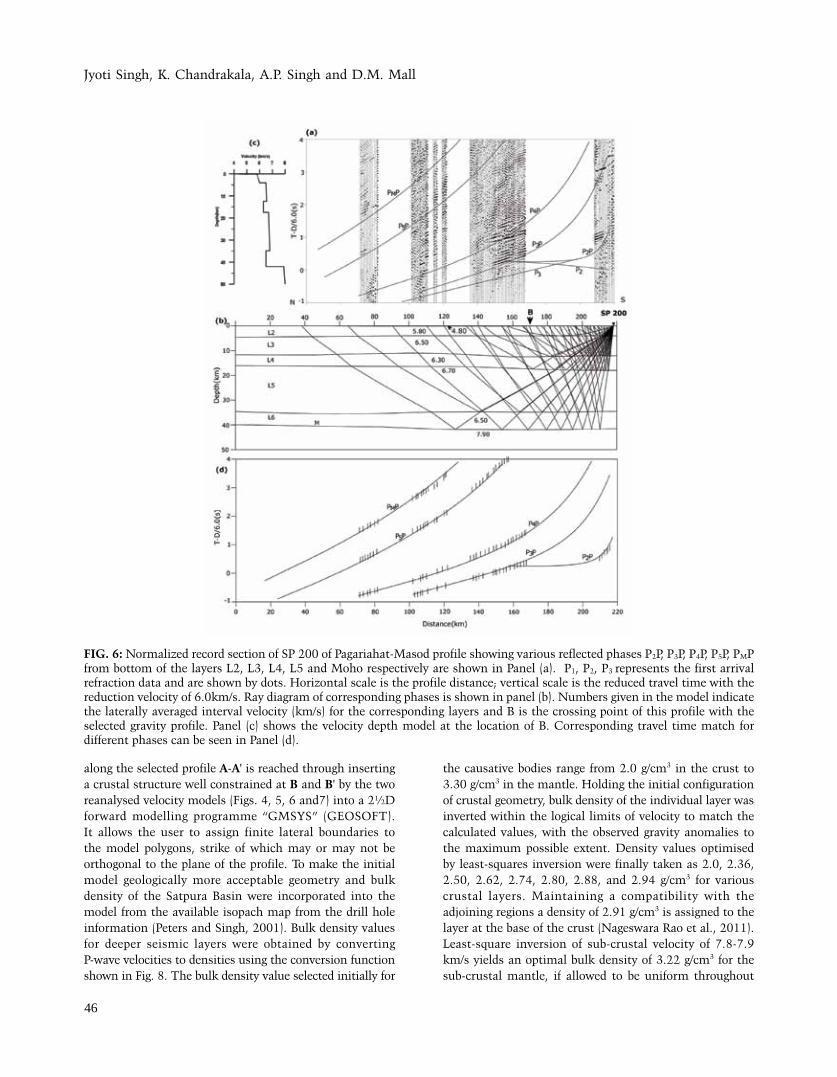
FIG. 6: Normalized record section of SP 200 of Pagariahat-Masod profile showing various reflected phases P2P, P3P, P4P, P5P, PMP from bottom of the layers L2, L3, L4, L5 and Moho respectively are shown in Panel (a). P1, P2, P3 represents the first arrival refraction data and are shown by dots. Horizontal scale is the profile distance; vertical scale is the reduced travel time with the reduction velocity of 6.0km/s. Ray diagram of corresponding phases is shown in panel (b). Numbers given in the model indicate the laterally averaged interval velocity (km/s) for the corresponding layers and B is the crossing point of this profile with the selected gravity profile. Panel (c) shows the velocity depth model at the location of B. Corresponding travel time match for different phases can be seen in Panel (d).
Structure and evolution of Satpura Gondwana Basin over Central Indian Tectonic Zone: inferences from seismic and gravity data
47
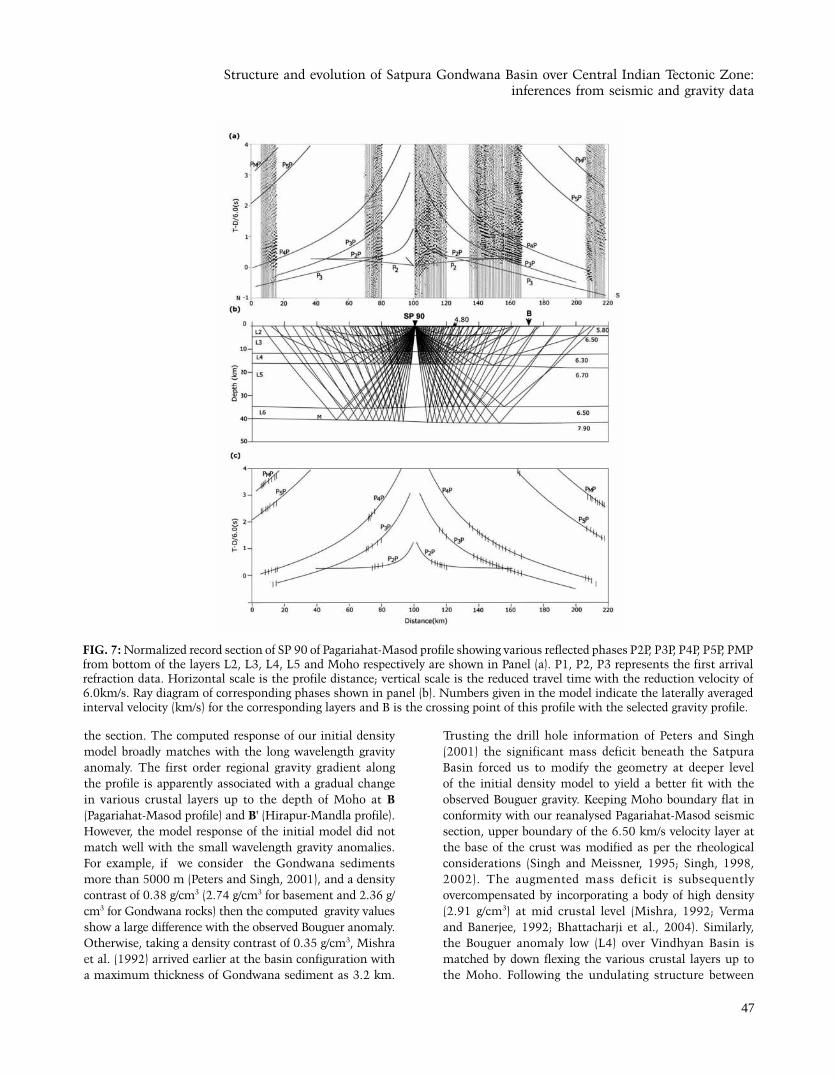
the section. The computed response of our initial density model broadly matches with the long wavelength gravity anomaly. The first order regional gravity gradient along the profile is apparently associated with a gradual change in various crustal layers up to the depth of Moho at B (Pagariahat-Masod profile) and B' (Hirapur-Mandla profile). However, the model response of the initial model did not match well with the small wavelength gravity anomalies. For example, if we consider the Gondwana sediments more than 5000 m (Peters and Singh, 2001), and a density contrast of 0.38 g/cm3 (2.74 g/cm3 for basement and 2.36 g/cm3 for Gondwana rocks) then the computed gravity values show a large difference with the observed Bouguer anomaly. Otherwise, taking a density contrast of 0.35 g/cm3, Mishra et al. (1992) arrived earlier at the basin configuration with a maximum thickness of Gondwana sediment as 3.2 km.
Trusting the drill hole information of Peters and Singh (2001) the significant mass deficit beneath the Satpura Basin forced us to modify the geometry at deeper level of the initial density model to yield a better fit with the observed Bouguer gravity. Keeping Moho boundary flat in conformity with our reanalysed Pagariahat-Masod seismic section, upper boundary of the 6.50 km/s velocity layer at the base of the crust was modified as per the rheological considerations (Singh and Meissner, 1995; Singh, 1998, 2002). The augmented mass deficit is subsequently overcompensated by incorporating a body of high density (2.91 g/cm3) at mid crustal level (Mishra, 1992; Verma and Banerjee, 1992; Bhattacharji et al., 2004). Similarly, the Bouguer anomaly low (L4) over Vindhyan Basin is matched by down flexing the various crustal layers up to the Moho. Following the undulating structure between
FIG. 7: Normalized record section of SP 90 of Pagariahat-Masod profile showing various reflected phases P2P, P3P, P4P, P5P, PMP from bottom of the layers L2, L3, L4, L5 and Moho respectively are shown in Panel (a). P1, P2, P3 represents the first arrival refraction data. Horizontal scale is the profile distance; vertical scale is the reduced travel time with the reduction velocity of 6.0km/s. Ray diagram of corresponding phases shown in panel (b). Numbers given in the model indicate the laterally averaged interval velocity (km/s) for the corresponding layers and B is the crossing point of this profile with the selected gravity profile.
Jyoti Singh, K. Chandrakala, A.P. Singh and D.M. Mall
48
Jabalpur-Mandla section of the Hirapur-Mandla seismic profile, where the upper crust is almost missing and the exhumed mid-crustal layers are overlain directly by Vindhyan sediments (Murty et al., 2008), a mid-crustal up warp between the SNNF and SNSF region is modelled. Resulting match between the observed and the computed Bouguer anomaly along the profile can be seen in Fig. 9.
Minimization of difference in the observed and calculated response of the Satpura Basin (L1), though entails maximum modification in the initial model geometry, eventually brought out some significant features. More than 5000 m deep Satpura Basin is bounded by faults and a high density (2.91 g/cm3) intrusive body is present in the mid crustal column similar to that along Hirapur-
FIG. 8: Normalized record section of SP 90 of Pagariahat-Masod profile showing various reflected phases P2P, P3P, P4P, P5P, PMP from bottom of the layers L2, L3, L4, L5 and Moho respectively are shown in Panel (a). P1, P2, P3 represents the first arrival refraction data. Horizontal scale is the profile distance; vertical scale is the reduced travel time with the reduction velocity of 6.0km/s. Ray diagram of corresponding phases shown in panel (b). Numbers given in the model indicate the laterally averaged interval velocity (km/s) for the corresponding layers and B is the crossing point of this profile with the selected gravity profile.
FIG. 9: Observed and calculated Bouguer gravity shown for the 2½D gravity model along the line A-A' derived by optimizing the geometry and density (in g/cm3) of the initial gravity model. L1 and L4 represent the gravity lows marked in Fig. 3.
Structure and evolution of Satpura Gondwana Basin over Central Indian Tectonic Zone: inferences from seismic and gravity data
49
Mandla profile (Mall et al., 1991; Mishra, 1992; Verma and Banerjee, 1992). An anomalous density (2.91 g/cm3) layer at the base of the crust and lower than the normal density (3.22 g/cm3) upper mantle beneath the region are other significant features of our derived density model, which may have a bearing on mantle and crustal dynamics.
DISCUSSION
Present 2½D gravity model across the Satpura Basin vis-à-vis junction of CITZ-Bundelkhand Craton provides a comprehensive image up to the Moho depth. Owing to the various phases visible in most of the seismograms, the reanalysed seismic sections (Figs. 4, 5, 6 and 7) and available borehole litholog (Table-1) provided vital constraint to our initial crustal density model. Emphasis was given to deeper crustal configuration that holds the key to Satpura Basin's present-day landscape. Added advantage of our 2½D gravity model is the configuration of adjoining Mahakoshal belt and Vindhyan Basin and their possible linkages to the Satpura orogeny.
Calculated response of our initial density model, well constrained by reanalysed seismic sections at B and B' led us to associate the regional gravity gradient with the gradual thickening of the various crustal layers from A to A' (Fig. 9). Gravity low L4, associated with the Vindhyan Basin, is modelled with a thicker sedimentary column (>5 km) towards the south-western part of the Vindhyan basin. The high-velocity (6.45-6.7 km/s)/density (2.74 g/cm3) layer at a depth of 2-8 km beneath the Mahakoshal belt extends from Hirapur-Mandla to Pagariahat-Masod DSS profiles and further west. This indicates the probable presence of lower crustal mafic rocks (Sain et al., 2000; Tewari et al., 2001, 2002). Moho lying at about 42 km depth beneath the B' (Hirapur-Mandla profile) flexed down to more than 43 km towards the Mahakoshal belt. It rises to about 41 km beneath the Satpura Basin and finally maintains the same depth till the end of the profile (A). A greater thickness of sedimentary columns observed under the Vindhyan Basin and a horst type structure occupied by Mahakoshal belt are not anomalous, if one assumes the Mesoproterozoic continental collision of Bundelkhand Craton with the collage of southern Indian cratons along the northern part of the CITZ (Acharyya, 2003; Arora et al., 2007; Raza et al., 2009; Naganjaneyulu and Santosh, 2010; Miahra, 2011). Dipping crustal layers in the Vindhyan Basin together with an offset in the Moho further suggest that the associated subduction was directed from the north to the south with the Vindhyan Basin formed as peripheral foreland basin abutting the CITZ.
Mesoproterozoic crustal shortening of the passive continental crust initiated a significant crustal uplift vis-à-vis small intramontane basins like Satpura Basin along the CITZ (Yedekar et al., 1990). Bouguer anomaly along the
SW-NE axis of the Satpura Basin decreases from both the ends towards the centre (L1). The derived density model clearly indicates that the basin gradually sags to more than 5000 m toward the centre and is marked by two faults F1 and F2 at its southern end (Fig. 9). These two faults (F1 and F2) together with the SNSF could have controlled the depositional history of the Satpura Gondwana sediments. According to Peters and Singh (2001) the present shape, size and disposition of the basin is a result of evolution of the basin through various tectono-sedimentation phases, which could be considered as pre-rift (development of a sag), syn-rift (creation of a rift), and post-rift. Although the mechanism of sagging is not fully understood, it is possible that such subsidence is preceded by thermal doming followed by sag or rift formation in response to subcrustal phase transformation (Biswas et al., 1993). Based on the shape of the basin, its disposition, and structural architecture, Chakraborty and Ghosh (2005) suggested it to be of pull-apart origin that developed due to sinistral strike-slip movements along a left-stepping segment of a regional wrench system defined by the SNSF and the Tapti-North faults that mark the northern and southern boundaries of the Satpura Basin, respectively. Whereas we believe that the Satpura Basin developed as a natural response to post-collisional intracontinental compressional tectonics where the sag was developed when the tips of propagating sinistral faults, SNSF in the north and Tapti-North fault in the south, met in this area. Tip of overlapping faults curves towards each other, isolating a block of crust that eventually drops into the mantle (Ben-Avraham and Schubert, 2006). Bordered by left-lateral faults often intersected by transverse faults, we refer to the sag as a “drop down” basin of Palaeozoic age. Syn-rift to post-rift phases of deposition started in early Permian and culminated in early Cretaceous with a hiatus in Jurassic. Deposition of Infra-trappean sediments was the last episode of the post-rift phase (Pandey and Tiwari, 1994). With the preserved architecture of original basin, exposition of Gondwana rocks in the form of hills in Pachmarhi area are the manifestation of post-rift upliftment of the Satpura Basin.
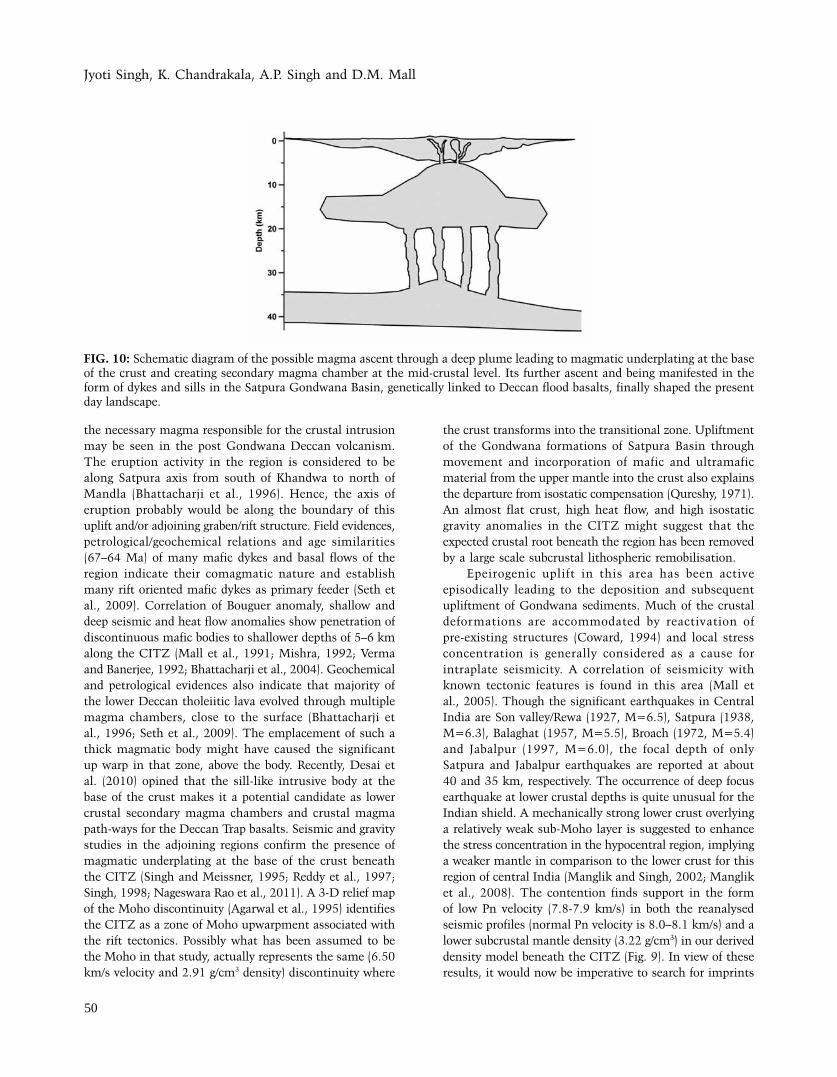
Geomorphological studies measuring the level of Deccan Traps and Gondwana junction indicate an up arching of the Pachmarhi plateau (West, 1962; Chaube, 1972). According to McKenzie (1984) intrusions in continental crust could cause epeirogenic upliftment under favourable conditions and could result in pushing the crust upward along existing faults. The uplifting processes that possibly originated through crust-mantle interaction might not be uniform, both in magnitude and also in direction of the operating forces. In the present case the vertical movement along the faults F1 and F2 caused by addition of high-density (2.91 g/cm3) magmatic material at various crustal levels has contributed to the elevated topography, south of the SNSF (Figs. 9 and 10). Genesis of
Jyoti Singh, K. Chandrakala, A.P. Singh and D.M. Mall
50
the necessary magma responsible for the crustal intrusion may be seen in the post Gondwana Deccan volcanism. The eruption activity in the region is considered to be along Satpura axis from south of Khandwa to north of Mandla (Bhattacharji et al., 1996). Hence, the axis of eruption probably would be along the boundary of this uplift and/or adjoining graben/rift structure. Field evidences, petrological/geochemical relations and age similarities (67–64 Ma) of many mafic dykes and basal flows of the region indicate their comagmatic nature and establish many rift oriented mafic dykes as primary feeder (Seth et al., 2009). Correlation of Bouguer anomaly, shallow and deep seismic and heat flow anomalies show penetration of discontinuous mafic bodies to shallower depths of 5–6 km along the CITZ (Mall et al., 1991; Mishra, 1992; Verma and Banerjee, 1992; Bhattacharji et al., 2004). Geochemical and petrological evidences also indicate that majority of the lower Deccan tholeiitic lava evolved through multiple magma chambers, close to the surface (Bhattacharji et al., 1996; Seth et al., 2009). The emplacement of such a thick magmatic body might have caused the significant up warp in that zone, above the body. Recently, Desai et al. (2010) opined that the sill-like intrusive body at the base of the crust makes it a potential candidate as lower crustal secondary magma chambers and crustal magma path-ways for the Deccan Trap basalts. Seismic and gravity studies in the adjoining regions confirm the presence of magmatic underplating at the base of the crust beneath the CITZ (Singh and Meissner, 1995; Reddy et al., 1997; Singh, 1998; Nageswara Rao et al., 2011). A 3-D relief map of the Moho discontinuity (Agarwal et al., 1995) identifies the CITZ as a zone of Moho upwarpment associated with the rift tectonics. Possibly what has been assumed to be the Moho in that study, actually represents the same (6.50 km/s velocity and 2.91 g/cm3 density) discontinuity where
the crust transforms into the transitional zone. Upliftment of the Gondwana formations of Satpura Basin through movement and incorporation of mafic and ultramafic material from the upper mantle into the crust also explains the departure from isostatic compensation (Qureshy, 1971). An almost flat crust, high heat flow, and high isostatic gravity anomalies in the CITZ might suggest that the expected crustal root beneath the region has been removed by a large scale subcrustal lithospheric remobilisation.
Epeirogenic uplift in this area has been active episodically leading to the deposition and subsequent upliftment of Gondwana sediments. Much of the crustal deformations are accommodated by reactivation of pre-existing structures (Coward, 1994) and local stress concentration is generally considered as a cause for intraplate seismicity. A correlation of seismicity with known tectonic features is found in this area (Mall et al., 2005). Though the significant earthquakes in Central India are Son valley/Rewa (1927, M=6.5), Satpura (1938, M=6.3), Balaghat (1957, M=5.5), Broach (1972, M=5.4) and Jabalpur (1997, M=6.0), the focal depth of only Satpura and Jabalpur earthquakes are reported at about 40 and 35 km, respectively. The occurrence of deep focus earthquake at lower crustal depths is quite unusual for the Indian shield. A mechanically strong lower crust overlying a relatively weak sub-Moho layer is suggested to enhance the stress concentration in the hypocentral region, implying a weaker mantle in comparison to the lower crust for this region of central India (Manglik and Singh, 2002; Manglik et al., 2008). The contention finds support in the form of low Pn velocity (7.8-7.9 km/s) in both the reanalysed seismic profiles (normal Pn velocity is 8.0–8.1 km/s) and a lower subcrustal mantle density (3.22 g/cm3) in our derived density model beneath the CITZ (Fig. 9). In view of these results, it would now be imperative to search for imprints
FIG. 10: Schematic diagram of the possible magma ascent through a deep plume leading to magmatic underplating at the base of the crust and creating secondary magma chamber at the mid-crustal level. Its further ascent and being manifested in the form of dykes and sills in the Satpura Gondwana Basin, genetically linked to Deccan flood basalts, finally shaped the present day landscape.
Structure and evolution of Satpura Gondwana Basin over Central Indian Tectonic Zone: inferences from seismic and gravity data
51
of major tectonic event that made the upper mantle comparatively weak. Chemical stratification of the Indian lithospheric mantle with the upper lithosphere (up to 80 km) comprising the spinal peridotite (of lower density) and the lower lithosphere with that of garnet peridotite composition (of higher density) may be a distinct possibility (Jagadeesh and Rai, 2008). Loss of the crustal root into the mantle and subcrustal lithospheric remobilisation would be an alternative explanation (Singh et al., 2006).
CONClUSIONS
On the basis of above discussions it may be surmised that the CITZ is an imprint of Mesoproterozoic orogeny in central India when northern Bundelkhand Craton collided with a collage of South Indian cratons. During the last stage of the Satpura orogeny tips of the SNSF and Tapti fault met in Pachmarhi area isolating a block of crust that eventually dropped into the mantle. Lower Carboniferous to upper Cretaceous Gondwana sediments were deposited within the present boundaries of this dropped down Satpura Basin. Subsequently, it uplifted over and above the normal elevation of CITZ orogeny. The Deccan Trap activity was one of the most influencing factors for elevated Gondwana sediments. The region is active even today as is evidenced by recent seismic activity.
ACKNOwleDGeMeNTS
Authors thank the Director, NGRI, Hyderabad for his encouragement and permission to publish this work. Thanks are also due to Dr. D.C. Mishra and two anonymous reviewers for their critical and constructive suggestions which improved the manuscript considerably. KC thanks DST for the financial support and DMM thanks CSIR for Emeritus Scientist position. This study was performed as a part of INDEX project of CSIR-National Geophysical Research Institute. Figure (1) was generated with the Generic Mapping Tools software (Wessel and Smith, 1991).
ReFeReNCeS
Acharyya, S.K., 2003. The nature of Mesoproterozoic Central
Indian Tectonic Zone with exhumed and reworked older
granulites, Gondwana Research, v.6, no.2, pp:197-214.
Acharyya, S.K., and Roy, A., 2000. Tectonothermal history of the
Central Indian Tectonic Zone and reactivation of major
fault/shear zones, Journal of the Geological Society of India,
v.55, pp:239-256.
Agarwal, B.N.P., Das, L.K., Chakravorty, K., and Sivaji, Ch.,
1995. Analysis of the Bouguer anomaly over central India:
a regional perspective, In: Sinha-Roy, S. and Gupta, K.R.
(Eds.), Continental Crust of Northwestern and Central
India, Geological Society of India Memoir, v.31, pp:37-61.
Arora, K., Rajasekhar, R.P., and Mishra, D.C., 2007. Density
models of the crust under the Dharwar granite-greenstone
terrain and the Satpura Mobile belt: Archaean-Proterozoic
analogue of Plate tectonics, International Association of
Gondwana Research Memoir, v.10, pp:217-225.
Ben-Avraham, Z., and Schubert, G., 2006. Deep "drop down"
basin in the southern Dead Sea, Earth and Planetary Science
Letters, v.251, pp:254-263.
Bhattacharji, S., Chatterjee, N., Wampler, J.M., Nayak, P.N., and
Deshmukh, S.S., 1996. Indian intraplate and continental
margin rifting, lithospheric extension, and mantle up welling
in Deccan flood basalt volcanism near the K/T boundary:
evidence from mafic dike swarms, Journal of Geology, v.104,
pp:379-398.
Bhattacharji, S., Sharma, R., and Chatterjee, N., 2004. Two-
and three-dimensional gravity modeling along western
continental margin and intra-plate Narmada-Tapti rifts: Its
relevance to Deccan flood basalt volcanism, Proceedings
Indian Academy of Sciences (Earth Planetary Sciences),
v.113, pp:771-784.
Bhowmik, S.K., Pal, T., Roy, A., and Pant, N.C., 1999. Evidence
for Pre-Grenvillian high-pressure granulite metamorphism
from the northern margin of the Sausar mobile belt in
central India, Journal of the Geological Society of India,
v.53, pp:385-399.
Biswas, S.K., Ram, J., and Bhasin, A.L., 1993. Classification of
Indian sedimentary basins in the framework of plate tectonics,
Proceeding of Second Seminar on Petroliferous Basins of India
v.1, Indian Petroleum Publishers, Dehradun, India.
Cerveny, V., Moltkov, I.A., and Psencik, I., 1977. Ray method in
seismology, Univerzita, Karlova, Prague, pp:1-214.
Chakraborty, C., and Ghosh, S.K., 2005. Pull-apart origin of the
Satpura Gondwana basin, central India, Journal of Earth
System Science, v.114,no.3, pp:259–273.
Chaube, V.D., 1972. Pre-Deccan Trap topography in Central India
and crustal warping in relation to Narmada rift structure and
volcanic activity, Bulletin of Volcanology, v.35, pp:660-685.
Christensen, N.I., and Mooney, W.D., 1995. Seismic velocity
structure and composition of the continental crust: a
global view, Journal of Geophysical Research, v.100, no.B6,
pp:9761-9788.
Coward, M., 1994. Inversion tectonics, In: Hancock, P.L. (Ed.),
Continental Deformation, Pergamon Press, pp:289-304.
Desai, A.G., Peinado, M., Gokarn, S.G., and Downes, H., 2010.
Structure of the deep crust beneath the Central Indian
Tectonic Zone: an integration of geophysical and xenoliths
data, Gondwana Research, v.17, pp:162-170.
GEOSOFT: The core software platform for working with large
volume gravity and magnetic spatial data. Geosoft Inc.,
Toronto, Canada.
GSI, 1998. Geological Map of India on 1: 2,000,000 scale,
Geological Survey of India Publication, Kolkata, India.
Jagadeesh, S., and Rai, S.S., 2008. Thickness, composition and
Jyoti Singh, K. Chandrakala, A.P. Singh and D.M. Mall
52
evolution of the Indian Precambrian crust inferred from
broadband seismological measurements, Precambrian
Research, v.162, no.1-2, pp:4-15.
Jain, S.C, Nair, K.K.K., and Yedekar, D.B., 1995. Geology of the
Son-Narmada-Tapti lineament zone, central India, In:
Geoscientific studies of the Son-Narmada-Tapti lineament
zone: Project CRUMANSONATA, Geological Survey of India
Spl. Pub., v.10, pp:1-154.
Kaila, K.L., 1986. Tectonic framework of Narmada-Son lineament-
a continental rift system in central India from deep seismic
soundings, In: Barazangi, M., Brown, L. (Eds.), Reflection
Seismology: a global perspective, Geodynamic Series of
American Geophysical Union, v.13, pp:133-150.
Kaila, K.L., 1988. Mapping the thickness of Deccan Trap flows
in India from DSS studies and inferences about a hidden
Mesozoic basin in the Narmada-Tapti region, In: Subba Rao,
K.V. (Ed.), Deccan flood basalts, Geological Society of India
Memoir, v.10, pp:91–116.
Kaila, K.L., and Krishna, V.G., 1992. Deep seismic sounding
studies in India and major discoveries, Current Science,
v.62, no.1&2, pp:117-154.
Kaila, K.L., and Rao, P.K., 1986. Crustal structure along Khajuria
Kalan-Rahatgaon-Betul, Multai-Pulgaon profile across
Narmada-Son lineament from deep seismic soundings, In:
Kaila K.L. and Tewari, H.C. (Eds.), Deep Seismic Soundings
and Crustal Tectonics, AEG Publications, Hyderabad, India,
pp:43-59.
Kaila, K.L., Murty, P.R.K., Mall, D.M., Dixit, M.M. and Sarkar, D.,
1987. Deep seismic soundings along Hirapur-Mandla profile,
central India, Geophysical Journal of the Royal Astronomical
Society, v.89, pp:399-404.
Kaila, K.L., Murty, P.R.K., and Mall, D.M., 1989. The evolution
of Vindhyan basin vis-à-vis the Narmada-Son lineament,
Central India, from deep seismic soundings, Tectonophysics,
v.162, pp:277-289.
Kailasam, L.N., 1979. Plateau uplift in peninsular India,
Tectonophysics, v.61, pp:243-269.
Ludwig, W.J., Nafe, J.E., and Drake, C.L., 1970. Seismic refraction.
In: Maxwell, A.E. (Ed.), The Sea, Wiley-Interscience, New
York, pp:53-84.
Mall, D.M., Kaila, K.L., and Rao, V. K., 1991. Magmatic body
interpreted at Mid-crustal level between Jabalpur and
Mandla as an indicator for one of the source regions for
Deccan Basalt, In: Proc. 1st Int. Symposium and Exhibition
on “Exploration Geophysics in Nineteen Nineties”, AEG,
Hyderabad, Nov, pp: 25-30.
Mall, D.M., Sarkar D. and Reddy, P.R., 2002. Seismic signature of
subtrappean Gondwana basin in Central India, Gondwana
Research, v.5, no.3, pp:613-618.
Mall, D.M., Singh, A.P., and Sarkar, D., 2005. Structure and
seismotectonics of Satpura, Central India, Current Science,
v.88, pp:1621-1627.
Manglik, A., and Singh, R.N., 2002. Thermomechanical structures
of the central Indian shield: constraints from deep crustal
seismicity, Current Science, v.82, pp:1151-1157.
Manglik, A., Thiagarajan, S., Mikhailova, A.V., and Yu Rebetsky,
2008. Finite element modelling of elastic intraplate stresses
due to heterogeneities in crustal density and mechanical
properties for the Jabalpur earthquake region, central India,
Journal of Earth System Science, v.117, no.2, pp:103–111.
McKenzie, D.P., 1984. The generation and compaction of partially
molten rocks, Nature, v.307, pp:616-618.
Mishra, D.C., 1992. Mid continental gravity "high" of central
India and Gondwana tectonics, Tectonophysics, v.212,
pp:153-161.
Mishra, D.C., 2011. Long hiatus in Proterozoic sedimentation
in India: Vindhyan, Cuddapah and Pakhal basins - a plate
tectonic model, Journal of the Geological Society of India,
v.77, pp:17-25.
Mishra, D.C., Gupta, S.B., and Venkatrayudu, M., 1989. Godavari
rift and its extension towards east coast of India, Earth and
Planetary Science Letters, v.94, pp:344–352.
Mishra, D.C., Venkatrayudu, M., and Laxman, G., 1992.
3-Dimensional basement relief model of Satpura basin
in Central India, Journal of Association of Exploration
Geophysicists, v.13, no.2, pp:63-69.
Murty, A.S.N., Sain, K., Tewari, H.C., and Prasad, B.R., 2008.
Crustal velocity inhomogeneities along the Hirapur-Mandla
profile, central India and its tectonic implications, Journal
of Asian Earth Sciences, v.31, pp:533-545.
Naganjaneyulu, K., and Santosh, M., 2010. The Central Indian
Tectonic Zone: a geophysical perspective on continental
amalgamation along a Mesoproterozoic suture, Gondwana
Research, v.18, pp:547-564.
Nageswara Rao, B., Niraj Kumar, Singh, A.P., Rao, M.R.K.P., Mall,
D.M., and Singh, B., 2011. Crustal density Structure across
the Central Indian Shear Zone from Gravity data, Journal
of Asian Earth Sciences, v.42, no.3, pp:341-353.
Naqvi, S.M., Divakara Rao, V., and Hari Narain, 1974. The
protocontinental growth of the Indian shield and the
antiquity of its rift valleys, Precambrian Research, v.1,
pp:645-698.
NGRI, 2009. Integrated Geophysical Studies for Hydrocarbon
Exploration in Eastern Part of the Deccan Syneclise,
Technical Report No. NGRI-2009-EXP-679 (Restricted).
Pande, D.K., and Tiwari, S., 1994. Transfer zone structural style
in Gondwana grabens and its implications in hydrocarbon
exploration. In: Biswas, S.K. (Ed.), Proceeding of Second
Seminar on Petroliferous Basins of India, v.3, pp:101-104.
Pant P.R., and others 1999. Significant inferences on deep crustal
structure of Deccan Trap region from spectral analysis of
Bouguer anomalies, Journal of the Geological Society of
India, v.53, pp:315–328.
Peters, J., and Singh, S.K., 2001. Satpura basin- an example of pre-
rift, syn-rift and post-rift Gondwana sedimentation in India,
Journal of the Geological Society of India, v.57, pp:309-320.
Qureshy, M.N., 1971. Relation of gravity to elevation and
rejuvenation of blocks in India, Journal of Geophysical
Structure and evolution of Satpura Gondwana Basin over Central Indian Tectonic Zone: inferences from seismic and gravity data
53
Research, v.76, pp:545-557.
Radhakrishna, B.P., and Naqvi, S.M., 1986. Precambrian
continental crust of India and its evolution, Journal of
Geology, v.94, pp:145-166.
Rajendran, K., and Rajendran, C.P., 1998. Characteristics of
the 1997 Jabalpur earthquake and their bearing on its
mechanism, Current Science, v.74, pp:168-174.
Rao, N.P., Tsukuda, T., Kosuga, M., Bhatia, S.C., and Suresh,
G., 2002. Deep lower crustal earthquakes in central India:
inferences from analysis of regional broadband data of the
1997 May, 21, Jabalpur earthquake, Geophysical Journal
International, v.148, pp:1-12.
Raza, M., Khan, A., and Khan, M.S., 2009. Origin of Late
Palaeoproterozoic Great Vindhyan basin of North Indian
shield: Geochemical evidence from mafic volcanic rocks,
Journal of Asian Earth Sciences, v.34, pp:716–730.
Reddy, P.R., Mall, D.M., and Prasad., A.S.S.S.R.S. 1997.
Subhorizontal layering the lower crust and its tectonic
significance in the Narmada-Son-Region, India, Pure and
Applied Geophysics, v.149, pp:525-540.
GMSI, 2006. Gravity Map Series of India-2006, GSI and NGRI
publication, Hyderabad, India.
Sain, K., Bruguie, N., Murty, A.S.N., and Reddy, P.R., 2000.
Shallow velocity structure along the Hirapur-Mandla profile
using traveltime inversion of wide-angle seismic data and
its tectonic implications, Geophysical Journal International,
v.142, pp:165-184.
Seth, H., 2007. Plume-related regional prevolcanic uplift in the
Deccan Traps: absence of evidence, evidence of absence,
Geological Society of America Spl. Papers, v.430, pp:785-
813.
Seth, H., Ray, J.S., Ray, R., Vanderkluysen, L., Mahoney, J.J., Kumar,
A., Shukla, A.D., Das, P., Adhikari, S., and Jana, B., 2009.
Geology and geochemistry of Pachmarhi dykes and sills,
Satpura Gondwana Basin, central India: problems of dyke-
sill-flow correlations in the Deccan Traps, Contributions to
Mineralogy and Petrology, v.158, pp:357–380.
Sharma, S.R., Rao, V.K., Mall, D.M., and Gowd, T.N., 2005.
Geothermal structure in an seismoactive region of Central
India, Pure and Applied Geophysics, v.162, pp:129-144.
Shukla, S.N., and Chakravorty, D., 1994. Status of exploration and
future Programs of Hydrocarbon exploration in Vindhyan
and Gondwana Basins, In: Biswas, S.K. (Ed.), Proceeding
of Second Seminar on Petroliferous Basins of India, v.3,
pp:63-100.
Singh, A.P., 1998. 3-D structure and geodynamic evolution of
accreted igneous layer in the Narmada-Tapti region (India),
Journal of Geodynamics, v.25, pp:129-141.
Singh, A.P., 2002. Impact of Deccan volcanism on deep crustal
structure along western part of Indian mainland and
adjoining Arabian Sea, Current Science, v.82, no.3, pp:316-
325.
Singh, A.P., and Meissner, R., 1995. Crustal configuration of the
Narmada-Tapti region (India) from gravity studies, Journal
of Geodynamics, v.20, pp:111-127.
Sridhar A.R., and Tewari, H.C., 2000. Existence of a sedimentary
graben in the western part of Narmada-zone: seismic
evidence, Journal of Geodynamics, v.31, pp:19-31.
Tewari, H.C., Murty, A.S.N., Prakash Kumar, and Sridhar, A.R.,
2001. A tectonic model of the Narmada region, Current
Science, v.80, pp:873-878.
Tewari, H.C., Krishna, V.G., Dixit, M.M., Mall, D.M., Murty,
A.S.N., Prakash Kumar, Sridhar, A.R., and Rao, G.S.P., 2002.
Seismic structure of the crust and sub-crustal lithosphere
across the Narmada Son zone, Project report No. NGRI-
2002/lithos-352.
Venkat Rao, K. and Nayak, P.N., 1995. Geophysical studies in
Narmada-Tapti valleys, Malwa plateau, and Satpura region,
central India, under 'Project CRUMANSONATA', Geological
Survey of India Spl. Pub., v.10, pp:155-180.
Verma, R.K., and Banerjee, P., 1992. Nature of the continental
crust along the Narmada-Son lineament inferred from
gravity and deep seismic sounding, Tectonophysics, v.202,
pp:375-397.
Wessel, P., and Smith, W.H.F., 1991. Free software helps
map and display data, EOS Trans AGU 72(41), 441,
doi:10.1029/90EO00319.
West, W.D., 1962. The line of Narmada-Son valley, Current
Science, v.31, pp:143-144.
Yedekar, D.B., Jain, S.C., Nair, K.K.K., and Dutta, K.K., 1990. The
Central Indian collision suture, Geological Survey of India
Spl. Pub., v.28, pp:1-37.
Zelt, C.A., 1999. Modeling strategies and model assessment for
wide-angle seismic travel time data, Geophysical Journal
International, v.139, pp:183–204.
Zelt, C.A., and Ellis, R.M., 1988. Practical and efficient ray
tracing in two dimensional media for rapid travel time
and amplitude forward modeling, Canadian Journal of
Exploration Geophysics, v.24, pp:16–31.
Zelt, C.A., and Smith, R.B., 1992. Seismic travel time inversion
for 2-D crustal velocity structure, Geophysical Journal
International, v.108, pp:16-34.
Zelt, C.A., and Forsyth, D.A., 1994. Modeling wide-angle seismic
data for crustal structure: Southern Grenville province,
Journal of Geophysical Research, v.99, no.B6, pp:11687–
11704.
Jyoti Singh, K. Chandrakala, A.P. Singh and D.M. Mall
54
Ms. Jyoti Singh received her M.Sc. (Tech) degree from Banaras Hindu University, Vararanasi. She joined CSIR-National Geophysical Research Institute, Hyderabad as a CSIR-Junior Research Fellow with Ph.D. registration in Academy of Scientific and Innovative Research (AcSIR)-NGRI. Currently she is working as Geophysicists in Oil and Natural Gas Corporation Ltd., Dehradun.
Dr. K. Chandrakala is presently working under the DST Woman Scientist Scheme in CSS Project of CSIR-National Geophysical Research Institute, Hyderabad. She has reprocessed the Kavali-Udipi DSS profile and worked with other scientists of CSS group of CSIR-NGRI in delineating the crustal structure of DharwarCraton, Cuddapah Basin and Eastern Ghats Mobile Belt. Her research work includes seismic data processing, interpretation and understanding the tectonics. She published several papers in national and international journals.
Dr. A.P. Singh received M.Sc. (Tech) degree from Banaras Hindu University, Varanasi and Ph.D. degree from Osmania University, Hyderabad. He is currently working as Sr. Principal Scientist, CSIR-National Geophysical Research Institute and Professor, Academy of Scientific and Innovative Research (AcSIR)-NGRI, Hyderabad. His research interest includes delineation of lithospheric structure of the Indian shield applying Geoid, Gravity and Magnetic data for understanding the tectonic history of the earth’s processes. He is the Young Scientist Awardees of the A.P. Academy of Sciences for his contributions to the field of applied geophysics.
Dr. D.M. Mall joined CSIR-National Geophysical Research Institute completing M.Sc. degree in Geophysics from Banaras Hindu University in 1972. Worked in coal exploration for a brief period of one year (1981-82) at Central Mine Planning and Design Institute, Ranchi.Pursued Deep Seismic Sounding studies in different geological provinces of India, while working at CSIR-NGRI, Hyderabad.Worked as CSIR-Emeritus Scientist at NGRI from 2009-2013 after superannuation from CSIR-NGRI.