geology and geochemistry of pachmarhi dykes and … · geology and geochemistry of pachmarhi dykes...
TRANSCRIPT
ORIGINAL PAPER
Geology and geochemistry of Pachmarhi dykes and sills, SatpuraGondwana Basin, central India: problems of dyke-sill-flowcorrelations in the Deccan Traps
Hetu C. Sheth Æ Jyotiranjan S. Ray Æ Ranjini Ray Æ Loyc Vanderkluysen ÆJohn J. Mahoney Æ Alok Kumar Æ Anil D. Shukla Æ Partha Das ÆSubhrashis Adhikari Æ Bikashkali Jana
Received: 8 September 2008 / Accepted: 22 January 2009
� Springer-Verlag 2009
Abstract Many tholeiitic dyke-sill intrusions of the Late
Cretaceous Deccan Traps continental flood basalt province
are exposed in the Satpura Gondwana Basin around
Pachmarhi, central India. We present field, petrographic,
major and trace element, and Sr–Nd–Pb isotope data on
these intrusions and identify individual dykes and sills that
chemically closely match several stratigraphically defined
formations in the southwestern Deccan (Western Ghats).
Some of these formations have also been identified more
recently in the northern and northeastern Deccan. How-
ever, the Pachmarhi intrusions are significantly more
evolved (lower Mg numbers and higher TiO2 contents)
than many Deccan basalts, with isotopic signatures gen-
erally different from those of the chemically similar lava
formations, indicating that most are not feeders to previ-
ously characterized flows. They appear to be products of
mixing between Deccan basalt magmas and partial melts of
Precambrian Indian amphibolites, as proposed previously
for several Deccan basalt lavas of the lower Western Ghats
stratigraphy. Broad chemical and isotopic similarities of
several Pachmarhi intrusions to the northern and north-
eastern Deccan lavas indicate petrogenetic relationships.
Distances these lava flows would have had to cover, if they
originated in the Pachmarhi area, range from 150 to
350 km. The Pachmarhi data enlarge the hitherto known
chemical and isotopic range of the Deccan flood basalt
magmas. This study highlights the problems and ambigu-
ities in dyke-sill-flow correlations even with extensive
geochemical fingerprinting.
Keywords Volcanism � Continental flood basalt �Dyke swarm � Deccan Traps � Gondwana
Introduction
The *66-million-year-old Deccan Traps continental flood
basalt (CFB) province (Fig. 1), with a present-day extent of
500,000 km2, has been studied extensively in terms of
geochemistry, palaeomagnetism, and lava stratigraphy. The
basalt pile is best developed in the Western Ghats region in
the southwestern part of the province, where it has been
divided into three subgroups and 11 formations with a
maximum stratigraphic thickness of *3.4 km (e.g. Cox
and Hawkesworth 1985; Beane et al. 1986; Khadri et al.
1988; Subbarao et al. 1988; Lightfoot et al. 1990)
(Table 1). Arguably, the Deccan lava flows were largely
fed by dykes in swarms, as shown, for example, for the
Columbia River CFB province (e.g. Swanson et al. 1975).
The feeder dykes may be identified with combined field,
petrographic, geochemical (major and trace element and
isotopic) and magnetic polarity studies of individual dyke
swarms, followed by statistical comparisons of the geo-
chemical data to well-characterized lava packages (e.g.
Bondre et al. 2006; Vanderkluysen et al. 2006).
Communicated by T. L. Grove.
H. C. Sheth (&) � R. Ray � P. Das � S. Adhikari � B. Jana
Department of Earth Sciences, Indian Institute of Technology
Bombay (IITB), Powai, Mumbai 400076, India
e-mail: [email protected]
J. S. Ray � A. Kumar � A. D. Shukla
Planetary and Geosciences Division, Physical Research
Laboratory (PRL), Navrangpura, Ahmedabad 380009, India
L. Vanderkluysen � J. J. Mahoney
Department of Geology and Geophysics, School of Ocean and
Earth Science and Technology (SOEST), University of Hawaii,
Honolulu, HI 96822, USA
123
Contrib Mineral Petrol
DOI 10.1007/s00410-009-0387-4
The Deccan province has three major zones of well
developed mafic dyke swarms (Fig. 1) (Auden 1949;
Deshmukh and Sehgal 1988). One is the region of the
Narmada and Tapi River valleys with the Satpura
Mountain Range in between, containing many hundreds
of tholeiitic and alkalic dykes with a general ENE-WSW
strike (e.g. Bhattacharji et al. 1996, 2004; Melluso et al.
1999; Ray et al. 2007). The second major zone of dykes
is the Konkan coastal plain, between the Arabian Sea to
the west and the Western Ghats escarpment to the east.
Here too tholeiitic and alkalic dykes are abundant, and
have a general NNW-SSE strike, parallel to the western
Indian rifted margin (e.g. Viswanathan and Chandrase-
kharam 1976; Sheth 1998). The third important zone of
dykes is the region in the Western Ghats northeast of
Mumbai. The almost exclusively tholeiitic dykes here do
not, as a group, show a strong preferred orientation as in
the other two areas (Beane et al. 1986), and yet, indi-
vidual swarms in this large region do show preferred
orientations, and probably fed some of the younger
Tamia
Matkuli
ChiloundJhirpa Anhoni
Devkhoh
Kandadhana
1119
Chhindwara 35 km
Mahulijir 464
455
674604
652Satdhara
Singanama
510,11,12
8,94
7
3
875
1
2
13
15
14
16
PMS1
PMS2
TAMIA SCARP
PACHMARHI
SCARP
Denwa gorge
Denwa River
78o 15' 78o 30' 78o 45'
22o 25'
22o 35'
22o 30'
22o 40'
22o 45'
22o 20'
Chakhla-Delakhari sill not mapped further west
saucer-shaped sill
Bijori Fm. (Late Permian)
Pachmarhi Fm. (Early Triassic)
Denwa Fm. (Late Lower & Middle Triassic)
Bagra Fm. (Jurassic)
Alluvium (Quaternary-Recent)
Talchir Fm. (Permian)
Precambrianbasement
Deccan dykes and sills
Deccan lavas (Late Cretaceous)
16o
20o
72o80o
Jabalpur
ARABIAN SEA 200 km
Mhow
ToranmalChikaldara
Mahabaleshwar
Saurashtra
Igatpuri
Sagar
Western Ghats
Mumbai
Kachchh
Pavagadh
MalwaPlateau
Nagpur
ChhindwaraPachmarhi
Mandla Lobe
DeccanPlateau
Dudhi River
Barwani
Low
er
Gon
dwan
aU
pper
G
ondw
ana
DhuleNandurbar
Sangamner
INDIA
5 km
521
623
6
695
883
886706
Banjarigurhi
UmariaBori
Denwa River
924
Pipardhar
Chakhla
400
608
547451
613Amadeh
506
Chakhla-Delakharisill
PIPARIYA
Sitadongri
Delakhari
498
9481041
1128
Bariam
Pagara
Ranikhera
PACHMARHI
17,18Dhupgarh
Mahadeo Chauragarh
Pachmarhi plateau
1352
1330 1308
966
887
613
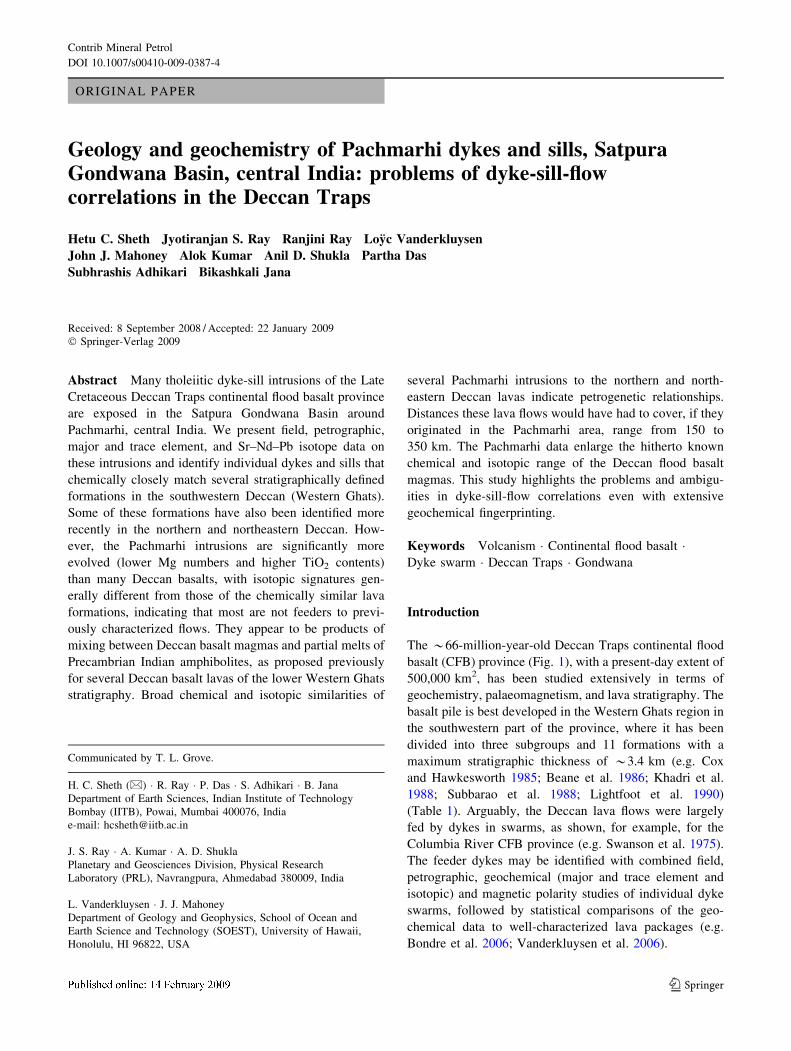
Fig. 1 Map of the Pachmarhi
area showing the geological and
main geographical-
topographical features, and
localities. The map has been
compiled with inputs from
Crookshank (1936), Ghosh et al.
(2006) and the present work.
Elevations are in metres.
Numbers from 1 to 18 in
boldface represent dyke samples
(the letters ‘PMD’ have been
removed from each to avoid
cluttering). Inset map shows the
outcrop of the Deccan flood
basalts (shaded), important
localities discussed in the text,
and, schematically, the three
major dyke swarms in the
Deccan province (e.g.
Deshmukh and Sehgal 1988)
Contrib Mineral Petrol
123
stratigraphic formations of the Western Ghats sequence
(Bondre et al. 2006).
The present study documents the field relations, petro-
graphic characteristics, and major and trace element and
Sr–Nd–Pb isotope geochemistry of Deccan dykes and sills
outcropping around the town of Pachmarhi (Panchmadhi),
central India (Fig. 1). These intrusions are an extension of
the Narmada–Satpura–Tapi dyke swarm. On the basis of
the geochemistry of these intrusions, we evaluate their role
as feeders to the Deccan lavas, particularly the lavas
forming some thick sections in the northern and north-
eastern Deccan Traps (the Toranmal–Mhow–Chikaldara–
Jabalpur areas, Fig. 1).
Field work and samples
Regional geology
In central India the Deccan lavas overlie the extensive
Vindhyan (Mid-Late Proterozoic) and Gondwana (Car-
boniferous to Lower Cretaceous) sedimentary basins,
locally developed Late Cretaceous sediments (the Bagh
and Lameta Formations), as well as Archaean and Prote-
rozoic igneous and metamorphic rocks (e.g. Choubey 1971;
Acharyya 2003). The sub-Trap Gondwana Basin is buried
in the subsurface over much of the region but has been
imaged by seismic profiling (Kaila 1988; Sridhar and
Tewari 2001). It is spectacularly exposed in the Pachmarhi
area as a result of post-Deccan tectonic uplift and stripping
of the lava cover (Sheth 2007). Chakraborty and Ghosh
(2005) claim that faults bound the Satpura Gondwana
Basin to its north and south, and that many syn-sedimen-
tary faults cut the sedimentary pile. Pachmarhi town sits
on a *1,000 m thick lens of north-dipping (*5�) Early
Triassic Pachmarhi Sandstone (Fig. 1), underlain by the
Permian Bijori Formation (dominantly shales). The Pac-
hmarhi sandstone is overlain by the Early-Mid Triassic
Denwa Formation (sandstones, shales, clays) and the
Jurassic Bagra Formation (conglomerates). According to
Venkatakrishnan (1984, 1987), multiple Late Cretaceous
planation surfaces in the region were raised and warped as
a result of major post-Deccan uplift that also produced
the long, ENE-WSW-trending, free-face, 280-m-high
Pachmarhi Scarp (Fig. 1). Rivers such as the Denwa and
Dudhi originate well to the south of the Scarp, several
hundred metres below the Pachmarhi plateau, and yet flow
north through the plateau, cutting deep gorges (Fig. 1),
suggesting that they existed before plateau uplift.
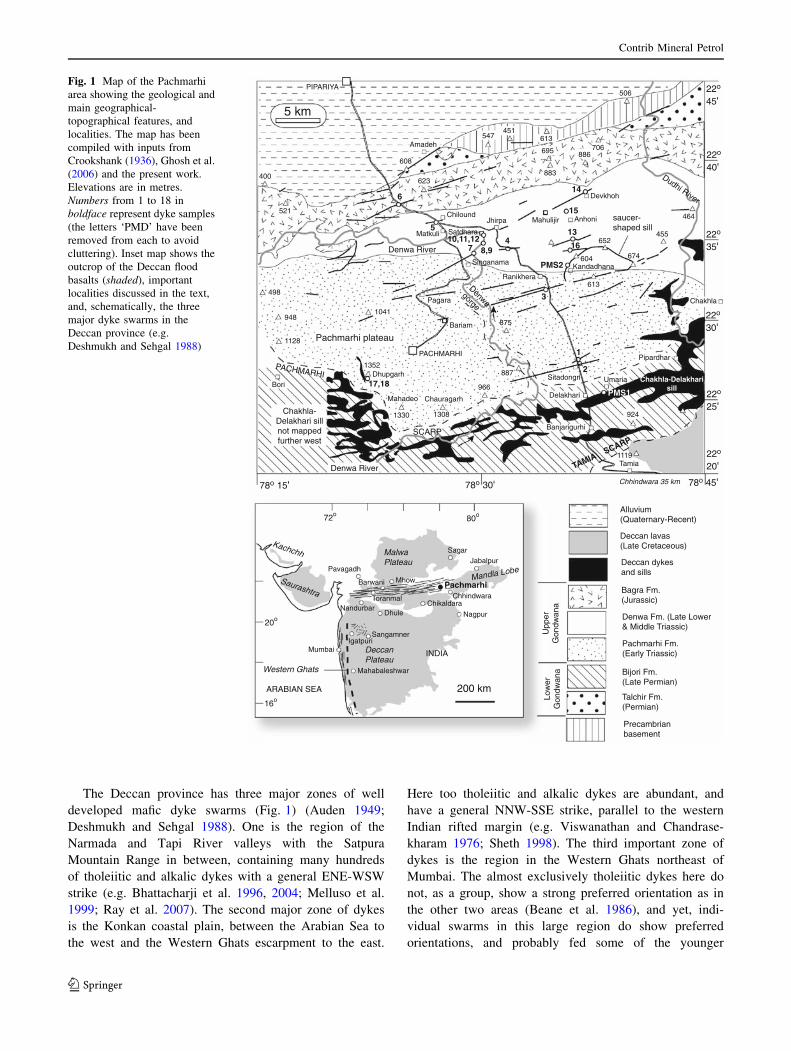
To the south, at Tamia, another high scarp (Fig. 2a)
exposes Gondwana sandstones and shales that are capped
by three Deccan basalt flows, and lower elevations expose
a large mafic intrusion, the Chakhla–Delakhari sill
(Crookshank 1936; Sen 1980, 1983). Many Deccan Trap
dykes and other intrusions can be found intruding the
Gondwana sequence, as in the gorges of the Denwa
(Fig. 2b–d). Alexander (1981) reported a K–Ar age of 61 ±
2 Ma for an unspecified dyke from this area. Sen and
Cohen (1994) reported 40Ar–39Ar ages of 66.1 ± 0.3 and
65.5 ± 0.3 Ma (2r errors) for two samples of the sill, and
noted that intrusion and volcanism in this region of the
Deccan were contemporaneous with the main Deccan
eruptions in the Western Ghats.
Table 1 shows the regional lava stratigraphy of the
Western Ghats region in the southwestern part of the
Deccan province. Peng et al. (1998) identified thick
sequences of lavas geochemically similar to those of the
Western Ghats (the Khandala, Poladpur and Ambenali
Formations) in the northeastern Deccan, around Chikaldara
and Jabalpur, and found Khandala- and Poladpur-like lavas
in the northern Deccan (around Mhow), where Ambenali-
type compositions are absent. The lavas are in the south-
western stratigraphic order as well. However, Peng et al.
(1998) found that the Poladpur-like lavas, in particular, had
systematically higher 206Pb/204Pb ratios than their chemi-
cally similar southwestern counterparts, and inferred that
Table 1 Stratigraphy of the
Deccan flood basalts in the
Western Ghats, with formation
thicknesses, magnetic polarity,
and Sr isotopic values
(at 66 Ma)
a The Desur is considered by
many as a ‘‘Unit’’ of the Panhala
Formation itself. Table based on
Subbarao and Hooper (1988),
Peng et al. (1994), and
references therein
N normal magnetic polarity,
R reverse magnetic polarity
Group Sub-group Formation Magnetic polarity 87Sr/86Sr(66 Ma)
Deccan Basalt Wai Desura (*100 m) N 0.7072–0.7080
Panhala ([175 m) N 0.7046–0.7055
Mahabaleshwar (280 m) N 0.7040–0.7055
Ambenali (500 m) R 0.7038–0.7044
Poladpur (375 m) R 0.7053–0.7110
Lonavala Bushe (325 m) R 0.7078–0.7200
Khandala (140 m) R 0.7071–0.7124
Kalsubai Bhimashankar (140 m) R 0.7067–0.7076
Thakurvadi (650 m) R 0.7067–0.7112
Neral (100 m) R 0.7062–0.7104
Jawhar-Igatpuri ([700 m) R 0.7085–0.7128
Contrib Mineral Petrol
123
they erupted from different vents. Chandrasekharam et al.
(1999) and Mahoney et al. (2000) found that some thin,
discontinuously exposed lava sections in the Tapi River
valley, and the 870 m-thick Toranmal section in the Sat-
pura Range, were composed of several Poladpur-type lavas
cut by a few broadly Bushe-like or Mahabaleshwar-like
dykes; the latter would be consistent with the southwestern
Deccan stratigraphy. They did not find Ambenali-like lavas
or dykes.
The Pachmarhi dykes
Prior to the field work, we measured the lengths and trends
of 55 dykes on six survey of India topographic sheets
(1:50,000 scale and 20 m contour interval) covering an
area of 14,500 km2 between latitudes 22�150 N and 22�450
N and longitudes 78�150 E and 79�000 E. The dykes were
identified in the toposheets as narrow linear ridges, with
equal slopes on either side, often extending for several
kilometres, or as linearly aligned segments. However,
because of the highly dissected terrain (relief [1 km) and
few roads, field work and sampling were restricted to the
area shown in Fig. 1, which covers parts of four toposheets
(nos. 55 J/6, 7, 10, 11).
The dykes we sampled are typical dolerites and basalts,
undeformed and relatively fresh. Almost all are vertical or
very steeply dipping (PMD11, 85�), but PMD7 dips north
at about 45�. Sample names in this study represent both
individual samples and whole dykes or sills. Of course, no
one sample can fully represent a large dyke or sill, where
mineral proportions and some aspects of chemical com-
position can change over relatively small distances (cf.
Bondre et al. 2006). Some dykes form prominent ridges
(PMD14), whereas others have quite low relief (PMD4, 5,
15). Many show blocky jointing (PMD6, 10, 12, 17).
Several are well exposed along the Denwa River valley
intruding the Gondwana sandstones and clays (PMD7–
PMD12), sometimes with straight chilled margins of
tachylite. Nowhere were the dykes seen to pass into flows
and no dyke tips (terminations) were seen. Almost all of
the dykes, with the exception of PMD6, are simple, single
intrusions. PMD6 is highly weathered in outcrop and seems
to have multiple fine-grained dykes at its margin.
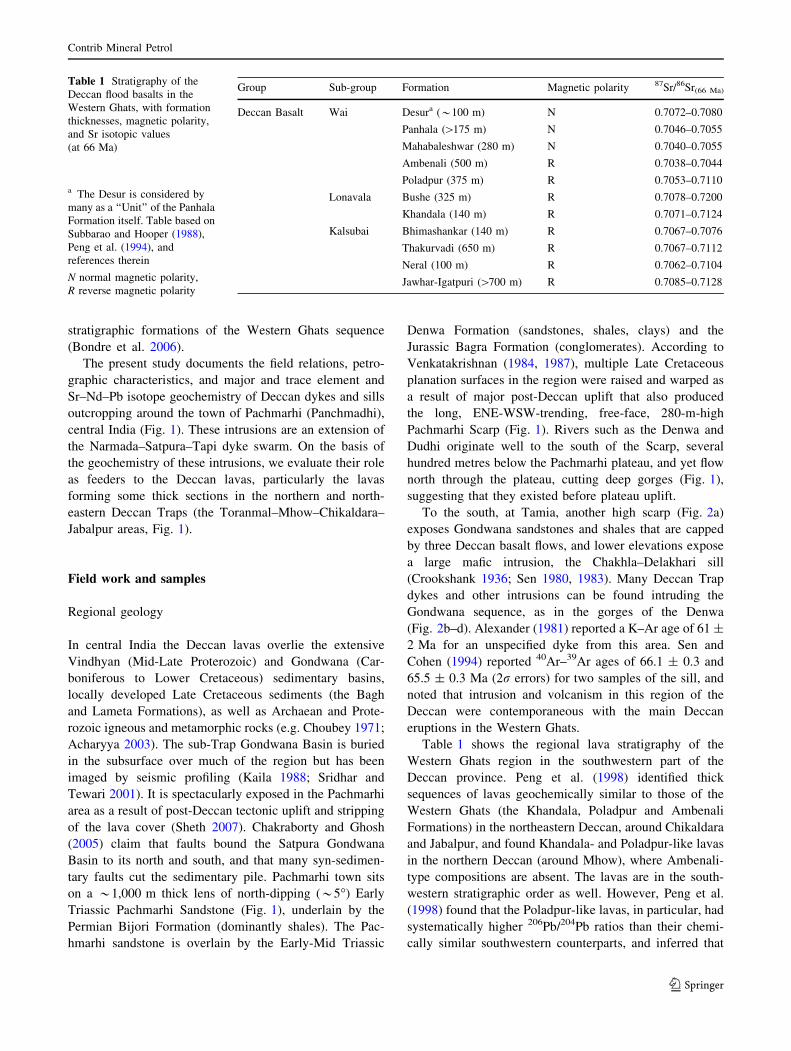
Most dykes strike ENE-WSW to E-W with a normal
distribution on a strike-frequency histogram (Fig. 3a) and a
strike of N73.9�. Only one dyke (PMD17), near Dhupgarh
summit, is N-S trending. Dykes PMD10 and PMD12,
exposed on the Denwa River bed, are highly sinuous. We
did not see any dykes occupying faults, so their general
ENE-WSW trend shows the regional minimum compres-
sive stress (r3) direction to have been *NNW-SSE during
emplacement (cf. Pollard 1987; Gudmundsson and Mari-
noni 2002; Ray et al. 2007). Dyke lengths vary from \1–
19.1 km (PMD2), and the length distribution of the dykes
follows a negative power law (Fig. 3b), as is typical (Gu-
dmundsson 1995). The mean, mode and median lengths are
3.2, 1.3 and 2.1 km, respectively. Measured thicknesses
range from 2 to *30 m and can be variable along strike.
Fig. 2 Field photographs.
a The Tamia scarp and Deccan
basalt lava flows overlying
Gondwana sandstone. b Dyke
PMD7 along Denwa River bed,
dipping roughly north (left) and
with columns perpendicular to
its contacts. c Dykes PMD8 and
PMD9 on the Denwa River bed.
d The 28–34 m wide Satdhara
dyke PMD11
Contrib Mineral Petrol
123
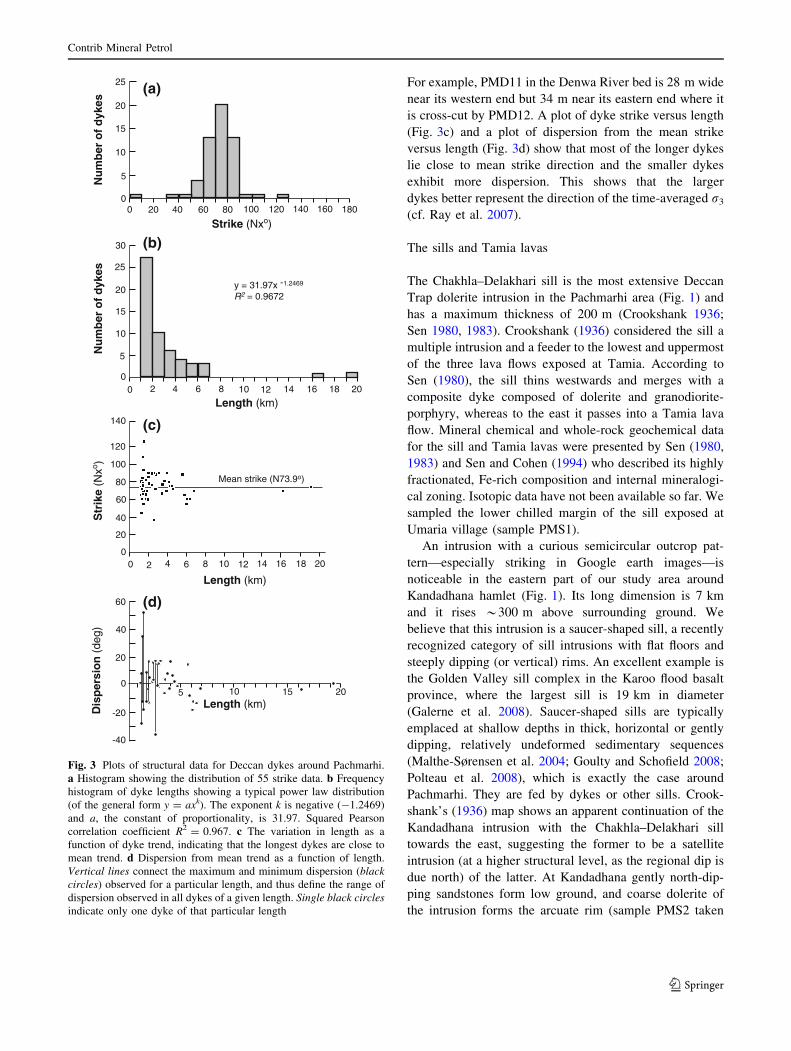
For example, PMD11 in the Denwa River bed is 28 m wide
near its western end but 34 m near its eastern end where it
is cross-cut by PMD12. A plot of dyke strike versus length
(Fig. 3c) and a plot of dispersion from the mean strike
versus length (Fig. 3d) show that most of the longer dykes
lie close to mean strike direction and the smaller dykes
exhibit more dispersion. This shows that the larger
dykes better represent the direction of the time-averaged r3
(cf. Ray et al. 2007).
The sills and Tamia lavas
The Chakhla–Delakhari sill is the most extensive Deccan
Trap dolerite intrusion in the Pachmarhi area (Fig. 1) and
has a maximum thickness of 200 m (Crookshank 1936;
Sen 1980, 1983). Crookshank (1936) considered the sill a
multiple intrusion and a feeder to the lowest and uppermost
of the three lava flows exposed at Tamia. According to
Sen (1980), the sill thins westwards and merges with a
composite dyke composed of dolerite and granodiorite-
porphyry, whereas to the east it passes into a Tamia lava
flow. Mineral chemical and whole-rock geochemical data
for the sill and Tamia lavas were presented by Sen (1980,
1983) and Sen and Cohen (1994) who described its highly
fractionated, Fe-rich composition and internal mineralogi-
cal zoning. Isotopic data have not been available so far. We
sampled the lower chilled margin of the sill exposed at
Umaria village (sample PMS1).
An intrusion with a curious semicircular outcrop pat-
tern—especially striking in Google earth images—is
noticeable in the eastern part of our study area around
Kandadhana hamlet (Fig. 1). Its long dimension is 7 km
and it rises *300 m above surrounding ground. We
believe that this intrusion is a saucer-shaped sill, a recently
recognized category of sill intrusions with flat floors and
steeply dipping (or vertical) rims. An excellent example is
the Golden Valley sill complex in the Karoo flood basalt
province, where the largest sill is 19 km in diameter
(Galerne et al. 2008). Saucer-shaped sills are typically
emplaced at shallow depths in thick, horizontal or gently
dipping, relatively undeformed sedimentary sequences
(Malthe-Sørensen et al. 2004; Goulty and Schofield 2008;
Polteau et al. 2008), which is exactly the case around
Pachmarhi. They are fed by dykes or other sills. Crook-
shank’s (1936) map shows an apparent continuation of the
Kandadhana intrusion with the Chakhla–Delakhari sill
towards the east, suggesting the former to be a satellite
intrusion (at a higher structural level, as the regional dip is
due north) of the latter. At Kandadhana gently north-dip-
ping sandstones form low ground, and coarse dolerite of
the intrusion forms the arcuate rim (sample PMS2 taken
Nu
mb
er o
f d
ykes
Nu
mb
er o
f d
ykes
25
20
15
10
5
0
25
20
15
10
5
0
30
0 20 40 60 80 100 120 140 160 180
0 2 4 6 8 10 12 14 16 18 20
Strike (Nxo)
Length (km)
y = 31.97x -1.2469
R2 = 0.9672
Length (km)
Length (km)
Str
ike
(Nxo )
Mean strike (N73.9o)
0 2 4 6 8 10 12 14 16 18 200
20
40
60
80
100
120
140
05 10 15 20
20
40
60
-20
-40
Dis
per
sio
n (
deg)
(a)
(b)
(c)
(d)
Fig. 3 Plots of structural data for Deccan dykes around Pachmarhi.
a Histogram showing the distribution of 55 strike data. b Frequency
histogram of dyke lengths showing a typical power law distribution
(of the general form y = axk). The exponent k is negative (-1.2469)
and a, the constant of proportionality, is 31.97. Squared Pearson
correlation coefficient R2 = 0.967. c The variation in length as a
function of dyke trend, indicating that the longest dykes are close to
mean trend. d Dispersion from mean trend as a function of length.
Vertical lines connect the maximum and minimum dispersion (blackcircles) observed for a particular length, and thus define the range of
dispersion observed in all dykes of a given length. Single black circlesindicate only one dyke of that particular length
Contrib Mineral Petrol
123
here). Because of dense forest cover we could not see their
contact, or the relationships between PMS2 and nearby
dykes such as PMD3 or PMD16.
Petrography
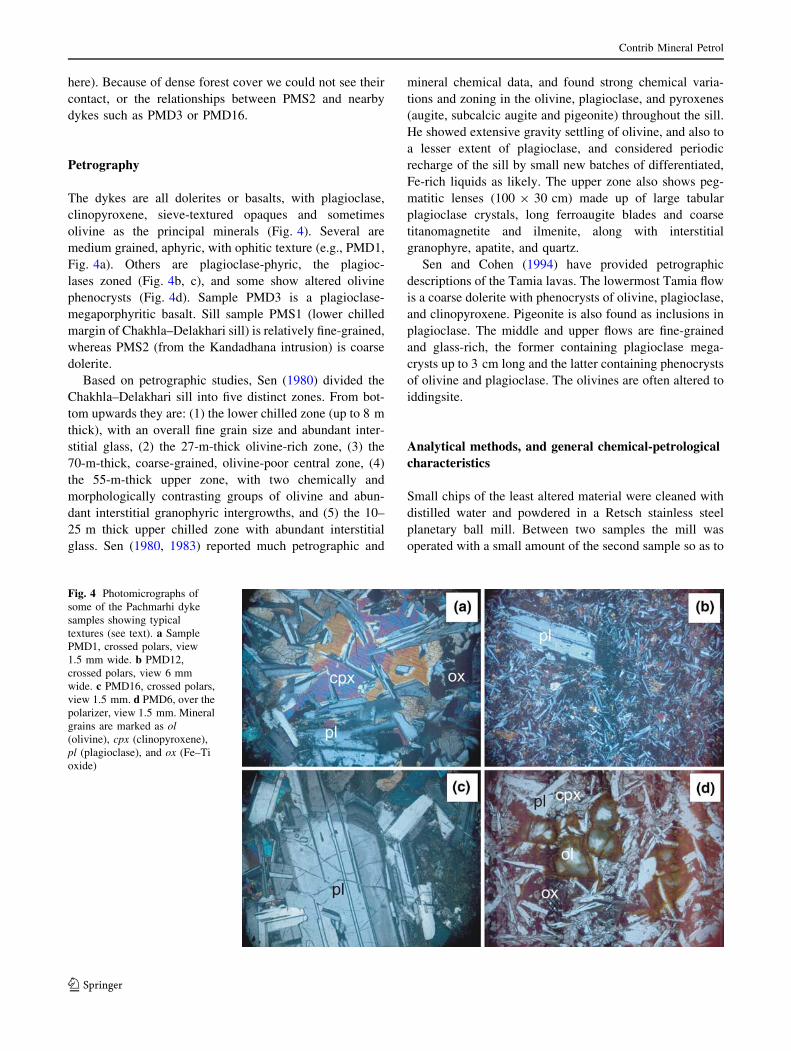
The dykes are all dolerites or basalts, with plagioclase,
clinopyroxene, sieve-textured opaques and sometimes
olivine as the principal minerals (Fig. 4). Several are
medium grained, aphyric, with ophitic texture (e.g., PMD1,
Fig. 4a). Others are plagioclase-phyric, the plagioc-
lases zoned (Fig. 4b, c), and some show altered olivine
phenocrysts (Fig. 4d). Sample PMD3 is a plagioclase-
megaporphyritic basalt. Sill sample PMS1 (lower chilled
margin of Chakhla–Delakhari sill) is relatively fine-grained,
whereas PMS2 (from the Kandadhana intrusion) is coarse
dolerite.
Based on petrographic studies, Sen (1980) divided the
Chakhla–Delakhari sill into five distinct zones. From bot-
tom upwards they are: (1) the lower chilled zone (up to 8 m
thick), with an overall fine grain size and abundant inter-
stitial glass, (2) the 27-m-thick olivine-rich zone, (3) the
70-m-thick, coarse-grained, olivine-poor central zone, (4)
the 55-m-thick upper zone, with two chemically and
morphologically contrasting groups of olivine and abun-
dant interstitial granophyric intergrowths, and (5) the 10–
25 m thick upper chilled zone with abundant interstitial
glass. Sen (1980, 1983) reported much petrographic and
mineral chemical data, and found strong chemical varia-
tions and zoning in the olivine, plagioclase, and pyroxenes
(augite, subcalcic augite and pigeonite) throughout the sill.
He showed extensive gravity settling of olivine, and also to
a lesser extent of plagioclase, and considered periodic
recharge of the sill by small new batches of differentiated,
Fe-rich liquids as likely. The upper zone also shows peg-
matitic lenses (100 9 30 cm) made up of large tabular
plagioclase crystals, long ferroaugite blades and coarse
titanomagnetite and ilmenite, along with interstitial
granophyre, apatite, and quartz.
Sen and Cohen (1994) have provided petrographic
descriptions of the Tamia lavas. The lowermost Tamia flow
is a coarse dolerite with phenocrysts of olivine, plagioclase,
and clinopyroxene. Pigeonite is also found as inclusions in
plagioclase. The middle and upper flows are fine-grained
and glass-rich, the former containing plagioclase mega-
crysts up to 3 cm long and the latter containing phenocrysts
of olivine and plagioclase. The olivines are often altered to
iddingsite.
Analytical methods, and general chemical-petrological
characteristics
Small chips of the least altered material were cleaned with
distilled water and powdered in a Retsch stainless steel
planetary ball mill. Between two samples the mill was
operated with a small amount of the second sample so as to
Fig. 4 Photomicrographs of
some of the Pachmarhi dyke
samples showing typical
textures (see text). a Sample
PMD1, crossed polars, view
1.5 mm wide. b PMD12,
crossed polars, view 6 mm
wide. c PMD16, crossed polars,
view 1.5 mm. d PMD6, over the
polarizer, view 1.5 mm. Mineral
grains are marked as ol(olivine), cpx (clinopyroxene),
pl (plagioclase), and ox (Fe–Ti
oxide)
Contrib Mineral Petrol
123
precontaminate it. The samples were analyzed at the
PLANEX Facility of the Indian Space Research Organi-
zation (ISRO), located at the Physical Research
Laboratory, Ahmedabad. The major elements were ana-
lyzed on pressed powder pellets by X-ray fluorescence
(XRF) spectrometry (Axios, from Panalytical Limited,
following the methods of Norrish and Chapell 1977). The
trace elements were analyzed on sample solutions by
inductively coupled plasma mass spectrometry (ICPMS,
Thermoelectron X-Series II, following the methods of Jain
and Neal 1996 and Neal 2001). The XRF and ICPMS data
are reported, together with information on accuracy and
precision of the measurements, and LOI (weight loss on
ignition to 1,000�C) values in Table 2. For calibrating the
instruments, international rock standards such as AGV-1,
BIR-1, G-2, GSP-1, STM-1 and W-2 were used, whereas
others (BHVO-2 and BCR-2) were analyzed as unknowns
along with the samples.
Bulk rock Sr and Nd isotopic analyses were also carried
out at the Physical Research Laboratory. Sample powders
were dissolved using a standard HF–HNO3–HCl dissolu-
tion procedure for silicate rocks. Sr separation was done by
conventional cation exchange chemistry and Nd was sep-
arated from other REE (rare earth elements) using Ln
specific resin from eichrom with dilute HCl as the elutant.
The isotope ratio measurements were carried out in static
multi-collection mode on an ISOPROBE-T mass spec-
trometer. Pb isotopic analyses were performed at the
University of Hawaii following Mahoney et al. (1991). The
isotopic data and information on the accuracy and precision
of the isotopic analyses are reported in Table 3.
We used the SINCLAS program (Verma et al. 2002) for
LOI-free major oxide data, CIPW norms, and a standard-
ized rock name following the IUGS nomenclature (Le Bas
et al. 1986). Table 2 shows the measured major and trace
element compositions of the samples and the rock names
obtained with SINCLAS. As noted by Middlemost (1989),
the Fe2O3/FeO ratio increases with oxidation (indirectly,
degree of differentiation) and weathering, and SINCLAS
incorporates an option for using Fe2O3/FeO ratios
depending on rock type, given by Middlemost (1989), to
split the total iron. A value of 0.20 was recommended by
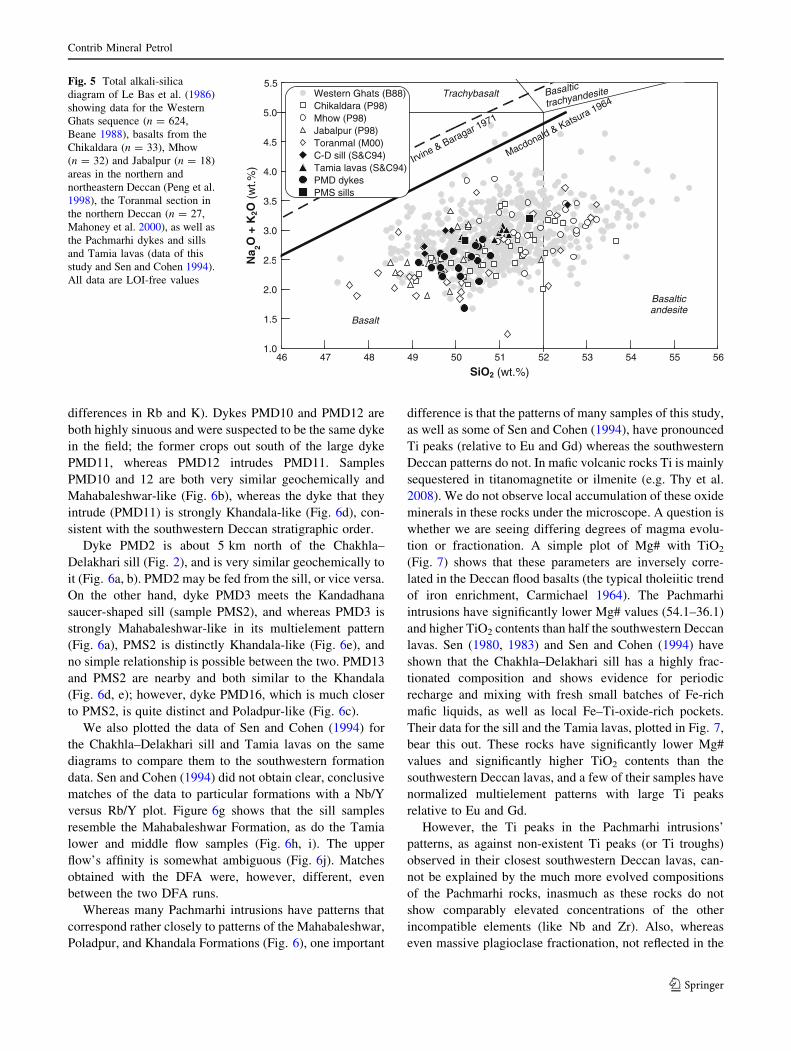
Middlemost for fresh basalts. All samples are classified as
subalkalic basalt, like the overwhelming majority of
Western Ghats and northeastern Deccan lavas (e.g. Beane
et al. 1986; Beane 1988; Peng et al. 1998; Sheth 2005;
Fig. 5). The rocks are fairly or moderately evolved, with
MgO contents ranging from 3.48 (PMS2) to 7.26 (PMD5)
wt.% and Mg numbers (Mg#) ranging from 36.1 (PMS2) to
54.2 (PMD9), where Mg# = [atomic Mg/(Mg?Fe2?)] 9
100. All rocks are quartz-normative, the normative quartz
ranging between 1.15 (PMD5) and 7.10 (PMS2) wt.%. The
LOI values provide an idea about the level of sub-aerial
alteration suffered by the rocks, and are low to moderate
(0.50–1.86) except for PMD9 (5.47 wt.%). We also pro-
cessed the data of Sen and Cohen (1994) for the Chakhla–
Delakhari sill and Tamia lavas through SINCLAS. LOI
values are not available. All except one of their 14 samples
are subalkalic basalt, the exception being a basaltic
andesite (D34). Mg# ranges from 38.7 to 52.2.
Geochemical correlations with the southwestern
Deccan lavas
Our objective is to establish geochemical correlations, or
the lack thereof, of the Pachmarhi dykes and sills to the
Deccan lava Formations, and thus to evaluate whether
these intrusions could represent feeders to any of the well-
studied, main lava packages in the province. Previous
studies of lava piles exposed in parts of the Deccan lacking
an established stratigraphy have employed several tools in
order to aid comparisons with the southwestern Deccan
formations (Peng et al. 1998; Mahoney et al. 2000; Sheth
et al. 2004; Sheth and Melluso 2008). These include binary
discriminant diagrams using major and trace elements and
element ratios, multivariate statistical methods (particu-
larly discriminant function analysis), normalized multi-
element patterns, and Sr–Nd–Pb isotopic ratios. The same
tools have been used to systematically correlate mafic dyke
swarms to particular Deccan lava packages or sequences
(Bondre et al. 2006; Vanderkluysen et al. 2006).
Binary diagrams and discriminant function analysis
Binary diagrams of alteration-resistant elements such as
Nb, Zr, Ba, and Y, and their ratios insensitive to crystal
fractionation (e.g., Nb/Zr), were seen to have no utility in
correlating the Pachmarhi rocks with any specific south-
western Deccan formations, because of the substantial
overlap in the compositional characteristics of several
formations, and because the Pachmarhi rocks’ data plot in
these areas of overlap (not shown).
Discriminant function analysis (DFA) was performed
in order to quantitatively evaluate chemical affinities of
the Pachmarhi dykes and sills and the Tamia lavas to
individual southwestern Deccan formations. DFA was
performed twice, first using several major (excluding
Na2O, K2O, total iron and MnO) and trace elements (Ni,
Sc, V, Ba, Rb, Sr, Zr, Y, and Nb) as the discriminating
variables, and again using just these trace elements. The
methodology used was exactly that used in previous similar
studies (Peng et al. 1998; Mahoney et al. 2000; Sheth et al.
2004; Bondre et al. 2006). The formation matches (tabu-
lated results available from the authors) obtained with the
two runs are different in all cases except for three samples
Contrib Mineral Petrol
123
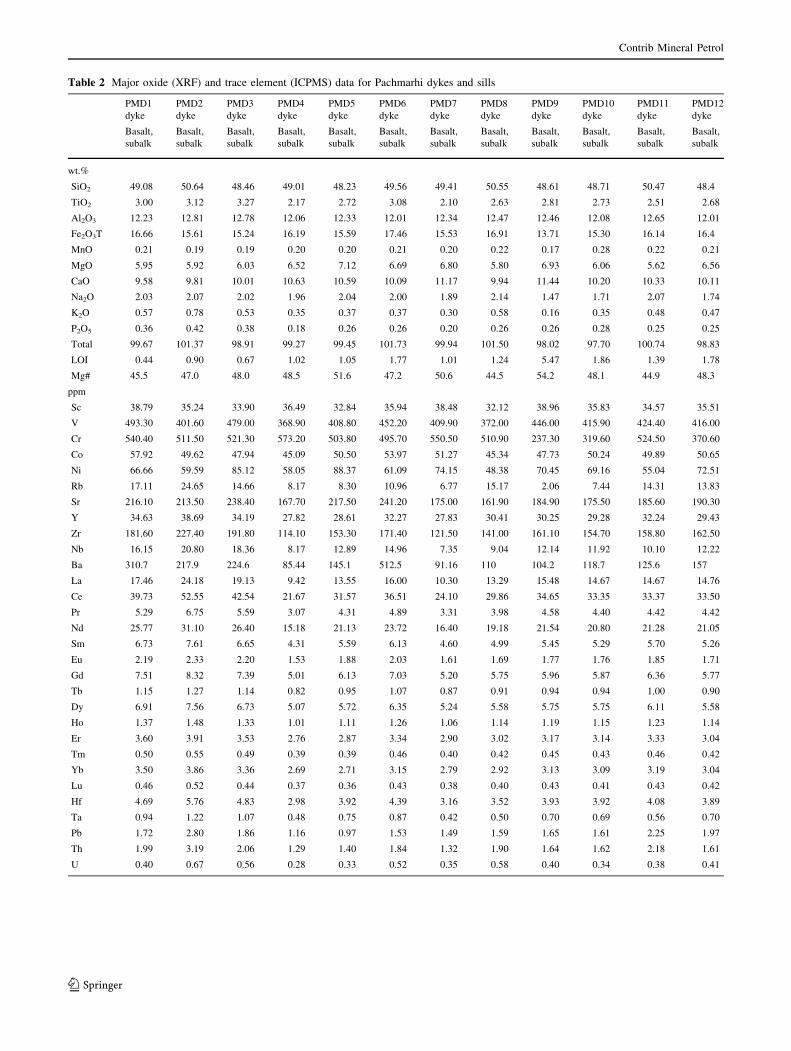
Table 2 Major oxide (XRF) and trace element (ICPMS) data for Pachmarhi dykes and sills
PMD1
dyke
Basalt,
subalk
PMD2
dyke
Basalt,
subalk
PMD3
dyke
Basalt,
subalk
PMD4
dyke
Basalt,
subalk
PMD5
dyke
Basalt,
subalk
PMD6
dyke
Basalt,
subalk
PMD7
dyke
Basalt,
subalk
PMD8
dyke
Basalt,
subalk
PMD9
dyke
Basalt,
subalk
PMD10
dyke
Basalt,
subalk
PMD11
dyke
Basalt,
subalk
PMD12
dyke
Basalt,
subalk
wt.%
SiO2 49.08 50.64 48.46 49.01 48.23 49.56 49.41 50.55 48.61 48.71 50.47 48.4
TiO2 3.00 3.12 3.27 2.17 2.72 3.08 2.10 2.63 2.81 2.73 2.51 2.68
Al2O3 12.23 12.81 12.78 12.06 12.33 12.01 12.34 12.47 12.46 12.08 12.65 12.01
Fe2O3T 16.66 15.61 15.24 16.19 15.59 17.46 15.53 16.91 13.71 15.30 16.14 16.4
MnO 0.21 0.19 0.19 0.20 0.20 0.21 0.20 0.22 0.17 0.28 0.22 0.21
MgO 5.95 5.92 6.03 6.52 7.12 6.69 6.80 5.80 6.93 6.06 5.62 6.56
CaO 9.58 9.81 10.01 10.63 10.59 10.09 11.17 9.94 11.44 10.20 10.33 10.11
Na2O 2.03 2.07 2.02 1.96 2.04 2.00 1.89 2.14 1.47 1.71 2.07 1.74
K2O 0.57 0.78 0.53 0.35 0.37 0.37 0.30 0.58 0.16 0.35 0.48 0.47
P2O5 0.36 0.42 0.38 0.18 0.26 0.26 0.20 0.26 0.26 0.28 0.25 0.25
Total 99.67 101.37 98.91 99.27 99.45 101.73 99.94 101.50 98.02 97.70 100.74 98.83
LOI 0.44 0.90 0.67 1.02 1.05 1.77 1.01 1.24 5.47 1.86 1.39 1.78
Mg# 45.5 47.0 48.0 48.5 51.6 47.2 50.6 44.5 54.2 48.1 44.9 48.3
ppm
Sc 38.79 35.24 33.90 36.49 32.84 35.94 38.48 32.12 38.96 35.83 34.57 35.51
V 493.30 401.60 479.00 368.90 408.80 452.20 409.90 372.00 446.00 415.90 424.40 416.00
Cr 540.40 511.50 521.30 573.20 503.80 495.70 550.50 510.90 237.30 319.60 524.50 370.60
Co 57.92 49.62 47.94 45.09 50.50 53.97 51.27 45.34 47.73 50.24 49.89 50.65
Ni 66.66 59.59 85.12 58.05 88.37 61.09 74.15 48.38 70.45 69.16 55.04 72.51
Rb 17.11 24.65 14.66 8.17 8.30 10.96 6.77 15.17 2.06 7.44 14.31 13.83
Sr 216.10 213.50 238.40 167.70 217.50 241.20 175.00 161.90 184.90 175.50 185.60 190.30
Y 34.63 38.69 34.19 27.82 28.61 32.27 27.83 30.41 30.25 29.28 32.24 29.43
Zr 181.60 227.40 191.80 114.10 153.30 171.40 121.50 141.00 161.10 154.70 158.80 162.50
Nb 16.15 20.80 18.36 8.17 12.89 14.96 7.35 9.04 12.14 11.92 10.10 12.22
Ba 310.7 217.9 224.6 85.44 145.1 512.5 91.16 110 104.2 118.7 125.6 157
La 17.46 24.18 19.13 9.42 13.55 16.00 10.30 13.29 15.48 14.67 14.67 14.76
Ce 39.73 52.55 42.54 21.67 31.57 36.51 24.10 29.86 34.65 33.35 33.37 33.50
Pr 5.29 6.75 5.59 3.07 4.31 4.89 3.31 3.98 4.58 4.40 4.42 4.42
Nd 25.77 31.10 26.40 15.18 21.13 23.72 16.40 19.18 21.54 20.80 21.28 21.05
Sm 6.73 7.61 6.65 4.31 5.59 6.13 4.60 4.99 5.45 5.29 5.70 5.26
Eu 2.19 2.33 2.20 1.53 1.88 2.03 1.61 1.69 1.77 1.76 1.85 1.71
Gd 7.51 8.32 7.39 5.01 6.13 7.03 5.20 5.75 5.96 5.87 6.36 5.77
Tb 1.15 1.27 1.14 0.82 0.95 1.07 0.87 0.91 0.94 0.94 1.00 0.90
Dy 6.91 7.56 6.73 5.07 5.72 6.35 5.24 5.58 5.75 5.75 6.11 5.58
Ho 1.37 1.48 1.33 1.01 1.11 1.26 1.06 1.14 1.19 1.15 1.23 1.14
Er 3.60 3.91 3.53 2.76 2.87 3.34 2.90 3.02 3.17 3.14 3.33 3.04
Tm 0.50 0.55 0.49 0.39 0.39 0.46 0.40 0.42 0.45 0.43 0.46 0.42
Yb 3.50 3.86 3.36 2.69 2.71 3.15 2.79 2.92 3.13 3.09 3.19 3.04
Lu 0.46 0.52 0.44 0.37 0.36 0.43 0.38 0.40 0.43 0.41 0.43 0.42
Hf 4.69 5.76 4.83 2.98 3.92 4.39 3.16 3.52 3.93 3.92 4.08 3.89
Ta 0.94 1.22 1.07 0.48 0.75 0.87 0.42 0.50 0.70 0.69 0.56 0.70
Pb 1.72 2.80 1.86 1.16 0.97 1.53 1.49 1.59 1.65 1.61 2.25 1.97
Th 1.99 3.19 2.06 1.29 1.40 1.84 1.32 1.90 1.64 1.62 2.18 1.61
U 0.40 0.67 0.56 0.28 0.33 0.52 0.35 0.58 0.40 0.34 0.38 0.41
Contrib Mineral Petrol
123
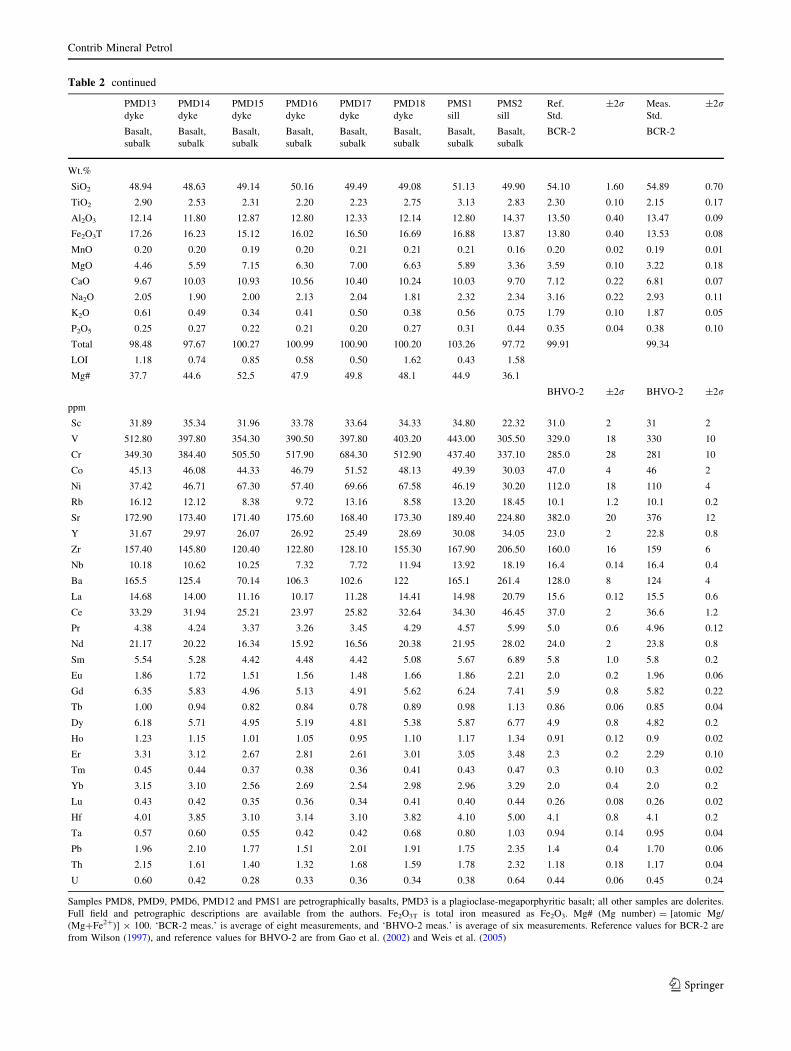
Table 2 continued
PMD13
dyke
Basalt,
subalk
PMD14
dyke
Basalt,
subalk
PMD15
dyke
Basalt,
subalk
PMD16
dyke
Basalt,
subalk
PMD17
dyke
Basalt,
subalk
PMD18
dyke
Basalt,
subalk
PMS1
sill
Basalt,
subalk
PMS2
sill
Basalt,
subalk
Ref.
Std.
BCR-2
±2r Meas.
Std.
BCR-2
±2r
Wt.%
SiO2 48.94 48.63 49.14 50.16 49.49 49.08 51.13 49.90 54.10 1.60 54.89 0.70
TiO2 2.90 2.53 2.31 2.20 2.23 2.75 3.13 2.83 2.30 0.10 2.15 0.17
Al2O3 12.14 11.80 12.87 12.80 12.33 12.14 12.80 14.37 13.50 0.40 13.47 0.09
Fe2O3T 17.26 16.23 15.12 16.02 16.50 16.69 16.88 13.87 13.80 0.40 13.53 0.08
MnO 0.20 0.20 0.19 0.20 0.21 0.21 0.21 0.16 0.20 0.02 0.19 0.01
MgO 4.46 5.59 7.15 6.30 7.00 6.63 5.89 3.36 3.59 0.10 3.22 0.18
CaO 9.67 10.03 10.93 10.56 10.40 10.24 10.03 9.70 7.12 0.22 6.81 0.07
Na2O 2.05 1.90 2.00 2.13 2.04 1.81 2.32 2.34 3.16 0.22 2.93 0.11
K2O 0.61 0.49 0.34 0.41 0.50 0.38 0.56 0.75 1.79 0.10 1.87 0.05
P2O5 0.25 0.27 0.22 0.21 0.20 0.27 0.31 0.44 0.35 0.04 0.38 0.10
Total 98.48 97.67 100.27 100.99 100.90 100.20 103.26 97.72 99.91 99.34
LOI 1.18 0.74 0.85 0.58 0.50 1.62 0.43 1.58
Mg# 37.7 44.6 52.5 47.9 49.8 48.1 44.9 36.1
BHVO-2 ±2r BHVO-2 ±2r
ppm
Sc 31.89 35.34 31.96 33.78 33.64 34.33 34.80 22.32 31.0 2 31 2
V 512.80 397.80 354.30 390.50 397.80 403.20 443.00 305.50 329.0 18 330 10
Cr 349.30 384.40 505.50 517.90 684.30 512.90 437.40 337.10 285.0 28 281 10
Co 45.13 46.08 44.33 46.79 51.52 48.13 49.39 30.03 47.0 4 46 2
Ni 37.42 46.71 67.30 57.40 69.66 67.58 46.19 30.20 112.0 18 110 4
Rb 16.12 12.12 8.38 9.72 13.16 8.58 13.20 18.45 10.1 1.2 10.1 0.2
Sr 172.90 173.40 171.40 175.60 168.40 173.30 189.40 224.80 382.0 20 376 12
Y 31.67 29.97 26.07 26.92 25.49 28.69 30.08 34.05 23.0 2 22.8 0.8
Zr 157.40 145.80 120.40 122.80 128.10 155.30 167.90 206.50 160.0 16 159 6
Nb 10.18 10.62 10.25 7.32 7.72 11.94 13.92 18.19 16.4 0.14 16.4 0.4
Ba 165.5 125.4 70.14 106.3 102.6 122 165.1 261.4 128.0 8 124 4
La 14.68 14.00 11.16 10.17 11.28 14.41 14.98 20.79 15.6 0.12 15.5 0.6
Ce 33.29 31.94 25.21 23.97 25.82 32.64 34.30 46.45 37.0 2 36.6 1.2
Pr 4.38 4.24 3.37 3.26 3.45 4.29 4.57 5.99 5.0 0.6 4.96 0.12
Nd 21.17 20.22 16.34 15.92 16.56 20.38 21.95 28.02 24.0 2 23.8 0.8
Sm 5.54 5.28 4.42 4.48 4.42 5.08 5.67 6.89 5.8 1.0 5.8 0.2
Eu 1.86 1.72 1.51 1.56 1.48 1.66 1.86 2.21 2.0 0.2 1.96 0.06
Gd 6.35 5.83 4.96 5.13 4.91 5.62 6.24 7.41 5.9 0.8 5.82 0.22
Tb 1.00 0.94 0.82 0.84 0.78 0.89 0.98 1.13 0.86 0.06 0.85 0.04
Dy 6.18 5.71 4.95 5.19 4.81 5.38 5.87 6.77 4.9 0.8 4.82 0.2
Ho 1.23 1.15 1.01 1.05 0.95 1.10 1.17 1.34 0.91 0.12 0.9 0.02
Er 3.31 3.12 2.67 2.81 2.61 3.01 3.05 3.48 2.3 0.2 2.29 0.10
Tm 0.45 0.44 0.37 0.38 0.36 0.41 0.43 0.47 0.3 0.10 0.3 0.02
Yb 3.15 3.10 2.56 2.69 2.54 2.98 2.96 3.29 2.0 0.4 2.0 0.2
Lu 0.43 0.42 0.35 0.36 0.34 0.41 0.40 0.44 0.26 0.08 0.26 0.02
Hf 4.01 3.85 3.10 3.14 3.10 3.82 4.10 5.00 4.1 0.8 4.1 0.2
Ta 0.57 0.60 0.55 0.42 0.42 0.68 0.80 1.03 0.94 0.14 0.95 0.04
Pb 1.96 2.10 1.77 1.51 2.01 1.91 1.75 2.35 1.4 0.4 1.70 0.06
Th 2.15 1.61 1.40 1.32 1.68 1.59 1.78 2.32 1.18 0.18 1.17 0.04
U 0.60 0.42 0.28 0.33 0.36 0.34 0.38 0.64 0.44 0.06 0.45 0.24
Samples PMD8, PMD9, PMD6, PMD12 and PMS1 are petrographically basalts, PMD3 is a plagioclase-megaporphyritic basalt; all other samples are dolerites.
Full field and petrographic descriptions are available from the authors. Fe2O3T is total iron measured as Fe2O3. Mg# (Mg number) = [atomic Mg/
(Mg?Fe2?)] 9 100. ‘BCR-2 meas.’ is average of eight measurements, and ‘BHVO-2 meas.’ is average of six measurements. Reference values for BCR-2 are
from Wilson (1997), and reference values for BHVO-2 are from Gao et al. (2002) and Weis et al. (2005)
Contrib Mineral Petrol
123
of the lower Tamia flow, which are classified with the
Poladpur, and sample 6A from the middle flow, classified
with the Jawhar–Igatpuri. For most samples, in both runs,
the Mahalanobis distances to nearest formation centroids
are 10 or more, and the highest is 86.6. Thus, the DFA not
only is inconclusive but also underscores the significant
dissimilarity of the Pachmarhi intrusions to the Western
Ghats sequence.
Multielement patterns
To further evaluate their stratigraphic affinities, the
Pachmarhi dyke and sill data were compared with data for
individual flows or members from various southwestern
Deccan formations using primitive-mantle-normalized
multielement patterns. Several southwestern formations
have distinct multielement patterns; for example, the
Ambenali and Poladpur can be distinguished on the basis of
the former’s lack of significant Pb peaks. Little-altered
samples of the Mahabaleshwar and Poladpur can be distin-
guished from each other by the former’s normalized K lower
than normalized Nb and Ta. The Poladpur and Khandala,
both considerably contaminated by continental lithosphere,
show sizeable Pb peaks and sometimes Nb–Ta troughs rel-
ative to Th and La. They can be mutually distinguished from
the overall slope of the pattern from left to right; the Poladpur
being almost flat and the Khandala considerably steeper.
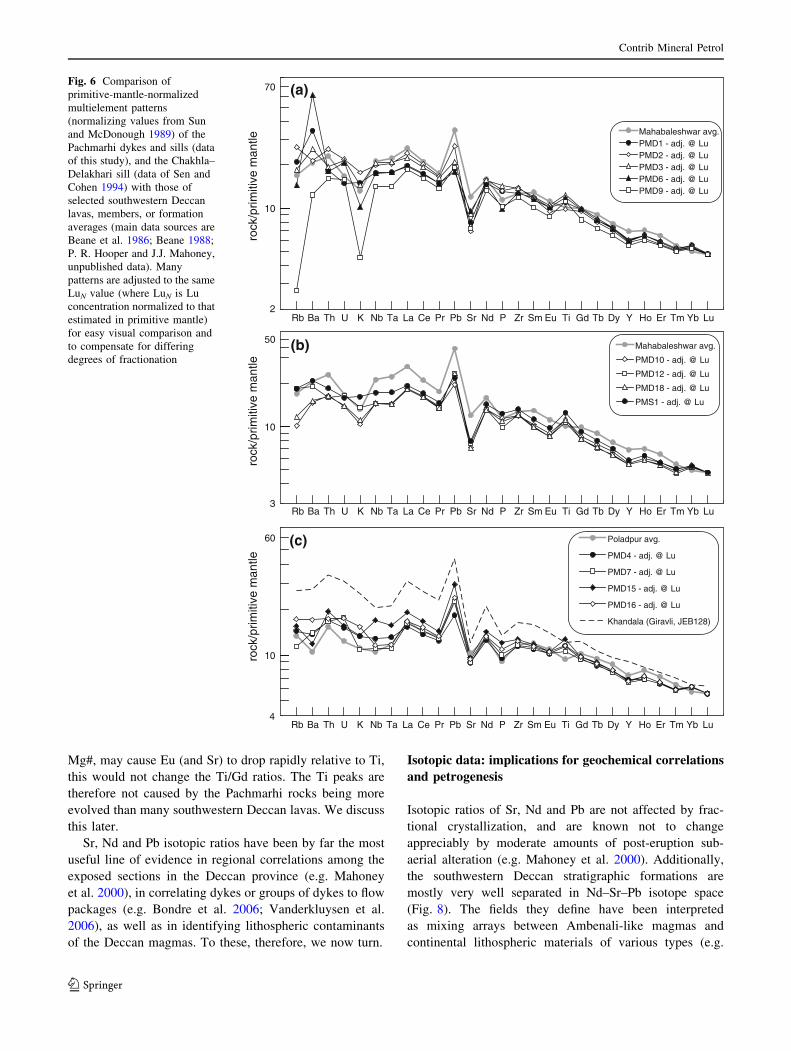
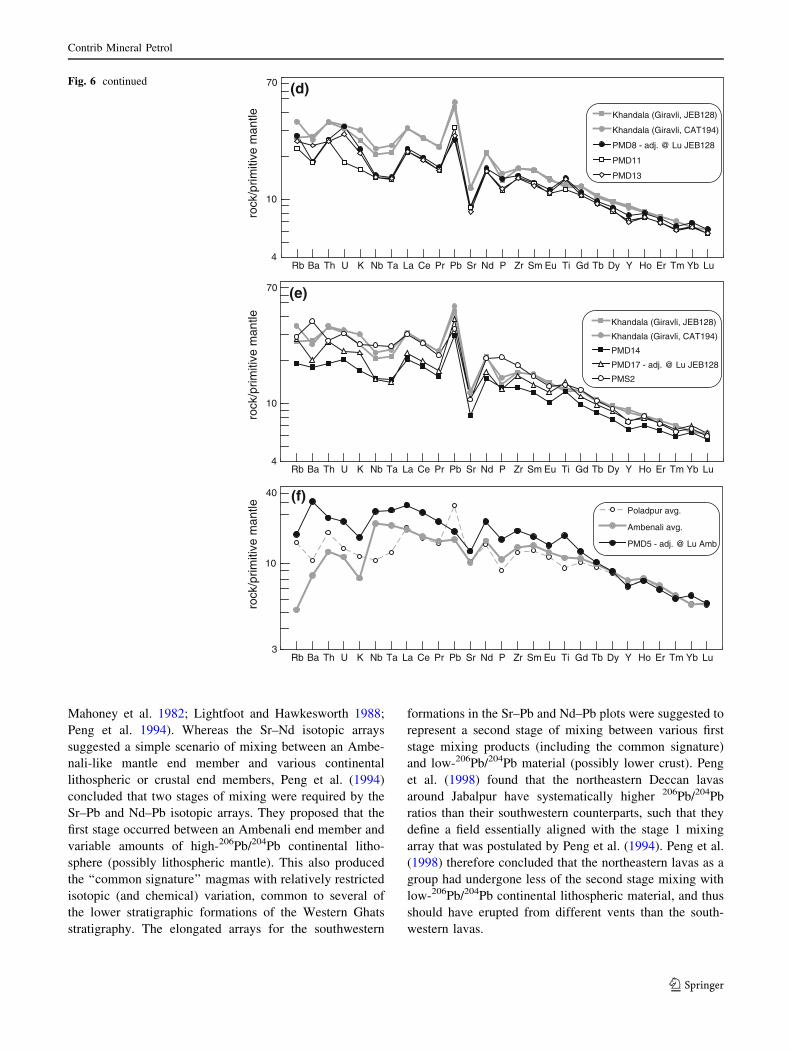
Patterns of dykes PMD1, 2, 3, 6 and 9 are strongly like
those of the Mahabaleshwar Formation, though somewhat
less ‘‘enriched’’ in La, Ce, Nb, Ta, and elements from Sm
to Tm than the Mahabaleshwar (Fig. 6a). Dykes PMD10,
12 and 18, and the Chakhla–Delakhari sill sample PMS1
also resemble the Mahabaleshwar Formation in their mul-
tielement patterns (Fig. 6b). All these rocks systematically
have higher normalized Nb and Ta compared to normalized
K, though alteration-related K loss–or gain–renders K
relationships unreliable.
On the other hand, dykes PMD4, 7 and 15 are distinctly
Poladpur-like (Fig. 6c). A typical Khandala pattern is
shown for comparison in Fig. 6c and is notable for its
steeper slope than the Poladpur’s. Dykes PMD8, 11, 13, 14
and 17, as well as sill sample PMS2, show some resem-
blance to Khandala Formation lavas in their multielement
patterns (Fig. 6d, e). Note the distinct Nb–Ta troughs
in these patterns as well as their steep slopes. Finally,
dyke PMD5 has some key characteristics of Ambenali
Formation lavas in its multielement pattern; note the
characteristic absence of a sizeable Pb peak and the lack of
a Nb–Ta trough, which contrast with the Poladpur pattern
(Fig. 6f).
Dykes PMD8 and PMD9 merge in the field (Fig. 2), but
were sampled away from the point of merger. Figure 6a, d
show that they are distinct geochemically, although
this may be alteration-related in part (with the biggest
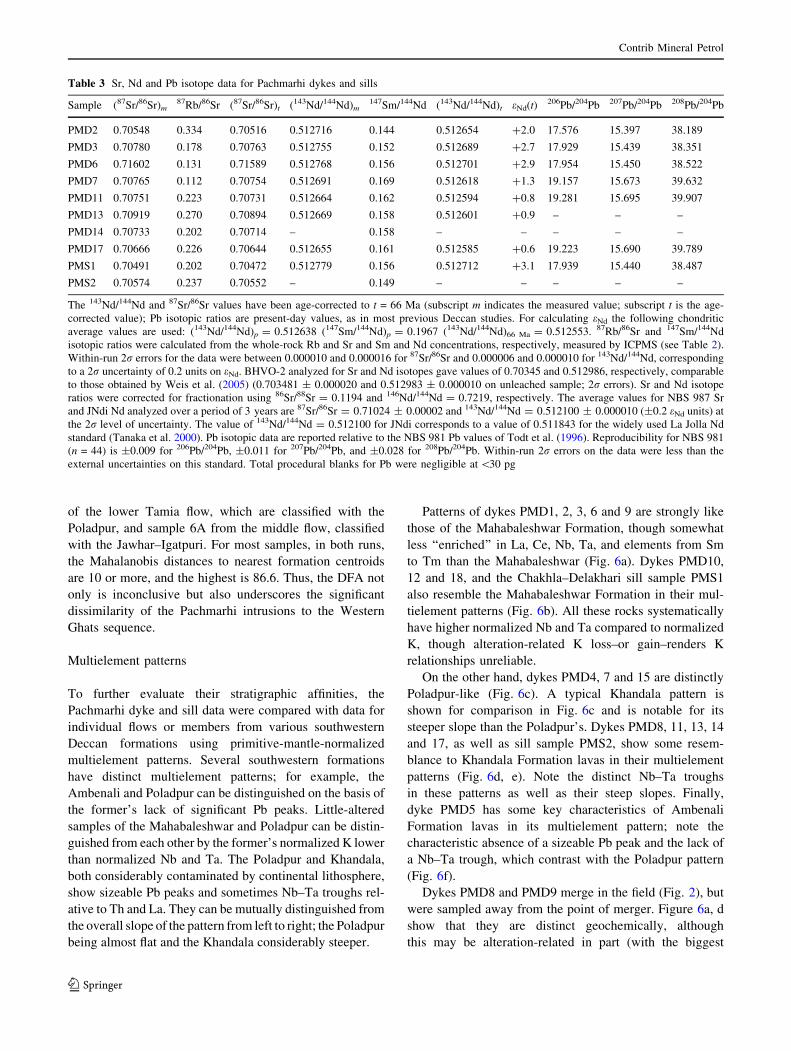
Table 3 Sr, Nd and Pb isotope data for Pachmarhi dykes and sills
Sample (87Sr/86Sr)m87Rb/86Sr (87Sr/86Sr)t (143Nd/144Nd)m
147Sm/144Nd (143Nd/144Nd)t eNd(t) 206Pb/204Pb 207Pb/204Pb 208Pb/204Pb
PMD2 0.70548 0.334 0.70516 0.512716 0.144 0.512654 ?2.0 17.576 15.397 38.189
PMD3 0.70780 0.178 0.70763 0.512755 0.152 0.512689 ?2.7 17.929 15.439 38.351
PMD6 0.71602 0.131 0.71589 0.512768 0.156 0.512701 ?2.9 17.954 15.450 38.522
PMD7 0.70765 0.112 0.70754 0.512691 0.169 0.512618 ?1.3 19.157 15.673 39.632
PMD11 0.70751 0.223 0.70731 0.512664 0.162 0.512594 ?0.8 19.281 15.695 39.907
PMD13 0.70919 0.270 0.70894 0.512669 0.158 0.512601 ?0.9 – – –
PMD14 0.70733 0.202 0.70714 – 0.158 – – – – –
PMD17 0.70666 0.226 0.70644 0.512655 0.161 0.512585 ?0.6 19.223 15.690 39.789
PMS1 0.70491 0.202 0.70472 0.512779 0.156 0.512712 ?3.1 17.939 15.440 38.487
PMS2 0.70574 0.237 0.70552 – 0.149 – – – – –
The 143Nd/144Nd and 87Sr/86Sr values have been age-corrected to t = 66 Ma (subscript m indicates the measured value; subscript t is the age-
corrected value); Pb isotopic ratios are present-day values, as in most previous Deccan studies. For calculating eNd the following chondritic
average values are used: (143Nd/144Nd)p = 0.512638 (147Sm/144Nd)p = 0.1967 (143Nd/144Nd)66 Ma = 0.512553. 87Rb/86Sr and 147Sm/144Nd
isotopic ratios were calculated from the whole-rock Rb and Sr and Sm and Nd concentrations, respectively, measured by ICPMS (see Table 2).
Within-run 2r errors for the data were between 0.000010 and 0.000016 for 87Sr/86Sr and 0.000006 and 0.000010 for 143Nd/144Nd, corresponding
to a 2r uncertainty of 0.2 units on eNd. BHVO-2 analyzed for Sr and Nd isotopes gave values of 0.70345 and 0.512986, respectively, comparable
to those obtained by Weis et al. (2005) (0.703481 ± 0.000020 and 0.512983 ± 0.000010 on unleached sample; 2r errors). Sr and Nd isotope
ratios were corrected for fractionation using 86Sr/88Sr = 0.1194 and 146Nd/144Nd = 0.7219, respectively. The average values for NBS 987 Sr
and JNdi Nd analyzed over a period of 3 years are 87Sr/86Sr = 0.71024 ± 0.00002 and 143Nd/144Nd = 0.512100 ± 0.000010 (±0.2 eNd units) at
the 2r level of uncertainty. The value of 143Nd/144Nd = 0.512100 for JNdi corresponds to a value of 0.511843 for the widely used La Jolla Nd
standard (Tanaka et al. 2000). Pb isotopic data are reported relative to the NBS 981 Pb values of Todt et al. (1996). Reproducibility for NBS 981
(n = 44) is ±0.009 for 206Pb/204Pb, ±0.011 for 207Pb/204Pb, and ±0.028 for 208Pb/204Pb. Within-run 2r errors on the data were less than the
external uncertainties on this standard. Total procedural blanks for Pb were negligible at \30 pg
Contrib Mineral Petrol
123
differences in Rb and K). Dykes PMD10 and PMD12 are
both highly sinuous and were suspected to be the same dyke
in the field; the former crops out south of the large dyke
PMD11, whereas PMD12 intrudes PMD11. Samples
PMD10 and 12 are both very similar geochemically and
Mahabaleshwar-like (Fig. 6b), whereas the dyke that they
intrude (PMD11) is strongly Khandala-like (Fig. 6d), con-
sistent with the southwestern Deccan stratigraphic order.
Dyke PMD2 is about 5 km north of the Chakhla–
Delakhari sill (Fig. 2), and is very similar geochemically to
it (Fig. 6a, b). PMD2 may be fed from the sill, or vice versa.
On the other hand, dyke PMD3 meets the Kandadhana
saucer-shaped sill (sample PMS2), and whereas PMD3 is
strongly Mahabaleshwar-like in its multielement pattern
(Fig. 6a), PMS2 is distinctly Khandala-like (Fig. 6e), and
no simple relationship is possible between the two. PMD13
and PMS2 are nearby and both similar to the Khandala
(Fig. 6d, e); however, dyke PMD16, which is much closer
to PMS2, is quite distinct and Poladpur-like (Fig. 6c).
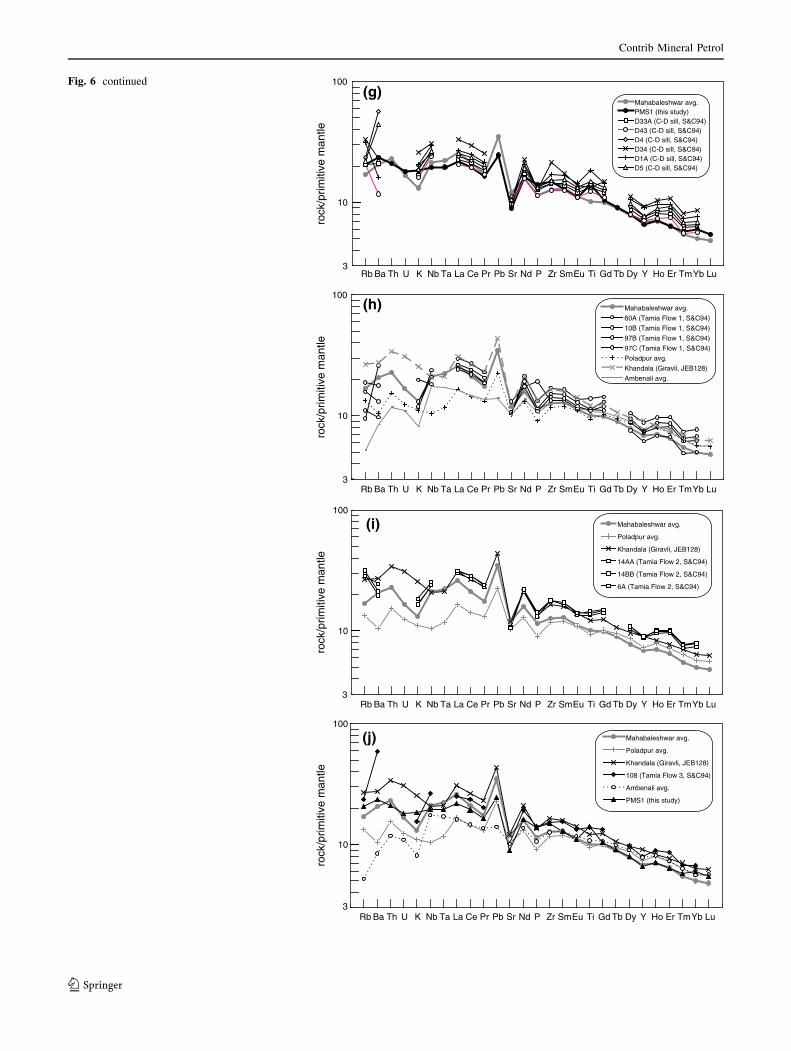
We also plotted the data of Sen and Cohen (1994) for
the Chakhla–Delakhari sill and Tamia lavas on the same
diagrams to compare them to the southwestern formation
data. Sen and Cohen (1994) did not obtain clear, conclusive
matches of the data to particular formations with a Nb/Y
versus Rb/Y plot. Figure 6g shows that the sill samples
resemble the Mahabaleshwar Formation, as do the Tamia
lower and middle flow samples (Fig. 6h, i). The upper
flow’s affinity is somewhat ambiguous (Fig. 6j). Matches
obtained with the DFA were, however, different, even
between the two DFA runs.
Whereas many Pachmarhi intrusions have patterns that
correspond rather closely to patterns of the Mahabaleshwar,
Poladpur, and Khandala Formations (Fig. 6), one important
difference is that the patterns of many samples of this study,
as well as some of Sen and Cohen (1994), have pronounced
Ti peaks (relative to Eu and Gd) whereas the southwestern
Deccan patterns do not. In mafic volcanic rocks Ti is mainly
sequestered in titanomagnetite or ilmenite (e.g. Thy et al.
2008). We do not observe local accumulation of these oxide
minerals in these rocks under the microscope. A question is
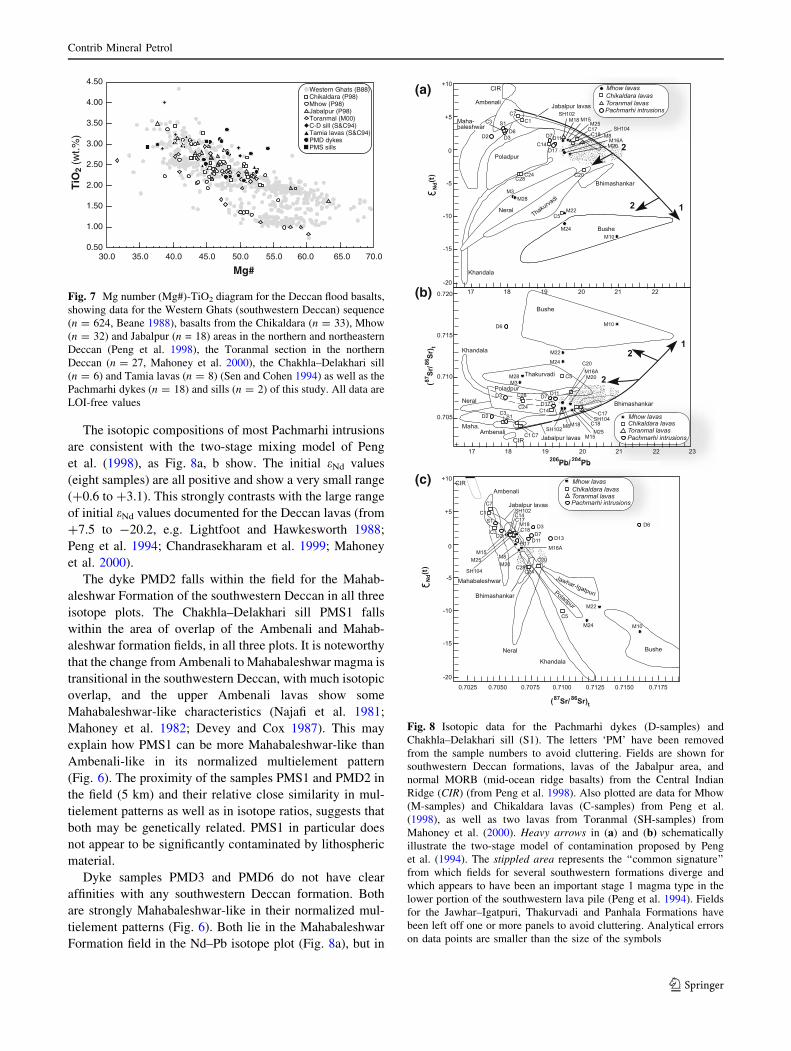
whether we are seeing differing degrees of magma evolu-
tion or fractionation. A simple plot of Mg# with TiO2
(Fig. 7) shows that these parameters are inversely corre-
lated in the Deccan flood basalts (the typical tholeiitic trend
of iron enrichment, Carmichael 1964). The Pachmarhi
intrusions have significantly lower Mg# values (54.1–36.1)
and higher TiO2 contents than half the southwestern Deccan
lavas. Sen (1980, 1983) and Sen and Cohen (1994) have
shown that the Chakhla–Delakhari sill has a highly frac-
tionated composition and shows evidence for periodic
recharge and mixing with fresh small batches of Fe-rich
mafic liquids, as well as local Fe–Ti-oxide-rich pockets.
Their data for the sill and the Tamia lavas, plotted in Fig. 7,
bear this out. These rocks have significantly lower Mg#
values and significantly higher TiO2 contents than the
southwestern Deccan lavas, and a few of their samples have
normalized multielement patterns with large Ti peaks
relative to Eu and Gd.
However, the Ti peaks in the Pachmarhi intrusions’
patterns, as against non-existent Ti peaks (or Ti troughs)
observed in their closest southwestern Deccan lavas, can-
not be explained by the much more evolved compositions
of the Pachmarhi rocks, inasmuch as these rocks do not
show comparably elevated concentrations of the other
incompatible elements (like Nb and Zr). Also, whereas
even massive plagioclase fractionation, not reflected in the
1.0
1.5
2.0
2.5
3.0
3.5
4.0
4.5
5.0
5.5
46 47 48 49 50 51 52 53 54 55 56
SiO2 (wt.%)
Na 2O
+ K
2O (
wt.%
)
Western Ghats (B88)Chikaldara (P98)Mhow (P98)Jabalpur (P98)Toranmal (M00)C-D sill (S&C94)Tamia lavas (S&C94)PMD dykesPMS sills
Basalt
Basaltic andesite
Trachybasalt
Irvine & Baragar 1971
Macdonald & Katsura 1964Basaltic
trachyandesiteFig. 5 Total alkali-silica
diagram of Le Bas et al. (1986)
showing data for the Western
Ghats sequence (n = 624,
Beane 1988), basalts from the
Chikaldara (n = 33), Mhow
(n = 32) and Jabalpur (n = 18)
areas in the northern and
northeastern Deccan (Peng et al.
1998), the Toranmal section in
the northern Deccan (n = 27,
Mahoney et al. 2000), as well as
the Pachmarhi dykes and sills
and Tamia lavas (data of this
study and Sen and Cohen 1994).
All data are LOI-free values
Contrib Mineral Petrol
123
Mg#, may cause Eu (and Sr) to drop rapidly relative to Ti,
this would not change the Ti/Gd ratios. The Ti peaks are
therefore not caused by the Pachmarhi rocks being more
evolved than many southwestern Deccan lavas. We discuss
this later.
Sr, Nd and Pb isotopic ratios have been by far the most
useful line of evidence in regional correlations among the
exposed sections in the Deccan province (e.g. Mahoney
et al. 2000), in correlating dykes or groups of dykes to flow
packages (e.g. Bondre et al. 2006; Vanderkluysen et al.
2006), as well as in identifying lithospheric contaminants
of the Deccan magmas. To these, therefore, we now turn.
Isotopic data: implications for geochemical correlations
and petrogenesis
Isotopic ratios of Sr, Nd and Pb are not affected by frac-
tional crystallization, and are known not to change
appreciably by moderate amounts of post-eruption sub-
aerial alteration (e.g. Mahoney et al. 2000). Additionally,
the southwestern Deccan stratigraphic formations are
mostly very well separated in Nd–Sr–Pb isotope space
(Fig. 8). The fields they define have been interpreted
as mixing arrays between Ambenali-like magmas and
continental lithospheric materials of various types (e.g.
2
10
70
Rb Ba Th U K Nb Ta La Ce Pr Pb Sr Nd P Zr Sm Eu Ti Gd Tb Dy Y Ho Er Tm Yb Lu
Mahabaleshwar avg.PMD1 - adj. @ LuPMD2 - adj. @ LuPMD3 - adj. @ LuPMD6 - adj. @ LuPMD9 - adj. @ Lu
3
10
Rb Ba Th U K Nb Ta La Ce Pr Pb Sr Nd P Zr Sm Eu Ti Gd Tb Dy Y Ho Er Tm Yb Lu
Mahabaleshwar avg.
PMD10 - adj. @ Lu
PMD12 - adj. @ Lu
PMD18 - adj. @ Lu
PMS1 - adj. @ Lu
4
10
Rb Ba Th U K Nb Ta La Ce Pr Pb Sr Nd P Zr Sm Eu Ti Gd Tb Dy Y Ho Er Tm Yb Lu
Poladpur avg.
PMD4 - adj. @ Lu
PMD7 - adj. @ Lu
PMD15 - adj. @ Lu
PMD16 - adj. @ Lu
Khandala (Giravli, JEB128)
50
60
rock
/prim
itive
man
tlero
ck/p
rimiti
ve m
antle
rock
/prim
itive
man
tle
(a)
(b)
(c)
Fig. 6 Comparison of
primitive-mantle-normalized
multielement patterns
(normalizing values from Sun
and McDonough 1989) of the
Pachmarhi dykes and sills (data
of this study), and the Chakhla–
Delakhari sill (data of Sen and
Cohen 1994) with those of
selected southwestern Deccan
lavas, members, or formation
averages (main data sources are
Beane et al. 1986; Beane 1988;
P. R. Hooper and J.J. Mahoney,
unpublished data). Many
patterns are adjusted to the same
LuN value (where LuN is Lu
concentration normalized to that
estimated in primitive mantle)
for easy visual comparison and
to compensate for differing
degrees of fractionation
Contrib Mineral Petrol
123
Mahoney et al. 1982; Lightfoot and Hawkesworth 1988;
Peng et al. 1994). Whereas the Sr–Nd isotopic arrays
suggested a simple scenario of mixing between an Ambe-
nali-like mantle end member and various continental
lithospheric or crustal end members, Peng et al. (1994)
concluded that two stages of mixing were required by the
Sr–Pb and Nd–Pb isotopic arrays. They proposed that the
first stage occurred between an Ambenali end member and
variable amounts of high-206Pb/204Pb continental litho-
sphere (possibly lithospheric mantle). This also produced
the ‘‘common signature’’ magmas with relatively restricted
isotopic (and chemical) variation, common to several of
the lower stratigraphic formations of the Western Ghats
stratigraphy. The elongated arrays for the southwestern
formations in the Sr–Pb and Nd–Pb plots were suggested to
represent a second stage of mixing between various first
stage mixing products (including the common signature)
and low-206Pb/204Pb material (possibly lower crust). Peng
et al. (1998) found that the northeastern Deccan lavas
around Jabalpur have systematically higher 206Pb/204Pb
ratios than their southwestern counterparts, such that they
define a field essentially aligned with the stage 1 mixing
array that was postulated by Peng et al. (1994). Peng et al.
(1998) therefore concluded that the northeastern lavas as a
group had undergone less of the second stage mixing with
low-206Pb/204Pb continental lithospheric material, and thus
should have erupted from different vents than the south-
western lavas.
rock
/prim
itive
man
tlero
ck/p
rimiti
ve m
antle
4
10
70
Rb Ba Th U K Nb Ta La Ce Pr Pb Sr Nd P Zr Sm Eu Ti Gd Tb Dy Y Ho Er Tm Yb Lu
Khandala (Giravli, JEB128)
Khandala (Giravli, CAT194)
PMD8 - adj. @ Lu JEB128
PMD11
PMD13
4
10
70
Rb Ba Th U K Nb Ta La Ce Pr Pb Sr Nd P Zr Sm Eu Ti Gd Tb Dy Y Ho Er Tm Yb Lu
Khandala (Giravli, JEB128)
Khandala (Giravli, CAT194)
PMD14
PMD17 - adj. @ Lu JEB128
PMS2
(d)
(e)
3
10
40
Rb Ba Th U K Nb Ta La Ce Pr Pb Sr Nd P Zr Sm Eu Ti Gd Tb Dy Y Ho Er Tm Yb Lu
rock
/prim
itive
man
tle Poladpur avg.
Ambenali avg.
PMD5 - adj. @ Lu Amb
(f)
Fig. 6 continued
Contrib Mineral Petrol
123
3
10
100
Rb Ba Th U K Nb Ta La Ce Pr Pb Sr Nd P Zr SmEu Ti Gd Tb Dy Y Ho Er TmYb Lu
Mahabaleshwar avg.PMS1 (this study)D33A (C-D sill, S&C94)D43 (C-D sill, S&C94)D4 (C-D sill, S&C94)D34 (C-D sill, S&C94)D1A (C-D sill, S&C94)D5 (C-D sill, S&C94)
3
10
100
Rb Ba Th U K Nb Ta La Ce Pr Pb Sr Nd P Zr SmEu Ti Gd Tb Dy Y Ho Er TmYb Lu
Mahabaleshwar avg.
60A (Tamia Flow 1, S&C94)
10B (Tamia Flow 1, S&C94)
97B (Tamia Flow 1, S&C94)
97C (Tamia Flow 1, S&C94)
Poladpur avg.
Khandala (Giravli, JEB128)
Ambenali avg.
3
10
100
Rb Ba Th U K Nb Ta La Ce Pr Pb Sr Nd P Zr SmEu Ti Gd Tb Dy Y Ho Er TmYb Lu
Mahabaleshwar avg.
Poladpur avg.
Khandala (Giravli, JEB128)
14AA (Tamia Flow 2, S&C94)
14BB (Tamia Flow 2, S&C94)
6A (Tamia Flow 2, S&C94)
3
10
100
Rb Ba Th U K Nb Ta La Ce Pr Pb Sr Nd P Zr SmEu Ti Gd Tb Dy Y Ho Er TmYb Lu
Mahabaleshwar avg.
Poladpur avg.
Khandala (Giravli, JEB128)
108 (Tamia Flow 3, S&C94)
Ambenali avg.
PMS1 (this study)
(g)
(h)
(j)
(i)
rock
/prim
itive
man
tlero
ck/p
rimiti
ve m
antle
rock
/prim
itive
man
tlero
ck/p
rimiti
ve m
antle
Fig. 6 continued
Contrib Mineral Petrol
123
The isotopic compositions of most Pachmarhi intrusions
are consistent with the two-stage mixing model of Peng
et al. (1998), as Fig. 8a, b show. The initial eNd values
(eight samples) are all positive and show a very small range
(?0.6 to ?3.1). This strongly contrasts with the large range
of initial eNd values documented for the Deccan lavas (from
?7.5 to -20.2, e.g. Lightfoot and Hawkesworth 1988;
Peng et al. 1994; Chandrasekharam et al. 1999; Mahoney
et al. 2000).
The dyke PMD2 falls within the field for the Mahab-
aleshwar Formation of the southwestern Deccan in all three
isotope plots. The Chakhla–Delakhari sill PMS1 falls
within the area of overlap of the Ambenali and Mahab-
aleshwar formation fields, in all three plots. It is noteworthy
that the change from Ambenali to Mahabaleshwar magma is
transitional in the southwestern Deccan, with much isotopic
overlap, and the upper Ambenali lavas show some
Mahabaleshwar-like characteristics (Najafi et al. 1981;
Mahoney et al. 1982; Devey and Cox 1987). This may
explain how PMS1 can be more Mahabaleshwar-like than
Ambenali-like in its normalized multielement pattern
(Fig. 6). The proximity of the samples PMS1 and PMD2 in
the field (5 km) and their relative close similarity in mul-
tielement patterns as well as in isotope ratios, suggests that
both may be genetically related. PMS1 in particular does
not appear to be significantly contaminated by lithospheric
material.
Dyke samples PMD3 and PMD6 do not have clear
affinities with any southwestern Deccan formation. Both
are strongly Mahabaleshwar-like in their normalized mul-
tielement patterns (Fig. 6). Both lie in the Mahabaleshwar
Formation field in the Nd–Pb isotope plot (Fig. 8a), but in
0.50
1.00
1.50
2.00
2.50
3.00
3.50
4.00
4.50
30.0 35.0 40.0 45.0 50.0 55.0 60.0 65.0 70.0
Western Ghats (B88)Chikaldara (P98)Mhow (P98)Jabalpur (P98)Toranmal (M00)C-D sill (S&C94)Tamia lavas (S&C94)PMD dykesPMS sills
Mg#
TiO
2 (w
t.%)
Fig. 7 Mg number (Mg#)-TiO2 diagram for the Deccan flood basalts,
showing data for the Western Ghats (southwestern Deccan) sequence
(n = 624, Beane 1988), basalts from the Chikaldara (n = 33), Mhow
(n = 32) and Jabalpur (n = 18) areas in the northern and northeastern
Deccan (Peng et al. 1998), the Toranmal section in the northern
Deccan (n = 27, Mahoney et al. 2000), the Chakhla–Delakhari sill
(n = 6) and Tamia lavas (n = 8) (Sen and Cohen 1994) as well as the
Pachmarhi dykes (n = 18) and sills (n = 2) of this study. All data are
LOI-free values
(b)
(a)
(c)
Fig. 8 Isotopic data for the Pachmarhi dykes (D-samples) and
Chakhla–Delakhari sill (S1). The letters ‘PM’ have been removed
from the sample numbers to avoid cluttering. Fields are shown for
southwestern Deccan formations, lavas of the Jabalpur area, and
normal MORB (mid-ocean ridge basalts) from the Central Indian
Ridge (CIR) (from Peng et al. 1998). Also plotted are data for Mhow
(M-samples) and Chikaldara lavas (C-samples) from Peng et al.
(1998), as well as two lavas from Toranmal (SH-samples) from
Mahoney et al. (2000). Heavy arrows in (a) and (b) schematically
illustrate the two-stage model of contamination proposed by Peng
et al. (1994). The stippled area represents the ‘‘common signature’’
from which fields for several southwestern formations diverge and
which appears to have been an important stage 1 magma type in the
lower portion of the southwestern lava pile (Peng et al. 1994). Fields
for the Jawhar–Igatpuri, Thakurvadi and Panhala Formations have
been left off one or more panels to avoid cluttering. Analytical errors
on data points are smaller than the size of the symbols
Contrib Mineral Petrol
123
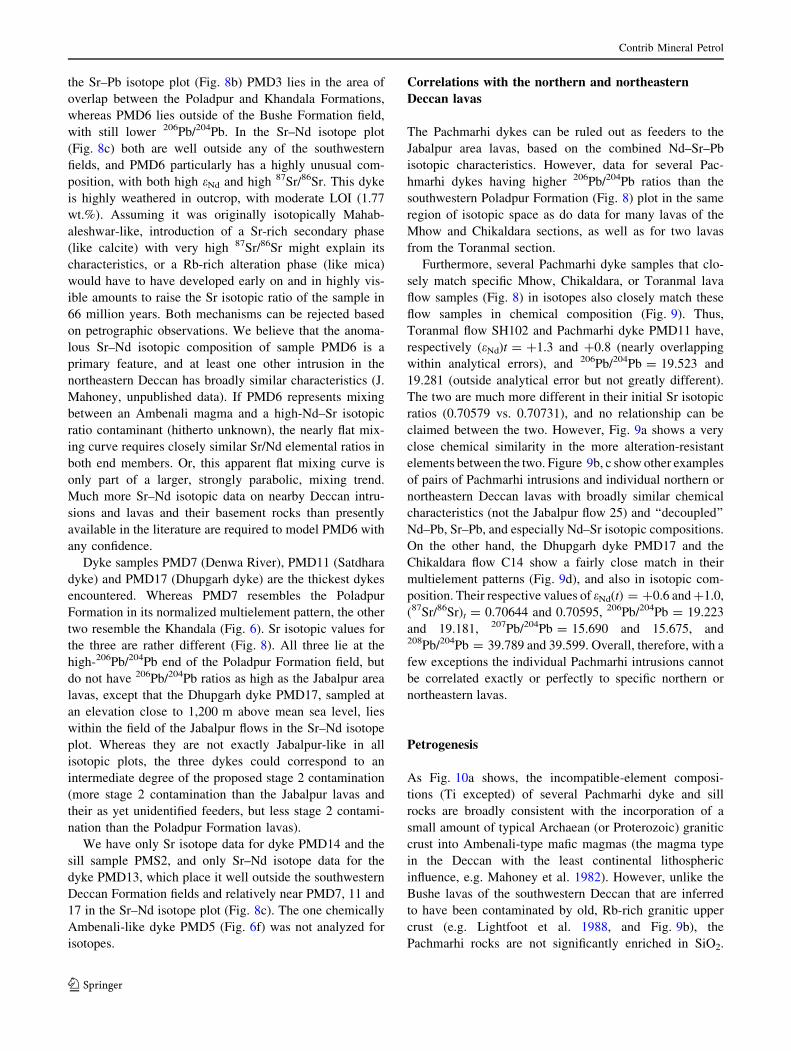
the Sr–Pb isotope plot (Fig. 8b) PMD3 lies in the area of
overlap between the Poladpur and Khandala Formations,
whereas PMD6 lies outside of the Bushe Formation field,
with still lower 206Pb/204Pb. In the Sr–Nd isotope plot
(Fig. 8c) both are well outside any of the southwestern
fields, and PMD6 particularly has a highly unusual com-
position, with both high eNd and high 87Sr/86Sr. This dyke
is highly weathered in outcrop, with moderate LOI (1.77
wt.%). Assuming it was originally isotopically Mahab-
aleshwar-like, introduction of a Sr-rich secondary phase
(like calcite) with very high 87Sr/86Sr might explain its
characteristics, or a Rb-rich alteration phase (like mica)
would have to have developed early on and in highly vis-
ible amounts to raise the Sr isotopic ratio of the sample in
66 million years. Both mechanisms can be rejected based
on petrographic observations. We believe that the anoma-
lous Sr–Nd isotopic composition of sample PMD6 is a
primary feature, and at least one other intrusion in the
northeastern Deccan has broadly similar characteristics (J.
Mahoney, unpublished data). If PMD6 represents mixing
between an Ambenali magma and a high-Nd–Sr isotopic
ratio contaminant (hitherto unknown), the nearly flat mix-
ing curve requires closely similar Sr/Nd elemental ratios in
both end members. Or, this apparent flat mixing curve is
only part of a larger, strongly parabolic, mixing trend.
Much more Sr–Nd isotopic data on nearby Deccan intru-
sions and lavas and their basement rocks than presently
available in the literature are required to model PMD6 with
any confidence.
Dyke samples PMD7 (Denwa River), PMD11 (Satdhara
dyke) and PMD17 (Dhupgarh dyke) are the thickest dykes
encountered. Whereas PMD7 resembles the Poladpur
Formation in its normalized multielement pattern, the other
two resemble the Khandala (Fig. 6). Sr isotopic values for
the three are rather different (Fig. 8). All three lie at the
high-206Pb/204Pb end of the Poladpur Formation field, but
do not have 206Pb/204Pb ratios as high as the Jabalpur area
lavas, except that the Dhupgarh dyke PMD17, sampled at
an elevation close to 1,200 m above mean sea level, lies
within the field of the Jabalpur flows in the Sr–Nd isotope
plot. Whereas they are not exactly Jabalpur-like in all
isotopic plots, the three dykes could correspond to an
intermediate degree of the proposed stage 2 contamination
(more stage 2 contamination than the Jabalpur lavas and
their as yet unidentified feeders, but less stage 2 contami-
nation than the Poladpur Formation lavas).
We have only Sr isotope data for dyke PMD14 and the
sill sample PMS2, and only Sr–Nd isotope data for the
dyke PMD13, which place it well outside the southwestern
Deccan Formation fields and relatively near PMD7, 11 and
17 in the Sr–Nd isotope plot (Fig. 8c). The one chemically
Ambenali-like dyke PMD5 (Fig. 6f) was not analyzed for
isotopes.
Correlations with the northern and northeastern
Deccan lavas
The Pachmarhi dykes can be ruled out as feeders to the
Jabalpur area lavas, based on the combined Nd–Sr–Pb
isotopic characteristics. However, data for several Pac-
hmarhi dykes having higher 206Pb/204Pb ratios than the
southwestern Poladpur Formation (Fig. 8) plot in the same
region of isotopic space as do data for many lavas of the
Mhow and Chikaldara sections, as well as for two lavas
from the Toranmal section.
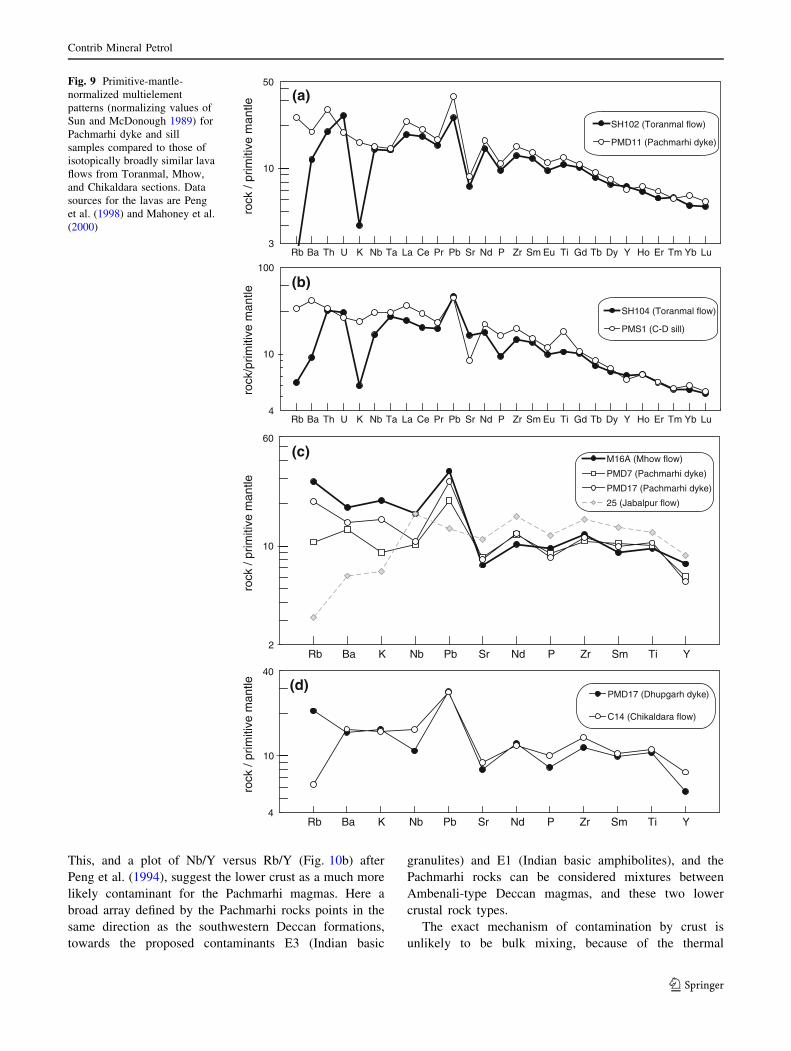
Furthermore, several Pachmarhi dyke samples that clo-
sely match specific Mhow, Chikaldara, or Toranmal lava
flow samples (Fig. 8) in isotopes also closely match these
flow samples in chemical composition (Fig. 9). Thus,
Toranmal flow SH102 and Pachmarhi dyke PMD11 have,
respectively (eNd)t = ?1.3 and ?0.8 (nearly overlapping
within analytical errors), and 206Pb/204Pb = 19.523 and
19.281 (outside analytical error but not greatly different).
The two are much more different in their initial Sr isotopic
ratios (0.70579 vs. 0.70731), and no relationship can be
claimed between the two. However, Fig. 9a shows a very
close chemical similarity in the more alteration-resistant
elements between the two. Figure 9b, c show other examples
of pairs of Pachmarhi intrusions and individual northern or
northeastern Deccan lavas with broadly similar chemical
characteristics (not the Jabalpur flow 25) and ‘‘decoupled’’
Nd–Pb, Sr–Pb, and especially Nd–Sr isotopic compositions.
On the other hand, the Dhupgarh dyke PMD17 and the
Chikaldara flow C14 show a fairly close match in their
multielement patterns (Fig. 9d), and also in isotopic com-
position. Their respective values of eNd(t) = ?0.6 and ?1.0,
(87Sr/86Sr)t = 0.70644 and 0.70595, 206Pb/204Pb = 19.223
and 19.181, 207Pb/204Pb = 15.690 and 15.675, and208Pb/204Pb = 39.789 and 39.599. Overall, therefore, with a
few exceptions the individual Pachmarhi intrusions cannot
be correlated exactly or perfectly to specific northern or
northeastern lavas.
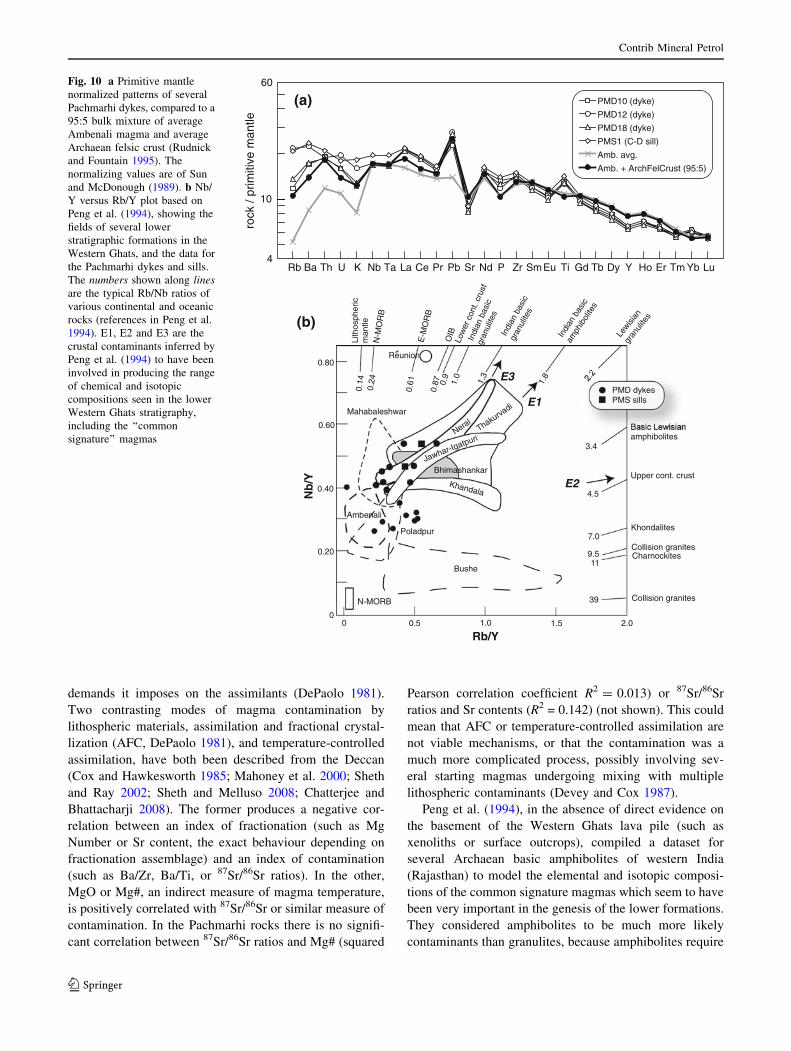
Petrogenesis
As Fig. 10a shows, the incompatible-element composi-
tions (Ti excepted) of several Pachmarhi dyke and sill
rocks are broadly consistent with the incorporation of a
small amount of typical Archaean (or Proterozoic) granitic
crust into Ambenali-type mafic magmas (the magma type
in the Deccan with the least continental lithospheric
influence, e.g. Mahoney et al. 1982). However, unlike the
Bushe lavas of the southwestern Deccan that are inferred
to have been contaminated by old, Rb-rich granitic upper
crust (e.g. Lightfoot et al. 1988, and Fig. 9b), the
Pachmarhi rocks are not significantly enriched in SiO2.
Contrib Mineral Petrol
123
This, and a plot of Nb/Y versus Rb/Y (Fig. 10b) after
Peng et al. (1994), suggest the lower crust as a much more
likely contaminant for the Pachmarhi magmas. Here a
broad array defined by the Pachmarhi rocks points in the
same direction as the southwestern Deccan formations,
towards the proposed contaminants E3 (Indian basic
granulites) and E1 (Indian basic amphibolites), and the
Pachmarhi rocks can be considered mixtures between
Ambenali-type Deccan magmas, and these two lower
crustal rock types.
The exact mechanism of contamination by crust is
unlikely to be bulk mixing, because of the thermal
3
10
50
Rb Ba Th U K Nb Ta La Ce Pr Pb Sr Nd P Zr Sm Eu Ti Gd Tb Dy Y Ho Er Tm Yb Lu
SH102 (Toranmal flow)
PMD11 (Pachmarhi dyke)
4
10
100
Rb Ba Th U K Nb Ta La Ce Pr Pb Sr Nd P Zr Sm Eu Ti Gd Tb Dy Y Ho Er Tm Yb Lu
SH104 (Toranmal flow)
PMS1 (C-D sill)
2
10
Rb Ba K Nb Pb Sr Nd P Zr Sm Ti Y
M16A (Mhow flow)
PMD7 (Pachmarhi dyke)
PMD17 (Pachmarhi dyke)
25 (Jabalpur flow)
4
10
Rb Ba K Nb Pb Sr Nd P Zr Sm Ti Y
PMD17 (Dhupgarh dyke)
C14 (Chikaldara flow)
rock
/ pr
imiti
ve m
antle
60
40
(a)
(b)
(c)
(d)
rock
/ pr
imiti
ve m
antle
rock
/ pr
imiti
ve m
antle
rock
/prim
itive
man
tle
Fig. 9 Primitive-mantle-
normalized multielement
patterns (normalizing values of
Sun and McDonough 1989) for
Pachmarhi dyke and sill
samples compared to those of
isotopically broadly similar lava
flows from Toranmal, Mhow,
and Chikaldara sections. Data
sources for the lavas are Peng
et al. (1998) and Mahoney et al.
(2000)
Contrib Mineral Petrol
123
demands it imposes on the assimilants (DePaolo 1981).
Two contrasting modes of magma contamination by
lithospheric materials, assimilation and fractional crystal-
lization (AFC, DePaolo 1981), and temperature-controlled
assimilation, have both been described from the Deccan
(Cox and Hawkesworth 1985; Mahoney et al. 2000; Sheth
and Ray 2002; Sheth and Melluso 2008; Chatterjee and
Bhattacharji 2008). The former produces a negative cor-
relation between an index of fractionation (such as Mg
Number or Sr content, the exact behaviour depending on
fractionation assemblage) and an index of contamination
(such as Ba/Zr, Ba/Ti, or 87Sr/86Sr ratios). In the other,
MgO or Mg#, an indirect measure of magma temperature,
is positively correlated with 87Sr/86Sr or similar measure of
contamination. In the Pachmarhi rocks there is no signifi-
cant correlation between 87Sr/86Sr ratios and Mg# (squared
Pearson correlation coefficient R2 = 0.013) or 87Sr/86Sr
ratios and Sr contents (R2 = 0.142) (not shown). This could
mean that AFC or temperature-controlled assimilation are
not viable mechanisms, or that the contamination was a
much more complicated process, possibly involving sev-
eral starting magmas undergoing mixing with multiple
lithospheric contaminants (Devey and Cox 1987).
Peng et al. (1994), in the absence of direct evidence on
the basement of the Western Ghats lava pile (such as
xenoliths or surface outcrops), compiled a dataset for
several Archaean basic amphibolites of western India
(Rajasthan) to model the elemental and isotopic composi-
tions of the common signature magmas which seem to have
been very important in the genesis of the lower formations.
They considered amphibolites to be much more likely
contaminants than granulites, because amphibolites require
2
4
10
60
Rb Ba Th U K Nb Ta La Ce Pr Pb Sr Nd P Zr SmEu Ti Gd Tb Dy Y Ho Er Tm Yb Lu
PMD10 (dyke)
PMD12 (dyke)
PMD18 (dyke)
PMS1 (C-D sill)
Amb. avg.
Amb. + ArchFelCrust (95:5)
rock
/ pr
imiti
ve m
antle
Khandala
Bushe
Jawhar-IgatpuriThaku
rvadi
Neral
Bhimashankar
Mahabaleshwar
Poladpur
Ambenali
Upper cont. crust
amphibolites
Khondalites
Collision granitesCharnockites
Collision granites
Indi
an b
asic
amph
ibol
ites
Lewisi
angr
anul
ites
Indi
an b
asic
gran
ulite
s
Indi
an b
asic
gran
ulite
s
Low
er c
ont.
crus
t
OIB
E-M
OR
B
N-M
OR
B
Lith
osph
eric
man
tle
N-MORB
0.5 1.0 1.5 2.00
0.20
0
0.40
0.60
0.80
Rb/Y
Nb
/Y
Reunion0.
140.
24
0.61
0.87 0.
91.
0
1.3
1.8
3.4
4.5
7.0
9.511
39
E2
E1
E3
(a)
(b)
PMD dykesPMS sills
Fig. 10 a Primitive mantle
normalized patterns of several
Pachmarhi dykes, compared to a
95:5 bulk mixture of average
Ambenali magma and average
Archaean felsic crust (Rudnick
and Fountain 1995). The
normalizing values are of Sun
and McDonough (1989). b Nb/
Y versus Rb/Y plot based on
Peng et al. (1994), showing the
fields of several lower
stratigraphic formations in the
Western Ghats, and the data for
the Pachmarhi dykes and sills.
The numbers shown along linesare the typical Rb/Nb ratios of
various continental and oceanic
rocks (references in Peng et al.
1994). E1, E2 and E3 are the
crustal contaminants inferred by
Peng et al. (1994) to have been
involved in producing the range
of chemical and isotopic
compositions seen in the lower
Western Ghats stratigraphy,
including the ‘‘common
signature’’ magmas
Contrib Mineral Petrol
123
substantially lower melting temperatures or yield greater
melt fractions at given temperatures than granulites. They
were able to reproduce the chemical and isotopic compo-
sitions of the common signature magmas by 10–30% bulk
contamination of Ambenali and Reunion-type magmas by
a calculated 40% partial melt of the average Indian basic
amphibolite. Rushmer’s (1991) experimental work shows
that at 8 kb pressure (equivalent to mid-lower crustal
conditions), hornblende—a phase with a high Kd value for
Ti relative to, say, Sm, Zr, or Y (references in Peng et al.
1994)—begins to break down at about 925�C into moder-
ately siliceous melt (*55% SiO2) and an anhydrous
granulitic residue (clinopyroxene, orthopyroxene, plagio-
clase). Notably, whereas increasing modal amounts of
these residual phases, as well as ilmenite, are produced at
increasing temperatures up to *1,000�C, no residual
ilmenite accompanies these residual phases at *925–
950�C. This means Ti-rich liquids during the beginning
stages of hornblende dehydration melting (Rushmer 1991).
Bulk mixing of such amphibolite partial melts with Deccan
basalt magmas would generate mixtures with enrichments
in Ti but not in the other incompatible elements like Nb
and Zr, as well as high Ti/Eu and Ti/Gd ratios. Also, the
mixed liquids would retain their basalt, ferrobasalt or
basaltic andesite compositions (Fig. 5), and appear con-
siderably more fractionated, in terms of Mg# (Fig. 7), than
they really were (cf. Natland 2007).
Precambrian lower crustal rocks—granulites, amphibo-
lites, and gneisses—indeed outcrop a few tens of
kilometres south of Pachmarhi, where they define the
Central Indian Tectonic Zone, a Proterozoic fold belt
(Acharyya 2003). Despite much available data on the
mineral chemistry and metamorphic evolution of these
rocks (Bhowmik and Roy 2003; Bhowmik et al. 2005;
Bhowmik 2006), we have not found whole-rock geo-
chemical data for them with which to model their partial
melting. Nevertheless, we show in Fig. 11 that several of
the Pachmarhi dykes—specifically dykes PMD7, 11, and
17—are closely similar to the common signature lavas
from the lower levels of the Western Ghats stratigraphy,
and dyke PMD2 and sill PMS2 have a very strong simi-
larity to the individual common signature lava sample
SAM001 in their normalized multielement patterns,
including Ti, and with the exception of a trough at P for the
latter (data for many trace elements, including Eu and Gd,
are not available). Notably, dykes PMD7, 11, and 17 are
very close in all three isotopes (Fig. 8), and cover a very
small region in isotopic space not far from the common
signature lavas. Whereas we do not think this suggests that
the feeders of the common signature lavas are in the Pac-
hmarhi area, vast as the distance implied is (*600 km), the
result is significant in showing that (1) magmas closely
similar to the common signature magmas of the lower
Western Ghats stratigraphy were produced and emplaced
600 km to the northeast, (2) basic amphibolites such as
those used by Peng et al. (1994) are indeed a plausible
contaminant for the Pachmarhi intrusions, and (3) for
explaining closely similar geochemical signatures in Dec-
can lava sections separated by hundreds of kilometres,
independent parallel evolution is at least as viable and
attractive a hypothesis as long-distance surface transport
(cf. Sen and Cohen 1994; Sheth and Chandrasekharam
1997; Peng et al. 1998).
Discussion
The Chakhla–Delakhari sill: feeder or not?
Isotopic data on sample PMS1 from the lower chilled
margin of the Chakhla–Delakhari sill provide, for the first
time, information on the isotopic composition of the
starting magma that produced this sill, although we realize
that the sill requires much more thorough geochemical and
isotopic characterization. The PMS1 composition is
slightly lower in eNd than most Ambenali Formation lavas,
which are contaminated little by continental lithospheric
materials, and requires that the fractionation and contami-
nation that resulted in the PMS1 composition would have
occurred still earlier, before the sill was emplaced, proba-
bly in a deeper magma chamber.
The sill is intruded into the Gondwana sandstones and
shales underlying the Tamia lavas. Discriminant function
analysis classified samples of the lower flow at Tamia
dominantly with the Poladpur Formation, and those of the
middle flow with the Jawhar-Igatpuri and Poladpur For-
mations, whereas the lower and middle flows are best
matched with the Mahabaleshwar Formation on the basis
of normalized multielement patterns. The upper flow’s
affinities remain ambiguous with either tool. Isotopic data
are unfortunately unavailable for Tamia lavas. On the basis
of the multielement patterns of the lower two Tamia flows,
the combined Ambenali/Mahabaleshwar-type isotopic
composition of the sill’s lower chilled margin (PMS1), as
well as dyke PMD2, we suggest that the sill and this dyke
are potential feeders to the lower two Tamia flows.
Notably, Crookshank (1936) reported that the sill was
the feeder of the lower and upper of the three Tamia flows.
Sen (1980) considered this questionable noting that oli-
vines in these two flows (Fo87–88) were much more
magnesian than the most Mg-rich olivine in the sill (Fo76).
Subsequently, Sen and Cohen (1994) concluded that at
least the upper flow had been fed by the sill. Our finding
that the sill and the dyke PMD2 are closest geochemically
to the lower and middle flows only adds to the existing
confusion. We note here that whereas a few samples of the
Contrib Mineral Petrol
123
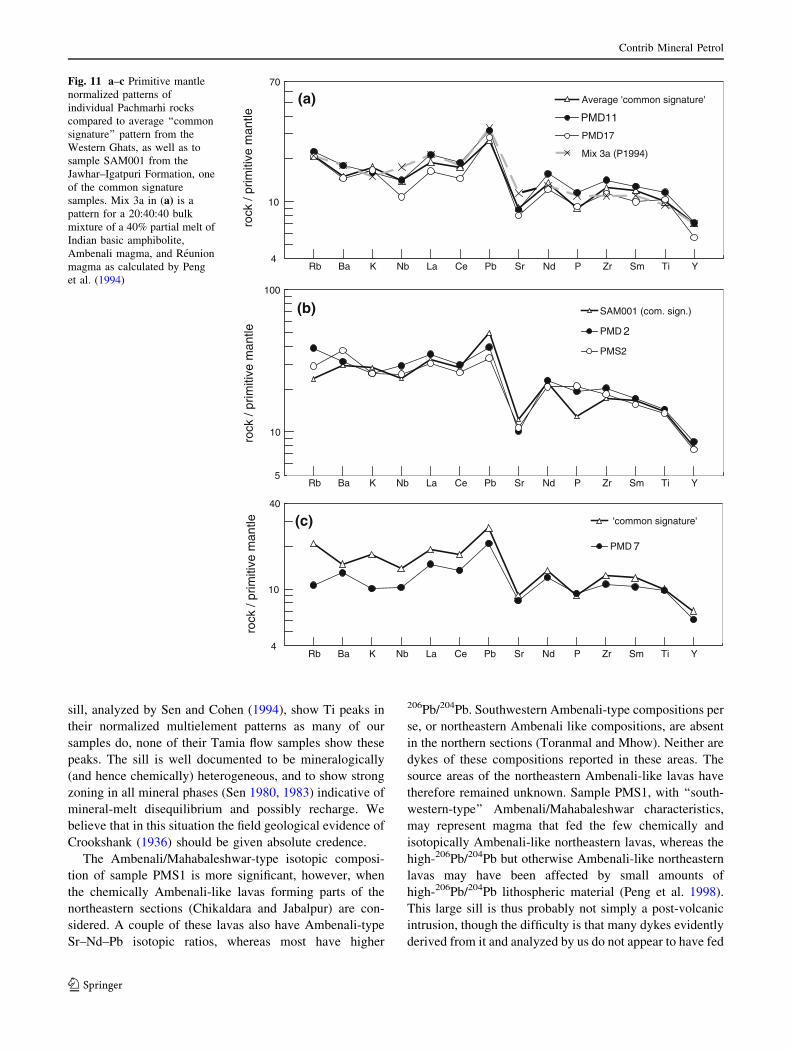
sill, analyzed by Sen and Cohen (1994), show Ti peaks in
their normalized multielement patterns as many of our
samples do, none of their Tamia flow samples show these
peaks. The sill is well documented to be mineralogically
(and hence chemically) heterogeneous, and to show strong
zoning in all mineral phases (Sen 1980, 1983) indicative of
mineral-melt disequilibrium and possibly recharge. We
believe that in this situation the field geological evidence of
Crookshank (1936) should be given absolute credence.
The Ambenali/Mahabaleshwar-type isotopic composi-
tion of sample PMS1 is more significant, however, when
the chemically Ambenali-like lavas forming parts of the
northeastern sections (Chikaldara and Jabalpur) are con-
sidered. A couple of these lavas also have Ambenali-type
Sr–Nd–Pb isotopic ratios, whereas most have higher
206Pb/204Pb. Southwestern Ambenali-type compositions per
se, or northeastern Ambenali like compositions, are absent
in the northern sections (Toranmal and Mhow). Neither are
dykes of these compositions reported in these areas. The
source areas of the northeastern Ambenali-like lavas have
therefore remained unknown. Sample PMS1, with ‘‘south-
western-type’’ Ambenali/Mahabaleshwar characteristics,
may represent magma that fed the few chemically and
isotopically Ambenali-like northeastern lavas, whereas the
high-206Pb/204Pb but otherwise Ambenali-like northeastern
lavas may have been affected by small amounts of
high-206Pb/204Pb lithospheric material (Peng et al. 1998).
This large sill is thus probably not simply a post-volcanic
intrusion, though the difficulty is that many dykes evidently
derived from it and analyzed by us do not appear to have fed
4
10
40
Rb Ba K Nb La Ce Pb Sr Nd P Zr Sm Ti Y
'common signature'
PMD 7
5
10
100
Rb Ba K Nb La Ce Pb Sr Nd P Zr Sm Ti Y
SAM001 (com. sign.)
PMD 2
PMS2
4
10
70
Rb Ba K Nb La Ce Pb Sr Nd P Zr Sm Ti Y
Average 'common signature'
PMD11
PMD17
Mix 3a (P1994)
rock
/ pr
imiti
ve m
antle
rock
/ pr
imiti
ve m
antle
rock
/ pr
imiti
ve m
antle
(a)
(b)
(c)
Fig. 11 a–c Primitive mantle
normalized patterns of
individual Pachmarhi rocks
compared to average ‘‘common
signature’’ pattern from the
Western Ghats, as well as to
sample SAM001 from the
Jawhar–Igatpuri Formation, one
of the common signature
samples. Mix 3a in (a) is a
pattern for a 20:40:40 bulk
mixture of a 40% partial melt of
Indian basic amphibolite,
Ambenali magma, and Reunion
magma as calculated by Peng
et al. (1994)
Contrib Mineral Petrol
123
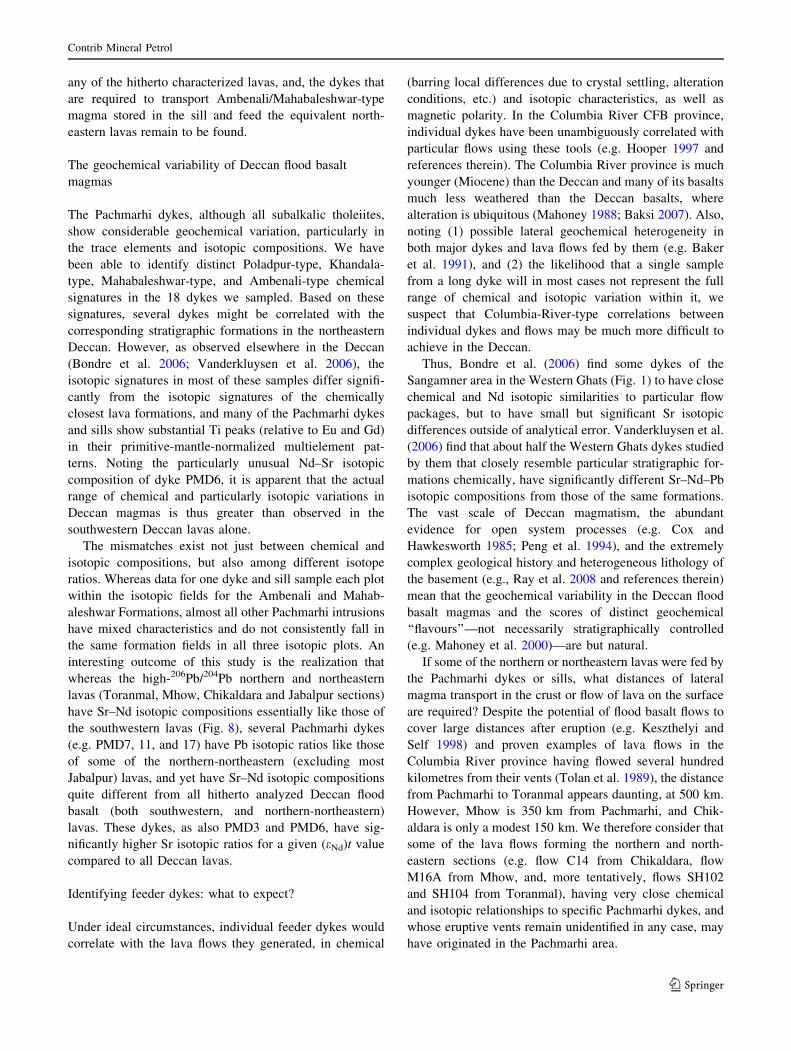
any of the hitherto characterized lavas, and, the dykes that
are required to transport Ambenali/Mahabaleshwar-type
magma stored in the sill and feed the equivalent north-
eastern lavas remain to be found.
The geochemical variability of Deccan flood basalt
magmas
The Pachmarhi dykes, although all subalkalic tholeiites,
show considerable geochemical variation, particularly in
the trace elements and isotopic compositions. We have
been able to identify distinct Poladpur-type, Khandala-
type, Mahabaleshwar-type, and Ambenali-type chemical
signatures in the 18 dykes we sampled. Based on these
signatures, several dykes might be correlated with the
corresponding stratigraphic formations in the northeastern
Deccan. However, as observed elsewhere in the Deccan
(Bondre et al. 2006; Vanderkluysen et al. 2006), the
isotopic signatures in most of these samples differ signifi-
cantly from the isotopic signatures of the chemically
closest lava formations, and many of the Pachmarhi dykes
and sills show substantial Ti peaks (relative to Eu and Gd)
in their primitive-mantle-normalized multielement pat-
terns. Noting the particularly unusual Nd–Sr isotopic
composition of dyke PMD6, it is apparent that the actual
range of chemical and particularly isotopic variations in
Deccan magmas is thus greater than observed in the
southwestern Deccan lavas alone.
The mismatches exist not just between chemical and
isotopic compositions, but also among different isotope
ratios. Whereas data for one dyke and sill sample each plot
within the isotopic fields for the Ambenali and Mahab-
aleshwar Formations, almost all other Pachmarhi intrusions
have mixed characteristics and do not consistently fall in
the same formation fields in all three isotopic plots. An
interesting outcome of this study is the realization that
whereas the high-206Pb/204Pb northern and northeastern
lavas (Toranmal, Mhow, Chikaldara and Jabalpur sections)
have Sr–Nd isotopic compositions essentially like those of
the southwestern lavas (Fig. 8), several Pachmarhi dykes
(e.g. PMD7, 11, and 17) have Pb isotopic ratios like those
of some of the northern-northeastern (excluding most
Jabalpur) lavas, and yet have Sr–Nd isotopic compositions
quite different from all hitherto analyzed Deccan flood
basalt (both southwestern, and northern-northeastern)
lavas. These dykes, as also PMD3 and PMD6, have sig-
nificantly higher Sr isotopic ratios for a given (eNd)t value
compared to all Deccan lavas.
Identifying feeder dykes: what to expect?
Under ideal circumstances, individual feeder dykes would
correlate with the lava flows they generated, in chemical
(barring local differences due to crystal settling, alteration
conditions, etc.) and isotopic characteristics, as well as
magnetic polarity. In the Columbia River CFB province,
individual dykes have been unambiguously correlated with
particular flows using these tools (e.g. Hooper 1997 and
references therein). The Columbia River province is much
younger (Miocene) than the Deccan and many of its basalts
much less weathered than the Deccan basalts, where
alteration is ubiquitous (Mahoney 1988; Baksi 2007). Also,
noting (1) possible lateral geochemical heterogeneity in
both major dykes and lava flows fed by them (e.g. Baker
et al. 1991), and (2) the likelihood that a single sample
from a long dyke will in most cases not represent the full
range of chemical and isotopic variation within it, we
suspect that Columbia-River-type correlations between
individual dykes and flows may be much more difficult to
achieve in the Deccan.
Thus, Bondre et al. (2006) find some dykes of the
Sangamner area in the Western Ghats (Fig. 1) to have close
chemical and Nd isotopic similarities to particular flow
packages, but to have small but significant Sr isotopic
differences outside of analytical error. Vanderkluysen et al.
(2006) find that about half the Western Ghats dykes studied
by them that closely resemble particular stratigraphic for-
mations chemically, have significantly different Sr–Nd–Pb
isotopic compositions from those of the same formations.
The vast scale of Deccan magmatism, the abundant
evidence for open system processes (e.g. Cox and
Hawkesworth 1985; Peng et al. 1994), and the extremely
complex geological history and heterogeneous lithology of
the basement (e.g., Ray et al. 2008 and references therein)
mean that the geochemical variability in the Deccan flood
basalt magmas and the scores of distinct geochemical
‘‘flavours’’—not necessarily stratigraphically controlled
(e.g. Mahoney et al. 2000)—are but natural.
If some of the northern or northeastern lavas were fed by
the Pachmarhi dykes or sills, what distances of lateral
magma transport in the crust or flow of lava on the surface
are required? Despite the potential of flood basalt flows to
cover large distances after eruption (e.g. Keszthelyi and
Self 1998) and proven examples of lava flows in the
Columbia River province having flowed several hundred
kilometres from their vents (Tolan et al. 1989), the distance
from Pachmarhi to Toranmal appears daunting, at 500 km.
However, Mhow is 350 km from Pachmarhi, and Chik-
aldara is only a modest 150 km. We therefore consider that
some of the lava flows forming the northern and north-
eastern sections (e.g. flow C14 from Chikaldara, flow
M16A from Mhow, and, more tentatively, flows SH102
and SH104 from Toranmal), having very close chemical
and isotopic relationships to specific Pachmarhi dykes, and
whose eruptive vents remain unidentified in any case, may
have originated in the Pachmarhi area.
Contrib Mineral Petrol
123
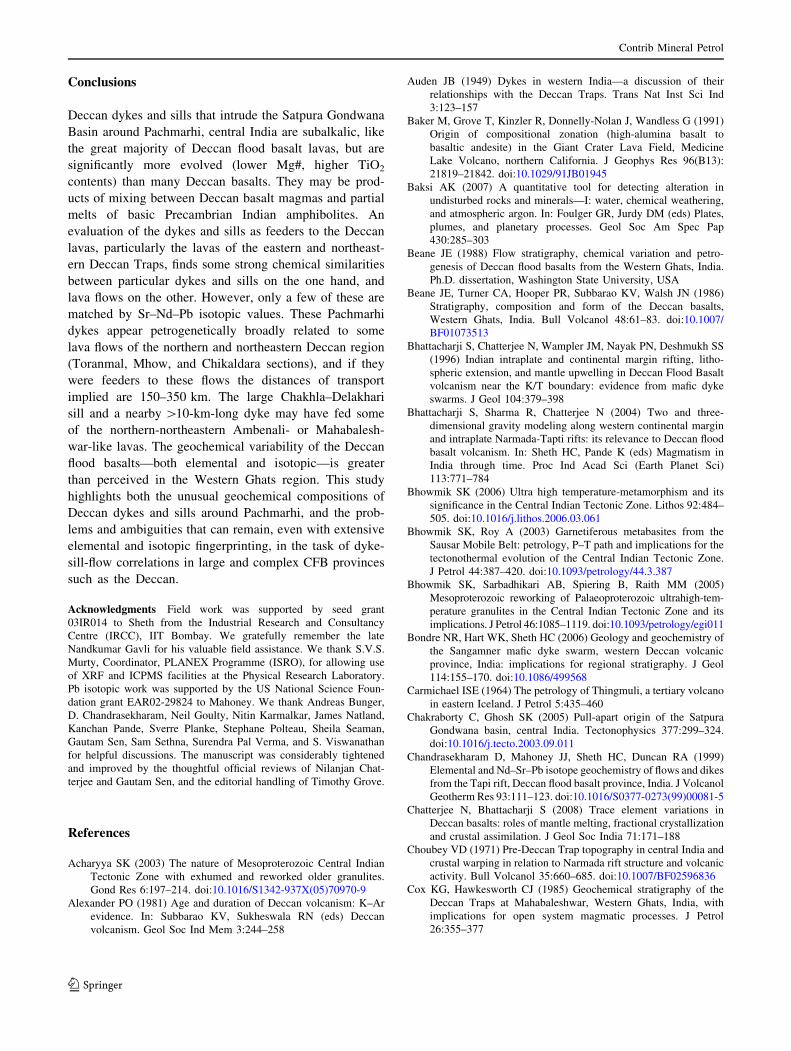
Conclusions
Deccan dykes and sills that intrude the Satpura Gondwana
Basin around Pachmarhi, central India are subalkalic, like
the great majority of Deccan flood basalt lavas, but are
significantly more evolved (lower Mg#, higher TiO2
contents) than many Deccan basalts. They may be prod-
ucts of mixing between Deccan basalt magmas and partial
melts of basic Precambrian Indian amphibolites. An
evaluation of the dykes and sills as feeders to the Deccan
lavas, particularly the lavas of the eastern and northeast-
ern Deccan Traps, finds some strong chemical similarities
between particular dykes and sills on the one hand, and
lava flows on the other. However, only a few of these are
matched by Sr–Nd–Pb isotopic values. These Pachmarhi
dykes appear petrogenetically broadly related to some
lava flows of the northern and northeastern Deccan region
(Toranmal, Mhow, and Chikaldara sections), and if they
were feeders to these flows the distances of transport
implied are 150–350 km. The large Chakhla–Delakhari
sill and a nearby [10-km-long dyke may have fed some
of the northern-northeastern Ambenali- or Mahabalesh-
war-like lavas. The geochemical variability of the Deccan
flood basalts—both elemental and isotopic—is greater
than perceived in the Western Ghats region. This study
highlights both the unusual geochemical compositions of
Deccan dykes and sills around Pachmarhi, and the prob-
lems and ambiguities that can remain, even with extensive
elemental and isotopic fingerprinting, in the task of dyke-
sill-flow correlations in large and complex CFB provinces
such as the Deccan.
Acknowledgments Field work was supported by seed grant
03IR014 to Sheth from the Industrial Research and Consultancy
Centre (IRCC), IIT Bombay. We gratefully remember the late
Nandkumar Gavli for his valuable field assistance. We thank S.V.S.
Murty, Coordinator, PLANEX Programme (ISRO), for allowing use
of XRF and ICPMS facilities at the Physical Research Laboratory.
Pb isotopic work was supported by the US National Science Foun-
dation grant EAR02-29824 to Mahoney. We thank Andreas Bunger,
D. Chandrasekharam, Neil Goulty, Nitin Karmalkar, James Natland,
Kanchan Pande, Sverre Planke, Stephane Polteau, Sheila Seaman,
Gautam Sen, Sam Sethna, Surendra Pal Verma, and S. Viswanathan
for helpful discussions. The manuscript was considerably tightened
and improved by the thoughtful official reviews of Nilanjan Chat-
terjee and Gautam Sen, and the editorial handling of Timothy Grove.
References
Acharyya SK (2003) The nature of Mesoproterozoic Central Indian
Tectonic Zone with exhumed and reworked older granulites.
Gond Res 6:197–214. doi:10.1016/S1342-937X(05)70970-9
Alexander PO (1981) Age and duration of Deccan volcanism: K–Ar
evidence. In: Subbarao KV, Sukheswala RN (eds) Deccan
volcanism. Geol Soc Ind Mem 3:244–258
Auden JB (1949) Dykes in western India—a discussion of their
relationships with the Deccan Traps. Trans Nat Inst Sci Ind
3:123–157
Baker M, Grove T, Kinzler R, Donnelly-Nolan J, Wandless G (1991)
Origin of compositional zonation (high-alumina basalt to
basaltic andesite) in the Giant Crater Lava Field, Medicine
Lake Volcano, northern California. J Geophys Res 96(B13):
21819–21842. doi:10.1029/91JB01945
Baksi AK (2007) A quantitative tool for detecting alteration in
undisturbed rocks and minerals—I: water, chemical weathering,
and atmospheric argon. In: Foulger GR, Jurdy DM (eds) Plates,
plumes, and planetary processes. Geol Soc Am Spec Pap
430:285–303
Beane JE (1988) Flow stratigraphy, chemical variation and petro-
genesis of Deccan flood basalts from the Western Ghats, India.
Ph.D. dissertation, Washington State University, USA
Beane JE, Turner CA, Hooper PR, Subbarao KV, Walsh JN (1986)
Stratigraphy, composition and form of the Deccan basalts,
Western Ghats, India. Bull Volcanol 48:61–83. doi:10.1007/
BF01073513
Bhattacharji S, Chatterjee N, Wampler JM, Nayak PN, Deshmukh SS
(1996) Indian intraplate and continental margin rifting, litho-
spheric extension, and mantle upwelling in Deccan Flood Basalt
volcanism near the K/T boundary: evidence from mafic dyke
swarms. J Geol 104:379–398
Bhattacharji S, Sharma R, Chatterjee N (2004) Two and three-
dimensional gravity modeling along western continental margin
and intraplate Narmada-Tapti rifts: its relevance to Deccan flood
basalt volcanism. In: Sheth HC, Pande K (eds) Magmatism in
India through time. Proc Ind Acad Sci (Earth Planet Sci)
113:771–784
Bhowmik SK (2006) Ultra high temperature-metamorphism and its
significance in the Central Indian Tectonic Zone. Lithos 92:484–
505. doi:10.1016/j.lithos.2006.03.061
Bhowmik SK, Roy A (2003) Garnetiferous metabasites from the
Sausar Mobile Belt: petrology, P–T path and implications for the
tectonothermal evolution of the Central Indian Tectonic Zone.
J Petrol 44:387–420. doi:10.1093/petrology/44.3.387
Bhowmik SK, Sarbadhikari AB, Spiering B, Raith MM (2005)
Mesoproterozoic reworking of Palaeoproterozoic ultrahigh-tem-
perature granulites in the Central Indian Tectonic Zone and its
implications. J Petrol 46:1085–1119. doi:10.1093/petrology/egi011
Bondre NR, Hart WK, Sheth HC (2006) Geology and geochemistry of
the Sangamner mafic dyke swarm, western Deccan volcanic
province, India: implications for regional stratigraphy. J Geol
114:155–170. doi:10.1086/499568
Carmichael ISE (1964) The petrology of Thingmuli, a tertiary volcano
in eastern Iceland. J Petrol 5:435–460
Chakraborty C, Ghosh SK (2005) Pull-apart origin of the Satpura
Gondwana basin, central India. Tectonophysics 377:299–324.
doi:10.1016/j.tecto.2003.09.011
Chandrasekharam D, Mahoney JJ, Sheth HC, Duncan RA (1999)
Elemental and Nd–Sr–Pb isotope geochemistry of flows and dikes
from the Tapi rift, Deccan flood basalt province, India. J Volcanol
Geotherm Res 93:111–123. doi:10.1016/S0377-0273(99)00081-5
Chatterjee N, Bhattacharji S (2008) Trace element variations in
Deccan basalts: roles of mantle melting, fractional crystallization
and crustal assimilation. J Geol Soc India 71:171–188
Choubey VD (1971) Pre-Deccan Trap topography in central India and
crustal warping in relation to Narmada rift structure and volcanic
activity. Bull Volcanol 35:660–685. doi:10.1007/BF02596836
Cox KG, Hawkesworth CJ (1985) Geochemical stratigraphy of the
Deccan Traps at Mahabaleshwar, Western Ghats, India, with
implications for open system magmatic processes. J Petrol
26:355–377
Contrib Mineral Petrol
123
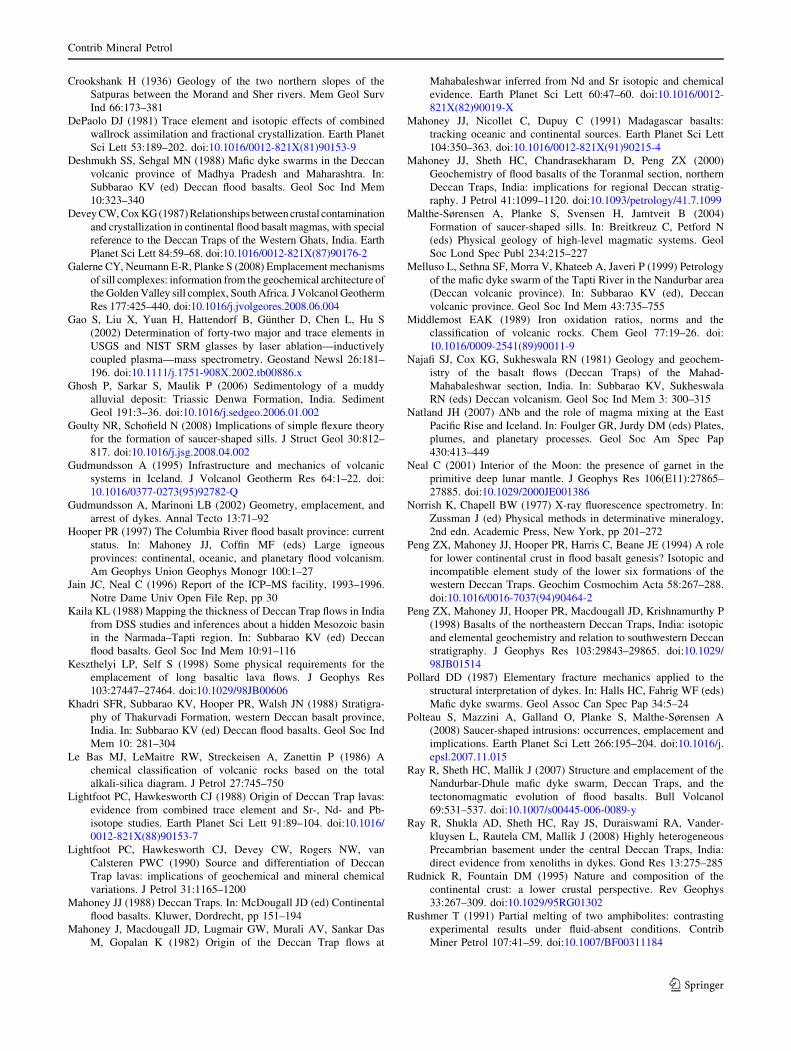
Crookshank H (1936) Geology of the two northern slopes of the
Satpuras between the Morand and Sher rivers. Mem Geol Surv
Ind 66:173–381
DePaolo DJ (1981) Trace element and isotopic effects of combined
wallrock assimilation and fractional crystallization. Earth Planet
Sci Lett 53:189–202. doi:10.1016/0012-821X(81)90153-9
Deshmukh SS, Sehgal MN (1988) Mafic dyke swarms in the Deccan
volcanic province of Madhya Pradesh and Maharashtra. In:
Subbarao KV (ed) Deccan flood basalts. Geol Soc Ind Mem
10:323–340
Devey CW, Cox KG (1987) Relationships between crustal contamination
and crystallization in continental flood basalt magmas, with special
reference to the Deccan Traps of the Western Ghats, India. Earth
Planet Sci Lett 84:59–68. doi:10.1016/0012-821X(87)90176-2
Galerne CY, Neumann E-R, Planke S (2008) Emplacement mechanisms
of sill complexes: information from the geochemical architecture of
the Golden Valley sill complex, South Africa. J Volcanol Geotherm
Res 177:425–440. doi:10.1016/j.jvolgeores.2008.06.004
Gao S, Liu X, Yuan H, Hattendorf B, Gunther D, Chen L, Hu S
(2002) Determination of forty-two major and trace elements in
USGS and NIST SRM glasses by laser ablation—inductively
coupled plasma—mass spectrometry. Geostand Newsl 26:181–
196. doi:10.1111/j.1751-908X.2002.tb00886.x
Ghosh P, Sarkar S, Maulik P (2006) Sedimentology of a muddy
alluvial deposit: Triassic Denwa Formation, India. Sediment
Geol 191:3–36. doi:10.1016/j.sedgeo.2006.01.002
Goulty NR, Schofield N (2008) Implications of simple flexure theory
for the formation of saucer-shaped sills. J Struct Geol 30:812–
817. doi:10.1016/j.jsg.2008.04.002
Gudmundsson A (1995) Infrastructure and mechanics of volcanic
systems in Iceland. J Volcanol Geotherm Res 64:1–22. doi:
10.1016/0377-0273(95)92782-Q
Gudmundsson A, Marinoni LB (2002) Geometry, emplacement, and
arrest of dykes. Annal Tecto 13:71–92
Hooper PR (1997) The Columbia River flood basalt province: current
status. In: Mahoney JJ, Coffin MF (eds) Large igneous
provinces: continental, oceanic, and planetary flood volcanism.
Am Geophys Union Geophys Monogr 100:1–27
Jain JC, Neal C (1996) Report of the ICP–MS facility, 1993–1996.
Notre Dame Univ Open File Rep, pp 30
Kaila KL (1988) Mapping the thickness of Deccan Trap flows in India
from DSS studies and inferences about a hidden Mesozoic basin
in the Narmada–Tapti region. In: Subbarao KV (ed) Deccan
flood basalts. Geol Soc Ind Mem 10:91–116
Keszthelyi LP, Self S (1998) Some physical requirements for the
emplacement of long basaltic lava flows. J Geophys Res
103:27447–27464. doi:10.1029/98JB00606
Khadri SFR, Subbarao KV, Hooper PR, Walsh JN (1988) Stratigra-
phy of Thakurvadi Formation, western Deccan basalt province,
India. In: Subbarao KV (ed) Deccan flood basalts. Geol Soc Ind
Mem 10: 281–304
Le Bas MJ, LeMaitre RW, Streckeisen A, Zanettin P (1986) A
chemical classification of volcanic rocks based on the total
alkali-silica diagram. J Petrol 27:745–750
Lightfoot PC, Hawkesworth CJ (1988) Origin of Deccan Trap lavas:
evidence from combined trace element and Sr-, Nd- and Pb-
isotope studies. Earth Planet Sci Lett 91:89–104. doi:10.1016/
0012-821X(88)90153-7
Lightfoot PC, Hawkesworth CJ, Devey CW, Rogers NW, van
Calsteren PWC (1990) Source and differentiation of Deccan
Trap lavas: implications of geochemical and mineral chemical
variations. J Petrol 31:1165–1200
Mahoney JJ (1988) Deccan Traps. In: McDougall JD (ed) Continental
flood basalts. Kluwer, Dordrecht, pp 151–194
Mahoney J, Macdougall JD, Lugmair GW, Murali AV, Sankar Das
M, Gopalan K (1982) Origin of the Deccan Trap flows at
Mahabaleshwar inferred from Nd and Sr isotopic and chemical
evidence. Earth Planet Sci Lett 60:47–60. doi:10.1016/0012-
821X(82)90019-X
Mahoney JJ, Nicollet C, Dupuy C (1991) Madagascar basalts:
tracking oceanic and continental sources. Earth Planet Sci Lett
104:350–363. doi:10.1016/0012-821X(91)90215-4
Mahoney JJ, Sheth HC, Chandrasekharam D, Peng ZX (2000)
Geochemistry of flood basalts of the Toranmal section, northern
Deccan Traps, India: implications for regional Deccan stratig-
raphy. J Petrol 41:1099–1120. doi:10.1093/petrology/41.7.1099
Malthe-Sørensen A, Planke S, Svensen H, Jamtveit B (2004)
Formation of saucer-shaped sills. In: Breitkreuz C, Petford N
(eds) Physical geology of high-level magmatic systems. Geol
Soc Lond Spec Publ 234:215–227
Melluso L, Sethna SF, Morra V, Khateeb A, Javeri P (1999) Petrology
of the mafic dyke swarm of the Tapti River in the Nandurbar area
(Deccan volcanic province). In: Subbarao KV (ed), Deccan
volcanic province. Geol Soc Ind Mem 43:735–755
Middlemost EAK (1989) Iron oxidation ratios, norms and the
classification of volcanic rocks. Chem Geol 77:19–26. doi:
10.1016/0009-2541(89)90011-9
Najafi SJ, Cox KG, Sukheswala RN (1981) Geology and geochem-
istry of the basalt flows (Deccan Traps) of the Mahad-
Mahabaleshwar section, India. In: Subbarao KV, Sukheswala
RN (eds) Deccan volcanism. Geol Soc Ind Mem 3: 300–315
Natland JH (2007) DNb and the role of magma mixing at the East
Pacific Rise and Iceland. In: Foulger GR, Jurdy DM (eds) Plates,
plumes, and planetary processes. Geol Soc Am Spec Pap
430:413–449
Neal C (2001) Interior of the Moon: the presence of garnet in the
primitive deep lunar mantle. J Geophys Res 106(E11):27865–
27885. doi:10.1029/2000JE001386
Norrish K, Chapell BW (1977) X-ray fluorescence spectrometry. In:
Zussman J (ed) Physical methods in determinative mineralogy,
2nd edn. Academic Press, New York, pp 201–272
Peng ZX, Mahoney JJ, Hooper PR, Harris C, Beane JE (1994) A role
for lower continental crust in flood basalt genesis? Isotopic and
incompatible element study of the lower six formations of the
western Deccan Traps. Geochim Cosmochim Acta 58:267–288.
doi:10.1016/0016-7037(94)90464-2
Peng ZX, Mahoney JJ, Hooper PR, Macdougall JD, Krishnamurthy P
(1998) Basalts of the northeastern Deccan Traps, India: isotopic
and elemental geochemistry and relation to southwestern Deccan
stratigraphy. J Geophys Res 103:29843–29865. doi:10.1029/
98JB01514
Pollard DD (1987) Elementary fracture mechanics applied to the
structural interpretation of dykes. In: Halls HC, Fahrig WF (eds)
Mafic dyke swarms. Geol Assoc Can Spec Pap 34:5–24
Polteau S, Mazzini A, Galland O, Planke S, Malthe-Sørensen A
(2008) Saucer-shaped intrusions: occurrences, emplacement and
implications. Earth Planet Sci Lett 266:195–204. doi:10.1016/j.
epsl.2007.11.015
Ray R, Sheth HC, Mallik J (2007) Structure and emplacement of the
Nandurbar-Dhule mafic dyke swarm, Deccan Traps, and the
tectonomagmatic evolution of flood basalts. Bull Volcanol
69:531–537. doi:10.1007/s00445-006-0089-y
Ray R, Shukla AD, Sheth HC, Ray JS, Duraiswami RA, Vander-
kluysen L, Rautela CM, Mallik J (2008) Highly heterogeneous
Precambrian basement under the central Deccan Traps, India:
direct evidence from xenoliths in dykes. Gond Res 13:275–285
Rudnick R, Fountain DM (1995) Nature and composition of the
continental crust: a lower crustal perspective. Rev Geophys
33:267–309. doi:10.1029/95RG01302
Rushmer T (1991) Partial melting of two amphibolites: contrasting
experimental results under fluid-absent conditions. Contrib
Miner Petrol 107:41–59. doi:10.1007/BF00311184
Contrib Mineral Petrol
123
Sen G (1980) Mineralogical variations in the Delakhari sill, Deccan
Trap intrusion, Central India. Contrib Miner Petrol 75:71–78.
doi:10.1007/BF00371890
Sen G (1983) Deccan Trap intrusion: magma mixing in the Chakhla–
Delakhari sill, Chhindwara district, Madhya Pradesh. J Geol Soc
India 24:381–393
Sen G, Cohen TH (1994) Deccan intrusion, crustal extension, doming
and the size of the Deccan-Reunion plume head. In: Subbarao
KV (ed) Volcanism. Wiley Eastern, New Delhi, pp 201–216
Sheth HC (1998) A reappraisal of the coastal Panvel flexure, Deccan
Traps, as a listric-fault-controlled reverse drag structure. Tec-
tonophysics 294:143–149. doi:10.1016/S0040-1951(98)00148-6
Sheth HC (2005) Were the Deccan flood basalts derived in part from
ancient oceanic crust within the Indian continental lithosphere?
Gond Res 8:109–127. doi:10.1016/S1342-937X(05)71112-6
Sheth HC (2007) Plume-related regional prevolcanic uplift in the
Deccan Traps: absence of evidence, evidence of absence. In:
Foulger GR, Jurdy DM (eds), Plates, plumes, and planetary
processes. Geol Soc Am Spec Pap 430:785–813
Sheth HC, Chandrasekharam D (1997) Plume-rift interaction in the
Deccan volcanic province. Phys Earth Planet Int 99:179–187.
doi:10.1016/S0031-9201(96)03220-7
Sheth HC, Melluso L (2008) The Mount Pavagadh volcanic suite,
Deccan Traps: geochemical stratigraphy and magmatic evolu-
tion. J Asian Earth Sci 32:5–21. doi:10.1016/j.jseaes.2007.
10.001
Sheth HC, Ray JS (2002) Rb/Sr–87Sr/86Sr variations in Bombay
trachytes and rhyolites (Deccan Traps): Rb–Sr isochron, or AFC
process? Int Geol Rev 44:624–638. doi:10.2747/0020-6814.
44.7.624
Sheth HC, Mahoney JJ, Chandrasekharam D (2004) Geochemical
stratigraphy of flood basalts of the Bijasan Ghat section, Satpura
Range, India. J Asian Earth Sci 23:127–139. doi:10.1016/S1367-
9120(03)00116-0
Sridhar AR, Tewari HC (2001) Existence of a sedimentary graben
in the western part of the Narmada zone: seismic evidence.
J Geodyn 31:19–31. doi:10.1016/S0264-3707(00)00013-2
Sun S-s, McDonough WF (1989) Chemical and isotopic systematics
of oceanic basalts: implications for mantle composition and
processes. In: Saunders AD, Norry MJ (eds), Magmatism in the
ocean basins. Geol Soc Lond Spec Publ 42:313–345
Subbarao KV, Hooper PR (Compilers) (1988) Reconnaissance map of
the Deccan Basalt Group in the Western Ghats, India. In:
Subbarao KV (ed) Deccan flood basalts. Geol Soc Ind Mem 10
(enclosure)
Subbarao KV, Bodas MS, Hooper PR, Walsh JN (1988) Petrogenesis
of Jawhar and Igatpuri formations, western Deccan basalt
province, India. In: Subbarao KV (ed) Deccan flood basalts.
Geol Soc Ind Mem 10:253–280
Swanson DA, Wright RL, Helz RT (1975) Linear vent systems and
estimated rates of magma production and eruption for the
Yakima Basalt on the Columbia Plateau. Am J Sci 275:877–905
Tanaka T, Togashi S, Kamioka H, Amakawa H, Kagami H,
Hamamoto T, Yuhara M, Orihashi Y, Yoneda S, Shimizu H,
Kunimaru T, Takahashi K, Yanagi T, Nakano T, Fujimaki H,
Shinjo R, Asahara Y, Tanimizu M, Dragusanu C (2000) JNdi-1:
a neodymium isotopic reference in consistency with La Jolla
neodymium. Chem Geol 168:279–281. doi:10.1016/S0009-
2541(00)00198-4
Thy P, Lesher CE, Tegner C (2008) The Skaergaard liquid line of
descent revisited. Contrib Miner Petrol (in press)
Todt W, Cliff RA, Hanser A, Hofmann AW (1996) Evaluation of a202Pb ? 205Pb double spike for high-precision lead isotopic
analyses. In: Basu AR, Hart SR (eds) Earth processes: reading
the isotopic code. Am Geophys Union Geophys Monogr 95:429–
437
Tolan TL, Reidel SP, Hooper PR, Beeson MH, Fecht KR, Bentley
RD, Anderson JL (1989) Revisions to the estimates of the areal
extent and volume of the Columbia River Basalt Group. In:
Reidel SP, Hooper PR (eds), Volcanism and tectonism in the
Columbia River flood basalt province. Geol Soc Am Spec Pap
239:1–20
Vanderkluysen L, Mahoney JJ, Hooper PR, Sheth HC, Ray R (2006)
Location and geometry of the Deccan Traps feeder system
inferred from dyke geochemistry. Eos Trans AGU, 87(52), Fall
Meet Suppl, abstract V13B–0681
Venkatakrishnan R (1984) Parallel scarp retreat and drainage
evolution, Pachmarhi area, Madhya Pradesh, central India.
J Geol Soc India 25:401–413
Venkatakrishnan R (1987) Correlation of cave levels and planation
surfaces in the Pachmarhi area, Madhya Pradesh: a case for base
level control. J Geol Soc India 29:240–249
Verma SP, Torres-Alvarado IS, Sotelo-Rodriguez ZT (2002) SIN-
CLAS: standard igneous norm and volcanic rock classification
system. Comput Geosci 28:711–715. doi:10.1016/S0098-3004
(01)00087-5
Viswanathan S, Chandrasekharam D (1976) Dykes related to Deccan
Trap volcanism. In: Proceedings of symposium on Deccan Trap
and Bauxite. Geol Surv Ind Spec Publ 14: 97–107
Weis D, Kieffer B, Maershalk C, Pretorius W, Barling J (2005) High-
precision Pb–Sr–Nd–Hf isotopic characterization of USGS
BHVO-1 and BHVO-2 reference materials. Geochem Geophys
Geosyst 6. doi:10.1029/2004GC000852
Wilson SA (1997) The collection, preparation, and testing of U.S.G.S.
reference material BCR-2, Columbia River Basalt. US Geol Surv
Open File Rep 98-xxx
Contrib Mineral Petrol
123