structural reforms in times of crisis - organisation for economic co
TRANSCRIPT
Economic Policy Reforms 2012
Going for Growth
© OECD 2012
17
PART I
Chapter 1
Structural reforms in times of crisis
The crisis has raised new policy challenges, but it has also made the necessity ofstructural reforms more apparent. This initial chapter of Going for Growthassesses progress that countries have made in structural reforms since the start ofthe crisis, covering the whole period 2007-11.
The key political economy lesson emerging from the analysis is that the crisis andensuing recession have acted as a catalyst for structural reforms, especially inOECD countries where reforms were most needed. In particular, the depth of thelabour market crisis has provided an impetus for structural reforms aimed atraising labour utilisation. The need to consolidate public finances and the financialpressure arising from mushrooming sovereign debt have given another impetus toreform, with a clear acceleration of politically sensitive reforms designed to help liftpotential growth, regain price competitiveness and restore fiscal sustainability,especially in some euro area countries.
Going forward, priority should be given to boosting jobs in the context of ongoingfiscal consolidation. For now, there is a clear case for sheltering activation policiesaimed at retraining displaced workers and encouraging return to work from fiscalconsolidation efforts. And in countries that experience renewed economic set-backsit will be important to build on the lessons from the financial crisis in terms ofpolicies that can help cushion the labour market and social impact of weak activity,such as making use of short-time working schemes. Tax reforms, not least areduction in tax expenditures and a shift in the tax burden away from labour, couldhelp kick-start the jobs recovery and assist fiscal consolidation. Product marketreforms could also boost short-term growth, especially if implemented in shelteredsectors where the potential to quickly create jobs is relatively high, such as retailtrade and professional services.

I.1. STRUCTURAL REFORMS IN TIMES OF CRISIS
ECONOMIC POLICY REFORMS 2012: GOING FOR GROWTH © OECD 201218
Summary and conclusionsGoing for Growth reports have been published by the OECD every year since 2005. The Going
for Growth analysis identifies five structural reform priorities to boost real income for each
OECD country, for the European Union as a whole, and starting with the 2011 edition, the
BRIICS – Brazil, China, India, Indonesia, Russia and South Africa – key non-member countries
with which the OECD works closely. This process provides a tool for governments to reflect on
“structural” policy reforms that affect their residents’ long-term living standards. Structural
policy reforms are central to the mission of the OECD, and the Going for Growth analysis has
been used in the Mutual Assessment Process of the G20 since the 2008 Pittsburgh Summit.
The methodology used identifies policy recommendations based on their ability to
improve long-term material living standards through higher productivity and labour
utilisation. The reference performance measure in this regard is gross domestic product
(GDP) per capita, given its contemporaneous availability and relatively broad coverage and
despite its various drawbacks.1 Policy priorities have been mainly concentrated on labour
and product market policies, education, health, innovation, housing policies, the efficiency
of public sectors, and tax systems. Five policy priorities were first identified in 2005, which
were then reassessed in the 2007, 2009 and 2011 editions based on both observed progress
in reform and new evidence. The intervening editions of Going for Growth have reviewed
progress made on previous priorities.
This paper provides a broad overview of the progress that countries have made in
structural reforms since the start of the crisis, covering the whole period 2007-11. This
crisis has raised new structural policy challenges, such as reviving economies and
consolidating public finances in a way that also fosters sustainable long-term growth. At
the same time, it has also made the necessity of reforms such as those identified in Going
for Growth more apparent – for example pension reforms that would boost labour
utilisation while addressing fiscal sustainability concerns. The five-year retrospective
allows identifying reform patterns throughout the various phases of the crisis, from which
political economy lessons can be drawn. As a tool for structural surveillance, this analysis
aims primarily at taking stock of reforms carried out in areas that had been previously
identified as priorities in Going for Growth. At the same time, however, the crisis induced timely
policy action to support the economy and especially the labour market,2 including in structural
areas which were not previously covered by Going for Growth, and it therefore delivered relevant
policy lessons to amend and broaden the surveillance exercise. Against this background, this
chapter covers major labour market policies and interventions implemented in the crisis
context, including when those were not identified as Going for Growth priorities.
The main reform patterns that emerge over the years since the start of the crisis are as
follows:
● The responsiveness of countries to OECD reform recommendations featured in Going for
Growth was greater overall after than before the crisis. However, the pace and the nature
of reforms have varied markedly throughout the distinct phases of the crisis.

I.1. STRUCTURAL REFORMS IN TIMES OF CRISIS
ECONOMIC POLICY REFORMS 2012: GOING FOR GROWTH © OECD 2012 19
The 2008 recession first slowed down structural reforms in OECD countries, due to the
pressing need to stabilise aggregate demand and provide income support to the
unemployed. As the need for medium-term fiscal consolidation became more pressing,
reforms were implemented in policy areas which could help assist the fiscal adjustment
process. This was the case with respect to both labour-utilisation (retirement schemes
and welfare systems) and labour-productivity (public sector reforms and privatisation
programmes)-enhancing areas.
● The crisis and ensuing recession have acted as a catalyst for structural reforms especially
in OECD countries where reforms were most needed. In contrast to what was observed
before the crisis, lower-income OECD countries, which are generally in greater need of
reform, have acted more on priorities identified in Going for Growth than their
higher-income counterparts. Likewise, there has been a strong correlation between the
depth of the labour market crisis and subsequent reforms, i.e. those countries that saw
unemployment rise most during the crisis have taken more measures along the Going for
Growth labour utilisation-enhancing priorities.
● The need to consolidate public finances and the financial pressure arising from
mushrooming sovereign debt have given another impetus to reform most recently,
contrasting with past evidence that fiscal easing usually accompanies and facilitates
reforms. Indeed, there is a strong cross-country correlation between the intensity of
ongoing fiscal consolidation efforts and responsiveness to Going for Growth priorities over
the period 2010-11. This pattern is driven mostly by the actions taken in countries
affected by the European debt crisis. Indeed, the most recent phase of the crisis has seen
an acceleration of politically sensitive reforms designed to help lift potential growth,
regain price competitiveness and restore fiscal sustainability, especially in some euro
area countries.
● Countries have sought to raise labour utilisation especially by cutting labour taxes,
delaying effective retirement ages, reforming disability schemes and strengthening
active labour market policies (ALMPs). At the onset of the recession, most OECD
countries sought to improve the safety net for job losers by boosting unemployment
benefit generosity and expanding coverage to new groups of workers. At the same time,
more than two-thirds of OECD countries raised resources for job-search assistance and
training programmes in order to facilitate re-employment and re-deployment. To
stimulate labour demand, work-sharing arrangements were introduced or expanded in
two-thirds of OECD countries, labour taxes were cut and new job or hiring subsidy
schemes were introduced, often targeting marginal job seekers such as youth, older
workers, or the long-term unemployed. Some temporary measures were subsequently
phased out, and difficult labour market reforms were implemented in the areas of
retirement schemes, job protection, minimum wages and wage bargaining systems,
especially in the context of the European debt crisis.
● Regarding priorities aimed at boosting labour productivity, countries have been
especially active in improving the design of their innovation policies and reforming their
education systems, while much less progress has been achieved towards reducing
agricultural policy support and removing barriers to foreign direct investment. The need
to deliver both higher growth and credible fiscal consolidation in many OECD countries
has also provided additional impetus for growth-friendly tax reforms that reduce
impediments to work and invest.
I.1. STRUCTURAL REFORMS IN TIMES OF CRISIS
ECONOMIC POLICY REFORMS 2012: GOING FOR GROWTH © OECD 201220
● The impact of the crisis was both milder and shorter in the BRIICS, but it also made more
apparent the necessity of some of the structural reforms recommended in Going for
Growth, in particular the need in several cases to expand social protection systems in
order to support workers in times of crisis and – in a longer-term perspective – achieve
more equitable and sustainable growth.3 Policy responsiveness to Going for Growth
priorities has been mixed since early 2011, when policy recommendations to the BRIICS
were made for the first time. All emerging economies have implemented policies aimed
at enhancing the quality and inclusiveness of their education systems, which is a key
challenge these countries face to achieve higher living standards. Helped by their
generally more sustainable fiscal situations along with their higher growth prospects,
most large emerging countries continued investing in physical infrastructure, another
specific Going for Growth priority in a number of them. By contrast, less has been done to
address other important productivity-enhancing priorities, such as the reduction of
barriers to entrepreneurship and foreign direct investment and the enhancement of the
rule of law and of governance systems.
● Given what has been done in recent years, priority should be given to action that can
boost jobs in the context of ongoing fiscal consolidation:
– At the current juncture, there is a need to reduce the risk of unemployment persistence
in a number of OECD countries, which can be achieved through effective ALMPs aimed
at retraining displaced workers and encouraging return to work – in this regard there is
a case for sheltering public spending on such activation from fiscal consolidation
efforts. Once recovery in labour market demand is solid, ALMPs should be accompanied
by unemployment benefit reforms with a view to enhancing work incentives.
– Growth-friendly tax reforms could strengthen the jobs content of a recovery, while
also helping fiscal consolidation insofar as they are implemented in a way that raises
tax revenue. These include removing tax expenditures and shifting the tax burden
towards tax bases that are less harmful to employment and growth, such as
immovable property, consumption and environmental taxes.
– Product market reforms are a priority for many OECD countries – in particular in
Europe, and could boost short-term growth, especially if implemented in certain
sheltered sectors such as retail trade and professional services where the potential to
quickly create jobs is rather high. By lifting productivity and potential growth, such
reforms would also have beneficial effects on debt dynamics and fiscal sustainability.
– Concerns that reforms may entail short-term economic losses before their benefits
start to materialise seem to be overdone. New empirical evidence provided in
Chapter 4 suggests that some structural reforms may fairly quickly boost growth while
very few if any have short-term costs in general. However, some reforms can be
temporarily detrimental in “bad” times, which may be a concern at the present time.
For instance, the pay-off from unemployment benefit and job protection reforms
appears to be less when the economy is depressed, suggesting these should probably
wait until the economic situation improves decisively.
– In economies that experience renewed economic slack, it will be important that the
policy response draws on the lessons from the crisis as to what works in terms of
cushioning labour market and social outcomes, such as making use of short-time
working schemes.

I.1. STRUCTURAL REFORMS IN TIMES OF CRISIS
ECONOMIC POLICY REFORMS 2012: GOING FOR GROWTH © OECD 2012 21
Growth performance and policy priorities in OECD countries and the BRIICS
Understanding differences in GDP per capita across countries
Structural reforms recommended in Going for Growth are aimed at improving living
standards by raising either labour productivity, or labour utilisation or both. Labour
resource utilisation is measured as the total number of hours worked per capita, while labour
productivity is measured as GDP per hour worked. The policy priorities (see Table 1.1) were
identified by mapping performance weaknesses (e.g. low labour productivity) against
policy deficiencies (e.g. high barriers to product markets), using internationally comparable
indicators.4
Looking at broad indicators of performance, OECD countries’ patterns of labour
utilisation and productivity have remained quite stable despite the depth of the crisis
(Figure 1.1, Panel A). Some exceptions stand out though, reflecting large differences across
OECD member countries in the magnitude of the decline in output and the way labour
markets responded to it. For instance, Ireland experienced a major decline in GDP per
capita as a result of the crisis, which turned the positive income gap with respect to the
upper-half of the OECD into a negative one. There was also a substantial reduction in the
United States’ lead in labour utilisation over the crisis period, reflecting a large increase in
unemployment and a significant decline in labour force participation. The impact of the
crisis has been both milder and shorter in the BRIICS countries. This has allowed them to
continue to converge rapidly with OECD GDP per capita levels, mostly thanks to rising
labour productivity. Nevertheless, for almost all the BRIICS, income is still 60%-90% lower
Table 1.1. Share of Going for Growth policy recommendations by subject areaPer cent
Going for Growth edition 2007 2009 2011 2011
Pre-enlargement OECDOECD
in 2011
Upper-income OECD1
Lower-income OECD2
BRIICS
Productivity
Product market regulation 25 25 24 26 20 32 33
Agriculture 5 5 5 4 6 2 0
Human capital 14 15 15 15 13 16 17
Other policy areas 15 14 18 17 16 16 30
Total 59 58 61 61 54 67 80
Labour utilisation
Average and marginal taxation on labour income 7 8 8 8 11 4 0
Social benefits 20 17 17 17 21 12 7
Labour market regulation and collective wage agreements 12 13 11 11 8 14 10
Other policy areas 2 3 3 2 6 4 3
Total 41 42 39 39 46 33 20
Overall (%) 100 100 100 100 100 100 100
Overall (number of priorities) 155 155 155 175 11 90 30
1. Upper-income OECD includes countries with per capita GDP levels above the median.2. Lower-income OECD includes countries with per capita GDP levels below the median.Source: OECD (2007), Economic Policy Reforms 2007: Going for Growth, OECD Publishing; OECD (2009), Economic PolicyReforms 2011: Going for Growth, OECD Publishing; OECD (2011), Economic Policy Reforms 2011: Going for Growth,OECD Publishing.

I.1. STRUCTURAL REFORMS IN TIMES OF CRISIS
ECONOMIC POLICY REFORMS 2012: GOING FOR GROWTH © OECD 201222
than the upper half of OECD countries, mainly owing to labour productivity shortfalls. In
this respect they are similar to the lower-income OECD countries. Low labour resource
utilisation is also a particularly large challenge in South Africa (Figure 1.1, Panel B).
Figure 1.1. Factors behind income variations: OECD and BRIICS countries, 2007 and 2010
1. Compared to the average of the 17 OECD countries with highest GDP per capita in 2007 and 2010, based on 2007 and 2010 purchasingpower parities (PPPs). The sum of the percentage difference in labour resource utilisation and labour productivity do not add upexactly to the GDP per capita difference since the decomposition is multiplicative.
2. Labour resource utilisation is measured as the total number of hours worked per capita.3. Labour productivity is measured as GDP per hour worked.4. In the case of Luxembourg, the population is augmented by the number of cross-border workers in order to take into account their
contribution to GDP.5. Data refer to GDP for mainland Norway which excludes petroleum production and shipping. While total GDP overestimates the
sustainable income potential, mainland GDP slightly underestimates it since returns on the financial assets held by the petroleumfund abroad are not included.
6. The EU category brings together countries that are members of both the European Union and the OECD. These are the EU15 countriesplus the Czech Republic, Estonia, Hungary, Poland, the Slovak Republic and Slovenia.
Source: OECD National Accounts Statistics (Database); OECD (2011), OECD Economic Outlook No. 90: Statistics and Projections (Database); OECDEmployment Outlook (Database).
1 2 http://dx.doi.org/10.1787/888932564844
Percentage difference in labourproductivity3
A. OECD countries
Percentage GDP per capita difference comparedwith upper half of OECD countries1
Percentage difference in labourresource utilisation2
Chile
Mexico
Turkey
Poland
Estonia
Hungary
Slovak Republic
Czech Republic
Portugal
Slovenia
Greece
Israel
Korea
New Zealand
Italy
Spain
EU
Japan
France
Iceland
United Kingdom
Finland
Germany
Belgium
Sweden
Canada
Denmark
Austria
Ireland
Australia
Netherlands
Norway
Switzerland
United States
Luxembourg4
5
6
Chile
Mexico
Turkey
Poland
Estonia
Hungary
Slovak Republic
Czech Republic
Portugal
Slovenia
Greece
Israel
Korea
New Zealand
Italy
Spain
EU
Japan
France
Iceland
United Kingdom
Finland
Germany
Belgium
Sweden
Canada
Denmark
Austria
Ireland
Australia
Netherlands
Norway
Switzerland
United States
Luxembourg
5
6
2010 20071
4
-70 -50 -30 -10 10 30 50 70 -70 -50 -30 -10 10 30 50 70 -70 -50 -30 -10 10 30 50 70

I.1. STRUCTURAL REFORMS IN TIMES OF CRISIS
ECONOMIC POLICY REFORMS 2012: GOING FOR GROWTH © OECD 2012 23
Policy priorities in OECD countries and the BRIICS
Overall, the balance of policy recommendations in Going for Growth by subject area has
remained quite stable for OECD countries since 2007, with the share of productivity-enhancing
recommendations remaining at approximately 60% (Table 1.1). This ratio slightly increased
in the most recent rounds, reflecting new priorities in public sector efficiency, taxation
structure, infrastructure, housing and social mobility. This was partly following new
empirical research in these domains, as well as reflecting policy lessons emerging from the
recent crisis. The predominance of labour productivity-enhancing challenges is more
pronounced among the lower-income OECD economies. While detailed priorities vary
widely across OECD countries depending on their particular performance and policy
weaknesses, relaxing anti-competitive product market regulations and reforming social
benefit systems are fairly common recommendations for raising productivity and labour
utilisation, respectively.
Figure 1.1. Factors behind income variations: OECD and BRIICS countries, 2007 and 2010 (cont.)
1. Compared to the average of the highest 17 OECD countries in terms of GDP per capita, based on 2007 and 2010 purchasing powerparities (PPPs) from the World Bank. The OECD average is based on a simple average of the 34 member countries. The sum of thepercentage gap in labour resource utilisation and labour productivity does not add up exactly to the GDP per capita gap since thedecomposition is multiplicative.
2. Labour resource utilisation is measured as employment as a share of working-age individuals in the population.3. Labour productivity is measured as GDP per employee.
Source: World Bank (2011), World Development Indicators (WDI) (Database); ILO (International Labour Organisation) (2011), Key Indicators of theLabour Market (KILM) (Database) for employment data on Brazil and Indonesia; Statistics South Africa for employment data onSouth Africa; India National Sample Survey (various years), annual population estimates from the Registrar General and OECD estimatesfor employment data on India; China Ministry of Human Resources and Social Security for employment data on China.
1 2 http://dx.doi.org/10.1787/888932564863
B. BRIICS countries vis-à-vis the OECD (using headcount productivity data)
Percentage GDP per capita difference compared
with upper half of OECD countries1
Percentage difference in labour
resource utilisation2
Percentage difference in labour
productivity3
-100 -80 -60 -40 -20 0 20
India
Indonesia
China
South Africa
Brazil
Russia
OECD average
Lower half of OECD countries
-100 -80 -60 -40 -20 0 20 -100 -80 -60 -40 -20 0 20
India
Indonesia
China
South Africa
Brazil
Russia
OECD average
Lower half of OECDcountries
2010 2007

I.1. STRUCTURAL REFORMS IN TIMES OF CRISIS
ECONOMIC POLICY REFORMS 2012: GOING FOR GROWTH © OECD 201224
For the BRIICS, four-fifths of the policy recommendations are aimed at improving
productivity, reflecting these countries’ relative weakness in this area (Figure 1.1, Panel B).
There is a strong focus on product market regulation, which is often much more stringent
than in upper-income OECD countries; and education systems, where quality and
achievement levels are relatively low. Government/governance reform, strengthening
intellectual property rights protection and basic financial liberalisation are also common
recommendations for boosting productivity in the BRIICS. There are fewer recommendations
aimed at enhancing labour utilisation than for OECD countries in general and the
lower-income OECD countries in particular, partly because most of the BRIICS have
relatively high overall employment rates. Instead, a number of recommendations are
intended to address the major challenge of labour informality. These include increasing
the coverage of social protection systems or containing labour costs and relaxing overly
strict job protection for formal workers.
The role of the crisis in shaping reform patterns
Measuring progress on Going for Growth priorities
In order to assess progress on Going for Growth priorities over the past five years, this
report makes use of the “reform responsiveness rate indicator”, first constructed for Going
for Growth 2010 (see Box 1.1). The reform responsiveness indicator is a measure of the
extent to which OECD countries have followed up on Going for Growth recommendations,
but it does not aim to assess overall reform intensity per se, which would require both
accounting for reforms carried out in non-priority areas and quantifying the importance of
each individual measure.5 It is defined annually for each individual Going for Growth policy
priority area, each broad reform field (labour productivity or labour utilisation) and each
Box 1.1. An indicator of reform action
The reform responsiveness rate indicator is based on a scoring system in which eachpriority set in the previous edition of Going for Growth takes a value of one if “significant”action is taken the following year, and zero if not. The indicator is therefore the ratio of thetotal number of years in which some action is taken to address the policy priority to thetotal number of years in which the policy priority has been identified. By definition, itexcludes the years before and includes the year in which the policy priority was first set.
Some policy areas appear to be more difficult to reform than others. Thus, the extent towhich countries have followed up on Going for Growth priorities may be shaped by thenature of the recommendations. For instance, a country with recommendations in theareas of innovation and public sector efficiency might be expected to be more responsivethan another country with similar appetite for reform but with priorities in the areas of jobprotection and wage formation, where political economy obstacles to reform are stronger.In order to account for this possibility a “corrected” responsiveness rate has also beencomputed. This weighs responsiveness on each individual priority according to thedifficulty of undertaking the relevant reform. The difficulty is measured by the averageresponsiveness to priorities in this area across the OECD.
For more details see Box 2.2 and Annex 2.A1 in OECD, (2010), Economic Policy Reforms 2010:
Going for Growth, OECD Publishing.

I.1. STRUCTURAL REFORMS IN TIMES OF CRISIS
ECONOMIC POLICY REFORMS 2012: GOING FOR GROWTH © OECD 2012 25
individual country. While this indicator is an imperfect substitute for proper reform
assessments, it is used here because of its comprehensiveness and timeliness. The reform
responsiveness indicator does not cover the countries that joined the OECD in 2010 (Chile,
Estonia, Israel6 and Slovenia) and the BRIICS, for which priorities were set for the first time
in 2011. Actions these countries have taken over the past year – a much shorter time period
than the other countries – are discussed in this report and detailed in the accompanying
country notes (Chapter 2).
Reform patterns during the crisis
Overall, the crisis seems to have acted as a catalyst for structural reforms.7 Compared
with the pre-crisis period, responsiveness rates have increased on average to Going for
Growth recommendations for enhancing both labour productivity and labour utilisation.
For the latter, this partly reflects recent extensive labour market reforms undertaken in the
context of the euro area debt crisis. Reform activity has gone through distinct phases since
the start of the crisis (Figure 1.2). At first the recession markedly slowed action on Going for
Growth priorities, probably reflecting much greater policy focus on macroeconomic
stabilisation. The pace of reform slowed down most in the labour productivity area and less
so for labour utilisation. The subsequent period saw reform action accelerate strongly, with
the bounce-back strongest in reforms to boost labour productivity, such as product market
or public sector reforms aimed at increasing efficiency.
During the 2010-11 recovery phase responsiveness to Going for Growth priorities
increased in more than half of OECD countries compared with the 2005-07 pre-crisis period
(Figure 1.3, Panel A). In the vast majority of these countries the picture is reinforced when
comparing this phase and the crisis phase (Panel B). However, there are exceptions. For
example, in Germany responsiveness has been declining, possibly reflecting reform
Figure 1.2. The crisis has acted as a catalyst for reformsResponsiveness to Going for Growth recommendations across the OECD, 2005-111
Note: See Box 1.1 for the definition of the responsiveness rate.1. Average across OECD countries excluding Chile, Estonia, Israel and Slovenia.
1 2 http://dx.doi.org/10.1787/888932564882
0
0.05
0.1
0.15
0.2
0.25
0.3
0.35
0.4
0.45
Labour utilisation Labour productivity Overall
Responsiveness rate
2005-07 2008-09 2010-11

I.1. STRUCTURAL REFORMS IN TIMES OF CRISIS
ECONOMIC POLICY REFORMS 2012: GOING FOR GROWTH © OECD 201226
“fatigue” after past efforts and the country’s relatively good overall economic performance.
Since 2010, there has been a major acceleration in reform action in countries either
i) directly affected by the euro area debt crisis and therefore forced into reform as part of
the European Union-International Monetary Fund (EU-IMF) financial aid package; or
ii) experiencing tensions with sovereign bond spreads. Indeed Greece, Ireland and Portugal
all appear among the countries whose responsiveness to Going for Growth recommendations
increased the most between 2008-09 and 2010-11, especially for labour utilisation, and so
does Spain. The acute crisis forced these countries to enact unpopular reforms in “difficult”
areas, such as labour market regulation and social welfare systems (e.g. job protection, pension
and welfare reforms). This can be seen in Figure 1.4, which compares responsiveness rates
with corrected responsiveness rates (see Box 1.1 for methodological details on these
indicators and Box 1.2 for a discussion of reforms in Greece, Ireland and Portugal).8
Figure 1.3. Evolution of responsiveness to Going for Growth recommendations: OECD countries
Note: See Box 1.1 for the definition of the responsiveness rate.1 2 http://dx.doi.org/10.1787/888932564901
-0.3
-0.2
-0.1
0
0.1
0.2
0.3
0.4
0.5
0.6
0.7Percentage points
B. Change in overall responsiveness to Going for Growth recommendations across OECD countries from 2008-09 to 2010-11
-0.5
-0.4
-0.3
-0.2
-0.1
0
0.1
0.2
0.3
0.4
0.5
0.6
0.7Percentage points
A. Change in overall responsiveness to Going for Growth recommendations across OECD countries from 2005-07 to 2010-11
I.1. STRUCTURAL REFORMS IN TIMES OF CRISIS
ECONOMIC POLICY REFORMS 2012: GOING FOR GROWTH © OECD 2012 27
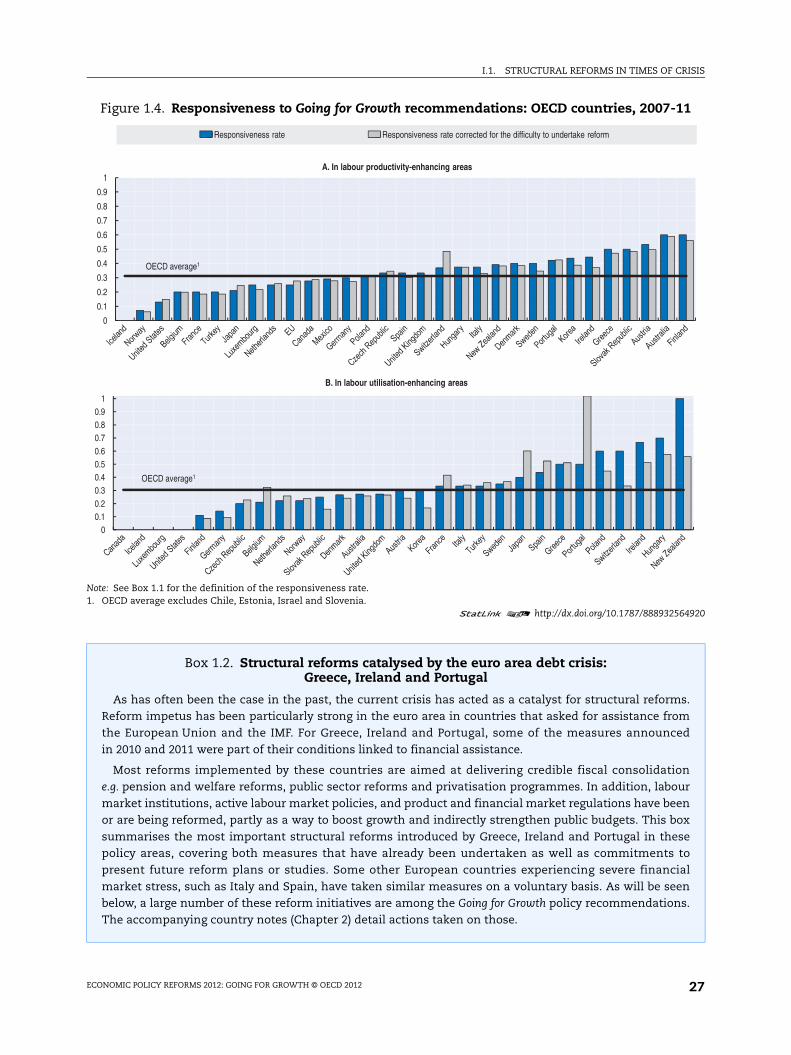
Figure 1.4. Responsiveness to Going for Growth recommendations: OECD countries, 2007-11
Note: See Box 1.1 for the definition of the responsiveness rate.1. OECD average excludes Chile, Estonia, Israel and Slovenia.
1 2 http://dx.doi.org/10.1787/888932564920
Box 1.2. Structural reforms catalysed by the euro area debt crisis: Greece, Ireland and Portugal
As has often been the case in the past, the current crisis has acted as a catalyst for structural reforms.Reform impetus has been particularly strong in the euro area in countries that asked for assistance fromthe European Union and the IMF. For Greece, Ireland and Portugal, some of the measures announcedin 2010 and 2011 were part of their conditions linked to financial assistance.
Most reforms implemented by these countries are aimed at delivering credible fiscal consolidatione.g. pension and welfare reforms, public sector reforms and privatisation programmes. In addition, labourmarket institutions, active labour market policies, and product and financial market regulations have beenor are being reformed, partly as a way to boost growth and indirectly strengthen public budgets. This boxsummarises the most important structural reforms introduced by Greece, Ireland and Portugal in thesepolicy areas, covering both measures that have already been undertaken as well as commitments topresent future reform plans or studies. Some other European countries experiencing severe financialmarket stress, such as Italy and Spain, have taken similar measures on a voluntary basis. As will be seenbelow, a large number of these reform initiatives are among the Going for Growth policy recommendations.The accompanying country notes (Chapter 2) detail actions taken on those.
0
0.1
0.2
0.3
0.4
0.5
0.6
0.7
0.8
0.9
1A. In labour productivity-enhancing areas
Responsiveness rate Responsiveness rate corrected for the difficulty to undertake reform
OECD average1
00.10.20.30.40.50.60.70.80.9
1
B. In labour utilisation-enhancing areas
OECD average1

I.1. STRUCTURAL REFORMS IN TIMES OF CRISIS
ECONOMIC POLICY REFORMS 2012: GOING FOR GROWTH © OECD 201228
Box 1.2. Structural reforms catalysed by the euro area debt crisis: Greece, Ireland and Portugal (cont.)
Tax reforms
Tax reforms include: i) base broadening by rationalising personal income tax and eliminating a numberof deductions (Greece, Ireland and Portugal) and broadening the value added tax (VAT) tax base (Greece andPortugal); ii) budget-neutral tax shifting aiming to lower labour costs (Ireland); iii) reforming propertytaxation, including increasing (Portugal and Greece) or introducing (Ireland) property taxation andintroducing a new flat stamp duty on all residential property taxation, along with abolishing all existingexemptions (Ireland); iv) stepping-up environmentally-friendly taxation by increasing the level of carbontaxes and introducing water charges (Ireland) or increasing the car registration tax (Portugal); v) combatingtax evasion and enhancing tax compliance, tax administration discipline and transparency by developinga risk-based analysis audit system, increasing fraud penalties, revising tax auditors’ hiring rules andreinforcing their supervision and the legal measures to curb corruption by tax personnel (Greece).
Pension, welfare and active labour market policies reforms
Pension reforms include: i) increasing the legal and/or minimum retirement ages and lengthening thecontribution periods required for a full pension (Greece and Ireland for the state contributory pension);ii) reducing the generosity of pension benefits (Greece), focusing on civil servants above a wage levelthreshold (Ireland); iii) reducing early retirement via reducing benefits and revising the list of arduousoccupations (Greece); v) introducing a mechanism to index the retirement age to life expectancy (Greece).
Welfare and active labour market policy reforms include: i) reducing unemployment benefit rates(Ireland and Portugal) and duration (Portugal), introducing means-tested benefits (Greece), along withextending the population covered by these benefits (Portugal); ii) cutting other welfare payments such aschild benefits (Ireland); and iii) strengthening active labour market policies (Ireland) through:
● Increasing the provision of training and internship.
● Enhancing efficiency in the Public Employment Services (PES), including enhanced profiling to betteridentify claimants at high risk of becoming unemployed.
● Strengthening the mutual obligations approach e.g. greater sanctions for refusal to engage in training.
Product market reforms
Product market reforms include: i) privatisation programmes – primarily aimed at raising public revenues– in various energy and transport sectors (Greece, Ireland and Portugal) and launch of public-privatepartnerships and concessions to develop some state-owned immovable assets (Greece); ii) strengtheningthe power, independence or effectiveness of the competition authority (Greece and Portugal) and theenforcement of competition law (Ireland); iii) easing the formalities to start a new business (Greece) and thecomplexity of licensing procedures (Greece and Portugal); iv) increasing competition in transport andnetwork industries by reducing barriers to entry in road and maritime cruises (Greece) and phasing outregulated tariffs in electricity and gas (Greece and Portugal); v) increasing competition in retail trade(Portugal) and reducing barriers to entry in professional services (Greece, Ireland and Portugal).
Public sector reforms
Public sector reforms include efficiency-enhancing measures: i) reorganising local and centralgovernment (Greece, Ireland and Portugal), rationalising the public remuneration system (Greece andIreland), rationalising management and improving efficiency and governance of state-owned enterprises(Greece and Portugal); ii) introducing cross public sector measures, including greater use of shared servicesand information technology solutions, reform of public procurement processes (Ireland and Portugal),regular comprehensive expenditure reviews and using new business models for service delivery (Ireland);iii) public healthcare sector measures, including strengthening and better monitoring of prescription rulesand rationalising procurement procedures (Greece and Portugal), increasing co-payments (Portugal) andenhancing cost-accountability in the hospital sector (Greece and Portugal).

I.1. STRUCTURAL REFORMS IN TIMES OF CRISIS
ECONOMIC POLICY REFORMS 2012: GOING FOR GROWTH © OECD 2012 29
Impact of the crisis on reform action
While countries that have been most active in their priority areas since 2007
(Figure 1.4) are relatively diverse in terms of geography and size, those that were in greater
need for reform – i.e. with lower GDP per capita levels in 2007 – have been most responsive
to Going for Growth priorities on average, as can for example be seen in the cases of Greece,
Hungary, New Zealand, Poland and Portugal (Figure 1.5).
Reforms have been more frequent in countries that have been more severely affected
by the crisis. There is a particularly clear positive correlation between the severity of the
labour market impact of the crisis (measured as the change in unemployment from trough
Box 1.2. Structural reforms catalysed by the euro area debt crisis: Greece, Ireland and Portugal (cont.)
Labour market reforms
Labour market reforms include: i) reductions in severance pay for regular contracts and somesimplification of individual or collective dismissal procedures (Greece and Portugal), along with measuresto boost temporary employment by increasing the maximum work time under temporary work agencies(Greece); ii) measures to boost flexibility in working-time arrangements by reducing overtime pay andearnings of part-time employees and making averaging of working time possible (Greece); iii) measures toenhance flexibility in wage determination such as easing the conditions for firms to opt out fromhigher-level collective bargaining agreements (Greece and Ireland) and reforming sectoral wageagreements (Ireland); iv) introducing a sub-minimum wage for young people (Greece).
Financial sector reforms
Financial sector reforms include: i) measures to help deleverage the banking system by progressivelysetting higher capital requirements than under the Basel III rules and requiring them be met earlier(Ireland and Portugal); ii) enhancing prudential regulation by reinforcing banking supervision (Ireland andPortugal) and restructuring the banking system (Ireland).
Figure 1.5. Reform progress has been greater in lower-income countries Responsiveness to Going for Growth priorities and 2007 GDP per capita levels
Note: See Box 1.1 for the definition of the responsiveness rate.1 2 http://dx.doi.org/10.1787/888932564939
AUS AUT
BELCAN
CZEDNK
FIN
FRA
DEU
GRCHUN
ISL
IRL
ITA
JPN
KOR
LUX
MEX
NLD
NZL
NOR
POLPRT
SVKESP
SWE
CHE
TURGBR
USA
0
0.05
0.1
0.15
0.2
0.25
0.3
0.35
0.4
0.45
0.5
0.55
0.6
10000 20000 30000 40000 50000 60000 70000
Level, GDP per capita in 2007 (PPPs 2005)
Correlation coefficient: -0.50Statistically significant at the 1% confidence level
Responsiveness rate, 2007-11

I.1. STRUCTURAL REFORMS IN TIMES OF CRISIS
ECONOMIC POLICY REFORMS 2012: GOING FOR GROWTH © OECD 201230
to peak) and responsiveness to Going for Growth recommendations for enhancing labour
use (Figure 1.6, Panel A).9 Major financial market pressure seems to have forced both fiscal
consolidation and reforms. There is a significant positive correlation between recent
reform intensity – measured by the responsiveness rate to Going for Growth priorities
between 2010 and 2011 – and fiscal consolidation intensity – measured as the projected
change in the underlying primary balance between 2010 and 2012 (Figure 1.6, Panel B).10, 11
This suggests that countries facing major economic and fiscal crises simultaneously may
have had little choice but to address both growth and fiscal consolidation objectives, as the
examples of Greece, Ireland and Portugal show (Box 1.2). In the current situation, it is
therefore difficult to disentangle structural reforms genuinely aimed at raising long-term
living standards from fiscal consolidation actions. Reforms that are associated with rapid
and unprecedented fiscal retrenchment are likely to have weaker positive effects on
growth than fiscally-neutral reforms (see discussion in Chapter 4).
Figure 1.6. The need to address job and fiscal sustainability concerns has given impetus to reform
Note: See Box 1.1 for the definition of the responsiveness rate.
Source: OECD Quarterly National Accounts (Database); OECD Main Economic Indicators (Database) and OECD Economic Outlook No. 90: Statisticsand Projections (Database). 1 2 http://dx.doi.org/10.1787/888932564958
AUSAUT
BEL
CAN
CZE
DNK
FIN
FRA
DEU
GRC
HUNIRL
ITA
JPN
KOR
LUX
NLDNOR
POL
PRT
SVK
ESP
SWE
CHE
TUR
GBR
0
0.1
0.2
0.3
0.4
0.5
0.6
0.7
0.8
0 2 4 6 8 10 12Unemployment % point change from trough to peak
A. Responsiveness to labour utilisation-enhancing Going for Growth priorities and magnitude of the labour market crisis
Correlation coefficient: 0.45Statistically significant at the 5% confidence level
Responsiveness rate, 2007-10
AUS
AUT
BEL
CANCHE
CZE
DEU
DNK
ESP
FIN
FRA
GBR
GRC
HUN
IRL
ISL
ITAJPN
KOR
LUX
NLDNOR
NZL POLPRT
SWE
USA
0
0.1
0.2
0.3
0.4
0.5
0.6
0.7
0.8
0.9
1
-4 -2 0 2 4 6 8 10
B. Overall responsiveness to Going for Growth priorities and fiscal consolidation effort
Correlation coefficient: 0.57Statistically significant at the 1% confidence level
Responsiveness rate, 2010-11
Variation in the underlying primary balance as a percentage of potential GDP from 2010 to 2012

I.1. STRUCTURAL REFORMS IN TIMES OF CRISIS
ECONOMIC POLICY REFORMS 2012: GOING FOR GROWTH © OECD 2012 31
The crisis and structural reforms: a detailed review of progress since 2007This section reports on progress in implementing Going for Growth priorities
since 2007, distinguishing labour-utilisation and labour productivity-enhancing priorities.
The associated actions are detailed in separate country notes (Chapter 2). Furthermore, as
already noted above and against the background of the crisis, key labour market reforms
and interventions in non-priority areas are also covered (in the labour utilisation section),
based on the accompanying country notes as well as on other recent OECD work
(see OECD, 2009; 2010b; 2011d; 2011e).
Progress in reforming policies to improve labour utilisation in the context of the crisis
Since 2007, recommendations to remove impediments to labour utilisation have been
made primarily to continental European countries, where trend labour utilisation rates
remain comparatively low despite some heterogeneity and some progress prior to the
crisis (Figure 1.1). Identified policy priorities have included reducing disincentives to work
at older ages, obstacles to female participation, and labour taxation, as well as improving
the design of disability and sickness benefit schemes and other labour market policies
such as job protection, unemployment benefits and activation policies. Priorities have also
been identified in these areas outside Europe, often as a way to address more specific
labour market performance weaknesses, e.g. widespread informality in the BRIICS. Among
the various types of Going for Growth labour utilisation-enhancing priorities, countries have
been most active in the areas of labour taxation, retirement systems, disability schemes
and active labour market policies (Figure 1.7).
Average and marginal taxation of labour income
Most countries for which labour taxation was identified as a priority in previous
editions of Going for Growth implemented measures to sustain employment by lowering
labour taxation, either on a permanent or a temporary basis. Despite high responsiveness,
policy action has never been judged sufficient to justify the removal of the policy priority.
Figure 1.7. Responsiveness to Going for Growth recommendations across labour utilisation-enhancing areas
2007-11 average
Note: See Box 1.1 for the definition of the responsiveness rate.1. OECD average excludes Chile, Estonia, Israel and Slovenia. 1 2 http://dx.doi.org/10.1787/888932564977
0
0.1
0.2
0.3
0.4
0.5
0.6
Labourtaxation
Retirementschemes
Disabilityschemes
Unemployment benefits systems
Active labour market policies
Employment protectionlegislation
Minimum wages and wage
bargaining systems
Responsiveness rate
OECD average1

I.1. STRUCTURAL REFORMS IN TIMES OF CRISIS
ECONOMIC POLICY REFORMS 2012: GOING FOR GROWTH © OECD 201232
This does not point to some lack of major reform, but reflects the fact that labour taxation
is an area where sustained reform efforts are often required to achieve major policy
changes. Countries with a Going for Growth priority in this area have reduced income tax
rates or increased tax relief (Austria, Belgium, the Czech Republic, Denmark, Finland,
Hungary, Netherlands, Poland and Sweden), introduced or raised in-work tax credits
(Denmark, Netherlands, Sweden and the Slovak Republic), and lowered social security
contributions (Austria, Germany, Hungary, Poland, Sweden and Turkey).12 Italy reduced the
labour tax wedge for young people and women by making the payroll tax deductible
against income tax. In some of these countries, reductions in labour taxation were
accompanied or, more recently in the context of fiscal consolidation packages, followed by
compensatory increases in consumption (Germany, Finland and Italy), environmental or
energy (Austria, Finland and Germany) and financial sector taxes (Austria).
Many OECD countries – including some for which labour taxation was not identified as
a priority in previous editions of Going for Growth – further implemented new job or hiring
subsidy schemes in response to the crisis, often targeting vulnerable job seekers such as
youth, older workers, or the long-term unemployed (Finland, France, Greece, Hungary,
Portugal and Turkey, for which reducing the cost of labour was identified as a Going for
Growth priority, as well as Ireland and Spain who did not have a priority in this area). Going
forward, to minimise potential productivity losses resulting from labour misallocation,
hiring subsidies should eventually be withdrawn. Conditional on the pace of fiscal
consolidation, reductions in social security contributions are to be envisaged on a longer
time frame in countries where non-wage labour costs remain high, and could be coupled
with a shift in the tax burden towards tax bases that are more friendly for employment and
growth, e.g. immovable property, consumption, or environmental taxation. Tax structure
reforms along these lines were recommended for ten countries in the 2011 edition of Going
for Growth (OECD, 2011b).
Social benefits and active labour market policies
Retirement schemes. There has been progress since 2007 in reducing financial
disincentives to work at older ages embedded in old-age pension systems and/or available
social transfer programmes in countries where this was deemed a Going for Growth priority.
The crisis and the ensuing fiscal sustainability problems in many OECD countries have led
to an acceleration of pension reforms over the most recent period. Major reforms have
been implemented in European countries, especially – but not exclusively – in EU-IMF
programme countries (see Box 1.2). Some of the reforming countries phased out or
restricted access to early retirement schemes by tightening eligibility conditions (Austria,
Belgium, Greece, Poland, the Slovak Republic and Spain) or progressively closing de facto
early retirement routes by abolishing job-search exemptions for older unemployed
(France). Others raised minimum and statutory retirement ages (Belgium for females,
France, Greece, Hungary and Spain), or sought to increase the effective retirement age by
lengthening contribution requirements to claim full pensions (France, Greece and Spain),
reducing the level of pension benefits (Greece and Hungary), or adjusting benefits or the
retirement age in line with life expectancy (Greece, Norway and Spain). Reforms aimed at
enhancing the long-term sustainability of public pensions systems have in some cases
been accompanied by concomitant backtracking with the downsizing of the fully-funded,
defined-contribution “second pillar”, especially in some Central and Eastern European
countries. Among the OECD countries that had a Going for Growth priority in this area,
I.1. STRUCTURAL REFORMS IN TIMES OF CRISIS
ECONOMIC POLICY REFORMS 2012: GOING FOR GROWTH © OECD 2012 33
Hungary dismantled the “second pillar” altogether while Poland partially diverted
contributions from the private to the public pillar. In Turkey, where reform of retirement
schemes was identified as a policy priority, the phasing-in of the pension reform remains
excessively slow.
One notable feature of this crisis has been that older workers have remained in the
labour market, contrary to the experiences of previous recessions, where early retirement
incentives sometimes encouraged labour market withdrawal (OECD, 2011b, 2011d
and 2011e). This may reflect not just the comparatively mild deterioration in labour market
conditions (given the magnitude of the recession) in a number of OECD countries, but also
the benefits of recent reforms. Still, given that severe recessions have in the past led to
significant labour market withdrawal with a notable lag (Duval et al., 2011), further
reductions of financial disincentives to continued work – not least faster phasing out of
special or de facto early retirement routes – would help ensure that laid-off older workers
remain attached to the labour market. Furthermore, such reforms would improve the
long-run sustainability of pension systems, which recent OECD analysis (OECD, 2011e,
OECD Pensions at a Glance 2011) shows is not currently ensured. Such reforms can be
designed in ways that protect the most vulnerable (low income earners and people with
interrupted careers), as has been done in some OECD countries.13
Disability schemes. Long-term sickness and disability benefit schemes have in the past
provided an exit pathway from the labour force to both older and prime-aged workers. A
look at the past cyclical profiles of unemployment and disability rates shows that in a
number of countries, unemployment peaks associated with recessions have tended to be
followed by spikes in disability rates a number of years later.14. This partly explains why
disability benefit reform ended up being identified as a priority in countries such as Australia,
Denmark, Norway, the Netherlands, the United Kingdom and the United States.15 While it is
too early to draw definitive conclusions regarding the impact of this crisis, preliminary
evidence (OECD, 2011d) suggests that recipiency rates have started trending upward or
have continued to rise in a number of OECD countries since the onset of the crisis
(Australia, Denmark, Estonia, Iceland, Israel, Korea, Norway and the United States).16
Cross-country heterogeneity in post-crisis developments has been wide, partly reflecting
differences in the design of disability benefit schemes and the extent of past reforms.17
Some of the countries with a Going for Growth priority in this area (the Netherlands, Sweden
and the United Kingdom) reformed their schemes just prior to the onset of the crisis, with
the view to stemming the “excess” inflow of recipients and, in some cases, to helping
existing recipients with work capacity to (re-) join the labor market. Preliminary recipiency
rates data suggest that past reforms in these countries helped cushion the impact of the crisis
in this area. While similar reforms are being implemented in Australia starting in 2011,
action was rather limited in other countries for which disability schemes reforms were
identified as a Going for Growth priority, in particular in the United States which have
experienced what seems to be a structural rise in the beneficiary rate.
Unemployment benefit systems. The crisis led a number of countries to better protect
the incomes of the unemployed, which was needed in a context where job opportunities
fell dramatically. Many of the changes made to unemployment benefit schemes during the
crisis were therefore temporary measures, rather than structural reforms per se. These
short-run imperatives legitimately constrained policy action, which explains low

I.1. STRUCTURAL REFORMS IN TIMES OF CRISIS
ECONOMIC POLICY REFORMS 2012: GOING FOR GROWTH © OECD 201234
responsiveness in this area (Figure 1.7). Indeed, none of the countries with a recommendation
took significant action in line with the priority, except for Portugal, whose authorities
committed to reduce the generosity of unemployment benefits in 2012 under the EU-IMF
financial aid package.
Crisis-response measures (including in countries where unemployment benefit
reform was not identified as Going for Growth priority) included:18
● Moderate increases in benefit replacement rates (Belgium and Finland where
unemployment benefit reform was a Going for Growth priority, but also the Czech Republic,
Greece and Poland);
● Increases in benefit duration (Canada, Iceland, Portugal and the United States);
● Looser eligibility criteria, a long-standing Going for Growth recommendation for certain
countries (e.g. Japan) in order to increase the social insurance coverage of non-regular
workers. For instance, changes in eligibility in Finland, France, Israel, Japan, Portugal and
Spain are likely to have made it easier for temporary or irregular workers to access
unemployment benefits.
Once the labour market recovers, phasing out crisis-related increases in benefit levels
and duration (where these were already high) would amplify the pick-up in labour
utilisation, with direct co-benefits for public budgets. In a number of countries,
crisis-related increases in unemployment income support have already been phased out –
increases in benefit duration have been phased out in Canada for instance19 – and some
countries have recently taken some steps to reduce the generosity of unemployment
benefits – especially those under fiscal pressure such as Ireland and Portugal. By contrast,
some of the extensions in the coverage of unemployment benefits from previously low
rates could be made permanent provided they are coupled with conditionality and
activation measures.
Active labour market policies. OECD countries have been endorsing the need to develop
sound ALMPs as a key tool to activate the long-term unemployed. In the crisis context,
reforms to increase spending on or enhance the efficiency of ALMPs have been
implemented in all the countries for which this was identified as a priority. Efficiency has
been improved through more regular assessments of job search activity (Estonia), greater
sanctions for refusing job or training offers (Ireland since 2011) or not participating in
active labour market programmes (Finland) and the reorganisation of Public Employment
Services (PES) (merger of benefit administration and public employment services into a
single department in Ireland, enhanced coordination between regional placement agencies
in Belgium). South Africa committed to increase funding devoted to employment services
and to improve information about training and employment opportunities. More broadly
and including outside Going for Growth priorities, more than two-thirds of OECD countries
raised resources for job-search assistance and training programmes in order to facilitate
re-employment and re-deployment during the crisis. Despite the additional resources
devoted to PES, the average staff caseload increased in most countries during the crisis due
to the surge in the number of registered jobseekers. Additional PES resources have
therefore been typically targeted to provide job-search assistance to particular groups such
as young people, immigrants, and people with short-term contracts or not receiving
benefits (OECD, 2010b).
I.1. STRUCTURAL REFORMS IN TIMES OF CRISIS
ECONOMIC POLICY REFORMS 2012: GOING FOR GROWTH © OECD 2012 35
In countries where the average caseload per staff providing PES has risen substantially
during the crisis as a result of a sharp increase in the number of job seekers, there is a case
for ensuring that resources devoted to job-search assistance are commensurate to the task
of returning to pre-crisis employment levels. Still, the relevance of different ALMP
spending programmes differs depending on the state of the labour market, suggesting a
case-by-case approach:
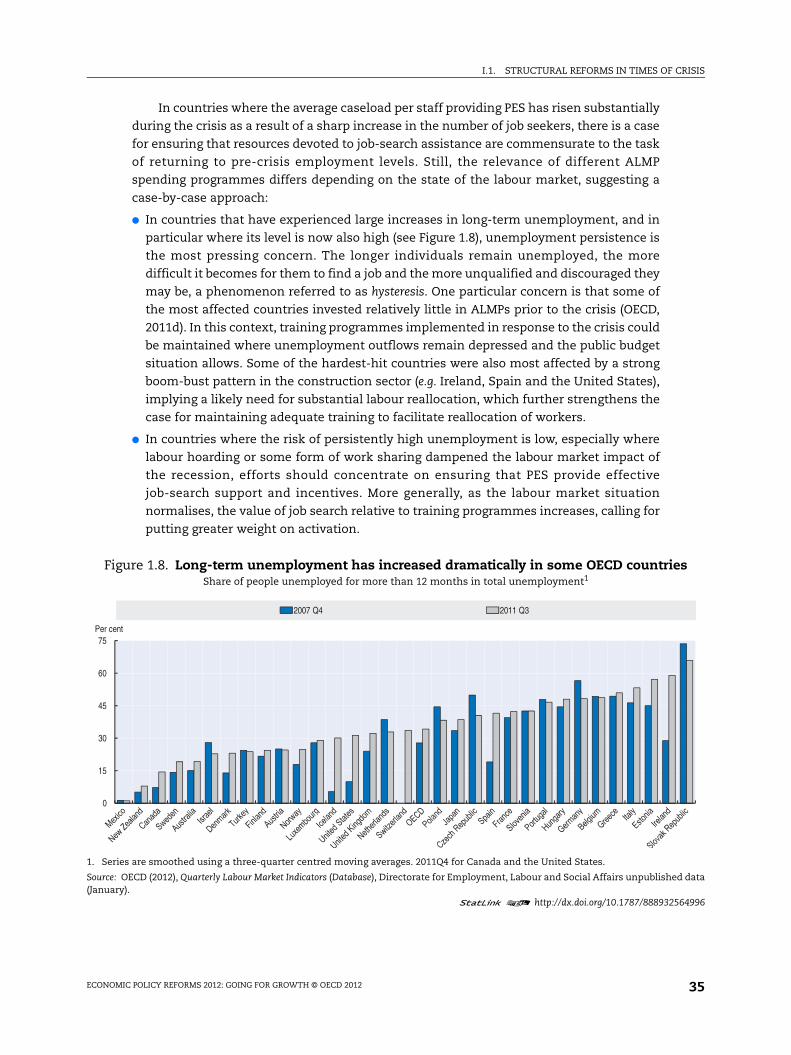
● In countries that have experienced large increases in long-term unemployment, and in
particular where its level is now also high (see Figure 1.8), unemployment persistence is
the most pressing concern. The longer individuals remain unemployed, the more
difficult it becomes for them to find a job and the more unqualified and discouraged they
may be, a phenomenon referred to as hysteresis. One particular concern is that some of
the most affected countries invested relatively little in ALMPs prior to the crisis (OECD,
2011d). In this context, training programmes implemented in response to the crisis could
be maintained where unemployment outflows remain depressed and the public budget
situation allows. Some of the hardest-hit countries were also most affected by a strong
boom-bust pattern in the construction sector (e.g. Ireland, Spain and the United States),
implying a likely need for substantial labour reallocation, which further strengthens the
case for maintaining adequate training to facilitate reallocation of workers.
● In countries where the risk of persistently high unemployment is low, especially where
labour hoarding or some form of work sharing dampened the labour market impact of
the recession, efforts should concentrate on ensuring that PES provide effective
job-search support and incentives. More generally, as the labour market situation
normalises, the value of job search relative to training programmes increases, calling for
putting greater weight on activation.
Figure 1.8. Long-term unemployment has increased dramatically in some OECD countriesShare of people unemployed for more than 12 months in total unemployment1
1. Series are smoothed using a three-quarter centred moving averages. 2011Q4 for Canada and the United States.
Source: OECD (2012), Quarterly Labour Market Indicators (Database), Directorate for Employment, Labour and Social Affairs unpublished data(January).
1 2 http://dx.doi.org/10.1787/888932564996
0
15
30
45
60
75Per cent
2007 Q4 2011 Q3

I.1. STRUCTURAL REFORMS IN TIMES OF CRISIS
ECONOMIC POLICY REFORMS 2012: GOING FOR GROWTH © OECD 201236
Short-time working schemes. Among crisis-related labour market interventions,
work-sharing arrangements and in particular short-time working schemes (STW) have
played a prominent role, with measures in place in two-thirds of OECD countries.20 Such
measures typically aim at cushioning the labour market impact of downturns, and for this
reason they have not been covered in Going for Growth, whose focus is on longer-term growth.
Nevertheless, given the highly persistent employment impact of the crisis in some countries,
STW schemes may have protected permanent jobs and prevented large income losses where
they were in place. New STW schemes were introduced in Poland, the Netherlands, Hungary,
the Czech Republic, the Slovak Republic, Mexico and New Zealand. In addition, many
countries extended the coverage or generosity of existing schemes, or relaxed eligibility or
administrative requirements in order to encourage take-up. The share of employees
participating in pre-existing STW schemes expanded substantially in Belgium, Germany,
Finland, Italy, Japan and Luxembourg, contributing to relatively benign labour market effects
of the crisis (OECD, 2010b; Hijzen and Venn, 2011). Although an empirical assessment of the
long-term effects of STW schemes is not yet available, the crisis experience suggests that
having such options in place and being able to activate them in severe downturns can be
useful, insofar as they may avoid losses of specific human capital in the wake of shocks that
are temporary and do not imply a need for reallocation.
At the same time, as with any form of public wage subsidy, STW schemes entail some
risks: i) deadweight losses may be incurred if subsidies are paid for jobs that employers
would have maintained even without public support; ii) displacement effects may occur if
STW schemes help preserve jobs that are not viable in the long run, hampering the
reallocation of resources across firms and industries and resulting in persistent declines in
hours worked and productivity; iii) wage pressures may arise, mitigating the success of
STW schemes in containing the rise in unemployment. In order to minimize these risks,
certain features in the design of STW schemes are desirable (OECD, 2011d; 2011e): i) tight
eligibility conditions (e.g. proof of minimum and abrupt reduction in production or sales),
co-financing by firms and (as is the case in Germany and the Netherlands) built-in
incentives for workers and firms to withdraw from STW schemes once they have outlived
their conjunctural purpose can help reduce deadweight losses; ii) quick phasing out as the
economy recovers can mitigate displacement effects. Also, such schemes may work more
effectively when implemented in the context of wage bargaining that provide individual
firms more leeway (such as opt-out clauses) in the application of collective agreements, as
this will allow for greater flexibility in the determination of working conditions during the
operation of such schemes. For example, in Germany, those measures complemented
spontaneous private-sector adjustment in average hours worked, the implementation of
which was facilitated by collective agreements.
Policy barriers to full-time female participation
Some of the impediments to full-time female participation have been reduced
since 2007 in all nine countries where this had been put forward as a policy priority. This
has been achieved by expanding childcare facilities (Germany, Ireland and Switzerland),
increasing childcare subsidies (Korea, New Zealand and the Slovak Republic), stepping up
the childcare components of tax credits (Switzerland and the United Kingdom), lowering
the compulsory schooling age or promoting full-day schools (Germany and Switzerland),
reducing differences in taxation between main and second earners (Australia and
Switzerland) and restructuring income support for single parents or second earners to

I.1. STRUCTURAL REFORMS IN TIMES OF CRISIS
ECONOMIC POLICY REFORMS 2012: GOING FOR GROWTH © OECD 2012 37
promote participation (Australia and the United Kingdom). Chile increased the length of
paid maternity leave and created a paternity leave, though empirical evidence suggests
that childcare support may be more conducive to high female labour force participation
(see e.g. Jaumotte 2003; Bassanini and Duval, 2006).
Labour market regulations and collective wage agreements
Job protection and other policies to reduce labour market dualism. Firing restrictions
may have cushioned unemployment to some extent during the crisis, but excessive gaps in
protection between permanent and temporary contracts contribute to duality in the labour
market, which in turn hampers employment and productivity (Bassanini et al., 2009).
Actions taken in countries that had a Going for Growth recommendation in this area were
more frequent and radical in nature during the crisis than before, especially in European
countries where the surge in unemployment highlighted the weaknesses of partial
employment protection reform strategies – i.e. reforms reducing job protection on
temporary contracts while maintaining high protection on regular contracts.21 Greece and
Spain introduced major EPL reforms in 2010 aimed at reducing severance payments on
permanent contracts. In Portugal, the 2009 job protection reform, which implied a
substantial easing of job protection on regular contracts through a simplification of
dismissal procedures, is being followed up – as part of the EU-IMF financial assistance
package – by reductions in severance payments for regular contracts and a narrower
definition of unfair dismissal. The Netherlands have been gradually reducing de facto
severance payments, first by reforming judicial procedures for local courts and then by
introducing a cap (although limited to public and care sector workers). The Czech Republic
also reformed severance payments by linking their level to job tenure. The provision for
termination of a work contract by mutual consent was instituted in France in 2008 with the
goal of reducing uncertainty about dismissal costs but it had a limited impact on reducing
dualism so far. Finally, some countries have sought to reduce labour market duality by
strengthening training (Korea) or work-study schemes (France). Such measures are likely to
work best if targeted to marginal groups in the labour market in order to enhance their
regular employability. No actions were taken in respect of the priority to reduce job
protection on regular workers in Germany, Italy, Korea, Luxembourg, Slovenia and Sweden.
EPL or targeted training reforms have also been recommended to lower-income
countries as a way to tackle labour informality, which is an extreme form of labour market
duality. Brazil recently introduced a programme for vocational training of low-skilled
workers. Turkey progressively eased the conditions for establishing temporary work
contracts. Little progress has been achieved in India over the past year to reduce
employment protection legislation that discriminates against larger firms. No action was
taken over the past year in Chile and Indonesia, where reducing job protection had been
recommended along with introducing (Indonesia) or stepping up (Chile) unemployment
benefits.
Minimum wages and wage bargaining systems. Reductions in the relative level or
growth rate of minimum wages vis-à-vis average wages have been recommended as a
means to encourage low-skilled and formal employment in both some OECD and large
emerging countries (Australia, Greece, Indonesia, Israel, South Africa and Turkey). Greater
flexibility in wage determination has also been recommended for Australia, Belgium,
Finland, Italy, Slovenia, Spain and South Africa in order to better align wages with firm-and

I.1. STRUCTURAL REFORMS IN TIMES OF CRISIS
ECONOMIC POLICY REFORMS 2012: GOING FOR GROWTH © OECD 201238
regional-level productivity conditions and thereby encourage demand for low-skilled
workers. Similarly to the trend observed in the area of job protection, responsiveness to
such recommendations has been stronger during the crisis than before. Greece introduced
sub-minimum wages for young workers and apprentices. While no change in this area has
been achieved in Belgium, Finland decentralised wage bargaining, as did Australia by
strengthening wage bargaining at the firm level, Italy by agreeing on a new labour contract
promoting greater wage differentiation in the private sector and Spain by easing the
conditions for firms to opt out from higher-level collective bargaining agreements. Reforms
in this area have been accelerating over the past year, especially in southern European
countries in need to regain competitiveness. Spain recently introduced a reform
facilitating company-level agreements over any other negotiation level on issues such as
wages and distribution of working time and accelerating arbitration procedures. Similarly,
in Italy, the 2011 emergency budget allows local enterprise bargaining to undercut national
wage agreements, provided a representative union in the firm accepts to opt out of the
collective agreement and signs the new agreement with the employer. Responsiveness to
priorities was more limited in the new OECD members and in Indonesia and South Africa
since 2011, when associated Going for Growth priorities were set. In South Africa, the New
Growth Pact strategy includes broad proposals to reform wage bargaining, which could help
raise the very low employment rate in the formal sector. In Israel and Slovenia, increases
in relative minimum wage levels were agreed for 2011 and 2012, in contrast with Going for
Growth recommendations in this area.
Housing policies
Housing policies can affect living standards through both labour productivity and
labour utilisation (see Special Chapter 4 in Going for Growth 2011, OECD, 2011b). However,
Going for Growth priorities in this area have focused somewhat more on boosting labour
utilisation. Responsiveness to these recommendations has clearly increased over the past
few years, possibly reflecting growing recognition that badly designed policies contributed
to the build-up of housing bubbles. Some countries have been revising housing subsidies
(Iceland and the Slovak Republic), in some cases replacing them with less distortive
targeted cash benefits (Spain). The United Kingdom simplified the planning process in
order to increase the responsiveness of housing supply to demand, while Sweden took
some actions to introduce market principles for municipal housing companies. Some
countries reduced tax distortions that favour home ownership by reducing mortgage
interest deductions from income taxation (Denmark) or by equalising the tax treatment of
rented and owner-occupied housing (Spain). Rent regulations that prevent the
development of the rental market have been eased in the Netherlands, Poland and Spain.
No actions were taken in Luxembourg to address housing rigidities.
Progress in reforming policies to improve labour productivity
Policy priorities aimed at improving productivity performance have been more
prevalent for countries with a large gap in output per hour worked vis-à-vis the most
productive OECD economies or with weak productivity growth over the past decade. Such
countries have included some North American and Asia-Pacific member countries, some
smaller European countries, the European Union as a whole, and starting in 2011, all of the
BRIICS. Suggested policy reforms to boost productivity have included the easing of entry
restrictions and controls over business operations in specific product markets, policies to

I.1. STRUCTURAL REFORMS IN TIMES OF CRISIS
ECONOMIC POLICY REFORMS 2012: GOING FOR GROWTH © OECD 2012 39
boost educational outcomes, cuts in agricultural support to improve resource allocation
throughout economies, and various other measures such as tax system reforms and
innovation policies. Progress has been mixed since 2007 in the area of agriculture, but more
actions in line with prior Going for Growth recommendations have been taken in other
areas, notably innovation,22 but also human capital and product market regulation
(Figure 1.9).
Product market reforms
The easing of unduly restrictive regulations in product markets has been identified as
a priority for most OECD countries – especially those with sub-par productivity
performance – and would in many cases also help them kick-start the recovery. While
action on these priorities has been relatively frequent, it has rarely been followed by a
removal of the corresponding Going for Growth priority, hinting at some lack of major
reforms. Specifically, around two-thirds of the countries concerned have followed up on
recommendations to ease product market regulations since 2007, but the actions taken
have been deemed sufficient to result in a removal of the corresponding priorities in only
around one-fifth of them. The main product market reforms have been the following:
● All countries that had been recommended to reduce economy-wide regulatory burdens
have taken some measures to address this priority by: i) streamlining registration and
licensing procedures (Belgium, Chile, the Czech Republic, Greece, Korea and Turkey)
including in some specific sectors (construction in Israel, services in Portugal and food in
Turkey); ii) creating a one-stop shop for start-ups (the Czech Republic, Greece, Israel and
Poland); iii) simplifying bankruptcy procedures (the Czech Republic and Estonia); and
iv) promoting competition for public contracts and cutting business red tape (Denmark
and Poland). Policy responsiveness has been limited in Iceland, India and Indonesia,
where sustained efforts will be needed to reduce economy-wide regulatory burdens.
Figure 1.9. Responsiveness to Going for Growth recommendations across labour productivity-enhancing areas
2007-11 average
Note: See Box 1.1 for the definition of the responsiveness rate.1. OECD average excludes Chile, Estonia, Israel and Slovenia.
1 2 http://dx.doi.org/10.1787/888932565015
0
0.1
0.2
0.3
0.4
0.5
0.6
Product market reform Agriculture Human Capital General taxation Public sector reform Public infrastructure Innovation
Responsiveness rate
OECD average1

I.1. STRUCTURAL REFORMS IN TIMES OF CRISIS
ECONOMIC POLICY REFORMS 2012: GOING FOR GROWTH © OECD 201240
● In line with Going for Growth recommendations, efforts have been made to strengthen
the competition framework in Denmark, France and Greece, Italy, as well as in
New Zealand through the establishment of an independent Productivity Commission
in 2010, and in South Africa through the introduction of regulatory impact assessment
for new regulation. In the European Union, the transposition of the Services Directive,
albeit incomplete, is well advanced and the creation of a Single European Payments Area
has reduced cross-border financial transactions costs. Norway took action that goes
against Going for Growth recommendations in 2008 with the simplification of
government procedures to overrule competition authorities.
● Most countries that had been recommended to strengthen competition in network
industries have taken some measures to address this priority by: i) unbundling energy
networks (Hungary, Portugal); ii) improving third-party access and easing entry
restrictions (Austria and Mexico in telecommunications, Greece and Portugal in various
network sectors and Switzerland in telecommunications and electricity transmission);
iii) introducing or consolidating the power of the regulatory authority (Mexico,
New Zealand, Poland and Switzerland) or adopting an industry-specific competition Act
(Austria in the gas sector); iv) reducing price controls (Belgium, Hungary, Ireland where a
wholesale electricity market was set up in 2007 and Portugal where a roadmap for
phasing out regulated energy prices was drafted in July 2011) and; v) introducing
incentive-based regulation (Germany and Israel). In the European Union, competition
has been enhanced in air services by the first-stage EU-US Air Transport Agreement and
postal services will be fully liberalised in 2012. The Netherlands took action that goes
against Going for Growth recommendations in 2010, when the court of appeal overruled
the 2006 law stipulating ownership separation of the energy distribution networks. No
significant action was taken in Canada and South Africa to address priorities to enhance
competition in network industries, nor in Japan where the privatisation of Japan Post
and Japan Post Insurance – planned to be completed by 2017 – was suspended.
● In countries that had been recommended to reduce barriers to competition in retail
trade, measures have been taken to: i) ease entry barriers, including for large retailers
(Italy, Belgium, Portugal and Spain), ii) retail pricing regulation (France) and iii) sales
regulations (Belgium) and; iv) reduce restrictions on shop opening hours (Austria,
Denmark, Finland, Italy and Portugal). In line with Going for Growth recommendations,
barriers to entry in professional services have been reduced in Austria, Canada (where
the focus has been barriers to inter-provincial mobility), Germany, Greece, Ireland, Korea
and Portugal (a commitment associated with the EU-IMF aid package). No progress has
been achieved to increase competition in retail trade and professional services in
Luxembourg, where even the transposition of the EU Services Directive remains to be
legislated, or in the Netherlands to promote competition in retail trade.
● Reducing the scope of public ownership has often been recommended as part of a
broader policy package aimed at strengthening competition. Privatising SOEs could bring
efficiency gains while helping restore the sustainability of public finances in cases where
public administration and management had clearly proven to hurt efficiency. Well-designed
privatisation processes, however, need to consider competition principles and apply
competition law. Reducing the scope of public ownership has also been specifically
advised to some OECD countries as well as in 2011 to China and Russia, where public
ownership is particularly high. In China, private equity firms are progressively being

I.1. STRUCTURAL REFORMS IN TIMES OF CRISIS
ECONOMIC POLICY REFORMS 2012: GOING FOR GROWTH © OECD 2012 41
allowed to restructure state-owned companies and the share of state capital in state-owned
enterprises is being decreased. Italy privatised its public airline Alitalia in 2009. Mexico
has been gradually increasing the independence and accountability of PEMEX, the
national oil company. Privatisations took place in Poland and Turkey. More broadly,
against the background of fiscal sustainability concerns, the crisis has accelerated the
pace of privatisation, and especially so in European countries in the context of the
sovereign debt crisis (see Box 1.2). In Russia, where State intervention remains pervasive,
no significant progress has been recorded over the past year.
● Among the 11 countries (8 OECD countries and in 2011 India, Indonesia and Russia)
where reducing barriers to foreign direct investment had been recommended, policy
responsiveness has been rather limited, with countries often combining small steps
forward with policy relapses. As a result, all priorities in this area have yet to be fully
addressed. Approval processes for foreign direct investment (FDI) were removed in the
non-state-owned banking sector in Russia over the last year and were simplified across
the board in Korea. Efforts to improve transparency and simplify procedures for
prospective foreign investors have also been undertaken in India since 2011 as well as in
Japan through the “Inward Investment Promotion Programme” (2010) which features
some deregulation of investment procedures. Reductions of ownership restrictions have
taken place for satellites broadcasting in Canada and Korea and for retail trade in India.
Little has been achieved in Australia, Iceland, Indonesia and New Zealand to reduce FDI
restrictions.
● Openness to trade was improved in Switzerland – for which the removal of non-tariff
trade barriers was identified as a priority in 2007 – in 2010, when remaining technical
barriers to trade for over 80% of the imports from the European Union were eliminated.
In Russia, action to remove distortions in trade policy has been limited since 2011, apart
from some reduction in tariffs for selected agricultural products that were put in place in
response to the food price shock resulting from the summer 2010 drought.
Agriculture
Limited action has also been taken on Going for Growth agricultural policy reform
priorities as reflected in relatively low responsiveness rates and in the persistence of the
recommendations over time. This partly stems from the political difficulty of reform in this
area, as also testify increases in restrictions of agricultural exports in the past few years.
Agricultural subsidies have been mechanically reduced as a consequence of higher world
market prices. However, some progress has also been made towards reducing the economic
distortions associated with policy interventions, i.e. the composition of producer support to
agriculture has shifted from price support towards more direct income support
(European Union and Switzerland), and in some countries new direct payments supplement
existing market price support measures (Japan and Korea). The European Union is
progressively decoupling producer support from production and will abolish milk quotas
by 2015. However, the renewed use of export subsidies for dairy products in 2009 was a step
back. Korea, Iceland and Switzerland are reducing export subsidies and tariff and
non-tariff barriers. The United States went a step back in 2008 by providing new incentives
for the local production of cellulosic bio-fuels and little progress has been achieved in
Norway in this area.

I.1. STRUCTURAL REFORMS IN TIMES OF CRISIS
ECONOMIC POLICY REFORMS 2012: GOING FOR GROWTH © OECD 201242
Human capital
Raising human capital has been recommended to lift productivity levels in the vast
majority of OECD countries since 2007 and in 2011 in all BIICS. Concrete priorities have
aimed at improving the quality and efficiency of education systems, their responsiveness
to labour market needs, as well as at reducing educational inequalities. While action has
been very frequent and increasingly so over time, many of the priorities remain as
education reform typically requires sustained efforts. The crisis context did not halt
longstanding policy efforts in this area but, as discussed in the 2011 edition of Going for
Growth, there remains significant room for improving the efficiency of public education
spending.
About half of the countries have taken actions on Going for Growth recommendations
to reform primary and secondary education. General education reforms have included:
i) curricula reforms (Greece, Iceland, Luxembourg, Mexico and Turkey); ii) increased supply
of vocational education at the upper secondary level and greater responsiveness to the
needs of the labour market (Australia, Portugal, Spain and Turkey and the United Kingdom)
– including by developing second-chance programmes for low-educated adults (Brazil and
Portugal); and iii) stronger qualification requirements, training or certification for teachers
(Chile, Greece, Indonesia, Mexico, Norway, South Africa, Spain and Sweden).
Accountability has been reinforced through: i) teacher or school performance evaluations
(Greece, Mexico, Portugal and the United States); ii) reforms or wider use of standardised
exams (the Czech Republic, Germany, Denmark, Israel, Sweden and Spain); iii) national
standards or indicators (Norway, New Zealand, Turkey and the United States), annual
reporting (New Zealand); and iv) evaluation by a quality assurance agency (Chile). Countries
have taken measures to increase equality of educational opportunities, such as: i) financial
incentives for under-performing schools or for teachers to raise student achievement (Chile
and the United States); ii) increased support for students from disadvantaged backgrounds
(Chile, New Zealand, the United States and the United Kingdom); iii) reduced grade repetition
(Luxembourg); iv) the progressive postponing of tracking (Austria and Germany); and v) an
increase in compulsory years of schooling (Portugal and Israel). Funding for basic education
and school infrastructure has been increased in emerging economies, including in Brazil,
China, Chile and South Africa, as well as in Israel where it has financed increased teacher
pay and reductions in class size.
Reform of higher education systems has been flagged as a priority in Going for Growth
for many continental European countries. Most of them have taken some measures,
although further action is still needed to address long-standing deficiencies. The reforms
undertaken since 2007 in countries with a recommendation in this area have included:
● Revising the functioning of students’ financial aid (Denmark and Finland) and introducing
or extending tuition fees (Germany, Ireland through increases in the contribution charge
for tertiary students, and Sweden but in the latter case only for students from outside
the European Economic area);
● Improving the governance of universities, including through greater autonomy (France,
Germany, Italy and Portugal) and the reinforcement of financial incentives to improve
performance inter alia by strengthening evaluation mechanisms (Italy), partly
conditioning government funding on outcomes (New Zealand and the Slovak Republic),
and via cost benchmarking across institutions (Switzerland);
I.1. STRUCTURAL REFORMS IN TIMES OF CRISIS
ECONOMIC POLICY REFORMS 2012: GOING FOR GROWTH © OECD 2012 43
● Reforming higher education assessment frameworks, including by establishing a new
framework law for higher education (Greece) or by creating or reforming the accreditation
agency to support internal quality assessments of universities (Portugal and Switzerland);
● Encouraging earlier completion by adjusting university funding and study programmes
(Denmark), or earlier entry into tertiary education by reforming admission criteria
(Sweden and Finland);
● Developing higher education technical and professionally-oriented courses (Portugal,
Spain and Turkey) with facilitated transition to university (Portugal and Spain).
General taxation
Tax reform has gained increasing prominence in the Going for Growth exercise over the
years. This reflects mounting evidence of the impact of the tax structure on economic
growth (see e.g. Arnold et al., 2011) and the pressing need to restore fiscal sustainability in
many OECD countries, which calls for designing growth-friendly fiscal consolidation
strategies – or for implementing revenue-neutral tax reforms where there is fiscal space.
While Brazil took no action to reduce the fragmentation and complexity of its tax system
since 2011 (when the corresponding priority was set) reforms have been widespread over
the last five years in the 13 OECD countries where improving the efficiency of the tax
system had been identified as a priority. Greece and Portugal have been implementing tax
reforms largely consistent with their Going for Growth priorities. In particular, both countries
have sought to broaden the tax base by combating tax evasion (Greece) and curbing tax
expenditures (Portugal). Portugal also took action to simplify tax collection and reduce tax
compliance costs. In 2011, Italy undertook a number of fiscal consolidation-driven tax
changes which should improve the efficiency of the tax structure, e.g. cutting labour and
corporate taxes along with raising value added tax (VAT) and local property tax rates. In
Germany and Finland, cuts in labour taxation implemented as part of the crisis-related
measures have been financed through permanent increases in less distortive consumption
and environmental taxes. Canada and Israel have been reducing the corporate tax rate – as
well as personal income tax rates in the case of Israel, as will Australia by 2013. Japan
broadened the tax base by abolishing a number of tax exemptions in 2010. Tax reform was
also implemented in Korea by broadening the consumption tax base and in Mexico, first by
reducing corporate tax loopholes and then by increasing the VAT rate in 2010. Norway
partly reformed its wealth tax system by bringing the housing valuation component of the
tax closer to market values. No significant action was taken in the United States to address
tax distortions and broaden the tax base.
Other policies
Policy priorities have also covered a broad range of other areas relevant to productivity
performance, some of which – especially in the area of the financial sector and public
sector efficiency – could also help address public and private sector financial imbalances:
● Financial services. Financial market reform has in general not featured among the Going for
Growth priorities and has been treated separately (e.g. in Box 1.1 of Going for Growth 2011
and in Going for Growth 2010), as it is a key challenge in many OECD countries and in need
of broad international coordination. Reforms in this area had also been specifically
identified as policy priorities for the European Union since 2007, and for Iceland and the
United States against the background of the financial crisis. Most OECD countries –
including those with a previous priority in this area – have taken steps towards overhauling

I.1. STRUCTURAL REFORMS IN TIMES OF CRISIS
ECONOMIC POLICY REFORMS 2012: GOING FOR GROWTH © OECD 201244
financial supervision, in an attempt to correct some of the institutional failures that led
to the financial crisis. Together with actions by individual countries and the
European Union, a regulatory reform has been taking place at the international level in
recognition of the need for co-ordinated rules to strengthen financial stability and
reduce opportunities for regulatory arbitrage. One vital component of such a regulatory
regime has been the Basel III agreement, which effectively triples the size of capital
reserves that banks must hold against losses over the period 2011-18.23 Despite this
progress, areas where international coordination still needs to advance include the
regulation of the over the counter derivatives market and accounting standards.
International coordination of prudential supervision is particularly important for the
euro area, where further efforts to develop an effective system of cross-border
supervision and an integrated crisis management framework should feature on top of
the policy agenda. Going for Growth 2011 recommended more basic financial
liberalisation in most non-member economies, including Brazil and India, where bank
credit is not fully allocated by the market. Since 2011, no action was taken in Brazil to
reduce its very high level of reserve requirements, but the authorisation of credit
registries should improve banks’ access to information on borrowers. Over the last year,
India eased restrictions on access to local capital markets with foreign individuals
allowed to invest directly (from 2012).
● Public sector reform. Responsiveness has been relatively high among the OECD countries
where improving the efficiency of government expenditure had been recommended,
likely reflecting the need to consolidate public budgets. General public sector reforms
have included a rationalisation of public services (Hungary and Portugal) and
introducing performance assessment (Portugal). Efficiency-enhancing public sector
reforms have taken place in the healthcare sector through the re-organisation of public
providers and the introduction of benchmarking (Hungary and New Zealand), patient
co-payments (the Czech Republic) or the decentralisation of expenditures to enhance
cost-awareness (New Zealand and the United Kingdom). Broader healthcare sector reforms
have been recommended for Switzerland, the United States and Russia. The 2010 reform in
the United States made health insurance compulsory and provided means-tested subsidies
for its purchase. Switzerland has been enhancing cost-effectiveness in the pharmaceutical
sector by increasing co-payments on branded drugs and by progressively introducing
diagnosis-related funding in the hospital sector. Since 2011, the Russian Federation has
allowed citizens to choose a primary care doctor and an insurance company within the
mandatory insurance system. No significant progress has been registered in Iceland
with respect to public sector reform.
● Public infrastructure. Addressing public infrastructure deficiencies has been a priority for
several OECD and large emerging countries. Against the background of fiscal adjustment
needs, raising expenditure on infrastructure has proven more challenging in the
aftermath of crisis-related fiscal stimulus packages implemented in most OECD
countries in 2008 and 2009 (see Chapter 1 in OECD, 2010a). Policies to make cost-effective
use of existing infrastructure have included the introduction of a combined property and
water charge in 2012 (and meter-based water charges scheduled for 2013) in Ireland and
the introduction of toll roads to restrain demand in Australia and New Zealand. Australia
also focused on enhancing transparency in the selection of projects through the
publication of cost-benefit analyses and ex post evaluation mechanisms. While the UK

I.1. STRUCTURAL REFORMS IN TIMES OF CRISIS
ECONOMIC POLICY REFORMS 2012: GOING FOR GROWTH © OECD 2012 45
government halted the trend increase in public investment amid austerity measures,
Poland could rely on EU structural funds to continue upgrading its transport and
communication infrastructure. In emerging economies, where enhancing infrastructure
provision is key to boosting living standards and where public finances are generally in
better shape, public spending on infrastructure continued to rise. At the same time,
though, backtracking took place with respect to the opening of infrastructure industries
to foreign investors, with India raising limits for foreign institutional investment in debt
issued by Indian infrastructure companies and Brazil restricting private equity
participation in the oil and gas sectors.
● Innovation-promoting policies. As a key driver of long-term growth, innovation-related
reforms have been recommended in seven OECD countries and in the Russian Federation
as well as in China, where the focus was to speed up absorption of existing technology.
As in the past, policy responsiveness has been rather high in this area, although it has
declined more recently. All countries concerned followed up on Going for Growth
recommendations since 2007 by raising public support for R&D activities through tax
credits (Ireland and Italy), public grants (New Zealand) or subsidies targeted at
innovative SMEs (Slovak Republic), as well as by strengthening university-industry
linkages (Canada, Ireland, Japan and New Zealand) and better protecting intellectual
property rights (Korea). In Russia, the recent creation of the Skolkovo “innovation city”
may help improve innovation policy in the future, but with the risk of increasingly
“picking the winners” through public support.
In some lower-income OECD countries (e.g. Mexico) and the BRIICS, a number of more
specific productivity-enhancing policy initiatives have been recommended, such as land
regulation, governance and legal reforms that would help strengthen the rule of law, clarify
property rights and fight corruption, or phasing out of distortive energy subsidies. Action
has been rather limited since 2011, when corresponding priorities were set. India and
Indonesia have introduced reforms aimed at streamlining land acquisition processes.
Since 2011 in Russia, all draft legislation is required to be subject to regulatory impact
analysis, in order to identify unjustified bureaucratic interference in private sector activities
and thereby reduce corruption risk. The new Mediation law introduced in China in 2011 should
strengthen the judicial system by providing a firm basis to the first level dispute resolution
mechanism commonly used at the local level for the resolution of private disputes. Little
progress has taken place since 2011 in Indonesia and Mexico to improve governance systems.
Energy subsidies were increased in Indonesia in 2011 compared to what was planned in the
initial Budget, at odds with the corresponding Going for Growth priority.
Green Growth
Going for Growth priorities are aimed at promoting long-run growth, and a number of them
would also boost Green Growth and contribute to environmental sustainability including
inter alia in the areas of innovation, taxes and infrastructure. Responsiveness to Going for
Growth priorities has been pro-Green Growth in a number of policy areas, among which:
● Tax reforms, where the focus was on reducing direct taxes by partly shifting the tax
burden on environmental taxation. Germany lowered unemployment insurance
contributions over the 2007-09 period while introducing a CO2 element in the vehicle tax
in 2009, and Finland cut income tax and social security contributions during the
I.1. STRUCTURAL REFORMS IN TIMES OF CRISIS
ECONOMIC POLICY REFORMS 2012: GOING FOR GROWTH © OECD 201246
recession while increasing energy taxes. Other countries have been introducing carbon
emission trading schemes, such as New Zealand. To the extent that the underlying
trading permits are auctioned, such schemes could also be part of a growth-friendly tax
reform package.
● Public infrastructure reforms, where the focus was on reducing CO2 emissions and road
congestion and curbing demand through price incentives more broadly. Water charges are
being introduced in Ireland (in 2012 as a lump sum per household and in 2013
meter-based). Australia is developing a system of smart managed motorways embedding
technologies aimed at improving traffic demand management in major cities, and
New Zealand opened a toll road in 2009.
Notes
1. Several broader measures of well-being are being developed in the context of the OECD-wide workon measuring well-being and progress. Highlights of this work are provided by the OECD Better LifeInitiative, which so far includes the 2011 report “How’s life?” and the interactive wellbeingassessment tool “Your Better Life Index”. Some measures that extend GDP numbers to non-marketproduction, and thereby may come closer to indicators of well-being, have been explored in lastyear’s edition of Going for Growth. While many alternative well-being measures are correlatedwith GDP per capita (see OECD, 2006, Going for Growth 2006), broader measures are importantcomplements to evaluate issues such as, for example, income distribution, poverty, orenvironmental sustainability. On the latter issue, the OECD is providing analytical tools and policyrecommendations to foster green growth, which will progressively be integrated in the Going forGrowth exercise (see OECD, 2011a) starting with next year’s edition.
2. See special chapter on the crisis-related policy interventions in Going for Growth 2010 (Chapter 1 inOECD, 2010a).
3. See Chapter 2 of OECD Employment Outlook 2010 (OECD, 2010b) for a discussion on the impact of thecrisis on emerging economies and the role of labour market and social policies to support affectedworkers and their families.
4. See Annex 1.A1 for a detailed presentation of the methodology used to select the priorities.
5. Box 2.2 in Going for Growth 2010 (OECD, 2010a) discusses the caveats associated with reformintensity indicators.
6. The statistical data for Israel are supplied by and under the responsibility of the relevant Israeliauthorities. The use of such data by the OECD is without prejudice to the status of the GolanHeights, East Jerusalem and Israeli settlements in the West Bank under the terms of internationallaw.
7. Roughly comparable reform patterns emerge from a concomitant survey carried over the sameperiod by the Business and Industry Advisory Committee to the OECD (BIAC) in its Member andObserver organisations – i.e. the major national business and employer organisations in OECDcountries and certain emerging economies. The latter survey suggests that BIAC Member/Observerorganisations perceive that most Going for Growth priorities have been addressed. Indeed, 69% ofthe reform priorities are considered to have been partly implemented since 2007, which isconsistent with significant reform activity over the period considered. BIAC Member/Observerorganisations rarely consider that Going for Growth recommendations have been fullyimplemented, in line with the current finding that policy action has been often piecemeal and thatit rarely would imply the removal of the corresponding priority.
8. See also the latest Economic Survey on Greece (OECD 2011c).
9. The scatter excludes the four countries that had either no or only one labour-utilisation enhancingpriority.
10. Based on OECD Economic Outlook 90 projections.
11. This finding is in contrast with past experience and empirical evidence, e.g. with Duval (2008) whofound significant evidence of a general trade-off between undertaking reforms and consolidatingpublic budgets.

I.1. STRUCTURAL REFORMS IN TIMES OF CRISIS
ECONOMIC POLICY REFORMS 2012: GOING FOR GROWTH © OECD 2012 47
12. Hungary achieved considerable progress in reducing labour taxation over the last two years, and,more recently, it even introduced a flat-rate personal income tax. While boosting labour utilisationin principle, such reform as implemented has been highly regressive and raises fiscalsustainability concerns.
13. See (OECD, 2011e).
14. See de Serres et al. (2012) and OECD (2010c), Sickness, Disability and Work: Breaking the Barriers – ASynthesis of Findings across OECD Countries
15. The Netherlands and the United Kingdom have had some success in reversing the trend rise indisability rates during 2000s.
16. See Box 1.3 and Panels A and B of Chapter 1 of OECD Employment Outlook 2011 (OECD, 2011d).
17. Other influential factors factors include population ageing, since disability prevalence increaseswith age.
18. See Chapter 1 of OECD Employment Outlook 2011 on income support to job losers (OECD, 2011d).
19. See web annex of Chapter 1 of Employment Outlook 2011 (OECD, 2011d), Table 1.A1.6.
20. See OECD Employment Outlook 2010 (OECD, 2010b) for a detailed assessment of STW schemes inOECD countries.
21. The Spanish labour market crisis is a topical case. See Blanchard and Landier (2002), Bentolila et al.(2010) and de Serres et al. (2012).
22. Actions in this area do not need to imply comprehensive reforms. Moreover, the bulk of measureswere actually taken over the period 2007-09, with some slowdown more recently.
23. See e.g. Box 1.1 in Chapter 1 of OECD (2011b) on financial market reform.
Bibliography
Arnold, J., et al. (2011), “Tax Policy for Economic Recovery and Growth”, The Economic Journal, 121,pp. F59-F80.
Bassanini, A. and R. Duval (2006), “Employment Patterns in OECD Countries: Reassessing the Role ofPolicies and Institutions”, OECD Economics Department Working Papers, No. 486, OECD Publishing.
Bassanini, A., L. Nunziata, and D. Venn (2009), “Job Protection Legislation and Productivity Growth inOECD Countries”, Economic Policy, Vol. 24, No. 58, pp. 349-402, April.
Bentolila, S., et al. (2010), “Two-tier Labor Markets in the Great Recession: France vs. Spain,”IZADiscussion Paper series, No. 5340.
Blanchard, O. and A. Landier (2002), “The Perverse Effects of Partial Labour Market Reform: Fixed-TermContracts in France”, Economic Journal, Vol. 112, No. 480, pp. F214-F244.
Duval, R. (2008), “Is There a Role for Macroeconomic Policy in Fostering Structural Reforms? PanelEvidence from OECD Countries over the Past Two Decades”, European Journal of Political Economy,Vol. 24, No. 2, pp. 491-502.
Duval, R., M. Ehris and D. Furceri (2011), “The Effects of Downturns on Labour Force Participation:Evidence and Causes”, OECD Economics Department Working Papers, No. 875, OECD Publishing.
Hijzen, A. and D. Venn (2011), “The Role of Short-Time Work Schemes during the 2008-09 Recession”,OECD Social, Employment and Migration Working Papers, No. 115, OECD Publishing.
Jaumotte, F. (2003), “Female Labour Force Participation: Past Trends and Main Determinants in OECDCountries”, OECD Economics Department Working Papers, No. 376, OECD Publishing.
OECD (2006), Economic Policy Reforms 2006: Going for Growth, OECD Publishing.
OECD (2009), OECD Employment Outlook 2009: Tackling the Jobs Crisis, OECD Publishing.
OECD (2010a), Economic Policy Reforms 2010: Going for Growth, OECD Publishing.
OECD (2010b), OECD Employment Outlook 2010: Moving Beyond the Jobs Crisis, OECD Publishing.
OECD (2010c), Sickness, Disability and Work: Breaking the Barriers: A Synthesis of Findings across OECDCountries, OECD Publishing.
I.1. STRUCTURAL REFORMS IN TIMES OF CRISIS
ECONOMIC POLICY REFORMS 2012: GOING FOR GROWTH © OECD 201248
OECD (2011a), “Strengthening Going for Growth and Other WP1 Work”, Document prepared by theEconomics Department for the Economic Policy Committee’s Working Party No. 1, ECO/CPE/WP1(2011)16.
OECD (2011b), Economic Policy Reforms 2011: Going for Growth, OECD Publishing.
OECD (2011c), OECD Economic Surveys: Greece 2011, OECD Publishing.
OECD (2011d), OECD Employment Outlook 2011, OECD Publishing.
OECD (2011e), Pensions at a Glance 2011: Retirement-income Systems in OECD and G20 Countries,OECD Publishing.
de Serres, A. F. Murtin, and C. De la Maisonneuve, (2012), “Policies to Facilitate the Return to Work”,OECD Economics Department Working Papers, OECD Publishing, forthcoming.

I.1. STRUCTURAL REFORMS IN TIMES OF CRISIS
ECONOMIC POLICY REFORMS 2012: GOING FOR GROWTH © OECD 2012 49
ANNEX 1.A1
How policy priorities are chosen for Going for Growth
The Going for Growth structural surveillance exercise seeks to identify five policy
priorities for each OECD member country, the BRIICS and the EU. Three of these policy
priorities are identified based on internationally comparable OECD indicators of policy
settings and performance. The additional two priorities are often supported by indicator-
based evidence, but may draw principally on country-specific expertise. These priorities are
meant to capture any potential policy imperatives in fields not covered by indicators.
For the selection of the three indicator-based policy priorities, the starting point is a
detailed examination of labour utilisation and productivity performance so as to uncover
specific areas of relative strength and weakness. Each performance indicator is juxtaposed
with corresponding policy indicators, where OECD empirical research has shown a robust
link to performance, to determine where performance and policy weaknesses appear to be
linked. This evaluation process is carried out for each of the approximately 50 areas where
OECD policy indicators provide coverage.
As an example, Figure 1.A1.1 below shows, for a sample country, a scatter plot of
pairings of policy indicators (on the horizontal axis) with corresponding performance
indicators (on the vertical axis). Since many of the approximately 50 indicators are
associated with more than one performance area, there are potentially more than
100 potential pairings to be examined. The indicators of policy and performance are
standardised by re-scaling them so that each has a mean of zero and a cross-county standard
deviation of one, with positive numbers representing positions more growth-friendly than
the OECD average. The scatter plot is thus divided into four quadrants, depending on
whether a country’s policy-performance pairing is below or above the average policy or
performance score.
Candidates for recommendations thus fall into the lower left quadrant, where policy
indicators and corresponding performance are both below average. In most countries there
are more than three unique policy areas that qualify as potential priorities (for instance,
Germany had 16 candidates in the 2009 exercise). When there are more than three
candidate policy priorities, the list has been narrowed using a combination of country
expertise with the following criteria: i) the estimated quantitative impact of reforms in the
policy area on GDP per capita as determined in previous OECD analysis, ii) the normalised
distance of the policy stance from the benchmark (the OECD average), and iii) recent trends
in policy and performance. The limit on the number of priorities means that for some
countries, obvious policy imperatives may not be identified as priorities because other
priorities are deemed as more important.

I.1. STRUCTURAL REFORMS IN TIMES OF CRISIS
ECONOMIC POLICY REFORMS 2012: GOING FOR GROWTH © OECD 201250
The empirical research linking policy with performance includes a long series of
studies carried out by the Secretariat as well as the academic literature. OECD studies
include for instance the OECD (2003), OECD (1994) and its reappraisal (OECD, 2006).
Carrying out empirical analysis to strengthen the underpinnings of Going for Growth
recommendations is an ongoing process. Some new empirical evidence on the policy and
institutional drivers of long-term economic growth for both OECD countries and the BRIICS
is featured in Bouis et. al. (2011).
Bibliography
Bouis, R., R. Duval and F. Murtin (2011), “The Policy and Institutional Drivers of Economic Growth: NewEvidence from Growth Regressions”, OECD Economics Department Working Papers, No. 843.
OECD (1994), OECD Jobs Study; Facts, Analysis, Strategies, OECD Publishing.
OECD (2003), The Sources of Economic Growth in OECD Countries, OECD Publishing.
OECD (2006), OECD Employment Outlook 2006: Boosting Jobs and Incomes, OECD Publishing.
Figure 1.A1.1. Example of selection of candidatesfor Going for Growth priorities
1 2 http://dx.doi.org/10.1787/888932372982
-3.0
-2.0
-1.0
0
1.0
2.0
3.0
-3.0 -2.0 -1.0 0 1.0 2.0 3.0
Performance gap
Policy gap
OECD average
OECD average