structural health monitoring fiber optic method for...
TRANSCRIPT

Article
Structural Health Monitoring
0(0) 1–16
� The Author(s) 2012
Reprints and permissions:
sagepub.co.uk/journalsPermissions.nav
DOI: 10.1177/1475921712455683
shm.sagepub.com
Fiber optic method for healthassessment of pipelines subjected toearthquake-induced ground movement
Branko Glisic and Yao Yao
AbstractNatural disasters, in particular earthquakes, can cause damage to pipelines with disastrous humanitarian, social, eco-nomic, and ecologic consequences. Thus, real-time, automatic, or on-demand assessment of damage to pipelines afterthe earthquake is essential for early emergency response, efficient preparation of rescue plans, and mitigation of thesedisastrous consequences. This article presents the development of a method for buried pipelines health assessmentbased on distributed fiber optic sensors, which are sensitive to strain at every point along their lengths. The sensors areboth bonded to pipeline and embedded in the soil, in the proximity of the pipeline. The research includes determinationof sensor topology, identification of required sensor properties, selection of sensors, development of installation proce-dures, implementation, and validation. The validation of the method was made through a large-scale testing: a 13-m-longreal-size concrete segmented pipeline was assembled in a large test basin filled with soil and was tested under simulatedpermanent ground displacement. The basin consisted of two parts: the movable north part and the fixed south part. Themovable north part of the test basin was attached to four hydraulic actuators, which were used to apply controlled dis-placement of the basin, and it induced damage to the pipeline by crushing the joints between adjacent pipeline segments.As a part of validation, the results obtained from distributed sensors were compared with resistive strain gauges. Twovalidation tests were performed: the first in 2010 and the second in 2011. The method is presented in detail, and themost significant results of both tests are analyzed, compared, and discussed. The validation tests confirmed the capacityof the method to reliably detect and localize the damage on pipeline and the displacement in the soil.
KeywordsDamage detection and localization, distributed fiber optic sensors, structural health monitoring of pipelines, earthquake-induced permanent ground displacement, large-scale validation testing
Introduction
Real-time, automatic, or on-demand assessment ofdamage to pipelines after the earthquake is essential forearly emergency response, efficient preparation of res-cue plans, and mitigation of the disastrous conse-quences. Assessment is particularly challenging forburied pipelines since they are under the soil.Earthquake-induced damage for pipelines is in generalclassified as being generated by transient ground defor-mation (TGD) or permanent ground deformation(PGD).1 Historical records are concordant with awidely accepted opinion that the most serious cases ofearthquake-induced damage to pipelines were gener-ated by strong ground motion or site failure,2 and thatis why this research focus on the damage generated byPGD. The distribution of PGD depends on several
factors, such as intensity and duration of earthquakes,site grade, soil type, type of pipeline, and the locationof the water table.3
Existing technologies employed for inspection ofburied pipelines are mainly based on the use of devicesthat can be inserted in the interior of the pipeline. Thesedevices may contain various types of sensors, typicallydepending on the type of the pipeline. The most com-mon device used for inspection of metallic pipelines is
Department of Civil and Environmental Engineering, Princeton University,
Princeton, NJ 08544, USA
Corresponding author:
Branko Glisic, Department of Civil and Environmental Engineering,
Princeton University, E330 EQuad, Princeton, NJ 08544, USA.
Email: [email protected]
shm.sagepub.comDownloaded from

the so-called pig.4 It is a small package containingmostly two types of sensing transducers: remote fieldeddy current and ultrasonic transducers.5 For concretepipelines, cameras are either placed on a robot andmoved through the pipeline using the robotic system6
or simply installed at a manhole access point. Besidesthe use of a camera, ultrasonic systems can also beused when the internal area of a pipeline is accessible.7
The acoustic and ultrasonic transducers can also beinstalled on the surface of the pipeline. Piezoelectricelements can be mounted on the walls of the pipelineand they can introduce guided elastic waves, calledLamb waves, into the walls of pipeline. However,Lamb waves are of limited application for concretepipelines due to their high attenuation.8 Remote sen-sing technologies for monitoring concrete pipelinesdeployed above the surface are infrared thermographysystems (ITS) that capture thermal images of soilaltered by leaks due to the rupture of pipeline9 andground penetrating radar (GPR) that captures reflec-tions from boundaries of two different dielectrics anddetects damage as alterations. Both technologies arechallenged by reliable image interpretation. Althoughseveral existing technologies are employed for assess-ment of pipeline health condition, none of them isentirely suitable for the real-time automated opera-tion. In general, they require manual operation anddata analysis, which adds subjectivity to the process.Recent researches propose novel approaches to theassessment of the pipeline health condition. They arebased on the self-detection capacity of cementitiousmaterials, that is, on the damage-induced changes intheir electrical properties10 and acoustic properties11
combined with the use of wireless technologies.12
These researches are ongoing and have a very promis-ing potential for applications on buried structures.13
Strain monitoring based on discrete14 and distribu-ted15 fiber optic sensing was introduced in the recentyears. The discrete sensors feature better measurementproperties (higher resolution, accuracy, and frequencyof reading), but they must be sparsely spaced and eitherprovide severely insufficient spatial resolution for earlydamage detection or rely on complex algorithms thatdegrade specificity against environmental and variableload conditions. Thus, they are rather suitable for alocal monitoring of critical pipeline sections than forthe global pipeline integrity monitoring. The distribu-ted sensors can overcome the spatial resolution andspecificity challenges related to discrete sensors-basedmonitoring.
A novel method for real-time, automatic, or on-demand assessment of health condition of buried pipe-lines after the earthquake is developed. The method isbased on the use of distributed fiber optic sensing tech-nology and it focused on concrete segmented pipelines,
but it can be extended to steel continuous pipelines.Besides the assessment of damage, the method can beused for long-term structural health monitoring andoperational monitoring, which will serve as an impor-tant input for lifetime maintenance activities. The cen-tral part of the project, validation testing, wasperformed at Network for Earthquake EngineeringSimulation (NEES) Lifeline Experimental and TestingFacilities at Cornell University. In a broader scope, thevalidation testing involved participation of severalother universities: University of Michigan, Ann Arbor,Michigan; Virginia Tech; Merrimack College; andPurdue University. Strain gauge measurements col-lected by University of Michigan were compared withresults obtained from fiber optic sensors (FOS) in orderto better understand their functioning. The method wasvalidated through two tests, and the results are pre-sented and discussed in this article.
Distributed sensing
The method researched and developed in this project isbased on the use of distributed fiber optic strain moni-toring system. Strain sensing is proposed, since thePGD actually strains the pipeline, and the distributedtechnology is proposed taking into consideration par-ticularly large lengths of the pipelines and the uncer-tainty of the location in which the damage can occur.
Distributed sensor (or sensing cable) can be repre-sented by a single cable, which is sensitive at every pointalong its length. Hence, one distributed sensor canreplace thousands of discrete sensors. Moreover, itrequires single connection cable to transmit the infor-mation to the reading unit, instead of a large number ofconnecting cables required in the case of wired discretesensors. Finally, distributed sensors are less difficultand more economic to install and operate. An illustra-tive comparison between pipelines equipped with dis-tributed and discrete sensors is shown in Figure 1.
There are three main principles for distributed sen-sing using FOS: Rayleigh scattering,16 Raman scatter-ing,17 and Brillouin scattering.18 Stimulated19 Brillouinscattering has been selected because it is least sensitiveto cumulated optical losses and it allows for monitoringof exceptionally large lengths.20,21 The performanceand the cost of the distributed sensors depend on thesensor packaging. The packaging that provides with avery good strain transfer from the structure to the mea-surement optical fiber, that is, with high measurementaccuracy, is expensive. In addition, this packaging ismechanically less robust, which makes them challengingto handle and install. In contrary, mechanically robustpackaging is less expensive, but as the strain transfer isless good, it provides with less accurate measurements.
2 Structural Health Monitoring 0(0)
shm.sagepub.comDownloaded from

Three types of sensors were selected for tests and theyare briefly presented here.
‘‘Tape’’ sensor (see Figure 2) contains one measure-ment optical fiber embedded in a thermoplastic compo-site tape.21 It features high strain transfer and highaccuracy (error limits estimated to approximately 620me, depending on the quality of installation), but itscost is elevated, and it needs cautions when handlingand installing, as it features low mechanical robustness.‘‘Profile’’ sensor (see also Figure 2) contains two mea-surement and two loose optical fibers embedded in apolyethylene profile.21 It features moderate strain trans-fer (i.e. moderate accuracy, estimated error limitsapproximately ranged between 620 and 650 me,depending on the quality of installation), moderate
cost, and it is easy to handle and install as it is mechani-cally robust.
‘‘Cord’’ sensor (see Figure 3) contains two measure-ment fibers and two loose fibers. Measurement fibersare ‘‘squeezed’’ between the inner and the outer plastictube, and the strain transfer is performed by friction;this provides with a weak strain transfer and a very lowaccuracy (error limits by absolute value are much largerthan 50 me), as the fibers can slide between the tubes.However, low cost, extended range of measurements,and very high mechanical robustness make this sensorvery attractive for applications in pipeline monitoring.
Sensor topology
The capability of distributed FOS to reliably detect andlocalize damage depends on their topology, and morespecifically, on their total number and position on thepipeline and in the soil. Topology of sensors dependson the expected pipeline failure mode, which dependson the pipeline type.
A segmented gravity pipeline was available for themethod validation test, and the focus in sensor topol-ogy determination was on this type of pipeline. Basedon the experience in previous tests, the failure ofsegmented pipeline occurs mainly by crushing of bell-and-spigot joints.13 An example of failure caused bycrushing of bell-and-spigot joint is shown in Figure 4.
Parallel topology22 is selected as the best feasibleconfiguration for both sensors installed on the pipelineand sensors embedded in the soil. For the installationon the pipeline, the parallel topology consists of at leastthree parallel sensors installed (glued) along the pipe-line as shown in Figure 1. Minimum three sensors are
Figure 1. Distributed versus discrete monitoring (schematic drawing, does not refer to real case).
Figure 2. Views of Tape sensor (left) and Profile sensor (right).PE: polyethylene.
Glisic and Yao 3
shm.sagepub.comDownloaded from

needed to fully describe spatial deformation of thepipeline,22 that is, axial deformation (elongation orcontraction) and bending in horizontal and verticalplanes, and to provide for sufficient spatial sensitivityto damage. Information on spatial deformation of thepipeline serves as an early warning about potentially
high stresses in the pipeline. High spatial sensitivity todamage is needed, as the location and direction of thepermanent ground displacement (PGD) are not knownbefore the earthquake.
For the sensors installed in the soil, the paralleltopology consists of at least one sensor installed paral-lel to the pipeline. The sensor in the soil cannot providewith spatial deformation or damage of the pipeline, butit can detect and localize the movements in the soil thatcan potentially imperil the pipeline, and it can point toendangered locations. Although this approach is notdirect, it can be very efficient if proven to be reliable,since the embedding in the soil is significantly simplerand faster than bonding sensors onto the pipeline.
The parallel topology was tested and its suitabilityfor segmented pipeline monitoring was confirmed bythe test. Positions of the sensors as tested in the twotests are given in Figures 5 and 6, respectively (see alsoFigure 14). Long Cord sensing cable (more than threetimes longer than the tested pipeline specimen) used inthe first test was installed in the form of a serpentinecovering three locations: T3, L1, and L3 (see Figure 5).Similarly, a long Profile sensing cable (more than fourtimes longer than the tested pipeline specimen) wasinstalled in the form of a serpentine covering four loca-tions: T2, T1, L1, and L2 (see Figure 5). All the othersensors in the first test (Cord sensor at location T1 andall Tape sensors, see Figure 5) as well as all the sensorsin the second test (see Figure 6) had approximately thesame length as the tested specimens and were installedas ‘‘individual lines’’ (i.e. not in the form of serpen-tines). The serpentine form of Cord and Profile sensorsinfluenced results of the first test as discussed in section‘‘Data analysis.’’
Installation procedure
In order to guarantee the strain transfer from the pipe-line to the sensors, it was decided to glue the sensorsover the entire length of the pipeline. Clamping the
Figure 4. Crushing of bell-and-spigot joint for a segmentedpipeline.
Figure 5. Physical layout of sensors in the first test; Cord andProfile sensors were in the form of serpentine.
Figure 3. View of Cord sensor (sensing cable).
Figure 6. Physical layout of sensors in the second test; allsensors installed as ‘‘individual lines.’’
4 Structural Health Monitoring 0(0)
shm.sagepub.comDownloaded from

sensor would be time-consuming and expensive as thefull circumference of the pipeline has to be accessibleat large number of closely spaced points. The adhesivewas carefully selected for each type of sensor in orderto match with materials to be bonded. In particular,adhesive should provide not only good adhesion ofTape sensors to the pipeline but also delamination ofsensors in the case of cracking of the pipeline in orderto prevent damaging of the sensor.23,24 Finally, sincethe sensors were bonded over their entire lengths, theywere capable of monitoring both elongation and con-traction, and there was no need to pre-tension thesensors.
The sensors installed on the pipeline are shown inFigure 7. The gluing of the sensors to the pipeline isshown in Figure 8. After the installation, the sensorswere covered by duct tape, which provided with protec-tion during the burying of the pipeline. Identical adhe-sives were used in the second test. The inspection of thesensors after the test has shown good adhesion of sen-sors over the body of the pipeline (no delamination)
and, as expected, a delamination of the Tape sensor incracked zones of the joints, which prevented the dama-ging of the sensor. The sensors installed in the soil weresimply placed at its position and covered with soil, asshown in Figure 9.
Particular issue for the sensor installation is unevensurface of the segmented pipeline. Two issues arerelated to abrupt changes in the geometry of the pipe-line at joints:
1. Sharp changes in geometry can create excessivelocal bending of the sensor that may result either inrupture of the sensor during the burying or in highattenuation of optical signal; high attenuation ofoptical signal will make the measurement impossi-ble or unreliable;
2. If small pieces of the sensor are left loose, theymight be excessively strained due to compaction ofthe soil and the measurement of the sensor will beunreliable at these locations; this was confirmedduring the second validation test.
In order to protect sensors during the burying andto provide for continuous strain transfer, it was decidedfor the first test to add small ‘‘bridges’’ made of plastic(polyvinyl chloride (PVC)) at the location of the joints,where the geometry of the pipeline changes abruptly,see Figure 10(a). The first method validation test hasshown that this solution was not good: during the
Figure 7. Sensors installed on the pipeline (first test).
Figure 8. Gluing of sensors, detail at joint (second test).
Figure 9. Profile and Cord sensors laid and ready for burying(first test).
Glisic and Yao 5
shm.sagepub.comDownloaded from

crush of the joint, the bell was pushing the ‘‘bridges’’that resulted in sensor damage, see Figure 10(b). Thus,the installation of sensor over the joints had to beimproved. Two solutions for installation over the jointswere considered for the second test:
1. As the pipeline segments for the second test weremade by research partners from Purdue University,it was possible to modify the bells of the joint, thatis, to create openings (2.5 3 2 cm2) in order to passthe sensors through without the bending; once thesensors were in place, they were bonded inside theopening and the holes were filled with the adhesive;this solution was applied for sensors at locations‘‘R’’ and ‘‘L’’ (see Figures 5 and 6) and it is shownin Figure 11(a);
2. The sensors were left unattached over the gap; dur-ing embedding, the space between the sensor andthe pipeline body was carefully filled with the soil
in order to give support to the sensor and then thepipeline was completely buried; this solutions isshown in Figure 11(b).
The validation tests fully proved the first solution,while the second solution was not satisfactory. Tapesensor installed in accordance with the second solution,being more fragile, was damaged by soil movements,and Cord sensor provided with ambiguous results.Consequently, only the first procedure is fully recom-mended, since the validation test confirmed its verygood performance.
Method validation testing
The central part of the project, method validation test-ing, was performed at The Cornell Large-Scale LifelinesTesting Facility, the NEES site at Cornell University(Cornell NEES Site). The aim of the testing was to
Figure 10. (a) Sensor installed over the joint using specially designed ‘‘bridge’’ and (b) damage to sensors generated by bell pushingthe ‘‘bridge’’.
Figure 11. (a) First solution: opening in the bell, Profile sensor (up), and Tape sensor (down) and (b) second solution: free sensorsover the gap, Tape sensor (closer), and Cord sensor (farther).
6 Structural Health Monitoring 0(0)
shm.sagepub.comDownloaded from
validate the researched method for reliable, real-time,automatic, or on-demand assessment of pipelines sub-ject to earthquake-induced PGD. Besides this primaryaim, the testing helped evaluate the performance of thedeployed distributed sensors in close-to-real conditions.The testing was performed in two phases, the first per-formed in June 2010 and the second performed in June2011.
Description of the test basin
The Cornell NEES Site contains a large test basin inwhich a pipeline can be assembled and tested undersimulated PGD. The basin is a 3.40-m-wide, 13.40-m-long, and 2.0-m-deep steel frame box with woodenwalls. It consists of two parts: the movable north partand the fixed south part.
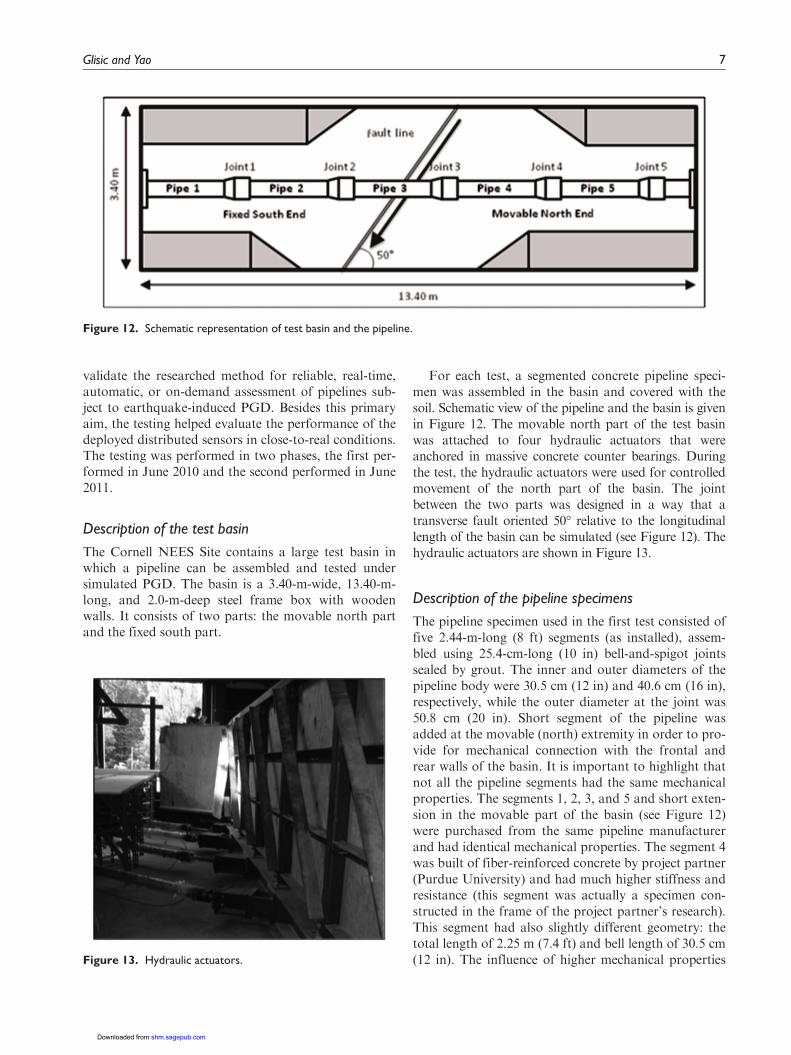
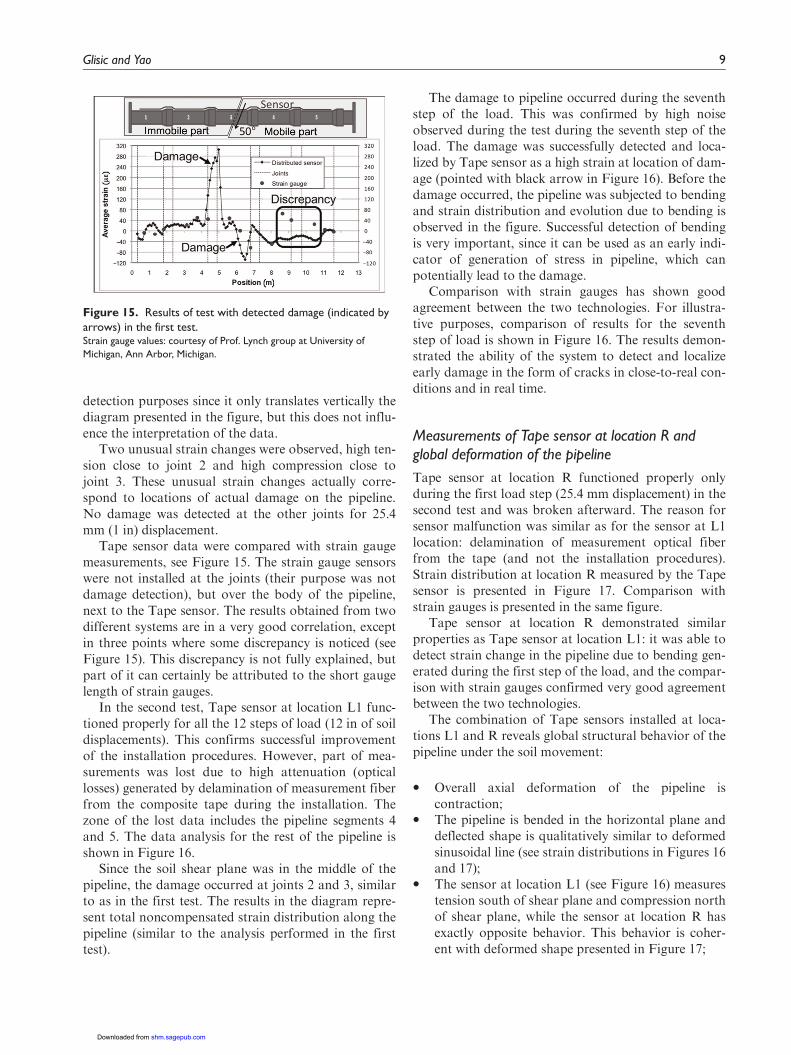
For each test, a segmented concrete pipeline speci-men was assembled in the basin and covered with thesoil. Schematic view of the pipeline and the basin is givenin Figure 12. The movable north part of the test basinwas attached to four hydraulic actuators that wereanchored in massive concrete counter bearings. Duringthe test, the hydraulic actuators were used for controlledmovement of the north part of the basin. The jointbetween the two parts was designed in a way that atransverse fault oriented 50� relative to the longitudinallength of the basin can be simulated (see Figure 12). Thehydraulic actuators are shown in Figure 13.
Description of the pipeline specimens
The pipeline specimen used in the first test consisted offive 2.44-m-long (8 ft) segments (as installed), assem-bled using 25.4-cm-long (10 in) bell-and-spigot jointssealed by grout. The inner and outer diameters of thepipeline body were 30.5 cm (12 in) and 40.6 cm (16 in),respectively, while the outer diameter at the joint was50.8 cm (20 in). Short segment of the pipeline wasadded at the movable (north) extremity in order to pro-vide for mechanical connection with the frontal andrear walls of the basin. It is important to highlight thatnot all the pipeline segments had the same mechanicalproperties. The segments 1, 2, 3, and 5 and short exten-sion in the movable part of the basin (see Figure 12)were purchased from the same pipeline manufacturerand had identical mechanical properties. The segment 4was built of fiber-reinforced concrete by project partner(Purdue University) and had much higher stiffness andresistance (this segment was actually a specimen con-structed in the frame of the project partner’s research).This segment had also slightly different geometry: thetotal length of 2.25 m (7.4 ft) and bell length of 30.5 cm(12 in). The influence of higher mechanical properties
Figure 12. Schematic representation of test basin and the pipeline.
Figure 13. Hydraulic actuators.
Glisic and Yao 7
shm.sagepub.comDownloaded from

of this segment to the results of the test was importantas presented in section ‘‘Data analysis.’’
The pipeline specimen used in the second test con-sisted of five 2.36-m-long (7 ft 9 in) segments (asinstalled), assembled using 30.5-cm-long (12 in) bell-and-spigot joints sealed by grout. The other dimensions(the inner and outer diameters of the pipeline body andthe outer diameter at the joints) were the same as in thefirst test. Short segment of the pipeline was added atthe movable (north) extremity in order to provide formechanical connection with the frontal and rear wallsof the basin, as in the case of the first test. In the secondtest, all the pipeline segments had the same mechanicalproperties. They were built of fiber-reinforced concreteby the project partner (Purdue University). The uni-form mechanical properties along the pipeline made theresults of the second test different from those obtainedin the first test, as presented in section ‘‘Data analysis.’’
For both tests, the sensors were installed in paralleltopology. The positions of the sensors with respect tothe cross-section are for both tests given in Figure 14(see also Figures 5 and 6).
Data analysis
The data analysis was performed in several steps:
1. Primary data analysis consisted of filtering out theoutliers and the noise, interpretation and correla-tion with load cases and visual inspection of thepipeline after each test (for crack occurrence).Primary data analysis helped identify data patternscharacteristic for each performed test and whether
the monitoring system was able to detect and loca-lize the damage.
2. The results obtained from the first step are com-pared with traditional strain gauges installed alongthe body of the pipeline specimens (installed andoperated by project partner University ofMichigan, Ann Arbor, MI); the comparison helpedto assess the performance of developed monitoringmethod.
3. In order to make damage detection and localizationautomatic, simple, but effective, algorithms basedon thresholds ‘‘in space’’ (comparison of strain val-ues along the pipeline) and ‘‘in time’’ (comparisonof strain value at each point in time) were appliedand their performance verified.
Large amount of data was collected during the tests.The most significant results are presented in this article.
Analysis of tape sensor at location L1
In the first test, the tape sensor at location L1 func-tioned properly during the first step of the test whenrelative ground displacement of 2.54 mm (1 in) wasapplied and damaged the pipeline at the joints 2 and 3(the joint 2 belongs to pipe segment 2, i.e. it is betweenpipe segments 2 and 3, etc.). Unfortunately, during thesecond step, the sensor was broken as a consequence ofinappropriate installation procedure (the use of‘‘bridges,’’ see Figure 10). The results are presented inFigure 15.
The results in the figure represent total noncompen-sated strain distribution along the pipeline. The tem-perature compensation was not necessary for damage
Figure 14. Positions of sensors in (a) the first test and in (b) the second test.
8 Structural Health Monitoring 0(0)
shm.sagepub.comDownloaded from
detection purposes since it only translates vertically thediagram presented in the figure, but this does not influ-ence the interpretation of the data.
Two unusual strain changes were observed, high ten-sion close to joint 2 and high compression close tojoint 3. These unusual strain changes actually corre-spond to locations of actual damage on the pipeline.No damage was detected at the other joints for 25.4mm (1 in) displacement.
Tape sensor data were compared with strain gaugemeasurements, see Figure 15. The strain gauge sensorswere not installed at the joints (their purpose was notdamage detection), but over the body of the pipeline,next to the Tape sensor. The results obtained from twodifferent systems are in a very good correlation, exceptin three points where some discrepancy is noticed (seeFigure 15). This discrepancy is not fully explained, butpart of it can certainly be attributed to the short gaugelength of strain gauges.
In the second test, Tape sensor at location L1 func-tioned properly for all the 12 steps of load (12 in of soildisplacements). This confirms successful improvementof the installation procedures. However, part of mea-surements was lost due to high attenuation (opticallosses) generated by delamination of measurement fiberfrom the composite tape during the installation. Thezone of the lost data includes the pipeline segments 4and 5. The data analysis for the rest of the pipeline isshown in Figure 16.
Since the soil shear plane was in the middle of thepipeline, the damage occurred at joints 2 and 3, similarto as in the first test. The results in the diagram repre-sent total noncompensated strain distribution along thepipeline (similar to the analysis performed in the firsttest).
The damage to pipeline occurred during the seventhstep of the load. This was confirmed by high noiseobserved during the test during the seventh step of theload. The damage was successfully detected and loca-lized by Tape sensor as a high strain at location of dam-age (pointed with black arrow in Figure 16). Before thedamage occurred, the pipeline was subjected to bendingand strain distribution and evolution due to bending isobserved in the figure. Successful detection of bendingis very important, since it can be used as an early indi-cator of generation of stress in pipeline, which canpotentially lead to the damage.
Comparison with strain gauges has shown goodagreement between the two technologies. For illustra-tive purposes, comparison of results for the seventhstep of load is shown in Figure 16. The results demon-strated the ability of the system to detect and localizeearly damage in the form of cracks in close-to-real con-ditions and in real time.
Measurements of Tape sensor at location R andglobal deformation of the pipeline
Tape sensor at location R functioned properly onlyduring the first load step (25.4 mm displacement) in thesecond test and was broken afterward. The reason forsensor malfunction was similar as for the sensor at L1location: delamination of measurement optical fiberfrom the tape (and not the installation procedures).Strain distribution at location R measured by the Tapesensor is presented in Figure 17. Comparison withstrain gauges is presented in the same figure.
Tape sensor at location R demonstrated similarproperties as Tape sensor at location L1: it was able todetect strain change in the pipeline due to bending gen-erated during the first step of the load, and the compar-ison with strain gauges confirmed very good agreementbetween the two technologies.
The combination of Tape sensors installed at loca-tions L1 and R reveals global structural behavior of thepipeline under the soil movement:
� Overall axial deformation of the pipeline iscontraction;
� The pipeline is bended in the horizontal plane anddeflected shape is qualitatively similar to deformedsinusoidal line (see strain distributions in Figures 16and 17);
� The sensor at location L1 (see Figure 16) measurestension south of shear plane and compression northof shear plane, while the sensor at location R hasexactly opposite behavior. This behavior is coher-ent with deformed shape presented in Figure 17;
Figure 15. Results of test with detected damage (indicated byarrows) in the first test.Strain gauge values: courtesy of Prof. Lynch group at University of
Michigan, Ann Arbor, Michigan.
Glisic and Yao 9
shm.sagepub.comDownloaded from

� The distribution of horizontal curvature presentedin Figure 17 is calculated from strain measurementsas a ratio between the difference in strain (strain atL1 minus strain at R) and pipeline diameter; thepipeline body bends so that it has inflection point
(curvature equal to zero) approximately at the shearplane; the curvature is approximately equal to zeroat the immobile extremity and approximately line-arly changes between the extremity and the joint 2;this indicates that strong concentrated force is
Figure 16. Results of test with detected damage (indicated by arrow) in the second test.Strain gauge values: courtesy of Prof. Lynch group at University of Michigan, Ann Arbor, Michigan.
Figure 17. (a) Measurement result of Tape sensor at location R and (b) horizontal curvature calculated from measurements ofTape sensors at locations L1 and R and their correlation with the deformed shape of the pipeline.Strain gauge values: courtesy of Prof. Lynch group at University of Michigan, Ann Arbor, Michigan.
10 Structural Health Monitoring 0(0)
shm.sagepub.comDownloaded from

generated at joint 2 due to soil movement; quasi-linear curvature distribution between the joints 2and 3 leads to similar conclusion at the joint 3.
The ability of the Tape sensors and the paralleltopology to assess the deformation of the pipeline wasconfirmed by the strain gauges and visual inspection ofthe deformed shape after the excavation of the pipeline.This validates the use of parallel topology for monitor-ing of deformed shape of the pipeline.
Analysis of Cord sensor installed at location L1
Cord sensing cable functioned properly for all 12 incre-ments of the simulated ground displacement in bothtests. Cord sensing cable, installed in the form of ser-pentine (see Figure 5) for the first test, had one partinstalled on the pipeline at location L1, and the resultsobtained from this location are presented in Figure 18.The part installed in the soil is presented in section‘‘Analysis of Cord sensor installed in soil at locationL3.’’ As in the case of the Tape sensor measurement,the results were not compensated for temperature.
In order to interpret the measurement of the Cordsensor, it is necessary to understand that the strainmeasured by optical fiber is not equal to the strain onthe structure because the measurement fibers can slideinside the body of the sensor. The sliding of the fibersactually makes interpretation of the data difficult. Thefact that one part of the physical sensor was installedon the pipeline and the other part in the soil (the sensorhad a shape of serpentine) additionally complicate dataanalysis since the fibers could slide from one part to theother. Comparison of Cord sensor with strain gaugeresults was not performed, since the former is less accu-rate than latter, due to sliding of fibers.
For the applied displacement in range 25.4–203.2mm (1–8 in), the strain change due to the damage injoints 2 and 3 is visible, but difficult to distinguish fromthe other strain variations (e.g. due to sliding of thefibers within the tube).
For higher levels of displacement, the damage detec-tion can be performed more reliably, as high strain indiagram (marked by black arrows). However, sliding ofthe fibers makes impossible to qualitatively evaluatewhether damage increased or not (e.g. strain in fibersfor 11 in displacement is smaller than the strain for 10in displacement), and in some cases can completely‘‘mask’’ the damage (e.g. damage of joint 3 is not identi-fiable for 12 in displacement, while it was clearly notedfor smaller displacements).
Two zones of concentrated high strain are noted atextremities of the pipeline, as shown by gray arrows inFigure 18. There was no visible damage at these loca-tions and the measurement can be explained by both
the influence of real strain change in the pipeline andthe sliding of the fibers including the sliding transferredfrom the parts of sensors embedded in the soil (seeFigure 5).
The conclusion carried out from the test is that theCord sensor can be used to detect and localize the dam-age; however, only higher levels of the damage can bereliably detected and localized by analyzing time seriesof the measurement.
Analysis of Cord sensor installed in soil at location L3
The Cord sensor embedded in the soil at location L3(see Figures 5 and 6) successfully detected ground dis-placement and location of the shear plane, as shown inFigure 19.
Similar to the previous discussion, sliding of thefibers inside the sensor body occurred. In addition, slid-ing of the sensor with respect to the soil was also possi-ble. Due to both sliding of the fibers and sliding of theentire sensor with respect to the soil, reliable detectionand localization of the damage was possible only forhigher values of ground displacement and by analyzingthe time series of the measurements.
Analysis of Profile sensor installed in soil atlocation L2
The Profile sensor installed in soil at location L2 func-tioned properly for all 12 increments of the ground dis-placement in the second test. The measurement resultsare shown in Figure 20. Profile sensor successfullydetected and localized soil displacement as indicatedwith black arrow in Figure 20. Noise in measurementwas observed due to sliding of the sensor within thesoil. Stressing of the sensor was detected at the
Figure 18. Cord sensor measurement at location L1 (on thepipeline) with detected damage (indicated by arrows in black) inthe first test.
Glisic and Yao 11
shm.sagepub.comDownloaded from

extremity of the pipeline due to sharp change in sensorgeometry (gray arrow in the figure), for similar reasonsas explained for Cord sensor in the first test. While thesoil movement can be detected and localized using sin-gle measurement of Profile sensor, it is still recom-mended to confirm the detection and localization byanalyzing time series of measurements.
Statistical data analysis
The data analysis performed in previous subsectionwas made manually by an experienced engineer. Whilethe engineer’s involvement in data analysis should notbe removed, it is important to create algorithms forautomatic damage detection and localization. The sig-nal produced by damage is at least order of magnitudehigher than usual noise (see diagrams in previously pre-sented figures), which makes possible damage detection
and localization using relatively simple threshold algo-rithms. They can be applied both ‘‘in space’’ (i.e. overthe sensed area) and ‘‘in time’’ (i.e. against previoussamples). The criteria are summarized as follows:
1. ‘‘Unusually high strain variation’’ at time t isdetected in at least m neighboring sensing points,where ‘‘unusually high strain variation’’ is definedeither by
(a) A deterministic threshold (change in valueexceed d microstrain, see example of results inFigure 21 for m ˜ 5 and d = 150 me) and/or
(b) A simple statistical threshold(i) In time: s multiples of the standard deviation
s observed over a window of recent mea-surements (see example of results for s = 1,2, 3 in Figure 22),
(ii) In space: s multiples of the standard devia-tion s observed over a local region of sen-sors (see example of results for s = 1, 2, 3 inFigure 22), and/or
(c) Modified ‘‘Z-score’’ method, which derives sta-tistical thresholds based on the root-squareddeviation from the median (i.e. rather than themean):MAD =median xi � ~xj jf g, where ~x is the sample
median; Mi = 0:6745 xi�~xð ÞMAD
; and literature25 sug-
gests detection when jMij. 3:5.This has shown superior performance in some
cases due to its robustness against outliers (seeexample of results in Figure 23).
2. The strain from at least k neighboring sensingpoints reaches value p, which is associated with
Figure 19. Cord sensor measurement at location L3 (in the soil) with detected damage (indicated by arrows in black): (a) first testresults and (b) second test results.
Figure 20. Profile sensor measurement at location L2 (in thesoil) with detected damage.
12 Structural Health Monitoring 0(0)
shm.sagepub.comDownloaded from

the ultimate strain limit of the monitored material(see example for k = 3 and p = 400 me in Figure24). This detects slow strain changes that areundetectable by criteria such as those presentedin point 1 above. Such degradations are nonethe-less important as they can gradually reach criticallevels.
In real application, the algorithm parameters (m, d,s, Mi, k, and p) should be determined based on mea-surements performed over nondamaged pipeline duringrepresentative (learning) period. Minimal recommendedlearning period is 1 year in order to identify patternsrelated to seasonal changes. In the following years, theparameters can be fine-tuned based on measurementresults.
Figure 21. Application of deterministic threshold for change invalue that exceeds 150 me, in at least five points; two detectionsshown between measurements for 203 mm (8 in) and 228.6 mm(9 in) displacement, in gray, and between measurements for279.4 mm (11 in) and 304.8 mm (12 in) displacement, in black(first test, Cord sensor at location L3).
Figure 22. (a) Application of statistical threshold ‘‘in time’’; damage is detected for s = 1, 2, and 3 (see circles); as a comparison,variation of data at nondamaged point does not exceed standard deviation s (first test, Tape sensor at location L1). (b) Applicationof statistical threshold ‘‘in space’’; damage is detected for s = 1, 2, or 3 (see horizontal lines) only at location of damage; variation ofdata at nondamaged point does exceed standard deviation s (first test, Tape sensor at location L1).
Figure 23. Application of Z-score method in (a) time and (b) space to the results shown in Figure 22(a) and (b); the damage isdetected at joint 2 but not confirmed in joint 3, indicating that parameter Mi should be fine-tuned.
Glisic and Yao 13
shm.sagepub.comDownloaded from

The examples of application of algorithms on themeasurement results obtained during the tests are givenin Figures 21 to 24. In both tests, the pipeline was mon-itored continuously for few days before the test, andthis period is used as the learning period. Successfuldamage detection and localization based on algorithmsconfirm the potential of the method to be fully auto-mated in real applications.
The soil used in both tests had the same properties,thus the sensitivity of algorithms to the soil propertiescould not be tested. Consequently, to minimize uncer-tainties, a combination of algorithms is recommendedin real-case applications as it can increase the sensitivityto damage and reliability in damage detection.
Conclusions
The research and development of a novel method forreal-time, automatic, or on-demand assessment ofhealth condition of buried pipelines after the earth-quake has been successfully accomplished. It includeddetermination of sensor topology, selection and devel-opment of sensors, development of installation proce-dures, implementation, and large-scale testing. Themethod is based on stimulated Brillouin light scatteringin optical fibers and deals with distributed sensors. Thefollowing conclusions are carried out from the project:
1. The parallel topology, researched during the proj-ect and deployed on the pipeline under the test, issuitable for detection and localization of damageinduced by the ground displacement to the concretesegmented pipelines. In addition, the parallel topol-ogy applied to sensors embedded in the soil is suit-able for detection of ground displacement.Minimum three noncoplanar sensors should be
used for pipeline monitoring and minimum one sen-sor in the soil, spaced 20–40 cm from the pipeline.
2. Tape and Cord sensors are verified as appropriatefor pipeline monitoring, while Profile and Cordsensors are verified for soil monitoring. The sensorsinstalled on the pipeline should be bonded usingappropriate adhesives. Peeling demonstrated thatthe adhesives alternately remained on both pipelineand the sensors, showing no preference of material.To guarantee safe installation of the sensor, thejoints of the pipeline should be modified with open-ings that will accommodate passage of the sensors.The sensors installed in the soil can simply be laidand buried.
3. Two method validation tests were performed tovalidate the method. Several sensors and severalinstallation procedures were tested. Those that haveshown satisfactory performance were adopted andpresented in points 1 and 2. Others did not fulfillthe requirements, either partially or fully.
4. The data analysis was completed for both valida-tion tests. Manual data analysis was used toachieve the aims of points 1 and 2. Data were com-pared and validated using results of strain gauges.Algorithms were developed for automation of themethod and successfully tested on the results. Inthe real application, it is recommended to combinealgorithms and tune parameters of algorithmsbased on measurements of nondamaged pipelineover the ‘‘learning’’ period.
The general principles of the method were validatedthrough the method validation testing. The validationtests confirmed the capacity of the method to reliablydetect and localize the damage on concrete segmentedpipelines and the displacements in the soil. The verifica-tion of algorithms confirmed potential for automation.The method deals with parallel topology of distributedsensors that can also be applied to the continuous steelpipelines. The adhesives used in this project can be usedfor bonding the sensors to steel, based on the authors’experience and adhesive datasheets. As the joint of steelpipelines are mostly welded, their geometry does nothave particular irregularities. Thus, the method devel-oped in this project has potential to be applied to thesteel pipelines too.
Funding
This study is based upon the work supported by the NationalScience Foundation under Grant No. 0936493 and realized inthe frame of George E. Brown Jr Network for EarthquakeEngineering Simulation Research (NEESR) ProgramSolicitation NSF 09-524.
Figure 24. Absolute strain threshold damage detection for k =3 and p = 400 me (second test, Tape sensor at location L1).
14 Structural Health Monitoring 0(0)
shm.sagepub.comDownloaded from
Acknowledgements
The method validation testing was performed at The CornellLarge-Scale Lifelines Testing Facility, the NEES site atCornell University (Cornell NEES Site). The authors wouldlike to acknowledge the personnel of the NEES Site and inparticular Mr Tim Bond, manager of operations of the HarryE. Bovay Jr Civil Infrastructure Laboratory Complex atCornell University, and Mr Joe Chipalowski, the manager ofCornell’s NEES Equipment Site. This research has beenawarded as a payload of NEESR Award CMMI-0724022.The latter hosted this research, and the author would like tothank all the collaborators from the NEESR Award for theirprecious help and in particular Radoslaw L. Michalowskiand Jerome P. Lynch from University of Michigan, AnnArbor, MI; Russell A. Green from Virginia Tech,Blacksburg, VA; Aaron S. Bradshaw from MerrimackCollege, North Andover, MA; W. Jason Weiss from PurdueUniversity, West Lafayette, IN; and their students whose help
and shared experience significantly contributed to the success-ful realization of the test. The sensors, the reading unit, andthe associated software were provided by SMARTEC SA,Switzerland at significantly reduced costs. Graduate studentsDorotea Sigurdardottir from Princeton University and KaiOberste-Ufer from Ruhr-University Bochum, Germany wereinvolved in and contributed significantly to the success of thevalidation tests.
Conflict of interest
Any opinions, findings, and conclusions or recommendationsexpressed in this material are those of the authors and do notnecessarily reflect the views of the National Science Foundation.
References
1. Torpak S and Taskin F. Estimation of earthquake dam-
age to buried pipelines caused by ground shaking. Nat
hazards 2007; 40(1): 1–24.2. Pei Z, Liu Y and Wang X. Earthquake damage assessment
models of water supply pipelines and their realization based
on GIS. In: IEEE international proceedings of geoscience
and remote sensing symposium, IGARSS ‘05, 25–29 July
2005, New York, USA, vol. 7, pp. 5208–5211.3. O’Rourke TD. An overview of geotechnical and lifeline earth-
quake engineering. In: Dakoulas P, Yegian M and Holtz RD
(eds) Geotechnical earthquake engineering and soil dynamics III
(GSP No. 75). ASCE, Reston, VA, USA, 1998, vol. 2, pp.
1392–1426.4. Liu H. Pipeline engineering. Boca Raton, FL: Lewis Pub-
lishers, 2003.5. Kobayashi M, Minato H, KondoM, et al. NKK ultrasonic
pipeline inspection pig. NKK Tech Rev 1999; 80: 46–50.6. Sinha SK and Fieguth PW. Segmentation of buried con-
crete pipe images. Automat Constr 2006; 15(1): 47–57.7. Wirahadikusumah R, Abraham DM, Iseley T, et al.
Assessment technologies for sewer system rehabilitation.
Automat Constr 1998; 7(4): 259–270.
8. Mandayam S, Jahan K and Cleary DB. Ultrasound
inspection of wastewater concrete pipelines-signal process-
ing and defect characterization. In: 27th annual review of
progress in quantitative nondestructive evaluation, 2001
(Proceedings of AIP Conference, vol. 557), Melville, NY,
USA: AIP (American Institute of Physics). pp. 1210–
1217.9. Weil GJ. Infrared thermographic pipeline leak detection
systems for pipeline rehabilitation programs. Proc SPIE
1998; 3398: 54–65.10. Lynch JP and Hou TC. Conductivity-based strain and
damage monitoring of cementitious structural compo-
nents. Proc SPIE 2005; 5765: 419–429.11. Yoon DJ, Weiss WJ and Shah SP. Assessing corrosion
damage in reinforced concrete beams using acoustic emis-
sion. J Eng Mech Div-ASCE 2000; 126(3): 273–283.12. Lynch JP, Wang Y, Loh K, et al. Performance monitor-
ing of the Geumdang Bridge using a dense network of
high-resolution wireless sensors. Smart Mater Struct
2006; 15(6): 1561–1575.13. Kim J, O’Connor S, Nadukuru S, et al. Behavior of full-
scale concrete segmented pipelines under permanent
ground displacements. Proc SPIE 2010; 7650: 76500U-1–
76500U-11.14. MOI. Case Study – Gas Pipeline. Available at: www.mi-
cronoptics.com/uploads/library/documents/ MicronOptics-
Williams Pipeline 02008.pdf (2008, accessed 22 June 2012).
15. Inaudi D and Glisic B. Development of distributed strain
and temperature sensing cables. In: 17th international
conference on optical fiber sensors, Bruges, Belgium, 23–
27 May 2005 (Proceedings of the SPIE, vol. 5855), SPIE
– The international society for optics and photonics;
Bellingham, WA, USA, pp. 222–225.16. Posey R, Johnson GA and Vohra ST. Strain sensing
based on coherent Rayleigh scattering in an optical fibre.
Electron Lett 2000; 36(20): 1688–1689.17. Kikuchi K, Naito T and Okoshi T. Measurement of
Raman scattering in single-mode optical fiber by optical
time-domain reflectometry. IEEE J Quantum Elect 1988;
24(10): 1973–1975.18. Kurashima T, Horiguchi T and Tateda M. Distributed
temperature sensing using stimulated Brillouin
scattering in optical silica fibers. Opt Lett 1990; 15(18):
1038–1040.19. Nikles M, Thevenaz L and Robert PA. Brillouin gain
spectrum characterization in single-mode optical fibers.
J Lightwave Technol 1997; 15(10): 1842–1851.20. Thevenaz L, Facchini M, Fellay A, et al. Monitoring of
large structure using distributed Brillouin fiber sensing.
In: 13th international conference on optical fiber sensors
(OFS-13), Kyongju, Korea, 12–16 April 1999 (Proceed-
ings of the SPIE, vol. 3746) SPIE – The international
society for optics and photonics; Bellingham,WA, USA.
pp. 345–348.21. Inaudi D and Glisic B. Long-range pipeline monitoring
by distributed fiber optic sensors. J Press Vess-T ASME
2010; 132(1): 011701-01–011701-09.
Glisic and Yao 15
shm.sagepub.comDownloaded from

22. Glisic B and Inaudi D. Fibre optic methods for structural
health monitoring. Chichester: John Wiley & Sons, Inc.,2007 (Europe)/2008 (USA).
23. Glisic B and Inaudi D. Development of method for in-service crack detection based on distributed fiber opticsensors. Struct Health Monit 2012; 11(2): 161–171.
24. Ravet F, Briffod F, Glisic B, et al. Submillimeter crack
detection with Brillouin-based fiber-optic sensors. IEEE
Sens J 2009; 9(11): 1391–1396.25. Iglewicz B and Hoaglin D. How to detect and handle out-
liers. Milwaukee, WI: ASQC Quality Press, 1993.
16 Structural Health Monitoring 0(0)
2shm.sagepub.comDownloaded from