structural funds social policy a member states responsbility “social” policy at eu level =...
Post on 18-Dec-2015
217 views
TRANSCRIPT

Structural Funds
Social policy a Member States responsbility
“Social” policy at EU level = (mainly) Regional Policy
Structural FundsEuropean regional policy is a policy promoting solidarity. It allocates more than a third of the budget of the European Union to the reduction of the gaps in Development among the regions and disparities among the citizens in terms of well-being.
The Union seeks to use the policy to help lagging regions to catch up, restructure declining industrial regions, diversify the economies of rural areas with declining agriculture and revitalise declining neighbourhoods in the cities.
It sets job creation as its primary concern. In a word, it seeks to strengthen the economic, social and territorial ‘cohesion’ of the Union.

Structural Funds
1957 The countries signing the Treaty of Rome refer in its preamble to the need ‘to strengthen the unity of their economies and to ensure their harmonious development by reducing the differences existing among the various regions and the backwardness of the less-favoured regions’.
1958 Setting-up of two sector-based funds: the European Social Fund (ESF) and the European Agricultural Guidance and Guarantee Fund (EAGGF).
History

Structural Funds
1975 Creation of the European Regional Development Fund (ERDF) to redistribute part of the Member States’ budget contributions to the poorest regions.
1986 The Single European Act lays the basis for a genuine cohesion policy designed to offset the burden of the single market for the southern countries and other less-favoured regions. Creation of the Cohesion Fund
1989–93 The European Council in Brussels in February 1988 overhauls the operation of the Solidarity Funds (now referred to as the Structural Funds) and allocates ECU 68 billion to them (at 1997 prices).
History

Structural Funds
1992 The Treaty of the European Union, which came into force in 1993, designates cohesion as one of the main objectives of the Union , alongside economic and monetary union and the single market. It also establishes the creation of the Cohesion Fund to support projects in the fields of the environment and transport in the least prosperous Member States.
History

Structural Funds
1994–99 Alongside the Structural Funds, a new Financial Instrument for Fisheries Guidance (FIFG) is created. The Berlin European Council (March 1999) reforms the Structural Funds and adjusts the operation of the Cohesion Fund. These funds will receive over EUR 30 billion per year between 2000 and 2006, i.e. EUR 213 billion over seven years.
The Instrument for Structural Policies for Pre-accession (ISPA) and the Special Accession Programme for Agriculture and Rural Development (Sapard) complements the Phare programme that has been in existence for seven years to promote economic and social development and environmental protection in the applicant countries in central and eastern Europe.
History

Structural Funds
2000–01 The European Council in Lisbon (March 2000) adopts a strategy focused on employment and designed to make the Union ‘the most competitive and dynamic knowledge-based economy in the world by the year 2010’. The Gothenburg Council (June 2001) completed this strategy by linking it with sustainable development.
2004 On 18 February, the European Commission presents its proposals for the reform of cohesion policy for the period 2007–13: ‘A new partnership for cohesion: convergence, competitiveness, cooperation’.
History
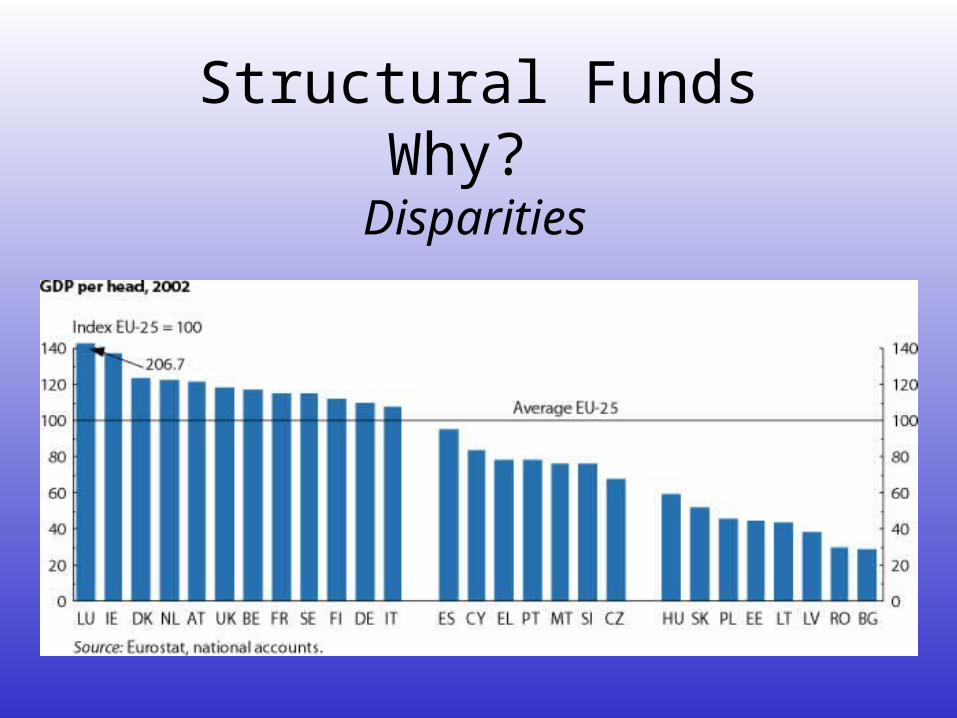
Structural FundsWhy? Disparities

Structural FundsWhy? Disparities

Structural FundsHow? 2000-2006
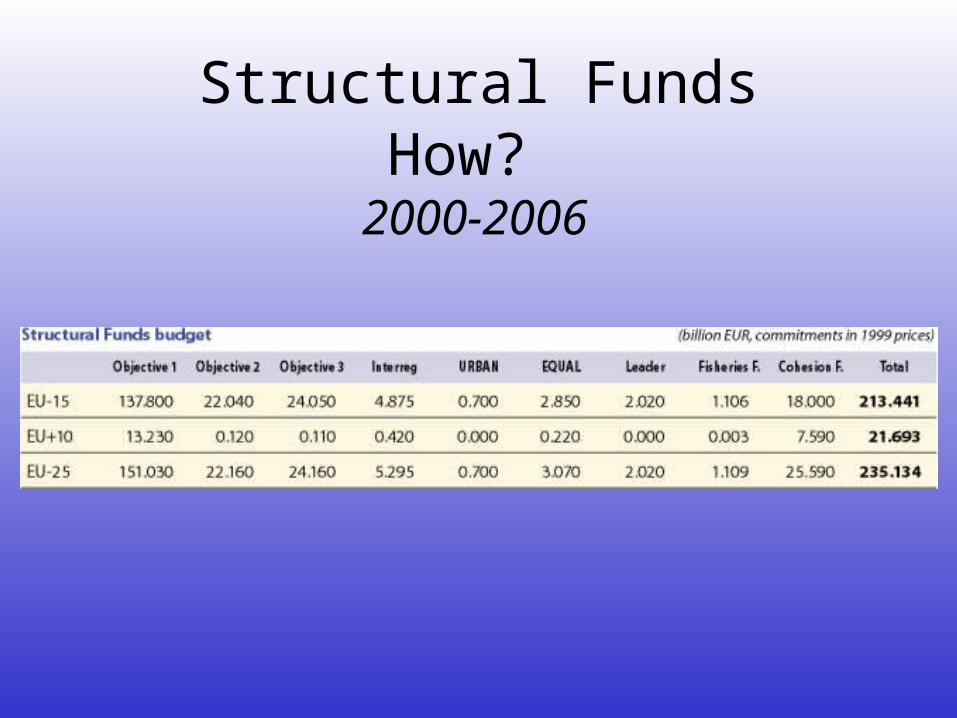
+ 213 billion € for all structural instruments for the 15 Member States. + 22 billion € in preaccession aid, + 22 billion € in structural interventions for the new Member States

Structural FundsHow? 2000-2006
The European Regional Development Fund (ERDF) finances infrastructure, job creating investment, local development projects and aid for small firms.

Structural FundsHow? 2000-2006
The European Social Fund (ESF) promotes the return of the unemployed and disadvantaged groups to the workforce, mainly by financing training measures and systems of recruitment assistance.

Structural FundsHow? 2000-2006
The Financial Instrument for Fisheries Guidance (FIFG) helps adapt and modernise the fishing industry.

Structural FundsHow? 2000-2006
The Guidance Section of the European Agricultural Guidance and Guarantee Fund (EAGGF-Guidance) finances rural development measures and provides aid for farmers, mainly in regions lagging behind in their development.
Structural FundsHow? 2000-2006
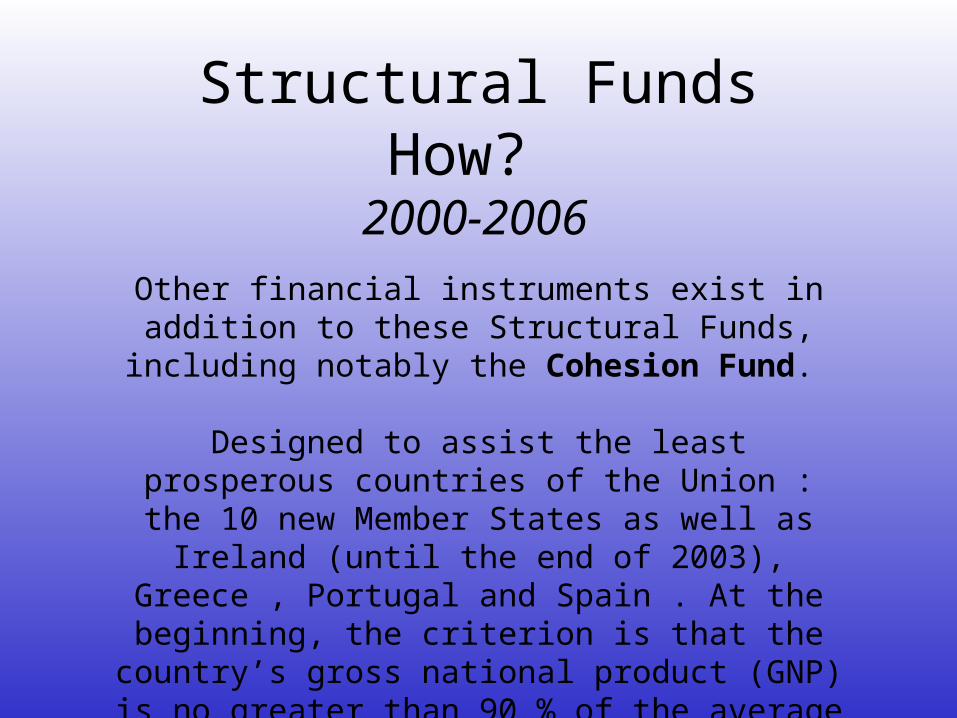
Other financial instruments exist in addition to these Structural Funds, including notably the Cohesion Fund.
Designed to assist the least prosperous countries of the Union : the 10 new Member States as well as Ireland
(until the end of 2003), Greece , Portugal and Spain . At the beginning, the criterion is that the country’s gross national product (GNP) is no greater than 90 % of the
average for the Union .

Structural FundsHow? 2000-2006
The Cohesion Fund intervenes throughout the national territory to co-finance major projects involving the
environment and trans-European transportation networks rather than programmes and thus makes it possible to avoid having
the cost of these works disrupt budgetary efforts in the countries to satisfy the demands of economic and monetary
union. Furthermore, it assists these countries to conform to European
norms in these areas. One third of the funding for the Cohesion Fund is reserved
for the new Member States between 2004 and 2006.

Structural FundsHow? 2000-2006
The priority objectives
To enhance its impact and secure the best possible results, 94 % of structural funding for the period 2000–06 is concentrated on three objectives:

Structural FundsHow? 2000-2006
Objective 1:
Helping regions whose development is lagging behind to catch up.
14.959,64 M €
Structural FundsHow? 2000-2006
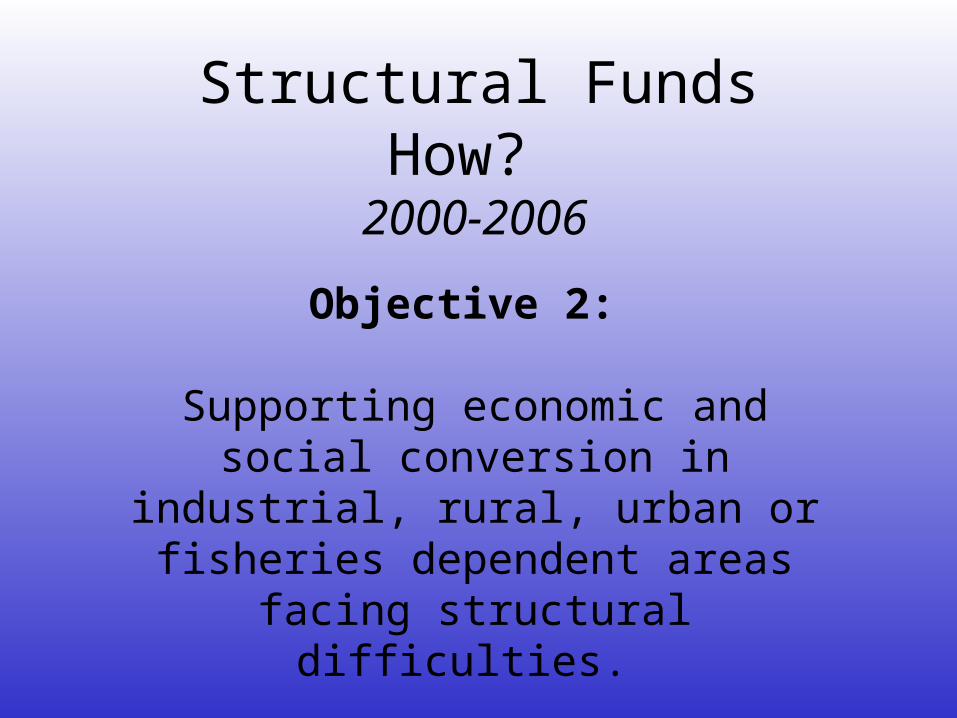
Objective 2:
Supporting economic and social conversion in industrial, rural, urban or
fisheries dependent areas facing structural difficulties.
136,49 M €

Structural FundsHow? 2000-2006
Objective 3:
Modernising systems of training and promoting employment. Measures financed by Objective 3 cover the
whole Union except for the Objective 1 regions, where measures for training and employment are included in the
catch-up programmes.
125,68 M €
Structural FundsHow? 2000-2006
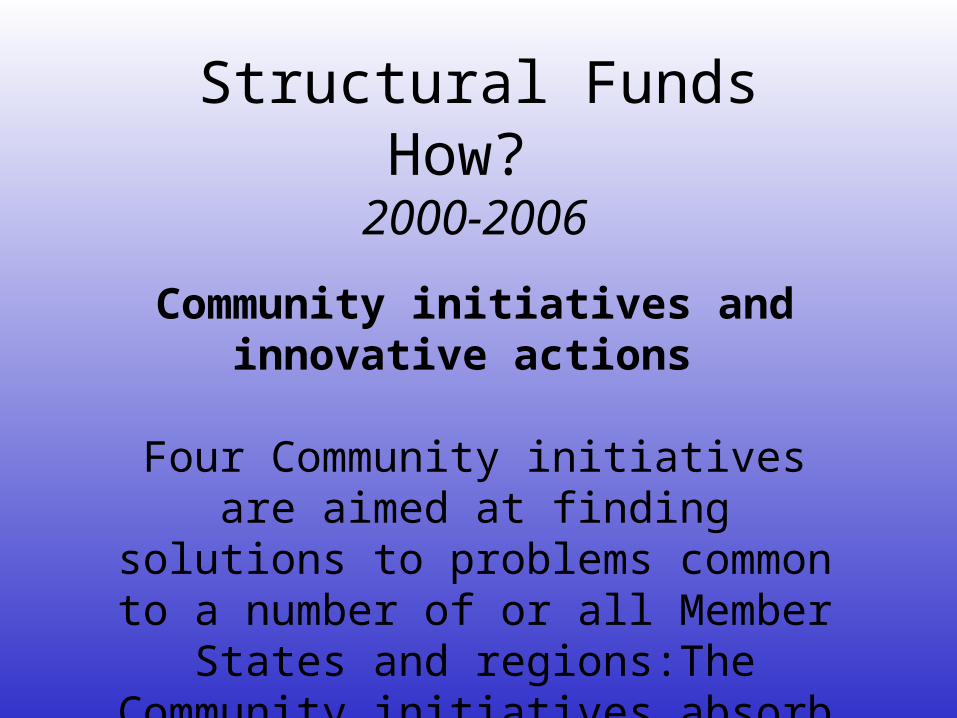
Community initiatives and innovative actions
Four Community initiatives are aimed at finding solutions to problems common to a
number of or all Member States and regions:The Community initiatives absorb 5.35 % of the Structural Funds budget.

Structural FundsHow? 2000-2006
Interreg III
for the development of crossborder, interregional and transnational cooperation;
URBAN II
to support innovative strategies in cities and urban neighbourhoods;

Structural FundsHow? 2000-2006
Leader+
to promote rural development initiatives;
EQUAL
to combat discrimination in the labour market. In addition, programmes for innovative actions receive
funding to work as laboratories of ideas for disadvantaged regions.
Structural FundsHow? 2000-2006
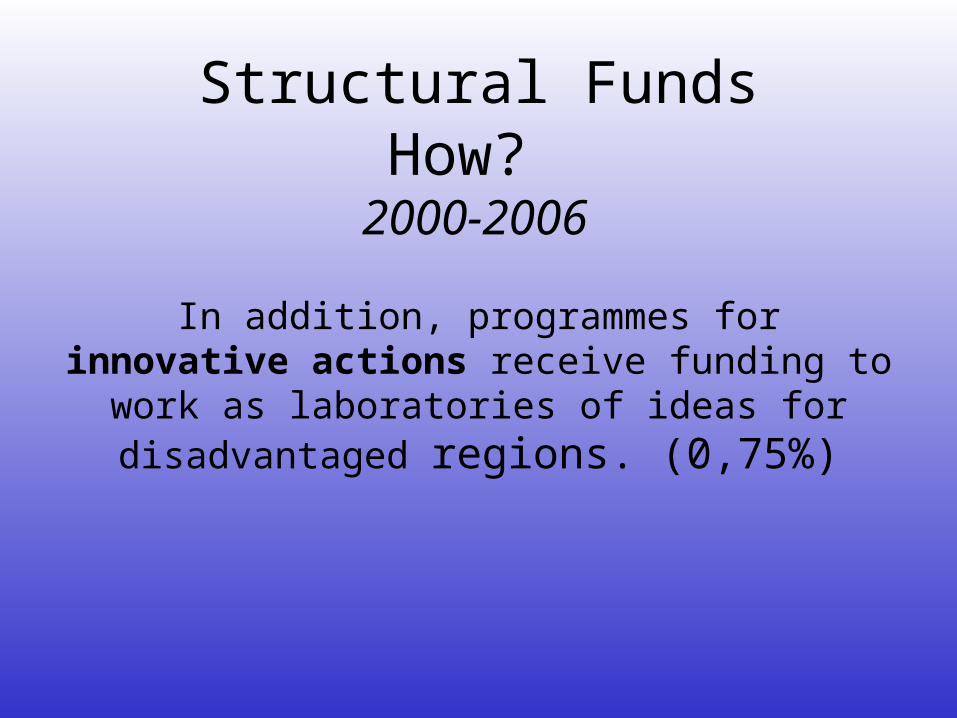
In addition, programmes for innovative actions receive funding to work as laboratories of ideas for
disadvantaged regions. (0,75%)
Structural FundsHow? 2000-2006

Structural FundsHow? 2000-2006
Obj,1 Obj.2
Obj.3
INTERREG III
EQUAL
LEADER+
URBAN II I.A.
ERDF
ESF
EAGGF -G
FIFG

Structural Funds: Eligible areas in EU25 for Objective 1 and 2 between 2000 and 2006
Objective 1 Phasing-out (till 31/12/2005)
Phasing-out (till 31/12/2006) Special programme Objective 2 Objective 2 (partly) Phasing-out (till 31/12/2005) Phasing-out (partly) (till 31/12/2005) ISPA

¿The future?
2007-2013

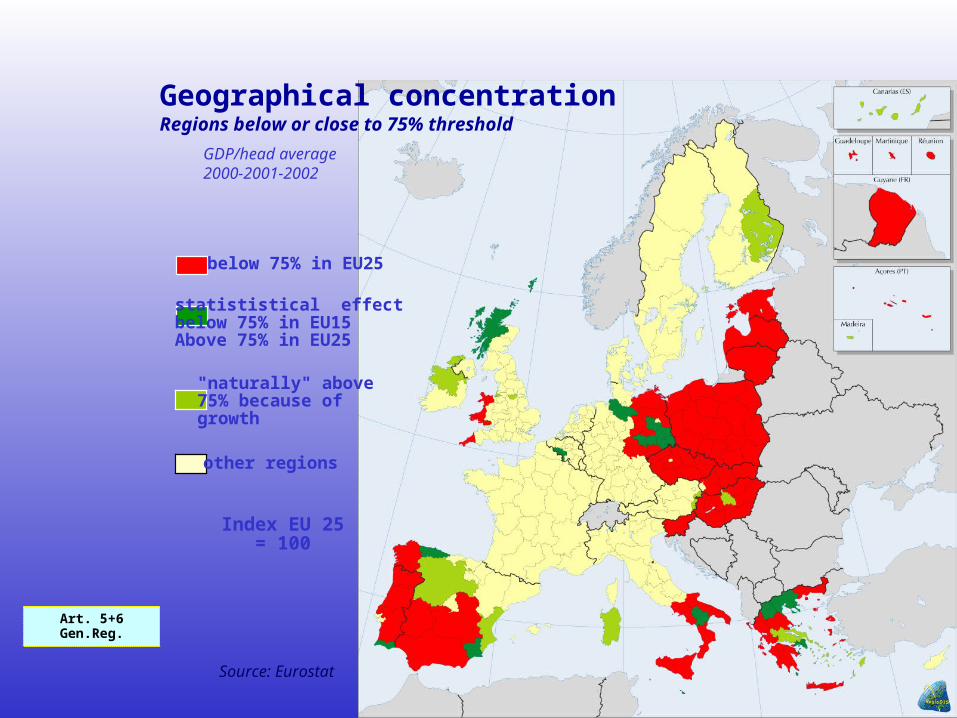
below 75% in EU25
statististical effect below 75% in EU15 Above 75% in EU25
"naturally" above 75% because of growth
other regions
Index EU 25= 100
Source: Eurostat
Art. 5+6 Gen.Reg.
GDP/head average 2000-2001-2002
Geographical concentrationRegions below or close to 75% threshold

New Policies2007-2013

New Policies2007-2013

New Policies2007-2013
Activities Total in billion €
% share of total
Change in % 2006/2013
Cohesion 338.7 33.1% 33%
Competitiveness 132.7 13% 194%
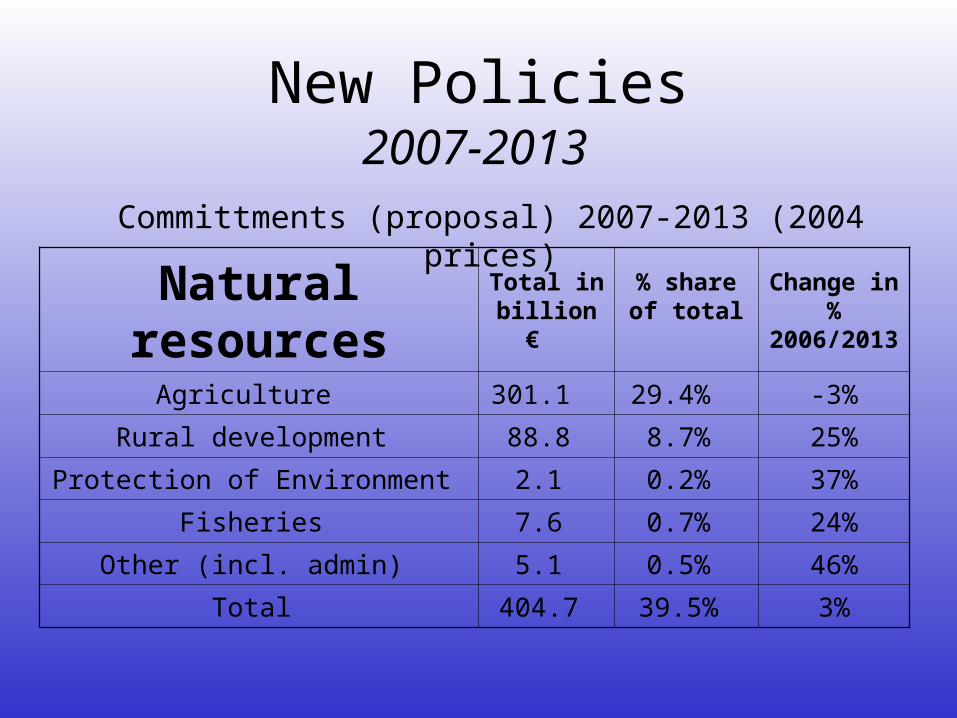
Natural resources 404.7 39.5% 3%
Justice & Other 24.7 2.4% 90%
The World 95.4 9.0% 40%
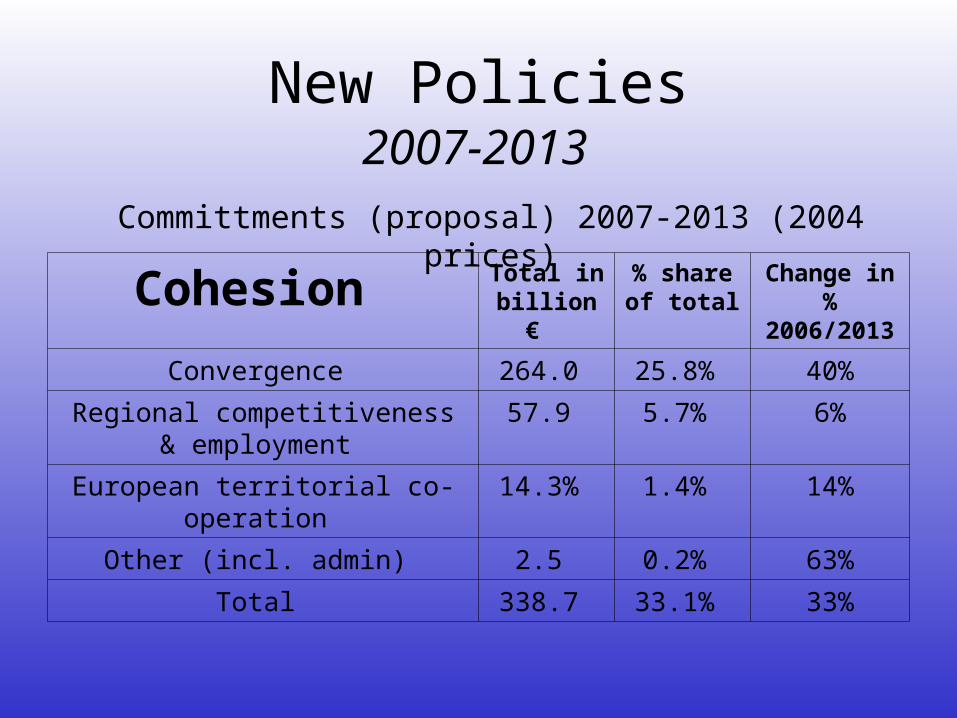
Committments (proposal) 2007-2013 (2004 prices)
New Policies2007-2013
Cohesion Total in billion €
% share of total
Change in % 2006/2013
Convergence 264.0 25.8% 40%
Regional competitiveness & employment
57.9 5.7% 6%
European territorial co-operation 14.3% 1.4% 14%
Other (incl. admin) 2.5 0.2% 63%
Total 338.7 33.1% 33%
Committments (proposal) 2007-2013 (2004 prices)

New Policies2007-2013
Competitiveness Total in billion €
% share of total
Change in % 2006/2013
Research 68.7 6.6% 166%
Transport & Energy 20.7 2.0% 367%
Education and training 12.0 1.2% 268%
Social Policy(Progress) 0.6 0.05% 3%
Competitiveness & innovation 3.7 0.4% 92%
Customs & FISCALIS 0.5 0.1¨% 32%
Growth adjustment fund 7.0 .0.7% new
Other (incl. admin) 20.4 2.0% 131%
Total 132.7 13% 194%
Committments (proposal) 2007-2013 (2004 prices)
New Policies2007-2013
Natural resources Total in billion €
% share of total
Change in % 2006/2013
Agriculture 301.1 29.4% -3%
Rural development 88.8 8.7% 25%
Protection of Environment 2.1 0.2% 37%
Fisheries 7.6 0.7% 24%
Other (incl. admin) 5.1 0.5% 46%
Total 404.7 39.5% 3%
Committments (proposal) 2007-2013 (2004 prices)

New Policies2007-2013
Justice & Others Total in billion €
% share of total
Change in % 2006/2013
Freedom, security and Justice 8.3 0.8% 228%
Health and consumer protection 1.8 0.2% 187%
Culture, youth, media, citizenship 2.5 0.2% 267%
Rapid Response Instrument 0.1 123% 0.01%
Solidarity Fund 6.2 0.6% -13%
Other (incl. admin) 5.8 0.6% 127%
Total 24.7 2.4% 90%
Committments (proposal) 2007-2013 (2004 prices)

New Policies2007-2013
The World Total in billion €
% share of total
Change in % 2006/2013
Pre-accession 12.9 1.3% -18%
Neighbourhood policy 13.1 1.3% 95%
Development 39.0 3.8% 261%
Stability 3.9 0.4% 257%
Loan guarantee fund 1.2 0.1% -13%
Other (incl. admin) 25.3 2.1% 70%
Total 95.4 9.0% 40%
Committments (proposal) 2007-2013 (2004 prices)

Other policies2007-2013
The 7th Framework Programme for Research and Technological Development
a new Competitiveness and Innovation Framework Programme (CIP)
The Education & Training 2010 strategy

Other policies2007-2013
The 7th Framework Programme for Research and Technological Development
A new Competitiveness and Innovation Framework Programme (CIP)
The Education & Training 2010 strategy
below 75% in EU25
statististical effect below 75% in EU15 Above 75% in EU25
"naturally" above 75% because of growth
other regions
Index EU 25= 100
Source: Eurostat
Art. 5+6 Gen.Reg.
GDP/head average 2000-2001-2002
Geographical concentrationRegions below or close to 75% threshold