structural effects on the hesperidin properties obtained by chelation to magnesium complexes
TRANSCRIPT

Journal of Inorganic Biochemistry 129 (2013) 35–42
Contents lists available at ScienceDirect
Journal of Inorganic Biochemistry
j ourna l homepage: www.e lsev ie r .com/ locate / j inorgb io
Structural effects on the hesperidin properties obtained by chelation tomagnesium complexes
ReginaM.M. Oliveira a, Juliana F. de Souza Daniel b, Inara de Aguiar a, Maria Fátima das Graças Fernandes Silva a,João Batista Fernandes a, Rose M. Carlos a,⁎a Departamento de Química, Universidade Federal de São Carlos, Rodovia Washington Luís, Km 235 CP 676, CEP 13565-905 São Carlos, SP, Brazilb Coordenação de Alimentos, Universidade Tecnológica Federal do Paraná, Avenida dos Pioneiros, 3131, CEP 86036-370 Londrina, PR, Brazil
⁎ Corresponding author. Tel.: +55 16 3351 8780; fax: +E-mail address: [email protected] (R.M. Carlos).
0162-0134/$ – see front matter © 2013 Elsevier Inc. All rihttp://dx.doi.org/10.1016/j.jinorgbio.2013.08.005
a b s t r a c t
a r t i c l e i n f oArticle history:Received 15 January 2013Received in revised form 7 August 2013Accepted 7 August 2013Available online 23 August 2013
Keywords:Magnesium(II) complexFlavonoidsBiologic propertiesLuminescenceAntioxidant activity
The magnesium complex [Mg(hesp)2(phen)] (1), where hesp = hesperidin and phen = 1,10′-phenanthroline,was synthesized and characterized by Elemental Analysis (C,H,N), atomic absorption and spectroscopic (FTIR,UV–visible, 1H NMR) techniques. The congested structure facilitates the tilting and contact of the two hesperidinligands by hydrogen bonding interactions having a stabilizer effect on the hesperidin. The hydrogen bonds arestrongly affected by the solvent used which can lead to changes in the physical–chemical, luminescence and bi-ologic properties of complex 1. Complex 1 ismore hydrosoluble (S = 472 ± 3.05 μg mL−1) and liposoluble (logP = −0.15 ± 0.01) than free hesperidin (S = 5.92 ± 0.49 μg mL−1, log P = 0.30). Oxidation of the complex inan aqueous solution and room temperature investigated by cyclic voltammetry resulted in a very stabletwo-electron cyclic process to form the phenoxonium neutral, cation and dication radicals. The stability of thevoltammetric process indicates that the species produced are never exhausted and does not lead to changes inthe coordination sphere composition. The complexwas found to be a better radical scavenger for superoxide radical(IC50 = 68.3 μM at pH 7.8) than free hesperidin (IC50 = 116.68 μmol L−1) and vitamin C (IC50 = 852 μmol L−1).The strong blue fluorescence of complex 1 switches through loss of luminescence in pure water/protic organic sol-vents orwhenprotected fromwater (in octanol for example as amodel of phospholipidmembranes). These featuresprovide an opportunity tomap the reactivity of hesperidin in the physiologicmedium. In this context, a high uptakeof complex into HeLa cells was detected by fluorescence microscopy. The blue fluorescence was uniformlydistributed mainly in per nucleic region.
© 2013 Elsevier Inc. All rights reserved.
1. Introduction
Hesperidin, aflavanone glycoside, has awide variety of pharmacolog-ical applications [1–3] in particular, antioxidant activity and inhibition ofxanthine oxidase, as well as protective effects in cardiovascular andneurodegenerative diseases [4–7]. Furthermore, the blue fluorescenceof hesperidin can be reached in a basic medium making it possible tohave various practical applications such as bio-medical diagnostic assays.However, hesperidin has a limited pharmacological application due tohigh hydrophobicity [8]. One strategy would be to promote the metalchelation of hesperidin and study the potential biological relevance ofthese interactions.Magnesium is ametal of interest because of its biolog-ical importance as an essential metal for life, participating in a variety ofmetabolic and physiological functions [9–12]. The presence of Mg(II)ions prevents the production of oxygen free radicals in the brain of aguinea pig fetus [13–15] and inhibits the effects of superoxide anionsin human amnion cells. Moreover, magnesium(II) compounds are goodmodels for design carriers for hesperidin because these species readilyreact with O,N-heterocyclic ligands yielding stable compounds and
55 16 3351 8350.
ghts reserved.
may provide a water soluble compound. Because hesperidin activity isattributed to the generation of reduced metabolites, which are involvedin its antioxidant activity it is expected that theMg–hesperidin complex,in which the hesperidin ligand would be more accessible to oxidation,shows higher antioxidant activity than free hesperidin. Using this strate-gy and aiming to develop a more water soluble compound which isbioactive and has reduced toxicity, and shown luminescent diagnosticproperties we describe here the [Mg(hesp)2(phen)] complex, wherehesp is hesperidin and phen is 1,10′-phenanthroline. The results areexplained based on the {Mg(phen)}2+ moiety influence on the physical,chemical and biological properties of hesperidin using both experimen-tal and theoretical parameters.
2. Experimental section
2.1. Spectrometric techniques
A flame atomic absorption spectrometer (AA240FS; Varian,Mulgrave, Australia) and ICP-OES (inductively coupled plasma opticalemission spectrometry) were used to determine the Mg element inthe samples of complex 1.
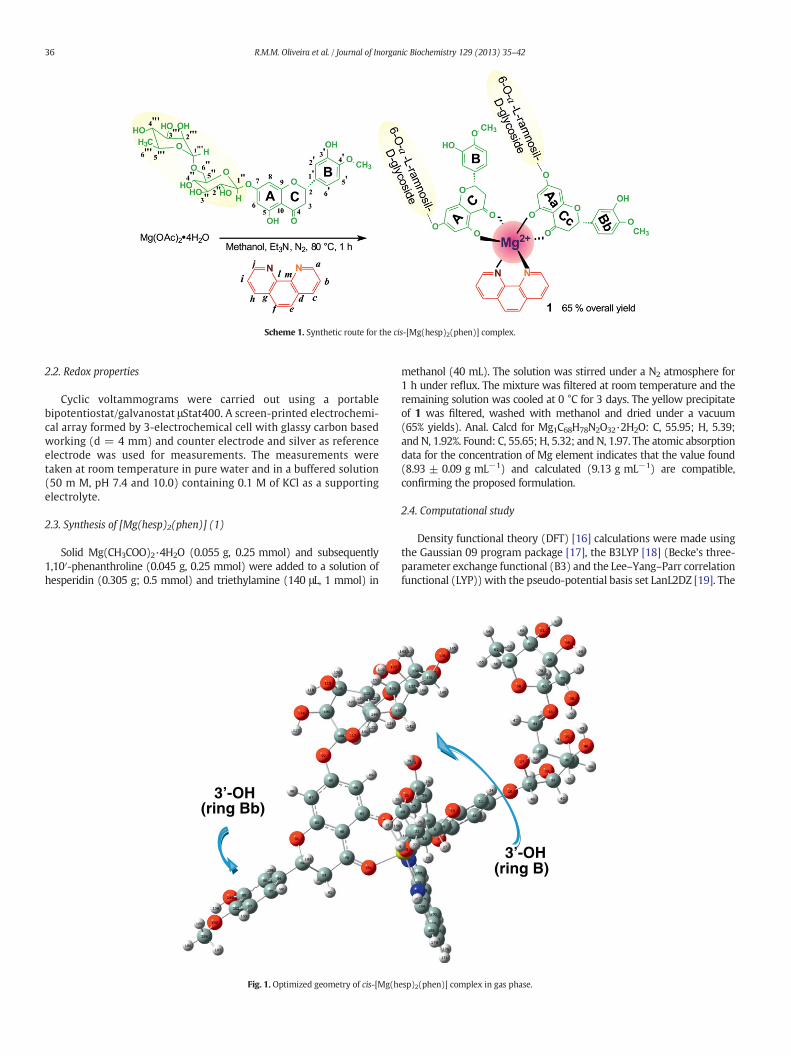
Scheme 1. Synthetic route for the cis-[Mg(hesp)2(phen)] complex.
36 R.M.M. Oliveira et al. / Journal of Inorganic Biochemistry 129 (2013) 35–42
2.2. Redox properties
Cyclic voltammograms were carried out using a portablebipotentiostat/galvanostat μStat400. A screen-printed electrochemi-cal array formed by 3-electrochemical cell with glassy carbon basedworking (d = 4 mm) and counter electrode and silver as referenceelectrode was used for measurements. The measurements weretaken at room temperature in pure water and in a buffered solution(50 m M, pH 7.4 and 10.0) containing 0.1 M of KCl as a supportingelectrolyte.
2.3. Synthesis of [Mg(hesp)2(phen)] (1)
Solid Mg(CH3COO)2·4H2O (0.055 g, 0.25 mmol) and subsequently1,10′-phenanthroline (0.045 g, 0.25 mmol) were added to a solution ofhesperidin (0.305 g; 0.5 mmol) and triethylamine (140 μL, 1 mmol) in
3’-OH(ring Bb)
Fig. 1. Optimized geometry of cis-[Mg(h
methanol (40 mL). The solution was stirred under a N2 atmosphere for1 h under reflux. The mixture was filtered at room temperature and theremaining solution was cooled at 0 °C for 3 days. The yellow precipitateof 1 was filtered, washed with methanol and dried under a vacuum(65% yields). Anal. Calcd for Mg1C68H78N2O32·2H2O: C, 55.95; H, 5.39;and N, 1.92%. Found: C, 55.65; H, 5.32; and N, 1.97. The atomic absorptiondata for the concentration of Mg element indicates that the value found(8.93 ± 0.09 g mL−1) and calculated (9.13 g mL−1) are compatible,confirming the proposed formulation.
2.4. Computational study
Density functional theory (DFT) [16] calculations were made usingthe Gaussian 09 program package [17], the B3LYP [18] (Becke's three-parameter exchange functional (B3) and the Lee–Yang–Parr correlationfunctional (LYP)) with the pseudo-potential basis set LanL2DZ [19]. The
3’-OH(ring B)
esp)2(phen)] complex in gas phase.

37R.M.M. Oliveira et al. / Journal of Inorganic Biochemistry 129 (2013) 35–42
geometry was fully optimized in a ground state without symmetryrestrictions.
2.5. Spectrophotometric and spectrofluorimetric measurements
UV–visible (UV–vis) spectrophotometric and spectrofluorimetricexperiments were done at room temperature in an aqueous solutionand using organic solvents with concentrations of complex 1 or hesper-idin of 20 μmol L−1. Optical spectra were recorded on an Agilent 8453UV–visible spectrophotometer in the range of 250–800 nm and emis-sion spectra were recorded on a Shimadzu RF-5301PC fluorescencespectrophotometer. The path length was 1 cm. To determine the re-sponse of complex 1 in the various pH values used, we exposed eithercomplex 1 (2.0 × 10⁻⁵ mol L−1) or hesperidin free (2.0 × 10⁻⁵ M)to various Britton and Robinson type buffer solutions (50 m mol L−1)between pH 3.0 and 12.0 at 0.1 M(KCl) ionic strength. Spectrophoto-metric measurements were performed in the range of 250–800 nmand the absorbance curve of complex 1 at 360 nm as a function ofsolution pH, which was fitted to the modified Henderson–Hasselbalchequation:
pKa ¼ pH– log Ai–Aprot:
� �.Adep:−Ai
� �h ið1Þ
where Aprot. is the absorbance of the protonated form only, Adep. is theabsorbance only of thedeprotonated form, andAi is the total absorbanceof the mixture (protonated + deprotonated form) to a given pH. Thecomputer program ORIGIN 7.5 [20], was used and the inflection pointof the sigmoid curve gives the value of pKa (the negative logarithm ofthe acid dissociation constant, Ka). The pH-dependent fluorescencemeasurements were also recorded and the emission intensity observedat 491 nm with excitation at 360 nm.
2.6. Solubility
Aqueous solubility of complex 1 in pure water and in Tris/HCl buffersolution pH (3.6–11.0) was determined at 37.0 ± 0.5 °C using theshake-flaskmethod [21]. These experimentswere carried out by addingappropriate amounts of complex 1 to 2 mL buffer solution until satura-tion. Suspensionswere shaken for 24 h at 50 rpmuntil equilibriumwasattained. Samples were centrifuged for 8 min in a FANEM 206-Rcentrifuge at 220 rpm. The concentration of complex in the filtratewas determined using a UV–visible spectrophotometer.
Fig. 2. 1H NMR spectrum of complex 1 in CD3OD at 25 (±0.1) °C.
2.7. Lipophilicity
The log P (Evaluation of Lipophilicity Parameter) value wasdetermined by partitioning octanol and 50 mM Tris/HCl buffer, usingthe shake-flaskmethod [21]. Complex1 (100 ppm)was added to amix-ture of 1 mL of octanol and 1 mL of buffer and the mixtures were then
Fig. 3. Electronic absorption spectra (a) and emission and excitation spectra (b) of com-plex 1 in different solvents and emission spectra of complex 1 (15 μM) in DMSO/H2O indifferent proportions at 25 °C.
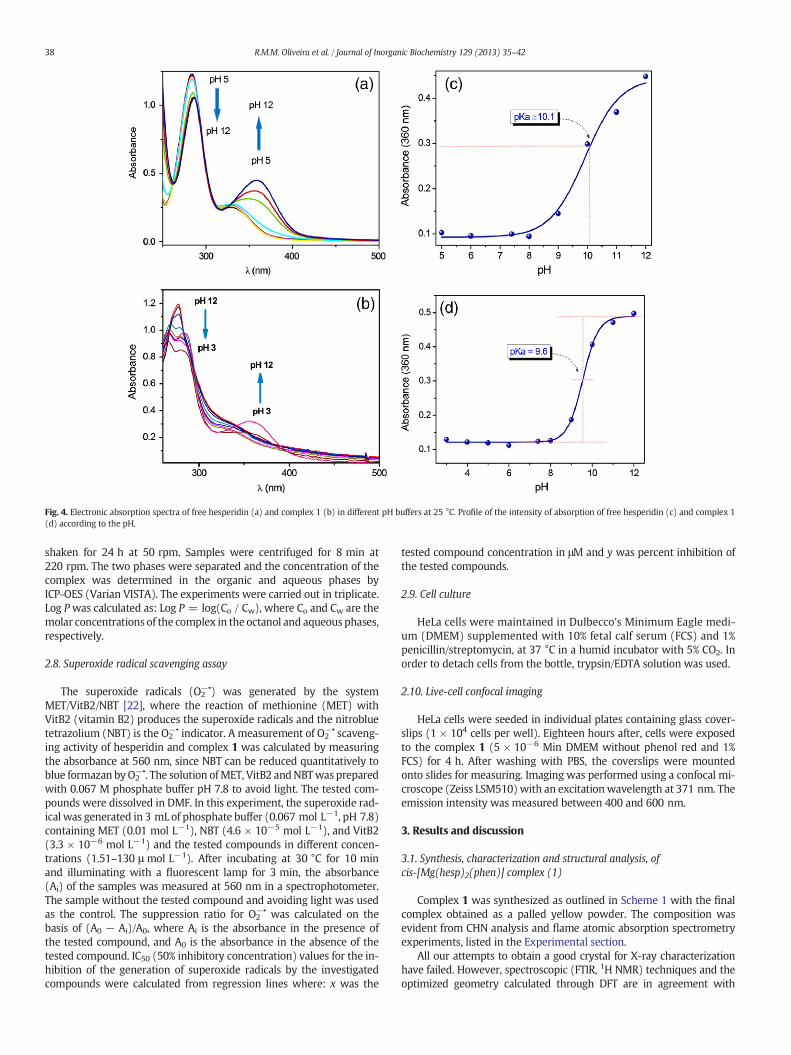
Fig. 4. Electronic absorption spectra of free hesperidin (a) and complex 1 (b) in different pH buffers at 25 °C. Profile of the intensity of absorption of free hesperidin (c) and complex 1(d) according to the pH.
38 R.M.M. Oliveira et al. / Journal of Inorganic Biochemistry 129 (2013) 35–42
shaken for 24 h at 50 rpm. Samples were centrifuged for 8 min at220 rpm. The two phases were separated and the concentration of thecomplex was determined in the organic and aqueous phases byICP-OES (Varian VISTA). The experiments were carried out in triplicate.Log Pwas calculated as: Log P = log(Co / Cw), where Co and Cw are themolar concentrations of the complex in the octanol and aqueous phases,respectively.
2.8. Superoxide radical scavenging assay
The superoxide radicals (O2−•) was generated by the system
MET/VitB2/NBT [22], where the reaction of methionine (MET) withVitB2 (vitamin B2) produces the superoxide radicals and the nitrobluetetrazolium (NBT) is the O2
−• indicator. A measurement of O2−• scaveng-
ing activity of hesperidin and complex 1 was calculated by measuringthe absorbance at 560 nm, since NBT can be reduced quantitatively toblue formazan byO2
−•. The solution ofMET, VitB2 andNBTwas preparedwith 0.067 M phosphate buffer pH 7.8 to avoid light. The tested com-pounds were dissolved in DMF. In this experiment, the superoxide rad-ical was generated in 3 mL of phosphate buffer (0.067 mol L−1, pH 7.8)containing MET (0.01 mol L−1), NBT (4.6 × 10⁻⁵ mol L−1), and VitB2(3.3 × 10⁻⁶ mol L−1) and the tested compounds in different concen-trations (1.51–130 μ mol L−1). After incubating at 30 °C for 10 minand illuminating with a fluorescent lamp for 3 min, the absorbance(Ai) of the samples was measured at 560 nm in a spectrophotometer.The sample without the tested compound and avoiding light was usedas the control. The suppression ratio for O2
−• was calculated on thebasis of (A0 − Ai)/A0, where Ai is the absorbance in the presence ofthe tested compound, and A0 is the absorbance in the absence of thetested compound. IC50 (50% inhibitory concentration) values for the in-hibition of the generation of superoxide radicals by the investigatedcompounds were calculated from regression lines where: x was the
tested compound concentration in μM and y was percent inhibition ofthe tested compounds.
2.9. Cell culture
HeLa cells were maintained in Dulbecco's Minimum Eagle medi-um (DMEM) supplemented with 10% fetal calf serum (FCS) and 1%penicillin/streptomycin, at 37 °C in a humid incubator with 5% CO2. Inorder to detach cells from the bottle, trypsin/EDTA solution was used.
2.10. Live-cell confocal imaging
HeLa cells were seeded in individual plates containing glass cover-slips (1 × 10⁴ cells per well). Eighteen hours after, cells were exposedto the complex 1 (5 × 10⁻⁶ Min DMEM without phenol red and 1%FCS) for 4 h. After washing with PBS, the coverslips were mountedonto slides for measuring. Imaging was performed using a confocal mi-croscope (Zeiss LSM510) with an excitationwavelength at 371 nm. Theemission intensity was measured between 400 and 600 nm.
3. Results and discussion
3.1. Synthesis, characterization and structural analysis, ofcis-[Mg(hesp)2(phen)] complex (1)
Complex 1 was synthesized as outlined in Scheme 1 with the finalcomplex obtained as a palled yellow powder. The composition wasevident from CHN analysis and flame atomic absorption spectrometryexperiments, listed in the Experimental section.
All our attempts to obtain a good crystal for X-ray characterizationhave failed. However, spectroscopic (FTIR, 1H NMR) techniques and theoptimized geometry calculated through DFT are in agreement with

39R.M.M. Oliveira et al. / Journal of Inorganic Biochemistry 129 (2013) 35–42
composition and structure of complex 1. For example, the FTIR spectrumshowed a shift of the carbonyl band to smaller values, 1600 cm−1, com-pared to the free ligand, 1647 cm−1, consistent with the binding of hes-peridin ligand to Mg(II) center through oxygen atom of C4_O group,Figure S1. The absence of the peak at 1503 cm−1 of free phen and theappearance of a peak at 1516 cm−1 and a shoulder at 1496 cm−1 dueto ν(CN and CC) modes of resonance of phen are coherent, with thephen coordination to Mg(II) center in accordance with DFT calculationsdescribed below.
The optimized structure of complex 1, in the gas phase is depicted inFig. 1, with bond lengths and bond angles collected in Table S1. The(phen)N2MgO4(hesp)2 skeleton of complex 1 has C1 symmetry withnearly octahedral coordination sphere around the Mg atom in a cis-configuration. This configuration places the oxygen atoms of the hy-droxyl group of one of the hesperidin ligands and the carbonyl groupof the other hesperidin ligand trans to each other in the axial position.Because each one of the hesperidin is coordinated to Mg(II) via twodifferent oxygen atoms, charge delocalization is observed within thismoiety. Thus, Mg\O(\O\C5; 1.99 Å) bond strengthening is observedwhich is consistent with the simultaneous Mg\O(O_C4; 2.07 Å)weakening. On the other hand, the Mg-N154(phen), 2.20 Å, and Mg-N163 (phen), 2.23 Å, bond lengths are comparable with those foundfor [Mg(SO4)(phen)(H2O)3] [23,24]. The extent of octahedral distortioncan also be observed by the torsion angle of 140.6° (O75O78MgN163).The nonplanar configuration between C andB rings can be seen throughthe twist of the C ring compared to the B ring of around 30°. The sterical-ly congested structure of complex 1 facilitates the bending of terminalglycoside arms present in ring Aa of one of the hesperidin ligands andthe OH group in position 3′ of ring B of the other hesperidin ligand inthe same direction. One consequence of this molecular arrangement isthat the phenanthroline ring is positioned perpendicularly and nearlysymmetrically between the two hesp ligands on the octahedral coordi-nation sphere of Mg(II). Indeed, the Mullikan analysis of complex 1shows that the negative charge on the OH group in position 3′ presentin ring B is decreased to−0.08 when the complex is formed. This indi-cates an increase in the acidity of the 3′-OH group. Further structural in-sight into the structure of complex 1 comes from 1H NMR dataexperiments.
The 1H NMR spectrum of complex 1 in CH3OH shows duplication ofthe proton signals of the flavanone skeleton, A, B and C indicatingthe metal chelating of two hesperidin molecules. The H-2, H-3b andH-3a proton signals of ring C, located in the vicinity of the 7-rhamnoglucoside groups, appear at 5.39, 2.78 and3.13 ppm, respective-ly, whereas those protons located on ring Cc are identified at 5.25, 2.75and 3.03 ppm, respectively, Fig. 2. Thus, the down-field shift observedfor the coordinated C ring compared to the Cc ring is coherent withthe increase of acidity in the hydroxyl group in position 3′ of ring B, aspredicted by optimized geometry. The 1H NMR spectra also show twoanomeric proton signals at 4.94 and 4.80 and two multiplet signals at4.00 ppm assigned to the glucose and terminal rhaminose component,respectively. Furthermore, two methoxy signals are identified at 3.86and 3.85, and one methyl signal at 1.19.
Consistent with the optimized geometry, the proton signals of thephen ligand remains equivalent after coordination, Table S2, whichmeans, chelation does not affect the phen signals as expected for nearlyperpendicular orientation of phen to two hesp ligand.
Fig. 5. Emission spectra of free hesperidin (a) and complex 1 (b) in different pH bufferswith excitation wavelength set at 360 nm, at 25 °C. (c) Plots of relative emission intensityversus pH for the complex 1 in buffer solutions. All points are relative to the highestintensity point at pH 12.0.
3.2. Spectroscopic and electrochemical properties of complex 1
The UV–vis spectrum of complex 1, shows absorption features at284 nm and 370 nm assigned based on the literature [25] to intra-ligand transitions π → π* of hesperidin ligand, corresponding to the Aring portion (band II) and to the B ring portion (band I), respectively.
As shown in Fig. 3(a), the absorption intensities are susceptive to thesolvent used. For example, the molar extinction coefficient at 370 nm is
3 fold higher in DMSO than in CH3OH, whereas the changes of 284 nmabsorption are less significant.
The emission properties of complex 1 are also solvent dependent: inmethanol and at room temperature a broad emission is observedwith amaximum at 490 nm (λexc = 370 nm), Fig. 3(b). Compared to the
40 R.M.M. Oliveira et al. / Journal of Inorganic Biochemistry 129 (2013) 35–42
absorption spectrum, themaxima in the excitation spectrum at 370 and282 nm have similar intensities. The Stokes shift was 5780 cm−1 andthe best fit of emission decays was obtained using a triexponentialcurve having lifetime values of 5.749 ns (A = 2007.3); 1.433 ns(A = 37217.17) and 0.307 ns (A = 7162.32). Similar behavior, al-though the emission is weaker, is observed in polar and aprotic solventssuch as CH2Cl2, Fig. 3(b), indicating that both emissions come from thesame excited state.
In aprotic donor solvents such as DMSO and DMF (dimethyl-formamide) and in PMMA (polymethylmethacrylate) films complex 1exhibits an intense emission at 467 nm. For example, in DMSO the in-tensity of the excitation band at 370 nm is 1.6-fold higher than theband at 284 nm whereas the Stokes shift was close to that in CH3OH.A triexponential fit was also required for the emission lifetime havingvalues of 6.041 ns, 1.206 ns and 0.194 ns. Fluorescence was completelyquenched in both cyclohexane (nonpolar, essentially nonsolvating) andin water at neutral pH (polar, strongly solvating). Indeed, Fig. 3(c)shows the changes in the emission spectra of complex 1 in DMSO tothose in DMSO–H2O mixtures with 0, 5, 10 and 15% H2O. By increasingthe amount of water, the emission feature of complex 1 at 467 nm de-creases in intensity and disappears in 100% water.
Fig. 4 shows the absorption spectra of complex 1 and free hesperidinas a function of pH. In basic solutions, the increase in the pH makes thehigh energy absorption bands decrease in intensity concomitantly withthe appearance of a broad and intense absorption band at ~360 nm in-dicating deprotonation of the hesperidin ligand, Fig. 4(a,b). A plot of theabsorbance at 360 nm versus pH shows an inflection point at pH 9.6,Fig. 4(d), correspondent to the pKa value for monoprotonation of com-plex 1. This value is smaller than the one reported [26] by Serra et al.,and reproduced in this work for the free hesperidin ligand, which is
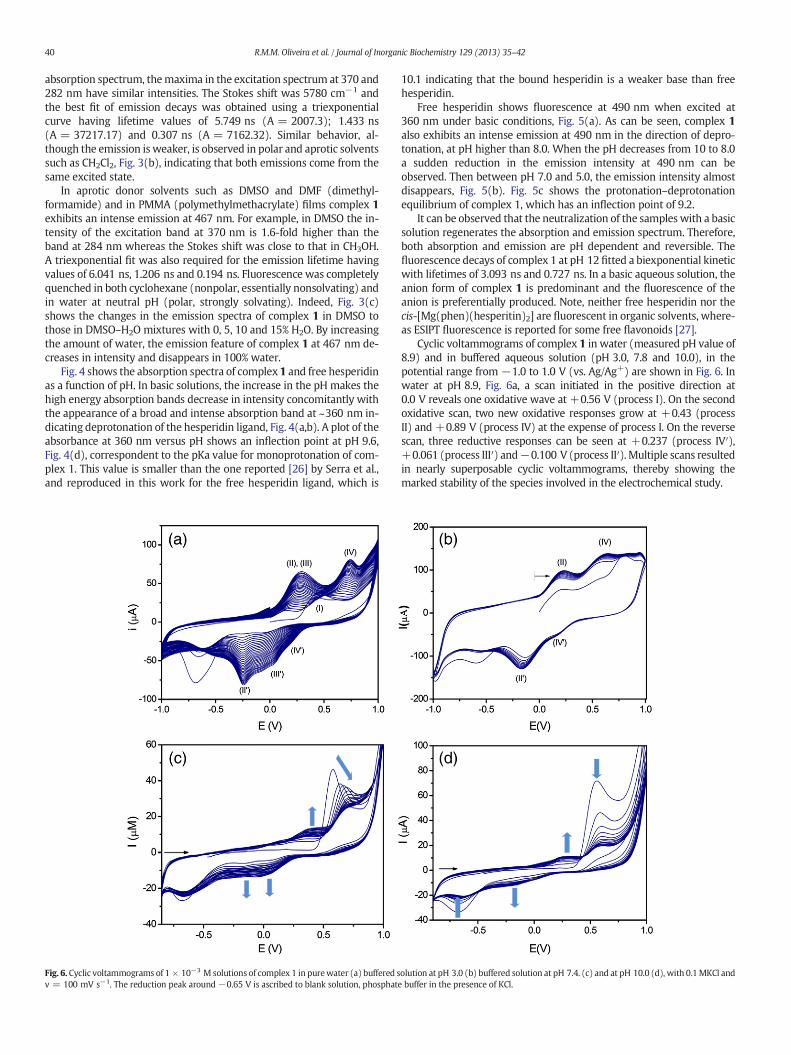
Fig. 6. Cyclic voltammograms of 1 × 10⁻³ M solutions of complex 1 in purewater (a) buffered sv = 100 mV s−1. The reduction peak around −0.65 V is ascribed to blank solution, phosphate
10.1 indicating that the bound hesperidin is a weaker base than freehesperidin.
Free hesperidin shows fluorescence at 490 nm when excited at360 nm under basic conditions, Fig. 5(a). As can be seen, complex 1also exhibits an intense emission at 490 nm in the direction of depro-tonation, at pH higher than 8.0. When the pH decreases from 10 to 8.0a sudden reduction in the emission intensity at 490 nm can beobserved. Then between pH 7.0 and 5.0, the emission intensity almostdisappears, Fig. 5(b). Fig. 5c shows the protonation–deprotonationequilibrium of complex 1, which has an inflection point of 9.2.
It can be observed that the neutralization of the samples with a basicsolution regenerates the absorption and emission spectrum. Therefore,both absorption and emission are pH dependent and reversible. Thefluorescence decays of complex 1 at pH 12 fitted a biexponential kineticwith lifetimes of 3.093 ns and 0.727 ns. In a basic aqueous solution, theanion form of complex 1 is predominant and the fluorescence of theanion is preferentially produced. Note, neither free hesperidin nor thecis-[Mg(phen)(hesperitin)2] are fluorescent in organic solvents, where-as ESIPT fluorescence is reported for some free flavonoids [27].
Cyclic voltammograms of complex 1 in water (measured pH value of8.9) and in buffered aqueous solution (pH 3.0, 7.8 and 10.0), in thepotential range from −1.0 to 1.0 V (vs. Ag/Ag+) are shown in Fig. 6. Inwater at pH 8.9, Fig. 6a, a scan initiated in the positive direction at0.0 V reveals one oxidative wave at +0.56 V (process I). On the secondoxidative scan, two new oxidative responses grow at +0.43 (processII) and +0.89 V (process IV) at the expense of process I. On the reversescan, three reductive responses can be seen at +0.237 (process IV′),+0.061 (process III′) and−0.100 V (process II′).Multiple scans resultedin nearly superposable cyclic voltammograms, thereby showing themarked stability of the species involved in the electrochemical study.
olution at pH 3.0 (b) buffered solution at pH 7.4. (c) and at pH 10.0 (d), with 0.1MKCl andbuffer in the presence of KCl.

Scheme 2. Reactions suggested to process electrochemistry in water for the complex 1.
41R.M.M. Oliveira et al. / Journal of Inorganic Biochemistry 129 (2013) 35–42
The cyclic voltammogram at pH 3.0 shows processes II/II′ and IV/IV′(Fig. 6b) whereas at pH 7.8, buffered solution, the first oxidative cyclicvoltammogram shows only process I (quite prominent) and processesII/II′ and III/III′, but with a smaller response, Fig. 6c. At pH 10.0, bufferedsolution,where the coordinated hesperidin is in the anion form, processI is intensified and processes III/III′ and IV/IV′ do not appear, Fig. 6d.
The oxidative cyclic voltammogram result shows that in water andat buffered solutions pH 7.8 there are two species in solution: theneutral complex and its anion form. At acidic pH, the neutral speciesdominates whereas at basic pH (pH 10.0) the anion form prevails.
Based on the literature results [28–30], it is suggested that the redoxprocesses on the electrode surface are associated with oxidation of the3′-OH group of B ring of the coordinated hesperidin, rich in electrondensity. The phenoxyl radical is produced at basic pH and thephenoxonium cation radical and its dication radical at acidic pH. Theoverall reaction mechanism is shown in Scheme 2.
The high stability of the species produced on the oxidative processand the cyclic behavior of the electrochemical processes are remarkable.This is possible due to nonredoxmagnesiummoiety that provides redoxstability to hesperidin increasing its potential applicability in therapeu-tic processes.
3.3. Physicochemical properties
A limiting factor for biological application of free hesperidin is eitherits instability in solution and low solubility in aqueous solution, 5.92 ±0.49 μg mL−1 at 25 °C, with log P = 0.30. Furthermore, hesperidin haslimited intestinal absorption due to glycoside group. Having this back-ground knowledge, the physicochemical properties of complex 1 wereinvestigated and listed in Table S3. The high solubility values in purewater (472.0 ± 3.1) at physiologic pH (552.0 ± 5.4) and the high pKavalue (9.4) suggest that this compound may show a high absorptionprofile in the gastrointestinal walls [31]. According to this observation,the lipophilicity of complex 1, determined by the shake-flask methodis described by the log P = −0.15 ± 0.01 showing a good absorptionprofile for oral administration. As expected, there is a direct correlationbetween the S and log P values. Solubility of complex 1was also detect-ed in the following organic solvents: methanol, ethanol, acetonitrile,
Fig. 7. Laser-scanning confocal microscopy images of HeLa cells incubated with comple
dimethyl sulfoxide, dimethylformamide, and dimethyl ketone, whilefree hesperidin is only slightly soluble in organic solvents [32].
3.4. Superoxide radical scavenger investigations
Having confirmed the formation of the hesperidin phenoxoniumcation radical bonded to magnesium moiety by cyclic voltammetry,we went on to test the radical scavenger ability of complex 1 towardthe superoxide radical as expected for flavonoids [33]. The scavengingeffect of complex 1 on superoxide anion radical was evaluated usingthe MET/VitB2/NBT assay at buffer solution pH 7.8. The decreased pro-duction of O2
−• was measured spectrophotometrically. The IC50 values(50% inhibitory concentration) were calculated from the regressionline where the x-axis was a log of the tested compound concentrationand y-axis was the percent inhibition of the tested compounds. TheIC50 values of complex 1 (68.8 μmol L−1) was smaller than that of freehesperidin ligand (116.68 μmol L−1) and the standard antioxidantcompound vitamin C (IC50 = 852 μmol L−1) [33].
On the basis of electrochemical data, the high superoxide radicalscavenging may be related to lowest oxidation potential of coordinatedhesperidin (+0.58 V vs. Ag/Ag+) relative to its free form, +0.66 V vs.Ag/Ag+ (Figure S2) at physiologic pH.
3.5. Cellular uptake
The cellular uptake and intracellular distribution of complex 1 weremonitored in the blue fluorescence filter as described in theExperimental section using laser-scanning confocal microscopy. Thefixed HeLa cells were exposed to 5 μM of complex 1 at 37 °C for30 min and the uptake was followed by fluorescence microscopy.Fig. 7 clearly shows that the complex was transported into the interiorof the cell. The greatest luminescence is evident in the perinuclear re-gion, forming luminescent rings surrounding the nuclei having a nicelystructured distribution. No luminescence was detected in the interior ofnuclei. These results indicate that the large size of the complex, its highhydrophilicity and low hydrophobicity and neutral charge do not pre-vent the complex cell uptake.
4. Conclusion
Thiswork demonstrates that chelation of the flavonoid hesperidin to{Mg(phen)}2+ moiety results in the formation of the new luminescentcomplex [Mg(hesp)2(phen)], which presents structural features,which are essential to improve the physico-chemical and antioxidantactivity of the hesperidin in the physiologic medium and can be usedas a luminescent sensor. These features are interesting to use inhuman tissue. Additionally, the highly efficient uptake of the complexat a low concentration in a relatively short incubation time suggests
x 1 (5 μM) at 37 °C for 30 min. Brightfield (left), and fluorescence (right) images.

42 R.M.M. Oliveira et al. / Journal of Inorganic Biochemistry 129 (2013) 35–42
that this luminescent complex is attractive to be developed as bio-imaging reagent.
Acknowledgment
The authors wish to thank FAPESP (Proc 2009/08218-0), CNPq (Uni-versal 470890/2010-0), INCT (Controle Biorracional de Insetos Pragas2008/57859-5) and CAPES for the grants and fellowships awarded forthis research.
Appendix A. Supplementary data
Supplementary material FTIR spectra of complex 1, hesperidin and1,10′-phenanthroline (Figure S1), cyclic voltammogram of hesperidinin potassium phosphate buffer (50 mM) at pH 7.4 (Figure S2), selectedbond lengths and angles of the optimized structure of complex 1(Table S1, solubility of complex 1 in water and in buffer at variouspHs), at 25 °C (Table S2). Supplementary data to this article can befound online at http://dx.doi.org/10.1016/j.jinorgbio.2013.08.005.
References
[1] E.M. Galati, M.T. Monforte, S. Kirjavainen, A.M. Forestieri, A. Trovato, M.M. Tripodo,Farmaco 40 (1994) 709–712.
[2] C. de Gregorio Alapont, R. Garcia-Domenech, J. Galvez, M.J. Ros, S. Wolski, M.D.Garcia, Bioorg. Med. Chem. Lett. 10 (2000) 2033–2036.
[3] B. Berkarda, H. Koyuncu, G. Soybir, F. Baykut, Res. Exp. Med. 198 (1998) 93–99.[4] W.S. Chang, Y.J. Lee, F.J. Lu, H.C. Chiang, Anti-cancer Res. 13 (1993) 2165–2170.[5] Y. Miyake, K. Shimoi, S. Kumazawa, K. Yamamoto, N. Kinae, T. Osawa, J. Agric. Food
Chem. 48 (2000) 3217–3224.[6] C. Morand, C. Dubray, D. Milenkovic, D. Lioger, J.F. Martin, A. Scalbert, A. Mazur, Am.
J. Clin. Nutr. 93 (2011) 73–80.[7] S.L. Hwang, P.H. Shih, G.C. Yen, J. Agric. Food Chem. 60 (2012) 877–885.[8] I.L.F. Nielsen, W.S.S. Chee, L. Poulsen, E. Offord-Cavin, S.E. Rasmussen, H. Frederiksen,
M.D. Enslen, D. Barron, M.N. Horcajada, G. Williamson, J. Nutr. 136 (2006) 404–408.[9] K.S. Kubena, J. Durlach, Magnes. Res. 3 (1990) 211–219.
[10] M.E. Maguire, Met. Ions Biol. 26 (1990) 135–153.
[11] C.B. Black, J.A. Cowan, Magnesium-dependent enzymes in general methodology, in:J.A. Cowan (Ed.), The Biological Chemistry of Magnesium, VCH Publishers, NewYork, 1995, pp. 159–183.
[12] W.B. Weglicki, T.M. Phillips, I.T. Mak, M.M. Cassidy, B.F. Dickens, R. Stafford, J.H.Kramer, Ann. N. Y. Acad. Sci. 723 (1994) 246–257.
[13] N. Masumoto, K. Tasaka, J. Mizuki, A. Miyake, O. Taniza-wa, Biochem. Biophys. Res.Commun. 182 (1992) 906–912.
[14] D. Maulik, S. Zanelli, Y. Numagami, S.T. Ohnishi, O.P. Mishrac, M.Delivoria-Papadopoulos, Brain Res. 817 (1999) 117–122.
[15] K.I. Fritz, O.P. Mishra, M. Delivoria-Papadopoulos, Neuroscience 92 (1999) 685–692.[16] W. Kohn, L. Sham, Phys. Rev. 140 (1965) A1133.[17] M.J. Frisch, G.W. Trucks, H.B. Schlegel, G.E. Scuseria, M.A. Robb, J.R. Cheeseman, G.
Scalmani, V. Barone, B. Men-nucci, G.A. Petersson, H. Nakatsuji, M. Caricato, X. Li,H.P. Hratchian, A.F. Izmaylov, J. Bloino, G. Zheng, J.L. Sonnen-berg, M. Hada, M.Ehara, K. Toyota, R. Fukuda, J. Hasega-wa, M. Ishida, T. Nakajima, Y. Honda, O.Kitao, H. Nakai, T. Vreven, J.A. Montgomery Jr., J.E. Peralta, F. Ogliaro, M. Bearpark,J.J. Heyd, E. Brothers, K.N. Kudin, V.N. Staroverov, R. Kobayashi, J. Normand, K.Raghavachari, A. Rendell, J.C. Burant, S.S. Iyengar, J. Tomasi, M. Cossi, N. Rega, J.M.Millam, M. Klene, J.E. Knox, J.B. Cross, V. Bakken, C. Adamo, J. Jaramillo, R.Gomperts, R.E. Stratmann, O. Yazyev, A. Austin, J.R. Cammi, C. Pomelli, J.W.Ochterski, R.L. Martin, K. Morokuma, V.G. Zakrzewski, G.A. Voth, P. Salvador, J.J.Dannenberg, S. Dapprich, A.D. Daniels, Ö. Farkas, J.B. For-esman, J.V. Ortiz, J.Cioslowski, D.J. Fox, Gaussian 09, Revision A. 02, Gaussian, Inc., Wallingford, CT,2009.
[18] C. Lee, W. Yang, R.G. Parr, Phys. Rev. B37 (1998) 785–789.[19] A.D. Becke, J. Chem. Phys. 98 (1993) 5648–5652.[20] Origin, 7.5 ed. OriginLab Corporation, Northampton, 2006.[21] S. Ghadimi, S. Mousavi, Z. Javani, J. Enzyme Inhib. Med. Chem. 23 (2008) 213–217.[22] C.C. Winterbourn, Biochem. J. 182 (1979) 625–628.[23] L. Zhu, J. Huang, S.-Y. Han, Z. An, Acta Crystallogr. E64 (2008) m683.[24] T. Sieranski, R. Kruszynski, J. Therm. Anal. Calorim. 109 (2012) 141–152.[25] K.R. Markham, Techniques of Flavonoids Identification, Academic Press, London,
1982.[26] H. Serra, T. Mendes, M.R. Bronze, L.A. Simplício, Bioorg. Med. Chem. 16 (2008)
4009–4018.[27] K. Krumova, P. Oleynik, P. Karam, G.J. Cosa, Org. Chem. 74 (2009) 3641–3651.[28] C. Costentin, M. Robert, J.-M. Savéant, Chem. Rev. 108 (2008) 2145–2179.[29] H.M. Peng, R.D. Webster, J. Org. Chem. 73 (2008) 2169–2175.[30] (a) D. Horter, J.B. Dressman, Adv. Drug Deliv. Rev. 46 (2001) 75–87;
(b) A. Leo, C. Hansch, D. Elkins, Chem. Rev. 71 (1971) 525.[31] M.A. Sanchez, C. Romero, A. Manjon, J.L. Iborra, Bio-tech. Letters 9 (1987)
871–874.[32] R.-M. Han, Y.-X. Tiam, Y. Liu, C.-H. Chen, X.-C. Ai, J.-P. Zhang, L.H. Skibsted, J. Agric.
Food Chem. 57 (2009) 3780–3785.[33] T.-R. Li, Z.-Y. Yang, B.-D. Wang, Chem. Pharm. Bull. 55 (2007) 26–28.