structural changes in the znf – bi o – geo glass system...
TRANSCRIPT

Structural changes in the ZnF2 – Bi2O3 – GeO2 glass system
doped with Fe2O3 by spectroscopic and dielectric
investigations
4.1 Introduction:
Glasses doped with transition metal ion, Fe2O3 are used in
electrochemical, electronic and electro-optic devices [1]. Sound investigations
were carried out previously the environment of iron ion in various inorganic
glass systems viz; silicate, borate, phosphate and telluride glasses [2-5]. Iron
ions are considered as effective and useful dopant ions because of the fact that
they exist simultaneously in different valence states in the glass network as
Fe3+ with both tetrahedral and octahedral and as Fe2+ octahedral
coordination[6]. Fe3+ and Fe2+ both are paramagnetic ions; Fe2+ ions posses a
large magnetic anisotropy due to its spin-orbit interaction of the 3d orbital
where as such anisotropy of Fe3+ ions is small since the anisotropic energy of
Fe3+ ions is small as the angular momentum of these ions is zero[7]. Several
studies were reported on the valence states and influence of iron ion on the
physical and electrical properties of different glass systems doped with Fe2O3
transition metal oxide[8-10] but most of them are related to borate, phosphate
and silicate glass formers, few studies are found on germanate glasses.
Germanate glasses mixed with heavy metal oxides are very promising
materials for IR transmitting windows [11], non-linear optics, and laser devises

122
[12]. For the present investigation germinate glasses mixed with heavy metal
oxide are chosen due to their remarkable optical properties like high refractive
index, dispersion and transmission in the IR region [13, 14] germanium is
imparted to the present investigation. Glasses containing heavy metal oxides
(HMO) are found to be excellent candidates for IR transmission compared with
conventional glasses [15, 16]. Bismuth oxide glasses have wide range of
applications in the field of optical and electronic devices, thermal and
mechanical sensors, reflecting windows [17, 18]. Bi2O3 participate in the glass
structure with two different coordinations as (BiO3) pyramidal which acts as
glass former and as BiO6, octahedral units act as modifier [19-21]. Recently,
spectroscopic and dielectric studies on the VA group elements mixed with
germanate glasses doped with CuO have been reported [22] from our
laboratory in which Bi2O3 effectively modified the germanate glass network
among VA group elements. Fluoride glasses typically have infrared absorption
edge wavelengths in the range 6 to 8 µm; with the addition of ZnF2 (metal
fluoride) to heavy metal germanate glasses widens their transmitting range into
the infrared [23].
NIR properties of GeO2 – PbO – Bi2O3 glasses doped with Yb3+ ions
were reported by Kasaab et al [24]. Salem and Mohammad [25] studied dc, ac
and dielectric properties of Bi2O3 – GeO2 – MoO3 glasses and observed that
molybdenum ions hinder the electron motion. Srinivasa Rao et al [26] have
reported the structural properties of ZnF2-Bi2O3 – P2O5 glass system.

123
The objective of the present study is aimed to find out the structural
changes in ZnF2 – Bi2O3 – GeO2 glass network doped with different
concentrations of Fe2O3 by means of spectroscopic and dielectric studies. The
prepared glasses were characterized by XRD; Analysis of spectroscopic
properties (viz FTIR, Raman, optical absorption, EPR) and dielectric properties
(viz; dielectric constant ε', loss tanδ and ac conductivity σac) over a wide range
of frequency has been reported in this chapter.
The glass samples with following composition were prepared using
melt-quenching method. In the present study the glass system 20ZnF2 –
40Bi2O3 – (40-x) GeO2: x Fe2O3; 0 ≤ x ≤ 2.5 wt% in steps of 0.5 wt% were
prepared using analytical grade reagents of GeO2, Bi2O3, ZnF2 and Fe2O3
(Sigma Aldrich 99.99% pure) in suitable proportions. The mechanically
homogenized mixtures were melted in a silica crucible at 1050 oC for 20
minutes until a bubble free liquid is formed. The melt was then poured on a
brass mould and subsequently annealed at 400 oC. Transparent yellow (pure)
and brown (doped) glasses are obtained; color of prepared glasses increases
with increase in the dopant concentration.
The prepared samples were labelled as
F0: 20ZnF2 – 40Bi2O3 – 40GeO2
F1: 20ZnF2 – 40Bi2O3 – 39.5GeO2: 0.5 Fe2O3
F2: 20ZnF2 – 40Bi2O3 – 39GeO2: 1.0 Fe2O3
124
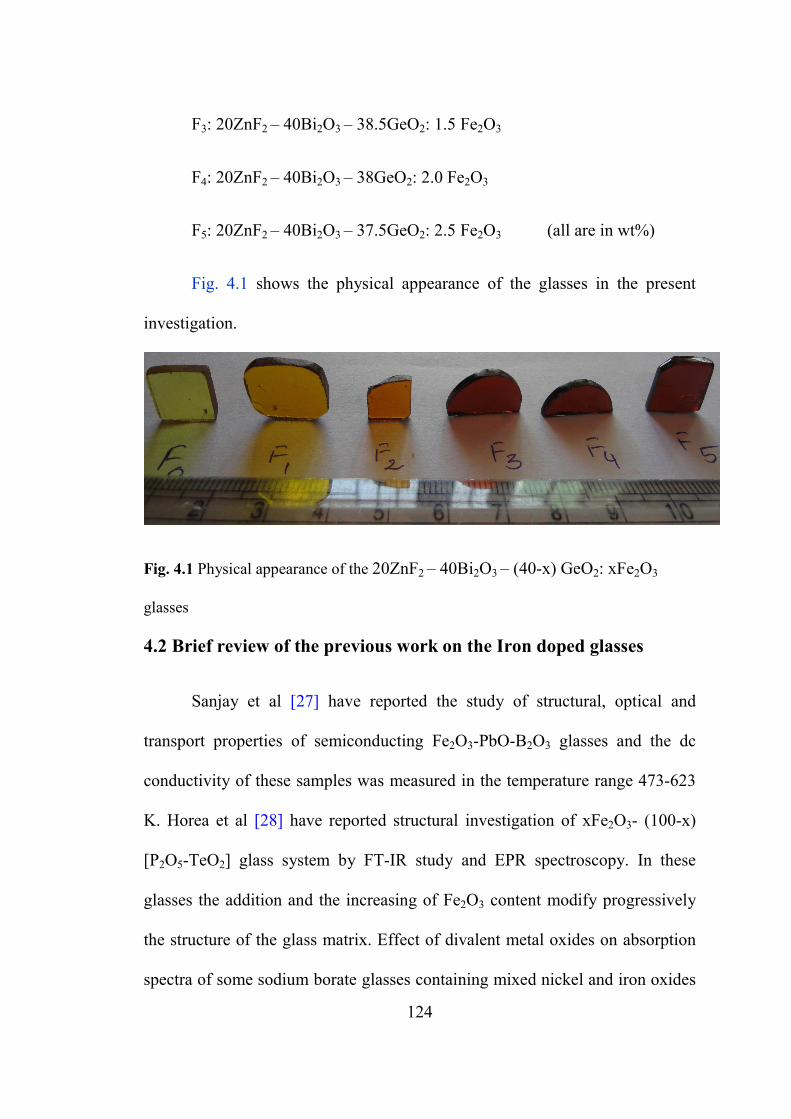
F3: 20ZnF2 – 40Bi2O3 – 38.5GeO2: 1.5 Fe2O3
F4: 20ZnF2 – 40Bi2O3 – 38GeO2: 2.0 Fe2O3
F5: 20ZnF2 – 40Bi2O3 – 37.5GeO2: 2.5 Fe2O3 (all are in wt%)
Fig. 4.1 shows the physical appearance of the glasses in the present
investigation.
Fig. 4.1 Physical appearance of the 20ZnF2 – 40Bi2O3 – (40-x) GeO2: xFe2O3
glasses
4.2 Brief review of the previous work on the Iron doped glasses
Sanjay et al [27] have reported the study of structural, optical and
transport properties of semiconducting Fe2O3-PbO-B2O3 glasses and the dc
conductivity of these samples was measured in the temperature range 473-623
K. Horea et al [28] have reported structural investigation of xFe2O3- (100-x)
[P2O5-TeO2] glass system by FT-IR study and EPR spectroscopy. In these
glasses the addition and the increasing of Fe2O3 content modify progressively
the structure of the glass matrix. Effect of divalent metal oxides on absorption
spectra of some sodium borate glasses containing mixed nickel and iron oxides

125
have reported by El-Betal et al [29]. The electrochemical behaviour of
Fe2+/Fe3+ redox couple in sodium disilicate glasses has been studied by Mariac
et al. [30]; from the results they have concluded that Fe3+ acts both as network
former and network modifier while Fe2+ acts as network modifier. Stefan and
Simon [31] have reported EPR of Fe3+ ions doped in bismuth borate glasses
and their studies indicate various sites for Fe3+ ions in environments
characterized by different crystalline field intensities. Baiocchi et al. [32]
studied the optical and magnetic properties of iron ions in lead silicate glasses;
they have assigned the bands observed in the optical absorption spectrum to the
corresponding transitions by taking into account the selection rules and on the
basis of ligand field energy calculations. They have also concluded that the
four-fold coordination of Fe3+ ions is more common than the six fold in silicate
glasses. Dance et al [33] have investigated ESR of Fe3+ ions in fluoro aluminate
glasses and attributed the single line centered at g=4.3 in the ESR spectrum to
the presence of Fe3+ ions in sites of fully rhombic symmetry. Hazra and Ghosh
[34] studied structural and physical properties of Fe2O3 doped lead vanadate
glasses; they concluded that there is a strong role of iron both in the glass
network and in the conduction mechanism of the glasses.
Muralidhara [35] et al. carried out electron paramagnetic resonance
(EPR) and optical absorption spectral investigations on Fe3+ ions doped sodium
boro phosphate glasses. The optical absorption spectrum of sodium boro
phosphate glasses exhibits four bands characteristics of Fe3+ ions in an

126
octahedral symmetry. The value of inter-electronic repulsion parameter B
obtained in the present work suggests that the bonding is moderately covalent.
Pascuta [36] et al. Structural investigation of xFe2O3 - (100 - x) [3B2O3 - SrO]
glass system, with 0 ≤ x ≤ 40 mol%, was performed by means of X-Ray
diffraction (XRD), Fourier transform infrared (FTIR) and Raman spectroscopy.
At higher concentrations the iron ions determinate the break of regulate glass
network structure and determines the appearance of BO4 isolated tetrahedral.
Therefore, with the increasing of iron ions concentration, the structure of the
glasses is modifying and the number of non-bridging oxygens in these glasses
increases. Spectroscopic studies of Fe2O3 and CeO2 doped ZnO–Bi2O3–B2O3
glasses were carried out by Singh et al. [37]. From EPR and optical studies it is
observed that iron ions are present in trivalent state with distorted octahedral
symmetry. The EPR spectra of Fe3+ ions exhibit two resonance signals at g ≈
4.2 and g ≈ 6.4 which are attributed to Fe 3+ ions in rhombic and axial
symmetry sites, respectively. The optical bandgap (Eopt) decreases with
increase of transition metal. Mixed alkali effect in Li2O–Na2O–B2O3 glasses
doped with Fe2O3 was studied by Chakradhar et al. [38]. The EPR spectra in
these glasses exhibit three resonance signals at g = 7.60, 4.20 and 2.02. The
resonance signal at g = 7.60 has been attributed to Fe3+ ions in axial symmetry
sites whereas the resonance signal at g = 4.20 is due to isolated Fe3+ ions in
rhombic symmetry site. The resonance signal at g = 2.02 is due to Fe3+ ions
coupled by exchange interaction. The existing theories of MAE have been

127
proposed mainly on the basis of transport properties in mixed alkali glasses,
particularly electrical. Fe concentration dependent transport properties of LiI–
AgI–B2O3 glass system were reported by Srilatha et al. [7]. Optical absorption
and ESR studies have indicated that iron ions exist in Fe2+ state in addition to
Fe3+ state. DC conductivity is increased up to 0.9 mol% of Fe2O3 and beyond
that the conductivity is found to decrease. The analysis of the DC conductivity
results indicated that there is a mixed conduction (both ionic and electronic)
and the ionic conduction seems to prevail over polaron hopping in the glasses
containing Fe2O3 more than 0.9 mol%.
Srinivasarao et al. [39] studied the role of iron ions on the structure and
physical properties of PbO – As2O3 glasses by means of DTA, optical
absorption, FTIR, magnetic susceptibility and dielectric parameters. The
optical absorption measurements indicate iron ion in Fe3+ state in lower
concentrations and Fe2+ state when the concentration is beyond 0.25%.
Dielectric and studies on physical properties indicate that the structure of PbO
– As2O3 glass is more stable at low concentration of Fe2O3. Raghavaiah et al.
[40] studied the thermoluminescence studies on PbO–Sb2O3–As2O3 glasses
doped with iron ions. Thermoluminescence (TL) studies coupled with data on
optical absorption, ESR and magnetic susceptibility measurements have been
carried out. The TL light output has been observed to decrease with increase in
the concentration of Fe2O3 up to 0.6 mol%. For further increase in the content
of Fe2O3, the TL light output has been observed to increase. Crystallization and

128
the physical properties of Fe2O3-induced lead arsenate glasses are studied by
Nagarjuna et al. [41] Optical absorption, FTIR, ESR and magnetic
susceptibility measurements were also carried out. The optical absorption
studies together with ESR and magnetic susceptibility measurements indicated
the dominant presence of iron ions in the trivalent state when the concentration
of nucleating agent Fe2O3 is less than 0.3 mol%. The analysis of the FTIR
spectra indicated a gradual transformation of iron ions from tetrahedral sites to
octahedral
4.3. Characterization
4.3.1 X- Ray diffraction
The absence of sharp Bragg peaks from X-ray diffraction pattern of all
glass samples as shown in Fig. 4.2 confirms the amorphous nature of the
prepared glasses.
4.3 Physical parameters
The measured density value of F0 is 5.9324 g/cm3 and it is found to increase
gradually with increase in the concentration of Fe2O3 as presented in Table 4.1.
Simultaneously the molar volume is decreased from F0 to F5. From the
measured values of density ‘ρ’ and calculated average molecular weight M of
the glasses, some physical parameters such as mean iron ion concentration Ni,
mean iron ion separation Ri, and polaron radius Rp in the glass network
evaluated and also presented in Table 4.1.

129
10 20 30 40 50 60 70 80
F3
F5
F4
F2
F1
Fo
Cou
nts
2θ
Fig. 4.2 XRD patterns of ZBiG glasses doped with Fe2O3

130
Table 4.1
Physical Parameters of ZBiG glasses doped with Fe2O3.
Sample x
wt%
M ρ (g/cm3)
(±0.0001)
Vm
(m3/mol)
(±0.001)
Nix1021
ions/cm3
Iron ion
separation
Ri (Ǻ)
Polaron
radius
Rp (Ǻ)
F0 0 248.918 5.9234 42.022 -- -- --
F1 0.5 249.192 5.7701 43.186 2.79 7.10 2.86
F2 1 249.467 5.7431 43.437 5.56 5.64 2.27
F3 1.5 249.743 5.7125 43.718 8.29 4.93 1.99
F4 2 250.019 5.6787 44.027 11.00 4.49 1.81
F5 2.5 250.294 5.6297 44.459 13.63 4.18 1.68

131
4.4 Results
4.4.1 Optical absorption spectra
Optical absorption spectra of ZBiG glasses doped with Fe2O3 recorded
at room temperature in the wave length region 200-1400 nm are shown in Fig
4.3. From the figure it is clear that pure sample F0 shows two small peaks
observed at 630 nm and 860 nm and the samples doped with Fe2O3 show two
peaks at about 831 nm and 964 nm. The UV absorption edge or cut off
wavelength, λc of F0 sample is observed at 386 nm. The cutoff wavelength is
found to be increased from F0 to F5 samples.
Fig. 4.3 Optical absorption spectra of ZBiG glass sample doped with Fe2O3.
400 600 800 1000 1200 14000.0
0.2
0.4
0.6
0.8
1.0
400 600 800 10000.10
0.15
0.20
0.25
0.30
860
630
F0
681.5F3
F2
F1
5Eg
5T2g
F4
F3
F2
F1
F0 F
5
Abs
orpt
ion(
cm-1)
Wavenumber(cm-1)

132
Table 4.2
Cutoff wavelength (λc), Optical band gap (Eg) and Urbach energy (∆E) of
ZBiG glasses doped with Fe2O3.
Sample λc (nm)
(±0.1)
band position (nm) (±0.1) Eg (eV)
(±0.001)
∆E (eV)
(±0.001) 6A1 → 4T1
2B1g→2B2g
F0 386 -- -- 2.848 0.201
F1 422.5 831 964 2.712 0.163
F2 438 829 963 2.663 0.202
F3 448.5 825 964 2.611 0.227
F4 465.5 825 964 2.556 0.238
F5 469 825 967 2.544 0.248
From Tauc’s plots, drawn between hν and (αhν)1/2 as shown in Fig. 4.4,
optical band gap (Eg) of all the samples are determined by the extrapolation of
the linear portion of the curve to the x-axis [(αhν)1/2 = 0]. The data pertinent to
cut off wavelength (λc), absorption band position and band gap (Eg) energies
for the glasses under investigation are presented in Table 4.2.

133
2.0 2.2 2.4 2.6 2.8 3.0 3.20
2
4
6
8
10
F5 F
4F
3 F2 F
1 F0
(αhν
)1/2 (c
m-1eV
)1/2
hν(eV)
Fig. 4.4 Tauc’s plots of ZBiG glasses doped with Fe2O3
The absorption coefficient α(ν) in Urbach’s exponential tail region is
evaluated from the following equation
α(ν) = C exp (hν/∆E) -- (1)
Where C is a constant and ∆E is the Urbach’s energy defined as the
energy gap between localized tail states in the forbidden band gap [42]. Urbach
tail plots drawn between ln(α) and hν are shown in Fig. 4.5. From these plots
∆E values are evaluated by taking the reciprocal of the slopes of the linear
portion of the curves and are also presented in Table 4.2. Inset of Fig. 4.5

134
shows the variation of Eg as well as ∆E with respect to dopant concentration of
Fe2O3.
2.0 2.2 2.4 2.6 2.8 3.0 3.20
1
2
3
4
5
0 1 2 3
0.18
0.24
Conc. of Fe2O
3
∆E
(eV
)
2.6
2.7Eg(eV
) F5
F4
F3
F2
F1
F0
ln(α
)
hν(eV)
Fig. 4.5 Urbach energy (∆E) of ZBiG glasses doped with Cobalt. Inset of the
figure shows the variation of Urbach energy (∆E) and Optical band gap (Eg)
with concentration of Fe2O3.
4.4.2 EPR spectra
EPR spectra of ZBiG glasses doped with Fe2O3 recorded at room
temperature are shown in Fig. 4.6. All samples show an intense signal at g =
4.2±0.1 and a broad resonance peak at g = 2.1±0.1 along with a shoulder peak

135
in the region g = 6.8±0.1. The intensity of signals at 4.2 and 6.8 decreases with
increase in the concentration of Fe2O3; whereas the intensity of the signal at 2.1
remains same up to F4 and the signal changes to an intense peak in F5 sample.
0 250 500
g = 6.8
g = 4.2
g = 2.1
F5
F4
F3
F2
F1
Firs
t Der
ivat
ive
of A
bsor
ptio
n
Magnetic Field(mT)
Fig. 4.6 EPR signals of ZBiG glasses doped with Fe2O3.

136
4.4.3 FTIR spectra
FTIR spectra of all glasses recorded in order to identify the structural
units in the glass network are shown in Fig. 4.7. The observed vibrational
bands and their corresponding assignments are given in Table 4.3. The glass
samples show four vibrations around 945 nm, 745 nm, 452 nm and 428 nm.
1100 1000 900 800 700 600 500 400
945 745 452
428
F5
F4
F3
F2
F1
F0
%T
ν(cm-1)
Fig. 4.7 FTIR spectra of ZBiG glasses doped with Fe2O3.

137
Table 4.3
Assignment of absorption bands in the infrared spectra (with a probable error
of ±0.1cm-1) of the ZBiG glasses doped with Fe2O3.
F0 F1 F2 F3 F4 F5 Assignment
428 422 413 423 417 417 Bi-O bonds in BiO6 units
452 471 466 471 469 472 Bi-O bonds in distorted BiO6 octahedra units and ZnO4 units
745 754 750 751 751 749 Bi-O symmetrical stretching of BiO3 and Ge – O– asymmetric stretching of GeO6 units
945 958 959 961 961 963 Bi-O stretching vibrations in BiO6 units and GeO4 units
4.4.4 Raman Spectra
Fig. 4.8 shows the Raman spectra of the all glass samples under
investigation. The main Raman feature shifts (RF) and the corresponding bond
vibrations are present in Table 4.4. A broad and intense RF is observed around
391 cm-1and at 782 cm-1 with feeble features around ~ 276, ~ 555, ~ 654 and ~
891 cm-1. By the addition of Fe2O3 the area of RF782 is found to be decreased,
where as the area under Raman feature at 391 cm-1 is observed to increase.

138
1000 900 800 700 600 500 400 300 200
276
555891782
654
391
Ram
an In
tens
ity (a
.u.)
F5
F4
F3
F2
F1
F0
ν(cm-1)
Fig. 4.8 Raman spectra of ZBiG glasses doped with Fe2O3.

139
Table 4.4
Assignment of Raman Features (with a probable error of ±0.1cm-1) of ZBiG
glasses doped with Fe2O3.
F0 F1 F2 F3 F4 F5 Assignment
276 282 288 284 280 284 Bi-O-Bi stretching vibrations in distorted BiO6 units
391 391 399 397 397 395 Bi-O-Bi bending vibrations
-- -- 458 458 -- 471 Symmetrical stretching vibrations of oxygen in Bi – O – Ge and Ge – O – Ge along with ZnO4 units
555 -- 552 554 560 575 Bi – O vibrations in distorted BiO6 units
654 -- 649 639 654 686 Ge – O – Ge bending modes associated with ring strains
782 781 780 781 771 792 Symmetric stretching vibrations of Ge – O– bonds in GeO4 units
891 875 873 883 898 896 Ge – O– bonds associated with Q2 GeO4 units and Ge –O – Ge asymmetrical stretching
-- 932 928 943 939 -- Ge – O– bonds associated with Q3 GeO4 units
140
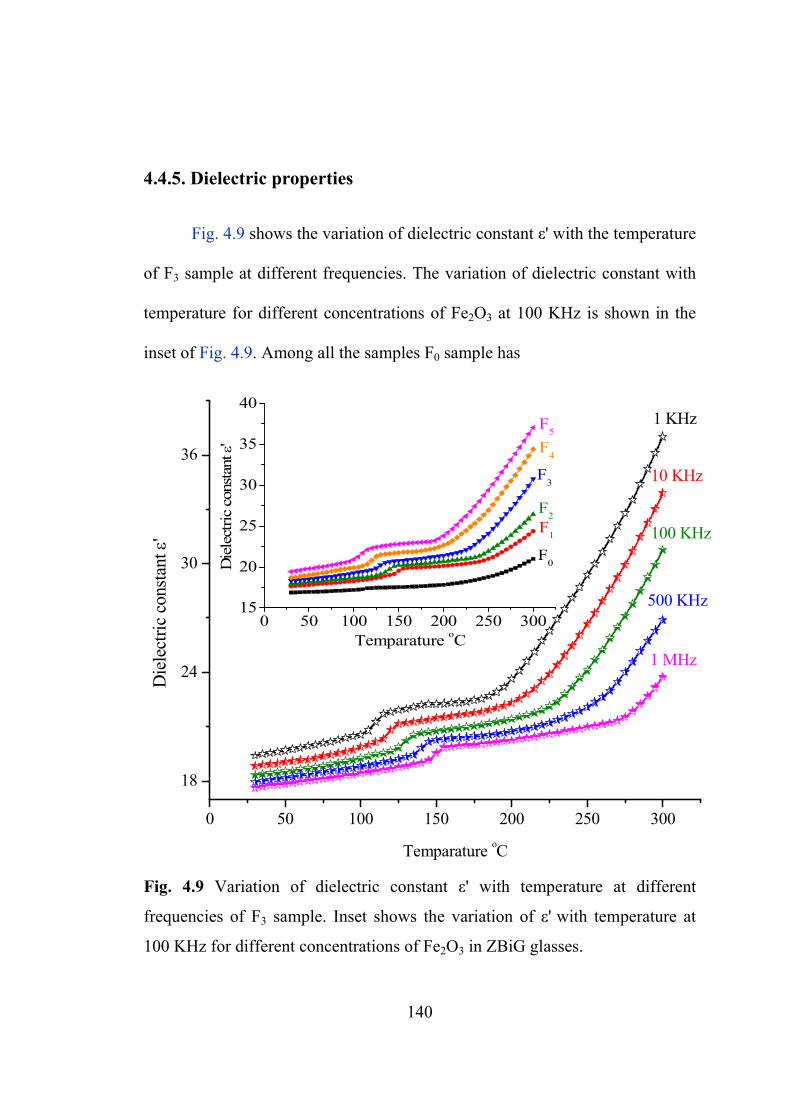
4.4.5. Dielectric properties
Fig. 4.9 shows the variation of dielectric constant ε' with the temperature
of F3 sample at different frequencies. The variation of dielectric constant with
temperature for different concentrations of Fe2O3 at 100 KHz is shown in the
inset of Fig. 4.9. Among all the samples F0 sample has
0 50 100 150 200 250 300
18
24
30
36
0 50 100 150 200 250 30015
20
25
30
35
40
F0
F1
F2
F3
F4
F5
Die
lect
ric c
onst
ant ε
'
Temparature oC1 MHz
500 KHz
100 KHz
10 KHz
1 KHz
Die
lect
ric c
onst
ant ε
'
Temparature oC
Fig. 4.9 Variation of dielectric constant ε' with temperature at different
frequencies of F3 sample. Inset shows the variation of ε' with temperature at
100 KHz for different concentrations of Fe2O3 in ZBiG glasses.

141
exhibited minimum value 13.78 for the dielectric constant ε' at 1 MHz and at
the temperature 30 oC. The sample F5 has shown the maximum value 44.45 for
ε' at 1 KHz and at the temperature 300 oC.
The variation of dielectric loss(tanδ) with temperature at 100 KHz for
different concentrations of Fe2O3 is shown in Fig. 4.10 and its inset shows the
temperature dependence of loss(tanδ) at different frequencies of F5 sample. The
curves of both pure and Fe2O3 doped glasses exhibit distinct maxima in the
dielectric loss(tanδ) verses temperature plot and such maxima are found to be
shifted towards lower temperature region with increase in the concentration of
Fe2O3. Such maxima in the dielectric loss (tanδ), is the characteristic of
relaxation of the dipoles present in the sample. Further, the variation of
dielectric loss with temperature for different concentrations of Fe2O3 indicates
a gradual increase in the broadening of relaxation curves. At the same time
(tanδ)max of relaxation curves is found to be increased with increase in the
concentration of Fe2O3. The effective activation energy, wd for all glass
samples is calculated for all the samples [26] using the following equation
f = f0 exp (-Wd/KT) -- (2)
Where f is the frequency and f0 is a constant. The summary of data
pertinent to loss (tanδ), activation energy for dipoles (A.E.) and breakdown
strength for different concentrations of Fe2O3 are presented in Table 4.5. From
observations, it is found that wd is maximum for F0 sample and is decreased
with increase in Fe2O3 doping. Since insulating strength of the glass sample

142
depends upon the electric field applied on it, the dielectric breakdown strength
of the samples is determined. The value of the breakdown strength 12.92
KV/cm is obtained for F0 sample and its value is found to be decreased with
increase in the Fe2O3 concentration.
0 50 100 150 200 250 300
0.04
0.06
0.08
0.10
0 50 100 150 200 250 3000.03
0.06
0.09
0.12
1 MHz
500 KHz
100 KHz
10 KHz
1 KHz F5
F4
F3
F2
F1
F0
tanδ
Temparature oC
Temparature oC
tanδ
Fig. 4.10 Variation of dielectric loss Tanδ with temperature at 10 KHz for
different concentrations of Fe2O3 in ZBiG glasses. Inset shows the variation of
loss(tanδ)with temperature at different frequencies of F5 sample.
The a.c. conductivity values for all glasses at different temperatures and
frequencies are evaluated [26] using the following equation
σac = ωε'ε0tanδ -- (3)

143
Where ω is the angular frequency, ε0 is the dielectric constant of
vacuum. The variation of conductivity with 1/T of all investigated glasses at 1
KHz is shown in Fig. 4.11 and its inset shows the variation of conductivity with
1/T at different spot frequencies of F1 sample.
Table 4.5
Summary of data on dielectric loss of ZBiG glasses doped with Fe2O3 at 1
KHz.
Sample (Tan δ)max.ave
x(10-1)
Temp. region of relaxation
AE for dipoles
(eV)
Breakdown Strength (kV/cm)
F0 -- -- -- 12.92
F1 0.3625 125-165 3.55 12.37
F2 0.378 110-155 3.38 12.09
F3 0.406 95-145 3.22 11.72
F4 0.425 85-145 3.06 11.28
F5 0.453 75-150 2.91 11.16

144
1.6 1.8 2.0 2.2 2.4 2.6 2.8 3.0 3.2 3.4
1E-7
1.6 2.0 2.4 2.8 3.21E-8
1E-6
1E-4 1 MHz
500 KHz
100 KHz
10 KHz
1 KHz
F0
F1
F2
F3
F4
F5
1000/T
σac
Fig. 4.11 Variation of σac with 1000/T at 1 KHz for different concentrations of Fe2O3
in ZBiG glass samples and inset shows the variation of σac with 1000/T for the Sample
F1.
The activation energy (A.E.) for conduction in the linear region of logσac with
1/T plots, observed at higher temperature, has been evaluated. Such σac values
at 70o C, density of defect energy states N(EF) and A.E. values for conduction
of all the glass matrices are incorporated in Table 4.6.

145
Table 4.6 Summary of data on ac conductivity of ZBiG glasses doped with Fe2O3 at 1 KHz.
4.5 Discussion:
ZnF2 – Bi2O3 – GeO2 glass containing iron ions is a complex
composition and an admixture of modifier, intermediates and network formers.
The observed decrease in the density and increase of molar volume by the
doping of Fe2O3 is ascribed to the following: (i) due to the gradual decrease in
the concentration of GeO4 structural units and simultaneous increase in Fe3+
(0.49 Å) and Fe2+ (0.78 Å) ion concentration in the composition (ii) formation
of octahedral Ge4+ [0.53 Å] ions at the expense of tetrahedral Ge4+ [0.39 Å]
Sample σa.c at 70oC x(10-8)
( Ωcm)-1
N(EF) x 1019 (eV-1/cm3) AE for conduction
(eV) Austin Butcher Pollak
F0 3.10 3.05 1.27 3.10 0.546
F1 3.52 3.25 1.36 3.30 0.451
F2 3.81 3.38 1.41 3.44 0.415
F3 4.27 3.58 1.49 3.64 0.357
F4 4.89 3.83 1.59 3.89 0.314
F5 5.94 4.22 1.76 4.29 0.305

146
ions in the glass network; since the density of a glass is sensitive to the ionic
size, atomic weight and amount of different elements present [23, 43]. From
the measured values of density ‘ρ’ and calculated average molecular weight
M of the glasses, physical parameters such as mean iron ion concentration Ni,
mean iron ion separation Ri, and polaron radius Rp of the glasses are evaluated
and presented in Table 4.1.
The presence of absorption peaks at 630 nm and 860 nm are ascribed to
bismuth radical Bio in Bi2O3. At higher temperature due to thermal effect Bi3+
ions may be reduced to Bi2+ → Bi+ → Bio bismuth radicals. Hence, the
observed absorption bands around 630 nm and 860 nm are ascribed to 3P0 →
1D2 and 3P0 → 3P2 transitions of Bi+ ions [42]. A small peak observed at around
681.5 nm in doped samples from F1 to F3 due to the presence of bismuth
radicals.
The absorption peak observed at 831 nm for F1 sample is blue shifted
with increase in concentration of Fe2O3. Using-Tanabe diagrams for d5 ions the
peak at 831 nm is due to 6A1 → 4T1 spin forbidden transitions of Fe3+ ions [44].
The observed red shift from the literature is perhaps due to the presence of high
polarizing nature of bismuth radicals which generally yield high crystal field
splitting. The band observed at 964 nm is ascribed to 5T2g → 5Eg transition of
Fe2+ (d6) ions [45]. Based on the selection rules and ligand field calculations
the first band at 831 nm is due to FeO6 group and the first band at 964 nm is
due to FeO4 group [44]. The Fe3+ ion sites considered as interaction between its

147
external orbital and the p-orbital of the neighbouring oxygens [46]. When the
concentration of Fe2O3 increased, the intensity of the peak at 964 nm is
increased at the expense of peak around 831 nm. Further the Fe2+ ions occupy
only interstitial positions, since the ratio of cation-oxygen radii is 0.63 Ǻ for
Fe2+ ion, which is far from the value of 0.19 Ǻ to be possessed by an ion to
occupy tetrahedral or substitutional sites [47] and create more disorder by
creating dangling bonds in the glass network.
The absorption edge λc observed at 386 nm for F0 sample and increases
with Fe2O3 concentration suggests that the increase in number of non-bridging
oxygens (NBOs). This increase leads to degree of localization of electrons and
hence the donor centres in the glass matrix. The study of variation of short
wave length absorption edge (SWAE) and optical band gap in oxide glasses
give vital information to understand the electronic band structure. The ionic
size of iron ion (Fe3+ - 0.49 Ǻ, Fe2+ - 0.78 Ǻ ) is larger than those of Ge ions
(GeO4 – 0.39 Ǻ, GeO6 – 0.53 Ǻ ). Therefore bond length of Fe-O is greater
than bond length of Ge-O and hence doping of Fe2O3 effectively opens the
glass network. The addition of Fe2O3 increases the average bond length which
narrows the optical band gap [48]. Among the doped samples F1 shows
minimum tail energy and increased with concentration of Fe2O3. The increase
in Urbach energy is reasonably explained because of the inducement of defects
like fluctuations in bond angle distortions and wrong bonds. Hence, the density
of localized states N(EF) of these defects increases and leads to tailing of the

148
states into the gap at the band edges. This tailing also gives the evidence for
decrease in Eg.
EPR spectra of ZnF2 – Bi2O3 – GeO2: Fe2O3 glasses exhibited two
signals centred at g = 4.2 and 2.1. The signal at g = 4.2 arises from the
tetrahedral environment of Fe3+ ions and the signal at g = 2.1 arises due to Fe3+
– O – Fe3+ spin-pair [59-51] and the shoulder peak at g = 6.8 is attributed to
the isolated Fe3+ ions in rhombic and axial symmetry sites [52-55]. These large
g values arise due to presence of certain symmetry elements in the glass matrix.
The theory of these large g values is usually expressed by the spin-Hamiltonian
[56]
2 2 2( 1)( )
3Z x y
S SH g BS D S E S Sβ
+ = + − + − --- (4)
Where S = 5/2. Here D and E are the axial and rhombic structure parameters
respectively, λ = E/D lies within the limits 0 < λ < 1/3 [57]. The iron ions in
Fe3+ state belong to d5 configuration with 6S as the ground state in the free ion
and there is no spin-orbit interaction [58]; when Fe3+ ions placed in a crystal
field environment, the 6S ground state splits into three Kramer doublets |±1/2>,
|±3/2> and |±5/2>. The resonance signal at g = 4.2 arises due to the middle
Kramer doublet |±3/2> [59]. The decay of the intensity of EPR signals at g =
4.2 and 6.8 indicates the decrease in the concentration of Fe3+ ions in the glass
network. The intense peak at g = 2.1 for F5 sample arises with further increase

149
in concentration of Fe2O3 and is ascribed to dipole – dipole interactions due to
Fe3+ ions in the sites of less distorted octahedral field.
The inferences drawn from the analysis of optical absorption and EPR
spectra suggest that the trivalent iron ions decrease with increase in the
concentration of Fe2O3 and the redox ratio (conc. of Fe2+/conc. of Fe3+)
increases. Hence, the modification of the glass network increases.
FTIR spectra are helpful to understand the structural changes in the
present investigation. Researchers report that vitreous GeO2 exhibits IR
transmissions at ~ 915 cm-1, ~ 750 cm-1 and ~ 584 cm-1 and are assigned to
asymmetric stretching vibrations of GeO4 units, asymmetric vibrations of Ge-
O– bonds of GeO6 and bending vibrations of Ge4 – O – Ge4 respectively[60-
63]. The observed bands in the pure sample F0 at 945 cm-1, 745 cm-1 are
ascribed to stretching vibrations of BiO3 [61] combined with Ge-O–
asymmetric stretching of GeO6 units [63]. Further, the bond at 452 cm-1 is due
to ZnO4 structural units overlapped by Bi-O bonds in distorted BiO6 units [64]
and GeO6 units [63]. A small at 428 cm-1 is due to Bi-O bonds of different
length in distorted BiO6 polyhedra [65].
From Fig 4.6 it is observed that the band at 945 cm-1 is slightly red
shifted, which indicates the increase in ionic nature of the glass matrix with
Fe2O3 doping. Further the areas of bands at 745 cm-1 and 452 cm-1 concluded
that the increase of octahedral GeO6 structural units at the expense of
tetrahedral GeO4 structural units; which results in the cross-linking bonds such

150
as Ge-O-Bi; Ge-O-Zn and Bi-O-Zn. The increase in the area of bands is due to
the increase of NBO’s. The red shift at 945 cm-1 may ascribed to the increase in
bond length when Ge-O is replaced by Fe-O, this augments the conductivity
of the glass network.
From the literature it is observed that trigonal GeO2 has germanium in
four fold coordination [67] and rutile structure of GeO2 has six-fold
coordination [67]. The Raman spectra of vitreous GeO2 consist of bands around
910, 835, 810 and 765 cm-1 due to asymmetric stretching of oxygen in GeO4
tetrahedra with BOs = 4, 3, 2 and 1 respectively [68]. In the present
investigation the Raman spectra of the glass samples show an intense peak
around 391 cm-1 is assigned to the combination of ZnO4 structural units
combined with Bi-O-Bi bending vibrations and symmetric stretching of
bridging oxygens in Ge-O-Ge in GeO6 [66, 69]. The small shoulder at around
555 cm-1 is due to Bi-O vibrations in BiO6 units [70]. An intense peak at 782
cm-1 is assigned to symmetric stretching vibrations of Ge-O– bonds in GeO4
units [71] along with two small peaks at 891 cm-1 and 964 cm-1 are ascribed to
Ge-O-Ge asymmetrical stretching in GeO4 structural units [72, 73]. From the
Fig. 4.7 it is observed that the area of the peak at around 782 cm-1 is decreased
and the area of the peak at 391 cm-1 is observed to increase with increase in the
concentration of Fe2O3, which indicates the increase of GeO6 (octahedral) units
in proportion with GeO4 (tetrahedral) units.

151
The inferences drawn from the analysis of FTIR spectra of the present
glasses are also supporting those obtained from Raman spectra; such inferences
indicate clearly the decrease in GeO4 structural units and increase in GeO6
structural units with increase in concentration of Fe2O3. Hence, iron ions
occupy octahedral positions in the glass structure with increase in
concentration; such ions act as a network modifier in decreasing the rigidity of
glass matrix.
Space charge polarization contributes more to the dielectric constant
among all polarizations (electronic, ionic, dipolar and space charge
polarization) and it depends on the purity and perfection of the glass [8]. The
observed increase in the value of ε', loss (tanδ) and σac at any frequency are
found to be increased with temperature. The increase of these dielectric
parameters attributed to (i) the high polarizing nature of Bi3+ ions (ii) increase
in the ionic environment of Fe2+ ions and (iii) enhancement of Bi3+- Bi5+ pairs.
In the present investigation iron exists as both Fe3+ and Fe2+ states, in which
Fe3+ ions take part in network forming positions and Fe2+ ions acts as modifiers
[39]. The activation energy decreases with increase in concentration of Fe2O3,
which is an indication of space charge polarization. The gradual increase in
octahedral positioned Fe2+ ions in the glass network leads to its modification.
These ions weaken the glass network by creating bonding defects and create
path ways for migration of ions that build up space charge polarization and
leads to an increase in the dielectric parameters. This is also supported by

152
decrease in the optical band gap energy, Eg and intensity of resonance signal in
EPR studies. At higher concentration, Fe2+ ions in octahedral positions lead to
more space charge polarization and hence increase the disorder in the glass
network [62].
The observed dielectric relaxation and its shift with frequency may be
attributed to association of Fe2+ ions, Zn2+ ions with a pair of Ge – O– groups or
F– ions in analogy, such that the association of the divalent ion with a pair of
cationic vacancies occurs in conventional glasses [74]. The dielectric relaxation
effects can be ascribed to Bi2+ ions with addition with Zn2+ ions. Further,
spreading of relaxation region with Fe2O3 doping is due to Fe2+ ions. From
Table 4.6, the increase in (tanδ)max.ave and decrease in activation energy for
dipoles with Fe2O3 content suggests that an increase in degree of freedom for
dipoles to orient into the field direction leads to a decrease rigidity of the glass
network. This enhancement is directly related to the mobility of charge carriers.
The observed decrease in activation energy and increase in conductivity of the
present glasses is an obvious change [75]. By correlating activation energy with
mean separation (Ri), and polaron radius (Rp) with increase in Fe2+ ion
concentration, the mean site-to-site separation between iron ions and polaron
radius are found to decrease, which cause to decrease in activation energy Wd
and increase of σac as reported previously [76].
The low temperature part of the conductivity can be explained on the
basis of quantum mechanical tunneling model [73]. The density of energy

153
states N(EF) near the Fermi level, has been evaluated using the equation (5)
and presented in Table 4.6.
4
2 2 5( ) [ ( )] ln ph
e FKT N Eν
σ ω η α ωω
− =
--- (5)
where for Austin η = π/3, Butcher η = 3.66 π2/6 and Pollack η = π4/96 with the
usual meaning of remaining symbols reported [73]. The increase in the number
of localized states near Fermi level is supported by increase of Urbach energy
∆E values suggests that, the increase in ionic radii with Fe2O3 doping is caused
to increase the disorder thus modifying the glass network.
The breakdown strength of all the samples is determined at room
temperature. Since the breakdown strength is inversely proportional to the
value ε'(tanδ) [52], the result suggests that the rate of increase of ε'(tanδ) with
temperature is lowest for F0 sample. Therefore, the experiments on dielectric
breakdown strength of ZnF2 – Bi2O3 – GeO2 glasses revealed the conversion of
a part of Fe3+ ions into Fe2+ ions with increase in concentration of Fe2O3 which
act as modifiers, thus modifying the glass network.
References:
[1] R. P. S. Chakradhar, G. Sivaramaiah, J. Lakshmana Rao, N.O. Gopal
Spectrochimica Acta 62 (2005) 51.

154
[2] Ravi K. Kukkadapu , Hong Li, Gary L. Smith, J.D. Crum , Jun-Sik
Jeoung , W. Howard Poisl, Michael C. Weinberg, Journal of Non-
Crystalline Solids 317 (2003) 301.
[3] A. Veerabhadra Rao, C. Laxmikanth, B. Appa Rao, N. Veeraiah J. of
Phy. and Chem of Solids 67 (2006) 2263.
[4] P. Bergo, W.M. Pontuschka, J.M. Prison, Materials Chemistry and
Physics 108 (2008) 142.
[5] I. Ardelean, Hong-Hua Qiu, H. Sakata, Materials Letters 32 (1997) 335.
[6] M. Ghazzali, V. Langer, L. Ohrstrom, J. Solid State Chem. 181 (2008)
2191.
[7] K. Srilatha, K. Sambasiva Rao, Y. Gandhi, V. Ravikumar, N. Veeraiah,
J. of Alloys and Comp. 507 (2010) 391.
[8] N. Krishna Mohan, K. Sambasiva Rao, Y. Gandhi, N. Veeraiah, Phys. B
389 (2007) 213.
[9] A. Rajendra Kumar Singh, A. Srinivasan, Appl. Surf. Sci. 256 (2010)
1725.
[10] V. Simon, D. Muresan, S. Simon, Eur. Phys. J. Appl. Phys. 37 (2007)
219.
[11] R. Balda, A.J. Garcia A deva, J. Fernandez, J.M. Fdez Navarro, J. Opt.
Soc. Am B. 21 (2004) 744.
[12] P.Marcel, Ann. Chim. Sci.. Mater., 28, No.2, 87-94 (2003).
[13] V. N. Polukin, Fiz. I Khim. Stekla, 8, No. 3, (1982) 338.

155
[14] K. A. Kostanyan, A. D. Akopyan, and V. G. Dzhavadyan. Zh.., 38
(1983) 25.
[15] Y. Fujimoto, M. Nakatsuka, Jpn. J. Appl. Phys. 40 (2001) 279.
[16] X. Meng, J. Qiu, M. Peng, D. Chen, Q. Zhao, X. Jiang, C. Zhu, Opt.
Express 13 (2005) 1635.
[17] I. Opera, H. Hesse, K. Betzler, Opt. Mater. 26 (2004) 235.
[18] M. Łaczka, L. Stoch, J. Gorecki, J. Alloys Comp. 186 (1992) 279.
[19] J. Fu, H. Yatsuda, Phys. Chem. of Glasses 36 (1995) 211.
[20] L. Montagne, G. Palavit, G. Mairesse, M. Draoui, K. Aomari, M. Saidi
Idrissi, Phys. Chem. of Glasses 38 (1997) 15.
[21] Werner Vogel, Glass Chemistry, Second Edition Springer - Verlag,
Berlin, 1994.
[22] P. M. Vinaya Teja, Ch. Rajyasree, S.B.Murali Krishna, Ch. Tirupataiah,
D. Krishna Rao, Mater. Chem. And phy. 133 (2012) 239.
[23] J.E. Shelby, Introduction to Glass Science and Technology, 2nd ed.,
Royal Society of Chemistry, Cambridge, UK, 2005.
[24] R. Balda, A.J. Garcia A deva, J. Fernandez, J.M. Fdez Navarro, J. Opt.
Soc. Am B. 21 (2004) 744.
[25] Z. Pan, S.H. Morgan, A. Loper, V. King, B.H. Long, W.E. Collins, J.
Appl. Phy. 77(9) (1995) 4688.
[26] P. Srinivasarao, Ch. Rajyasree, A. Ramesh Babu, P. M. Vinaya Teja, D.
Krishna Rao J. Non-Cryst. Solids. 357 (2011) 3585.

156
[27] Sanjay, N. Kishore, A. Agarwal, Indian J Pure & Appld. Phys. 48
(2010) 205.
[28] C. Horea, D. Rusu, I. Ardelean, J. Mater Sci: Mater Electron 20 (2009)
905.
[29] FH El-Batal, AM Fayad, SA El-Rahman , FA Moustaffa, Indian J Pure
& Appl. Phys. 44 (2006) 367.
[30] M. Mariac, M.P. Brungs, M.S. Kazacos, Phys. Chem. of Glasses 30
(1989) 5.
[31] R.Stefan, S. Simon, Mod. Phys. Lett. 3 (2000) 111.
[32] E. Baiocchi, A. Montenero, M.Bettinelli, J. Non-Crst. Solids 46 (1981)
203.
[33] J.M.Dance, J.J.Videau, J.Portier, J. Non-Crst. Solids 86 (1986) 88.
[34] S. Hazra, A. Ghosh, Phys. Rev. B 51 (1995) 851.
[35] R.S. Muralidhara, C.R.Kesavulu, J.L.Rao, R.V.Anavekar,
R.P.S.Chakradhar; J. of Phy. and Chem. of Solids 71 (2010) 1651.
[36] Petru Pascuta, Rares Lungu, Ioan Ardelean, J. Mater Sci: Mater Electron
21 (2010) 548.
[37] S. P. Singh, R.P.S. Chakradhar, J.L. Rao, Basudeb Karmakar, J. of
Alloys and Comp. 493 (2010) 256.
[38] R.P. S. Chakradhar, B. Yasoda, J. L. Rao, N.O. Gopal; Mater. Res. Bull.
41 (2006) 1646.
[39] G. Srinivasa rao, N. Veeraiah, J. of Phy. Chem. of solids 63 (2002) 705.

157
[40] B.V. Raghavaiah, P. Nageswara Rao, P. Yadgiri Reddy, N. Veeraiah,
Opt. Mater. 29 (2007) 566.
[41] G. Nagarjuna, N. Venkatramaiah, P.V.V. Satyanarayana, N. Veeraiah; J.
of Alloys and Comp. 468 (2009) 466.
[42] Ch. Rajyasree, D. Krishna Rao, J. Non-cryst. Solids. 357 (2011) 836.
[43] A. Al-Hajry, N.M. Tashtosh, M.M. El-Desoky, Physica B. 368 (2005)
51.
[44] E. Baiocchi, A. Montenegro, M. Bettinelli, J. Non-Cryst. Solids 46
(1981) 203.
[45] F. Albert Cotton, G. Wilkinson, C.A. Murlio, M. Bochmann, Advanced
Inorganic Chemistry, John Wiley & Sons, New York, 1999.
[46] S. M. D. Nery, W. M. Pontuschka, S. Isotani, C. G. Rouse, Phys. Rev. B
49 (1994) 3760.
[47] A. S. Rao, R. R. Reddy, J. L. Rao, Solid State Commun. 96 (1995) 701.
[48] L.B. Su, P. Zhou, J. Yu, H. Li, L.H. Zheng, F. Wu, Y. Yang, Q. H.
Yang, J. Xu, Opt express. 17(16) (2009) 13554.
[49] C. Hirayama, J.G. Castle Jr., M. Kuriyama, Phys. Chem. Glasses 9
(1968) 109.
[50] K. Tanaka, K. Kamiya, T. Yoko, J. Non-Cryst. Solids 109 (1989) 294.
[51] T. Komatsu, N. Soga, M. Kunugi, J. Appl. Phys. 50 (1979) 6469.
[52] T. Castner Jr., G.S. Newell, W.C. Holton, C.P. Slichter, J. Chem. Phys.
32 (1960) 668.

158
[53] D.L. Griscom, J. Non-Cryst. Solids 40 (1980) 211.
[54] E. Burzo, I. Ursu, D. Ungur, I. Ardelean, Mater. Res. Bull. 15 (1980)
1273.
[55] I. Ardelean, P. Pascuta, L.V. Giurgiu, Int. J. Mod. Phys. B 17 (2003)
3049.
[56] B. Bleaney, K.W.H. Stevens, Rep. Prog. Phys. 16 (1953) 108.
[57] A. Abragam, B. Bleaney, Electron Paramagnetic Resonance of
Transition Ions, Clarendon, Oxford, 1970.
[58] D. Loveridge, S. Parke, Phys. Chem. Glasses 12 (1971) 19.
[59] J. Kliava, Phys. Status Solidi (b) 134 (1986) 411.
[60] I. Ardelean, D. Rusu, J. Opto electro and advanced Materials. 10 (2008)
66.
[61] I. Ardelean, C. Simona, V. Ioncu, J. Opt. Adv. Mater. 8 (2006) 1843.
[62] G. E. Rachkovskaya, G. B. Zakharevich, Journal of Applied
Spectroscopy, 74 (2007) 86.
[63] V. Dimitrov, y. Dimitriev, A. Montenero, J. Non-Cryst. Solids. 180
(1994) 51.
[64] S.B.M. Krishna, A.R. Babu, Ch. Rajyasree, D.K. Rao, J. Non-Cryst.
Solids 356 (2010) 1754.
[65] S.B.M. Krishna, P.M. Vinaya Teja, D. Krishna Rao, Mater. Res. Bull.
45 (2010) 1783.
[66] W.H. Baur, A.A. Khan, Acta Crystallogr. 273 (1971) 2133.

159
[67] G.S. Henderson, H. Wang, Eur. J. Mineral. 14 (2002) 733.
[68] S. J. L. Ribeiro, J. Dexpert-Ghys, B. Piriou, V. R. Mastelaro, J. Non-
Cryst. Solids 159 (1993) 213.
[69] G.S. Henderson, D.R. Neuville, Benjamin Cochain, L. Cormier, J. Non-
Cryst.Solids 355 (2009) 468.
[70] A. A Kharlamov, R. M Almedia, J. Heo, J. Non-Cryst. Solids 202
(1996) 233.
[71] E.I. Kamitsos, Y.D. Yiannopoulos, M.A. Karakassides, G.D.
Chryssikos, H. Jain, J Phys. Chem. 100 (1996) 11755.
[72] H. Verweij, J.H.J.M. Buster, G.F. Remmers, J. Mater. Sci. 14 (1979)
931.
[73] F. L. Galeener, A. J. Leadbetter, M. W. Strongfellow, Phys. Rev. B 27
(1983) 1052.
[74] P. G. Prakash, J. L. Rao, J. Mater. Sci. 39 (2004) 193.
[75] M. M. El-Desoky, H. S. S. Zayed, F. A. Ibrahim, H. S. Ragab, Physica
B 404 (2009) 4125.
[76] A. Al-Hajry, A. A. Soliman, M. M. El-Desoky, Thermochim. Acta 427
(2005) 181.