strong free cash flow - covestro.com
TRANSCRIPT

covestro.com
Strong free cash flow Financial Highlights
Q3 2016
October 25, 2016 │ Q3 2016 Investor Conference Call

Forward-looking statements
2
This presentation may contain forward-looking statements based on current assumptions and
forecasts made by Covestro AG.
Various known and unknown risks, uncertainties and other factors could lead to material
differences between the actual future results, financial situation, development or performance of the
company and the estimates given here. These factors include those discussed in Covestro’s public
reports, which are available on the Covestro website at www.covestro.com.
The company assumes no liability whatsoever to update these forward-looking statements or to
adjust them to future events or developments.
October 25, 2016 │ Q3 2016 Investor Conference Call

Continued dynamic core volume growth (9.1% Y/Y)
Adj. EBITDA above previous year’s quarter (22% Y/Y)
Strong free operating cash flow generation (>100% Y/Y)
FY 2016 guidance increased slightly
Share price more than doubled at our first anniversary on the stock market
Q3 2016 Key Highlights
3
Strong free cash flow
October 25, 2016 │ Q3 2016 Investor Conference Call

Q3 2016 Sales & Earnings
4
Strong volume growth with significant earnings and FOCF leverage
1,130
471
160
251
1,233
574
259
646
Core Volumes1 Adj. EBITDA Net Income FOCF
Q3 2015 Q3 2016 Q3 2015 Q3 2016 Q3 2015 Q3 2016 Q3 2015 Q3 2016
+9.1% +21.9% +61.9% +157.4%
Change vs. prior year
in kt
in € million
in € million
in € million
October 25, 2016 │ Q3 2016 Investor Conference Call 1 data of previous year have been adjusted
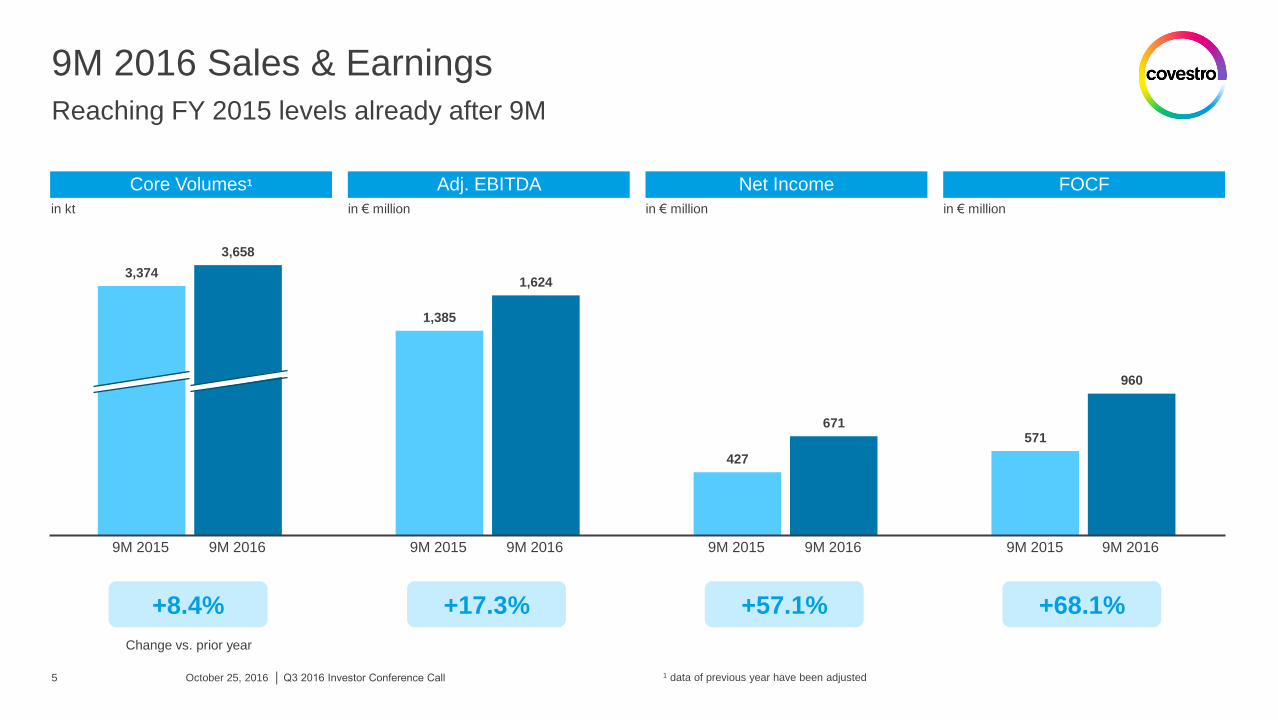
9M 2016 Sales & Earnings
5
Reaching FY 2015 levels already after 9M
3,374
1,385
427
571
3,658
1,624
671
960
9M 2015 9M 2016 9M 2015 9M 2016 9M 2015 9M 2016 9M 2015 9M 2016
+8.4% +17.3% +57.1% +68.1%
Core Volumes1 Adj. EBITDA Net Income FOCF
in kt
in € million
in € million
in € million
October 25, 2016 │ Q3 2016 Investor Conference Call
Change vs. prior year
1 data of previous year have been adjusted
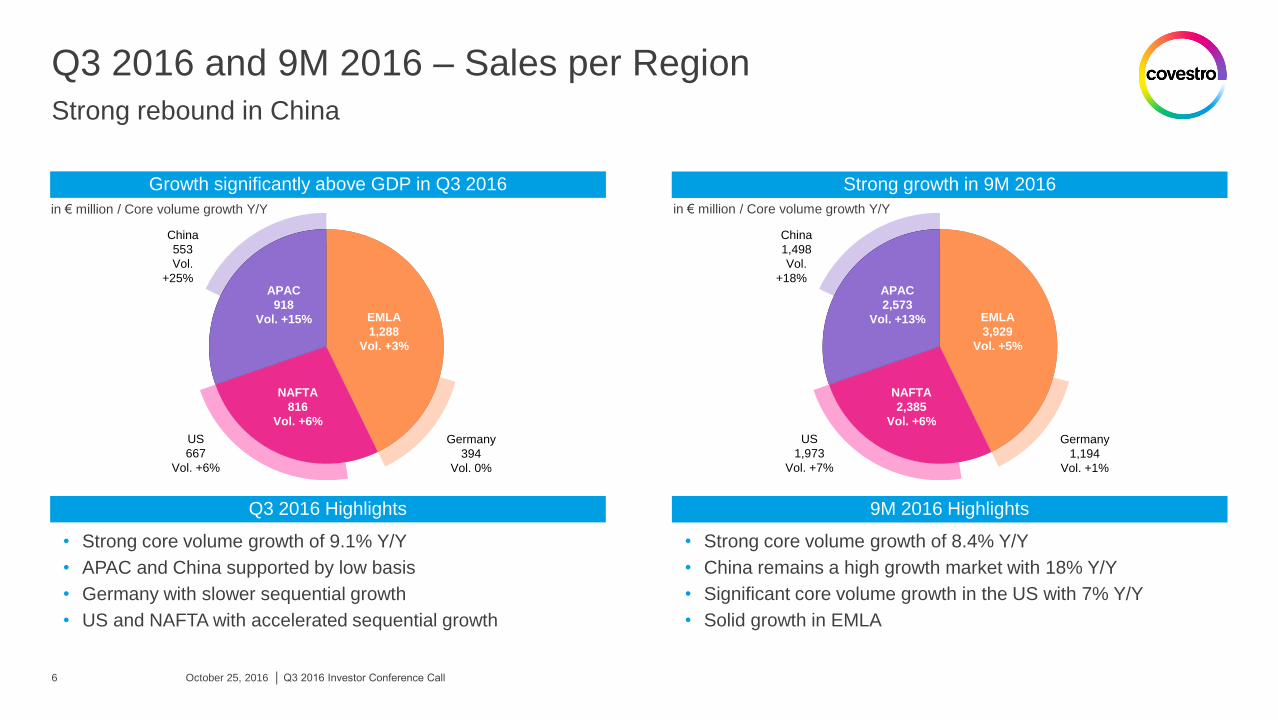
• Strong core volume growth of 8.4% Y/Y
• China remains a high growth market with 18% Y/Y
• Significant core volume growth in the US with 7% Y/Y
• Solid growth in EMLA
in € million / Core volume growth Y/Y
Strong growth in 9M 2016 Growth significantly above GDP in Q3 2016
in € million / Core volume growth Y/Y
9M 2016 Highlights Q3 2016 Highlights
• Strong core volume growth of 9.1% Y/Y
• APAC and China supported by low basis
• Germany with slower sequential growth
• US and NAFTA with accelerated sequential growth
Q3 2016 and 9M 2016 – Sales per Region
6
Strong rebound in China
October 25, 2016 │ Q3 2016 Investor Conference Call
APAC
918
Vol. +15% EMLA
1,288
Vol. +3%
NAFTA
816
Vol. +6%
China
553
Vol.
+25%%
US
667
Vol. +6%
Germany
394
Vol. 0%
APAC
2,573
Vol. +13% EMLA
3,929
Vol. +5%
NAFTA
2,385
Vol. +6%
China
1,498
Vol.
+18%%
US
1,973
Vol. +7%
Germany
1,194
Vol. +1%

MDI
TDI
Polyols CAS 18%
PCS 28%
Others 5%
Sales by Segments Highlights
PUR 49%
MDI/TDI – Oversupply gradually absorbed
• Mid-term demand growth of ~4% above
supply additions ~2-3%1
• Volatile margins2 with structural improvements
over the next years
PCS – Improving mix
• Relatively stable industry margin2 due to
balanced supply-demand development1
• Covestro benefits from strong growth in
higher value-added applications
Resilient businesses – Steady high FOCF
• CAS & Polyols: structurally low volatility
Resilient Businesses
% of group sales
9M 2016 – Cyclical business on structural upward trend
7
Significant proportion of sales generated with resilient businesses
1 Assumes global real GDP CAGR of 2-3% (2015-20) 2 Margin = Selling price minus raw material costs per ton
Source: internal estimates October 25, 2016 │ Q3 2016 Investor Conference Call

Q3 2016 – Sales Bridge
8
Dynamic volume growth
Q3 2015 Q3 2016
0%
Dynamic volume development
• Core volume growth (in kt) of 9.1% Y/Y
• Sales volumes (in €) expansion of 6.3% Y/Y
• Core volume growth above sales volume
expansion due to declining non-core volumes
and product mix effects
Price decline driven by lower raw
material prices
• Lower selling prices negatively impacted sales
by 5.1% Y/Y
Negative FX effects
• FX effects burdened sales by 1.1% Y/Y
mainly due to weaker CNY, MXN and USD
3,020 +191 -154
-35 3,022
in € million
Volume Price FX
October 25, 2016 │ Q3 2016 Investor Conference Call
Highlights Sales Bridge

Q3 2016 – Adj. EBITDA Bridge
9
Positive volume leverage and pricing delta
Positive volume leverage
• Mainly driven by MDI and PCS
Improving cash margin
• Positive pricing delta predominantly driven by
TDI
Limited FX effects
• Mainly translational impact
+22%
Q3 2015 Q3 2016
in € million Pricing Delta
+€80m
FX Volume
Other
items
471
574
+234 -55
-8
+86 -154
Raw
Material
Costs
Price
October 25, 2016 │ Q3 2016 Investor Conference Call
Highlights Adj. EBITDA Bridge

Q3 2016 – Group Results
10
Continued margin expansion
Adjusted EBITDA and Margin
• Dynamic core volume growth of 9.1% Y/Y
driven by PUR and PCS
• Stable sales as higher volumes could
compensate lower raw material prices
in € million / changes Y/Y
in € million / margin in percent
Adj. EBITDA Adj. EBITDA Margin
Q3 2016 Highlights
• Adj. EBITDA margin significantly improved by
3.4pp Y/Y to 19.0% due to positive pricing
delta, volume leverage and deflationary
environment
• Quarterly Adj. EBITDA increased Y/Y in last
seven consecutive quarters
1 data of previous year have been adjusted
416 498 471 256 508 542 574
13.6%
15.5% 15.6%
9.1%
17.7% 18.1%
19.0%
Q1 2015 Q2 2015 Q3 2015 Q4 2015 Q1 2016 Q2 2016 Q3 2016
3,054 3,210 3,020 2,798 2,875 2,990 3,022
+1.7%
+6.7% -0.6%
+3.0% +8.5%
+7.7% +9.1%
Q1 2015 Q2 2015 Q3 2015 Q4 2015 Q1 2016 Q2 2016 Q3 2016
Net Sales Core Volume Growth Y/Y1
October 25, 2016 │ Q3 2016 Investor Conference Call
Q3 2016 Highlights Net Sales and Core Volume Growth

Q3 2016 – Results of PUR Segment
11
Polyurethanes – Solid development
• Core volume growth of 9.0% Y/Y
predominantly driven by MDI
• Selling prices declined by 6.2% Y/Y
• Adj. EBITDA increased by 50% Y/Y due to
positive pricing delta and volume leverage
• Adj. EBITDA margin increased by 5.9pp Y/Y
supported by deflationary environment
1,554 1,637 1,512 1,385 1,403 1,481 1,503
-0.4% +5.8% -2.7%
+4.6% +10.4%
+9.0% +9.0%
Q1 2015 Q2 2015 Q3 2015 Q4 2015 Q1 2016 Q2 2016 Q3 2016
163 223 175 63 214 228 263
10.5%
13.6%
11.6%
4.5%
15.3% 15.4%
17.5%
Q1 2015 Q2 2015 Q3 2015 Q4 2015 Q1 2016 Q2 2016 Q3 2016
October 25, 2016 │ Q3 2016 Investor Conference Call
Adjusted EBITDA and Margin
in € million / changes Y/Y
in € million / margin in percent
Q3 2016 Highlights
Q3 2016 Highlights Net Sales and Core Volume Growth
Adj. EBITDA Adj. EBITDA Margin
1 data of previous year have been adjusted Net Sales Core Volume Growth Y/Y1

Q3 2016 – Results of PCS Segment
12
Polycarbonates – Steady high margin business
• Adj. EBITDA increased by 13.5% Y/Y due to
positive volume leverage
• Margin unchanged despite start-up costs in
China (200kt/a name plate capacity)
• Continuing favorable supply-demand balance
• Broad based dynamic development by
regions and industries, with lower volumes in
low-margin optical media
• Selling prices declined by 5.0% Y/Y 765 829 819 759 786 831 848
+5.4%
+9.1%
+5.4%
+0.5%
+8.5% +8.5%
+11.6%
Q1 2015 Q2 2015 Q3 2015 Q4 2015 Q1 2016 Q2 2016 Q3 2016
116 150 171 123 177 191 194
15.2%
18.1%
20.9%
16.2%
22.5% 23.0% 22.9%
Q1 2015 Q2 2015 Q3 2015 Q4 2015 Q1 2016 Q2 2016 Q3 2016
October 25, 2016 │ Q3 2016 Investor Conference Call
Adjusted EBITDA and Margin
in € million / changes Y/Y
in € million / margin in percent
Q3 2016 Highlights
Q3 2016 Highlights Net Sales and Core Volume Growth
Adj. EBITDA Adj. EBITDA Margin
1 data of previous year have been adjusted Net Sales Core Volume Growth Y/Y1

Q3 2016 – Results of CAS Segment
13
Coatings, Adhesives, Specialties – Solid results
• Phase out of trading product burdened core
volume growth; underlying business of CAS
delivered a high single-digit growth
• Relative growth was supported by a low prior
year basis
• Selling prices decreased by 2.7% Y/Y
• Stable margin on a high level
• Phase out of trading product burdened
absolute EBITDA but was slightly margin
enhancing
535 562 519 477 512 532 515
+6.3% +6.5%
-2.4% -0.2%
-2.8% -1.8% +3.5%
Q1 2015 Q2 2015 Q3 2015 Q4 2015 Q1 2016 Q2 2016 Q3 2016
133 137 137 84 139 142 136
24.9% 24.4% 26.4%
17.6%
27.1% 26.7% 26.4%
Q1 2015 Q2 2015 Q3 2015 Q4 2015 Q1 2016 Q2 2016 Q3 2016
October 25, 2016 │ Q3 2016 Investor Conference Call
Adjusted EBITDA and Margin
in € million / changes Y/Y
in € million / margin in percent
Q3 2016 Highlights
Q3 2016 Highlights Net Sales and Core Volume Growth
Adj. EBITDA Adj. EBITDA Margin
1 data of previous year have been adjusted Net Sales Core Volume Growth Y/Y1
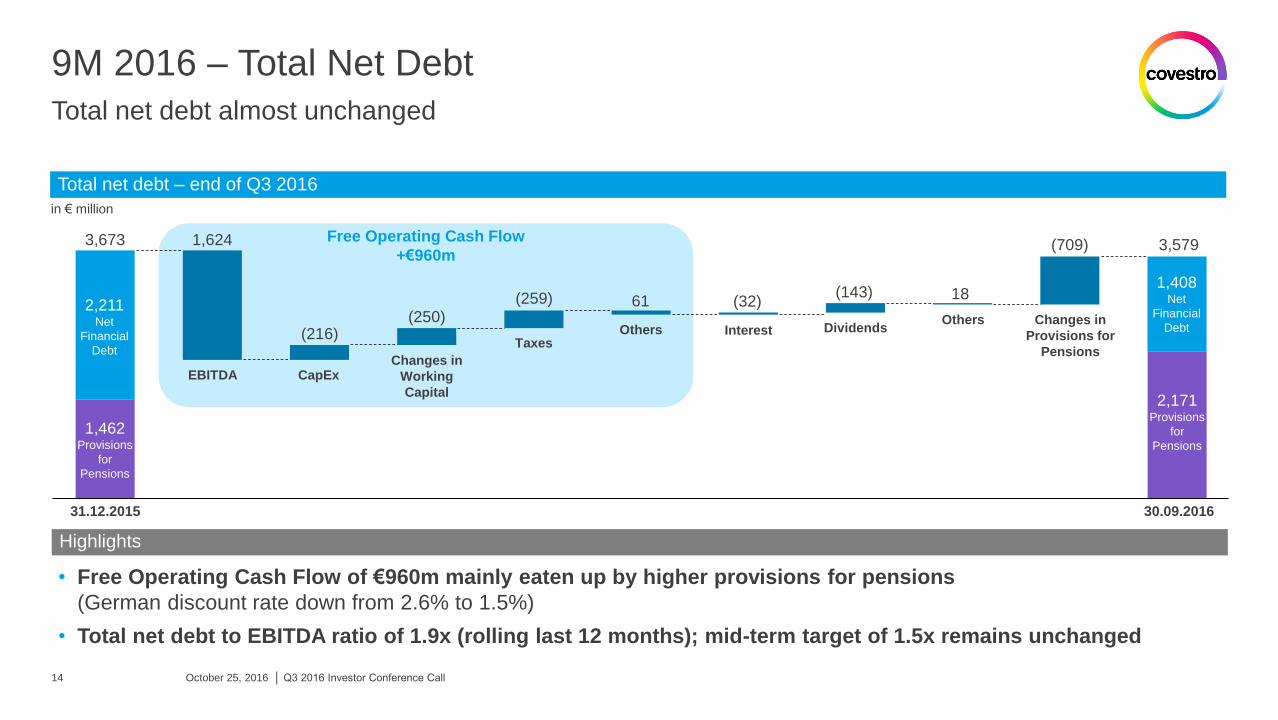
Total net debt – end of Q3 2016
3,673 1,624
31.12.2015
EBITDA
2,211 Net
Financial
Debt
1,462 Provisions
for
Pensions
(216) Taxes
CapEx Changes in
Working
Capital
Dividends Others Changes in
Provisions for
Pensions
Others Interest
30.09.2016
1,408 Net
Financial
Debt
2,171 Provisions
for
Pensions
3,579 Free Operating Cash Flow
+€960m
(259) 61 (32) (143) 18
(709)
(250)
in € million
9M 2016 – Total Net Debt
14
Total net debt almost unchanged
Highlights
• Free Operating Cash Flow of €960m mainly eaten up by higher provisions for pensions
(German discount rate down from 2.6% to 1.5%)
• Total net debt to EBITDA ratio of 1.9x (rolling last 12 months); mid-term target of 1.5x remains unchanged
October 25, 2016 │ Q3 2016 Investor Conference Call

Guidance 2016
15
On track to deliver
Adj. EBITDA
D&A
Special items in EBITDA
Financial results
Tax rate
CapEx
€1,641m
€739m
€-222m
€-175m
30.3%
€509m
Additional financial expectations for 2016
H2-2016: at least on last year’s level
~€650-700m
~€0m
~€-210m
~30%
~€450m
€1,624m
€514m
€0m
€-164m
28.3%
€216m
FY 2015 Old guidance FY 2016 9M 2016 New guidance FY 2016
Core Volume Growth Mid- to high-single-digit
increase Y/Y +8.4% +2.7% Unchanged
FOCF Around last year’s level €960m €964m Above last year’s level
Around €1.9bn
~€650-700m
~€0m
~€-210m
~30%
~€400m
ROCE 9.5% - Above last year’s level Significantly above last year’s level
October 25, 2016 │ Q3 2016 Investor Conference Call

Strong volume growth in a focused portfolio
despite a challenging market environment
Robust financial profile
with an investment grade rating (Baa2 from Moody’s)
Long-term progressive dividend policy
with focus on increasing or at least stable dividends
Solid financial outlook
despite continued limited visibility
Solid earnings and cash flow generation
supported by a stable demand/supply balance and a focus on profitability
Q3 2016 – Summary
Covestro fully on track
October 25, 2016 │ Q3 2016 Investor Conference Call 16

Upcoming IR Events
Find more information on investor.covestro.com
Broker conferences
• November 15-16, 2016 UBS European Conference, London
• December 6-7, 2016 BAML European Chemicals Conference, London
• January 9-11, 2017 German Investment Seminar, Commerzbank, New York
• January 16-18, 2017 German Corporate Conference, UniCredit / Kepler Cheuvreux, Frankfurt
Reporting dates
• October 25, 2016 Q3 2016 Interim Report
• February 20, 2017 Annual Report 2016
• April 25, 2017 Q1 2017 Interim Report
Annual General Meeting
• May 3, 2017 Annual Stockholders' Meeting, Bonn
Capital Markets Day
• June 29, 2017 Covestro Capital Markets Day, London
October 25, 2016 │ Q3 2016 Investor Conference Call covestro.com