stress effects of high noise levels on lower body negative ... · noise levels on lower body...
TRANSCRIPT
STRESS EFFECTS OF HIGH NOISE LEVELS ON LOWER BODY NEGATIVE PRESSURE EXPERIMENTS
by R. E. Al len, R. L. Trobaugh, and B. B. Henson
George C. Marshal l Space Flight Center Marshall Space Flight Center, Ala. 35812
N A T I O N A L AERONAUTICS A N D SPACE A D M I N I S T R A T I O N W A S H I N G T O N , D. C. SEPTEMBER 1970
I
https://ntrs.nasa.gov/search.jsp?R=19700027760 2018-06-14T21:31:03+00:00Z

TECH LIBRARY KAFB, NM
7. Author(s) R. E. Allen, Ph.D. R. L. Trobaugh, M.A. B. B. Henson, E.E.
9. Performing Organization Name and Address
, ..
I 111111 IIIII lllll lllll1111 lllll11111 Ill1 1111
8. Performing Organization Report No.
10. Work Unit No.
M364
-~ 1. Report No.
NASA TN D-5967 4. Title and Subtitle
12. Sponsoring figency Name and Address
National Aeronautics and Space Administration Washington, D. C. 20546
. . . . . -
~-
Ult328&7 3. Recipient's Catalog No. I 2. Government Accession No. I
I .
13. Type of Report and Period Covered
Technical Note 14. Sponsoring Agency Code
Stress Effects of High Noise Levels on Lower Body Negative Pressure Experiments
20. Security Classif. (of this page) I - Unclassified ~-
5. Report Date September 1970
6. Performing Organization Code I
21. No. of Pages 22. Price'
52 $3.00
George C. Marshall Space Flight Center Marshall Space Flight Center, Alabama 35812
11. Contract or Grant No.
.. 6. Abstract
The purpose of this study was to examine the effects of high noise levels on subjects experiencing lower body negative pressure. physiological data, and this study w a s designed to investigate further this question.
Noise has been cited as one form of s t r e s s that might impact the
The subjects participating in this study w e r e five male employees a t Marshall Space Flight Center, Huntsville, Alabama. subject w a s required to have hearing sensitivity within normal limits and to have had no excessive exposure to noise pr ior to testing.
Their ages ranged from 24 to 33 years , and all were in good physical condition. Each
Each subject w a s given a complete audiological examination to determine his hearing level pr ior to testing. the lower body negative pressure device (LBNPD). Physiological data were collected prior to the experimen to establish each subject's baseline response. The noise experiment lasted 30 minutes. and each subject experienced 4 bursts of 100 dB pink noise for a duration o? 1. t minute:. each. A csgative pressure of -40 mmHG w a s maintained for 12.5 minutes. The physiological parameters measured on each subject w e r e EKG, blood pressure, GSR, respiratory rate , respiratory volume, lower body temperature, and upper body temperature. Ambient conditions in the laboratory were also monitored, and the testing was recorded on a tape recorder for the purpose of recall.
Noise levels of varying intensities w e r e introduced through earphones to the subject while he w a s in
The results indicated that 100 dl3 of noise given at random time intervals throughout the lower body negative pressure test produced no significant recurring effects on heart rate o r blood pressure that could be credited to the noise stimulus. levels do produce some s t r e s s on subjects in the LBNPD.
The introduction of noise did affect the GSR, indicating that high noise
7. Key Words (Suggested by Authorls))
19. Security Classif. (of this report)
Unclassified -
18. Distribution Statement
Unclassif ied - Unlimited
'For sale by the Clearinghouse for Federal Scientific and Technical Information
Springfield, Virginia 22151

I . .. __ .. .. . ... . . . .. ... -. .. --.
TABLE OF CONTENTS
Page
S U M M A R Y . . . . . . . . . . . . 1 .......................... INTRODUCTION ................................... 2
P R O C E D U R E S . . . . . . . . . . . . . . . . . . . . . . . . . . . . . . . . . . . . 8
Subjects. .................................. 8
Physiological Equipment. ....................... 10 Test Sequence and Procedure. .................... 11
Audiological Equipment. ........................ 9
RESULTS.. ..................................... 15
DISCUSSION AND CONCLUSIONS ....................... 24
Summary of Major Conclusions . . . . . . . . . . . . . . . . . . . 29
APPEND E.............,........................ 31
REFERENCES... ................................. 43
BIBLIOGRAPHY .................................. 44
iii
Figure
1.
2.
3.
4.
5 .
6.
7 .
8.
9.
10.
11.
12.
13.
14.
15.
16.
17.
L I S T OF ILLUSTRATIONS Title Page
Noise spectra produced by type 1382 generator , . . , 3
a. Schematic drawing of the human ear. . . . . . . . , b. Schematic c ros s section of the cochlear
channels . . . . . . . . . . . . . . . . . . . . . . . . . . . 4
4
Audiological setup . . . . . . . . . . . . . . . . . . . . . . 9
Wilson headphone calibration, . . . . . . . . . . . . . . . 1 I
Headphone calibration fixture and microphone. . . . . 12
Headphone and calibration microphone in place on the calibration fixture. . . . . . . , . . . . . . . . . . . 13
Test data - experiment no. 30, subject A , . . . . . . . 16
Test data - experiment no. 36, subject A,. . . . . . . 17
Test data - experiment no. 31, subject B,. . . . . . . Test data - experiment no. 33, subject B2. . . . . . . Test data - experiment no. 38, subject B3. , . . . . .
19
20
21
Test data - experiment no. 32, subject Ci. , . . . . . 22
Test data - experiment no. 3 5 , subject Cz. , . . , . . 23
Test data - experiment no, 34, subject D,. , . . , . . Test data - experiment no. 37, subject D,. . . . . . . Test data - experiment no, 39, subject E,. . . . . . .
25
26
27
Test data - experiment no. 40, subject E,. . . . . . . 28
iv

r
Abbreviation o r Symbol
LBNPD
GSR
mmHg
min.
t
4
LIST OF ABBREVIATIONS AND SYMBOLS
Definition
lower body negative pressure device
galvanic skin response
mill imeters of mercury
minutes
100 decibels of pink noise on
100 decibels of pink noise off
peripheral vasoconstriction
subjects - Examples: A, - subject A, test i; A, - subject A, test 2; etc.
V
I

STRESS EFFECTS OF HIGH NOISE LEVELS ON LOWER BODY NEGATIVE PRESSURE
EXPERIMENTS
SUMMARY
This study w a s undertaken to determine whether high noise levels would impact physiological data being monitored while subjects were experiencing lower body negative pressure. Noise has been cited as one form of stress that might impact the physiological data, and this study w a s designed to investigate this hypothesis further.
The subjects chosen for participation in this study were five male employees at Marshall Space Flight Center , Huntsville , Alabama. Thei r ages ranged from 24 to 33 years , and all were in good physical condition. Each subject w a s required to have hearing sensitivity within normal limits and to have had no excessive exposure to noise pr ior to testing. Each subject w a s given complete audiological testing to meet these cr i ter ia .
The experiment w a s carr ied out with the subject in the.Melpar LBNPD. Physiological data were collected pr ior to the experiment to establish each subject’s baseline response. The noise experiment lasted 30 minutes, and a negative pressure of - 40 “ H g was maintained for 12.5 minutes. Four bursts of 100 dB pink noise for a duration of 1. 5 minutes each were introduced through earphones to the subject while he w a s in the LBNPD.
Physiological data w e r e measured continuously throughout the tests. EKG, blood pressure, GSR, respiratory rate and respiratory volume measurements were recorded on a Physiograph. A Strip Chart Oscillograph measured lower body temperature, and upper body temperature. A Leg Pleythsmograph w a s a lso used. Ambient conditions in the laboratory were monitored by a Hygro-thermograph, measuring temperature and humidity in the room and in the device. The testing w a s recorded on a tape recorder fo r the purposes of recall.

From the resul ts of this noise study, it was found that one 100 cU3 of noise given at random time intervals throughout the lower body negative pressure test produced no significant recurr ing effects on heart rate o r blood pressure that could be credited to the noise stimulus. The introduc- tion of noise did affect the GSR, indicating that high noise levels do produce some s t r e s s on subjects in the LBNPD. Unless sensitive measurements such as the GSR are used, the noise levels, even as high as 100 dB, will not adversely affect the data obtained in the Orbiting Workshop. results did indicate that some adaptation to the noise occurred. suggest that the subject might initially be start led, thus influencing the test data, but would adapt rapidly with no further change in data occurring. It would be interesting to investigate the increased sensitivity of an individual to random noise preceded by a period of flcomposed quietnessff to determine if his reaction is more o r l e s s as compared to this data.
Tes t This would
INTRODUCTION
To understand the s t r e s s effects of high noise levels on subjects in the lower body negative pressure device, it is first necessary to consider the physical parameters involved. These are the auditory stimulus employed and the receptor.
Noise, the auditory stimulus, is complex sound composed of different wave forms superimposed upon each other. A definition suitable for this experiment would be that noise is an undesired sound producing an adverse reaction in the central nervous system of the receptor; i. e. , the subject in an experiment.
The three types of noise most often used in psychoacoustical testing are white, pink, and USASI. In this experiment i t w a s desirable to choose a noise that would most nearly approximate the environmental conditions of a space laboratory. Pink noise was the spectrum chosen to measure the stress effects of noise on the receptor; i. e . , the subject. octaves of energy that is constant per bandwidth. rolloff per octave (Fig. I ) .
Pink noise is based on There is a linear 3 dB
The physical stimulus acts on the receptor, in this study a human being with the mechanism of hearing intact, by setting up activity in the form of nerve impulses that convey the information in coded form to the brain. The ear , the most complex of the sensory organs, has a broad
2
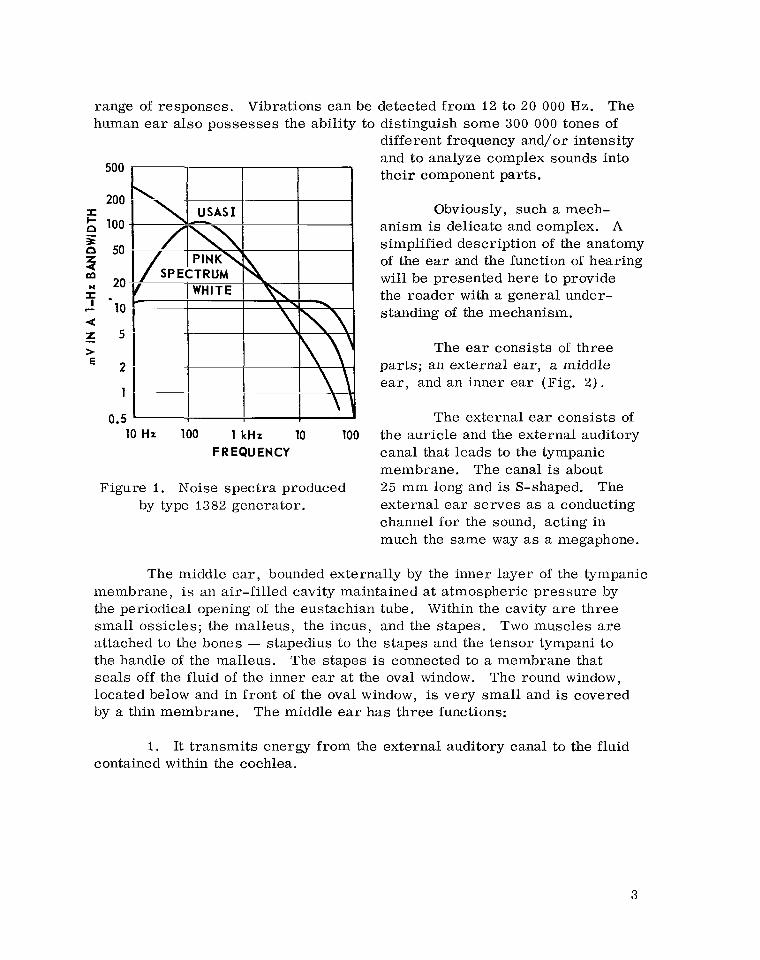
range of responses. himan ear also possesses the ability to distinguish some 300 000 tones of
Vibrations can be detected from 12 to 20 000 Hz. The
different frequency and/or intensity and to analyze complex sounds into their component parts.
Obviously, such a mech- anism is delicate and complex. A simplified description of the anatomy of the ear and the function of hearing wi l l be presented here to provide the reader with a general under- standing of the mechanism.
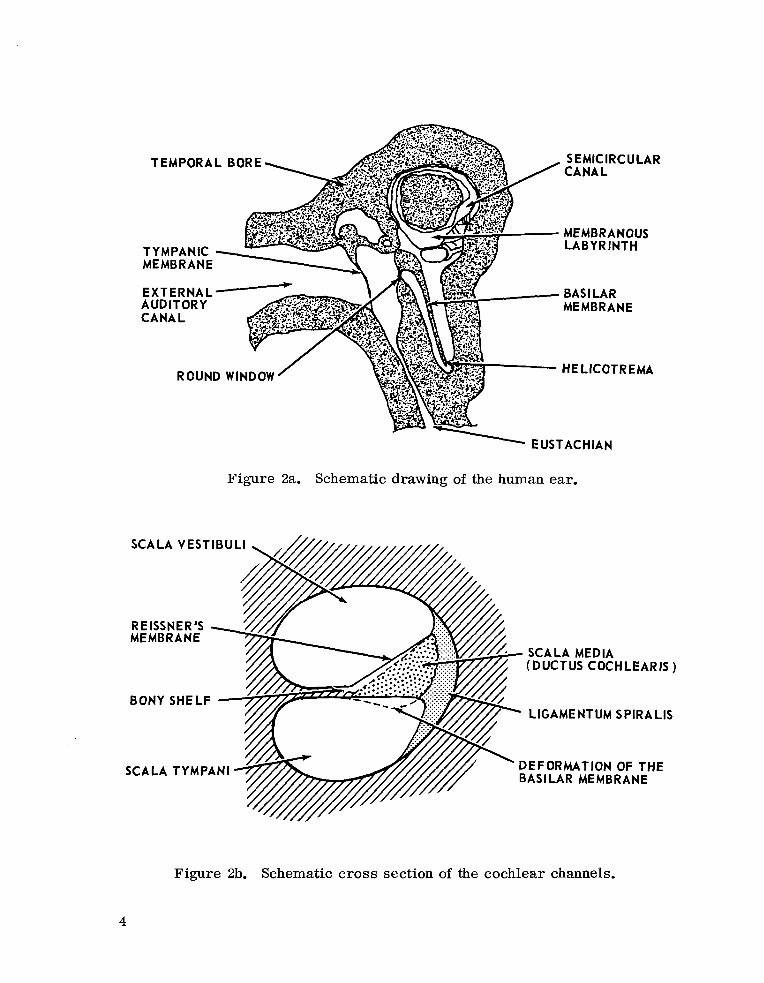
The ear consists of three par ts ; an external ear, a middle e a r , and an inner ea r (Fig. 2 ) .
10 H Z 100 1 kHz 10 100 F R EQU EN CY
Figure I. Noise spectra produced by type 1382 generator.
The external ea r consists of the auricle and the external auditory canal that leads to the tympanic membrane. The canal is about 25 mm long and is S-shaped. external ea r serves as a conducting channel for the sound, acting in much the same way as a megaphone.
The
The middle ea r , bounded externally by the inner layer of the tympanic membrane, is an air-filled cavity maintained at atmospheric pressure by the periodical opening of the eustachian tube. Within the cavity a r e three small ossicles; the malleus, the incus, and the stapes. Two muscles are attached to the bones - stapedius to the stapes and the tensor tympani to the handle of the malleus. seals off the fluid of the inner ea r at the oval window. located below and in front of the oval window, is very small and is covered by a thin membrane,
The stapes is connected to a membrane that The round window,
The middle e a r has three functions:
1. It transmits energy from the external auditory canal to the fluid contained within the cochlea.
3
TY MPANIC MEMBRANE
EXTERNAL AUDITORY
TEMPORAL BORE SEMlC IRC ULAR CANAL
MEMBRANOUS LABYRINTH
BAS1 LAR MEMBRANE
Figure 2a. Schematic drawing of the human ear.
SCALA VESTlBULl ,,A
R E ISSNE R 'S MEMBRANE
LIGAMENTUM SPIRALIS
DEFORMATION OF THE MEMBRANE
BONY SHELF
SCALA TYMPANI
/ ;II'
Figure 2b. Schematic c ross section of the cochlear channels.
4

2. It serves as a protective device from intense sounds of low frequency by the reflexive action of the muscles.
3. It equalizes air pressure.
The inner e a r , the source of the sense of hearing, is a system of cavities in the bone of the skull containing the mechanism for balance as we l l as the auditory part of the cochlea. The cochlea is a s p i r d cavity about 35 mm long and coiled 2 1/2 turns like a snail's shell. The cochlea consists of three canals that are separated by Reissner 's and the basilar membrane. The three canals are the scala tympani, scala vestibuli, and the scala media. These canals contain fluid and serve as a hydrodynamic system.
Enclosed in the canals is the end organ of hearing, the organ of Corti. This structure r e s t s on the basilar membrane and consists of a ser ies of projecting hair cells. cells and one row of inner hair cells. From these hair cel ls run nerve fibers to the central core of the cochlea. nerve and pass to the base of the brain where they synapse with other fibers leading to the central hearing mechanism in the cortex.
There a r e three parallel rows of outer hair
There the fibers form the auditory
The vibrations coming from the outside to the middle ear cause an inward movement of the stapes at the oval window. This in turn produces an outward movement at the round window. Reciprocal movement is set up, and the wave-like movements set up the nerve impulses in the organ of Corti.
The moving par ts of the ear are seldom a t rest . Their normal state is one of motion. High noise levels can se t up activity beyond their mechanical l imits of tolerability, then physiological changes may occur. Noise affects man a t two levels; s t r e s s , and physical damage to the auditory mechanism. In this study, we are concerned with the stress effects of noise. the secondary vegetative reactions and the primary vegetative reactions.
G. Lehmann 111 has categorized reactions to noise into two levels,
The secondary vegetative reactions occur as a consequence of the conscious perception of noise. A s different persons or even the same person under different situations respond differently both quantitatively and qualitatively to the same noise, there is a wide range of reactions. In general, the noise produces a definite feeling of annoyance and irritability.
5
Often there is an increase in muscle tonus. It has been observed that higher frequency noise is generally more annoying. Intermittent noises a lso produce more stress.
The second level of reactions is the pr imary vegetative reactions. These are independent of consciousness and can occur beyond a sound level of 65 dB. A characterist ic reaction is the contraction of the blood vessels in the precapillaries, mainly in the skin and mucous membranes. There is usually no increase in blood pressure, and pulse frequency remains constant for the most part. It is observed that cardiac output per minute is reduced, and changes in glandular activity and dilation of the pupil of the eye may occur.
Intensity of the reactions depends on sound level, the bandwidth of the noise, and the mean frequency. Lehmann I l l also observed that whether o r not the individual w a s accustomed to the particular type of noise made no difference.
Those concerned with the medical problems encountered by the astronaut a r e becoming increasingly aware of the effects of noise in the spacecraft. In considering long space flights, it is necessary to be able to forecast man's ability to ca r ry out work in the cabin. More investigations are needed to determine the consequences of high intensity noises on the astronaut.
There are two main stages of noise in the cabins of the spacecraft. The first stage is the short but intensive sounds occurring during the period of active propulsion. The second stage of noise is the prolonged and contin- uous sounds of medium and low intensity when the craft is in orbital move- ment. The main source of noise is the assembly of life-supporting systems. These function continuously and create a permanent acoustic background in the cabin. Occasionally other environmental noises are introduced. It is the concern of this study whether o r not unexpected bursts of noise in the cabin would produce s t r e s s effects upon the astronaut while he is in the lower body negative pressure device. A review of the literature does suggest high noise levels might affect the subject's performance,
Lehmann [ Z I found in his research that noise produces a contraction of the precapillary blood vessels over the vegetative nervous system. This reaction occurs at noises of 65 dB and increases with the increase in noise level, He found that the vasoconstriction holds on during the entire duration of the noise and is dependent upon the spectral latitude of the noise,
6

Gerd Jansen [ 3 ] performed an experiment studying the influence of noise on manual work. at 95 dB) and three-band noise (medium frequency of 3200 Hz) w a s deter- mined in a six-experiment series on medium heavy work on a bicycle ergometer. influence on the reduction of the blood circulation, while the three-band noises had no influence on blood circulation.
The influence of wide-band noise (30 to 20 000 Hz
It w a s discovered that the wide-band noises exerted a significant
Oppliger and Grandjean [ 41 found during plethysmographic investi- gations that a decrease in volume occurs under the influence of noise. They felt this w a s a result of the noise-conditioned decrease of the blood supply to the periphery. Lehmann and Tamm [51 reported that they observed a decrease in cardiac output in addition to the peripheral resistance increase in the majority of their cases.
In 1942 Silink and Sedlacek [ 6 ] determined that the influence of noise They were assuming produced a minimal lowering of the skin temperature.
that the noise had a vasoconstricting effect on the periphery.
More recent experiments emphasize that the extent of the vegetative reactions depends on the intensity and bandwidth of the noise and is also modified by other environmental influences, such as physical labor and heat [ 71 .
Krylov [ 8 ] performed an experiment in which he studied the effects of certain space flight factors on the auditory reactions in man. were exposed to continuous high frequency (800 to 2000 Hz) noise of 75 dB intensity for periods from 8 hours to 30 days. as respiratory rate , blood pressure, and electrocardiographic elements, changed u t i 1 the subjects had been exposed for 10 days. A t the end of this period of exposure, auditory thresholds were raised by 20 to 25 dB. The subjects were troubled by headaches and noises in their ears. Cardio- vascular reaction to a standard physical load revealed some reduction of vascular tone, and physiological examination of the subjects revealed signs of fatigue. over a period of 10 days has a marked general effect on man.
Individuals
No physiological indices, such
It was concluded that exposure to 74 to 76 dB of noise continuously
Research indicates that high noise levels do affect man and his ability to ca r ry out tasks. The purpose of this study is to examine the effects of high noise levels on subjects experiencing lower body negative pressure. Noise has been cited as one form of stress that might impact the physiologi- cal data, and this study is designed to investigate further this question.
7

PROCEDURES
This study w a s undertaken to determine whether high noise levels impact physiological data being monitored while subjects a r e experiencing lower body negative pressure. Each subject w a s given a complete audio- logical examination to determine his hearing level pr ior to testing. Noise levels of varying intensities were introduced through earphones to the subject while he w a s in the lower body negative pressure device. Physiologi- cal data were collected.
Subjects
The subjects were employees a t Marshall Space Flight Center in Huntsville, Alabama. Five male personnel were chosen to participate in the study. Their ages ranged from 24 to 33 years, and all were in good physical condition.
The following criteria were required for the subjects:
I . Each subject was required to have hearing sensitivity within normal limits, as determined by complete audiological testing,
2. Each subject w a s required to have had no excessive exposure to noise prior to the testing.
All subjects were tested in the morning with the following conditions being met:
I. No subject varied more than *3 pounds in weight during the test period.
2. The last meal w a s more than 3 hours before the test.
3 . No exercise w a s done a t least 4 hours before the test.
4. No drugs were being taken at the time of the test.
5. No subject had suffered any illness one week before the test.
Each subject w a s tested two times and one w a s tested three times.
8
A u d io log ica I Eq u i p m e n t Each subject w a s given complete audiological tests at the
Rehabilitation Center in Huntsville, Alabama. using a Beltone Audiometer (Model 15-C), calibrated according to 1964 IS0 standards. The testing w a s performed in a soundproof suite.
Hearing acuity w a s assessed
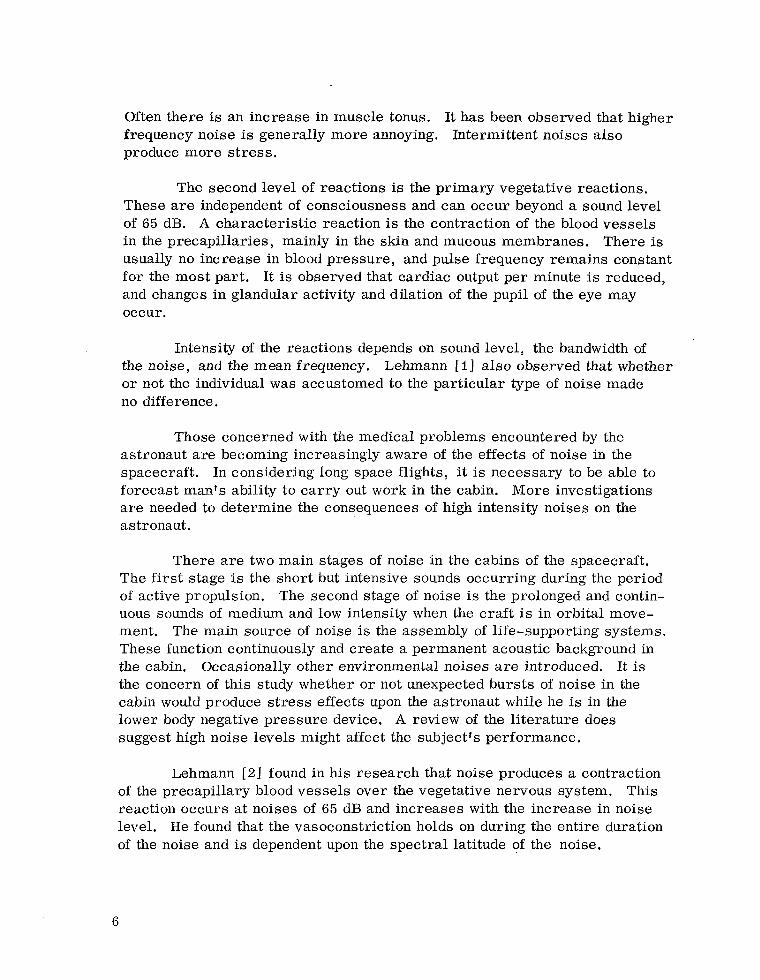
The acoustic testing of the subjects while experiencing lower body pressure was done in the Physiological Laboratory at Marshall Space Flight Center , Huntsville, Alabama. The following equipment w a s used: Random Noise Generator, Electronic Voltmeter, Headset, Sound Level Meter, and Sound-Survey Meter (Fig. 3 ) .
SOUND LEVEL I I METER
r
2 3 4
MATCH IN G HEADSET NETWORK
RANDOM NOISE VOLTMETER GENERATOR
Figure 3. Audiological setup,
The pink noise w a s generated by a Random Noise Generator (Model 1382, Type 1390-B) which has a frequency range of 20 Hz to 50 kHz. It w a s manufactured by General Radio Company of Concord, Massachusetts. An Electronic Voltmeter (Model 400 H) w a s used to measure the electrical signals to correlate decibel levels. Mark II Headset that w a s carefully calibrated to determine its output power. The noise in the laboratory w a s measured by a Sound-Survey Meter (Type 15555-A, Serial No. 3716) and a Sound-Level Meter (Type 1551-A, Serial No. 2709). The output of the Random Noise Generator w a s monitored constantly during testing.
The subject wore an MSA Noisefoe
Calibration of the headphones w a s accomplished by placing each individual headphone of the headset and the microphone in a holding fixture fabricated to the dimensions of these specific instruments. power at audio frequencies w a s then applied to the headphones in discrete
Electrical
9

steps, and the acoustical power levels w e r e noted. F o r convenience in use, a calibration chart of millivolts versus sound power level in decibels w a s developed. This, then, made selection of any desired sound power level immediately possible by merely reading the millivolt input to the headphones. Calibrations were performed f o r discrete audio frequencies, pink noise, white noise, and USASI noise.
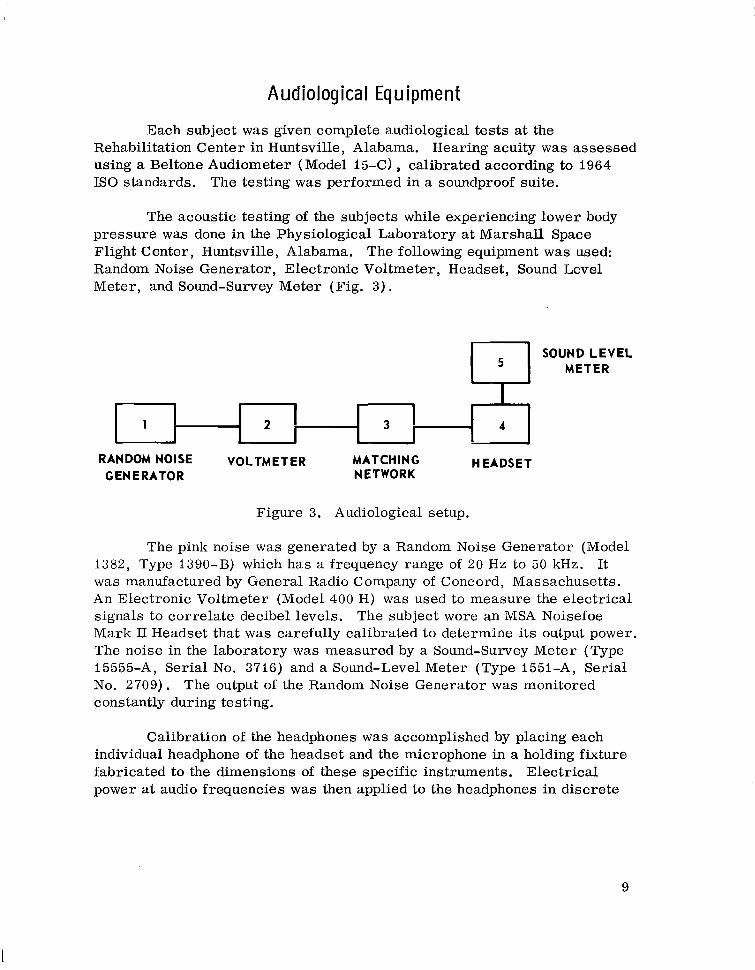
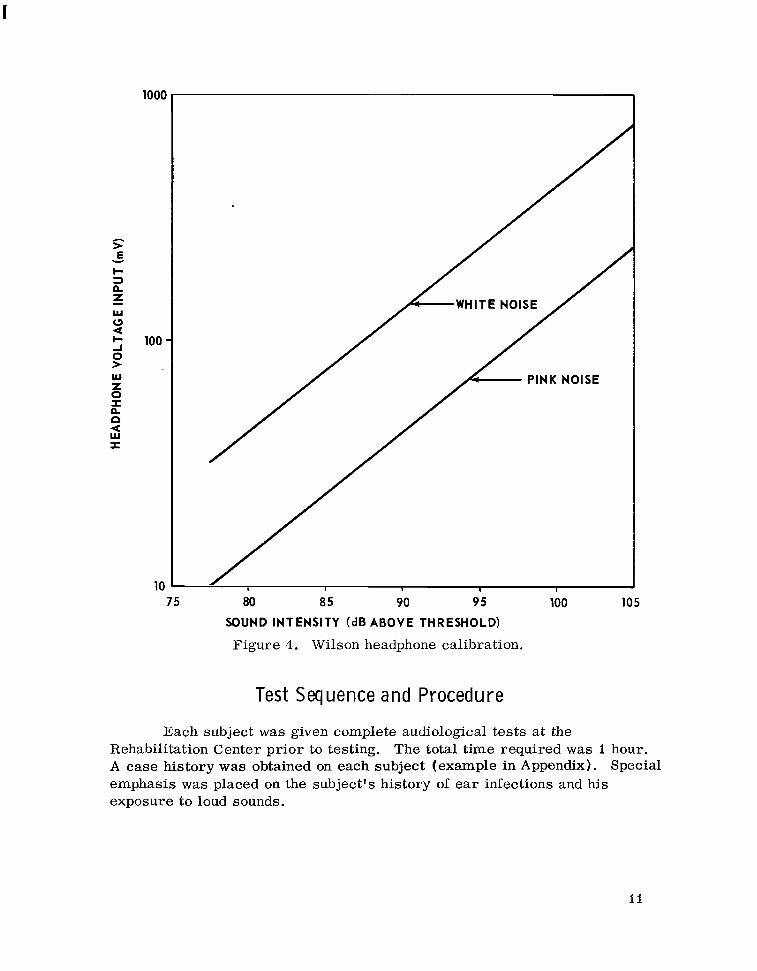
The items of equipment used in the calibrations and in actual testing procedures were under valid Standards Laboratory Certification. The system as used consisted of an oscillator, a voltmeter, and headphones with various connecting leads. The system w a s calibrated exactly as used to minimize possible e r ro r s . A completely independent set of equipment and calibration techniques was also utilized, and performances of the two systems w e r e compared. All comparisons of the two independent systems were within 2. 0 dB at the 100 dB level. Repeatability of the settings for the 100 dB sound power level w a s within a 1 . 0 dB reading on a particular system. There w a s no discriminable difference in the performance of the left earphone and the right earphone of the headset (Fig. 4). Manufacturers of equipment used in the calibrations and in actual testing procedures a r e as follow (Figs. 5 and 6) :
Oscillator - General Radio 1382
Voltmeter - Hewlett Packard 400 H
Headphones - Wilson
Calibration Microphone and System - Bruel & K j a e r
P h ys io1 og ica I Eq u i p me n t
The experiment w a s carried out with the subject in the Melpar LBNPD. During testing, the device w a s constantly monitored visually, and records were made on the Sanborn Dual Channel Recorder. EKG, blood pressure, GSR, respiratory rate, and respiratory volume measure- ments were recorded on a Physiograph (Type DMP-4A). A Strip Chart Oscillograph manufactured by Brush Instruments measured lower body temperature and upper body temperature. Also used was a Leg Pleythsmograph (Model 270) manufactured by Parks Electronic Laboratory. Ambient conditions in the laboratory were monitored by a Hygro- thermograph (Model 594). It measured temperature and humidity in the room and in the device. The testing w a s recorded on a tape recorder for purposes of recall.
10
I
h > E I- 3
Y
n E w 0 4 I- 1 0 > Lu Z 0 I P n
r z
1001
100
75 80 85 90 95 100 105 SOUND INTENSITY (dB ABOVE THRESHOLD)
Figure 4. Wilson headphone calibration.
Test Sequence and Procedure
Each subject w a s given complete audiological tes ts at the Rehabilitation Center pr ior to testing. A case history was obtained on each subject (example in Appendix). emphasis w a s placed on the subject's history of e a r infections and his exposure to loud sounds.
The total time required w a s 1 hour. Special

Figure 5. Headphone calibration fixture and microphone.

\
Figure 6. Headphone and calibration microphone in place on the calibration fixture.

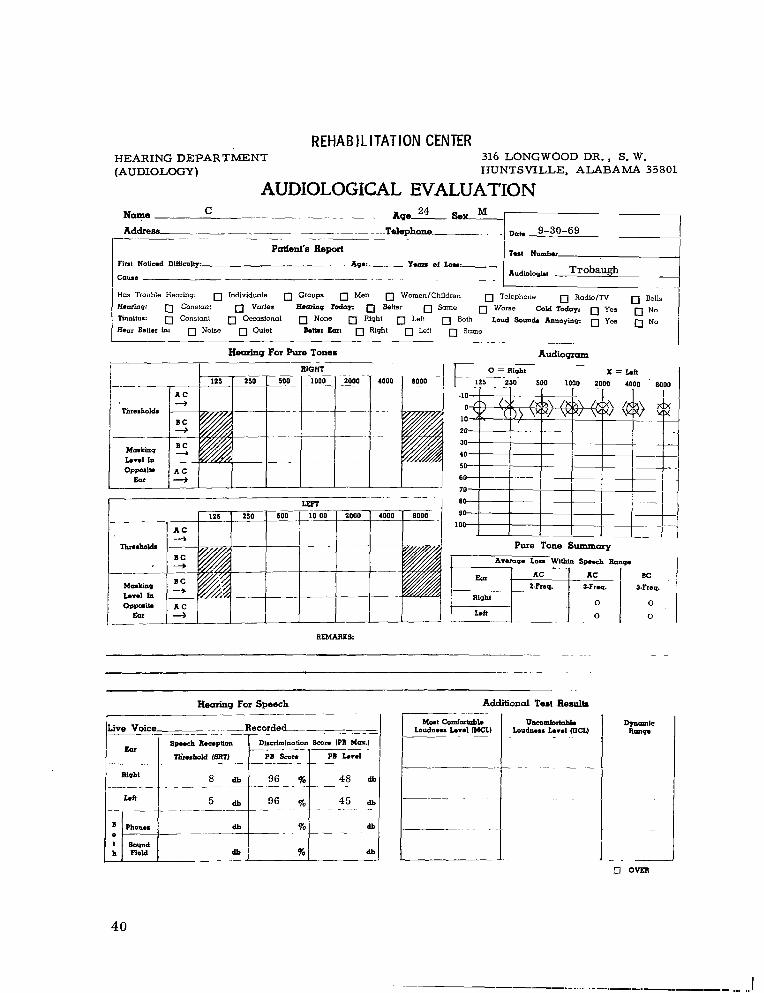
Hearing acuity w a s assessed utilizing pure tones and speech audiometric techniques. commencing with the right ear. The frequencies tested were 1000, 2000, 4000, 8000, 500, 250, and 125 Hz. A descending psychophysical method w a s used to obtain the thresholds. Bone conduction thresholds were then assessed by the same procedure; testing frequencies w e r e 1000, 2000, 4000, 500, and 250 Hz.
The subject w a s first tested by air conduction
Speech audiometric techniques were then assessed. Speech reception thresholds were obtained with live voice utilizing spondee words. Speech sound discrimination w a s assessed in a like manner using Harvard's phone tically balanced word l is ts .
Each subject then reported to the Physiological Laboratory at Marshall Space Flight Center for baseline testing in the Melpar LBNPD. Physiological data were measured and recorded on each subject to establish their baseline response.
After the baseline data were obtained, each subject w a s ready to proceed with the noise experiments. Each subject w a s briefed on the general operational procedure. No subject expressed anxiety o r fear of the test. no noise filtered from the environment to the subject. Minimum noise w a s maintained in the laboratory during the test.
The subjects were fitted with the custom earphones to assure
The noise experiment w a s administed as follows:
Pink Noise (dB) -_i
Time (min. 1 P res su re (mmHg)
0 - 4 4 - 5.5 5 .5 - 10 10 - 13 13 - 14.5 14.5 - 19.5 19.5 - 21 21 - 22.5 22.5 - 27.5 27.5 - 29 29 - 30
0 0 0
-40 -40 -40 -40 -40
0 0 0
0 100
0 0
100 0
100 0 0
100 0
14

The total time for the experiment w a s 30 minutes. four bursts of 100 d B pink noise for a duration of 1. 5 minutes each. A negative pressure of -40 mmHg was maintained for 12.5 minutes. Each subject was requested to write an assessment of the experiment after he had finished the test.
The subject experienced
RESULTS
Upon completion of the noise experiments, the following questions were used as cr i te r ia for evaluating the noise data:
1. Did the noise affect the subject's blood pressure o r hear t ra te?
2 . W a s the response different for repeated exposure to noise?
3. W a s the first experimental response different from the second?
4. Did negative pressure significantly a l ter the response to noise?
5. Can the individual's comments help explain the results?
6 . Can the individual's history help explain the resul ts?
To simplify the discussion of the results each subject w a s assigned a capital let ter. abbreviations and symbols used on the data sheets. )
(See the List of Abbreviations and Symbols for definitions of
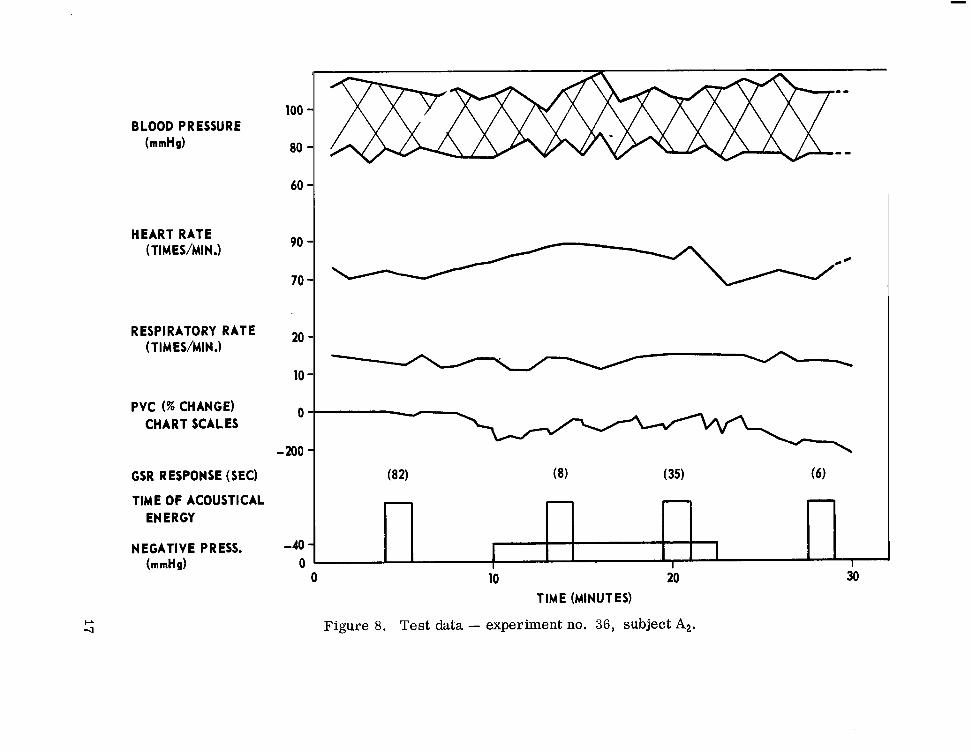
In reviewing the test data for subject A (Figs. 7 and 8 ) , i t is apparent that the blood pressure and hear t rate varied more in response to negative pressure than to the introduction o r cessation of the noise stimuli. blood pressure remained essentially unchanged in subject A. In both tests, the hear t rate indicates the standard recovery profile at the release of negative pressure. It should be noted that even with the increased s t r e s s through the negative pressure, no significant response can be detected from the noise given during the negative pressure, The respiratory rate also remains basically unchanged throughout the experiment, a phenomenon observed consistently in other s imilar noise. The first response has a significantly longer duration than any subsequent response. It might be noted, however, that the response to noise after the subject had experienced lower
The
15

BLOOD PRESSURE (mmHg)
100 -
80 -
60 -
20- 10 -
HEART RATE (TIMES/MIN.) - RESPIRATORY RATE (TIMES/MIN .)
10 - 0 -
YG A VOLUME (LEG)
TIME OF ACOUSTICAL ENERGY
NEGATIVE PRESS. (mmHg)
70 .' - -- I
10 20 30 0
TIME (MINUTES) Figure 7. Test data - experiment no. 30, subiect A, .
BLOOD PRESSURE b " g )
20 -
lo-
HEART RATE ( TIMES/MI N.) - RESPIRATORY RATE ( TIM ES/MI N .)
PVC (% CHANGE) CHART SCALES
60 -
GSR RESPONSE (SEC)
TIME OF ACOUSTICAL ENERGY
NEGATIVE PRESS. -40 - 0 -
1 (mmHg)
I I I
0 10 20 30 TIME (MINUTES)
Figure 8. Test data - experiment no. 36, subject A2.
pressure fo r 10 minutes was of a longer duration than his response at the beginning of the lower pressure o r after its cessation. In the question period immediately after the test, the subject substantiated this phenomenon of adaptation. He stated that the noise is initially frightening, but adaptation occurs quickly. It is interesting to note that a response was recorded with the introduction of noise; however, at no time w a s there a complementary response in the blood pressure o r hear t rate.
In this, and all subsequent resul ts , the PVC var ies at random during the test, There are some indications of increased PVC, but these findings are preliminary and should be pursued in later tests.
In those tests involving subject B (Figs. 9, i o , and i l ) , the trends se t by subject A are continued. The blood pressure and hear t rate did not respond to the addition of noise. In tes ts B1 and B2 there does appear to be some signs of transient tachycardia to the second introduction of noise; however, this is not borne out in previous o r subsequent introduction of noise nor in B, at all. Adaptation to the noise is not seen in this series of tests. The GSR data show a varied response to noise. In no difference is seen in the response to noise at the beginning o r near the end of the negative pressure, but i t is important to note that this subject had very little response to the negative pressure at all. H i s past history could help explain these results, He participates in many areas of routine stress and excitement. He is a private pilot, drives 20 000 miles pe r year , and rarely becomes excited. This subject has been tested several t imes in the LBNPD, and those data are typical of this subject. introduction of noise is startling but not annoying. I r He also reported that he adapted quickly to the stimuli,
The subject stated that "the
In reviewing the test data of C1 and C2 (Figs. 1 2 and 13) , there again appears to be no definite change in blood pressure o r hear t ra te because of the noise s t ress . The GSR data f rom C , is indicative of some adaptation to the noise. In the second test , C2, the subject is much more relaxed, and no response on the second test is as great as the lowest response on the f i r s t test. It was stated by the subject that the noise w a s "less unpleasant" during the second test. The hear t rate increase in C2 seems to be more related to the negative pressure than to the noise intro- duction. Adaptation w a s not as obvious on the second tes t as on the f i rs t .
18

BLOOD PRESSURE (mmHg)
10 - 0 -.
HEART RATE (TIMES/MIN.)
TIME OF ACOUSTICAL ENERGY
NEGATIVE PRESS. -40 - 0
120 - 100 1
80 - V 60 -
- - - 7
I I I I I I I I I I
65 - 60 - 55 -
RESPIRATORY RATE 10 1 (TIMES/MIN.)
% A VOLUME (LEG)
0 -I
CL W
TIME (MINUTES)
Figure 9. Test data - experiment no. 31, subject Bi.

BLOOD PRESSURE (mmHg)
* O l 60
RESPIRATORY RATE ,o ( TI ME s /MI N .)
% A VOLUME (LEG)
10 - 5 -
GSR RESPONSE (SEC) I TIME 0 F ACOUSTICAL + - NEGATIVE PRESS.
EN E RGY
(mmHg) I I I I I I 1 I I I I I I 1'
8 10 12 14 16 18 20 22 24 26 28 30 0 2 4 6
TIME (MINUTES)
Figure 10. Test data - experiment no. 33, subject E$.

B OOD PRESSURE (mmHg)
HEART RATE ( TIM ES/M IN..)
RESPIRATORY RATE (TIMES/MIN.)
PVC (% CHANGE) CHART SCALES
120
100
80
60
70
50
15 10 5
0
- 100
GSR RESPONSE (SEC) TIME OF ACOUSTICAL
NEGATIVE PRESS. -40 (mmHg) 0
ENERGY
0
_1 -
I 1 I I I
10 20 TIME (MINUTES)
Figure 11. Test data - experiment no. 38, subject %.
30

to to 120
BLOOD PRESSURE (mmHg) 100
80
0
GSR RESPONSE (SEC)
TIME.OF ACOUSTICAL ENERGY
NEGATIVE PRESS, -40-
10 RESPIRATORY RATE
\
(TIM ES/MI N .)
I
0 - /
(110) (50) (20) - - - I I
0-
(mmHg) 0 I
% AVOLUME (LEG)
I I I I I I I I I
Figure 12. Test data - experiment no. 32, subject Ci.

110
b " g ) 90 BLOOD PRESSURE
70
HEART RATE 70
60
(TIM ES/MIN.)
RESPIRATORY RATE 10
0
( TIM ES/MIN J
PVC (% CHANGE) 0
- 100
CHART SCALES
GSR RESPONSE (SEC) TIME OF ACOUSTICAL
ENERGY
NEGATIVE PRESS. -40 (mmHg) 0
N w
3
20 lo TIME (MINUTES) 0
Figure 13. Test data - experiment no. 35, subject C t .

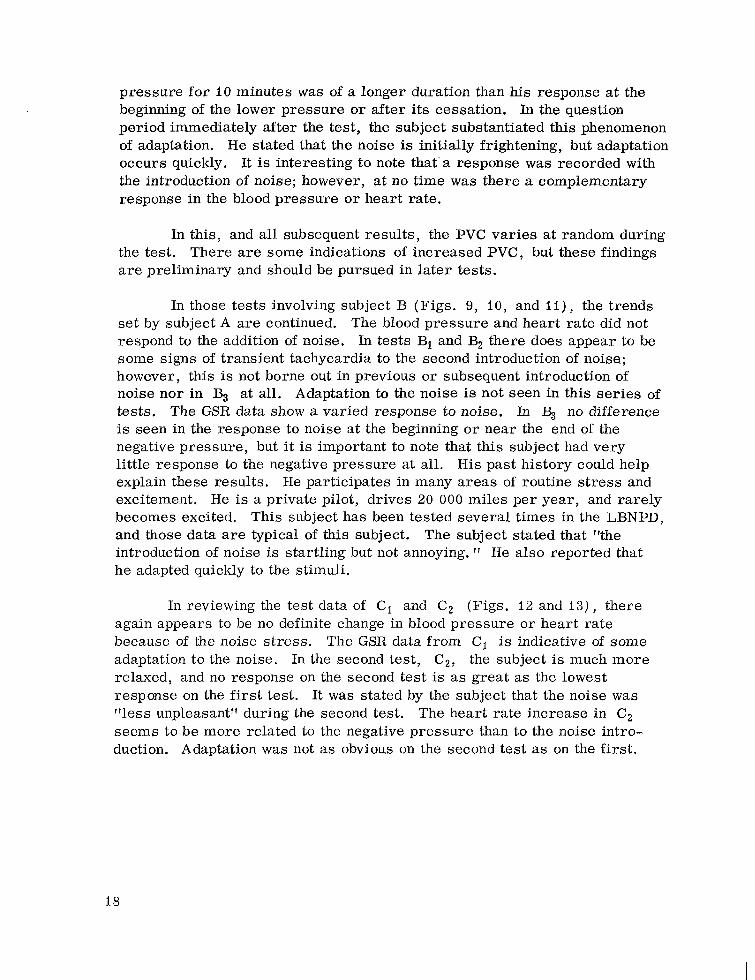
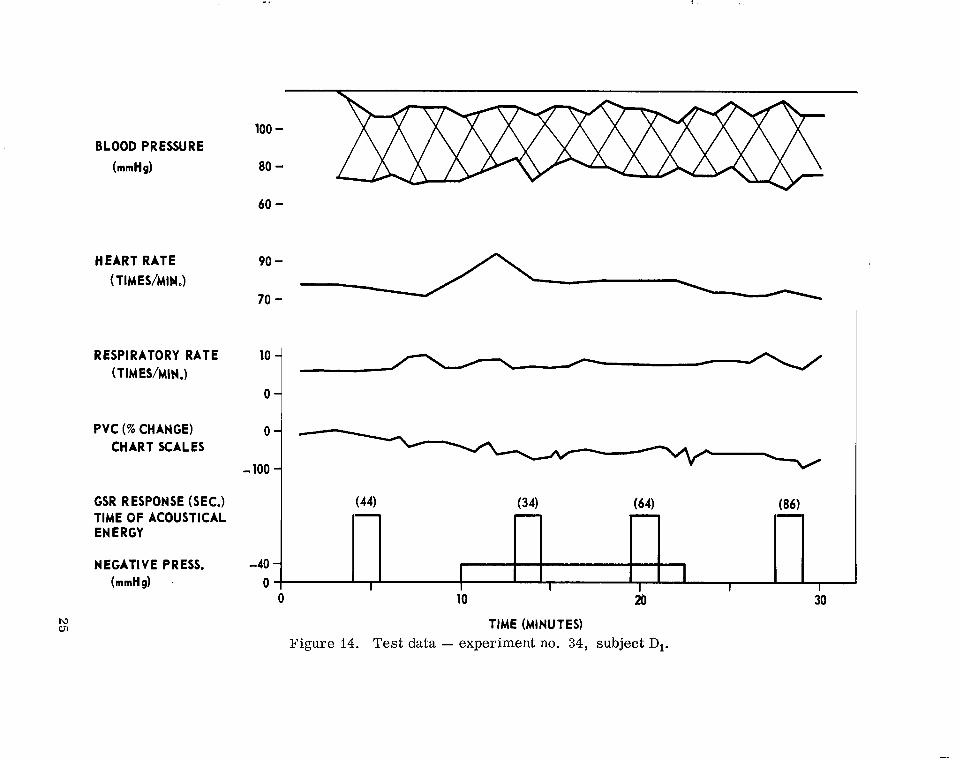
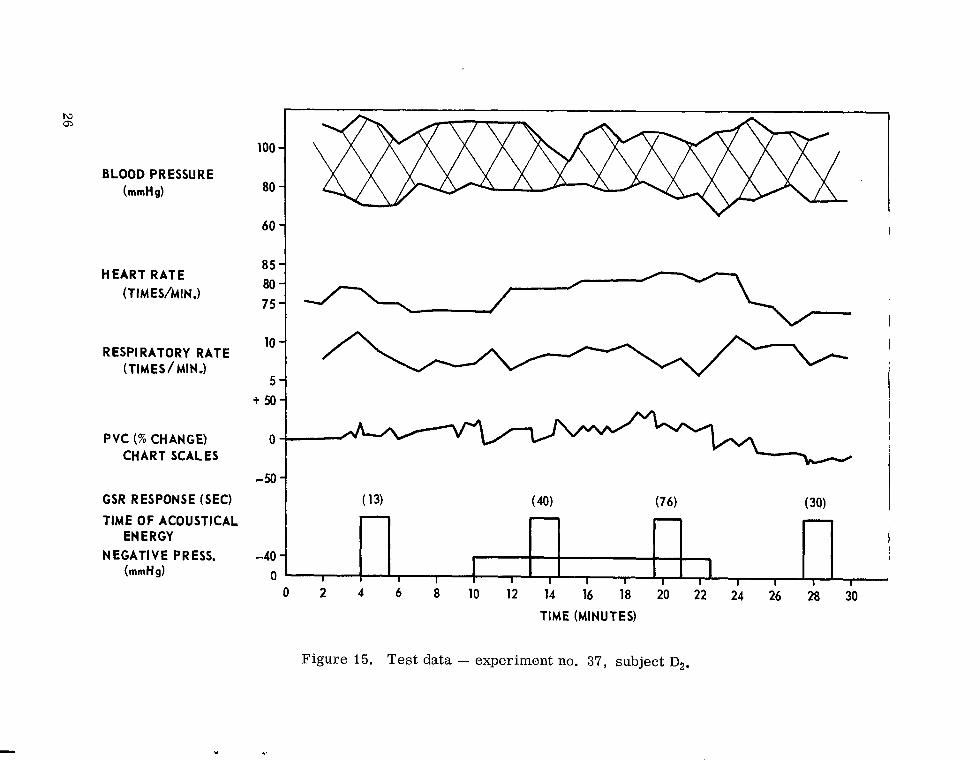
The hear t rate in D, and D2 (Figs. 14 and 15) increased significantly after the induction of negative pressure and decreased, as expected, when the ambient pressure w a s restored. No similar correlation was found between the introduction of noise and the change in hear t rate. The respiratory ra te varied a great deal during D2 but remained consistent throughout D,. The subject did express a feeling of annoyance during the test, and the GSR data does not substantiate that the subject reacted strongly to the noise stimulation. It w a s in the subject's own statement that he said, "1 found the noise always startling. I t Although the introduction of noise did affect the subject's GSR responses, the negative pressure exerted a greater change in his hear t rate than did the noise.
Although two tes ts were administered to E (Figs. 16 and 17) , the first one cannot be evaluated in the noise study because the subject's systolic pressure dropped steeply and the ambient pressure had to be restored immediately. The subject's statements after the test reveal that he did not receive an adequate night's rest. Since the test w a s conducted early in the morning, the lack of rest can be cited as a possible cause of his intolerance to the negative pressure. This subject has participated in other LBNPD tests without problems. The level of excitement in El can be seen in the GSR results as well. This is especially important when comparing his responses on E,. As expected, his level of response w a s much higher during El than E,. During E2 there is a significant increase in heart ra te a t the onset of the negative pressure and a subsequent reduction when ambient pressure is restored. A s in other tes ts , the significant increase in hear t rate is correlated to the negative pressure rather than to the noise. The subject did respond on the GSR when noise w a s introduced during E,. No adaptation to the noise is apparent from the data since his responses varied considerably.
0 I SCUSS ION AND CONCLUS I ONS
A t the onset of these experiments the purpose w a s to examine the effects of high noise levels on subjects experiencing lower body negative pressure. It had been stated that no useful data concerning hear t ra te and blood pressure could be collected if noise w a s introduced randomly during the test. This would drastically compromise data received from M092 (A Cardiovascular Study: Lower Body Negative P res su re Experiment) from the Orbiting Workshop to be launched in 1972. There was a concern that
24
BLOOD PRESSURE
(mmHg)
TIME OF ACOUSTICAL ENERGY
NEGATIVE PRESS, -40 - (mmHg) . 0
100 - 80 -
- - - -
I 1 I I I 1 I
60 -
HEART RATE 90 - 70 7
(TIMES/MI#.)
lo 1 RESPIRATORY RATE ( T IM ES/MI N .)
- 100
(44) (34) (64) (86)
PVC (76 CHANGE) CHART SCALES
GSR RESPONSE (SEC.)
0 10 20 30
TIME (MINUTES) Figure 14. Test data - experiment no. 34, subject D,.
BLOOD PRESSURE (mmHg)
HEART RATE (TIM ES/MIN .)
RESPIRATORY RATE (TIMES/MINJ
PVC (% CHANGE) CHART SCALES
GSR RESPONSE (SEC)
TIME OF ACOUSTICAL
NEGATIVE PRESS. ENERGY
(mmHg)
80
loo]
6o 1 75 - ! lo] 5
0
- 7
-40 - 0 I I I I I I I 1 I I I I I I
0 2 4 6 8 10 12 14 16 18 20 22 24 26 28 30
TIME (MINUTES)
Figure 15, Test data - exDeriment no. 37. subiect T I .

BLOOD PRESSURE (mmHg)
HEART RATE ( TIM ES/MINJ
RESPIRATORY RATE (TIMES IMIN.)
PVC (X CHANGE) CHART SCALES
GSR RESPONSE (SEC)
120
100
80
60
80
60
20
10
0
- 100
TIME OF ACOUSTICAL ENERGY
-40 NEGATIVE PaRESS.
(mmHg)
- -
I I I I 1 I I I I I 1 I I
0 2 4 6 8 10 12 14 16 18 20 22 24 26 28 30
TIME (MINUTES)
Figure 16. Test data - experiment no. 39, subject El.

BLOOD PRESSURE (mmHg)
60
HEART RATE ( T I M E S/MI N J
R ESP1 RATORY RATE (TIM ES/MIN.) .i 10 -
PVC (% CHANGE) 50 CHART SCALES
I
0 -' - -9 -
TIME OF ACOUSTICAL ENERGY - - - NEGATIVE PRESS -40 -
0 (mmHg) 0 ' I I I I
10 20 30 TIME (MINUTES)
Figure 17. Test data - experiment no. 40, subject E,.

blowers associated with the environmental control system or other units of equipment might start while the M092 w a s in progress. For this reason and because of relatively unknown effects of random noise, it w a s considered cri t ical that the environmental noise be reduced to a minimum during the M092 experiment.
From the resul ts of this noise study, however, it w a s found that 100 dB of noise introduced at random time intervals throughout the LBNP test produced no significant recurring effects on hear t rate o r blood pressure that could be credited to the noise stimulus. (These two parameters are emphasized because they wi l l be the ones recorded during the M092 experiment. ) The introduction of noise did affect the GSR, indicating that high noise levels do produce some stress on subjects in the LBNPD. Unless sensitive measurements such as the GSR are used, the noise levels, even as high as 100 dB, wi l l not adversely affect the data obtained in the Orbiting Workshop. Test resul ts indicated that some adaptation to the noise did occur. initially be start led, thus influencing the test data, but would adapt rapidly with no further change in data occuring.
This would suggest that the subject might
Summary of Major Conclusions
I. No significant repeatable response w a s recorded in the blood pressure or hear t rate because of 100 dB of pink noise being introduced at random periods for I. 5 minute durations.
2. A startle response w a s recorded in the GSR from subjects given 100 dB of pink noise for the above cited durations. The level of this response varied between individuals and varied for the same individual on the first and second tests.
3. The duration of s t r e s s resulting from introduction of noise had no consistent relationship to the duration of lower body negative pressure.
4. The response to 100 dB of pink noise had no demonstrable increase or decrease when superimposed over a lower body negative pressure of -40 mmHg fo r 1 2 . 5 minutes.
29

It is the recommendation, therefore, that the concern for noise levels up to 100 dB during the M092 experiment are without basis. available documents have stated that the noise levels for the Orbiting Workshop wi l l be wel l below this value. ) Unless more sensitive measure- ments such as the GSR are monitored, the noise level need not be a vital concern.
(All
As a future experiment, one could subject the test person to a high level of noise (100 dB) before the test and repeat the above experimental protocol. It would be interesting to investigate the increased sensitivity of an individual to random noise preceded by a period of "composed quietness" to determine if his reaction is more or less as compared to this data.
George C . Marshall Space Flight Center National Aeronautics and Space Administration
Marshall Space Flight Center, Alabama, March 31, 1970 93 1-31- 19-00-62
30
APPENDIX
31

I I I I I I I I I

REHABILITATION CENTER DEPARTMENT OF AUDIOLOGY
HISTORY FORM
EXAMINER Trobaugh
DATE September 29, 1969
ROUTINE INFORMATION
FULL NAME: A AGE 33 BIRTHDATE: March 6, 1936
ADDRESS: COUNTY :
PHONE NUMBER: OCCUPATION NASA
REFERRED BY:
CHIEF COMPLAINT: None
PATIENT'S EVALUATION - OF HEARING PROBLEM
DATE OF ONSET:,
UNDER WHAT CIRCUMSTANCES:
PROGRESSION OF LOSS:
CAUSE OF LOSS:
FAMILY HISTORY OF HEARING LOSS: Yes No X
Relationship when (age)
Relationship when (age)
MEDICAL TREATMENT FOR HEARING LOSS:
When by whom
Diagnosis treatment
MEDICAL HISTORY
GENERAL HEALTH: Very Good
SERIOUS ILLNESS : None
CHILDHOOD DISEASES: mumps, measles, chicken pox, scarlet fever, others
EAR DRAINAGE: None
EAR ACHES: _ _ Very Few
33
I
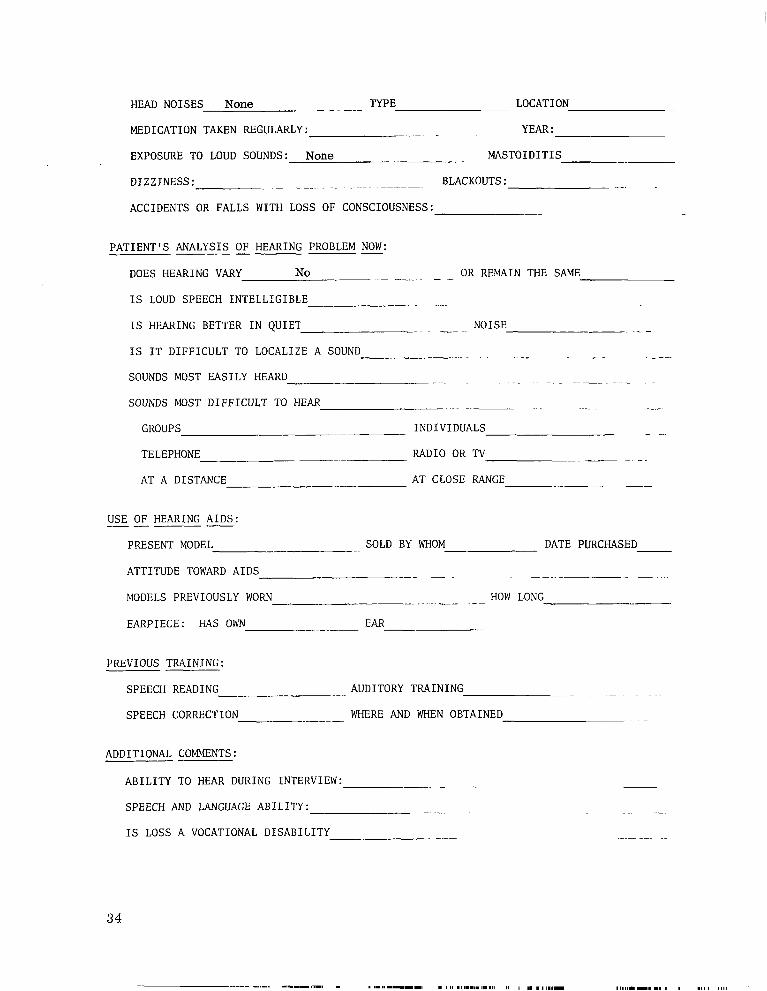
HEAD NOISES None ~~~ - - - __ TYPE LOCATION
MEDICATION TAKEN REGULARLY:
EXPOSURE TO LOUD SOUNDS: None __ ~ MASTOIDITIS
YEAR : ~ - . -
DIZZINESS: - ~ _ _ _ _ BLACKOUTS: . ~ _ _
ACCIDENTS OR FALLS WITH LOSS OF CONSCIOUSNESS: ~~ ~-
PATIENT’S ANALYSIS OF HEARING PROBLEM E: - OR REMAIN THE SAME - - DOES HEARING VARY No
IS LOUD SPEECH 1NTELLIGIBL.E --
~- - .. - NOISE -- - IS HEARING BETTER IN QUIET
IS IT DIFFICULT TO LOCALIZE A SOUND
SOUNDS MOST EASILY HEARD
SOUNDS MOST DIFFICULT TO HEAR
. . - -. . . - - - _
.. .. , . ..., - - . -~ _ _ - . ~ .
. . .. ~ .... ~.~ ~ ~ ~ ~I ..
_ _ ~ -- GROUPS - INDIVIDUALS
RADIO OR TV TELEPHONE
AT A DISTANCE AT CLOSE RANGE
~ - -. -__-
____
USE OF HEARING AIDS: -____- PRESENT MODEL SOLD BY WHOM - DATE PURCHASED
ATTITUDE TOWARD AIDS
MODELS PREVIOUSLY WORN - --- I-- HOW LONG
EARPIECE: HAS OWN
I__-
~ - - ~- -- -
- EAR ~-
PREVIOUS TRAINING:
SPEECH READING - ~ - AUDITORY TRAINING -
WHERE AND WHEN OBTAINED SPEECH CORRECTION - ---- -
ADDITIONAL COMMENTS:
ABILITY TO HEAR DURING INTERVIEW: -- -
SPEECH AND LANGUAGE ABILITY:
IS LOSS A VOCATIONAL DISABILITY - __
34

AUDIOLOGICAL ASSESSMENT
RE: A ADDRESS: Decatur, Alabama BIRTHDATE: March 6, 1936 DATE OF EVALUATION: September 29, 1969
A w a s seen at the Rehabilitation Center in Huntsville, Alabama for an audiological assessment September 29, 1969 to rule out any possibility of a hearing loss. A is an employee at MSFC in Huntsville, Alabama and is participating in the audiological research study associated with the Physiological Laboratory at MSFC under the direction of Dr. Robert E. Allen.
A case history w a s obtained when the subject came to the Center. This provided information concerning noise exposure as wel l as pertinent medical history. general health is good, and he has never suffered excessive ear aches o r ear drainage.
The subject reported no complaints with his hearing. His
He reported no exposure to loud sounds.
Hearing acuity w a s assessed utilizing pure tones and speech audio- metric techniques with resul ts on the enclosed audiogram. A Beltone Audiometer (Model 15C), calibrated according to 1964 IS0 Standards, was used in the study.
The subject w a s first tested by air conduction commencing with the right ear. The frequencies tested w e r e 1000, 2000, 4000, 8000, 500, 250, and 125 Hz. A descending psychophysical method w a s used to obtain the thresholds. The subject w a s found to have hearing within normal limits. Bone conduction thresholds were then assessed by the same procedure; testing frequencies w e r e 1000, 2000, 4000, 500, and 250 Hz. His bone conduction thresholds were also within normal limits.
Speech audiometric techniques w e r e assessed with the same audiom- eter. Speech reception thresholds w e r e obtained with live voice utilizing spondee words; The subject's speech reception threshold w a s 6 dB in the right ear and 3 dB in the left ear. Speech sound discrimination w a s assessed in a like manner with the use of Harvard's phonetically balanced word lists. The subject's discrimination score w a s 98 percent in the right ear and 96 percent in the left ear.
35

In summary, the subject's hearing w a s found to be within normal limits, He i s , therefore, considered a good candidate for the audiological experiment to be carr ied out in conjunction with the Physiological Laboratory at MSFC .
Submitted by:
Roma Leah Trobaugh Senior A udiologis t
36

Address ~ Telephone
Panont'n Rapat Plnt Notisad DIHisuiW: ~ AWL Y m of h- Caw. . . ~-
- 9-29-69
I n 1 N U "
AudIoloqLt Trobaugh
I
REHABILITATION CENTER HEARING DEPARTMENT 316 LONGWOOD DR., S. W. (AUDIOLOGY) HUNTSVILLE, ALABAMA 35801
AUDIOLOGICAL EVALUATION
H o d u r ~ For Rue Tones
2000
hudiog"
I BIGHI 0 = Right
, X X L H .oooiboo/ ZOO0 , , 125 250 500 1WO I I 1 1
1000
-10
0 10
Ihnshold.
Mmklrq LV.1 In
I C --+ q E m
Riqhi
L d l -
I 1
Additional Tent Ranulb
37
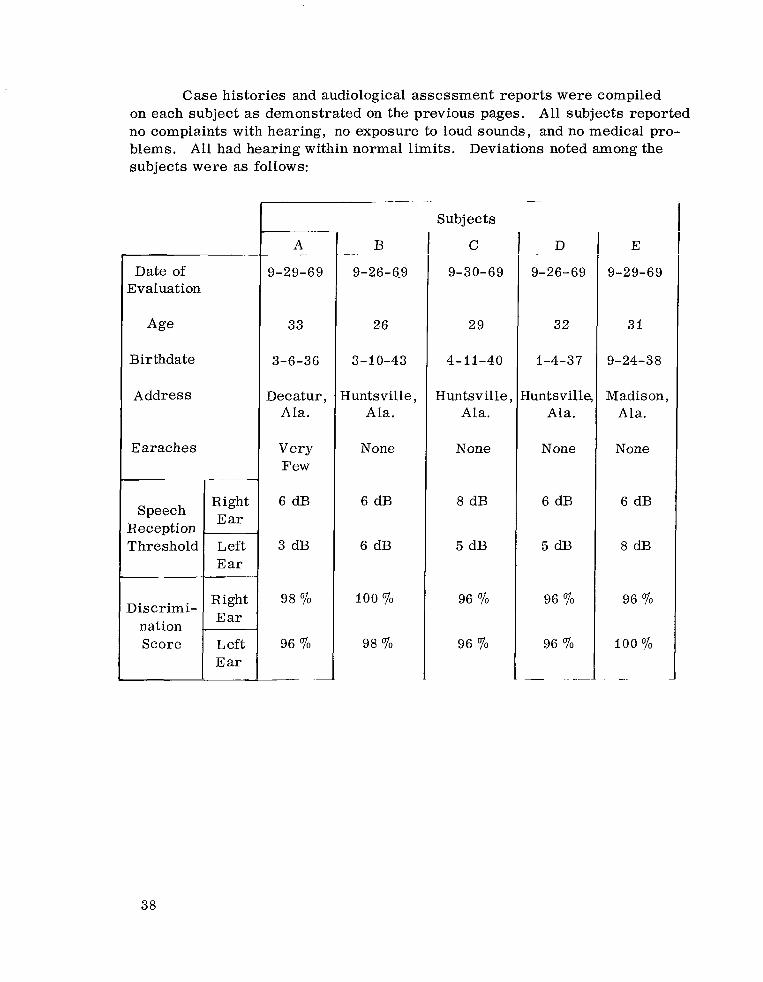
Case histories and audiological assessment reports were compiled on each subject as demonstrated on the previous pages. no complaints with hearing, no exposure to loud sounds, and no medical pro- blems. All had hearing within normal limits. subjects were as follows:
All subjects reported
Deviations noted among the
Date of Evaluation
Age
Birthdate
Address
Earaches
Speech Reception Threshold
Discrimi- nation Score
- ~
Right E ar
Left E ar
Right E ar
~ ~
Left E ar
A
9-29-69
-
33
3-6-36
Decatur , A la.
Very Few
6 d B
3 dB
98 70
96 TQ
_ _ - ~
~
B
9- 2 6 - 6-9
- .. .
26
3- 10-43
Huntsville, A la.
None
6 dB
6 dB
100 7 0
98 YQ
S ubj ec t s
C
9- 3 0- 6 9
29
4- 11-40
Huntsville Ala.
None
8 dB
5 dB
96 70
96 70
-
D
9-26-69
32
1-4-37
luntsvilk Ala.
None
6 d B
5 d B
96 YQ
96 '%
~
I I E
9-29-69
3 1
9-24-38
Madis on , Ala.
None
6 dB
8 dB
96 '%
100 70
-.
38

REHABILITATION CENTER HEARING DEPARTMENT 316 LONGWOOD DR., S. w. (AUDIOLOGY) HUNTSVILLE, ALABAMA 35801
AUDIOLOGICAL EVALUATION N e e B A q e L se M
Aqo:- Ymm 01 I a m r Audio1ogi.t Trobau
B.tto1.r Em: 0 Riqht Lett 0 Same
Addrens - ~ --Telephone
Pdent's Report First Noticod Difficulty: None Causa
Has Trouble Hearing: 0 Individuals 0 Groups 0 Men 0 Women/Children 0 Telephone Radio/TV 0 &lis &&g: 0 Constant 0 V d e s iiourlnv Todw. 0 Bettpr 0 Some 0 Worse Cold Todq: Yes 0 No Iinnitu.: Constant [7 Occasional None Right 0 Left Both Loud Sound. Annoying: 0 Yes 0 NO
Hear Bettar in: 0 Noise Quiet
i
Thresholds
Mmkins b1.1 In o p p a 1 u Em
Heminq For Rue Tones I
2000
I
I _. .- .
Audiogram
I 4000 1
Pure Tone Summmy I Average Loss W i l h i Sweh Rrmge
AC I 1 Em I 2-Frsq. ' Right
1 Loh 0 __ ...
H-~J For Speech
ive Voice .-Recorded . . _- --1 ~ ..
E-
Riqht
La11
Phonos
Sound Field
6 db I 100 %I db I
6. db
db
db
98
Additional Test Fle8Ult.
I
-.
Address
r i 5 c I--
1 Thresholds
Pure Tone Summary
I
2-Fmq. Right
Hearing For Speech Additional Test Result.
40

REHABILITATION CENTER 316 LONGWOOD D R . , S. W. HEARING D E P A R T M E N T
(AUDIOLOGY) HUNTSVILLE, A L A B A M A 35801
AUDIOLOGICAL EVALUATION
Address ._ ~ Telephone
Patient's Report First Noticed Dlfflcult).: Aqcr.:- Y w n of Lou;
CaU. ~- ~ -
Dab 9-26-69
1m.t Nu"?
AudiolopLt Trobaugh
l ~ v e Voice
0
I h
Ea,
RSqht
L.*
Phon"
Sound Fhld
Hearing For Pure Tones
500
I 500
BlGIiI 1000 2000
L ---I I
.IO
10 O?
20
30 40
5 0
Heating For Speech I
sp..sh R.nplian
nG..hoid lSR1)
6 d b
5 d b
db
db
I Audiogmm
0 = Right
I -Recorded =
96 QO 46 db
96 % / 45 dbl 1
Pure Tone Summary
Additional Test Resulb
M a t G a m t d L Lo&... L.r.1 nnnl
41

REHAB I L I TAT I ON CENTER 316 LONGWOOD DR., S. W. HUNTSVILLE, ALABAMA 35801
HEARING DEPARTMENT (AUDIOLOGY)
AUDIOLOGICAL EVALUATION
9-29-69 Telephone-
E Ncnpe ~
Addrees- _- __ ..
Patient's Report Test Nvmber First Noticed D i t t i c u l t y : ~ . . -. Aqm:- Yo- of Leu:-
Cause . - Has Troub:e Hearing Individuals 0 Groups [7 Men Women/Children 0 Telephone 0 RodiofTV 0 Bells Hemins: 0 Constant V d e s Homing Today: 0 Better Same 0 Worse Cold Todq: Yes 0 N o Iinnitus: Constant 0 Occasional None 0 Righl 0 Left 0 Both Loud Sounds Annoying: 0 Yes NO Hear Better in: 0 Noise 0 Quiet Better Em: Rlght Left Same
Audiologist T r O b a g &
~~
Hecning For Pure Tones Audiog" ~- ___.
~ I RIGHT 1 r 0 = Right x = I a f t
- ..
Thresholds
-.
MUSking Level In Oppoalle
Ear
. i loo0 I 1 I
Threshold#
.-
Moaking Lord In Oppaile I . E=--
[ .? t"! h C - - 3 J I I
2000
-.
REMARKS:
-. - . _ _ -
Hearing For Speech --
4000 I 8000 t 125- 250 500 1000 .~
4000 I I
&+A Yf
I I 1 I I i
- 1 I 1 Pure Tone Summary
Righl
Spssch Recaption
Th-reshold (SRT)
- 6 ' J b
8 d b
Discrimination Score IPB Mm.) 1 - ~~
PB Score PB Lor81
96 46
100 % 48 'Jb
. . ..
Additional Test Results
I-
42

REFERENCES
1. Lelimann, G. : Man and Noise. Handbook of Physiology, American Physiological Society, Washington, D. C. , 1964.
2. Lehmann, G. : The battle against noise - an important task for prophylactic medicine. German Medical Weekly, 82, 1957, pp. 465-470.
3. Jansen, G. : The influence of noise at manual work, International Journal of Applied Physiology, 20, 1963, pp. 233-239.
4. Oppliger, G. ; and Grandjean, E. : Vasomotor reactions of the hand to noise stimulation. Swiss Physiology Acts, 17, 1959, pp. 275-287.
5. Lehmann, G. ; and Tamm, J. : The influencing through noise of the vegetative functions of man. Research Report 517 of the Economics and Travel Department, West German Publishing House, Cologne, 1958.
6. Silink, K. U. ; and Sedlacek, K. : The psychothermic reflex. Eas. L6k. e e s . , 1942, pp. 1701-1702.
7. Janseii, G. ; and Rey, P. Y. : The effect of the band width of noise on the strength of vegetative reactions. Applied Physiolo,gy, 19, 1962, pp. 209-217.
International Journal of
8. Krylov, Y. V. : Effects of certain space flight factors on auditory reactions in man. Kosmicheskaya Biologiya i Meditsina, 1, 1967, pp. 84-89.
43
1 1 1 1 I I I I 111 11111 I 11111111111.1111-m.1111111 11.....--11.1
BIBLIOGRAPHY
Armstrong, H. G. (Ed. ): Aerospace Medicine. The Williams & Wilkins Co. , Baltimore, 1961.
Glorig, A. (Ed. ): Audiometry. The Williams & Wilkins Co. , Baltimore, 1965.
Heath, R. G. ; and Tabb, H. G. (Ed. ) : Effects of high intensity-low frequency sound pressure f rom rocket engines. Unpublished study, Tulane University, 1965.
Jansen, G. ; and Klensch, H. : The influence of the sound stimulus and music on the ballistogram. International Journal of Applied Physiology, 20 , pp. 258-270.
Jansen, G. ; and Schulze, J. : Examples of sleep disturbance through noise. Clinical Weekly, 42, 1964, pp. 132-134.
Lehmann, G. ; and Meyer-Delius, J. : Vascular reaction of the body periphery to sound effects. Research Report 517 of the Economics and Travel Department, West German Publishing House, Cologne, 1958.
Lienert, G. A. ; and Jansen, G. : Noise influence and test performance. International Journal of Applied Physiology, 20, 1964, pp. 207-212.
Lipscomb, D. M. : Noise in the environment: the problem. Maico Audiological Library Series. Volume VIII, 1969.
Lord, P. ; and Thomas, F. L. (Eds. ) : Noise Measurement and Control. Heywood & Company Ltd. , London, 1963.
McFarland, R. A. : Human Factors in Ai r Transportation, McGraw-Hill Book Co. , Inc. , New York, 1953.
O'Neill, J. J. ; and Oyer, H. J. : Applied Audiometry. Co., New York, 1966.
Dodd, Mead and
Peterson, A. P. ; and Gross, E. E. , Jr. (Eds. ): Handbook of Noise Measurement. General Radio Company, West Concord, Massachusetts, 1963.
44

B I BLIOGRAPHY (Concluded)
Sells, S. B. ; and Berry, C. A. : Human Factors in Jet and Space Travel. Ronald Press Co., New York, 1961.
Slager, U. T. : Space Medicine, Prentice-Hall, Inc., Englewood Cliffs, New Jersey, 1962.
Stevens, S. S. (Ed. ) : Handbook of Experimental Psychology. John Wiley & Sons, Inc., New York, 1951.
NASA-Langley, 1970 - 5 M364 45

NATIONAL AERONAUTICS AND SPACE ADMINISTRATION WASHINGTON, D. C. 20546
- . OFFICIAL BUSINESS FIRST CLASS MAIL
POSTAGE A N D FEES PAID NATIONAL AERONAUTICS A N D
SPACE ADMINISTRATION
05U 001 30 51 3 D S 70240 00903 A I R F O R C E WEAPONS LABORATORY /WLOL/ KIRTLANO AFB, NEW M E X I C O 87117
. A T T E . LOU BOWMAN, CHIEF,TECH* L I B R A R Y
If Undeliverable (Section 158 Postal Manual) Do Not Return
- - . __ . ~- -~
“The aeroiiaitticnl and space activities of the United States shall be coizdwted so as t o contribute . . . t o the expnizrioiz of hz~tuan hnozul- d g e of phenomeiza ii2 the atmospheve ai2d space. T h e Admiizislrntioit shall pvozGde for the widest practicable ar2d appropriate dissenzi?zatioiz of inforwation corzceri2iizg its activities and the results thereof.”
-NATIONAL AERONAUTICS A N D SPACE ACT OF 1958
NASA. SCIENTIFIC AND TECHNICAL PUBLICATIONS
TECHNICAL REPORTS: Scientific and technical information considered important, complete, and h lasting contribution to existing knowledge.
TECHNJCAL NOTES: Information less broad in scope but nevertheless of importance as a contribution to existing knowledge.
TECHNICAL MEMORANDUMS : Information receiving limited distribution because of preliminary data, security classifica- tion, or other reasons.
TECHNICAL TRANSLATIONS: Information published in a foreign language considered to merit NASA distribution in English.
SPECIAL PUBLICATIONS: Information derived from or of value to NASA activities. Publications include conference proceedings, monographs, data compilations, handbooks, so~ircebooks, and special bibliographies.
TECHNOLOGY UTILIZATION PUBLICATIONS: Information on technology used by NASA that may be of particular interest in commercial and other non-aerospace applications. Publications include Tech Briefs, TEchnology Utilization Reports and N ~ ~ ~ ~ , and Teclinology Surveys.
CONTRACTOR REPORTS: Scientific and technical information generated under a NASA contract or grant and considered an important contribution to existing knowledge.
Details on the availability of these publications may be obtained from:
SCIENTIFIC AND TECHNICAL INFORMATION DIVISION
NATlO NA L AERO N AUT1 CS AND SPACE AD MI N ISTRATIO N Washington, D.C. 20546