stress and displacement analysis of a hawt under time
TRANSCRIPT
STRESS AND DISPLACEMENT ANALYSIS OF A HAWT UNDER TIME-VARIABLE WIND
Radostina Petrova Technical University of Sofia,
Sliven, Bulgaria E-mail: [email protected]
Hirpa G. Lemu University of Stavanger, Stavanger, Norway
E-mail: [email protected]
ABSTRACT The article presents a study conducted to analyze the
vulnerable zones of horizontal axis wind turbine (HAWT) wings, the nacelle, and the tower during the rotor revolution. The objective of the study is to establish relations between the extreme values of the investigated variables (wind velocity and pressure, von Mises stresses, displacements, etc. vs. angle of rotation or position of the rotor) in order to explore the vulnerable zone. The numerical model, as a computer-aided design (CAD) model geometry of the turbine assembly, was developed using freeform outline of the blade profile according to a previously designed twisted and tapered blade shape and a simplified outline of the nacelle. The tower was assumed to be made of a pipe and unites pipes of increasing diameter; hence its outline is a conic form. All solid bodies, i.e., blades of fiber glass composite and the tower and nacelle of alloy steel, are meshed using parabolic tetrahedral finite elements. The article demonstrates the used simulation technique and the results that are visualized using diverse graphical tools. Though it is hard to precisely point out the location of the vulnerable zone, the results indicate that the highest stresses appear along the trailing edge when the blade is in vertical direction. Keywords: HAWT, CFD, FEM, CAD/CAE analysis, wind turbine blade, stress-displacement analysis
INTRODUCTION
In response to the increasing demand for renewable energy sources, diverse wind turbine types and sizes are appearing in the market. Among the available designs, the horizontal axis wind turbine (HAWT) is often mentioned as the most common and versatile type of wind turbines [1]. The root cause of the diversity of the wind turbine design types is basically the need to extract the maximum possible energy available in the wind. To enable an efficient or maximized energy conversion process that guarantees economic feasibility of the wind energy based
business, previous studies [2] indicated that the solution lies in innovative design solutions and designs that reduce mechanical losses. These endeavors require in depth understanding of the stress-displacement profile of among others the blade and the total structure. The turbine blade is in particular considered as the key performance factor of the turbine and thus the major part of research in turbine design has focused on the shape, airfoil, materials, number of blades, structure and processing technology of the blade [3 -5]. Among these, the size, number, shape and airfoil form of the blades influence the aerodynamics around the turbine and highly affect the structural performance of the whole unit.
Today, there exist a number of Computer-aided Engineering (CAE) tools developed for flow and structural analysis. For instance, Computational fluid dynamics (CFD) simulation in flow field analysis is a key tool that can provide knowledge about the flow characteristics using graphical illustrations such as flow lines, contour lines and iso-lines [6]. For this purpose, aerodynamic models in 3D are developed and used to solve pressure and velocity variables mainly adopting Euler or Navier-Stoke equations combined with customized algorithms for specific purposes [7 – 9]. The pressure distribution is particularly important in practical terms to determine the external forces on the turbine blade and the rest of the structure. Similarly, the structural components are analyzed using Finite Element and Finite Volume Methods (FEM/FVM) that are currently widely used in simulation of structural strength in both static and dynamic loads. Among other algorithms, blade element and momentum (BEM) theory, flat element theory and classical beam theory are adopted as the calculation bases of the above-mentioned CAE simulation tools. BEM is widely used in design and analysis of turbine blades mainly due to its simplicity, lower computational cost and computation speed [10]. In an effort to understand how design verification related costs can be reduced, the authors have studied the aerodynamic and structural (modal) 3D analysis of a wind turbine blade at
Proceedings of the ASME 2014 International Mechanical Engineering Congress and Exposition IMECE2014
November 14-20, 2014, Montreal, Quebec, Canada
IMECE2014-37018
1 Copyright © 2014 by ASME

selected wind velocities and wind directions using virtual wind tunnel simulators [11].
As continuation of previous works of the authors [2, 11, 12], the objective of the work presented in this article is to contribute to better understanding of the vulnerable zone of the HAWT by performing stress-deformation analysis of the blades under time-variable wind loads. After presenting the adopted physical and mathematical models, the article discusses the simulation results of the pressure and velocity field distribution followed by the resulting stresses and deformations in the turbine blade. The effect of the other HAWT parts, such as the tower and the nacelle, when calculating the wind pressure is also considered.
DESCRIPTION OF THE PHYSICAL MODEL
In this study, numerical simulation of a horizontal axis wind turbine is conducted aimed to investigate the stress and deformation profile of the blade under time-variable wind. The considered turbine has a tower height of about 11 m and blade length of about 5.5 m. The turbine dimensions are assumed based on the geometry given according to a NASA airfoil profile [2]. The blades are tapered and twisted around their axis with screwed end (Fig. 1). The turbine geometry design is close to the one tested in NREL “Unsteady Aerodynamics” project [13]. It is assumed that the blades are made of a composite material Constuctex™Uniweave. In the simulation work, the material characteristics are taken from [14]. The material of the nacelle, the tower and that of the rotor and the transmission is assumed to be alloy steel.
The analysis was conducted by exposing the wind turbine to a wind excitation at a high speed, i.e. 20 m/s, which is significantly higher than most profitable wind speed for that type of HAWT. When exposed to such high wind loads the turbine is stopped and the blades are parked.
MATHEMATICAL MODELS AND THE ADOPTED ALGORITHM
In order to study the dynamic response of the wind turbine, modeling and analysis work was performed based on a developed Computer-aided design (CAD) model and then finite element (FE) model of the assembly at the preliminary stage of the work. The rest of the analysis was conducted using a double-staged CAE analysis approach whose analysis workflow is described as follows: Stage I: CFD analysis
Performing a flow-simulation analysis of the turbine parts due to oncoming wind. To conduct this analysis, finite volume method is adopted and the pressure over the turbine blades versus wind velocity and direction is calculated.
Transferring the results of the flow-simulation analysis to the FE model of the blades.
Stage II: Stress-deformation analysis
Performing a FE stress-deformation analysis of an HAWT, based on the previously calculated pressure.
Evaluating the obtained results.
The analysis is performed within SolidWorks software, particularly the FlowSimulation [15] and SolidWorks Simulation [16] packages environment. Though, there exist some other relevant and powerful software tools such as Comsol Multiphysics, ANSYS CFX, ADAMS, etc. that can be used to develop the analysis,, the authors decided to rely on SW packages because of the close interaction between the tools for CAD modeling and the tools for conducting CFD analysis and other CAE analyses. The integrated CAE environment facilitates automatic transfer of design data to the analysis and simulation models, which makes the early stages of the design easier and quicker. Each of the other above-mentioned software is suitable for a particular precise research (flow-structure interaction, multibody dynamics simulations, etc.). Developing the assembled CAD model of the wind turbine
As stated, the CAD models of all considered HAWT parts are developed in Solid Works environment (Fig. 1). The blades are modeled using freeform complex surfaces. The coordinates of their guiding points and lines are calculated in advance and the data for all 3D-curves is directly imported into SW. Upon establishing the basic geometry of the blades, all solid body entities are developed by diverse 3D geometry generating techniques such as lofting, revolving, cutting, etc.
Further, in order to include all significant parts needed to make the investigation, particularly the blades, the nacelle, and the tower, and some less important but still mandatory parts as shafts and gears of the rotor, the turbine structure is assembled. The materials of all parts are introduced directly to the developed FE model. The mates in the assembly allow the rotation of the rotor around its axis and hence the geometry of the turbine can easily be modified.
Fig. 1. The CAD model of the studied wind turbine
2 Copyright © 2014 by ASME

Stage I: CFD analysis
This section discusses the procedure used to perform the flow-simulation analysis of the HAWT parts due the oncoming (flying-by) wind using the CFD simulation module of the software. In a fluid flow related simulation and analysis research, CFD modeling is becoming a crucial tool to understand airflow behavior around an object. In wind turbine research in particular, CFD modeling and simulation helps to study and visualize the airflow velocity profiles and air pressure distribution around the turbine blades and the rest of the structure. In the flow simulation conducted in this study, the impact of the oncoming wind was studied without accounting for the impact of the near-by turbines on the trajectories of the air particles. In order to outline the vulnerable zones of the blades, a high velocity wind (20 m/s) is assumed. At that velocity the brake system of the turbine is switched on and the blades are parked. Different positions of the blades are shown in Fig. 2 and 3. For consequent designations in the analysis work, the axis that is perpendicular to the plane of the rotor is denoted as Z.
Three different cases or scenarios of the direction of the angle of attack were considered (Fig. 2):
Scenario 1: the wind attacks the turbine blade in direction parallel to Z (i.e., at an angle of 0); Scenario 2: the wind attacks the turbine blade at 45 with respect to Z-axis; Scenario 3: the wind attacks at 90 with respect to Z-axis.
For each case, four possible positions of the blades were considered (Fig. 3). These positions are given by the angle between the blade nr 1 and the vertical axis and are equal to 0, 30, 60 and 90. Based on these scenarios, the pressure of the moving wind upon each of the three blades is calculated. Furthermore, the data about the pressure of the wind upon each entity (edge, face, vertex, etc.), which outlines the shape of the wind turbine is obtained and saved. The vortices, turbulence, trajectories of the fluid particles and other features describing the fluid-structure interaction are additionally calculated.
Fig. 2. Angles of wind attack
a) 0
b) 30
c) 60
d) 90
Fig. 3. Different studied positions of the rotor This stage enables, among others, the calculation of the
numerical data that describes the fluid-structure interaction where the HAWT behavior is studied using a “virtual wind tunnel” simulation. It is worthy to mention that a true wind tunnel analysis, without considering the scale factor of an object of that size is not reasonable and adequate. As discussed by the authors in a previous publication [11], the idea of a “virtual wind tunnel” simulation enables analysis of the turbine performance at lower effort, time and money.
The turbine is situated inside the computational domain that totally wraps the turbine. The size of the computational domain is twice as big as the vertical size of the turbine and exceeds more than 10 times its size along the Z axis. This domain realizes the idea of the above-mentioned “virtual wind tunnel”. An inner sub-domain, shown in Fig. 4 and close to the HAWT is formed inside the first domain. The volume cells in the inner domain are twice smaller, compared to those inside the outer one. As they come closer to the solid body their size decreases (Fig. 5).
3 Copyright © 2014 by ASME

Fig.4. The sub-domain for the shown results
Fig. 5. The local initial mesh
Fig. 6. The flow trajectories within HAWT domain at 0 angle of wind attack (a) flow velocity and (b) total pressure
In order to calculate the boundary layers between the solid
bodies (parts of the HAWT) and the fluid cells (the wind), the finite volume method (FVM) approach was adopted. The local initial meshes (Fig. 5), where the fluid cells are colored in blue and the partial cells are green were introduced using a double refinement of the boundary domain.
The analysis provides the trajectories of the air particles, the iso-lines of wind velocity, the total pressure and the dynamic pressure, etc. within the defined computational domain. The values of the total and the normal force acting on each surface of the blades and nacelle are also calculated and used as convergence goals throughout the analysis.
Further, CFD analysis provides the graphs of the pressure loads along the edge of attack and of the trailing edge of each blade (Fig. 6). This enables visualization of the contours of the total pressure (or the dynamic pressure, the shear forces, or any other feature calculated during CFD analysis) along the leading and trailing edge of the blade as a function of rotor rotational position, considering different angles of wind attack. Transferring flow-simulation results to FEA model
Upon completing the computation of the CFD, the software allows transferring the results to the FE model automatically. A definite plus to the adopted algorithm and the software platform is the existing close interaction between CFD analysis and the FEA. The results of CFD are treated as external loads applied to the studied turbine structure. At this stage, it is possible to account for or to neglect the shear stresses due to wind pressure. As the shear stress loads are very small compared to the pressure, the presented analysis selected the second option. To proceed with the FEA, the materials and the boundary/ contact conditions between parts of the turbine are introduced. An example of the pressure loads (nodal pressure forces) for a single position of its structure is given in Fig. 7. The pressure load values are obtained as the result of the air – turbine structure interaction for the configuration shown in Fig. 6.
Fig. 7. The plot of the nodal values of the transferred wind pressure to the FE model for the scenario in Fig. 6
4 Copyright © 2014 by ASME
Stage II: Stress-deformation analysis
The FE model of the turbine assembly was developed based on the CAD model assembly. At this stage of the process, there is no previous interaction between the finite volume and finite element models in the adopted algorithm and thus the consequence of the performance of CFD analysis and the development of FE model is not crucial for the success of the analysis.
Upon establishing the geometrical model, specification of the material model or properties and boundary conditions are the essential parts of any finite element analysis process. In the developed FE model, the materials of all components considered as part of the HAWT are defined. The boundary condition of the model is defined in such a way that the bottom surface of the tower is fixed. Furthermore, the load on the blades is transferred from the low speed shaft to the high speed shaft via a gear transmission system whose deformation and dynamic analysis are out of the scope of this work. Therefore, the exact geometrical and elastic properties of the transmission system are not considered here.
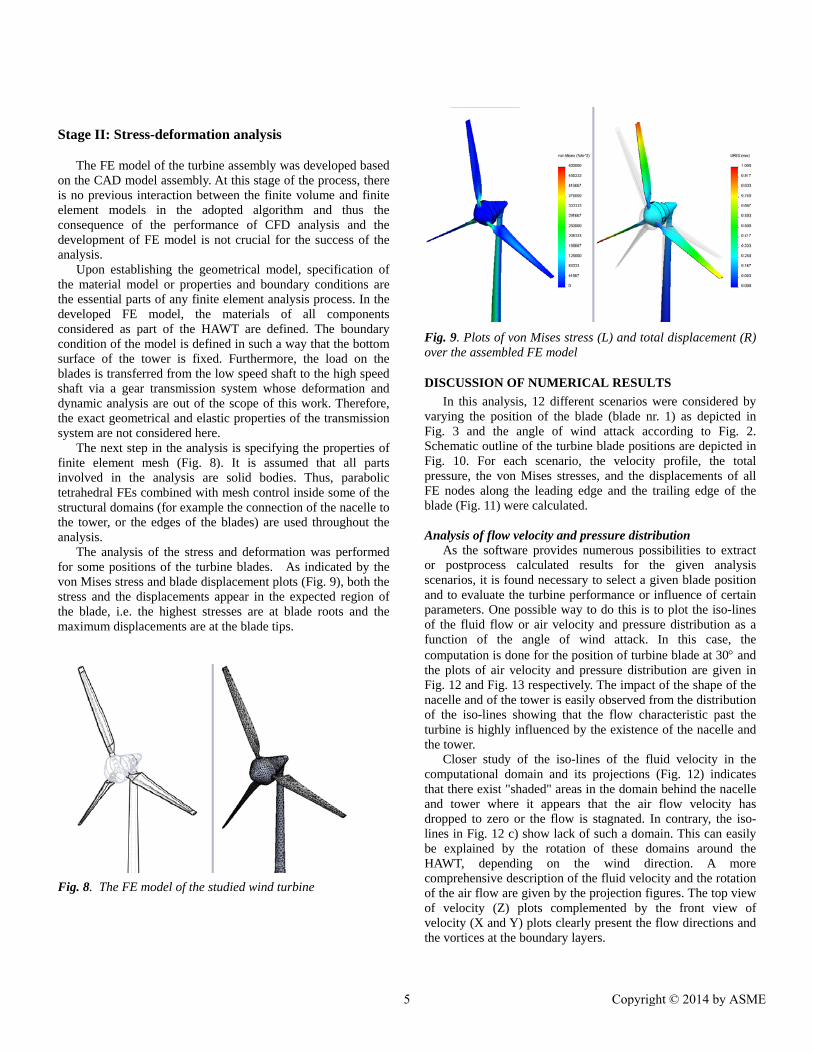
The next step in the analysis is specifying the properties of finite element mesh (Fig. 8). It is assumed that all parts involved in the analysis are solid bodies. Thus, parabolic tetrahedral FEs combined with mesh control inside some of the structural domains (for example the connection of the nacelle to the tower, or the edges of the blades) are used throughout the analysis.
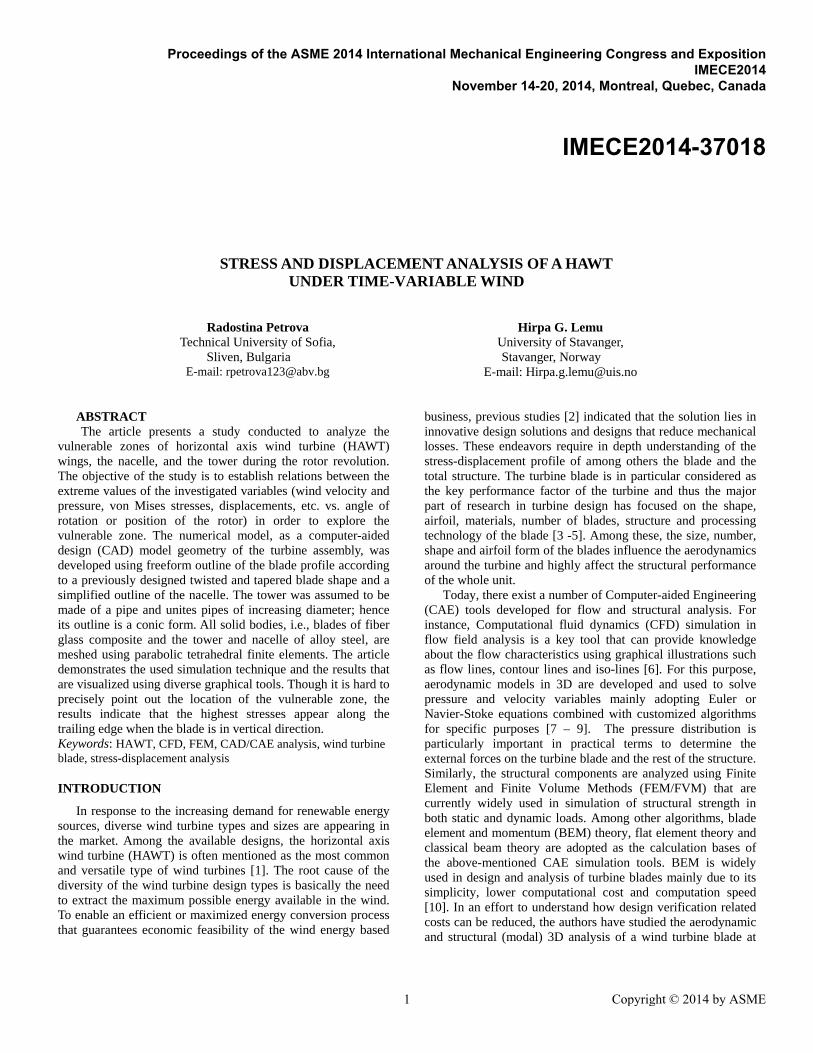
The analysis of the stress and deformation was performed for some positions of the turbine blades. As indicated by the von Mises stress and blade displacement plots (Fig. 9), both the stress and the displacements appear in the expected region of the blade, i.e. the highest stresses are at blade roots and the maximum displacements are at the blade tips.
Fig. 8. The FE model of the studied wind turbine
Fig. 9. Plots of von Mises stress (L) and total displacement (R) over the assembled FE model
DISCUSSION OF NUMERICAL RESULTS
In this analysis, 12 different scenarios were considered by varying the position of the blade (blade nr. 1) as depicted in Fig. 3 and the angle of wind attack according to Fig. 2. Schematic outline of the turbine blade positions are depicted in Fig. 10. For each scenario, the velocity profile, the total pressure, the von Mises stresses, and the displacements of all FE nodes along the leading edge and the trailing edge of the blade (Fig. 11) were calculated.
Analysis of flow velocity and pressure distribution
As the software provides numerous possibilities to extract or postprocess calculated results for the given analysis scenarios, it is found necessary to select a given blade position and to evaluate the turbine performance or influence of certain parameters. One possible way to do this is to plot the iso-lines of the fluid flow or air velocity and pressure distribution as a function of the angle of wind attack. In this case, the computation is done for the position of turbine blade at 30 and the plots of air velocity and pressure distribution are given in Fig. 12 and Fig. 13 respectively. The impact of the shape of the nacelle and of the tower is easily observed from the distribution of the iso-lines showing that the flow characteristic past the turbine is highly influenced by the existence of the nacelle and the tower.
Closer study of the iso-lines of the fluid velocity in the computational domain and its projections (Fig. 12) indicates that there exist "shaded" areas in the domain behind the nacelle and tower where it appears that the air flow velocity has dropped to zero or the flow is stagnated. In contrary, the iso-lines in Fig. 12 c) show lack of such a domain. This can easily be explained by the rotation of these domains around the HAWT, depending on the wind direction. A more comprehensive description of the fluid velocity and the rotation of the air flow are given by the projection figures. The top view of velocity (Z) plots complemented by the front view of velocity (X and Y) plots clearly present the flow directions and the vortices at the boundary layers.
5 Copyright © 2014 by ASME

Fig. 10. Scheme of all studied positions of the wind turbine blade
Fig. 11. Scheme of the edge of attack and of the trailing edge of the wind turbine blades
X-v
eloc
ity
[m/s
]
Y-v
eloc
ity [
m/s
]
Z-v
eloc
ity [
m/s
]
6 Copyright © 2014 by ASME
Tota
l vel
ocit
y [m
/s]
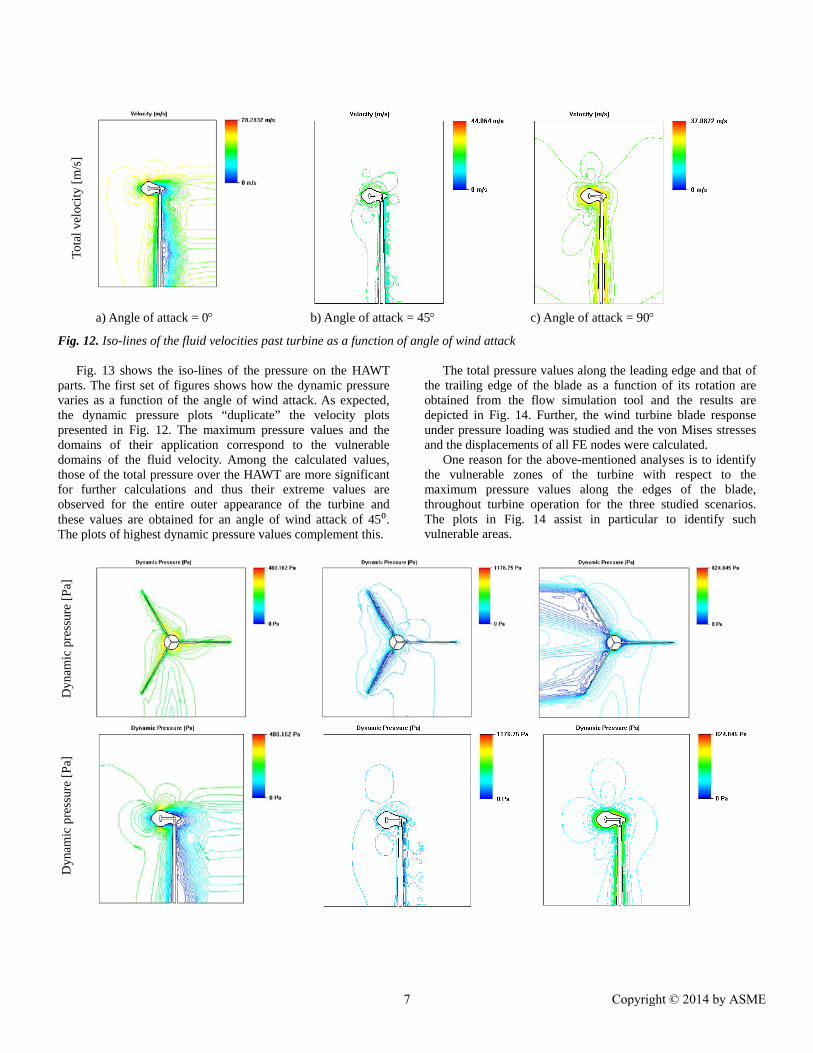
a) Angle of attack = 0 b) Angle of attack = 45 c) Angle of attack = 90
Fig. 12. Iso-lines of the fluid velocities past turbine as a function of angle of wind attack Fig. 13 shows the iso-lines of the pressure on the HAWT
parts. The first set of figures shows how the dynamic pressure varies as a function of the angle of wind attack. As expected, the dynamic pressure plots “duplicate” the velocity plots presented in Fig. 12. The maximum pressure values and the domains of their application correspond to the vulnerable domains of the fluid velocity. Among the calculated values, those of the total pressure over the HAWT are more significant for further calculations and thus their extreme values are observed for the entire outer appearance of the turbine and these values are obtained for an angle of wind attack of 45⁰. The plots of highest dynamic pressure values complement this.
The total pressure values along the leading edge and that of the trailing edge of the blade as a function of its rotation are obtained from the flow simulation tool and the results are depicted in Fig. 14. Further, the wind turbine blade response under pressure loading was studied and the von Mises stresses and the displacements of all FE nodes were calculated.
One reason for the above-mentioned analyses is to identify the vulnerable zones of the turbine with respect to the maximum pressure values along the edges of the blade, throughout turbine operation for the three studied scenarios. The plots in Fig. 14 assist in particular to identify such vulnerable areas.
Dyn
amic
pre
ssur
e [P
a]
Dyn
amic
pre
ssur
e [P
a]
7 Copyright © 2014 by ASME
Tota
l pre
ssur
e [P
a]
Tota
l pre
ssur
e [P
a]
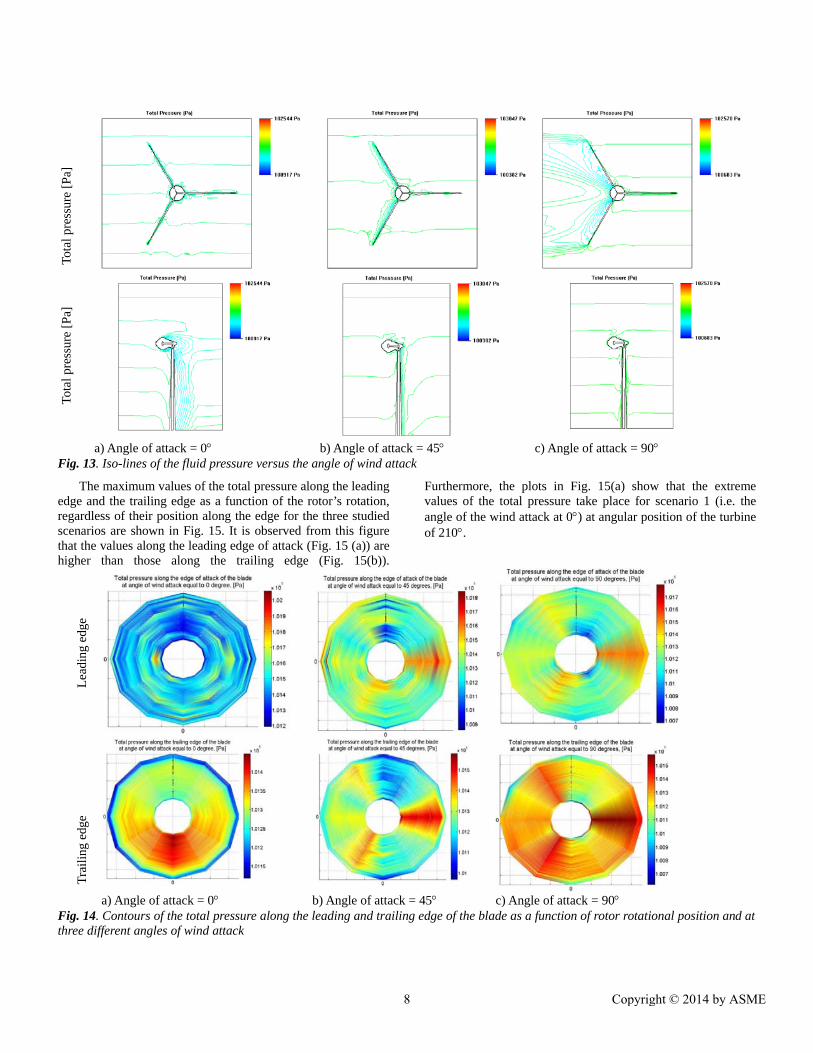
a) Angle of attack = 0 b) Angle of attack = 45 c) Angle of attack = 90 Fig. 13. Iso-lines of the fluid pressure versus the angle of wind attack
The maximum values of the total pressure along the leading edge and the trailing edge as a function of the rotor’s rotation, regardless of their position along the edge for the three studied scenarios are shown in Fig. 15. It is observed from this figure that the values along the leading edge of attack (Fig. 15 (a)) are higher than those along the trailing edge (Fig. 15(b)).
Furthermore, the plots in Fig. 15(a) show that the extreme values of the total pressure take place for scenario 1 (i.e. the angle of the wind attack at 0) at angular position of the turbine of 210.
Lea
ding
edg
e
Tra
ilin
g ed
ge
a) Angle of attack = 0 b) Angle of attack = 45 c) Angle of attack = 90
Fig. 14. Contours of the total pressure along the leading and trailing edge of the blade as a function of rotor rotational position and at three different angles of wind attack
8 Copyright © 2014 by ASME

Fig. 15. Plots of maximum values of the total pressure along (a) leading edge and (b) trailing edge of the blade
According to the results given in Fig. 14(a), where some more vulnerable zones for scenario 1 are outlined, the sought zone is observable somewhere in the middle of the blade. In the case of scenario 3 (i.e. the angle of wind attack at 90), the total pressure values are smaller, yet the vulnerable zone, when the rotation angle of the blade is about 270, is clearly outlined (Fig. 14(c)).
The corresponding values for the trailing edge are shown in the plots of Fig. 15(b). For scenario 1 the vulnerable is the zone when the angle of rotation is 0. This is clearly visible in the bottom half of the contour plot in Fig. 14 (a) (for the trailing edge) and the red graphical plot in Fig. 15(b). In this case, the highest values are for scenario 3, particularly for the angular position of the blade at about 270 (see the black graphical plot in Fig. 15(b) and the deep red zone in Fig. 14(b), bottom).
Analysis of stress state along the turbine blade
To characterize the stress state of mechanical and structural strength, von Mises stress is widely used as parameter to describe the equivalent state of stresses. Using FEA tools, the von Mises stress states of nodes are readily available. In this study, the effect of the flow loads, excluding inertial loads, is studied and the plots of the von Mises stress are given in Fig. 16.
As depicted, the smallest stresses occur for scenario 1, i.e., when the angle of the wind attack is 0. It is also noticeable that the von Mises stresses along the trailing edge compared to those along the leading edge are considerably higher for all studied scenarios. All maximum values arise at the root of the blade confirming the high bending load due to the oncoming flow. Therefore, a turbine blade structural optimization task should focus on a better stress distribution which is the following step of this study. Analysis of deformation state along the turbine blade
The nodal displacement plots along the edge of attack and along the trailing edge versus the rotor’s revolution are given in Fig. 17. Maximum displacement values are as expected at the tip of the blade. Considering the lowest stresses and the lowest values of the displacements for scenario 1, they are much smaller when compared with the rest of the scenarios into consideration. As depicted in Fig. 17(a), the nodal displacement for scenario 3 (i.e., when the wind attack angle is 90) are significantly high with respect to the rest and this peak value appears at the angular position of the blade of 330. Relatively high peak values are also observed when angular position of the blade is around 180-210. Another important conclusion that can be withdrawn from the two plots in Fig. 17 is that the displacement patterns in both cases, for all considered scenarios, are almost identical with few exceptions.
Fig. 16. The max. values of von Mises stresses vs the rotor’s revolution along (a) the leading edge and (b) the trailing edge
9 Copyright © 2014 by ASME

Fig. 17. Maximum values of nodal displacements as a function of the rotors angular position CONCLUSION
The work reported in this article attempted to shed some light on the velocity and pressure profile of the oncoming wind and the impact on the stress and displacement distribution. The CAE tool, i.e., Solid Works and the accompanying modules/ algorithms have been used to make the modeling and simulation work and the results have been processed using diverse visualization tools such as contour plots, graphs, and iso-lines. It is hard to make a precise outline, based on all solved cases studies, where the vulnerable zones is located in terms of the highest von Mises stresses in the turbine blades. However, the study results indicate that for the studied HAWT and blade geometry the highest stresses appear along the trailing edge when the blade is in vertical direction.
Though the end verification is believed to be experimental study, the implemented methodology considerably reduces the design price and spares time. It allows the establishment of optimized blade model and design verification in a virtual world, contrary to previous design practices that demanded developing scaled physical prototypes and conducting experiments in a wind tunnel. The digital prototype is obviously cheaper and shortens the product development time. References [1] Manwell, J.F., McGowan, J.G. and Rogers, A. (2009), "Wind
Energy Explained: theory, design and application", Chichester, UK, Wiley.
[2] Petrova, R. and Lemu, H.G., 2012, "Design study for dynamic behavior of wind turbine blade", In: Proc. of Int. Workshop of Advanced Manufacturing and Automation (IWAMA 2012), Tapir Academic Press, 131-138.
[3] Baoqing, X. and De, T. (2012), "Simulation and Test of the Blade Models’ Output Characteristics of Wind Turbine", Energy Procedia 17: 1201 – 1208
[4] Kong, C., Bang, J. and Sugiyama, Y. (2005), "Structural investigation of composite wind turbine blade considering various load cases and fatigue life", Energy, 30, 2101–2114.
[5] De, T., Mingguang, D. and Haikuan, W. (2007), "Three and four blades impeller’s wind tunnel experiment study of concentrated wind energy turbine", Acta Energiae Solaris Sinica, 1st ed., 28, 74–80.
[6] Castelli, M.R., Monte, A.D., Quaresimin, M. and Benini, E. (2013), "Numerical evaluation of aerodynamic and inertial contributions to Darrieus wind turbine blade deformation", Renewable Energy, 51, 101-112.
[7] Hansen, M.O.L, Sørensen, J.N. and Shen, W.Z. (2003), "Vorticity–velocity formulation of the 3D Navier–Stokes equations in cylindrical co-ordinates", International journal for numerical methods in fluids, 41, 29–45 (DOI: 10.1002/_d.422).
[8] Sørensen, J.N. and Shen, W.Z. (2002), "Numerical modeling of wind turbine wakes", Journal of fluid engineering, 124, 393-399
[9] Wong, K.L., Baker, A.J. (2002), "A 3D incompressible Navier–Stokes velocity–vorticity weak form finite element algorithm", International Journal for Numerical Methods in Fluids, 38, 99 –123.
[10] Lanzame, R. and Messina, M. (2007), "Fluid dynamics wind turbine design: critical analysis, optimization and application of BEM theory", Renewable Energy, 32, 2291-2305.
[11] Petrova, R., Lemu, H.G. and Larion, I. (2013), "Study of Horizontal Axis Wind Turbine Blade in Virtual Wind Tunnel Simulator", In: Proc. of ASME 2013 Int. Mechanical Engineering Congress and Exposition (IMECE2013), Nov. 14 – 21, San Diego, CA, USA.
[12] Petrova, R., (2012), "Influence of the operating frequency of the rotor and the tip brake system of a wind turbine blade on its modal vibrations", Mechanics of Machines, nr. 99, 55-59.
[13] [http://wind.nrel.gov/amestest], last visited: 2014.04.10.
[14] [http://www.supergen-wind.org.uk/docs/presentations/ 2010-03-25_1420_%20SUPERGENWind_FA_ Presentation_ PaulHogg.pdf], last visited: 2014.04.10.
[15] SolidWorks FlowSimulation Help Manual, release 2014, www.solidworks.com
[16] SolidWorks FlowSimulation Help Manual, release 2012, www.solidworks.com
10 Copyright © 2014 by ASME