strengthening disaster risk reduction and reslience … · international and intergovernmental bodi...
TRANSCRIPT

1
1
Strengthening Disaster Risk Reduction and Resliencethe Contributions of Earth Observations
UNITED NATIONS ESCAP
Economic and Social Commission for Asia and the Pacific
10/9/2017
Dr. David GreenDisasters ProgramScience Mission DirectorateEarth Science Division
NASA Disasters ProgramApproach/Principles
Global to local reach• Routine Monitoring to Tiered mobilization• Trans boundary• Intergovernmental and International
Coordination
Harvesting and exploiting data• NASA’s data free and open and processing
systems• Non-NASA data as available
Historical trends and Near real-time and direct readout data/product access• Impact and risk assessment, static and
predictive models• Exposure, risk extent and damage maps• Visualization systems, geospatial platform,
GIS, and web services

2
Organizational Structure
3
• NASA Center Disaster Coordinators, Event and Engagement Leads• Interagency and international committees and working groups• Integrated global workforce of scientists, technologists, economists,
communication and emergency management specialists• Principal Investigators, Users, and Volunteer Networks• Partnerships, Public and Private across multiple sectors including
humanitarian, insurance, transportation, resource management
Intergovernmental and International Coordination and Data Sharing
GEO Flood Task: Supporting access to a unified system of space data acquisition and delivery, models and mapping to support those affected by natural or man‐made disasters
Group on Earth Observations
‐ Committee of Earth Observing Satellites
‐ Other Participating Organizations. Eg. OGC
International Charter and Copernicus EMS
….
CEOS Flood Dashboard
Various UN bodiesEg. WMO, UNESCO…
Civil Society GroupsRed Cross Red CrescentMercy CorpConservation International
NetworksWater Youth Network

3
Disaster Response for Nepal
User-Centric Work Flows: From Data to Information
Engagement with Stakeholders and PartnersMonitoring and ObservationData Acquisition, Processing and DistributionInterpretive and Decision Support
6https://disasters.nasa.gov/

4
Risk Reduction for ResilienceExample Flood Themes
Moving from information centric to user centric Answering Users Questions
• Exploiting Earth Observations, Science & Technology• Integrating Vulnerability, exposure for impact-based forecasting
– Understanding and communicating risk for physical as well as social and economic perils and catastrophic impacts
– Forecasting extent and scale for intense and catastrophic impacts– Assessing, preparing and planning for ‘confident’ decision
support, risk management and assessment to value– Informing sustainable recovery
PI: John Bolton GSFC
Monitoring Transboundary Flood Inundation areas and impacts in Lower Mekong River Basin
Satellite observations, together with socioeconomic and historical flooding data, are being used by regional stakeholders to rapidly identify floods and associated impacts to people and infrastructure in near real-time in the Lower Mekong region.

5
Where’s the Water and the People Impacted?Mapping People and Place
9
. “Without making policymakers aware of elevation issues, and making the connection to the number of people impacted, it is hard to get their attention. The data broaden the community that registers on their radar,” MacManus http://sedac.ciesin.columbia.edu/
Population Density Below 5m
Landscape Change and Storm Surge
10
Disaster Response Activities:Hurricanes Harvey, Irma, Maria
Visible light at night imagery from NASA Suomi NPP Satellite.

6
NASA Damage Map Aids FEMA's Hurricane Maria Rescue Operation in Puerto Rico
11
The map from synthetic aperture radar (SAR) images using the Copernicus Sentinel-1A and Sentinel-1B satellites, operated by the European Space Agency (ESA).
Change detection from images before (March 25, 2017) and after (Sept. 21, 2017) the storm's landfall.
FEMA combined the map with building infrastructure data to estimate a damage density map, which was sent to its Urban Search and Rescue teams in the field in Puerto Rico.
Delivered to responding agencies, including the Federal Emergency Management Agency (FEMA), on Sept. 22, 2017.
https://disasters.nasa.gov/disasters
Recent Response Activities
NASA’s Disasters Program (mobilizing NASA scientists, public, private sector, and international partners…) has been
• Supporting situational awareness of intensive risk and disaster impactsto assist preparedness, response and recovery decisions – Hurricanes Harvey, Irma and now Maria with related flooding;– Pacific Northwest Wildfires; – Mexico’s recent earthquakes and related hazards (tsunami, volcano…)
• Collecting, sharing and processing relevant Earth Observation data from multiple sources to produce geospatial products (maps and models)
• Addressing questions by state, federal, and international partner agencies, the media and the public needed to take effective action

7
Tracking Hurricane Irma
13
NOAA’s GOES-16, operational after a joint NASA-NOAA project to develop and launch the GOES-R Series, monitors the development and track of Irma from September 1-11 while
Hurricane Jose waits offshore.
Monitoring Harvey and Irma Rainfall
14
Global Precipitation Measurement (GPM) provided products used by the National Hurricane Center, NOAA/NWS lWeather Forecast Offices, and NRL.
NASA imagery cited and used by the National Hurricane Center to help understand and describe the state of Irma as it moved north of Cuba and then over the Florida Keys and inland.
What is the circulation? Where are the strong thunderstorms? Where is the rain maxima in the impacted areas of Texas, Louisiana and Florida?

8
NASA Soil Moisture Products Used by FEMA
15
SMAP data combined with atmospheric forcing data within the Land Information System (LIS) created higher spatial resolution maps of soil moisture prior to and during the hurricane to inform risk
Soil Moisture Active Passive (SMAP) data was used to map wind speeds from Harvey (left) and changes in soil moisture
Where are the flood prone areas? Are these areas also impacted by drought or risk agricultural losses?
Imagery and products posted on NASA website, disseminated to users and informed actions of FEMA and other stakeholders
Flood Maps For Hurricane Harvey
JPL’s Advanced Rapid Imaging and Analysis(ARIA) used Synthetic Aperture Radar from JAXA to create Flood Proxy Maps forSoutheastern Texas that are likely flooded as a result of Hurricane Harvey.
16August 27th
Where is potential flooddamage?
Products were posted and provided to FEMA, USGS, International Charter, and State of Texas.

9
Flood Maps for Hurricane Harvey
FEMA shared data with the affected states and other partners, extending the reach of NASA Disasters analysis.
“We found your (flood maps) extremely useful during Harvey for model validation and identifying locations of flooding that we could not predict with modeled riverine depth grids.”-FEMA
NASA captured and processed data from the International Charter on Space and Major Disasters and the Copernicus/European Space Agency, while FEMA combined maps with their risk models
What is the flood extent, exposure and potential risk?
Mapping Progression of Harvey Flood Impact
“I think we may have seen the future of flood response”-Gordon Wells, Texas Center for Space Research and Special Advisor to the TX Natural Disasters Working Group.
NASA deployed UAVSAR over 4 days from base operations in Austin, TX, conducting local flights to fill information gaps and generated single channel quick-look products during flight and post-flight for state and local officials.
When and where will floods crest and risks change across 4 major river basins as waters drain to the Gulf? Where and when should action be taken?

10
Imaging Flood Retreat
UAVSAR data and quicklook products were used by the Texas State Operations Center to:
• Identify levee breaches and levee over tops around small towns to direct evacuation and rescue efforts
• Identify flooding in refineries, to direct chemical spill response
• Identify “dry spots” for relief agencies to stage centers
Where are the risks from infrastructure failure and where do we stage relief efforts?
Assessing Financial Loss Potentialfor Hurricane Harvey
Disasters Program PI, ImageCat combined flood extent maps and depth information to create overlays with exposed property values in the flooded areas.
Products were provided to FEMA and the state of Texas to help estimate financial loss
Where and what is the extent of insured loss?

11
Nighttime Satellite Data
High resolution nighttime maps combined data from six satellites (Suomi-NPP, Landsat-8, Sentinel 2A & 2B, TerraSAR-X/TanDEM-X) to enable first-ever daily monitoring of affected areas at neighborhood scales (< 30 meters) for S&R
What are the nighttime conditions for Search & Rescue?
Predicting Flood from Irma
22
Disasters Program PI at the University of Maryland provided results from the Global Flood Mapping System (GFMS), which uses NASA satellite-based rainfall (GPM) and other model information to predict river flows and resulting flooding (inundation).
Where is substantial and damaging flooding expected?
GFMS guidance provided FEMA and other end users a rapid estimate of areas of concern and triggered actions

12
23
Space provides a unique perspective

13
NASA and Mission PartnershipsNISAR* and Resilience
25
Among the many existing, new and planned missions NISAR is one of many examples where NASA partnerships opportunities improved resilience and response
NISAR will change the way the world shares data and provide advanced radar imaging that it will capture uniquely the Earth in motion
* NASA and ISRO (the Indian Space Research Organisation) Synthetic Aperture Radar Mission Concept to Launch in 2020
Dr. David GreenDisaster Response Program Manager
Office: 202-358-0032Mobile: 202-748-2875
https://disasters.nasa.gov/
http://appliedsciences.nasa.gov/programs/disasters-programProgram:
Response:

1
1
Strengthening Disaster Risk Reduction and Resliencethe Contributions of Earth Observations
UNITED NATIONS ESCAP
Economic and Social Commission for Asia and the Pacific
10/9/2017
Dr. David GreenDisasters ProgramScience Mission DirectorateEarth Science Division
Earthquake Response
2

2
NASA’s Response to the magnitude 7.8 Gorkha Earthquake in Nepal – April 25, 2015
NASA Responds to Gorkha, Nepal Earthquake
M 7.8 earthquake struck Nepal at 11:56 NST on April 25, 2015.M 7.3 aftershock again shook Nepal on May 12, 2015.NASA responded, providing satellite imagery, modeling, and data analysis to USGS and NGO partners on the ground in Nepal, including SERVIR, USAID, and ICIMOD.
4

3
Damage Proxy Map from ALOS-2
Highlights areas of potential damage caused by M7.8 Nepal earthquake (70 km x 180 km)Used by World Bank, USGS, OFDA/USAID, ICIMOD, and GEER for damage assessment, NGA for analysis priority, DigitalGlobe for WorldView image acquisition planning657 downloads worldwide in May 2015Derived from SAR data from JAXA ALOS-2 (L-band)
| 5| 5
Gorkha Earthquake VolunteersImage Analysis Group
| 6| 6
Volunteer global campaign to assist with earthquake disaster, coordinated by the University of Arizona
Six areas of interest were defined according to river valley. Expert researchers from 9 nations contributed to the satellite image analysis.
NASA data: Landsat, ASTER, EO‐1 ALI, SRTM data; (+ DigitalGlobe, WorldView images through commercial partnership).
Aided NASA, USGS and NGA in the targeting of satellite imaging
Results reported to NASA, SERVIR Applied Science Team,and authorities in Nepal
Flags indicate nation of volunteers home institution(s)

4
Gorkha Earthquake: Langtang Valley landslides, Nepal
Langtang Valley was severely affected by the main earthquake and aftershocks.
Image analysis by volunteer group validated and qualified effects of the disaster.
Several villages destroyed or damaged, more than 200 people killed, dozens missing.
Information relayed to authorities resulted in relief helicopter missions to the valley
Recurrent landsliding resulted in complete evacuation and public closure of the valley.
| 7| 7
Regional landslide mapping
8

5
Regional Engagement
9
https://kubeworks.wixsite.com/argentina-summit
Agenda at a Glance
: response and resilience cycle
6
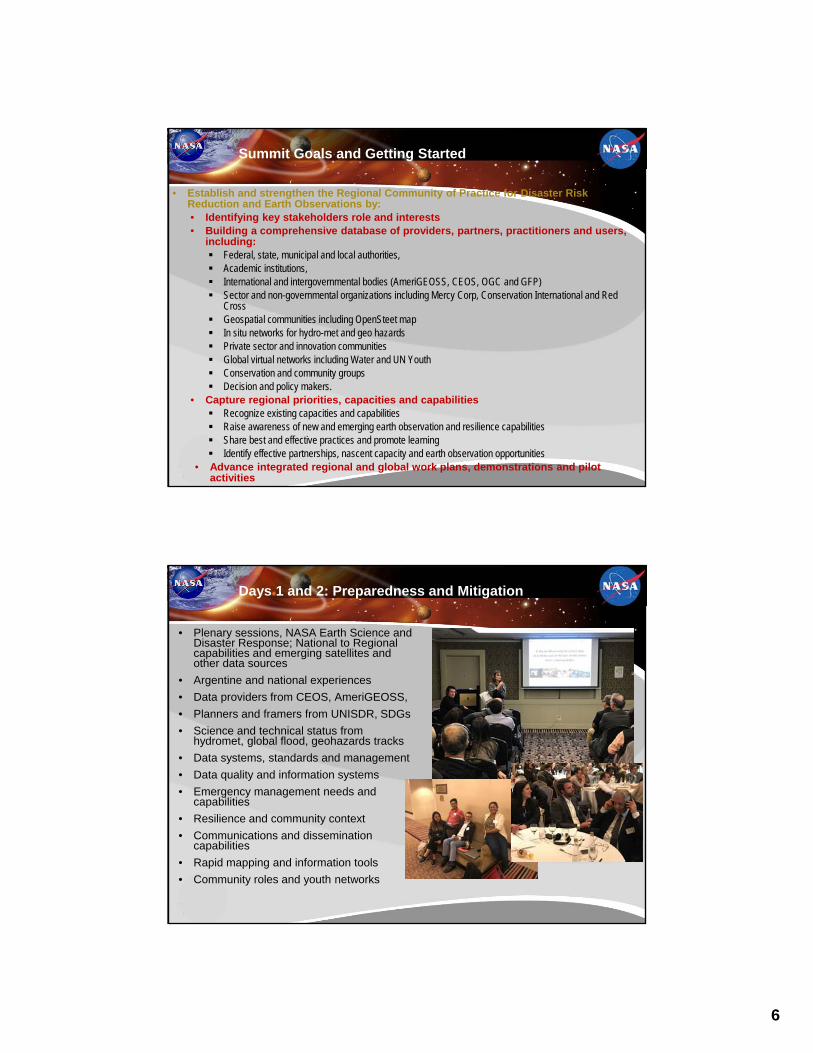
Summit Goals and Getting Started
• Establish and strengthen the Regional Community of Practice for Disaster Risk Reduction and Earth Observations by:• Identifying key stakeholders role and interests• Building a comprehensive database of providers, partners, practitioners and users,
including: Federal, state, municipal and local authorities, Academic institutions, International and intergovernmental bodies (AmeriGEOSS, CEOS, OGC and GFP) Sector and non-governmental organizations including Mercy Corp, Conservation International and Red
Cross Geospatial communities including OpenSteet map In situ networks for hydro-met and geo hazards Private sector and innovation communities Global virtual networks including Water and UN Youth Conservation and community groups Decision and policy makers.
• Capture regional priorities, capacities and capabilities Recognize existing capacities and capabilities Raise awareness of new and emerging earth observation and resilience capabilities Share best and effective practices and promote learning Identify effective partnerships, nascent capacity and earth observation opportunities
• Advance integrated regional and global work plans, demonstrations and pilot activities
Days 1 and 2: Preparedness and Mitigation
• Plenary sessions, NASA Earth Science and Disaster Response; National to Regional capabilities and emerging satellites and other data sources
• Argentine and national experiences
• Data providers from CEOS, AmeriGEOSS,
• Planners and framers from UNISDR, SDGs
• Science and technical status from hydromet, global flood, geohazards tracks
• Data systems, standards and management
• Data quality and information systems
• Emergency management needs and capabilities
• Resilience and community context
• Communications and dissemination capabilities
• Rapid mapping and information tools
• Community roles and youth networks

7
Day 3: Mitigation and Readiness
• Plenary on building capacity, humanitarian role and understanding maps and tools
• Raising awareness and specialized training
• Role of the International Charter and Copernicus Services
• Flight, drones and other observing systems
• Decision tools and virtual networks for mapping and sourcing
• Delivery of Disaster management and resilience services
• Interpretive Support and Shared knowledge
• Strengthening understanding of mutual roles and dependencies
Day 4: Disaster Strikes! A Scenario Driven Exercise
Disastrov has been wracked by a year long drought that culminated in wildfires just before monsoon season…

8
Summit Participants Pull Together to Save Disastrov
Day 5: Wrapping Up and Looking Forward
- Regional Work Plans
• Participants crafted draft input to integrated Americas Regional Work plans incorporate earth observations, risk reduction and resilience building
Activity Who When/Where Desired Outcome

9
Dr. David GreenDisaster Response Program Manager
Office: 202-358-0032Mobile: 202-748-2875
https://disasters.nasa.gov/
http://appliedsciences.nasa.gov/programs/disasters-programProgram:
Response: