strength from every angle - semtech corporation
TRANSCRIPT

strength from every angle
2013 Annual Report
the right time | the right markets | the right products

2013 financial highlights
FY2009 FY2010 FY2011 FY2012 FY2013
Cash, cash equivalents $ 258,815 $ 162,223 $ 258,342 $ 327,665 $ 236,072and investments
Working capital $ 279,887 $ 146,086 $ 259,873 $360,330 $ 248,311
Total assets $ 420,795 $ 514,294 $ 659,943 $726,321 $ 1,171,013
Long-term debt — — — — $ 282,286-less current
Other long-term $ 8,960 $ 35,173 $ 37,503 $ 29,151 $ 34,177liabilities
Total stockholders’ $ 378,020 $ 405,741 $ 528,615 $ 630,188 $ 694,826equity
Balance Sheet Data (in thousands)
* FY2010 EPS impacted by transaction related costs, primarily a one-time tax expense related to the Sierra Monolithics, Inc. acquisition.
2009 2010 2011 2012
Annual Revenue (in millions) EPS Operating Cash Flow (in millions)
2013 2009 2010 2011 2012 2013 2009 2010 2011 2012 2013
$295 $287
$455$481
$579
$0.61
$0.02*
$1.12
$1.32
$0.62
$78$83
$94$100 $102
*

Whether we’re staying connected with friends and family via social
networking, collaborating with clients and colleagues via web conferencing,
or navigating our way through town using dashboard GPS devices, our lives
have been transformed by, and inextricably linked to, information technology.
This increasing reliance on information technology in every aspect of our lives
has manifested into three major trends driving growth in the semiconductor
industry—first, the explosive growth in global demand for network bandwidth;
second, the ongoing need for miniaturization in electronics; and third, the
heightened focus on green technologies.
The rapid rise in the use of personal devices like tab-lets, smartphones, and eReaders to provide continuous access to the Internet and to exchange higher bit-rate content, like streaming video and real-time gaming, is creating major bottlenecks in networking infrastruc-ture. In addition, businesses are increasingly migrating to “the cloud,” putting additional pressure on network infrastructure and bandwidth. The industry-wide transition from Standard Definition to High Definition video and other next-generation broadcast video sys-tems is further taxing the networking infrastructure. Semtech’s high-performance and high-quality analog and mixed-signal semiconductor platforms are integral components of the electronic devices used in some of the most innovative products, systems, and infrastruc-ture equipment enabling broadband communications today.
Electronics are continually becoming miniatur-ized as consumers and businesses demand electronic devices that are smaller, faster, energy efficient, and more portable while providing greater functionality. Smaller chip size correlates to reduced internally inte-grated ESD (Electrostatic Discharge) protection, thus creating a compelling market for our external ESD protection ICs. Semtech leads the industry with some of the smallest form factors combined with the highest performance and most reliable ESD protection.
Global energy issues are driving a need for greater
efficiency and forcing technology companies to develop systems that incorporate smarter power concepts. This growing demand for improving energy efficiency is creating attractive market opportuni-ties for Semtech. Our power management products require less energy to run and facilitate efficient energy usage in the products they power. Our products sense when devices are not in use and will power down to “sleep” mode and quickly start up again when needed, reducing energy waste and extending battery life. Our wireless and sensing products sense ambient light, temperatures, movement and other factors to help automate and efficiently manage energy usage in light-ing systems, security systems, and other industrial and home automation applications.
Semtech is addressing these key trends in mul-tiple end markets with solutions distinguished by ultra-low power consumption, small form factor, a high degree of integration and highly complex analog performance. Our solutions can be found in today’s sophisticated consumer electronics, enterprise computing applications, wired and wireless communi-cations infrastructure, home and industrial automation applications, medical equipment, and automotive applications. We are becoming ubiquitous in the new media driven electronics world, and chances are that any video watched by a consumer today has passed through several Semtech devices.
2013 Annual Report 1

innovation
Bandwidth ExpansionWhile today’s mobile communications devices provide continuous access to the Internet, their higher bit-rate content creates bottlenecks in networking infrastructure. The solution comes with Semtech’s high-performance and high-quality analog and mixed- signal semiconductor platforms. They have become integral components of the electronic devices that are used in some of today’s most innovative products, systems, and infrastructure equipment.

Semtech drives innovation by fostering an engineer-ing rich culture—more than half of Semtech’s salaried employees are engineers. With such a large percentage of engineers, Semtech is well-positioned to design and develop new products that provide our custom-ers the added value and innovation they need to be successful. This is no accident: our ability to generate breakthrough ideas is founded on a company-wide commitment to innovation. At Semtech, we recognize that there is no magic formula for accomplishing this. It requires in-house visionaries and business leaders committed to exploring ways of making innovation a day-to-day reality.
With more than 50 years of experience, Semtech has established long-term collaborative relationships with our customers. Our engineers have an in-depth understanding of our customers’ business needs and are thus able to design innovative solutions to help them succeed.
Innovation is about more than ideas; it is also about execution. The Semtech Innovation Process is driven by the leadership of senior executives who pro-vide informed commitment, guidance and inspiration while ensuring our R&D efforts remain aligned with overall company goals. It requires our team’s continual reinvention of the development process—a willingness to continually change in order to enhance experi-mentation and risk-taking (and to reward innovative breakthroughs). Semtech is committed to building
individual competencies to improve innovation- readiness and creative thinking skills. Finally, it is also about the entire team, not just the leaders. Semtech works hard to increase cross-functional collaboration and knowledge sharing.
This culture of innovation has provided the indus-try leadership and competitive differentiation that has grown our business over the last half century. It has made us the leader in advanced analog and mixed sig-nal architecture through our world-class engineering capability. Our proprietary platforms, differentiated by innovation, size, efficiency, performance and reach, are used in some of the most innovative systems and products in the market today.
This innovation has established Semtech as an industry leader in many areas: we deliver the only merchant solution for 40 Gbps and 100 Gbps serdes platforms for high-speed optical networking; we are the sole provider of clock and data recovery technology in Thunderbolt cables; we offer the longest-range radio frequency technology for automated meter reading; we ensure the highest level of ESD protection capability; and we provide the longest distance touch sensing capability.
A culture of innovation
2013 Annual Report 3

convergence
MiniaturizationConsumers increasingly demand sophisticated portable devices in smaller packages that are more mobile, consume less power and provide more functionality. Their smaller chip size requires reduced internally integrated ESD protection, demanding Semtech’s external ESD protection ICs, with the smallest form factors, highest performance and most reliable ESD protection available.

A convergence of timing, markets and productsSemtech has the good fortune of being in the right place at the right time with the right products—a happy convergence of timing, markets and products that is no accident. The company’s analog and mixed signal semiconductor platforms are integral components of the electronic devices that have become so commonplace in modern consumer and business life.
Semtech’s products are integral to some of the most innovative systems and fastest growing markets in the industry. Wireless technologies in homes and industries align with Semtech’s innovative low-power, long-range wireless RF capabilities targeted at Smart Metering and Smart Lighting solutions. Power management platforms enable office equipment and household appliance manu-facturers to meet stringent ENERGY STAR® specifications.
The high-end consumer market is increasingly sophisticated, mobile and integrated. The growth in smartphones, tablets, HD televisions, gaming devices and set-top boxes provides ample growth opportunities for Semtech’s protection, power management, wireless, and touch sensing products. The accelerating transition from Standard Definition to High Definition video and other next-generation broadcast video systems requires both advanced technology within the devices, and also in the networking infrastructure.
Consumer demand for faster and more reliable communications networks is met by a host of Semtech solutions: our 40 Gbps and 100 Gbps platforms provide the fastest signal speeds in optical networks, our tim-ing synchronization platforms facilitate new backhaul infrastructure, our CDR technology in Thunderbolt cables enable the fastest download of content for personal computing devices, and our new microwave platforms enable point-to-point communications. We also deliver the most advanced protection and power management for networking equipment.
The computer industry depends on Semtech’s smart power management to maximize energy efficiency and reduce end user costs for servers, workstations, note-books, computer gaming systems, printers and copiers.
In addition, our extremely small form factor power and protection devices are ideally suited for the latest genera-tion of mobile devices.
Manufacturers of mobile communication devices rely on Semtech’s protection platforms for high-speed, low-voltage interfaces that require the highest ESD protec-tion. These platforms are ultra-small and thin and protect virtually all ports in mobile electronic devices. Semtech also provides the most advanced lightning protection platforms for telecommunications and networking equipment.
On the larger communications network front, Semtech provides telecommunications equipment manu-facturers the highest-performance 40 Gbps and 100 Gbps SerDes platforms (1 Gbps to 26 Gbps platforms for the access and metro markets), timing synchronization platforms, and advanced microwave platforms to enable communications within buildings, between cities and around the globe.
Semtech broadcast video and surveillance products are an integral part of our customers’ video production workflow and also provide a smooth transition from Standard Definition to High Definition video and other next-generation broadcast video systems. In the video surveillance market, our video surveillance products enable customers to upgrade their standard definition systems to full digital HDcctv platforms.
Semtech’s innovative power management platforms allow customers to develop highly efficient applications for a broad range of devices and are optimized for extremely space-constrained devices to extend battery life, reduce overall energy consumption, and minimize waste.
Our ultra-low-power, long-range sub-GHz, RF tech-nology enables the replacement of power-hungry wired systems with smart wireless systems and inefficient light-ing with smarter automated systems. Semtech’s products provide critical functionality for wireless alarm systems, remote keyless entry systems, smart gas meters, water meters and temperature sensors, simplifying everyday life for millions of consumers and businesses.
2013 Annual Report 5

relationships
Green TechnologyThe global greening of technology requires smarter power concepts, creating growing demand for Semtech’s power management products, which facilitate efficient energy usage and require less energy. They are critical components of numerous consumer, computing and communications devices, lighting and security systems, and other industrial and home automation applications that benefit from reduced energy waste and extended battery life.

Established and trusted relationships with our customers
A major component of Semtech’s competitive advan-tage is our customer relationships, which drive innovation and the ultimate success of our enterprise. Strong customer relationships are any company’s best competitive advantage and the lifeblood of any business, and Semtech’s relationships are world-class. It starts with communication—answering our cus-tomers’ concerns and needs and listening to them. It’s about delivering on our commitments—always. It’s about trust. It’s about helping beyond their immediate requirements and about giving our customers more than they ask. It’s about knowing our customers’ busi-nesses as well as they do and anticipating their needs.
In other words, it’s about being a committed partner in their success.
We at Semtech are proud of our track record in helping our customers bring innovative technology to the marketplace. Our strategy gives customers the differentiated performance they need, while reduc-ing their costs and negative impact on the planet. Our design teams partner with our client develop-ment team to optimize technologies for efficient performance and manufacturing effectiveness. It’s all about Semtech’s unique ability to create tremendous value for customers.
We have many programs and processes that guarantee our partners’ success, including a rock solid quality control process. This includes a formal Quality Control pledge that provides innovative and technically superior products and services that meet or exceed their expectations. We are dedicated to contin-uously improving our organizational performance and capabilities to achieve the lowest cost of ownership for our customers and suppliers.
Not least important is the Semtech Reliability Assurance team, which establishes qualification sys-tems that guarantee the quality and reliability of our products, processes, and suppliers. It can become part of our client’s development effort. A primary value of the team is its ability, in partnership with our customer, to establish a proactive presence early in the product development cycle and provide feedback regarding the performance of Semtech’s products and processes for early design considerations. This helps make the ulti-mate success of our customer’s design more certain.
The value of this process was demonstrated when one of our key customers was experiencing Electrical Overstress (EOS) failures on high-speed video lines and turned to us for help. The Semtech team quickly took action to identify the cause of the failures. We determined that charging an external video cable was resulting in a high potential difference between the cable and the equipment’s PCB (Printed Circuit Board) and that this was causing high energy surges during cable insertion. The magnitude of the surges was beyond the capability of the on-board IC protection circuitry, resulting in catastrophic failure of the video IC. Our protection products application team used state-of-the-art Transmission Line Pulse (TLP) and Electrostatic Discharge (ESD) scanning analysis to iso-late the failure site and recommend a suitable solution that would not interfere with normal circuit operation. As a result, failures were virtually eliminated.
2013 Annual Report 7

Letter to our shareholders
Fiscal year 2013 was another record year for Semtech with revenue growth of 20%, surpassing that of our industry and peers. During the year we generated $579 million in revenue, $102 million in operating cash flow, and ended the year with $236 million in cash and investments. In addition to generating record revenue, we achieved record gross profit, record bookings, and a record number of design wins.
In fiscal year 2013 we acquired Gennum Corporation, the largest acquisition in company history. Gennum gives us entry into lucrative growth markets such as passive optical networks, storage networks, data centers, high definition video surveillance and ultra-high-definition broadcast video. Gennum’s optical products, together with our existing advanced communications platforms, enable us to deliver the highest performance, lowest power and broadest range of 1 Gbps, 10 Gbps, 40 Gbps and 100 Gbps SerDes, CDRs, and physical media device platforms to the long-haul telecommunications market and the shorter-reach metro and access data communications markets.
Semtech continues to be one of the fastest growing diversified analog companies in the industry. Our end market and geographical balance, in conjunction with our close customer relationships, has enabled us to balance exciting growth with downside risk mitigation in recessionary environments. We believe our ability to outgrow the market arises from our strategy of selectively targeting the fastest growing segments in our indus-try while exiting mature segments that are commoditizing.
In the consumer end market, we are positioned to benefit from the continued growth in smartphones, tablets, LCD TVs, set top boxes and Thunderbolt cables. In communications, Semtech provides industry- leading products in many segments facilitating the global build-out of high-bandwidth infrastructure. In the enterprise computing space, we provide critical solutions to the cloud computing and storage networking markets. And industrial customers increasingly turn to Semtech to solve their needs in smart lighting, energy management, home automation, security systems, and automotive.
For fiscal year 2014, our financial goals are to grow revenue faster than the industry, drive non-GAAP operating margin toward the midpoint of our target range of 25% to
30%, generate free cash flow in our target range of 20% to 25% of revenue, and pay down our debt.
I am very excited by the opportunities that lie ahead for Semtech and believe we have the growth engines in place to drive toward our long-term goal of $1 billion in annual revenue. Thank you for your confidence and loyalty.
Mohan MaheswaranPresident and Chief Executive Officer

UNITED STATES
SECURITIES AND EXCHANGE COMMISSION Washington, D.C. 20549
____________________________________ FORM 10-K
Annual report pursuant to Section 13 or 15(d) of the Securities Exchange Act of 1934 For the fiscal year ended January 27, 2013
or Transition Report Pursuant to Section 13 or 15(d) of the Securities Exchange Act of 1934
For the transition period from to Commission File Number 1-6395 ____________________________________
SEMTECH CORPORATION (Exact name of registrant as specified in its charter)
Delaware (State or other jurisdiction of incorporation or organization)
95-2119684 (I.R.S. Employer Identification No.)
200 Flynn Road, Camarillo, California, 93012-8790 (Address of principal executive offices, Zip Code)
Registrant’s telephone number, including area code: (805) 498-2111 Securities registered pursuant to Section 12(b) of the Act:
Title of each class Common Stock par value $.01 per share
Name of each exchange on which registered The NASDAQ Stock Market LLC
Securities registered pursuant to Section 12(g) of the Act: None
(Title of Class) . Indicate by check mark if the registrant is a well-known seasoned issuer, as defined in Rule 405 of the Securities Act. Yes No Indicate by check mark if the registrant is not required to file reports pursuant to Section 13 or Section 15(d) of the Exchange Act. Yes No Indicate by check mark whether the registrant (1) has filed all reports required to be filed by Section 13 or 15(d) of the Securities Exchange Act of 1934 during the preceding 12 months (or for such shorter period that the registrant was required to file such reports), and (2) has been subject to such filing requirements for the past 90 days. Yes No Indicate by check mark whether the registrant has submitted electronically and posted on its corporate Web site, if any, every Interactive Data File required to be submitted and posted pursuant to Rule 405 of Regulation S-T (§232.405 of this chapter) during the preceding 12 months (or for such shorter period that the registrant was required to submit and post such files). Yes No Indicate by check mark if disclosure of delinquent filers pursuant to Item 405 of Regulation S-K is not contained herein, and will not be contained, to the best of registrant’s knowledge, in definitive proxy or information statements incorporated by reference in Part III of this Form 10-K or any amendment to this Form 10-K. Indicate by check mark whether the registrant is a large accelerated filer, an accelerated filer, a non-accelerated filer, or a smaller reporting company. See the definitions of “large accelerated filer,” “accelerated filer” and “smaller reporting company” in Rule 12b-2 of the Exchange Act. Large accelerated filer Accelerated filer Non-accelerated filer Smaller reporting company Indicate by check mark whether the registrant is a shell company (as defined in Rule 12b-2 of the Exchange Act): Yes No The aggregate market value of the common stock held by non-affiliates of the registrant (based upon the closing sale price of $24.39 on the NASDAQ Global Select Market) as of July 27, 2012 was approximately $1.37 billion. Stock held by directors, officers and shareholders owning 5% or more of the outstanding common stock (as reported by shareholders on Schedules 13D and 13G) were excluded as they may be deemed affiliates. This determination of affiliate status is not a conclusive determination for any other purpose. Number of shares of Common Stock, $0.01 par value per share, outstanding at March 22, 2013: 67,090,054
____________________________________ DOCUMENTS INCORPORATED BY REFERENCE
Portions of the following documents are incorporated by reference in Part III, Item numbers 11, 12, 13 and 14 and portions of Item 10 of this report to: Definitive Proxy Statement in connection with registrant’s annual meeting of shareholders to be held on June 20, 2013, to be filed no later than 120 days after the end of the registrant’s fiscal year ended January 27, 2013.

(THIS PAGE INTENTIONALLY LEFT BLANK)

1
SEMTECH CORPORATION
INDEX TO FORM 10-K FOR THE YEAR ENDED JANUARY 27, 2013
PART I Item 1 Business 3 Item 1A Risk Factors 14 Item 1B Unresolved Staff Comments 27 Item 2 Properties 27 Item 3 Legal Proceedings 28 Item 4 Mine Safety Disclosure 28 PART II Item 5 Market for Registrant’s Common Equity, Related Stockholder Matters and Issuer Purchases
of Equity Securities 28 Item 6 Selected Financial Data 30 Item 7 Management’s Discussion and Analysis of Financial Condition and Results of Operations 32 Item 7A Quantitative and Qualitative Disclosures About Market Risk 45 Item 8 Financial Statements and Supplementary Data 48 Item 9 Changes in and Disagreements with Accountants on Accounting and Financial Disclosure 94 Item 9A Controls and Procedures 94 Item 9B Other Information 97 PART III Item 10 Directors, Executive Officers and Corporate Governance 97 Item 11 Executive Compensation 97 Item 12 Security Ownership of Certain Beneficial Owners and Management and Related
Stockholder Matters 97 Item 13 Certain Relationships and Related Transactions, and Director Independence 97 Item 14 Principal Accounting Fees and Services 98 PART IV Item 15 Exhibits, Financial Statement Schedules 98 Signatures 104

2
(THIS PAGE INTENTIONALLY LEFT BLANK)

3
Special Note Regarding Forward Looking and Cautionary Statements
This Annual Report on Form 10-K (the “Form 10-K”) contains “forward-looking statements” within the meaning of Section 27A of the Securities Act of 1933, as amended (the “Securities Act”), and Section 21E of the Securities Exchange Act of 1934, as amended (the “Exchange Act”). We may also make forward-looking statements in other reports filed with the Securities and Exchange Commission (“SEC”), in materials delivered to shareholders and in press releases. In addition, Company representatives may make oral forward-looking statements from time to time. Forward-looking statements are statements other than historical information or statements of current condition and relate to matters such as our future financial performance, future operational performance, and our plans, objectives and expectations. Some forward-looking statements may be identified by use of terms such as “expects,” “anticipates,” “intends,” “estimates,” “believes,” “projects,” “should,” “will,” “plans” and similar words.
Forward-looking statements should be considered in conjunction with the cautionary statements contained in Item 1A “Risk Factors” and elsewhere in this Form 10-K, in our other filings with the SEC, and in material incorporated herein and therein by reference. In light of the risks and uncertainties inherent in all such projected matters, forward-looking statements should not be regarded as a representation by the Company or any other person that our objectives or plans will be achieved or that any of our operating expectations or financial forecasts will be realized. Financial results could differ materially from those projected in forward-looking statements due to known or unknown risks. We assume no obligation to update or revise any forward-looking statements, whether as a result of new information, future events or otherwise.
In addition to regarding forward-looking statements with caution, you should consider that the preparation of the consolidated financial statements requires us to draw conclusions and make interpretations, judgments, assumptions and estimates with respect to certain factual, legal, and accounting matters. Our financial statements might have been materially impacted if we had reached different conclusions or made different interpretations, judgments, assumptions or estimates.
PART I
Item 1. Business General Unless the context otherwise requires, the use of the terms “Semtech,” “the Company,” “we,” “us” and “our” in this Annual Report on Form 10-K refers to Semtech Corporation and, as applicable, its consolidated subsidiaries. We are a leading supplier of analog and mixed-signal semiconductor products and were incorporated in Delaware in 1960. We design, develop and market a wide range of products for commercial applications, the majority of which are sold into the enterprise computing, communications, high-end consumer and industrial end-markets.
Enterprise Computing: datacenters, passive optical networks, optical receiver and transceiver, desktops, notebooks, servers, graphic boards, monitors, printers and other computer peripherals.
Communications: base stations, backplane, optical networks, carrier networks, switches and routers, cable modems, signal conditioners, wireless LAN and other communication infrastructure equipment.
High-End Consumer: handheld products, set-top boxes, digital televisions, tablet computers, digital video recorders, thunderbolt and fiberless high-speed interfaces and other consumer equipment.
Industrial: broadcast studio equipment, automated meter reading, military and aerospace, medical, security systems, automotive, industrial and home automation, video security and surveillance and other industrial equipment. Our end-customers are primarily original equipment manufacturers and their suppliers, including Alcatel-Lucent, Cisco Systems, Inc., Huawei Technologies Co., Ltd., LG Electronics, Motorola, Nokia Siemens Networks, Itron, Apple, Phonak International, Research In Motion Limited, Samsung Electronics Co., and ZTE Corporation.

4
Overview of the Semiconductor Industry The semiconductor industry is broadly divided into analog and digital semiconductor products. Analog semiconductors condition and regulate “real world” functions such as temperature, speed, sound and electrical current. Digital semiconductors process binary information, such as that used by computers. Mixed-signal devices incorporate both analog and digital functions into a single chip and provide the ability for digital electronics to interface with the outside world.
The market for analog and mixed-signal semiconductors differs from the market for digital semiconductors. The analog and mixed-signal industry is typically characterized by longer product life cycles than the digital industry. In addition, analog semiconductor manufacturers tend to have lower capital investment requirements for manufacturing because their facilities tend to be less dependent than digital producers on state-of-the-art production equipment to manufacture leading edge process technologies. The end-product markets for analog and mixed-signal semiconductors are more varied and more specialized than the relatively standardized digital semiconductor product markets.
Another difference between the analog and digital markets is the amount of available talented labor. The analog industry relies more heavily than the digital industry on design and applications talent to distinguish its products from one another. Digital expertise is extensively taught in universities due to its overall market size, while analog and mixed-signal expertise tends to be learned over time based on experience and hands-on training. Consequently, personnel with analog training are scarcer than digital trained engineers. This has historically made it more difficult for new suppliers to quickly develop products and gain significant market share.
Advancements in digital processing technology typically drive the need for corresponding advancements in analog and mixed-signal solutions. We believe that the diversity of our applications allows us to take advantage of areas of relative market strength and reduces our vulnerability to competitive pressure in any one area.
Business Strategy Our objective is to be a leading supplier of analog and mixed-signal semiconductor devices to the fastest growing areas of our target markets. We intend to leverage our pool of skilled technical personnel to develop new products, or, where appropriate, use acquisitions to either accelerate our position in the fastest growing areas or to gain entry into these areas. In order to capitalize on our strengths in analog and mixed-signal processing design, development and marketing, we intend to pursue the following strategies:
Leverage our rare analog design expertise We have developed a strategy to invest heavily in human resources needed to define, design and market high-performance analog platform products. We have built a team of experienced engineers who combine industry expertise with advanced semiconductor design expertise to meet customer requirements and enable our customers to get their products to market rapidly. We intend to leverage this strategy to achieve new levels of integration, power reduction and performance, enabling our customers to achieve differentiation in their end systems.
Continue to release proprietary new products, achieve new design wins, and cross-sell products We are focused on developing unique, new, proprietary products that bring value to our target customers in our target markets. These products typically are differentiated in performance but are priced competitively. We also focus on achieving design wins for our products with current and future customers. Design wins are indications by the customer that they intend to incorporate our products into their new designs. Our technical talent works closely with our customers in securing design wins, defining new products and in implementing and integrating our products into their systems. We also focus on selling our complete portfolio of products to our existing customers, as we believe the technical expertise of our marketing and sales team allows us to identify and capitalize on cross-selling opportunities.

5
Focus on fast-growing market segments and regions We have chosen to target the analog segments of some of the fastest growing end-markets. We participate in these markets by focusing on specific product areas within the analog and mixed-signal market, including products for handheld equipment, high-end consumer equipment, and communications infrastructure and certain broad-based industrial markets. All of these markets are characterized by their need for leading-edge, high-performance analog and mixed-signal semiconductor technologies. The enterprise computing, communications, high-end consumer and industrial end markets we supply are characterized by several trends that we believe drive demand for our products. The key trends that we target include:
• Increasing bandwidth over high-speed networks, fueling growth in high speed voice, video and data transmission
• Increasing electronic system requirements for smaller, lighter, highly integrated and feature rich devices
• Increasing need for more efficient energy management in the home and in industrial environments and the proliferation of ”green” standards
Our products address these market trends by providing solutions that are ultra-low power thus extending battery life, small form factor enabling smaller devices, highly integrated enabling more functionality within devices and high performance enabling product differentiation within our customer base. Additionally, as communications functions are increasingly integrated into a range of systems and devices, these products require analog sensing, processing and control capabilities, which increases the number and size of our end-markets. Finally, industrial, medical, high-end consumer and other end-market applications have increasingly incorporated data processing and communications features into their end systems resulting in more complex power and protection requirements, which in turn, has broadened the opportunities for selling our power and protection devices.
We believe that certain geographic markets, such as Asia and North America represent opportunities for added sales and end-customer diversity. Accordingly, we have bolstered our efforts in these regions to enhance our ability to expand our customer base.
Leverage outsourced semiconductor fabrication capacity We outsource most of our manufacturing in order to focus more of our resources on defining, developing and marketing our products. Our primary outside wafer foundries are based in China, Israel, the United States, Europe and Taiwan. Our largest wafer source is a foundry based in China. We believe that outsourcing provides us numerous benefits, including capital efficiency, the flexibility to adopt and leverage emerging process technologies without significant investment risk and a more variable cost of goods, which provides us with greater operating flexibility.
Products and Technology We design, develop, manufacture and market high-performance analog and mixed signal semiconductor products. We operate and account for results in one reportable segment.
On March 20, 2012, we acquired, through our wholly-owned subsidiary Semtech Canada Inc., all outstanding equity interests of Gennum Corporation (“Gennum”) (TSX: GND), a leading supplier of high speed analog and mixed-signal semiconductors for the optical communications and video broadcast markets.
Our primary reasons for the acquisition were to broaden our existing portfolio of high-speed communications platforms through Gennum’s data communications and video platforms by combining Gennum’s 1 Gbps to 25 Gbps signal integrity solutions with our 40 Gbps to 100 Gbps SerDes solutions to create one of the industry’s most complete and robust analog and mixed signal portfolios. In addition, Gennum’s strong position in video broadcast and the emerging HD video surveillance market further diversifies our portfolio of high-performance analog semiconductors and provides cross-selling potential with the combined customer base.
On March 7, 2012, we completed the acquisition of Cycleo SAS (“Cycleo”), a privately held company based in France that develops intellectual property (“IP”) for wireless long-range semiconductor products used in smart

6
metering and other industrial and consumer markets. This transaction, which was accounted for using the acquisition method of accounting, complements our current wireless offerings and will bring customers a set of high-end, digitally enhanced wireless solutions. Our product lines include:
Protection Products. We design, develop and market high performance protection devices, which are often referred to as transient voltage suppressors (“TVS”). TVS devices provide protection for electronic systems where voltage spikes (called transients), such as electrostatic discharge or secondary lightning surge energy that can permanently damage voltage sensitive complementary metal–oxide–semiconductor (“CMOS”) integrated circuits (“ICs”). Our portfolio includes filter and termination devices that are integrated in with the transient voltage suppressor (“TVS”) devices. Our protection products feature low capacitance, providing robust protection while preserving signal integrity in high-speed networking and video interfaces. These products also operate at very low voltage needed for today’s low voltage ICs. Our protection products can be found in a broad range of applications including smart phones, LCD TVs, set-top boxes, tablet computers, notebooks, base stations, routers, and industrial instruments.
Advanced Communications Products. We design, develop and market a portfolio of proprietary advanced wired communication, ultra-high speed Serializer/Deserializer (“SerDes”) and modulator driver products for transport communication. These ICs perform transmission and amplification functions used in high-speed networks, at 40Gbps and 100Gbps. Our advanced communications products also feature a leading integrated timing solution for packet based communication networks. Our advanced communications products are used in a variety of communications and industrial applications.
Gennum Products. We design, develop and market a portfolio of optical communications, broadcast video, active cable transceiver and backplane products used in a wide variety of enterprise computing, industrial, communications and high-end consumer applications. Our broadcast video products offer advanced solutions for next generation video formats, ever increasing data rates and evolving I/O and distance requirements. Our security and surveillance products for HDcctv enable upgrade of analog cctv installations to full digital HD, leveraging the installed base of cabling, and our fully integrated transmit and receive products enable the highest performance, longest reach HDcctv standards-compliant designs. Our comprehensive portfolio of IC’s for optical transceivers, backplane applications and consumer high-speed interfaces ranges from 100Mbps to 100Gbps and supports key industry standards such as Fibre Channel, Infiniband, Ethernet, PON, SONET and PCI Express.
Power Management and High-Reliability Products. Power management products control, alter, regulate and condition the power supplies within electronic systems. The highest volume product types within the power management product line are switching voltage regulators, combination switching and linear regulators, smart regulators and charge pumps. Our power management products feature highly integrated devices for the telecom industry and low-power, small form factor and high-efficiency products for mobile phones, notebook computers, computer peripherals and other portable devices. The primary application for these products is power regulation for computer, communications, high-end consumer and industrial systems. Our high-reliability discrete semiconductor products comprised of rectifiers, assemblies (packaged discrete rectifiers) and other products are typically used to convert alternating currents (“AC”) into direct currents (“DC”) and to protect circuits against very high voltage spikes or high current surges. Our high-reliability products can be found in a broad range of applications including industrial, military, medical, aerospace and defense systems, including satellite communications.
Wireless and Sensing Products. We design, develop and market a portfolio of specialized radio frequency (“RF”) functions used in a wide variety of industrial, medical and networking applications, and specialized sensing functions used in industrial and consumer applications. Our wireless and sensing products feature industry leading and longest range industrial, scientific and medical (“ISM”) radio, enabling low cost of ownership and increased reliability in all environments. Our unique sensing interface platforms can interface to any sensor and output digital data in any form. Our wireless and sensing products can be found in a broad range of applications in the industrial, medical and consumer markets.

7
Semtech End-Markets Our products are sold to customers in the enterprise computing, communications, high-end consumer, and industrial end-markets. Our estimates of sales by major end-markets are detailed below:
Fiscal Years (percentage of net sales) 2013 2012 2011 Enterprise Computing 15 % 9 % 9 % Communications 31 % 39 % 37 % High-End Consumer 29 % 35 % 33 % Industrial and Other 25 % 17 % 21 % Total 100 % 100 % 100 %
We believe that our diversity in end-markets provides stability to our business and opportunity for growth.
The following table depicts our main product lines and their end-market and product applications:
Specific End-Product Applications Semtech’s Main Product Lines
Enterprise Computing Communications High-End Consumer Industrial / Other
Protection
Desktop PC/Notebooks,
Ultrabooks
3G/4G Base stations, 10/100/10000
Routers/Switches
Smartphones, tablets, cameras, TVs, settop
boxes
Measurement & instrumentation
devices, Automobile
Advanced Communications Data centers
40G/100G ULH/LH line cards, Optical Modules, 4G LTE
wireless base stations —
Military, aerospace
Power Management and High-Reliability
Servers, workstations, notebook computers,
add-on cards, computer gaming systems, printers,
copiers
Network cards, routers and hubs, telecom network
boards
Smartphones, tablets, cameras, TVs, settop
boxes
Power supplies, industrial systems, military, aerospace,
medical
Wireless and Sensing — —
Smartphones, media players, tablets, LCD
TVs, digital/still video cameras
Automated meter readers, industrial automation, home security, keyless
entry, hearing aids
Gennum
Servers, data centers, storage networks, cloud computing, fiber to the home
Backplane, LAN and WAN routers and
switches Thunderbolt cables
Video broadcast, video surveillance, ultrasound imaging
Seasonality Historically, our results have reflected some seasonality, with demand levels generally being slightly higher in the computer and high-end consumer products segments during the third and fourth quarters of our fiscal year in comparison to the first and second quarters.

8
Intellectual Capital and Product Development The design of intellectual property (“IP”) and the resulting development of proprietary products is a critical success factor for us. The recruiting and retaining of key technical talent is the foundation for designing, developing and selling this IP, in the form of new proprietary products, in the global marketplace. One of our strategies to recruit this talent is the establishment of multiple design center locations. As a result, we have design centers throughout the world.
Circuit design engineers, layout engineers, product and test engineers, application engineers and field application engineers are our most valuable employees. Together they perform the critical tasks of designing and laying out integrated circuits, turning these circuits into silicon devices, and conferring with customers about designing these devices into their applications. The majority of our engineers fit into one of these categories. Most of these engineers have many years of experience in the design, development and layout of circuits targeted for use in protection, advanced communications, power management and high-reliability, multimedia and data communications, and wireless and sensing applications. We also employ a number of software engineers and systems engineers that specialize in the development of software and systems architecture, who enable us to develop systems oriented products in select markets.
In fiscal year 2013, we incurred $120.0 million of product development and engineering expense. This represents 21% of net sales. Product development and engineering costs were $80.6 million or 17% of net sales and $69.6 million or 15% of net sales in fiscal years 2012 and 2011, respectively. We intend to make further investments in research and development in the future, which may include increasing our employee headcount and investing in design and development equipment.
Sales and Marketing Sales made directly to customers during fiscal year 2013 were approximately 61% of net sales. The remaining 39% of net sales were made through independent distributors. We have direct sales personnel located throughout the United States, Europe and Asia who manage the sales activities of independent sales representative firms and independent distributors. We expense our advertising costs as they are incurred.
We operate internationally through our wholly owned Swiss and Canadian subsidiaries, Semtech International AG and Semtech Canada Corporation. Semtech International AG serves the European markets from its headquarters in Wil, Switzerland and through its wholly owned subsidiaries based in France, Germany, Neuchatel – Switzerland, the United Kingdom, China and Malaysia. Semtech International AG maintains branch offices, either directly or through one of its wholly owned subsidiaries, in Taiwan, Korea and Japan. Semtech International AG also maintains representative offices in China. Semtech Canada Corporation serves the North American market for GPG products from its headquarters in Burlington, Ontario. Semtech Canada Corporation also serves the European and Japanese markets for GPG products through its wholly owned subsidiaries in the United Kingdom and Japan. Semtech Canada Corporation also maintains research and development facilities in Mexico and India. Independent representatives and distributors are also used to serve customers throughout the world. Some of our distributors and sales representatives also offer products from our competitors, as is customary in the industry.
Customers, Sales Data and Backlog As a result of the breadth of our products and markets, we have a broad range of customers.

9
Representative Customers by End-Markets:
Enterprise Computing Communications High-End Consumer Industrial
Hewlett-Packard Cisco LG Electronics General Atomics Lenovo Alcatel-Lucent Motorola Honeywell Quanta Huawei Quanta Itron
Samsung Nokia Siemens Research in Motion Phonak LuxNet Ericsson Samsung Raytheon Apple Samsung Sony Ericsson Nokia Siemens
ZTE Sumitomo Electric
Our customers include major original equipment manufacturers (“OEMs”) and their subcontractors in the enterprise computing, communications, high-end consumer and industrial end-markets. Our products are typically purchased by these customers for our performance, price, or technical support, as compared to our competitors.
During fiscal years 2013, 2012 and 2011, U.S. sales contributed 17%, 20% and 23%, respectively to our net sales. Foreign sales constituted 83%, 80% and 77% of our net sales during fiscal years 2013, 2012 and 2011, respectively. A majority of foreign sales were to customers located in the Asia-Pacific region, with sales to customers located in South Korea, Japan, and China (including Hong Kong) comprising 7%, 10%, and 35% of our net sales, respectively, in fiscal year 2013. No other foreign country comprised more than 7% of net sales in fiscal year 2013. See Note 16 to our consolidated financial statements included in Item 8 of this report for additional financial information by geographic region.
A summary of net sales by region follows.
Sales by Region
Fiscal Years (in thousands, except percentages) 2013 2012 2011 North America $ 98,401 17 % $ 114,552 24 % $ 112,404 25 % Asia-Pacific 405,179 70 % 298,477 62 % 272,079 60 % Europe 75,247 13 % 67,572 14 % 70,019 15 %
Total Net Sales $ 578,827 100 % $ 480,601 100 % $ 454,502 100 %
The following table sets forth the concentration of net sales and accounts receivable among the customers that accounted for more than 10% of our net sales in one of the fiscal years 2013, 2012 and 2011:
Concentration of Net Sales - Significant Customers
Fiscal Years (percentage of net sales) 2013 2012 2011 Samsung Electronics (and affiliates) 12 % 13 % 12 % Huawei Technologies (and affiliates) 10 % 7 % 8 % Frontek Technology Corp 6 % 10 % 11 %

10
Concentration of Accounts Receivable - Significant Customers
Fiscal Years (percentage of net accounts receivable as of fiscal year end) 2013 2012 Samsung Electronics (and affiliates) 12 % 14 % Frontek Technology Corp 4 % 10 % Dragon Technology 3 % 11 % Huawei Technologies (and affiliates) 14 % 11 %
For fiscal year 2013, end-market concentration for our significant customers was as follows:
(percentage of net sales) Samsung Electronics
(and affiliates) Huawei Technologies Co
(and affiliates) Enterprise Computing 1 % — Communications — 11 % High-End Consumer 11 % (1) — Industrial and Other — — 12 % 11 %
(1) For Samsung Electronics, approximately 54% of the sales into the High-end Consumer end-market relate to products focused on the handheld market, which includes cell phones.
Our backlog of orders as of the end of fiscal years 2013, 2012 and 2011 was approximately $113.8 million, $75.6 million and $112.3 million, respectively. The majority of our backlog is typically requested for delivery within six months. In markets where the end system life cycles are relatively short, customers typically request delivery in four to eight weeks. A backlog analysis at any given time gives little indication of our future business except on a short-term basis, principally within the next 45 days. We do not have any significant contracts with our customers calling for shipments over a period of more than 18 months.
Manufacturing Capabilities Our strategy is to outsource the majority of our manufacturing functions to third-party foundries and assembly and test contractors. The third-party foundries fabricate silicon wafers and the assembly and test contractors package and test our products. We believe this outsourcing permits us to take advantage of the best available technology, leverage the capital investment of others, and reduce our operating costs associated with manufacturing assets.
We perform a limited amount of internal probe and final test activities at our facilities in Camarillo, Irvine, Redondo Beach and San Diego, California; Neuchatel, Switzerland; and Reynosa, Mexico. These activities accommodate situations in which tight coupling with product design is desirable or where there are unique requirements. Our packaged discrete rectifier products are packaged and tested in-house in Reynosa, Mexico. Almost all of our other products are packaged and tested by outside subcontractors.
In keeping with our mostly “fabless” business model, we have no wafer fabrication facilities except for our operation in Reynosa, Mexico. For fiscal year 2013, the Reynosa facility provided almost all of the silicon for our packaged discrete rectifier products, which were approximately 3% of our end product sales. The remaining 97% of our end products were supported with finished silicon wafers purchased from outside wafer foundries in China, Taiwan, the United States, Canada, Europe and Israel. We anticipate that more than 90% of all silicon wafers we require will come from outside foundries in fiscal year 2014.
Despite our use of outside wafer foundries for sourcing a majority of our silicon needs, we do maintain internal process development capabilities. Our process engineers work closely with our outside foundries on the improvement and development of process capabilities. In fiscal year 2013, we purchased the vast majority of our wafers from

11
approximately nine different third-party wafer foundries and used various manufacturing processes, including Bipolar, High-Speed Bipolar, Complementary Metal-Oxide-Semiconductor (“CMOS”), RF-CMOS, Bi-CMOS and SiGe processes.
While we do have some redundancy of fabrication processes by using multiple outside foundries, any interruption of supply by one or more of these foundries could materially impact us. As a result, we maintain some amount of business interruption insurance to help reduce the financial risk associated with a wafer supply interruption, but we are not fully insured against this risk.
Although our products are made from basic materials (principally silicon, metals and plastics), all of which are available from a number of suppliers, capacity at wafer foundries sometimes becomes constrained. The limited availability of certain materials, such as silicon wafer substrates, may impact our suppliers’ ability to meet our demand needs or impact the price we are charged. The prices of certain other basic materials, such as metals, gases and chemicals used in the production of circuits have all increased in recent years as demand has grown for these basic commodities. In most cases we do not procure these materials ourselves but we are nevertheless reliant on these materials for producing our products because our outside foundry and package and test subcontractors must procure them. To help minimize risks associated with constrained capacity, we use multiple foundries and have taken other steps to reserve capacity at certain foundries.
Our largest wafer source is a foundry in China. In fiscal year 2013, this Chinese foundry provided 38% of our total silicon requirements in terms of cost of wafers purchased. We have consigned certain equipment to this foundry to support our specialized processes run at the foundry and to ensure a specified level of capacity over the next few years. While the provision of these assets to the wafer foundry may be factored into certain pricing arrangements with the foundry, the impact of any pricing adjustments is insignificant and does not impact our margin trends.
Most of our ultra-high speed SerDes products and microwave and high-reliability products are dependent on a single fabrication facility, located within the United States, for wafers.
We use third-party subcontractors to perform almost all of our assembly and test operations. A majority of our assembly and test activity is conducted by third-party subcontractors based in Malaysia, the Philippines, Korea and China. We have operations offices located in the Philippines, Malaysia and China that support and coordinate some of the worldwide shipment of products. We have installed our own test equipment at some of our packaging and testing subcontractors in order to ensure a certain level of capacity, assuming the subcontractor has ample employees to operate the equipment.
Our arrangements with both outside wafer foundries and package and test subcontractors are designed to provide some assurance of capacity but are not expected to assure access to all the manufacturing capacity we may need in the future.
Competition The analog and mixed-signal semiconductor industry is highly competitive, and we expect competitive pressures to continue. Our ability to compete effectively and to expand our business will depend on our ability to continue to recruit key engineering talent, our ability to execute on new product developments and our ability to persuade customers to design these new products into their applications. Our industry is characterized by decreasing unit selling prices over the life of a product as the volumes typically increase. However, price decreases can sometimes be quite rapid and faster than the rate of increase of the associated product volumes. We believe we compete effectively based upon our ability to capitalize on efficiencies and economies of scale in production and sales, and our ability to maintain or improve our productivity and product yields to reduce manufacturing costs. We are in direct and active competition, with respect to one or more of our product lines, with numerous manufacturers of varying size, technical capability and financial strength. A number of these competitors are dependent on semiconductor products as their principal source of income, and some are much larger than we are. The number of competitors has grown due to expansion of the market segments in which we participate. We consider our primary competitors with respect to our protection products to include STMicroelectronics N.V., NXP

12
Semiconductors N.V., ON Semiconductor Corporation, and Infineon Technologies AG. Our primary competitors with respect to our Advanced Communications products are Broadcom Corporation, AMCC, ClariPhy Communications, Inc., and our customer’s own internal solutions. With respect to our Power Management and High Reliability products, we consider our primary competitors to include Linear Technology Corporation, Maxim Integrated Products Inc., Microsemi Corporation, and Monolithic Power Systems Inc. Our primary competitors with respect to our Wireless and Sensing products include Silicon Laboratories, Texas Instruments Inc., Atmel Corporation, Analog Devices Inc., and Cypress Semiconductor Corporation. With respect to our Gennum Product Group, we consider our primary competitors to include Texas Instruments, Maxim Integrated, Inc., Mindspeed Technology Inc., and Inphi Corporation.
Intellectual Property and Licenses We have been granted 153 U.S. patents and 43 foreign patents and have numerous patent applications pending with respect to our products and to technologies associated with our business. The expiration dates of issued patents range from 2013 to 2031. Although we consider patents to be helpful in maintaining a competitive advantage, we do not believe they create definitive competitive barriers to entry. There can be no assurance that our patent applications will lead to issued patents, that others will not develop or patent similar or superior products or technologies, or that our patents will not be challenged, invalidated, or circumvented by others.
We have registered many of our trademarks in the U.S. and in various foreign jurisdictions. Registration generally provides rights in addition to basic trademark protections and is typically renewable upon proof of continued use. We have registered, or are in the process of registering, our SEMTECH trademark in many jurisdictions. In one location use of this trademark is prohibited, but we are permitted to use our Semtech International trade name. This restriction has not had a material impact on our business to date and we do not anticipate it will have a material impact in the future.
We also have registered certain materials in which we have copyright ownership, which provides additional protection for this intellectual property.
Employees As of January 27, 2013, we had 1,433 full-time employees. There were 529 employees in research and development, 250 in sales, marketing and field services, and 174 in general, administrative and finance. The remaining employees support operational activities, including product and test engineering, assembly, manufacturing, distribution and quality functions.
We have not had a work stoppage in at least the last decade and the only unionized employees are approximately 128 Mexican nationals who work at our manufacturing facility in Reynosa, Mexico. Our employee relations during the last fiscal year have been, and remain, satisfactory.
We adjust our workforce from time to time to meet the changing needs of our business. Competition for key design engineering talent globally is significant.
Government Regulations and Environmental Matters We are required to comply, and it is our policy to comply, with numerous government regulations that are normal and customary to businesses in our industry and that operate in our markets and operating locations.
Our sales that serve the military and aerospace markets primarily consist of our Microwave and High-Reliability products that have been qualified to be sold in these markets by the U.S. Department of Defense (“DOD”). In order to maintain these qualifications, we must comply with certain specifications promulgated by the DOD. As part of maintaining these qualifications, we are routinely audited by the DOD. Based on current specifications, we believe we can maintain our qualifications for the foreseeable future. However, these specifications could be modified by the DOD in the future or we could become subject to other government requirements, which could make the manufacturing of these products more difficult and thus could adversely impact our profitability in the Power

13
Management and High Reliability and Advanced Communications product lines. The U.S. State Department has determined that a small number of special assemblies from the Power Management and High Reliability and Advanced Communications product lines are subject to the International Traffic in Arms Regulations (“ITAR”). We have a Technical Assistance Agreement in place that permits us to assemble certain of these products in Mexico. Other products subject to ITAR regulations are manufactured in our Redondo Beach, CA facilities. International shipments of these products require a State Department license.
Our facilities throughout the world are subject to various environmental laws and regulations and we believe our operations are in substantial compliance with those laws and regulations. We have incurred, and may continue to incur, liabilities under various statutes for the cleanup of pollutants at locations we have operated and at third-party disposal and recycling sites we have used. During fiscal years 2012 and 2011, the expense incurred with respect to these clean up matters was not material. In fiscal year 2013, the Company has recorded $2.5 million environmental reserves associated with the November 2012 draft clean up and abatement order discussed below. New laws or regulations or changes to existing laws or regulations could subject our ongoing operations to different or additional environmental standards that could increase our cost of compliance in the future. In addition, our cost of doing business could increase if our suppliers increase prices to recoup the cost of their compliance with environmental laws or regulations. See Note 15 to our consolidated financial statements included in Item 8 of this report. The Company has used an environmental firm, specializing in hydrogeology, to perform monitoring of the groundwater at the Company’s former facility in Newbury Park, California that was leased for approximately forty years. The Company vacated the building in May 2002. Certain contaminants have been found in the local groundwater and site soils. Groundwater monitoring results to date over a number of years indicate that groundwater contaminants are, in full or in material part, from adjacent facilities. Responsibility for soil contamination remains under investigation. The location of key soil contamination is concentrated in an area of an underground storage tank that the Company believes to have been installed and used in the early 1960s by a former tenant at the site who preceded the Company’s tenancy. There are no claims pending with respect to environmental matters at the Newbury Park site. The applicable regulatory agency having authority over the site issued joint instructions in November 2008, ordering the Company and the current owner of the site to perform additional assessments and surveys, and to create ongoing groundwater monitoring plans before any final regulatory action for “no further action” may be approved. In September 2009, the regulatory agency issued supplemental instructions to the Company and the current site owner regarding previously ordered site assessments, surveys and groundwater monitoring. Most recently, in November 2012, the regulatory agency added two more potentially responsible parties to the matter, based on historical evidence of past occupancy or operations at the site dating to the 1960s. In addition, the regulatory agency has issued draft cleanup and abatement orders to all the parties. Responses to the draft orders were submitted in a timely manner by all the parties in January 2013. The parties are expected to work cooperatively in responding to and determining the appropriate scope and extent of additional site investigative and categorization work, as well as in relation to any ultimate proposed clean up and abatement work. The Company has accrued liabilities where it is probable that a loss will be incurred and the cost or amount of loss can be reasonably estimated. Based upon, and in anticipation of the likely outcome associated with the November 2012 draft cleanup and abatement order, the Company engaged an environmental firm to assist in an assessment of this site consistent with the direction of the draft order. Based on the Company’s preliminary assessment, it has determined a likely range of probable loss between $2.5 million and $5.7 million. Given the early nature of the draft clean up and abatement order and uncertainties associated with environmental assessment and the remediation activities, the Company is unable to determine a best estimate within the range of loss. Therefore, the Company recorded the minimum amount of $2.5 million in fiscal year 2013 under “Other long-term liabilities” on the consolidated balance sheets, and included in the consolidated statement of income under “Selling, general and administrative.” These estimates could change as a result of changes in planned remedial actions, further actions from the regulatory agency, remediation technology, and other factors.
Available Information
General information about us can be found on our website at www.semtech.com. The information on our website is for informational purposes only and should not be relied on for investment purposes. The information on our website is

14
not incorporated by reference into this report and should not be considered part of this or any other report filed with the SEC.
We make available free of charge, either by direct access on our website or a link to the SEC website, our annual report on Form 10-K, quarterly reports on Form 10-Q, current reports on Form 8-K and amendments to those reports filed or furnished pursuant to Section 13(a) or 15(d) of the Exchange Act, as soon as reasonably practicable after such reports are electronically filed with, or furnished to, the SEC. Our reports filed with, or furnished to, the SEC are also available directly at the SEC’s website at www.sec.gov. Item 1A. Risk Factors You should carefully consider and evaluate all of the information in this report, including the risk factors listed below. The risks described below are not the only ones facing our company. Additional risks not now known to us or that we currently deem immaterial may also impair our business operations. If any of these risks actually occur, our business could be materially harmed. If our business is harmed, the trading price of our common stock could decline.
As discussed earlier in “Special Notes Regarding Forward Looking and Cautionary Statements,” this report contains forward-looking statements that involve risks and uncertainties. Our actual results could differ materially from those anticipated in these forward looking statements as a result of certain factors including the risks faced by us described below and elsewhere in this report, in our other filings with the SEC, and in material incorporated herein and therein by reference. We undertake no duty to update or revise any forward-looking statements, whether as a result of new information, future events or otherwise.
Risks Relating to General Business Conditions Our future results may fluctuate, fail to match past performance or fail to meet expectations Our results may fluctuate in the future, may fail to match our past performance or fail to meet the expectations of analysts and investors. Our results and related ratios, such as gross margin, operating income percentage and effective tax rate may fluctuate as a result of:
• general economic conditions in the countries where we sell our products; • seasonality and variability in the computer market and our other end-markets; • the timing of new product introductions by us and our competitors; • product obsolescence; • the scheduling, rescheduling or cancellation of orders by our customers; • the cyclical nature of demand for our customers’ products; • our ability to develop new process technologies and achieve volume production; • our ability to integrate and realize synergies from recent acquisitions; • changes in manufacturing yields; • capacity utilization; • product mix and pricing; • movements in exchange rates, interest rates or tax rates; • the availability of adequate supply commitments from our outside suppliers; • the manufacturing and delivery capabilities of our subcontractors; and • litigation and regulatory matters.
As a result of these factors, our past financial results are not necessarily indicative of our future results.

15
Downturns in the business cycle could adversely affect our revenues and profitability The semiconductor industry is highly cyclical and has experienced significant downturns, which are characterized by reduced product demand, production overcapacity, increased levels of inventory, industry-wide fluctuations in the demand for semiconductors and the significant erosion of average selling prices. The cyclical nature of the semiconductor industry may cause us to experience substantial period-to-period fluctuations in our results of operations. The growth rate of the global economy is one of the factors affecting demand for semiconductor components. Many factors could adversely affect regional or global economic growth including increased price inflation for goods, services or materials, rising interest rates in the United States and the rest of the world, or tight credit markets. In addition, economic slowdowns may also affect our customers’ ability to pay for our products. Accordingly, economic slowdowns may harm our business.
Current global economic conditions could reduce demand for our products Current global economic conditions pose a risk to the overall economy as consumers and businesses may continue to defer purchases in response to the uncertainty around tighter credit and negative financial news. These conditions could reduce demand for our products. Such demand could be different from our expectations due to many factors including changes in business and economic conditions, conditions in the credit market that affect consumer confidence, customer acceptance of our products, changes in customer order patterns, including order cancellations, and changes in the level of inventory held by vendors.
Business interruptions could harm our business Our corporate headquarters, a portion of our assembly and research and development activities and certain other critical business operations are located near major earthquake fault lines. We do not maintain earthquake insurance and our business could be harmed in the event of a major earthquake. We generally do not maintain flood coverage, including for our Asian locations where certain of our operations support and sales offices are located. Such flood coverage has become very expensive; as a result the Company has elected not to purchase this coverage. If one of these locations were to experience a major flood, our business may be harmed.
Our business could be harmed if natural disasters interfere with production of wafers by our suppliers, assembly and testing of products by our subcontractors, or our distribution network. We maintain some business interruption insurance to help reduce the effect of such business interruptions, but we are not fully insured against such risks. Likewise, our business could be adversely impacted if a natural disaster were to shut down or significantly curtail production by one or more of our end customers. Any such loss of revenue due to a slowdown or cessation of end customer demand is uninsured.
When natural disasters, such as an earthquake or other causes, result in wide-spread destruction, the impact on our business may not be readily apparent. This is especially true when trying to assess the impact of the disaster on our end customers, who themselves may not fully understand the impact of the event on their business. The full extent and scope of natural disaster impacts, both in terms of direct impact on the Company and our supply chain, as well as on our end customers (to include their own supply chain issues as well as end market issues), may not be known for a considerable period of time following the disaster. When any such natural disaster occurs, there can be no assurance that our results of operations may not be materially affected as a result of the impact of the disaster on the Company or on our end customers.
We rely on third party freight firms for nearly all of our shipments from vendors to assembly and test sites, primarily in Asia, and for shipments of our final product to customers. This includes ground and air transportation. Any significant disruption of such freight business globally or in certain parts of the world, particularly where our operations are concentrated, could materially affect our ability to generate revenues. Business interruption insurance may not provide enough protection to compensate us for losses that may occur. Accordingly, any of these disruptions could significantly harm our business. Terrorist attacks, wars and other acts of violence, such as those that may result from the tension in the Middle East and the Korean peninsula, or any other national or international crisis, calamity or emergency, may result in

16
interruption to the business activities of many entities, business losses and overall disruption of the U.S. economy at many levels. These events may directly impact our physical facilities or those of our customers and suppliers. Additionally, these events or armed conflicts may cause some of our customers or potential customers to reduce the level of expenditures on their services and products that ultimately may reduce our revenue. The consequences of these reductions are unpredictable, and we may not be able to foresee events that could have an adverse effect on our business. For example, as a result of these events, insurance premiums for businesses may increase and the scope of coverage may be decreased. Consequently, we may not be able to obtain adequate insurance coverage for our business and properties. To the extent that these disruptions result in delays or cancellations of customer orders, a general decrease in corporate spending, or our inability to effectively market our services and products, our business and results of operations could be harmed. We operate a manufacturing facility in Reynosa, Mexico. Historically, certain regions in Mexico have experienced high levels of violence. Any significant disruption of our operations at this facility could materially affect our ability to generate revenues for certain products within our High-Reliability product line. Some of the products that we produce at this facility require certification by the Defense Contract Audit Agency (“DCAA”). Failure to secure or maintain the required certification, either directly through the DCAA or through a qualifying third party would materially affect our authorization to manufacture applicable products at this facility, and our revenue for certain products within our High-Reliability product line could materially decline. An audit was performed in May 2012 by the Defense Logistic Agency (DLA) Land and Maritime office, which is the Department of Defense (DoD) agency having oversight responsibility for applicable products manufactured in this facility. The DLA has indicated that a letter of certification to allow the Company to continue producing High-Reliability products will be issued in March 2013. The applicable certification will list the Company on the DoD Qualified Parts List (QPL) as a MIL-PRF-19500 Semiconductor Manufacturer of JAN, JANTX, JANTXV and JANS quality level components. The certification cycle is every two years. Semtech has been continuously certified to produce QPL components for over 20 years without lapse.
A large percentage of our sales are to customers located in Asia and a large percentage of our products are manufactured in Asia. One of our largest customer bases in Asia is located in Taiwan. Our largest wafer source is located in China. An outbreak of SARS or other health related issues, such as an avian influenza (bird flu) pandemic, could have a negative impact on consumer demand, on travel needed to secure new business or manage our operations, on transportation of our products from our suppliers or to our customers, or on workers needed to sell or manufacture our products or our customers’ products.
Risks Relating to Production Operations We obtain many essential components and materials and certain critical manufacturing services from a limited number of suppliers and subcontractors, most of which are foreign-based entities
Our reliance on a limited number of subcontractors and suppliers for wafers, packaging, testing and certain other processes involves several risks, including potential inability to obtain an adequate supply of required components and reduced control over the price, timely delivery, reliability and quality of components. These risks are attributable to several factors, including limitations on resources, labor problems, equipment failures or the occurrence of natural disasters. The good working relationships we have established with our suppliers and subcontractors could be disrupted, and our supply chain could suffer, if a supplier or subcontractor were to experience a change in control. There can be no assurance that problems will not occur in the future with suppliers or subcontractors. Disruption or termination of our supply sources or subcontractors could significantly delay our shipments and harm our business. Delays could also damage relationships with current and prospective customers. Any prolonged inability to obtain timely deliveries or quality manufacturing or any other circumstances that would require us to seek alternative sources of supply or to manufacture or package certain components internally could limit our growth and harm our business.
We are subject to risk from fluctuating market prices of certain commodity raw materials, particularly gold, that are incorporated into our end products or used by our suppliers to process our end products. Increased commodity prices are passed on to us in the form of higher prices from our suppliers, either in the form of general price increases or commodity surcharges. Although we generally deal with our suppliers on a purchase order basis rather than on a long-

17
term contract basis, we generally attempt to obtain firm pricing for volumes consistent with planned production. Our gross margins may decline if we are not able to increase selling prices of our products or obtain manufacturing efficiencies to offset the increased cost. We do not enter into formal hedging arrangements to mitigate against commodity risk.
Most of our outside subcontractors and suppliers, including third-party foundries that supply silicon wafers, are located in foreign countries, including China, Taiwan, the United States, Canada, Europe and Israel. For fiscal year 2013, approximately 38% of our silicon in terms of cost of wafers, was supplied by a third-party foundry in China, and this percentage could be even higher in future periods. For fiscal years 2012 and 2011, approximately 59% and 49%, respectively, of our silicon in terms of cost of wafers was supplied by this third-party foundry in China. While our utilization of multiple outside foundries does create some redundancy of fabrication processes, any interruption of supply by one or more of these foundries could materially impact us. We maintain some amount of business interruption insurance to help reduce the risk of wafer supply interruption, but we are not fully insured against such risk.
A majority of our package and test operations are performed by third-party contractors based in Malaysia, Korea, the Philippines and China. Our international business activities, in general, are subject to a variety of potential risks resulting from political and economic uncertainties. Any political turmoil or trade restrictions in these countries, particularly China, could limit our ability to obtain goods and services from these suppliers and subcontractors. The effect of an economic crisis or political turmoil on our suppliers located in these countries may impact our ability to meet the demands of our customers. If we find it necessary to transition the goods and services received from our existing suppliers or subcontractors to other firms, we would likely experience an increase in production costs and a delay in production associated with such a transition, both of which could have a significant negative effect on our operating results, as these risks are substantially uninsured.
Our ultra-high speed SerDes products and most of our microwave products are dependent on a single fabrication facility, located within the United States, for wafers. Any extended or continued interruption of supply by this supplier facility could materially impact our ability to ship these products to customers. An extended or protracted failure by us to deliver products to customers in accordance with contractual delivery commitments could result in lost business opportunities and may in certain circumstances trigger contractual penalties or other contractual liabilities to customers, including stipulated delay fees and/or the cost differential of substitute products.
Our products may be found to be defective, product liability claims may be asserted against us and we may not have sufficient liability insurance One or more of our products may be found to be defective after shipment, requiring a product replacement, recall, or a software solution that would cure the defect but impede performance of the product. We may also be subject to product returns in the ordinary course of our business which could impose substantial costs and harm our business. Beyond the potential direct cost associated with product failures, loss of confidence by major customers could cause sales of our other products to drop significantly.
Product liability claims may be asserted with respect to our technology or products. Our products are typically sold at prices that are significantly lower than the cost of the modules or end-products into which they are incorporated. A defect or failure in our product could give rise to failures in the module or the ultimate end-product, so we may face claims for damages that are disproportionately higher than the revenues and profits we receive from the products involved, especially if our customer seeks to recover for damage claims made against it by its own customers. While we maintain some insurance for such events, there can be no assurance that we have obtained a sufficient amount of insurance coverage, and that asserted claims will be within the scope of coverage of the insurance, or that we will have sufficient resources to satisfy any asserted claims not covered by insurance.
Our general warranty policy provides for repair or replacement of defective parts. In some cases, a refund of the purchase price is offered. In certain instances, we have agreed to other warranty terms, including some indemnification provisions, which could prove to be significantly more costly than repair, replacement or refund. If there is a substantial increase in the rate of customer claims, if our estimate of probable losses relating to identified

18
warranty exposures prove inaccurate, or if our efforts to contractually limit liability prove inadequate, we may record a charge against future cost of sales.
Risks Relating to Research and Development, Engineering, Intellectual Property and New Technologies We may be unsuccessful in developing and selling new products, which is central to our objective of maintaining and expanding our business
We operate in a dynamic environment characterized by price erosion, rapid technological change, and design and other technological obsolescence. Our competitiveness and future success depend on our ability to achieve design wins for our products with current and future customers and introduce new or improved products that meet customer needs while achieving favorable margins. A failure to achieve design wins, to introduce these new products in a timely manner, or to achieve market acceptance for these products could harm our business.
The introduction of new products presents significant business challenges because product development commitments and expenditures must be made well in advance of product sales. The success of a new product depends on accurate forecasts of long-term market demand and future technological developments, as well as on a variety of specific implementation factors, including:
• timely and efficient completion of process design and development;
• timely and efficient implementation of manufacturing and assembly processes;
• product performance;
• the quality and reliability of the product; and
• effective marketing, sales and service. The failure of our products to achieve market acceptance due to these or other factors could harm our business.
We may be unable to adequately protect our intellectual property rights We pursue patents for some of our new products and unique technologies, but we rely primarily on trade secret protections through a combination of nondisclosure agreements and other contractual provisions, as well as our employees’ commitment to confidentiality and loyalty, to protect our know-how and processes. We intend to continue protecting our proprietary technology, including through trademark and copyright registrations and patents. Despite this intention, we may not be successful in achieving adequate protection. Our failure to adequately protect our material know-how and processes could harm our business. There can be no assurance that the steps we take will be adequate to protect our proprietary rights, that our patent applications will lead to issued patents, that others will not develop or patent similar or superior products or technologies, or that our patents will not be challenged, invalidated, or circumvented by others. Furthermore, the laws of the countries in which our products are or may be developed, manufactured or sold may not protect our products and intellectual property rights to the same extent as laws in the United States.
The semiconductor industry is characterized by frequent claims of infringement and litigation regarding patent and other intellectual property rights. Due to the number of competitors, intellectual property infringement is an ongoing risk since other companies in our industry could have intellectual property rights that may not be identifiable when we initiate development efforts. Litigation may be necessary to enforce our intellectual property rights and we may have to defend ourselves against infringement claims. Any such litigation could be very costly and may divert our management’s resources. If one of our products is found to infringe on a third party’s rights, we may have liability for past infringement and may need to seek a license to use such intellectual property going forward. If a license is not available or if we are unable to obtain a license on terms acceptable to us, we would either have to change our product so that it does not infringe or stop making the product.

19
We must commit resources to product production prior to receipt of purchase commitments and could lose some or all of the associated investment Sales are made primarily on a current delivery basis, pursuant to purchase orders that may be revised or cancelled by our customers without penalty, rather than pursuant to long-term contracts. Some contracts require that we maintain inventories of certain products at levels above the anticipated needs of our customers. As a result, we must commit resources to the production of products without binding purchase commitments from customers. Our inability to sell products after we devote significant resources to them could harm our business.
Risks Relating to International Operations We sell and trade with foreign customers, which subjects our business to increased risks Sales to foreign customers accounted for approximately 83% of net sales in the fiscal year ended January 27, 2013. Sales to our customers located in China (including Hong Kong) and South Korea constituted 35% and 7%, respectively, of net sales for fiscal year 2013. International sales are subject to certain risks, including unexpected changes in regulatory requirements, tariffs and other barriers, political and economic instability, difficulties in accounts receivable collection, difficulties in managing distributors and representatives, difficulties in staffing and managing foreign subsidiary and branch operations and potentially adverse tax consequences. These factors may harm our business. Our use of the Semtech name may be prohibited or restricted in some countries, which may negatively impact our sales efforts. In addition, substantially all of our foreign sales are denominated in U.S. dollars and currency exchange fluctuations in countries where we do business could harm us by resulting in pricing that is not competitive with prices denominated in local currencies.
Our foreign currency exposures may change over time as the level of activity in foreign markets grows and could have an adverse impact upon financial results As a global enterprise, we face exposure to adverse movements in foreign currency exchange rates. Certain of our assets, including certain bank accounts, exist in non-U.S. dollar-denominated currencies, which are sensitive to foreign currency exchange rate fluctuations. The non-U.S. dollar-denominated currencies are principally the Swiss Franc, Euro, Canadian dollars, Mexican Peso, Japanese Yen and British Pound Sterling. We also have a significant number of employees that are paid in foreign currency, the largest groups being United Kingdom-based employees who are paid in British Pound Sterling, Swiss-based employees who are paid in Swiss Francs, Canada-based employees who are paid in Canadian dollars, and Mexican nationals who are paid in Mexican Pesos.
If the value of the U.S. dollar weakens relative to these specific currencies, as it has done in recent years, the cost of doing business in terms of U.S. dollars rises. With the growth of our international business, our foreign currency exposures may grow and under certain circumstances, could harm our business.
As a means of managing our foreign exchange exposure, we routinely convert U.S. dollars into foreign currency in advance of the expected payment. The Company regularly assesses whether or not to hedge foreign exchange exposure. Any future use of forward contracts to hedge foreign exchange exposure may be required to be marked-to-market each quarter and can create volatility in net income not directly tied to our operating results.
We may be subject to increased tax liabilities and an increased effective tax rate if we need to repatriate funds held by our foreign subsidiaries
As of January 27, 2013, our foreign subsidiaries held approximately $180.2 million of cash, cash equivalents, and short-term investments and $383.7 million of unremitted earnings for which no Federal or State taxes have been provided. If we needed these funds for investment in our domestic operations, any repatriation, such as that which occurred in fiscal year 2010 to partially fund the acquisition of Sierra Monolithics, Inc. (“SMI”), could result in increased tax liabilities.
We are subject to export restrictions and laws affecting trade and investments As a global company headquartered in the United States, we are subject to U.S. laws and regulations that limit and restrict the export of some of our products. Compliance with these laws has not significantly limited our operations or

20
our sales in the recent past, but could significantly limit them in the future. We maintain an export compliance program but there are risks that the compliance controls could be circumvented, exposing us to legal liabilities. We must also comply with export restrictions and laws imposed by other countries affecting trade and investments. Although these restrictions and laws have not significantly restricted our operations in the recent past, there is a risk that they could do so in the future.
Risks Relating to Sales, Marketing and Competition We compete against larger, more established entities and our market share may be reduced if we are unable to respond to our competitors effectively The semiconductor industry is intensely competitive and is characterized by price erosion, rapid technological change, and design and other technological obsolescence. We compete with domestic and international semiconductor companies, many of which have substantially greater financial and other resources with which to pursue engineering, manufacturing, marketing and distribution of their products. Some of these competitors include: Linear Technology Corporation, Maxim Integrated Products Inc., Microsemi and Monolithic Power Systems Inc., with respect to our Power Management and High Reliability products; and STMicroelectronics N.V., NXP Semiconductors N.V., ON Semiconductor Corporation, and Infineon Technologies AG, with respect to our Protection products. Our primary competitors with respect to our Advanced Communication products are Broadcom Corporation, ClariPhy Communications, Inc., and our customer’s own internal solutions. Our primary competitors with respect to our Wireless and Sensing products include Silicon Laboratories, Texas Instruments Inc., Atmel Corporation, Analog Devices Inc., and Cypress Semiconductor Corporation. With respect to our Gennum Product Group, we consider our primary competitors to include Texas Instruments, Maxim Integrated, Inc., Mindspeed Technology Inc., and Inphi Corporation.
We expect continued competition from existing competitors as well as competition from new entrants in the semiconductor market. Our ability to compete successfully in the rapidly evolving area of integrated circuit technology depends on several factors, including:
• success in designing and manufacturing new products that implement new technologies;
• protection of our processes, trade secrets and know-how;
• maintaining high product quality and reliability;
• pricing policies of our competitors;
• performance of competitors’ products;
• ability to deliver in large volume on a timely basis;
• marketing, manufacturing and distribution capability; and
• financial strength. To the extent that our products achieve market success, competitors typically seek to offer competitive products or lower prices; if they are successful, they could harm our business.
We receive a significant portion of our revenues from a small number of customers and the loss of any one of these customers or failure to collect a receivable from them could adversely affect our business
Our largest customers have varied from year to year. Historically, we have had significant customers that individually accounted for 10% or more of consolidated revenues in certain quarters or represented 10% or more of net accounts receivables at any given date. One of our authorized distributors regularly accounts for more than 10% of net sales on an annual basis. Depending on the authorized distributor and their strategic focus, they can support anywhere from a few end-customers to many end-customers.

21
Concentration of Net Sales - Significant Customers Fiscal Years (percentage of net sales) 2013 2012 2011 Samsung Electronics (and affiliates) 12 % 13 % 12 % Huawei Technologies (and affiliates) 10 % 7 % 8 % Frontek Technology Corp 6 % 10 % 11 %
Concentration of Accounts Receivable - Significant Customers Fiscal Years (percentage of net accounts receivable as of fiscal year end) 2013 2012 Samsung Electronics (and affiliates) 12 % 14 % Frontek Technology Corp 4 % 10 %
Dragon Technology 3 % 11 % Huawei Technologies (and affiliates) 14 % 11 %
In addition to those customers representing greater than 10% of net sales listed above, we had several end-customers in fiscal year 2013 that, on an annual basis, accounted for more than 3% of net sales, but less than 10% of net sales.
Sales to our customers are generally made on open account, subject to credit limits we may impose, and the receivables are subject to the risk of being uncollectible.
We primarily conduct our sales on a purchase order basis, rather than pursuant to long-term contracts. The loss of any significant customer, any material reduction in orders by any of our significant customers, the cancellation of a significant customer order or the cancellation or delay of a customer’s significant program or product could harm our business.
Most of our authorized distributors, which together represent approximately half of our net sales, can terminate their contract with us with little or no notice. The termination of a distributor could negatively impact our business, including net sales and accounts receivable In fiscal year 2013, authorized distributors accounted for approximately 39% of our net sales. We generally do not have long-term contracts with our distributors and most can terminate their agreement with us with little or no notice. For fiscal year 2013, our two largest distributors were based in Asia.
The termination of any of our distributor relationships could impact our net sales and limit our access to certain end-customers. It could also result in the return of excess inventory of our product held by that distributor. Since many distributors simply resell finished products, they generally operate on very thin profit margins. If a distributor were to terminate an agreement with us or go out of business, our accounts receivable from the particular distributor would be subject to significant collection risk.
Risks Relating to Governmental Regulations, including Taxes, Financial Reporting Rules and Regulations, and Environmental Regulations We are subject to government regulations and other standards that impose operational and reporting requirements We, our suppliers, and our customers are subject to a variety of United States federal, foreign, state and local governmental laws, rules and regulations, including those related to the use, storage, handling, discharge or disposal of certain toxic, volatile or otherwise hazardous chemicals and the incorporation of such substances into products available for sale. If we or our suppliers were to incur substantial additional expenses to acquire equipment or otherwise comply with environmental regulations, product costs could significantly increase, thus harming our business.

22
We are also subject to laws, rules, and regulations related to export licensing and customs requirements, including the International Traffic in Arms Controls, the North American Free Trade Agreement and State Department and Commerce Department rules.
Additional laws, rules and regulations at the United States federal and relevant foreign levels governing data privacy protections for personal information, and corrupt practices/anti-bribery prohibitions, impact our business in terms of ongoing monitoring of compliance. Legislation and related regulations in the United Kingdom under that country’s Bribery Act could have extra-territorial application of compliance standards that may be inconsistent with comparable United States law, requiring the Company to re-evaluate and amend its compliance programs, policies and initiatives.
The SEC and NASDAQ have revised, and continue to revise, their regulations and listing standards. These developments have increased, and may continue to increase, our legal compliance and financial reporting costs. These developments also may make it more difficult and more expensive for us to obtain director and officer liability insurance, and we may be required to accept reduced coverage or incur substantially higher costs to obtain coverage. This, in turn, could make it more difficult for us to attract and retain qualified members of our Board of Directors, or qualified executive officers.
Failure to comply with present or future laws, rules and regulations of any kind that govern our business could result in suspension of all or a portion of production, cessation of all or a portion of operations, or the imposition of significant regulatory, administrative, civil, or criminal penalties or sanctions, any of which could harm our business.
Our failure to comply with any applicable environmental regulations could result in a range of consequences, including fines, suspension of production, excess inventory, sales limitations, and criminal and civil liabilities and new regulations related to “conflict minerals” may force us to incur additional expenses, may make our supply chain more complex and may result in damage to our reputation with customers. We are subject to various state, federal and international laws and regulations governing the environment, including restricting the presence of certain substances in electronic products and making producers of those products financially responsible for the collection, treatment, recycling and disposal of those products. Although our management systems are designed to maintain compliance, we cannot assure you that we have been or will be at all times in complete compliance with such laws and regulations. If we violate or fail to comply with any of them, a range of consequences could result, including fines, import/export restrictions, sales limitations, criminal and civil liabilities or other sanctions. We could also be held liable for any and all consequences arising out of exposure to hazardous materials used, stored, released, disposed of by us or located at, under or emanating from our facilities or other environmental or natural resource damage.
Environmental laws are complex, change frequently and have tended to become more stringent over time. For example, the European Union and China are two among a growing number of jurisdictions that have enacted in recent years restrictions on the use of lead, among other chemicals, in electronic products. These regulations affect semiconductor packaging. There is a risk that the cost, quality and manufacturing yields of lead-free products may be less favorable compared to lead-based products or that the transition to lead-free products may produce sudden changes in demand, which may result in excess inventory.
Future environmental legal requirements may become more stringent or costly and our compliance costs and potential liabilities arising from past and future releases of, or exposure to, hazardous substances may harm our business and our reputation.
On August 22, 2012, under the Dodd-Frank Wall Street Reform and Consumer Protection Act of 2010, or the Dodd-Frank Act, the SEC adopted new requirements for companies that use certain minerals and metals, known as conflict minerals, in their products, whether or not these products are manufactured by third parties. These requirements will require companies to diligence, disclose and report whether or not such minerals originate from the Democratic Republic of Congo and adjoining countries. We will have to diligence whether such minerals are used in the manufacture of our products. The implementation of these new requirements could adversely affect the sourcing, availability and pricing of such minerals used in the manufacture of semiconductor devices. As a result, there may only be a limited pool of suppliers who provide conflict free metals, and we cannot assure you that we will be able to

23
obtain products in sufficient quantities or at competitive prices. In addition, we will incur additional costs to comply with the disclosure requirements, including costs related to determining the source of any of the relevant minerals and metals used in our products. Also, since our supply chain is complex, we may face reputational challenges with our customers and other stockholders if we are unable to sufficiently verify the origins for all metals used in our products. In such event, we may also face difficulties in satisfying customers who require that all of the components of our products are certified as conflict mineral free. The first report is due on May 31, 2014 for the 2013 calendar year. However, in October 2012, the U.S. Chamber of Commerce, the National Association of Manufacturers and the Business Roundtable filed a petition challenging the adoption of the rules by the SEC. It is presently unclear if this challenge will delay the effectiveness of the rule.
Changes in tax laws may materially impact tax liabilities and our effective tax rate We do not provide U.S. federal or state taxes for our unremitted income of wholly owned foreign subsidiaries that is considered to be permanently reinvested offshore and is not otherwise subject to current domestic taxation. The current U.S. Administration and Congress have proposed changes to current U.S. tax law, including international tax reform that, if enacted, could materially impact our tax liabilities and effective tax rate. We are subject to review by taxing authorities, including the Internal Revenue Service We are subject to review by domestic and foreign taxing authorities, including the Internal Revenue Service (“IRS”). Tax years prior to 2009 (fiscal year 2010) are generally not subject to examination by the IRS except for items with tax attributes that could impact open tax years. Changes to our tax filings could materially impact our tax liabilities and effective tax rate.
We may be subject to taxation in other jurisdictions which could negatively affect our operations As a global organization, we may be subject to a variety of transfer pricing or permanent establishment challenges by taxing authorities in various jurisdictions. If certain of our non-U.S. activities were treated as carrying on business as a permanent establishment and therefore, subject to income tax in such jurisdiction, our results of operations could be materially adversely affected.
Failure to maintain effective internal control over financial reporting or disclosure controls and procedures could have a material adverse effect on our business and stock price Section 404 of the Sarbanes-Oxley Act requires an annual management assessment of the effectiveness of internal controls over financial reporting and an annual report by our independent registered public accounting firm opining on our internal controls over financial reporting. Management is similarly required to review disclosure controls, which are controls established to ensure that information required to be disclosed in SEC reports is recorded, processed, summarized and reported in a timely manner.
If we fail to maintain the adequacy of our internal controls, as such standards are modified, supplemented or amended from time to time, we may not be able to ensure that we can conclude on an ongoing basis that we have effective internal control over financial reporting. Effective internal controls are necessary for us to produce reliable financial reports and are important in the prevention of financial fraud. If we cannot produce reliable financial reports or prevent fraud, our business and operating results could be harmed, investors could lose confidence in our reported financial information, and there could be a material adverse effect on our stock price. If we fail to maintain adequate disclosure controls and procedures, the reports we file with the SEC, including the financial statements contained therein, could be inaccurate or misleading.
Government investigations and inquiries from regulatory agencies could lead to enforcement actions, fines, restatement of our financial statements or other penalties and could result in litigation against us. In the past, we have been subject to government investigations and inquiries from regulatory agencies such as the SEC and we have had to restate our historical financial statements in connection with such inquiry related to our historical stock option practices. We may be subject to government investigations and receive additional inquiries from regulatory agencies in the future, which may lead to enforcement actions, fines or other penalties.

24
In addition, litigation has often been brought against a company in connection with the announcement of a government investigation or inquiry from a regulatory agency. Such lawsuits could result in the diversion of management’s time and attention away from business operations, which could harm our business. In addition, the costs of defense and any damages resulting from litigation, a ruling against us, or a settlement of the litigation could adversely affect our cash flow and financial results.
If such government investigations or inquiries result in a restatement of our financial statements, this could delay the filing of our subsequent SEC reports which, in turn, might result in the delisting of our common stock from the NASDAQ Stock Market for failure to meet continued listing requirements.
Risks Relating to our Business Strategies, Personnel and Other Operations The loss of any of our key personnel or the failure to attract or retain specialized technical and management personnel could impair our ability to grow our business Our future success depends upon our ability to attract and retain highly qualified technical, marketing and managerial personnel. We are dependent on a relatively small group of key technical personnel with analog and mixed-signal expertise. Personnel with highly skilled managerial capabilities, and analog and mixed-signal design expertise, are scarce and competition for personnel with these skills is intense. There can be no assurance that we will be able to retain key employees or that we will be successful in attracting, integrating or retaining other highly qualified personnel in the future. If we are unable to retain the services of key employees or are unsuccessful in attracting new highly qualified employees, our business could be harmed.
If our stock price declines below the exercise price of stock options held by our employees, the retention incentive aspect of the stock options is lost and there is a greater likelihood we will be unable to retain key talent. We face risks associated with companies we have acquired in the past and may acquire in the future We have expanded our operations through strategic acquisitions, such as the acquisition of SMI in December 2009 and Gennum Corporation in March 2012, and we may continue to expand and diversify our operations with additional acquisitions. Acquisitions have used and could use in the future a significant portion of our available liquid assets or we could incur debt or issue equity securities to fund acquisitions. Issuance of equity securities could be dilutive to existing shareholders. Debt financing could subject us to restrictive covenants that could have an adverse effect on our business. Although we undertake detailed reviews of proposed acquisition candidates and attempt to negotiate acquisition terms favorable to us, we may encounter difficulties or incur liabilities for which we have no recourse. We cannot provide any assurance that any acquisition will have a positive impact on our future performance.
If we are unsuccessful in integrating acquired companies into our operations or if integration is more difficult than anticipated, then we may not achieve anticipated cost savings or synergies and may experience disruptions that could harm our business. Some of the risks that may affect our ability to successfully integrate acquired companies include those associated with:
• conforming the acquired company’s standards, processes, procedures and controls with our operations;
• coordinating new product and process development, especially with respect to highly complex technologies;
• assuring acquired products meet our quality standards;
• loss of key employees or customers of the acquired company;
• hiring additional management and other critical personnel;
• increasing the scope, geographic diversity and complexity of our operations;
• consolidation of facilities and functions;
• the geographic distance between the companies; and

25
• disparate corporate cultures.
Acquisitions could have a negative impact on our future earnings by way of poor performance by the acquired company or, if we later conclude we are unable to use or sell an acquired product or technology, we could be required to write down the related intangible assets and goodwill.
Our ability to generate the significant amount of cash needed to service our debt obligations or to obtain additional financing depends on many factors beyond our control. We completed the acquisition of Gennum on March 20, 2012 and entered into senior secured first lien credit facilities in an aggregate principal amount of $350 million as described further under “Note 10- Credit Facilities.” Prior to the completion of the acquisition of Gennum, we did not have any material outstanding indebtedness. As a result of the incurrence of such debt, we expect our consolidated interest expense will increase and our ability to make payments on amounts borrowed under our credit facilities, and to fund our operations will depend on our ability to generate substantial operating cash flow. Our cash flow generation will depend on our future performance, which will be subject to prevailing economic conditions and to financial, business and other factors, many of which are beyond our control.
Our business may not generate sufficient cash flow from operations and, if we cannot service our debt, we will have to take actions such as reducing or delaying capital investments, selling assets, or seeking additional equity capital. We may not be able to, if required, effect these actions on commercially reasonable terms, or at all. Because of these and other factors beyond our control, we may be unable to pay the interest on or other amounts in respect of our indebtedness.
Restrictive covenants in the credit agreement governing our senior secured first lien credit facilities may restrict our ability to pursue our business strategies. The credit agreement governing our senior secured first lien credit facilities contain a number of restrictive covenants that impose significant operating and financial restrictions on us and may limit our ability to engage in acts that may be in our long-term best interests. The credit agreement includes covenants restricting, among other things, our and our subsidiaries’ ability to:
• incur or guarantee additional debt or issue certain preferred stock;
• pay dividends or make distributions on our capital stock or redeem, repurchase or retire our capital stock;
• make certain investments and acquisitions;
• create liens on our or our subsidiaries’ assets;
• enter into transactions with affiliates;
• merge or consolidate with another person or sell or otherwise dispose of substantially all of our assets;
• make certain payments in respect of other material indebtedness;
• alter the business that we conduct; and
• make certain capital expenditures.
Under the credit agreement, we are required to maintain a total leverage ratio and an interest expense coverage ratio. Our ability to meet such financial ratios can be affected by events beyond our control, and we cannot assure you that we will be able to meet such ratios. The credit agreement also contains various covenants and restrictions and a breach of any covenant or restriction could result in a default under our credit agreement. If any such default occurs, the lenders may elect (after the expiration of any applicable notice or grace periods) to declare all outstanding borrowings, together with accrued and unpaid interest and other amounts payable thereunder, to be immediately due and payable. Further, following an event of default under our credit facilities, the lenders will have the right to proceed against the

26
collateral granted to them to secure that debt. If the debt under our credit facilities were to be accelerated, our assets may not be sufficient to repay in full that debt that may become due as a result of that acceleration.
We rely on certain critical information systems for the operation of our business We maintain and rely upon certain critical information systems for the effective operation of our business. These information systems include telecommunications, the Internet, our corporate intranet, various computer hardware and software applications, network communications, and e-mail. These information systems may be owned by us or by our outsource providers or even third parties such as vendors and contractors and may be maintained by us or by such providers or third parties. These information systems are subject to attacks, failures, and access denials from a number of potential sources including viruses, destructive or inadequate code, power failures, and physical damage to computers, hard drives, communication lines and networking equipment. To the extent that these information systems are under our control, we have implemented security procedures, such as virus protection software and emergency recovery processes, to address the outlined risks; however, security procedures for information systems cannot be guaranteed to be failsafe and our inability to use or access these information systems at critical points in time could unfavorably impact the timely and efficient operation of our business. Additionally, any compromise of our information security could result in the unauthorized publication of our confidential business or proprietary information or the unauthorized release of customer or employee data and result in a violation of privacy or other laws, thus exposing us to litigation or damage to our reputation.
The costs associated with our indemnification of certain customers, distributors, and other parties could be higher in future periods In the normal course of our business, we indemnify other parties, including customers, distributors, and lessors, with respect to certain matters. These obligations typically arise pursuant to contracts under which we agree to hold the other party harmless against losses arising from a breach of representations and covenants related to certain matters, such as acts or omissions of our employees, infringement of third-party intellectual property rights, and certain environmental matters. We have not incurred any significant expense as a result of agreements of this type in at least a decade, but there can be no assurances that we will not incur expense under these indemnification provisions in the future.
We have also entered into agreements with our current and former directors and certain of our current and former executives indemnifying them against certain liabilities incurred in connection with their duties. Our Certificate of Incorporation and Bylaws contain similar indemnification obligations with respect to our current and former directors and employees, as does the California Labor Code. We cannot estimate the amount of potential future payments, if any, that we might be required to make as a result of these agreements. Our share price could be subject to extreme price fluctuations, and stockholders could have difficulty trading shares Historically, the market for the stock of high technology companies has been volatile, and the market price of our common stock has been and may continue to be subject to significant fluctuations. Fluctuations could be in response to items such as operating results, announcements of technological innovations, or market conditions for technology stocks in general. Additionally, the stock market in recent years has experienced extreme price and volume fluctuations that often have been unrelated to the operating performance of individual companies. These market fluctuations, as well as general economic conditions, may adversely affect the price of our common stock.
In addition, the future sale of a substantial number of shares of common stock by us or by our existing stockholders or option holders (including directors, officers, and employees, some of whom hold stock options that are approaching their expiration date) may have an adverse impact on the market price of the shares of common stock. There can be no assurance that the trading price of our common stock will remain at or near its current level.

27
Our decision to implement a new Enterprise Resource Planning (“ERP”) software platform has been subject to some delay, could be subject to further delays, may cost more than expected and could interrupt operational transactions during and following the implementation. We are currently implementing SAP’s enterprise resource planning software and making related enhancements to our integrated financial and supply chain management systems. This process is complex, time-consuming and expensive. Operational disruptions during the course of this process or delays in or results from the implementation of these enhancements could materially impact our operations. Our ability to forecast sales demand, ship products, manage our product inventory and record and report financial and management information on a timely and accurate basis could be impaired while we are making these enhancements, as well as after we complete the implementation. We have already experienced some delay in the implementation of the ERP system and there is no guarantee that other delays will not take place. Further changes in scope, timeline or cost could have a material adverse effect on our results of operation. Item 1B. Unresolved Staff Comments None. Item 2. Properties Our headquarters are located in Camarillo, California where we own an approximately 87,600 square foot facility that was completed in 2002. The parcel on which our headquarters is located can accommodate substantial expansion. The Camarillo facility houses inside sales, marketing and administrative offices as well as a very limited amount of test and probe activity.
We own a 30,000 square foot building in Reynosa, Mexico that supports some of the assembly and production needs of the Power Management and High-Reliability product line.
We lease an approximately 10,000 square foot building in San Diego, California that houses design, test and administrative functions and serves as a development center for our Wireless and Sensing product line. The lease on this facility runs through September 2014, with an option to extend for an additional five years.
Our Redondo Beach, California facilities consist of approximately 26,300 total square feet of leased space which house general offices for business functions relating to certain products of our Advanced Communications product line. The leases on these facilities expire at various times between 2013 and 2015. For the portion of the facilities for which the lease expires in 2013, we intend to continue occupancy in that space under a month to month tenancy. We also lease approximately 35,000 square feet in Irvine, California which facility houses design, test and administrative functions for our Advanced Communications product line. The leases on the Irvine facilities expire between 2014 and 2015. We lease a facility in Wil, Switzerland which serves as corporate headquarters for our Semtech International AG subsidiary and houses finance, administrative and other general functions. The lease on this facility runs through June 2019. In addition, we lease office and warehouse space in Neuchatel, Switzerland, the headquarters for our Wireless and Sensing product line. The lease on this facility expires in March 2016. We also lease space to house certain of our other administrative, design, sales and marketing, and operations in San Jose, California; Raleigh, North Carolina; Buckingham Township (Philadelphia), Pennsylvania; Canada; China; Finland; France; Germany; India; Japan; Lithuania; Mexico; South Korea; Sweden; the Philippines; Taiwan; and the United Kingdom.
We believe that our existing leased and owned space is more than adequate for our current operations, and that suitable replacement and additional space will be available in the future on commercially reasonable terms.

28
Item 3. Legal Proceedings The descriptions of the legal proceedings in Note 15 to the financial statements included in this report are incorporated by reference to this Item 3. Item 4. Mine Safety Disclosures Not applicable.
PART II Item 5. Market for Registrant’s Common Equity, Related Stockholder Matters and Issuer Purchases of
Equity Securities Market Information During fiscal years 2013 and 2012, our common stock traded on the NASDAQ Global Select Market under the symbol “SMTC.” The following table sets forth, for the periods indicated, the high and low sale prices of our common stock, as reported on the NASDAQ market, giving effect to all stock splits through the date hereof.
High Low
Fiscal year ended January 27, 2013: First Quarter $30.46 $25.54 Second Quarter $27.59 $22.22 Third Quarter $27.10 $23.18 Fourth Quarter $30.12 $22.95 Fiscal year ended January 29, 2012: First Quarter $28.29
$21.30 Second Quarter $29.47
$22.88 Third Quarter $26.23
$19.16 Fourth Quarter $29.40
$20.45
On March 22, 2013, the reported last sale price of our common stock on the NASDAQ Global Select Market was $33.69 per share.
Holders As of March 22, 2013, we had 287 holders of record of our common stock.
Dividends The payment of dividends on our common stock is within the discretion of our Board of Directors. Currently, we intend to retain earnings to finance the growth of our business. We have not paid cash dividends on our common stock during at least the five most recent fiscal years and our Board of Directors has not indicated any intent to declare a cash dividend on the common stock in the foreseeable future. The credit agreement governing our senior secured first lien credit facilities entered into in connection with our acquisition of Gennum includes covenants limiting our ability to pay dividends or make distributions on our capital stock.

29
Purchases of Equity Information with respect to purchases by the Company of shares of common stock during the fourth quarter of fiscal year 2013 follows:
Issuer Purchases of Equity Securities
Fiscal Month/Year
Total Number of Shares Purchased
(2) Average Price Paid per Share
Total Number of Shares Purchased as Part of Publicly Announced
Program
Approximate Dollar Value of Shares That May Yet Be
Purchased Under The Program (1)
November 2012 (10/29/12-11/25/12) — $ — — $50.0 million December 2012 (11/26/12-12/23/12) 178,085 $ 28.37 178,085 $45.0 million January 2013 (12/24/12-01/27/13) 85,358 $ 28.67 85,358 $42.5 million Total activity in the fourth quarter 263,443 263,443
(1) On March 4, 2008, we announced that our Board of Directors authorized the repurchase of up to $50 million of our common stock from time to time through negotiated or open market transactions (“2008 Program”). This stock repurchase program does not have an expiration date. On August 24, 2011, we announced a $36 million expansion of the 2008 Program. On November 30, 2011, we announced an additional $50 million expansion of our existing stock repurchase program.
(2) The table does not include shares surrendered to us in connection with the cashless exercise of stock options by employees and directors or shares surrendered to us to cover tax liabilities upon vesting of restricted stock.
Securities Authorized for Issuance Under Equity Compensation Plans See the information set forth in Part III, Item 12 of this Form 10-K.
Sales of Unregistered Securities We did not make any unregistered sales of equity securities during fiscal year 2013.

30
Performance Graph This chart and graph show the value of a $100 cash investment on the last day of fiscal year 2008 in (i) the Company’s common stock, (ii) the NASDAQ Composite Index, and (iii) the Philadelphia Semiconductor Index. Note that historic stock price performance is not necessarily indicative of future stock price performance.
Fiscal Year 2008 2009 2010 2011 2012 2013 Semtech $ 100
$ 93 $ 120
$ 175 $ 233
$ 240 NASDAQ Composite $ 100
$ 64 $ 92
$ 116 $ 121
$ 135 PHLX SEMICONDUCTOR SECTOR $ 100
$ 59 $ 89
$ 124 $ 117
$ 117
The information contained in this Item 5 under the heading “Performance Graph” (i) is being furnished and shall not be deemed “filed” for the purposes of Section 18 of the Exchange Act, or otherwise subject to the liabilities of that section, and (ii) shall not be incorporated by reference into any registration statement or other document pursuant to the Exchange Act, or the Securities Act, except as shall be expressly set forth by specific reference in such filing to this Item 5 Performance Graph information.
Item 6. Selected Financial Data The consolidated statement of income data set forth below for fiscal years 2013, 2012 and 2011 and the consolidated balance sheet data as of the end of fiscal years 2013 and 2012 are derived from, and qualified by reference to, the audited consolidated financial statements included in Item 8 of this report. The consolidated statement of income data for fiscal years 2010 and 2009 and the consolidated balance sheet data as of the end of fiscal years 2011, 2010 and 2009 are derived from the audited financial statements previously filed with the SEC on Form 10-K.
This information should be read in conjunction with Management’s Discussion and Analysis contained in Item 7 of this report, the audited financial statements and accompanying notes included in Item 8 of this report, and the corresponding items included in our Form 10-K for fiscal years 2012, 2011 and 2010. The fiscal year ended January 31, 2010 consisted of fifty-three weeks with the extra week falling in the fourth quarter. All other fiscal years presented consisted of fifty-two weeks. Our past results are not necessarily indicative of our future performance.

31
Income Statement Data
Fiscal Year Ended
(in thousands, except per share amounts) January 27,
2013 January 29,
2012 January 30,
2011 January 31,
2010 January 25,
2009 Net sales $ 578,827
$ 480,601 $ 454,502
$ 286,560 $ 294,820
Cost of sales 264,215 194,956
186,196 130,514
135,233 Gross profit 314,612
285,645 268,306
156,046 159,587
Operating costs and expenses:
Selling, general and administrative 149,070 100,629
110,404 77,934
75,200 Product development and engineering 120,009
80,577 69,624
44,847 41,405
Intangible amortization 29,944 10,853
9,520 2,348
1,091 Total operating costs and expenses 299,023
192,059 189,548
125,129 117,696
Operating income 15,589 93,586
78,758 30,917
41,891 Interest expense (14,363 ) — — — — Interest income and other (expense) income, net (977 )
593 574
3,054 4,287
Income before taxes 249 94,179
79,332 33,971
46,178 (Benefit) provision for taxes (41,690 )
5,092 6,760
33,014 8,657
Net income $ 41,939 $ 89,087
$ 72,572 $ 957
$ 37,521 Earnings per share:
Basic $ 0.64 $ 1.37 $ 1.16 $ 0.02
$ 0.61 Diluted $ 0.62 $ 1.32 $ 1.12
$ 0.02 $ 0.61
Weighted average number of shares used in computing earnings per share:
Basic 65,809 65,099 62,339 60,779
61,249 Diluted 67,472 67,350 64,523
61,676 61,999
Anti-dilutive shares not included in the EPS calculations 783 625 1,700 8,900
10,600
Balance Sheet Data
(in thousands) January 27,
2013 January 29,
2012 January 30,
2011 January 31,
2010 January 25,
2009 Cash, cash equivalents and investments $ 236,072 $ 327,665
$ 258,342 $ 162,223
$ 258,815 Working capital 248,311 360,330
259,873 146,086
279,887 Total assets 1,171,013 726,321
659,943 514,294
420,795 Long term debt, less current 282,286 — — — — Other long-term liabilities 34,177 29,151
37,503 35,173
8,960 Total stockholders’ equity 694,826 630,188
528,615 405,741
378,020 Note 1: The Company acquired Gennum on March 20, 2012 and Cycleo SAS on March 7, 2012. Both of these acquisitions
occurred during our fiscal year 2013 with Gennum being the more significant of the two. As a result, fiscal year 2013 reflects almost a full year on these acquisitions in our consolidated statements of income.
The Company acquired SMI on December 9, 2009 and Leadis Technology Inc. on February 6, 2009. Both of these acquisitions occurred during our fiscal year 2010 with SMI being the more significant of the two. As a result, fiscal year 2011 reflects a full year on these acquisitions in our consolidated statements of income.
Refer to Note 3 to our audited consolidated financial statements included in Item 8 of this report.

32
Item 7. Management’s Discussion and Analysis of Financial Condition and Results of Operations The following discussion and analysis of our financial condition and results of operations should be read in conjunction with Item 6 “Selected Consolidated Financial Data” and our audited consolidated financial statements and related notes included elsewhere in this Form 10-K.
As discussed in “Special Note Regarding Forward-Looking and Cautionary Statements” earlier in this report, this Form 10-K contains forward-looking statements that involve risks and uncertainties. Our actual results could differ materially from those anticipated in the forward looking statements, including as a result of the risks described in the cautionary statements in Item 1A “Risk Factors” and elsewhere in this Form 10-K, in our other filings with the SEC, and in material incorporated herein and therein by reference. We undertake no duty to update or revise any forward-looking statements, whether as a result of new information, future events or otherwise.
Overview
We are a leading supplier of analog and mixed-signal semiconductor products and were incorporated in Delaware in 1960. We design, produce and market a broad range of products that are sold principally into applications within the high-end consumer, industrial, enterprise computing and communications end-markets. The high-end consumer market includes handheld products, tablet computers, set-top boxes, digital televisions, digital video recorders, thunderbolt and fiberless high-speed interfaces and other consumer equipment. Applications for the industrial market include broadcast studio equipment, automated meter reading, military and aerospace, medical, security systems, automotive, industrial and home automation, video security and surveillance and other industrial equipment. Enterprise computing product markets include optical receiver and transceiver, desktops, notebooks, servers, graphic boards, monitors, printers, and other computer peripherals. Communications market applications include base stations, backplane, optical networks, carrier networks, switches and routers, servers, cable modems, signal conditioners, wireless LAN, and other communication infrastructure equipment. Our end-customers are primarily original equipment manufacturers and their suppliers, including Alcatel-Lucent, Cisco Systems, Inc., Huawei Technologies Co., Ltd., LG Electronics, Motorola, Nokia Siemens Networks, Itron, Apple, Phonak International, Research In Motion Limited, Samsung Electronics Co., and ZTE Corporation.
On March 20, 2012, we, through our wholly-owned subsidiary Semtech Canada Inc., completed the acquisition of all outstanding equity interests of Gennum Corporation (“Gennum”) (TSX: GND), a leading supplier of high speed analog and mixed-signal semiconductors for the optical communications and video broadcast markets.
Upon consummation of the acquisition, which constituted a change in control of Gennum, Gennum’s stock option awards and restricted shares became fully vested. We acquired 100% of the outstanding shares and vested stock options, restricted shares, and deferred share units of Gennum for CDN$13.55 per share for a total purchase price of $506.5 million. The acquisition was financed with a combination of cash from our international cash reserves and $347 million (net of original issue discount of $3 million) of five-year secured term loans with a combined interest rate of approximately 4% (see Note 10 to our audited consolidated financial statements included in Item 8 of this report).
Our primary reasons for the acquisition were to broaden our existing portfolio of high-speed communications platforms with Gennum’s 1 Gbps to 25 Gbps signal integrity platform, to complement our 40 Gbps to 100 Gbps SerDes solutions and to create one of the industry’s most complete and robust analog and mixed signal portfolios. In addition, Gennum’s strong position in video broadcast and the emerging HD video surveillance market further diversifies our portfolio of high-performance analog semiconductors and provides cross-selling potential with the combined customer base.
On March 7, 2012, we completed the acquisition of Cycleo SAS (“Cycleo”), a privately held company based in France that develops IP for wireless long-range semiconductor products used in smart metering and other industrial and consumer markets. This transaction, which was accounted for using the acquisition method of accounting, complements our current wireless offerings and will bring customers a set of high-end, digitally enhanced wireless solutions. Under the terms of the agreement, we paid the stockholders of Cycleo $5 million in cash at closing.

33
The audited consolidated financial statements for the fiscal year 2013 include the results of operations of Gennum and Cycleo commencing as of the acquisition dates.
We operate our business in one enterprise-wide reportable segment. Most of our sales to customers are made on the basis of individual customer purchase orders. Many customers include cancellation provisions in their purchase orders. Trends within the industry toward shorter lead-times and “just-in-time” deliveries have resulted in our reduced ability to predict future shipments. As a result, we rely on orders received and shipped within the same quarter for a significant portion of our sales. Orders received and shipped in fiscal years 2013 represented 41% of net sales. Sales made directly to customers during fiscal year 2013 were 61% of net sales. The remaining 39% of net sales were made through independent distributors.
Our business relies on foreign-based entities. Most of our outside subcontractors and suppliers, including third-party foundries that supply silicon wafers, are located in foreign countries, including China, Taiwan, the United States, Canada, Europe and Israel. For the fiscal year ended January 27, 2013, approximately 38% of our silicon, in terms of cost of wafers purchased, was manufactured in China. Foreign sales for fiscal year 2013 constituted approximately 83% of our net sales. Approximately 84% of foreign sales in fiscal year 2013 were to customers located in the Asia-Pacific region. The remaining foreign sales were primarily to customers in Europe and Canada. Results of Operations Fiscal Year 2013 Compared With Fiscal Year 2012
Presented below is our estimate of net sales by end-market.
Fiscal Years (in thousands, except percentages) 2013 2012 Change Enterprise Computing $ 85,945 15 % $ 41,716 9 % 106 % Communications 181,791 31 % 186,479 39 % (3 )% High-End Consumer 169,847 29 % 168,520 35 % 1 % Industrial and Other 141,243 25 % 83,886 17 % 68 % Total $ 578,826 100 % $ 480,601 100 % 20 %
Net Sales. Net sales for fiscal year 2013 were $578.8 million, an increase of 20% compared to $480.6 million for fiscal year 2012. Fiscal year 2013 revenues increased driven by strengthening demand in the enterprise computing and industrial end markets and by the impact of approximately $129.6 million of Gennum sales in the current fiscal year, partially offset by a slight decrease in demand from the high-end consumer and communications end markets. Fiscal year 2012 was also impacted by softening global economic conditions that resulted in a reduction in orders of our component products during the fiscal year. Higher revenue in the enterprise computing market is driven primarily by demand for the Gennum Product Group optical communications products. Within the communications category, lower revenue was attributed to softer demand for 40G communications products in our Advanced Communications product line, partially offset by increasing demand for 100G communication products. High-end consumer revenues were relatively flat due to softer demand in Protection products due to reduced demand from a North American Tier 1 smartphone customer offset by increasing demand for Gennum Product Group Thunderbolt cables. Higher revenue in the industrial category was attributed to video broadcast applications in the Gennum Product Group and continued strength in the medical business of our Wireless and Sensing Group.
Gross Profit. Gross profit was $314.6 million and $285.6 million in fiscal years 2013 and 2012, respectively. Our gross margin was 54.4% for fiscal year 2013, down from 59.4% in fiscal year 2012. Gross profit margins for fiscal year 2013 were negatively impacted by the amortization of $39.4 million of the fair value adjustment related to

34
acquired inventory recorded to cost of sales from the Gennum acquisition which offset a favorable end-market product mix driven primarily by the impact of approximately $129.6 million of Gennum sales in fiscal year 2013.
Operating Costs and Expenses. Fiscal Years (in thousands, except percentages) 2013 2012 Cost/Exp. % net sales Cost/Exp. % net sales Change Selling, general and administrative $ 149,070 26 % $ 100,629 21 % 48 % Product development and engineering 120,009 21 % 80,577 17 % 49 % Intangible amortization and impairments 29,944 5 % 10,853 2 % 176 %
Total operating costs and expenses $ 299,023 52 % $ 192,059 40 % 56 %
Selling, General & Administrative Expenses Selling, general and administrative (“SG&A”) expenses for fiscal year 2013 increased by $48.4 million or 48% driven primarily by $11.4 million of transaction and integration expenses due to the acquisition of Gennum and Cycleo in March 2012 and the impact of incremental Gennum SG&A expenses.
Selling, general and administrative expenses for fiscal years 2013 include approximately $2.5 million environmental reserves and $13.4 million severance costs associated with the integration of the acquired Gennum business with the Company’s pre-existing business (refer to Note 15 and Note 17 to our audited consolidated financial statements for details). Fiscal year 2012 includes $2.0 million for expenses attributed to a reorganization plan initiated during the third quarter of fiscal year 2012 which resulted in consolidation of research and development activities and reduction in workforce.
SG&A stock-based compensation expense was $15.0 million and $15.8 million in fiscal years 2013 and 2012, respectively. The year over year decrease in equity compensation was principally driven by staffing reductions associated with our reorganization actions in fiscal year 2012 partially offset by the increase in stock price in fiscal year 2013.
Product Development and Engineering Expenses Product development and engineering expenses for fiscal years 2013 and 2012 were $120.0 million and $80.6 million, respectively or an increase of 49%. The increase in fiscal year 2013 is principally driven primarily by the inclusion of Gennum expenses of $40.9 million since March 2012.
The levels of product development and engineering expenses reported in a fiscal period can be significantly impacted, and therefore experience period over period volatility, by the number of new product tape-outs and by the timing of recoveries from non-recurring engineering services which are typically recorded as a reduction to product development and engineering expense.
Intangible Amortization and Impairments Intangible amortization and impairments was $29.9 million and $10.9 million in fiscal years 2013 and 2012, respectively. The increase reflects the impact of $19.7 million intangible amortization related to the acquisition of Gennum and an impairment charge of $0.7 million attributed to assets acquired from SMI Inc. As of January 27, 2013, we had a total of $228.6 million of gross carrying amount of finite-lived intangible assets, which included $129.9 million related to the acquisition of Gennum.
The purchase price allocation for the Gennum acquisition included $29.1 million of acquired in-process research and development (“IPR&D”) projects. Each project was analyzed to determine the unique technological innovations, the existence and reliance on core technology, the existence of any alternative future use or current technological feasibility, and the complexity, cost and time to complete the remaining development.
The fair value of the IPR&D projects was determined using an income approach or replacement cost approach as applicable. The replacement cost approach was used for IPR&D projects that were considered long-term core

35
investments and were not anticipated to be profitable for a period of time. IPR&D projects which were valued using an income approach, measured the returns attributable to each specific IPR&D project, discounted to present value using a risk-adjusted rate of return, including as appropriate, any tax benefits derived from amortizing the intangible asset for tax purposes. Significant factors considered in the calculation of the rate of return are the weighted average cost of capital and return on assets, as well as the risks inherent in the development process, including the likelihood of achieving technological success and market acceptance. For IPR&D projects valued using a replacement cost approach, value was estimated by developing the cost to either replace or reproduce (replicate) the IPR&D to its current state.
The top three IPR&D projects that comprise $21.0 million of the total $29.1 million IPR&D balance are for enterprise computing, communications and high-end consumer products. The following table summarizes the significant assumptions underlying the valuation for such three IPR&D projects at the acquisition date:
Development Projects
Estimated Percent
Complete
Estimated Time to
Complete (in years)
Estimated Cost to
Complete (in millions)
Risk Adjusted Discount
Rate Valuation Approach
IPR&D (in millions)
Video Platform 10%-14% 1.7 to 1.9 $3.4 - $10.4 12% Income $4.0 Backplane 36%-40% 0.2 to 0.4 $18.4 - $20.2 NA Replacement Cost $12.0 Consumer 44%-48% 0.2 $5.2 - $6.0 NA Replacement Cost $5.0 Costs, timing, and successful completion are subject to additional risk factors such as (i) increase in the projected technological risk of completion, (ii) decrease in the projected market size for the developed product, and (iii) subsequent decisions to postpone or delay the development of the IPR&D project. Actual results to date have been consistent, in all material respects, with our assumptions at the time of the acquisition.
Acquired in-process research and development was tested for impairment as of November 30, 2012, the date of our annual impairment review. With the exception of the impairment charge of $0.7 million recorded to write-off acquired IPR&D from SMI, we concluded that the fair value of the acquired in-process research and developments exceeded the carrying value and no impairment existed as of January 27, 2013 (see Note 8 to our audited consolidated financial statements).
Interest Expense. Interest expense was $14.4 million in fiscal year 2013. There was no interest expense in fiscal year 2012. The increase was due to interest expense and the amortization of the original issue discount and debt issuance costs related to the credit facilities to finance the acquisition of Gennum (see Notes 3 and 10 to our audited consolidated financial statements).
We are currently assessing our financing alternatives and may decide to replace our existing debt with lower interest debt in fiscal year 2014.
Interest Income and Other Expense, Net. Interest income and other expense, net was $(977,000) in fiscal year 2013, compared to $593,000 in fiscal year 2012. In fiscal year 2013, the interest income and other expense is primarily made of $(700,000) Swiss Stamp duty tax liabilities. In addition, interest income in fiscal year 2013 is lower as a result of a significant liquidation of investment to pay for acquisitions.
Provision for Taxes. The benefit for income taxes was $41.7 million for fiscal year 2013 compared to a provision of $5.1 million for fiscal year 2012. The effective tax rate for fiscal year 2013 reflects the impact of the one-time $23.4 million benefit related to our change in assertion regarding $70 million of foreign subsidiary earnings. Because income before taxes was near break-even for fiscal year 2013, comparison of year-over-year effective tax rates is meaningless. In fiscal year 2010, we concluded that $120 million of foreign subsidiary earnings were no longer considered to be permanently reinvested offshore. In the first quarter of fiscal year 2013, in connection with the acquisition of Gennum, we reviewed our assertion regarding the amount of foreign subsidiary earnings that were considered to be permanently reinvested offshore and concluded that due to post-acquisition foreign operating cash needs, all of our

36
foreign subsidiary earnings are considered to be permanently reinvested offshore. This change in assertion resulted in the recognition of a one-time tax benefit of $23.4 million in the first quarter of fiscal year 2013. In fiscal year 2013, our tax provision was adversely affected by a net increase to our valuation allowance of $2.7 million. This net increase was primarily the result of concerns related to our ability to utilize our California net operating losses due to a projected lower California apportionment in future years.
Fiscal Year 2012 Compared With Fiscal Year 2011 Presented below is our estimate of net sales by end-market.
Fiscal Years (in thousands, except percentages) 2012 2011 Change Enterprise Computing $ 41,716 9 % $ 42,728 9 % (2 )% Communications 186,479 39 % 166,419 37 % 12 % High-End Consumer 168,520 35 % 151,945 33 % 11 % Industrial and Other 83,886 17 % 93,410 21 % (10 )% Total $ 480,601 100 % $ 454,502 100 % 6 %
Net Sales. Net sales for fiscal year 2012 were $480.6 million, an increase of 6% from $454.5 million for fiscal year 2011. Fiscal year 2012 revenues increased driven by strengthening demand in the communications and consumer end markets. Fiscal year 2012 was also impacted by softening global economic conditions that resulted in a reduction in orders of our component products during the fiscal year.
Higher revenue in the communications end market was attributed to the impact of strengthening demand for our 40G and 100G communications infrastructure products in our Advanced Communications product line. Higher revenues in the high-end consumer end market were driven by strengthening demand for Protection products in consumer applications including LCD TVs, smartphones and tablet computers. Enterprise computing revenues were roughly flat. Within the industrial category, lower revenue was attributed to softer demand from the military segment in our Power Management and High-Reliability and Advanced Communications product lines.
Gross Profit. Gross profit was $285.6 million and $268.3 million for fiscal years 2012 and 2011, respectively. Our gross margin was 59.4% for fiscal year 2012, up from 59.0% in fiscal year 2011. Gross profit margins for fiscal year 2012 were positively impacted by higher revenues, increased manufacturing volumes and the impact of reduced equity compensation expenses attributed to staffing reductions associated with a reduction in workforce. These factors offset the impact of a higher mix of consumer and enterprise computing revenues relative to communications and industrial revenues.
Operating Costs and Expenses. Fiscal Years (in thousands, except percentages) 2012 2011 Cost/Exp. % net sales Cost/Exp. % net sales Change Selling, general and administrative $ 100,629 21 % $ 110,404 24 % (9 )% Product development and engineering 80,577 17 % 69,624 15 % 16 % Intangible amortization and impairments 10,853 2 % 9,520 2 % 14 %
Total operating costs and expenses $ 192,059 40 % $ 189,548 41 % 1 %
Selling, General & Administrative Expenses Selling, general and administrative expenses for fiscal year 2012 decreased by $9.8 million or 9% driven by the reduction in class action lawsuit expenses as the Company settled the litigation in August 2011, and lower equity compensation expenses partially offset by the impact of transaction expenses, reorganization charges and the impact

37
of higher staffing and information technology infrastructure upgrade spending. Approximately $2.9 million of transaction expenses attributed to the acquisition of Gennum and the evaluation of other acquisition candidates were recorded in fiscal year 2012.
Selling, general and administrative expenses for fiscal years 2012 and 2011 include approximately $0.2 million and $13.6 million (net of insurance recoveries of $10 million), respectively, for legal and other professional services incurred in connection with matters related to our historical stock option practices, including the government inquiries, the related litigation, and other associated matters. Fiscal year 2012 includes $2.0 million for expenses attributed to a reorganization plan initiated during the third quarter of fiscal year 2012 which resulted in consolidation of research and development activities and reduction in workforce.
SG&A stock-based compensation expense was $15.8 million and $19.3 million in fiscal years 2012 and 2011, respectively. The year over year decrease in equity compensation was principally driven by staffing reductions associated with our reorganization actions.
Product Development and Engineering Expenses Product development and engineering expenses for fiscal years 2012 and 2011 were $80.6 million and $69.6 million, respectively or an increase of 16%. The increase in fiscal year 2012 is principally driven by the impact of increased new product and process development expenditures primarily in the Advanced Communications and Protection product lines. In addition, fiscal year 2012 includes a $0.9 million expense associated with the impairment of a new process development initiative.
Intangible Amortization and Impairments Intangible amortization and impairments, which reflects amortization costs associated with acquired intangibles, increased by $1.3 million in fiscal year 2012 compared to fiscal year 2011, as a result of the impact of impairment charges attributed to assets acquired from Leadis Technology Inc. During the third quarter of fiscal year 2012, we abandoned certain development efforts related to acquired intangible assets and recorded an impairment charge of $2.5 million.
Interest Expense. There was no interest expense in fiscal year 2012 and 2011.
Interest Income and Other Expense, Net. Interest income and other expense, net was $593,000 for fiscal year 2012, up from $574,000 in fiscal year 2011. For fiscal years 2012 and 2011, the primary source of income was interest from investments offset by loss from foreign currency transactions.
Provision for Taxes. The provision for income taxes was $5.1 million for fiscal year 2012 compared to $6.8 million for fiscal year 2011. The effective tax rates for fiscal year 2012 and fiscal year 2011 were 5.4% and 8.5%, respectively. The rate for fiscal year 2012 reflects the impact of favorable trends in our regional mix of income. We expect our regional income trends to remain favorable. However, certain items which occurred in fiscal year 2012 are not expected to recur in fiscal year 2013. One such item includes a one-time benefit of $3.9 million related to a release of previously recorded reserves for uncertain tax positions, as a result of statutes of limitations for the taxing authority to challenge the positions expiring.
In fiscal year 2012, our tax provision was adversely affected by a net increase to our valuation allowance of $2.1 million. This net increase was primarily the result of concerns related to our ability to utilize our California net operating losses due to a projected lower California apportionment in future years. Liquidity and Capital Resources Our capital requirements depend on a variety of factors, including but not limited to, the rate of increase or decrease in our existing business base; the success, timing and amount of investment required to bring new products to market; revenue growth or decline; and potential acquisitions. We believe that we have the financial resources necessary to meet business requirements for the next 12 months, including funds needed for working capital requirements.

38
As of January 27, 2013, our total shareholders’ equity was $694.8 million. At that date we also had approximately $228.2 million in cash and cash equivalents, $7.9 million in long-term investments, and total debt of $330.7 million.
Our primary sources and uses of cash during the comparative fiscal years are presented below: Fiscal Year Ended
(in millions) January 27,
2013 January 29,
2012 January 30,
2011 Sources of Cash
Operating activities $ 102.0 $ 99.8 $ 93.8 Proceeds from exercise of stock options including tax benefits 12.9 45.0 30.7 Proceeds from sale of investments 112.5 131.7 111.0 Issuance of debt, net of original issue discount and debt issuance cost 338.0 — —
$ 565.4 $ 276.5 $ 235.5 Uses of Cash
Capital expenditures, net of sale proceeds $ (23.3 ) $ (21.5 ) $ (25.5 ) Acquisitions, net of cash acquired (491.7 ) — — Purchase of intangible assets (1.3 ) (3.0 ) — Purchases of investments (24.7 ) (93.3 ) (168.8 ) Purchase of cost method investments (2.5 ) — — Payment of long-term debt (16.9 ) — — Payment for interest rate cap (1.1 ) — — Repurchase of common stock (7.8 ) (50.7 ) (2.8 )
$ (569.3 ) $ (168.5 ) $ (197.1 ) Effect of exchange rate increase on cash and cash equivalents $ 0.1 $ — $ — Net (decrease) increase in cash and cash equivalents $ (3.8 ) $ 108.0 $ 38.4
We incur significant expenditures in order to fund the development, design, and manufacture of new products. We intend to continue to focus on those areas that have shown potential for viable and profitable market opportunities, which may require additional investment in equipment and the hiring of additional design and application engineers aimed at developing new products. Certain of these expenditures, particularly the addition of design engineers, do not generate significant payback in the short-term. We plan to finance these expenditures with cash generated by our operations and our existing cash balances.
A meaningful portion of our capital resources, and the liquidity they represent, are held by our foreign subsidiaries. As of January 27, 2013, our foreign subsidiaries held approximately $180.2 million of cash, cash equivalents, and short-term investments compared to $271.4 million at January 29, 2012. The decline was attributable to using approximately $213.0 million to partially fund the acquisitions of Gennum and Cycleo and to cover transaction and other related expenses.
One of our primary goals is to improve the cash flows from our existing business activities. Our cash, cash equivalents and investments give us the flexibility to use our free cash flow to return value to shareholders (in the form of stock repurchases) and also pursue business improvement opportunities.
Additionally, we will continue to seek to maintain and improve our existing business performance with capital expenditures and, potentially, acquisitions that meet our rate of return requirements. Acquisitions might be made for either cash or stock consideration, or a combination of both.
Operating Activities Net cash provided by operating activities is primarily due to net income adjusted for non-cash items plus fluctuations in operating assets and liabilities.

39
Operating cash flows for fiscal year 2013 was impacted by several significant non-cash transaction related items including $39.4 million of purchase accounting adjustments related to inventory acquired from Gennum, $19.7 million of amortization expense for acquired intangible assets from Gennum. Also, accretion of deferred financing costs and debt discount was $2.5 million.
Investing Activities Cash used for investing activities is primarily attributable to the acquisitions of Gennum and Cycleo, capital expenditures, purchases of investments, offset by proceeds from the sales/maturities of investments. Our marketable securities investment portfolio is invested primarily in highly rated securities, generally with a minimum rating of A/A2 or equivalent.
Capital expenditures were $23.3 million for fiscal year 2013 compared to $21.6 million for fiscal year 2012. Acquisitions of Gennum and Cycleo were $491.7 million, net of cash acquired. Funding of the purchase price was sourced from cash and cash equivalents, credit facilities and required the liquidation of a significant amount of our temporary and long-term investments.
Financing Activities Cash provided by financing activities is primarily attributable to the following: net proceeds from credit facilities, proceeds from the exercise of stock options offset by the repurchase of common stock under the Company’s stock repurchase program and the payment of statutory tax withholding obligations resulting from the vesting of restricted stock settled by withholding shares.
In addition to using our cash, we incurred debt of $347 million (net of original issue discount of $3 million) in term loans during the quarter to complete the Gennum acquisition. On March 20, 2012, we entered into the senior secured first lien credit facilities in the aggregate principal amount of $350 million (the “Facilities”), consisting of Term A loans in an aggregate principal amount of $100 million (the “Term A Loans”) and Term B loans in an aggregate principal amount of $250 million (the “Term B Loans”). Both the Term A Loans and the Term B Loans mature on March 20, 2017. Repayments of long term debt during the fiscal year 2013 totaled $16.9 million. In accordance with the stipulations in the credit agreement, we entered into an interest rate cap agreement protecting at least 50% of the variable interest rate exposure on the term loans and made an upfront payment of $1.1 million in June 2012. Under the terms of the Facilities, we may request, at any time, subject to certain conditions, the establishment of one or more additional term loan facilities in an aggregate principal amount not to exceed $150 million, the proceeds of which may be used for working capital and general corporate purposes. The Facilities are subject to customary affirmative and negative covenants. We were in compliance with such covenants as of January 27, 2013 and we expect to remain in compliance with these covenants. Pursuant to the Credit Agreement, under certain circumstances, the Company is obligated to apply 50% of its excess cash flow (as defined in the Credit Agreement) for each fiscal year, as well as net cash proceeds from specified other sources, such as asset sales, debt issuances or insurance proceeds, to prepay the Term A Loans and Term B Loans. The first excess cash flow payment is estimated to be $26.6 million. The earliest date that any such payment may be due is 95 days after the last day of the fiscal year ending closest to January 31, 2013. The Company has classified the potential early payment of $26.6 million from “Long term debt” to “Current portion - long term debt” in the consolidated balance sheets as of January 27, 2013. The Company may decide to replace and refinance its Facilities associated with the Gennum acquisition. The Company does not believe the terms associated with the new facilities will have a significant impact on the Company’s liquidity or operations.
For fiscal year 2013, cash proceeds from the exercise of stock options were $12.9 million compared to $42.7 million in fiscal year 2012.
We do not directly control the timing of the exercise of stock options. Such exercises are independent decisions made by grantees and are influenced most directly by the stock price and the expiration dates of stock awards. Such

40
proceeds are difficult to forecast, resulting from several factors which are outside our control. We believe that such proceeds will remain an important secondary source of cash after cash flow from operating activities.
We currently have in effect a stock repurchase program. This program represents one of our principal efforts to return value to our shareholders. In fiscal year 2013 and fiscal year 2012, we repurchased 0.3 million and 2.3 million shares, respectively, under this program for $7.5 million and $50 million, respectively. On August 24, 2011, we announced a $36 million expansion of our existing stock repurchase program. Refer to Exhibit 99.1 of our current report on Form 8-K filed with the SEC on August 24, 2011 for the complete announcement. On November 30, 2011, we announced an additional $50 million expansion of our existing stock repurchase program. Refer to Exhibit 99.1 of our current report on Form 8-K filed with the SEC on November 30, 2011 for the complete announcement.
In addition to the stock repurchase program, shares valued at $0.3 million and $0.7 million were withheld in connection with the vesting of restricted stock to cover statutory tax withholding obligations in the fiscal years 2013 and 2012, respectively.
Off-Balance Sheet Arrangements We do not have any off-balance sheet arrangements, as those arrangements are defined by the SEC, that are reasonably likely to have a material effect on our financial condition, revenues or expenses, results of operations, liquidity, capital expenditures or capital resources.
We do not have any unconsolidated subsidiaries or affiliated entities. We have no special purpose or limited purpose entities that provide off-balance sheet financing, liquidity or market or credit risk support. We do not engage in leasing, hedging, research and development services, or other relationships that expose us to liability that is not reflected on the face of the financial statements.
Noted below under “Contractual Obligations” are various commitments we have associated with our business, such as lease commitments and open purchase obligations, which are not recorded as liabilities on our balance sheet because we have not yet received the related goods or services as of January 27, 2013.
Contractual Obligations Presented below is a summary of our contractual obligations as of January 27, 2013.
(in thousands) Less than 1 year 1-3 years 4-5 years After 5 years Total Long-term debt $ 49,100 $ 45,000 $ 239,025 $ — $ 333,125 Operating leases 8,743
10,269 6,461
11,383 36,856
Open capital purchase commitments 1,451 —
— —
1,451 Other open purchase commitments 57,314
7,327 —
— 64,641
Other vendor commitments 1,200 300
— —
1,500 Deferred compensation 760
2,369 494
12,118 15,741
Stock-based compensation 3,241 5,738
— —
8,979 Total contractual cash obligations $ 121,809
$ 71,003
$ 245,980
$ 23,501
$ 462,293
Capital purchase commitments, other open purchase commitments and other vendor commitments are for the purchase of plant, equipment, raw material, supplies and services. They are not recorded as liabilities on our balance sheet as of January 27, 2013, as we have not yet received the related goods or taken title to the property.
We maintain a deferred compensation plan for certain officers and key executives that allow participants to defer a portion of their compensation for future distribution at various times permitted by the plan. Our liability for deferred compensation under this plan was $13.9 million and $11.1 million as of January 27, 2013 and January 29, 2012, respectively, and is included in accrued liabilities and other long-term liabilities on the balance sheet and in the table above. The plan provides for a discretionary Company match up to a defined portion of the employee’s deferral, with any match subject to a vesting period.

41
In addition, during the fiscal year ended January 27, 2013, the Company recognized $1.8 million deferred compensation liability related to the payment of Cycleo earn-out liability which is contingent upon employment at the end of the four-year period beginning on April 30, 2012.
We have purchased whole life insurance on the lives of some of our current and former deferred compensation plan participants. This Company-owned life insurance is held in a grantor trust and is intended to cover a majority of our costs of the deferred compensation plan. The cash surrender value of our Company-owned life insurance was $10.0 million as of January 27, 2013 and $10.2 million as of January 29, 2012, and is included in other assets.
We have $11.1 million of accrued taxes for uncertain tax positions. We believe that it is reasonably possible that the amount of unrecognized tax benefits will decrease by approximately $0.2 million within twelve months as a result of expiring statutes.
Inflation Inflationary factors have not had a significant effect on our performance over the past several years. A significant increase in inflation would affect our future performance. Critical Accounting Policies and Estimates Our consolidated financial statements are prepared in accordance with generally accepted accounting principles (“GAAP”). In connection with the preparation of our financial statements, we are required to make assumptions and estimates about future events, and apply judgments that affect the reported amounts of assets, liabilities, revenue, expenses and the related disclosures. We base our assumptions, estimates and judgments on historical experience, current trends and other factors that management believes to be relevant at the time our consolidated financial statements are prepared. On a regular basis, management reviews the accounting policies, assumptions, estimates and judgments to ensure that our financial statements are presented fairly and in accordance with GAAP. However, because future events and their effects cannot be determined with certainty, actual results could differ from our assumptions and estimates, and such differences could be material.
Our significant accounting policies are discussed in Note 2 to our audited consolidated financial statements, included in Item 8, of this report on Form 10-K. We believe that the following accounting estimates are the most critical to aid in fully understanding and evaluating our reported financial results, and they require our most difficult, subjective or complex judgments, resulting from the need to make estimates about the effect of matters that are inherently uncertain. We have reviewed these critical accounting estimates and related disclosures with the Audit Committee of our Board of Directors.
Allowance for Doubtful Accounts We evaluate the collectability of our accounts receivable based on a combination of factors. If we are aware of a customer’s inability to meet its financial obligations to us, we record an allowance to reduce the net receivable to the amount we reasonably believe we will be able to collect from the customer. For all other customers, we recognize allowances for doubtful accounts based on the length of time the receivables are past due, the current business environment, the size and number of certain large accounts and our historical experience. If the financial condition of our customers were to deteriorate or if economic conditions worsen, additional allowances may be required in the future.
Revenue and Cost of Sales
We recognize product revenue when persuasive evidence of an arrangement exists, delivery has occurred, the fee is fixed or determinable and collectability is probable. Product design and engineering recoveries is recognized during the period in which services are performed. We include revenue related to granted technology licenses as part of “Net sales.” Historically, revenue from these arrangements has not been significant though it is part of our recurring ordinary business. In the third quarter of fiscal year 2013, we entered into a single licensing arrangement that resulted in the recognition of $7.5 million of revenue.

42
We record a provision for estimated sales returns in the same period as the related revenues are recorded. We base these estimates on historical sales returns and other known factors. Actual returns could be different from our estimates and current provisions for sales returns and allowances, resulting in future charges to earnings. We defer revenue recognition on shipment of products to certain customers, principally distributors, under agreements which provide for limited pricing credits or product return privileges, until these products are sold through to end-users or the return privileges lapse. For sales subject to certain pricing credits or return privileges, the amount of future pricing credits or inventory returns cannot be reasonably estimated given the relatively long period in which a particular product may be held by the customer. Therefore, we have concluded that sales to customers under these agreements are not fixed and determinable at the date of the sale and revenue recognition has been deferred. We estimate the deferred gross margin on these sales by applying an average gross profit margin to the actual gross sales. The average gross profit margin is calculated for each category of material using current standard costs. The estimated deferred gross margin on these sales, where there are no outstanding receivables, is recorded on the balance sheet under the heading of “Deferred revenue.” There were no significant impairments of deferred cost of sales in fiscal year 2013 or fiscal year 2012.
The following table summarizes the deferred net revenue balance:
(in thousands) January 27,
2013 January 29,
2012 Deferred revenues $ 4,467
$ 4,964 Deferred cost of revenues 1,099
1,243 Deferred revenue, net 3,368
3,721 Deferred product design and engineering recoveries 377
132 Total deferred revenue $ 3,745
$ 3,853
Inventory Valuation Our inventories are stated at lower of cost or market and consist of materials, labor and overhead. We determine the cost of inventory by the first-in, first-out method. At each balance sheet date, we evaluate our ending inventories for excess quantities and obsolescence. This evaluation includes analyses of sales levels by product and projections of future demand. In order to state our inventory at lower of cost or market, we maintain specific reserves against our inventory which serve to write-down our inventories to a new cost basis. If future demand or market conditions are less favorable than our projections, a write-down of inventory may be required, and would be reflected in cost of goods sold in the period the revision is made.
Business Combinations Business combinations are accounted for at fair value. Acquisition costs are expensed as incurred and recorded in general and administrative expenses; in-process research and development is recorded at fair value as an indefinite-lived intangible asset at the acquisition date; restructuring costs associated with a business combination are expensed subsequent to the acquisition date; contingent consideration obligations are recorded at fair value on the date of acquisition, with increases or decreases in the fair value arising from changes in assumptions or discount periods recorded as contingent consideration expenses in the consolidated statement of operations in subsequent periods; and changes in deferred tax asset valuation allowances and income tax uncertainties after the acquisition date generally affect income tax expense. All changes that do not qualify as measurement period adjustments are included in current period earnings. The fair values assigned to tangible and intangible assets acquired and liabilities assumed, including contingent consideration, are based on management’s estimates and assumptions, as well as other information compiled by management, including valuations that utilize customary valuation procedures and techniques. Significant judgment is required in estimating the fair value of intangible assets acquired in a business combination and in assigning their respective useful lives. The fair value estimates are based on available historical information and on future expectations and assumptions deemed reasonable by management at the time. If the actual results differ from the estimates and judgments we utilized, the amounts recorded in the financial

43
statements could result in a possible impairment of the intangible assets and goodwill, or require acceleration of the amortization expense of finite-lived intangible assets. Interest Rate Derivative We manage interest expense using variable rate debt. To manage its interest rate risk, we occasionally hedge the future cash flows of its variable rate debt, principally through interest rate contracts with major financial institutions. Interest rate cap contracts involve the receipts of variable amounts from a counterparty when one-month LIBOR exceeds the capped interest rate in exchange for an upfront payment from us, capping our one-month LIBOR floating interest payments at the strike rate on its interest rate cap contract. Interest rate contracts that meet specific criteria are accounted for as cash flow hedges. The effective portion of changes in the fair value of derivatives designated and that qualify as cash flow hedges is recorded in accumulated other comprehensive income, net of taxes, and is subsequently reclassified into earnings in the period that the hedged forecasted transaction affects earnings. The ineffective portion of the change in fair value of the derivatives is recognized directly in earnings. Amounts reported in accumulated other comprehensive income related to derivatives will be reclassified to interest expense as interest payments are made on our variable-rate debt. The assessment of effectiveness is based on the total changes in an option’s cash flows such that the assessment will include the interest rate caps entire change in fair value. The interest rate cap is considered a highly effective hedge since the key features and terms match with the hedged item at inception. Key features and terms are notional amount, cap effective date, rate threshold, index, repricing dates, payments dates, and maturity dates.
Contingencies and Litigation
We record accruals for contingencies when it is probable that a liability has been incurred and the amount can be reasonably estimated. These accruals are adjusted periodically as assessments change or additional information becomes available. Individually significant contingent losses are accrued when probable and reasonably estimable.
The legal defense costs we accrue is based on reviews by outside counsel, in-house counsel and management and some of the significant factors considered in the review of these reserves are as follows: the actual costs incurred by the Company; the development of the Company's legal defense strategy and structure in light of the scope of its litigation; the number of cases being brought against the Company; the costs and outcomes of completed trials and the most current information regarding anticipated timing, progression, and related costs of pre-trial activities and trials in the associated litigation.
In those situations where the Company is unable to determine the best estimate within the range of loss, it will record the minimum amount in the identified range of probable loss.
Stock-Based Compensation We measure compensation cost for all share-based payments (including stock options) at fair value using a valuation model, which considers, among other things, estimates and assumptions on the rate of forfeiture, expected life of options and stock price volatility. If any of the assumptions used in the valuation model change significantly, stock-based compensation expense may differ materially in the future from that recorded in the current period and actual results may differ from estimates.
Impairment of Goodwill, Other Intangibles and Long-Lived Assets
We test goodwill and other indefinite-lived intangible assets for impairment in the fourth quarter of each fiscal year or more frequently if we believe indicators of impairment exist. The value of our intangible assets, including goodwill, could be impacted by future adverse changes such as: (i) any future declines in our operating results, (ii) a decline in the valuation of technology company stocks, including the valuation of our common stock, (iii) a significant slowdown in the worldwide economy and the semiconductor industry or (iv) any failure to meet the performance projections included in our forecasts of future operating results. For our annual impairment review, we primarily use a multi-period excess earnings approach methodology of valuation that includes the discounted cash flow method as well as other generally accepted valuation methodologies to determine the fair value of the assets. Our assumptions

44
incorporate judgments as to the price received to sell a reporting unit as a whole in an orderly transaction between market participants at the measurement date. Considering the integration of our operations, we have assumed that the highest and best use of a reporting unit follows an “in-use” valuation premise. Significant management judgment is required in the forecasts of future operating results that are used in the discounted cash flow method of valuation. The estimates we have used are consistent with the plans and estimates that we use to manage our business. It is possible, however, that the plans and estimates used may be incorrect. If our actual results, or the plans and estimates used in future impairment analysis, are lower than the original estimates used to assess the recoverability of these assets, we could incur impairment charges in a future period.
Goodwill is tested for impairment as of November 30, the date of our annual impairment review. We estimated the fair values of our reporting units using the income approach, which requires significant judgments, including estimation of future cash flows, which is dependent on internal forecasts, estimation of the long-term rate of growth for our business, estimation of the useful life over which cash flows will occur, and determination of our weighted average cost of capital. Our analysis included sensitivity analysis of key assumptions such as a 10% increase in the weighted-average cost of capital, a 10% increase in the effective tax rate or a 5% decline in our compound annual growth rate noting the fair value of the goodwill associated with the Advanced Communications, the Wireless and Sensing, and Gennum reporting units exceeded their respective carrying values and no impairment existed as of January 27, 2013.
The Company reviews indefinite-lived intangible assets for impairment annually or whenever events or changes in circumstances indicate the carrying value may not be recoverable. Recoverability of indefinite-lived intangible assets is measured by comparing the carrying amount of the asset to the future discounted cash flows that asset is expected to generate. Acquired in-process research and development projects (“IPR&D”) is tested for impairment as of November 30, the date of the Company’s annual goodwill impairment review.
We record impairment losses on long-lived assets used in operations when indicators of impairment, such as reductions in demand or significant economic slowdowns in the semiconductor industry, are present. Reviews are performed to determine whether the carrying value of an asset is impaired, based on comparisons to undiscounted expected future cash flows. If this comparison indicates that there is impairment, the impaired asset is written down to fair value, which is typically calculated using: (i) quoted market prices and/or (ii) discounted expected future cash flows utilizing a discount rate. Impairment is based on the excess of the carrying amount over the fair value of those assets.
Accounting for Income Taxes As part of the process of preparing our consolidated financial statements, we are required to estimate our income taxes in each of the jurisdictions in which we operate. This process involves estimating our actual current tax liability together with assessing temporary differences resulting from differing treatment of items for tax and accounting purposes. These differences result in deferred tax assets and liabilities, which are included within our consolidated balance sheet.
We must assess the likelihood that our deferred tax assets will be recovered from future taxable income and to the extent we believe that recovery is not likely, we must establish a valuation allowance. Generally, to the extent we change a valuation allowance; the change is recorded through the tax provision in the statement of operations. Management periodically evaluates our deferred tax assets to assess whether it is likely that the deferred tax assets will be realized. In determining whether a valuation allowance is required, we consider projected taxable income. The most significant assumptions used in preparing projections of taxable income include forecasting the levels of income by region and the amount of deductible stock based compensation.
We are subject to income taxes in both the United States and numerous foreign jurisdictions. Significant management estimates are required in determining our worldwide provision for income taxes. In the ordinary course of our business, there are many transactions and calculations where the ultimate tax impact is uncertain. The calculation of tax liabilities involves dealing with uncertainties in the application of complex tax laws. We recognize liabilities for uncertain tax positions based on a two-step process. The first step is to evaluate the tax position for recognition by

45
determining if the weight of available evidence indicates that it is more likely than not that the position will be sustained on audit, including resolution of related appeals or litigation processes, if any. The second step requires us to estimate and measure the tax benefit as the largest amount that is more than 50% likely of being realized upon ultimate settlement. It is inherently difficult and subjective to estimate such amounts, as this requires us to determine the probability of various possible outcomes. We reevaluate these uncertain tax positions on a quarterly basis. This evaluation is based on factors including, but not limited to, changes in facts or circumstances, changes in tax law, effectively settled issues under audit, and new audit activity. Such a change in recognition or measurement would result in the recognition of a tax benefit or an additional charge to the tax provision in the period of change. Although we believe the estimates are reasonable, no assurance can be given that the final outcome of these matters will not be different than what is reflected in the historical income tax provisions and accruals. Should additional taxes be assessed as a result of an audit or litigation, a material effect on our income tax provision and net income in the period or periods for which that determination is made could result.
The income tax effects of share-based payments are recognized for financial reporting purposes only if such awards are expected to result in a tax deduction. We do not recognize a deferred tax asset for an excess tax benefit (that is, a tax benefit that exceeds the amount of compensation cost recognized for the award for financial reporting purposes) that has not been realized. In determining when an excess tax benefit is realized, we have elected to follow the ordering provision of the tax law.
In addition to the risks to the effective tax rate discussed above, the effective tax rate reflected in forward-looking statements is based on current enacted tax law. Significant changes in enacted tax law could materially affect these estimates.
In general, the amount of taxes we pay will differ from our reported tax provision as a result of differences between accounting for income under U.S. GAAP and accounting for taxable income. Typical book-tax differences include expense related to equity compensation, deemed dividends, depreciation, litigation expense and amortization of intangible assets. As a result of these book-tax differences, our tax payments are expected to exceed our tax provision during the next three years.
For intra-entity differences between the tax basis of an asset in the buyer’s tax jurisdiction and their cost as reported in the consolidated financial statements, we do not recognize a deferred tax asset. Income taxes paid on intra-entity profits on assets remaining within the group are accounted for as prepaid taxes.
We continually review our position on undistributed earnings from our foreign subsidiaries to determine whether those earnings are indefinitely reinvested offshore. Domestic and foreign operating cash flow forecasts are reviewed to determine the sources and uses of cash. Based on these forecasts, we determine the need to accrue deferred tax liabilities associated with our undistributed earnings offshore.
New Accounting Standards In February 2013, the FASB issued an accounting standards update regarding the reporting of reclassifications out of accumulated other comprehensive income. This update, which will be effective prospectively for reporting periods beginning after December 15, 2012, requires disclosure of amounts reclassified out of accumulated other comprehensive income by component. In addition, an entity is required to present either on the face of the statement of operations or in the notes, significant amounts reclassified out of accumulated other comprehensive income by the respective line items of net income but only if the amount reclassified is required to be reclassified to net income in its entirety in the same reporting period. For amounts not reclassified in their entirety to net income, an entity is required to cross-reference to other disclosures that provide additional detail about those amounts. The Company will adopt the disclosure requirements of this update for the quarter ending April 28, 2013.
Item 7A. Quantitative and Qualitative Disclosures About Market Risk We are subject to a variety of market risks, including commodity risk and the risks related to foreign currency, interest rates and market performance that are detailed below. Many of the factors that can have an impact on our market risk are external to us, and so we are unable to fully predict them.
46
Market Conditions Current global economic conditions pose a risk to the overall economy as consumers and businesses may defer purchases in response to the uncertainty around tighter credit and negative financial news. These conditions have historically resulted in periods where demand for our products is reduced.
In addition to risks associated with global economic conditions, demand for our products could be different from our expectations due to customer acceptance of our products, changes in customer order patterns, including order cancellations, and changes in the level of inventory held by vendors.
Commodity Risk We are subject to risk from fluctuating market prices of certain commodity raw materials, particularly gold, that are incorporated into our end products or used by our suppliers to process our end products. Increased commodity prices are passed on to us in the form of higher prices from our suppliers, either in the form of general price increases or a commodity surcharge. Although we generally deal with our suppliers on a purchase order basis rather than on a long-term contract basis, we generally attempt to obtain firm pricing for volumes consistent with planned production. Our gross margins may decline if we are not able to increase selling prices of our products or obtain manufacturing efficiencies to offset the increased cost. We do not enter into formal hedging arrangements to mitigate against commodity risk.
Foreign Currency Risk As a global enterprise, we face exposure to adverse movements in foreign currency exchange rates and we could experience foreign currency exchange gains or losses. Historically, we have not considered our foreign currency exposure to be material. Therefore, we have not utilized foreign currency hedging products to mitigate foreign currency risks. Our foreign currency exposures may increase over time as the level of activity in foreign markets grows. Changes in the rates could have an adverse impact upon our financial results.
A relatively small amount of our monetary assets and liabilities are denominated in foreign currencies, principally the Swiss Franc, Canadian dollars, Mexican Peso, British Pound Sterling and the Euro. Fluctuations in these currencies relative to the United States dollar will result in transaction gains or losses included in net earnings.
All of our foreign sales, which amounted to $488.1 million in fiscal year 2013, are denominated in United States dollars. Currency exchange rate fluctuations in foreign countries where we do business could harm our business by resulting in pricing that is not competitive with prices denominated in local currencies.
For fiscal year 2013, we spent approximately $42.3 million in Canadian dollars, $16.8 million in British Pound Sterling, $14.4 million in Swiss Francs, $4.6 million in Euros, $4.6 million in Japanese Yen, and $7.7 million in Mexican Pesos for operating expenses.
In general, we purchase foreign currencies on a spot basis as needed to fund local operations. As of January 27, 2013, we held cash funds of $16.7 million denominated in Canadian dollars, $0.8 million denominated in British Pound Sterling, $1.0 million denominated in Swiss Francs, $4.4 million denominated in Euros and $1.4 million denominated in Japanese Yen, and $0.7 million denominated in Mexican Pesos. We did not hold a significant amount of other foreign currencies. If rates of these foreign currencies were to strengthen or weaken relative to the U.S. dollar, we would realize gains or losses in converting these funds back into U.S. dollars.
Interest Rate and Market Risk As a result of entering into the $350 million long-term debt with variable interest rates, our operating results are exposed to fluctuations in interest rates. Pursuant to the Credit Agreement, we were required to enter into an interest rate hedging agreement protecting at least 50% of all the variable interest rate exposure on the term loans within 90 days of entering into the Credit Agreement. We do not engage in the trading of derivative financial instruments in the normal course of business. On June 18, 2012, we entered into an interest rate cap agreement to fulfill the requirements of our Credit Agreement (see Note 11 to our audited consolidated financial statements for more information). In the

47
event interest rates were to increase 100 basis points and holding all other variables constant, annual net income and cash flows for the following year would decrease by approximately $1.0 million associated with the Company’s variable-rate debt, including the effect of the interest rate contract. The effect of the 100 basis points increase would decrease the fair value of our variable-rate debt by approximately $3.4 million.
Interest rates affect our return on excess cash and investments. As of January 27, 2013, we had $223.2 million of cash and cash equivalents and $12.9 million of temporary and long-term investments. A majority of our cash and cash equivalents and investments generate interest income based on prevailing interest rates. Investments and cash and cash equivalents generated interest income of $0.4 million in fiscal year 2013. A significant change in interest rates would impact the amount of interest income generated from our cash and investments. It would also impact the market value of our investments.
Our investments are subject to market risks, primarily interest rate and credit risk. Our investments are managed by a limited number of outside professional managers following investment guidelines set by us. Such guidelines prescribe credit quality, permissible investments, diversification, and duration restrictions. These restrictions are intended to limit risk by restricting our investments to high quality debt instruments with relatively short-term durations. Our investment strategy limits investment of new funds and maturing securities to U.S. Treasury, Federal agency securities, high quality money market funds and time deposits with our principal commercial banks.

48
Item 8. Financial Statements and Supplementary Data The information required by Item 8 is presented in the following order:
Management’s Report on Internal Control Over Financial Reporting 49 Report of Independent Registered Public Accounting Firm on Internal Control Over Financial Reporting 49 Report of Independent Registered Public Accounting Firm on the Consolidated Financial Statements 49 Consolidated Statements of Income 50 Consolidated Statements of Comprehensive Income 51 Consolidated Balance Sheets 52 Consolidated Statements of Stockholders’ Equity 53 Consolidated Statements of Cash Flows 54 Notes to Consolidated Financial Statements 55 Schedule II — Valuation and Qualifying Accounts 98

49
MANAGEMENT’S REPORT ON INTERNAL CONTROL OVER FINANCIAL REPORTING
The report called for by Item 308(a) of Regulation S-K is incorporated herein by reference to the Report of Management on Internal Control Over Financial Reporting that is included in Part II, Item 9A of this report.
REPORT OF INDEPENDENT REGISTERED PUBLIC ACCOUNTING FIRM ON INTERNAL CONTROL OVER FINANCIAL REPORTING
The report called for by Item 308(b) of Regulation S-K is incorporated herein by reference to the Report of Independent Registered Public Accounting Firm on Internal Control Over Financial Reporting that is included in Part II, Item 9A of this report.
REPORT OF INDEPENDENT REGISTERED PUBLIC ACCOUNTING FIRM
The Board of Directors and Stockholders of Semtech Corporation We have audited the accompanying consolidated balance sheets of Semtech Corporation and subsidiaries as of January 27, 2013 and January 29, 2012, and the related consolidated statements of income, comprehensive income, stockholders' equity and cash flows for each of the three years in the period ended January 27, 2013. Our audits also included the financial statement schedule listed in the Index at Item 15(a). These financial statements and schedule are the responsibility of the Company's management. Our responsibility is to express an opinion on these financial statements and schedule based on our audits. We conducted our audits in accordance with the standards of the Public Company Accounting Oversight Board (United States). Those standards require that we plan and perform the audit to obtain reasonable assurance about whether the financial statements are free of material misstatement. An audit includes examining, on a test basis, evidence supporting the amounts and disclosures in the financial statements. An audit also includes assessing the accounting principles used and significant estimates made by management, as well as evaluating the overall financial statement presentation. We believe that our audits provide a reasonable basis for our opinion. In our opinion, the financial statements referred to above present fairly, in all material respects, the consolidated financial position of Semtech Corporation and subsidiaries at January 27, 2013 and January 29, 2012, and the consolidated results of their operations and their cash flows for each of the three years in the period ended January 27, 2013, in conformity with U.S. generally accepted accounting principles. Also, in our opinion, the related financial statement schedule, when considered in relation to the basic financial statements taken as a whole, presents fairly in all material respects the information set forth therein. We also have audited, in accordance with the standards of the Public Company Accounting Oversight Board (United States), Semtech Corporation and subsidiaries' internal control over financial reporting as of January 27, 2013, based on criteria established in Internal Control-Integrated Framework issued by the Committee of Sponsoring Organizations of the Treadway Commission and our report dated March 28, 2013 expressed an unqualified opinion thereon.
/s/ Ernst & Young LLP
Los Angeles, California
March 28, 2013

50
SEMTECH CORPORATION AND SUBSIDIARIES CONSOLIDATED STATEMENTS OF INCOME (in thousands, except earnings per share) Fiscal Year Ended
January 27,
2013 January 29,
2012 January 30,
2011 Net sales $ 578,827 $ 480,601 $ 454,502 Cost of sales 264,215 194,956 186,196 Gross profit 314,612 285,645 268,306 Operating costs and expenses: Selling, general and administrative 149,070 100,629 110,404 Product development and engineering 120,009 80,577 69,624 Intangible amortization and impairments 29,944 10,853 9,520 Total operating costs and expenses 299,023 192,059 189,548 Operating income 15,589 93,586 78,758 Interest expense (14,363 ) — — Interest income and other (expense) income, net (977 ) 593 574 Income before taxes 249 94,179 79,332 (Benefit) provision for taxes (41,690 ) 5,092 6,760 Net income $ 41,939 $ 89,087 $ 72,572 Earnings per share:
Basic $ 0.64 $ 1.37 $ 1.16 Diluted $ 0.62 $ 1.32 $ 1.12
Weighted average number of shares used in computing earnings per share:
Basic 65,809 65,099 62,339 Diluted 67,472 67,350 64,523
See accompanying notes. The accompanying notes are an integral part of these statements.

51
SEMTECH CORPORATION AND SUBSIDIARIES CONSOLIDATED STATEMENTS OF COMPREHENSIVE INCOME (in thousands) Fiscal Year Ended
January 27,
2013 January 29,
2012 January 30,
2011 Net income $ 41,939 $ 89,087 $ 72,572 Other comprehensive (loss) income, before tax:
Change in net unrealized holding loss on available-for-sale investments (42 )
(262 )
(117 )
Change in unrealized loss on interest rate cap (556 ) — — Change in cumulative translation adjustment 203 (4 ) 1
Other comprehensive loss, before tax (395 ) (266 ) (116 ) Benefit for taxes related to items of other comprehensive (loss) income 213 58 41 Other comprehensive loss, net of tax (182 ) (208 ) (75 ) Total comprehensive income, net of tax $ 41,757 $ 88,879 $ 72,497
See accompanying notes. The accompanying notes are an integral part of these statements.

52
SEMTECH CORPORATION AND SUBSIDIARIES CONSOLIDATED BALANCE SHEETS AS OF JANUARY 27, 2013 AND JANUARY 29, 2012
(in thousands, except share data) January 27,
2013 January 29,
2012 Assets Current assets:
Cash and cash equivalents $ 223,192 $ 227,022 Temporary investments 4,973 83,121 Accounts receivable, less allowances of $4,917 at January 27, 2013 and $3,594 at January 29, 2012 69,160 49,644 Inventories 74,878 46,995 Deferred tax assets 7,473 5,339 Prepaid taxes 7,794 9,580 Other current assets 18,523 5,611
Total current assets 405,993 427,312 Non-current assets:
Property, plant and equipment, net of accumulated depreciation of $101,766 at January 27, 2013 and $85,393 at January 29, 2012 101,837 69,713 Long-term investments 7,907 17,522 Deferred income taxes 33,563 — Goodwill 393,584 129,651 Other intangible assets, net 206,058 66,720 Other assets 22,071 15,403
TOTAL ASSETS $ 1,171,013 $ 726,321
Liabilities and Stockholders’ Equity Current liabilities:
Accounts payable $ 51,991 $ 26,699 Accrued liabilities 49,276 32,389 Deferred revenue 3,745 3,853 Current portion - long term debt 48,449 — Deferred tax liabilities 4,221 4,041
Total current liabilities 157,682 66,982 Non-current liabilities:
Deferred tax liabilities 2,042 1,000 Long term debt, less current 282,286 — Other long-term liabilities 34,177 28,151
Stockholders’ equity: Common stock, $0.01 par value, 250,000,000 shares authorized, 78,136,144 issued and 66,607,347 outstanding on January 27, 2013 and 78,136,144 issued and 64,964,780 outstanding on January 29, 2012 785 785 Treasury stock, at cost, 11,528,797 shares as of January 27, 2013 and 13,171,364 shares as of January 29, 2012 (200,604 ) (225,822 ) Additional paid-in capital 355,990 358,327 Retained earnings 538,302 496,363 Accumulated other comprehensive income 353 535
Total stockholders’ equity 694,826 630,188 TOTAL LIABILITIES AND STOCKHOLDERS’ EQUITY $ 1,171,013 $ 726,321 See accompanying notes. The accompanying notes are an integral part of these statements.

53
SEMTECH CORPORATION AND SUBSIDIARIES CONSOLIDATED STATEMENTS OF STOCKHOLDERS’ EQUITY (in thousands, except share amounts)
See accompanying notes. The accompanying notes are an integral part of these statements.
AccumulatedNumber of
Shares Outstanding Amount
Additional Paid-in Capital
Retained Earnings
Treasury Stock, at Cost
Other Comprehensive Income (Loss)
Stockholders’ Equity
Balance at January 31, 2010 61,261,015 784$ 348,741$ 334,704$ (279,306)$ 818$ 405,741$ Net income - - - 72,572 - - 72,572 Other comprehensive (loss) - - - - - (75) (75) Stock-based compensation - - 24,204 - - - 24,204 Repurchase of outstanding common stock (164,636) - - - (2,819) - (2,819) Treasury stock reissued 2,825,111 - (19,169) - 49,858 - 30,689 Shares issued under equity award plans 6,250 1 - - - - 1 Tax shortfall from stock based compensation - - (1,698) - - - (1,698) Balance at January 30, 2011 63,927,740 785$ 352,078$ 407,276$ (232,267)$ 743$ 528,615$ Net income - - - 89,087 - - 89,087 Other comprehensive (loss) - - - - - (208) (208) Stock-based compensation - - 19,068 - - - 19,068 Repurchase of outstanding common stock (2,279,526) - - - (50,665) - (50,665) Treasury stock reissued 3,316,566 - (15,264) - 57,110 - 41,846 Shares issued under equity award plans - - - - - - - Excess tax benefits from stock based compensation - - 2,445 - - - 2,445 Balance at January 29, 2012 64,964,780 785$ 358,327$ 496,363$ (225,822)$ 535$ 630,188$ Net income - - - 41,939 - - 41,939 Other comprehensive (loss) - - - - - (182) (182) Stock-based compensation - - 21,382 - - - 21,382 Repurchase of outstanding common stock (273,139) - - - (7,769) - (7,769) Treasury stock reissued 1,915,706 - (20,184) - 32,987 - 12,803 Shares issued under equity award plans - - - - - - - Tax shortfall from stock based compensation - - (3,535) - - - (3,535) Balance at January 27, 2013 66,607,347 785$ 355,990$ 538,302$ (200,604)$ 353$ 694,826$
Common Stock

54
SEMTECH CORPORATION AND SUBSIDIARIES CONSOLIDATED STATEMENTS OF CASH FLOWS (in thousands) Fiscal Year Ended January 27, 2013 January 29, 2012 January 30, 2011 Cash flows from operating activities:
Net income $ 41,939 $ 89,087 $ 72,572 Adjustments to reconcile net income to net cash provided by operating activities, net of effects of acquisitions:
Depreciation, amortization and impairments 49,192 21,013 16,448 Effect of acquisition fair value adjustments 37,693 — — Accretion of deferred financing costs and debt discount 2,545 — — Deferred income taxes (47,623 ) (2,023 ) 3,184 Stock-based compensation 24,528 24,020 29,010 Excess tax benefits on stock based compensation — (2,279 ) (891 ) Loss on disposition of property, plant and equipment 85 1,022 69
Changes in assets and liabilities: Accounts receivable, net (5,002 ) 966 (19,447 ) Inventories (4,251 ) 676 (14,016 ) Prepaid expenses and other assets 5,971 (7,068 ) (540 ) Accounts payable 4,453 (3,354 ) 5,986 Accrued liabilities (10,410 ) (26,017 ) 13,434 Deferred revenue (1,112 ) (1,167 ) 1,744 Income taxes payable and prepaid taxes (1,120 ) 4,962 (16,702 ) Other liabilities 5,080 (6 ) 2,950
Net cash provided by operating activities 101,968 99,832 93,801 Cash flows from investing activities:
Purchases of available-for-sale investments (24,744 ) (93,330 ) (168,802 ) Proceeds from sales and maturities of available-for-sale investments 112,466 131,748 110,987 Proceeds from sales of property, plant and equipment — 46 76 Purchase of property, plant and equipment (23,266 ) (21,564 ) (25,537 ) Purchase of intangible assets (1,251 ) (3,000 ) — Purchase of cost method investment (2,500 ) — — Acquisitions, net of cash acquired (491,717 ) — —
Net cash (used in) provided by investing activities (431,012 ) 13,900 (83,276 ) Cash flows from financing activities:
Proceeds from debt issuance, net of discount 347,000 — — Deferred financing cost (8,962 ) — — Payment for interest rate cap (1,100 ) — — Excess tax benefits on stock based compensation — 2,279 891 Proceeds from exercises of stock options 12,855 42,661 29,823 Repurchase of outstanding common stock (7,769 ) (50,665 ) (2,819 ) Payment of long term debt (16,875 ) — —
Net cash provided by (used in) financing activities 325,149 (5,725 ) 27,895 Effect of exchange rate increase (decrease) on cash and cash equivalents 65 (4 ) 1 Net (decrease) increase in cash and cash equivalents (3,830 ) 108,003 38,421 Cash and cash equivalents at beginning of period 227,022 119,019 80,598 Cash and cash equivalents at end of period $ 223,192 $ 227,022 $ 119,019 Supplemental disclosure of cash flow information
Income taxes paid $ 5,029 $ 4,059 $ 20,566 Interest paid $ 10,556 $ — $ —
See accompanying notes. The accompanying notes are an integral part of these statements.

55
SEMTECH CORPORATION AND SUBSIDIARIES NOTES TO CONSOLIDATED FINANCIAL STATEMENTS
Note 1: Organization and Basis of Presentation Semtech Corporation (together with its subsidiaries, the “Company” or “Semtech”) is a global supplier of analog and mixed-signal semiconductor products. The end-customers for the Company’s products are primarily original equipment manufacturers (“OEM’s”) that produce and sell electronics.
The Company designs, develops and markets a wide range of products for commercial applications, the majority of which are sold into the enterprise computing, communications, high-end consumer and industrial end-markets.
Enterprise Computing: datacenters, passive optical networks, optical receiver and transceiver, desktops, notebooks, servers, graphic boards, monitors, printers and other computer peripherals.
Communications: base stations, backplane, optical networks, carrier networks, switches and routers, servers, cable modems, signal conditioners, wireless LAN and other communication infrastructure equipment.
High-End Consumer: handheld products, set-top boxes, digital televisions, tablet computers, digital video recorders, thunderbolt and fiberless high-speed interfaces and other consumer equipment.
Industrial: broadcast studio equipment, automated meter reading, military and aerospace, medical, security systems, automotive, industrial and home automation, video security and surveillance and other industrial equipment.
Fiscal Year The Company reports results on the basis of 52 and 53 week periods and ends its fiscal year on the last Sunday in January. The fiscal years ended January 27, 2013, January 29, 2012 and January 30, 2011 each consisted of 52 weeks.
Principles of Consolidation The accompanying consolidated financial statements include the accounts of Semtech Corporation and its wholly owned subsidiaries. All inter-company transactions and accounts have been eliminated. In March 2012, the Company completed the acquisitions of Gennum Corporation (“Gennum”) and Cycleo SAS (“Cycleo”). The consolidated financial statements include the results of operations of Gennum and Cycleo commencing as of the acquisition dates. See Note 3 for further discussion.
Segment Information The Company operates and accounts for its results in one reportable segment. The Company identified five operating segments which aggregate into one reportable segment. The Company designs, develops, manufactures and markets high performance analog and mixed signal integrated circuits. The Chief Executive Officer has been identified as the Chief Operating Decision Maker as defined by guidance regarding segment disclosures. The Company has evaluated its reportable segments subsequent to its acquisition of Gennum and concluded that it continues to operate and account for its results in one reportable segment. Use of Estimates The preparation of financial statements in conformity with U.S. GAAP requires management to make estimates and assumptions that affect the reported amounts of assets and liabilities and disclosure of contingent assets and liabilities at the date of the financial statements and the reported amounts of revenues and expenses during the reporting period. Actual results could differ from those estimates. Reclassification Certain prior period immaterial amounts have been reclassified to conform with current period presentation.

56
Note 2: Significant Accounting Policies Cash, Cash Equivalents and Investments The Company considers all highly liquid investments with an original maturity of 90 days or less to be cash equivalents. The Company maintains cash balances and investments in highly qualified financial institutions. At various times such amounts are in excess of insured limits. Investments consist of government and corporate obligations and bank time deposits. The Company’s investment policy restricts investments to high credit quality investments with limits on the length to maturity and the amount invested with any one issuer. These investments, especially corporate obligations, are subject to default risk. The Company designates its investments as available for sale (“AFS”). Investments designated as AFS are reported at fair value. The Company records the unrealized gains and losses, net of tax, in stockholders’ equity as a component of comprehensive income. Realized gains or losses are recorded in “Interest income and other expense, net” in the consolidated statements of income.
Accounts Receivable and Allowance for Doubtful Accounts Accounts receivable are recorded at net realizable value or the amount that the Company expects to collect on gross customer trade receivables. The Company evaluates the collectability of its accounts receivable based on a combination of factors. The Company generally does not require collateral on accounts receivable as the majority of the Company’s customers are large, well-established companies. Historically, bad debt provisions have been consistent with management’s expectations. If the Company becomes aware of a customer’s inability to meet its financial obligations after a sale has occurred, it records an allowance to reduce the net receivable to the amount it reasonably believes it will be able to collect from the customer. For all other customers, the Company recognizes allowances for doubtful accounts based on the length of time the receivables are past due, the current business environment and historical experience. If the financial condition of the Company’s customers were to deteriorate or if economic conditions worsen, additional allowances may be required in the future. All of the Company’s accounts receivables are trade-related receivables. See Note 16 for a discussion of concentration risks.
Inventories Inventories are stated at lower of cost or market and consist of materials, labor and overhead. The Company determines the cost of inventory by the first-in, first-out method. The Company evaluates inventories for excess quantities and obsolescence. This evaluation includes analyses of sales levels by product and projections of future demand. In order to state the inventory at lower of cost or market, the Company maintains reserves against its inventory. If future demand or market conditions are less favorable than the Company’s projections, a write-down of inventory may be required, and would be reflected in cost of goods sold in the period the revision is made.
Business Combinations The Company accounts for business combinations at fair value. Goodwill is measured as the excess of consideration transferred over the acquisition date net fair values of the assets acquired and the liabilities assumed. All changes that do not qualify as measurement period adjustments are included in current period earnings. Significant judgment is required to determine the estimated fair value for assets and liabilities acquired and to assigning their respective useful lives. The fair values assigned to tangible and intangible assets acquired and liabilities assumed, including contingent consideration, are based on management’s estimates and assumptions, as well as other information compiled by management, including available historical information and valuations that utilize customary valuation procedures and techniques. The Company employs the income approach to estimate the fair value of intangible assets, which is based on forecasts of the expected future cash flows attributable to the respective assets. The fair value of acquired in-process research and development projects (“IPR&D”) was determined using an income approach or replacement cost approach as applicable. The replacement cost approach was used for IPR&D projects that were considered long-term core investments and were not anticipated to be profitable for a period of time. IPR&D projects which were valued using an income approach, measured the returns attributable to each specific IPR&D project, discounted to present value using a risk-adjusted rate of return, including as appropriate, any tax benefits derived from amortizing the intangible

57
assets for tax purposes. Significant estimates and assumptions inherent in the valuations reflect consideration of other marketplace participants, and include the amount and timing of future cash flows (including expected growth rates and profitability), the underlying product life cycles, economic barriers to entry, a brand’s relative market position and the discount rate applied to the cash flows, among others. If actual results differ from the estimates and judgments used in these estimates, the amounts recorded in the financial statements could result in a possible impairment of the intangible assets and goodwill, or require acceleration of the amortization expense of finite-lived intangible assets.
Property, Plant and Equipment Property, plant and equipment are stated at cost. The Company’s cost basis includes certain assets acquired in business combinations that were initially recorded at fair value as of the date of acquisition. Depreciation is computed over the estimated useful lives of the related asset type or term of the operating lease using the straight-line method for financial statement purposes. Maintenance and repairs are charged to expense as incurred and the costs of additions and betterments that increase the useful lives of the assets are capitalized.
The estimated service lives for property and equipment is as follows:
Estimated Useful Lives Buildings and leasehold improvements 7 to 39 years Machinery and equipment 5 to 8 years Transportation vehicles 5 years Furniture and fixtures 7 years Computers and computer software 3 years
Impairment of Goodwill, Other Intangible and Long-Lived Assets Goodwill Goodwill is the excess of the purchase price over the fair value of identifiable net assets acquired in business combinations accounted for under the purchase method. Goodwill is not amortized but is tested for impairment using a two-step method on an annual basis in the fourth quarter or whenever events or changes in circumstances indicate that the carrying value may not be recoverable. These indicators would include a significant change in operating performance, the business climate, legal factors, competition, or a planned sale or disposition of a significant portion of the business among other factors.
The recoverability of goodwill is measured at the reporting unit level by comparing the reporting unit’s carrying amount, including goodwill, to the fair market value of the reporting unit. A reporting unit is an operating segment or a business unit one level below that operating segment, and it is the level at which management regularly reviews operating results and makes resource allocation decisions. Step one is the identification of potential impairment. This involves comparing the fair value of each reporting unit with its carrying amount, including goodwill. If the fair value of a reporting unit exceeds the carrying amount, the goodwill of the reporting unit is considered not impaired and the second step of the impairment test is unnecessary. If the carrying amount of a reporting unit exceeds its fair value, the second step of the impairment test is performed to measure the amount of impairment loss, if any.
Step two is the measurement of the amount of impairment loss. This involves comparison of the implied fair value of the reporting unit goodwill with the carrying amount of that goodwill. If the carrying amount of the reporting unit goodwill exceeds the implied fair value of that goodwill, an impairment loss would be recognized in an amount equal to that excess. The loss recognized cannot exceed the carrying amount of the goodwill. Once a goodwill impairment loss is recognized, the adjusted carrying amount becomes the accounting basis.

58
The fair value of goodwill is tested for impairment on a non-recurring basis in the accompanying consolidated financial statements using Level 3 inputs. The Company’s estimate of fair value was primarily determined using the income approach methodology of valuation that includes the discounted cash flow method as well as other generally accepted valuation methodologies to determine the fair value of the assets. Changes in economic and operating conditions that occur after the annual impairment analysis or an interim impairment analysis that impact these assumptions may result in a future goodwill impairment charge.
Other Intangibles and Long-lived Assets Finite-lived intangible assets resulting from business acquisitions or technology licenses purchased are amortized on a straight-line basis over their estimated useful lives. The useful lives of acquisition-related intangible assets represent the point where over 90% of realizable undiscounted cash flows for each intangible asset are recognized. The assigned useful lives are consistent with the Company’s historical experience with similar technology and other intangible assets owned by the Company. The useful life of technology licenses is usually based on the term of the agreement.
In-process research and development is recorded at fair value as of the date of acquisition as an indefinite-lived intangible asset until the completion or abandonment of the associated research and development efforts or impairment. Upon completion of development, acquired in-process research and development assets are transferred to finite-lived intangible assets and amortized over their useful lives.
The Company reviews indefinite-lived intangible assets for impairment on an annual basis in conjunction with goodwill or whenever events or changes in circumstances indicate the carrying value may not be recoverable. Recoverability of indefinite-lived intangible assets is measured by comparing the carrying amount of the asset to the future discounted cash flows the asset is expected to generate.
Fair Value Measurements When determining the fair value measurements for assets and liabilities required or permitted to be recorded at fair value, the Company considers the principal or most advantageous market in which it would transact and considers assumptions that market participants would use when pricing the asset or liability, such as inherent risk, transfer restrictions, and risk of nonperformance. The Company uses the following three levels of inputs in determining the fair value of the Company’s assets and liabilities, focusing on the most observable inputs when available:
Level 1 - Quoted prices in active markets for identical assets or liabilities.
Level 2 - Observable inputs other than Level 1 prices such as quoted prices for similar assets or liabilities; quoted prices in markets with insufficient volume or infrequent transactions (less active markets); or model-derived valuations in which all significant inputs are observable or can be derived principally from or corroborated by observable market data for substantially the full term of the assets or liabilities.
Level 3 - Unobservable inputs to the valuation methodology that are significant to the measurement of fair value of assets or liabilities.
To the extent that valuation is based on models or inputs that are less observable or unobservable in the market, the determination of fair value requires more judgment. In certain cases, the inputs used to measure fair value may fall into different levels of the fair value hierarchy. In such cases, for disclosure purposes, the level in the fair value hierarchy within which the fair value measurement is disclosed is determined based on the lowest level input that is significant to the fair value measurement.
Interest Rate Derivative The Company incurs interest expense through its variable rate debt. To manage its interest rate risk, the Company occasionally hedges the future cash flows of its variable rate debt, principally through interest rate contracts with major financial institutions. Interest rate contracts that meet specific criteria are accounted for as cash flow hedges.

59
The Company’s objective in using interest rate contracts is to add stability to interest expense and to manage its exposure to interest rate movements. To accomplish this objective, the Company uses interest rate contracts as part of its interest rate risk management strategy. Interest rate cap contracts involve the receipts of variable amounts from a counterparty when one-month LIBOR exceeds the capped interest rate in exchange for an upfront payment from the Company, capping the Company’s one-month LIBOR floating interest payments at the strike rate on its interest rate cap contract. The effective portion of changes in the fair value of derivatives designated and that qualify as cash flow hedges is recorded in accumulated other comprehensive income and is subsequently reclassified into earnings in the period that the hedged forecasted transaction affects earnings. The upfront payment the Company paid for the interest rate cap agreement will be amortized out of accumulated other comprehensive income and recorded as interest expense according to the amortization schedule created at inception of the hedging relationship. The ineffective portion of the change in fair value of the derivatives is recognized directly in earnings. The Company records derivative instruments in the statements of cash flows to operating, investing, or financing activities consistent with the cash flows of the hedged item. The assessment of effectiveness is based on the total changes in an option’s cash flows such that the assessment will include the interest rate caps entire change in fair value. The interest rate cap is considered a highly effective hedge since the key features and terms match with the hedged item at inception. Key features and terms are notional amount, cap effective date, rate threshold, index, repricing dates, payments dates, and maturity dates. Revenue Recognition The Company recognizes product revenue when persuasive evidence of an arrangement exists, delivery has occurred, the fee is fixed or determinable and collectability is probable. Recovery of costs associated with product design and engineering services are recognized during the period in which services are performed. The product design and engineering recovery, when recognized, will be reported as a reduction to product development and engineering expense. Historically, these recoveries have not exceeded the cost of the related development efforts.
The Company includes revenue related to granted technology licenses as part of “Net sales.” Historically, revenue from these arrangements has not been significant though it is part of its recurring ordinary business. In the third quarter of fiscal year 2013, the Company entered into a single licensing arrangement that resulted in the recognition of $7.5 million of revenue.
The Company defers revenue recognition on shipment of products to certain customers, principally distributors, under agreements which provide for limited pricing credits or return privileges, until these products are sold through to end-users or the return privileges lapse. For sales subject to certain pricing credits or return privileges, the amount of future pricing credits or inventory returns cannot be reasonably estimated given the relatively long period in which a particular product may be held by the customer. Therefore, the Company has concluded that sales to customers under these agreements are not fixed and determinable at the date of the sale and revenue recognition has been deferred. The Company estimates the deferred gross margin on these sales by applying an average gross profit margin to the actual gross sales. The average gross profit margin is calculated for each category of material using standard costs which is expected to approximate actual costs at the date of sale. The estimated deferred gross margins on these sales, where there are no outstanding receivables, are recorded on the consolidated balance sheets under the heading of “Deferred revenue.”
The Company records a provision for estimated sales returns in the same period as the related revenues are recorded. The Company bases these estimates on historical sales returns and other known factors. Actual returns could be different from Company estimates and current provisions for sales returns and allowances, resulting in future charges to earnings. There were no significant impairments of deferred cost of sales in fiscal year 2013 or fiscal year 2012.

60
The following table summarizes the deferred revenue balance:
(in thousands) January 27, 2013 January 29, 2012 Deferred revenues $ 4,467
$ 4,964 Deferred cost of revenues 1,099
1,243 Deferred revenue, net 3,368
3,721 Deferred product design and engineering recoveries 377
132 Total deferred revenue $ 3,745
$ 3,853
Cost of Sales Cost of sales includes materials, depreciation on fixed assets used in the manufacturing process, shipping costs, direct labor and overhead.
Sales and Marketing The Company expenses sales and marketing costs, which include advertising costs, as they are incurred. Advertising costs were $119,000, $285,000 and $232,000 for fiscal years 2013, 2012 and 2011, respectively.
Product Development and Engineering Product development and engineering costs are charged to expense as incurred. Recoveries from nonrecurring engineering services are recorded as an offset to product development expense incurred in support of this effort since these activities do not represent an earnings process core to the Company’s business and serve as a mechanism to partially recover development expenditures.
The Company received approximately $12.5 million, $5.7 million and $11.7 million in fiscal years 2013, 2012 and 2011, respectively for nonrecurring engineering services.
Income Taxes The Company accounts for income taxes using the asset and liability method. Under this method, deferred tax assets and liabilities are recognized for the estimated future tax consequences attributable to differences between the financial statement carrying amounts and their respective tax bases. The consolidated balance sheets include current and long term prepaid taxes under “Prepaid taxes” and “Other assets” and current and long term liabilities for uncertain tax positions under “Accrued liabilities” and “Other long-term liabilities.” As part of the process of preparing the Company’s consolidated financial statements, the Company estimates income taxes in each of the jurisdictions in which it operates. This process involves estimating the current tax liability together with assessing temporary differences resulting from differing treatment of items for tax and accounting purposes. These differences result in deferred tax assets and liabilities. The Company must assess the likelihood that its deferred tax assets will be recovered from future taxable income and, to the extent the Company believes that recovery is not likely, it must establish a valuation allowance. To the extent the Company changes its valuation allowance in a period; the change is generally recorded through the tax provision on the consolidated statements of income.
The income tax effects of share-based payments are recognized for financial reporting purposes only if such awards are expected to result in a tax deduction. The Company does not recognize a deferred tax asset for an excess tax benefit (that is, a tax benefit that exceeds the tax benefit for the amount of compensation cost recognized for the award for financial reporting purposes) that has not been realized. In determining when an excess tax benefit is realized, the Company has elected to follow the ordering provision of the tax law.
For intra-entity differences between the tax basis of an asset in the buyer’s tax jurisdiction and their cost as reported in the consolidated financial statements, the Company does not recognize a deferred tax asset. Income taxes paid on

61
intra-entity profits on assets remaining within the group are accounted for as prepaid taxes. See Note 14 for further discussion of income taxes.
Accumulated Other Comprehensive Income Other comprehensive income includes unrealized gains and losses on available-for-sale investments, unrealized loss on interest rate hedging activities and foreign currency translation adjustments, net of tax. This information is provided in our consolidated statements of comprehensive Income. Accumulated other comprehensive income balances were as follows:
(in thousands)
Unrealized holding gain (loss) on available-for-sale investments
(1)
Unrealized loss on interest rate
hedge
Cumulative translation adjustment
Accumulated other
comprehensive income
Balance at January 31, 2010 $ 317 $ — $ 501 $ 818 Current-period other comprehensive (loss) income (76 ) — 1 (75 ) Balance at January 30, 2011 241 — 502 743 Current-period other comprehensive loss (204 ) — (4 ) (208 ) Balance as of January 29, 2012 37 — 498 535 Current-period other comprehensive (loss) income (32 ) (353 ) 203 (182 ) Balance as of January 27, 2013 $ 5 $ (353 ) $ 701 $ 353
(1) Net of reclassification adjustments for gains realized, net of tax from other comprehensive income to net income $1 and $5 for the fiscal years 2013 and 2012, respectively. There were no reclassification adjustments for gains realized in fiscal year 2011.
Translation The assets and liabilities of the Company’s foreign subsidiaries that operate in a local currency environment, where that local currency is the functional currency, are translated to the U.S. dollar using exchange rates in effect at the balance sheet date. Income statement items are translated at average exchange rates prevailing during the period. The translation gains or losses are included as a component of accumulated other comprehensive income in the accompanying consolidated financial statements. Transaction gains and losses resulting from the re-measurement or settlement of assets and liabilities denominated in foreign currencies are included in the determination of net income and have not been significant. Stock-Based Compensation The Company has various equity award plans (“Plans”) that provide for granting stock based awards to employees and non-employee directors of the Company. The Plans provide for the granting of several available forms of stock compensation. As of January 27, 2013, the Company has granted stock option awards (“Options”) and restricted stock unit awards (“RSU”) under the Plans and has also issued some stock-based compensation outside of any plan, including options and restricted stock awards issued as inducements to join the Company.

62
Earnings per Share The computation of basic and diluted earnings per common share was as follows:
Fiscal Year Ended (in thousands, except per share amounts) January 27, 2013 January 29, 2012 January 30, 2011 Net income $ 41,939 $ 89,087 $ 72,572 Weighted average common shares outstanding - basic 65,809 65,099 62,339 Dilutive effect of employee equity incentive plans 1,663 2,251 2,184 Weighted average common shares outstanding - diluted 67,472 67,350 64,523
Basic earnings per common share $ 0.64 $ 1.37 $ 1.16 Diluted earnings per common share $ 0.62 $ 1.32 $ 1.12
Anti-dilutive shares not included in the above calculations 783 625
1,700
Basic earnings per common share is computed by dividing income available to common shareholders by the weighted-average number of shares of common stock outstanding during the reporting period. Diluted earnings per common share incorporates the incremental shares issuable, calculated using the treasury stock method, upon the assumed exercise of stock options and the vesting of restricted stock.
Contingencies The Company accrues an undiscounted liability for contingencies where the incurrence of a loss is probable and the amount can be reasonably estimated, and the Company discloses the amount accrued and the amount of a reasonably possible loss in excess of the amount accrued, if such disclosure is necessary for our financial statements not to be misleading. The Company does not record liabilities when the likelihood that the liability has been incurred is probable but the amount cannot be reasonably estimated, or when the liability is believed to be only reasonably possible or remote.
Because litigation outcomes are inherently unpredictable, the Company’s evaluation of legal proceedings often involves a series of complex assessments by management about future events and can rely heavily on estimates and assumptions. If the assessments indicate that loss contingencies that could be material to any one of our financial statements are not probable, but are reasonably possible, or are probable, but cannot be estimated, then the Company discloses the nature of the loss contingencies, together with an estimate of the range of possible loss or a statement that such loss is not reasonably estimable.
Subsequent Events The Company evaluates all events through the issuance date of the consolidated financial statements to determine whether any subsequent events have occurred that require recognition or disclosure. Note 3: Acquisitions Gennum Corporation (“Gennum”) On March 20, 2012, the Company, through its wholly-owned subsidiary Semtech Canada Inc., completed the acquisition of all outstanding equity interests of Gennum (TSX: GND), a leading supplier of high speed analog and mixed-signal semiconductors for the optical communications and video broadcast markets.
Upon consummation of the business acquisition, which constituted a change in control of Gennum, Gennum’s stock option awards and restricted shares became fully vested. Semtech acquired 100% of the outstanding shares and vested stock options, restricted shares, and deferred share units of Gennum for CDN $13.55 per share for a total purchase price of $506.5 million. The acquisition was financed with a combination of cash from Semtech’s international cash reserves and $347 million of five-year secured term loans, net of original issuance debt discount of $3 million (see Note 10).

63
The Gennum assets acquired and liabilities assumed are recorded at their acquisition-date fair values. Acquisition-related transaction costs are not included as a component of consideration transferred, but are accounted for as an expense in the period in which the costs are incurred. Any excess of the acquisition consideration over the fair value of assets acquired and liabilities assumed is allocated to goodwill. The goodwill resulted from expected synergies from the transaction, including complementary products that will enhance the Company’s overall product portfolio, and opportunities within new markets, and is not deductible for tax purposes. The acquired in-process research and development is recorded at fair value as an indefinite-lived intangible asset at the acquisition date until the completion or abandonment of the associated research and development efforts.
In connection with the acquisition, certain Gennum employees became entitled to payments upon a change in control and their subsequent termination. These payments, which totaled approximately $9.6 million, have been recognized as a post-acquisition compensation expense and included in the consolidated statements of income for fiscal year 2013 under “Selling, general and administrative.”
The Company’s allocation of the total purchase price as of March 20, 2012 is summarized below: (in thousands) At March 20, 2012 Cash $ 19,664 Accounts receivable, less allowances 14,032 Inventories 62,941 Prepaid expenses 3,832 Income taxes receivable 1,467 Deferred tax assets - current 8,590 Other current assets 7,804 Property, plant and equipment 25,702 Amortizable intangible assets 129,863 In-process research and development 29,100 Goodwill 261,891 Deferred tax assets - non-current 31,235 Other non-current assets 8 Deferred tax liabilities (47,077 ) Accounts payable (18,232 ) Accrued liabilities (24,274 ) Total acquisition consideration $ 506,546
(in thousands)
At March 20, 2012
Amortizable intangible assets: Developed technology $ 95,100 Customer relationships 28,000 Other intangible assets 6,763
$ 129,863
Primarily due to a change in the preliminary allocation of fair value with regard to deferred tax assets and liabilities, the preliminary goodwill allocation related to Gennum decreased by $0.9 million from $262.8 million as of October 28, 2012 to $261.9 million as of January 27, 2013. There was no impact to the Company’s consolidated statements of income for fiscal year 2013. As of January 27, 2013, the Company has completed the purchase price allocation for its acquisition of Gennum.

64
The Company recognized approximately $11.4 million of transaction and integration expenses and $13.4 million severance costs associated with the Gennum acquisition in fiscal year 2013. These costs are included in the consolidated statements of income under “Selling, general and administrative.”
Net revenues attributable to Gennum since the acquisition date were $129.6 million, with a corresponding net loss of $36.5 million in fiscal year 2013.
In May 2012, the Company settled two pre-acquisition contingencies related to legal matters that were included in the purchase price allocation for a total cash payment of $4.2 million.
Pro Forma Financial Information The results of operations of Gennum have been included in the Company’s consolidated statements of income since the acquisition date of March 20, 2012. The following table reflects the unaudited consolidated pro forma information as if the acquisition had taken place at the beginning of each period presented, after giving effect to certain adjustments including the following for fiscal years 2013 and 2012:
• increase in cost of goods sold associated with the fair value adjustment related to acquired inventory of $41.8 million for fiscal year 2012 and subsequent decrease of $39.4 million for fiscal year 2013;
• decrease in operating expense as a result of classifying recoveries of cost associated with product design and engineering services as a reduction to product development and engineering expense of $12.9 million for fiscal year 2012;
• increase in operating expense as a result of the settlement of two pre-acquisition contingencies related to legal matters of $4.2 million for fiscal year 2013;
• increase in amortization expense as a result of acquired intangible assets of $22.8 million for fiscal year 2012 and a subsequent decrease of $1.6 million for fiscal year 2013;
• increase in benefit for taxes of $23.4 million associated with the releasing of prior accrued taxes on foreign earnings for fiscal year 2012 and subsequent decrease for fiscal year 2013;
• increase in interest expense of $16.6 million associated with the $350 million term loans entered into to finance the acquisition for fiscal year 2012 and $1.7 million for fiscal year 2013; and
• the related tax effects.
Unaudited Consolidated Pro forma Information:
Fiscal Year Ended January 27, 2013 January 29, 2012 (in thousands) (unaudited) (unaudited) Revenue $ 603,067 $ 604,906 Net income $ 56,980 $ 66,377
The unaudited pro forma information presented does not purport to be indicative of the results that would have been achieved had the acquisition been consummated at the beginning of each period presented nor of the results which may occur in the future. The pro forma adjustments are based upon available information and certain assumptions that the Company believes are reasonable. The unaudited pro forma information does not include any adjustments for any restructuring activities, operating efficiencies or cost savings.
Cycleo SAS On March 7, 2012, the Company completed the acquisition of Cycleo, a privately held company based in France that develops intellectual property (“IP”) for wireless long-range semiconductor products used in smart metering and other industrial and consumer markets. Under the terms of the agreement, Semtech paid the stockholders of Cycleo $5 million in cash at closing.

65
Total acquisition consideration is allocated to the acquired tangible and intangible assets and assumed liabilities of Cycleo based on their respective estimated fair values as of the acquisition date. Any excess of the acquisition consideration over the fair value of assets acquired and liabilities assumed is allocated to goodwill. The Company expects that all such goodwill will not be deductible for tax purposes. As of January 27, 2013, the Company completed the purchase price allocation for its acquisition of Cycleo.
Additionally, pursuant to the earn-out arrangement with Cycleo stockholders, the Company potentially may make payments totaling up to approximately $16 million based on the achievement of a combination of certain revenue and operating income milestones by Cycleo over the period of four years beginning on April 30, 2012. For certain of the Cycleo stockholders, payment of the earn-out liability is contingent upon employment on the payout date and is accounted for as post-acquisition compensation expense over the service period. The portion of the earn-out liability that is not dependent on continued employment is included in the purchase price allocation at March 7, 2012.
Net revenues and earnings attributable to Cycleo since the acquisition date were not material. Pro forma results of operations have not been presented as the acquisition was not material to the Company’s consolidated financial statements.
Note 4: Investments Investments that have original maturities of three months or less are accounted for as cash equivalents. This includes money market funds, time deposits and U.S. government obligations. Temporary and long-term investments consist of government, bank and corporate obligations, and bank time deposits with original maturity dates in excess of three months. Temporary investments have original maturities in excess of three months, but mature within twelve months of the balance sheet date. Long-term investments have original maturities in excess of twelve months. The Company determines the cost of securities sold based on the specific identification method. Realized gains or losses are reported in “Interest income and other expense, net” on the consolidated statements of income.
The Company classifies its investments as “available for sale” because it may sell some securities prior to maturity. The Company’s investments are subject to market risk, primarily interest rate and credit risks. The Company’s investments are managed by a limited number of outside professional managers that operate within investment guidelines set by the Company. These guidelines include specified permissible investments, minimum credit quality ratings and maximum average duration restrictions and are intended to limit market risk by restricting the Company’s investments to high quality debt instruments with relatively short-term maturities.
As of January 27, 2013, all of the Company’s long-term investments mature on various dates through fiscal year 2015.
The following table summarizes the Company’s available for sale investments:
January 27, 2013 January 29, 2012
(in thousands) Market Value Adjusted
Cost
Gross Unrealized
Gain Market Value Adjusted
Cost
Gross Unrealized
Gain Agency securities $ 7,907 $ 7,900 $ 7 $ 26,132 $ 26,110 $ 22 Corporate issues — — — 4,511 4,484 27 Bank time deposits 4,973 4,973 — 70,000 70,000 — Total investments $ 12,880 $ 12,873 $ 7 $ 100,643 $ 100,594 $ 49
Agency securities are specific securities that are issued by United States government agencies such as Ginnie Mae, Fannie Mae, Freddie Mac or the Federal Home Loan Banks. Due to the expectation of federal backing, these securities usually hold the highest credit rating possible.

66
The following table summarizes the maturities of the Company’s available for sale investments:
January 27, 2013 January 29, 2012 (in thousands) Market Value Adjusted Cost Market Value Adjusted Cost Within 1 year $ 4,973 $ 4,973 $ 83,121 $ 83,085 After 1 year through 5 years 7,907 7,900 17,522 17,509 Total investments $ 12,880 $ 12,873 $ 100,643 $ 100,594
Unrealized gains and losses are the result of fluctuations in the market value of the Company’s available for sale investments and are included in “Accumulated other comprehensive income” on the consolidated balance sheets. The following table summarizes net unrealized losses arising in the periods presented in addition to the tax associated with these comprehensive income items:
Fiscal Year Ended
(in thousands) January 27,
2013 January 29,
2012 January 30,
2011 Unrealized loss, net of tax $ (32 ) $ (204 ) $ (76 ) Decrease to deferred tax liability $ (10 ) $ (58 ) $ (41 )
The following table summarizes interest income generated from investments and cash and cash equivalents:
Fiscal Year Ended
(in thousands) January 27,
2013 January 29,
2012 January 30,
2011 Interest income $ 404 $ 1,213 $ 1,051
During fiscal year 2013, the Company acquired an investment in a privately traded company for total cash consideration of $2.5 million. The Company accounts for the investment in equity interests under the cost method of accounting since it does not have the ability to exercise significant influence over the investee. The investment in equity interests is included in “Other assets” on the consolidated balance sheet as of January 27, 2013. Note 5: Fair Value Measurements
Instruments Measured at Fair Value on a Recurring Basis
Financial assets measured and recorded at fair value on a recurring basis consisted of the following types of instruments: (in thousands) Fair Value as of January 27, 2013 Fair Value as of January 29, 2012 Total (Level 1) (Level 2) (Level 3) Total (Level 1) (Level 2) (Level 3) Agency securities $ 7,907 $ — $ 7,907 $ — $ 26,132 $ — $ 26,132 $ — Corporate issues — — — — 4,511 — 4,511 — Bank time deposits 4,973 — 4,973 — 70,000 — 70,000 — Total available-for-sale securities 12,880 — 12,880 — 100,643 — 100,643 $ — Interest rate cap 544 — 544 — — — — — Total financial assets $ 13,424 $ — $ 13,424 $ — $ 100,643 $ — $ 100,643 $ —
Available-for-sale securities included in Level 2 are valued utilizing inputs obtained from an independent service (the “Service”), which uses quoted market prices for identical or comparable instruments rather than direct observations of quoted prices in active markets. The Service gathers observable inputs for all of our fixed income securities from a variety of industry data providers, for example, large custodial institutions and other third-party sources. Once the

67
observable inputs are gathered by the Service, all data points are considered and an average price is determined. The Service’s providers utilize a variety of inputs to determine their quoted prices. The Company reviews and evaluates the values provided by the Service and agrees with the valuation methods and assumptions used in determining the fair value of investments. The Company believes this method provides a reasonable estimate for fair value.
The fair value of the interest rate cap at January 27, 2013 is estimated as described in Note 11 and is included in “Other assets” on the consolidated balance sheet.
Financial assets measured and recorded at fair value on a recurring basis were presented on the Company’s consolidated balance sheets as follows: Fair Value as of January 27, 2013 Fair Value as of January 29, 2012 (in thousands) Total (Level 1) (Level 2) (Level 3) Total (Level 1) (Level 2) (Level 3) Temporary investments $ 4,973 $ — $ 4,973 $ — $ 83,121 $ — $ 83,121 $ — Long-term investments 7,907 — 7,907 — 17,522 — 17,522 — Other assets 544 — 544 — — — — — Total financial assets $ 13,424 $ — $ 13,424 $ — $ 100,643 $ — $ 100,643 $ —
During fiscal years 2013 and 2012, the Company had no transfers of financial assets or liabilities between Level 1, Level 2 or Level 3. As of January 27, 2013 and January 29, 2012, the Company had not elected the fair value option for any financial assets and liabilities for which such an election would have been permitted.
Instruments Not Recorded at Fair Value on a Recurring Basis Some of the Company’s financial instruments are not measured at fair value on a recurring basis but are recorded at amounts that approximate fair value due to their liquid or short-term nature. Such financial assets and financial liabilities include: cash and cash equivalents, receivables, net, certain other assets, accounts payable and accrued expenses, accrued personnel costs, and other current liabilities.
The Company’s long-term debt is not recorded at fair value on a recurring basis, but is measured at fair value for disclosure purposes. The fair value of the Company’s debt is estimated primarily based on quotes (“ask prices”) provided by pricing services generated in a market with insufficient volume to comprise an active market (Level 2 inputs) based on the Company’s debt obligations. The fair value of the Company’s debt was $336.7 million at January 27, 2013.
Assets and Liabilities Recorded at Fair Value on a Non-Recurring Basis The Company reduces the carrying amounts of its goodwill, intangible assets, long-lived assets and non-marketable equity security to fair value when held for sale or determined to be impaired. For its investment in equity interests, the Company has not identified events or changes in circumstances that may have a significant adverse effect on the fair value of its cost method investment during the last three months of fiscal year 2013.
Note 6: Inventories Inventories, consisting of material, material overhead, labor, and manufacturing overhead, are stated at the lower of cost (first-in, first-out) or market and consist of the following:
(in thousands) January 27, 2013 January 29, 2012 Raw materials $ 1,970 $ 4,871 Work in progress 52,669 30,884 Finished goods 20,239 11,240 Inventories $ 74,878 $ 46,995

68
Note 7: Property, Plant and Equipment The following is a summary of property and equipment, at cost less accumulated depreciation:
(in thousands) January 27, 2013 January 29, 2012 Property $ 9,050
$ 5,991 Buildings 18,627
18,580 Leasehold improvements 8,881
5,768 Machinery and equipment 130,595
98,895 Furniture and office equipment 30,120
23,428 Construction in progress 6,330
2,444 Property, plant and equipment, gross 203,603
155,106 Less accumulated depreciation and amortization (101,766 ) (85,393 ) Property, plant and equipment, net $ 101,837
$ 69,713
The net book value of equipment and machinery that are consigned to a foundry in China is $7.9 million and $9.4 million as of January 27, 2013 and January 29, 2012, respectively.
The following table summarizes depreciation and amortization expense for property, plant and equipment:
Fiscal Year Ended
(in thousands) January 27,
2013 January 29,
2012 January 30,
2011 Depreciation and amortization expense $ 17,915 $ 9,908 $ 6,928
Note 8: Goodwill and Intangible Assets Goodwill – Goodwill balances as of January 27, 2013 and January 29, 2012 are presented below:
(in thousands) Carrying Amount Balance as of January 29, 2012 $ 129,651 Acquisition of Gennum Corporation 261,891 Acquisition of Cycleo SAS 2,042 Balance as of January 27, 2013 $ 393,584
During fiscal year 2013, goodwill increased by approximately $263.9 million due to the Company’s acquisitions of Gennum and Cycleo (see Note 3).
In fiscal year 2012, the Company reorganized its reporting structure in a manner that changed the composition of its product lines within its reporting units. The components of the Advanced Communications and Sensing reporting unit were split into two reporting units consisting of the Advanced Communications and the Wireless and Sensing reporting units. As a result of the change, in fiscal year 2012, goodwill was reassigned to the reporting units affected using a relative fair value allocation approach. Subsequent to the reorganization in the third quarter of fiscal year 2012, the goodwill associated with the Advanced Communications and Sensing reporting unit was reassigned (as of November 2011) such that 10% of goodwill is allocated to the Wireless and Sensing reporting unit and 90% of the goodwill is allocated to the Advanced Communications reporting unit. In connection with the reorganization, the Company assessed whether an indicator of impairment existed prior to the reorganizations and concluded that no such indicators were present in fiscal year 2012.

69
As a result of the acquisition of Gennum and Cycleo (see Note 3), the Company acquired $261.9 million of goodwill, associated with the newly formed Gennum reporting unit, and added $2.0 million to the Wireless and Sensing reporting unit.
Goodwill was tested for impairment as of November 30, 2012, the date of the Company’s annual impairment review. The Company concluded that the fair values of each of the Advanced Communications, the Wireless and Sensing, and Gennum reporting units exceeded their respective carrying values of goodwill and no impairment existed as of January 27, 2013. The Company estimated the fair values of its reporting units using the income approach, which utilizes estimates of discounted future cash flows. The discounted cash flows for each reporting unit were based on discrete financial forecasts developed by management for planning purposes. Cash flows beyond the discrete forecasts were estimated using a terminal value calculation, which incorporated historical and forecasted financial trends for each identified reporting unit and considered perpetual earnings growth rates for publicly traded peer companies. Future cash flows were discounted to present value by incorporating appropriate present value techniques. Specifically, the income approach valuations included the following assumptions:
Discount rate 10.0% - 13.0% Perpetual growth rate 3.0% Tax rate 14.7% - 20.0% Risk-free rate 2.4% Peer company beta 1.3 - 1.6
Purchased Intangibles - The following table sets forth the Company’s finite-lived intangible assets resulting from business acquisitions and technology licenses purchased, which continue to be amortized: January 27, 2013 January 29, 2012
(in thousands) Estimated
Useful Life
Gross Carrying Amount
Accumulated Amortization
Net Carrying Amount
Gross Carrying Amount
Accumulated Amortization
Net Carrying Amount
Core technologies 2-10 years $ 173,724 $ (40,867 ) $ 132,857 $ 65,900 $ (21,031 ) $ 44,869 Customer relationships 7-10 years 40,130 (7,736 ) 32,394 12,130 (2,929 ) 9,201 Technology licenses (1) 5-10 years 8,164 (1,056 ) 7,108 3,000 (250 ) 2,750 Other intangibles assets 1-5 years 6,600 (4,601 ) 1,999 — — — Total finite-lived intangible assets $ 228,618 $ (54,260 ) $ 174,358 $ 81,030 $ (24,210 ) $ 56,820 (1) Technology licenses relate to licensing agreements entered into by the Company. Amortization expense
related to technology licenses is reported as “Product development and engineering” in the consolidated statements of income.
During fiscal year 2013, acquired finite-lived intangible assets increased by approximately $147.6 million mainly due to $129.9 million due to the acquisition of Gennum, $6.1 million from the acquisition of Cycleo and $5.0 million from additional technology licenses purchased. In addition, acquired finite-lived intangible assets increased by $6.6 million due to the transfer from indefinite-lived intangible assets to core technologies upon the completion of one in-process research and development project from the acquisition of Sierra Monolithics, Inc. (“SMI”) in 2009.
Core technologies include $95.1 million and $6.1 million of finite-lived intangible assets from the acquisition of Gennum and the acquisition of Cycleo, respectively (see Note 3). The Company concluded that the intangible assets classified as core technologies were identifiable intangible assets, separate from goodwill, since they were capable of being separated from Gennum or Cycleo and sold, transferred or licensed, regardless of whether the Company intended to do so. Each product technology was valued separately since each was determined to have a different remaining useful life. The value for the underlying core IP technology from the acquisition of Gennum and Cycleo was assessed utilizing a discounted cash flow methodology and/or a relief from royalty method.

70
The nature of Gennum’s core technology was categorized as follows:
January 27, 2013
(in thousands) Fair Value Estimated Useful
Life Underlying intellectual property - Clock and data recovery $ 31,000 8 years Video broadcast and surveillance 39,000 7-8 years Optical communication 21,000 6 years Other 4,100 6-7 years Total $ 95,100
For the fiscal years 2013, 2012 and 2011, amortization expense related to finite-lived intangible assets was $29.2 million, $8.4 million and $9.5 million, respectively. Amortization expense related to finite-lived intangible assets is reported as “Intangible amortization and impairments” in the consolidated statements of income.
The estimated annual amount of future amortization expense for finite-lived intangible assets will be as follows: (in thousands)
To be recognized in: Technology
license Sierra
Monolithics Gennum Cycleo Total Fiscal year 2014 $ 1,507 $ 8,870 $ 18,778 $ 1,007 $ 30,162 Fiscal year 2015 1,465 8,870 18,132 1,007 29,474 Fiscal year 2016 1,436 8,870 17,586 1,007 28,899 Fiscal year 2017 1,186 8,870 17,499 1,007 28,562 Fiscal year 2018 776 8,160 17,499 1,007 27,442 Thereafter 738 8,490 20,510 81 29,819 Total expected amortization expense $ 7,108 $ 52,130 $ 110,004 $ 5,116 $ 174,358
The following table sets forth the Company’s indefinite-lived intangible assets resulting from business acquisitions:
January 27, 2013 January 29, 2012
(in thousands)
Gross Carrying Amount
Accumulated Impairment
Loss Net Carrying
Amount
Gross Carrying Amount
Accumulated Impairment
Loss Net Carrying
Amount In-process research and development $ 34,870 $ (3,170 ) $ 31,700 $ 12,370 $ (2,470 ) $ 9,900 Total indefinite-lived intangible assets $ 34,870 $ (3,170 ) $ 31,700 $ 12,370 $ (2,470 ) $ 9,900
During fiscal year 2013, acquired indefinite-lived intangible assets increased by approximately $22.5 million mainly due to $29.1 million related to the acquisition of Gennum, partially offset by $6.6 million due to the transfer from indefinite-lived intangible assets to core technologies upon the completion of one in-process research and development project from SMI acquisition.
Acquired in-process research and development projects (“IPR&D”) was tested for impairment as of November 30, 2012, the date of the Company’s annual impairment review. With the exception of the impairment charge of $700,000 recorded to write-off acquired IPR&D from SMI acquisition, the Company concluded that the fair value of the acquired in-process research and developments exceeded the carrying value and no impairment existed as of January 27, 2013. The fair value of the IPR&D projects was determined using using an income approach or replacement cost approach as applicable. The replacement cost approach was used for IPR&D projects that were considered long-term core investments and were not anticipated to be profitable for a period of time. IPR&D projects which were valued using an income approach, measured the returns attributable to each specific IPR&D project,

71
discounted to present value using a risk-adjusted rate of return, including as appropriate, any tax benefits derived from amortizing the intangible assets for tax purposes. Significant factors considered in the calculation of the rate of return are the weighted average cost of capital and return on assets, as well as the risk inherent in the development process, including the likelihood of achieving technology success and market acceptance. For IPR&D projects valued using a replacement cost approach, value was estimated by developing the cost to either replace or reproduce (replicate) the IPR&D to its current state. The key unobservable inputs utilized in the model include discount rates ranging from 12.0% to 18.0%, a market participant tax rate of 12.3% to 17.0%, and a probability adjusted level of future cash flows based on current product and market data.
During the third quarter of fiscal year 2012, the Company abandoned certain development efforts related to acquired intangible assets. As a result of these actions, the Company concluded that a portion of the net carrying amount of in-process research and development was not recoverable and therefore it recorded an impairment charge against the net carrying value in the three month period ended October 30, 2011, as summarized below:
(in thousands) Net Carrying In-process research and development impairment Amount Impairment High-speed switching technology for power management applications (1) $ 2,070
$ (2,070 ) Integrated driver for telecommunications applications (2) 400
(400 ) Total $ 2,470
$ (2,470 )
(1) related to the February 2009 Leadis Technology Inc. acquisition. (2) related to the December 2009 Sierra Monolithics, Inc. acquisition.
These impairment charges are included in “Intangible amortization and impairments” on the consolidated statements of income.
Note 9: Accrued Liabilities The following is a summary of accrued liabilities for fiscal years 2013 and 2012:
(in thousands) January 27, 2013 January 29, 2012 Compensation $ 23,140
$ 14,330 Equity awards accounted for as a liability 3,241
3,988 Deferred compensation 1,410 901 Accrued sales and marketing expenses 3,202 1,742 Accrued professional fees 3,835 1,949 Accrued interest expense 1,177 — Income taxes payable 4,113
4,260 Accrued taxes 266
437 Other 8,892
4,782 $ 49,276 $ 32,389
Note 10: Credit Facilities On March 20, 2012, the Company entered into a credit agreement with certain lenders (the “Lenders”) and Jefferies Finance LLC, as administrative and collateral agent (the “Credit Agreement”). Pursuant to the Credit Agreement, the Lenders provided the Company with senior secured first lien credit facilities in an aggregate principal amount of $350 million (the “Facilities”), consisting of term A loans in an aggregate principal amount of $100 million (the “Term A Loans”) and term B loans in an aggregate principal amount of $250 million (the “Term B Loans”). Both the Term A Loans and the Term B Loans mature on March 20, 2017. The initial carrying amounts totaled $99.5 million (net of original issue discount of $500,000) for the Term A Loans and $247.5 million (net of original issue discount of $2.5 million) for the Term B Loans. The respective amounts of original issue discount are being amortized using the

72
effective interest method and are included in “Interest expense” in the consolidated statements of income. A portion of the proceeds of the loans was used to finance the acquisition of Gennum and fees, costs and expenses related thereto, and the remainder of the proceeds may be used by Semtech for working capital and general corporate purposes.
Debt issuance costs incurred in connection with the Facilities totaled $8.9 million and are being amortized using the effective interest method over the terms of the loans, and are included in “Interest expense” in the consolidated statements of income.
The Company may request, at any time, subject to certain conditions, the establishment of one or more additional term loan facilities in an aggregate principal amount not to exceed $150 million, the proceeds of which may be used for working capital and general corporate purposes.
Interest on the Term A Loans and Term B Loans accrue at certain reference rates plus specified applicable margins. The reference rates are equivalent to, at the Company’s option, either: (i) LIBOR for interest periods of 1, 2, 3 or 6 months or, subject to certain conditions, 9 or 12 months (“LIBOR”) or (ii) the highest of (a) the prime rate, (b) the federal funds effective rate plus 1/2% or (c) one-month LIBOR plus 1.00% (“Base Rate”). For the Term B Loans, LIBOR is subject to a floor of 1.00% and Base Rate is subject to a floor of 2.00%. For the Term A Loans, the applicable margin for LIBOR loans ranges from 2.50% to 2.75% and the applicable margin for Base Rate loans ranges from 1.50% to 1.75%, in each case depending upon the total leverage ratio. For the Term B Loans, the applicable margin for LIBOR loans is 3.25% and the applicable margin for Base Rate loans is 2.25%. Interest is payable at least quarterly. As of January 27, 2013, the interest rates payable on the Term A Loans and Term B Loans were 2.96% and 4.25%, respectively.
In accordance with the Credit Agreement, and as described in Note 11, in June 2012, the Company entered into an interest rate hedging agreement protecting at least 50% of the variable interest rate exposure on the term loans.
Quarterly principal payments of $5.0 million and $0.6 million for the Term A Loans and Term B Loans, respectively, are due beginning on the last business day of the quarter ended July 29, 2012, with the final remaining payments due on the maturity date of March 20, 2017.
Scheduled maturities of current and long-term debt are as follows:
(in thousands) Fiscal Year Ending: 2014 $ 49,100 2015 22,500 2016 22,500 2017 22,500 2018 216,525 Total debt $ 333,125
Pursuant to the Credit Agreement, under certain circumstances, the Company is obligated to apply 50% of its excess cash flow (as defined in the Credit Agreement) for each fiscal year, as well as net cash proceeds from specified other sources, such as asset sales, debt issuances or insurance proceeds, to prepay the Term A Loans and Term B Loans. Excess cash flow may be primarily summarized as cash provided by operating activities less capital expenditures and loan principal payments. The first excess cash flow payment is estimated to be $26.6 million. The earliest date that any such payment may be due is 95 days after the last day of the fiscal year ending closest to January 31, 2013. The Company has classified the potential early payment of $26.6 million from “Long term debt” to “Current portion - long term debt” in the consolidated balance sheets as of January 27, 2013.
Subject to certain customary exceptions, all obligations of the Company under the Facilities are unconditionally guaranteed by each of Semtech’s existing and subsequently acquired or organized direct and indirect domestic subsidiaries (the “Guarantors”). The obligations of Semtech and the Guarantors in respect of the Facilities are secured

73
by a first priority security interest in substantially all of the assets of Semtech and the Guarantors, subject to certain customary exceptions.
The Facilities are subject to customary affirmative and negative covenants, some of which require the maintenance of specified interest coverage and leverage ratios. The Company was subject to a minimum interest ratio of 5.00:1.00 for the fourth quarter ended January 27, 2013 and a maximum total leverage ratio of 2.65:1.00 as of the last day of the fourth quarter ended January 27, 2013. The Company was in compliance with such financial covenants as of January 27, 2013.
Note 11: Interest Rate Derivative Agreement In June 2012, the Company entered into an interest rate cap agreement with a $175 million notional amount and an upfront payment of $1.1 million. The agreement matures on February 22, 2016 and caps interest rates on one-month LIBOR at 1.00%. The interest rate cap agreement has been designated as a cash flow hedge of interest rate risk and is recorded at estimated fair value as of January 27, 2013. The Company determined that the interest rate cap agreement is highly effective in offsetting future variable interest payments associated with the hedged portion of the Company’s term loans. No ineffectiveness was recorded during fiscal year 2013. The Company did not have any active interest contracts outstanding prior to June 2012. The amount of unrealized losses on the interest rate cap recorded in other comprehensive loss at January 27, 2013 that is expected to be reclassified into interest expense in the next twelve months, if interest rates remain unchanged, is approximately $78,000.
The fair value of the interest rate cap at January 27, 2013 is determined based on assumptions that management believes market participants would use in pricing. This analysis reflects the contractual terms of the derivatives, including the period to maturity, and uses observable market-based inputs, including interest rate curves and implied volatilities. Based on the inputs used in the valuation, the Company has determined that the derivative valuation is classified in Level 2 of the fair value hierarchy.
Note 12: Stock-Based Compensation Financial Statement Effects and Presentation. The following table shows total pre-tax, stock-based compensation expense included in the consolidated statements of income for fiscal years 2013, 2012 and 2011.
Fiscal Year Ended (in thousands) January 27, 2013 January 29, 2012 January 30, 2011 Cost of sales $ 1,218 $ 983 $ 1,802 Selling, general and administrative 14,965 15,839 19,310 Product development and engineering 8,345 7,198 7,898 Stock-based compensation, pre-tax $ 24,528 $ 24,020 $ 29,010 Net change in stock-based compensation capitalized into inventory $ (33 ) $ (83 ) $ (116 )

74
The below table summarizes the net impact of stock-based compensation, after tax, on net income for fiscal years 2013, 2012 and 2011.
Fiscal Year Ended (in thousands) January 27, 2013 January 29, 2012 January 30, 2011 Stock-based compensation $ 24,528 $ 24,020 $ 29,010 Associated tax effect (5,120 ) (5,693 ) (9,170 ) Net effect on net income $ 19,408 $ 18,327 $ 19,840
The tax benefit realized from option exercise activity for fiscal years 2013, 2012 and 2011 was $14.3 million, $12.9 million and $7.1 million, respectively.
Share-based Payment Arrangements The Company has various equity award plans that provide for granting stock-based awards to employees and non-employee directors of the Company. The plans provide for the granting of several available forms of stock compensation. As of January 27, 2013, the Company has granted options and restricted stock under the plans and has also issued some stock-based compensation outside of the plans, including options and restricted stock issued as inducements to join the Company.
Grant Date Fair Values and Underlying Assumptions; Contractual Terms The Company uses the Black-Scholes pricing model to value options. For awards classified as equity, stock-based compensation cost is measured at grant date, based on the fair value of the award, and is recognized as an expense over the employee’s or director’s requisite service period. For awards classified as liabilities, stock-based compensation cost is measured at fair value at the end of each reporting date until the date of settlement, and is recognized as an expense over the employee’s or director’s requisite service period. Expected volatilities are based on historical volatility using daily and monthly stock price observations.
The following table summarizes the assumptions used in the Black-Scholes model to determine the fair value of options granted in fiscal years 2013, 2012 and 2011: Fiscal Year Ended
January 27,
2013 January 29,
2012 January 30,
2011 Expected lives, in years 4.4 - 4.6 4.4 - 4.7 4.3 - 5.1 Estimated volatility 38% - 41% 40% - 41% 39% - 40% Dividend yield — — — Risk-free interest rate 0.66% - 0.73% 0.71% - 1.8% 1.2% - 2.3% Weighted average fair value on grant date $9.52 $8.43 $6.56
The estimated fair value of restricted stock awards was calculated based on the market price of the Company’s common stock on the date of grant. Some of the restricted stock units awarded in fiscal year 2013 and prior years are classified as liabilities rather than equity. For awards classified as liabilities, the value of these awards is re-measured at the end of each quarter. Stock Option Awards. The Company has historically granted stock option awards to both employees and non-employee directors. The grant date for these awards is equal to the measurement date. These awards were valued as of the measurement date and are amortized over the requisite vesting period (typically 3-4 years).

75
A summary of the activity for stock option awards for fiscal years 2013, 2012 and 2011 is presented below:
(in thousands, except for per share amounts)
Number of
Shares
Weighted Average Exercise
Price (per share)
Aggregate Intrinsic Value (1)
Aggregate Unrecognized Compensation
Number of Shares
Exercisable
Weighted Average
Contractual Term (years)
Balance at January 31, 2010 9,151 $ 16.44 $ 8,998 $ 9,436 6,302 Options granted 403 17.61 Options exercised (2,329 ) 14.22 11,495 Options cancelled/forfeited (603 ) 21.35
Balance at January 30, 2011 6,622 16.84 35,492 7,067 5,160 Options granted 343 24.05 Options exercised (2,781 ) 16.64 22,537 Options cancelled/forfeited (494 ) 22.30
Balance at January 29, 2012 3,690 16.94 44,435 4,699 2,767 Options granted 258 28.21 Options exercised (1,254 ) 15.70 14,508 Options cancelled/forfeited (115 ) 25.30
Balance at January 27, 2013 2,579 $ 18.29 $ 29,789 $ 3,817 1,937 Exercisable at January 27, 2013 1,937 $ 16.51 $ 25,822 2.1 Vested and expected to vest after January 27, 2013 2,495 $ 18.10 $ 29,293 2.6
(1) Represents the difference between the exercise price and the value of the Company’s stock at the time of exercise, for exercised grants. For outstanding awards, represents the difference between the exercise price and the value of the Company’s stock at fiscal year end.
The following table summarizes information about stock options outstanding at January 27, 2013.
(number of shares in thousands)
Number of
Shares
Weighted Average Exercise
Price (per share)
Weighted Average
Contractual Term (years)
Price Range Analysis - Outstanding $1.15 - $4.53 9
$ 2.52 4.3 $7.79 - $13.15 247
11.59 2.1 $13.76 - $20.90 1,671
16.58 2.1 $21.02 - $29.68 652
25.43 4.4 Total outstanding 2,579
$ 18.29 2.7
Price Range Analysis - Exercisable $1.15 - $4.53 9
$ 2.52 4.3 $7.79 - $13.15 241
11.62 2.0 $13.76 - $20.90 1,494
16.52 2.0 $21.02 - $29.68 193
23.18 2.8 Total exercisable 1,937
$ 16.51 2.1

76
The following table summarizes information regarding unvested stock option awards at January 27, 2013:
(in thousands, except for per share amounts)
Number of
Shares
Weighted Average Exercise
Price (per share)
Weighted Average
Grant Date Fair Value (per share)
Weighted Average
Remaining Expense Period (years) Total Fair Value
Balance at January 31, 2010 2,849 $ 13.31 $ 7.48 1.9 $ 21,311 Options granted 403 17.61 6.56 2,644 Options vested (1,575 ) 13.07 8.26 13,006 Options forfeited (215 ) 11.57 8.56 1,845 Balance at January 30, 2011 1,462 15.00
6.23
1.9 $ 9,103
Options granted 343 24.05 8.43
2,893
Options vested (650 ) 14.30 6.33
4,115
Options forfeited (231 ) 16.59 6.39
1,479
Balance at January 29, 2012 924 18.47 6.99
1.8
$ 6,452 Options granted 258 28.21
9.52 2,457
Options vested (484 ) 16.42 6.49
3,144 Options forfeited (56 ) 21.69
7.74 432
Balance at January 27, 2013 642 $ 23.66 $ 8.31
1.9
$ 5,333
Restricted Stock. The Company has not granted any restricted stock to employees since fiscal year 2009. The grant date for these awards is equal to the measurement date. These awards are valued as of the measurement date and recognized as compensation expense over the requisite vesting period (typically 3-4 years).
The following table summarizes the activity for restricted stock awards for fiscal years 2013, 2012 and 2011:
(in thousands, except for per share amounts)
Number of Shares
Weighted Average Grant Date Fair Value (per share)
Aggregate Intrinsic Value (1)
Aggregate Unrecognized Compensation
Weighted Average Period Over
Which Expected to be Recognized
(in years) Balance at January 31, 2010 418 $ 15.15
$ 3,193
1.2
Restricted stocks granted —
Restricted stocks vested (270 ) 17.33
$ 4,678
Restricted stocks cancelled (13 ) 17.44
Balance at January 30, 2011 135 14.44
984
0.8
Restricted stocks granted —
Restricted stocks vested (91 ) 14.29
2,201
Restricted stocks cancelled (12 ) 15.25
Balance at January 29, 2012 32 14.57 81 0.1
Restricted stocks granted — Restricted stocks vested (32 ) 14.57 $ 902 Restricted stocks cancelled —
Balance at January 27, 2013 — $ — $ — —
(1) Represents the value of Semtech stock on the date that the restricted stock vested.

77
Performance Units. The Company grants performance-based vesting restricted stock units to select employees. These awards have a performance condition in addition to a service condition. The performance condition generally relates to the Company’s revenue and operating income measured against internal goals. Under the terms of these awards, assuming the highest level of performance with no cancellations due to forfeitures, the maximum number of shares that can be earned in the aggregate is 696,400. In this scenario, the maximum number of shares that could be issued thereunder would be 353,200 and the Company would have a liability accrued in the consolidated balance sheet equal to the value of 343,200 shares on the settlement date, which would be settled in cash. Only cash performance unit awards are classified as liabilities and the value of these awards is re-measured at each reporting date. At January 27, 2013, 85% of the units from the fiscal year 2009 grant vested and 200% of the units from the fiscal year 2010 grant are expected to vest. At January 27, 2013, the performance metrics associated with the outstanding awards issued in fiscal years 2013, 2012 and 2011 are expected to be met at a level which would result in a grant at 100%, 108%, and 200% of target, respectively.
The following table summarizes the activity for performance units during fiscal years 2013, 2012 and 2011:
Subject to
Share Settlement Subject to
Cash Settlement
Weighted Average
Grant
Aggregate Period Over
Which Expected (in thousands, except for per share amounts)
Total Units Units Units
Recorded Liability
Fair Value (per share)
Unrecognized Compensation
to be Recognized (in years)
Balance at January 31, 2010 593 363
230 $ 259
$ 14.29
$ 580
1.3
Performance units granted 143 72 71 16.68
Performance units vested — — — — —
Performance units cancelled/forfeited (180 ) (109 ) (71 )
16.28
Change in liability 3,666 —
Balance at January 30, 2011 556 326 230 3,925
14.26
7,971
1.0 Performance units granted 117 59 58 23.33
Performance units vested (218 ) (157 ) (61 ) (1,335 )
14.74
Performance units cancelled/forfeited (95 ) (48 ) (47 )
15.26
Change in liability 3,444
Balance at January 29, 2012 360 180 180 6,034 16.65 4,829 1.0 Performance units granted 144 77 67 29.30 Performance units vested (144 ) (72 ) (72 ) (4,172 ) 11.92 Performance units cancelled/forfeited (7 ) (4 ) (3 ) 29.35 Change in liability 2,560
Balance at January 27, 2013 353 181 172 $ 4,422 $ 23.50 $ 4,754 1.1 Stock Units, Employees. The Company issues stock unit awards to employees which are expected to be settled with stock. The grant date for these awards is equal to the measurement date. These awards are valued as of the measurement date and amortized over the requisite vesting period (typically 4 years).

78
The following table summarizes the stock unit award activity for fiscal years 2013, 2012 and 2011:
(in thousands, except per share amount)
Number of Units
Weighted Average Grant Date Fair Value (per unit)
Aggregate Intrinsic Value (1)
Aggregate Unrecognized Compensation
Weighted Average Period Over
Which Expected to be Recognized
(in years) Balance at January 31, 2010 1,410 $ 15.72
$ 17,713
3.4
Stock units granted 1,181 17.62
Stock units vested (404 ) 19.20
$ 7,749
Stock units forfeited (129 ) 19.50
Balance at January 30, 2011 2,058 16.70
29,763
2.7
Stock units granted 810 22.74
Stock units vested (627 ) 16.61
14,333
Stock units forfeited (259 ) 17.75
Balance at January 29, 2012 1,982 19.06 31,472 2.4
Stock units granted 1,517 26.73 Stock units vested (699 ) 18.20 $ 18,438 Stock units forfeited (242 ) 23.65
Balance at January 27, 2013 2,558 $ 23.41 $ 49,374 2.5
(1) Reflects the value of Semtech stock on the date that the stock unit vested.
Stock Units, Non-Employee Directors. The Company grants stock unit awards to non-employee directors. These restricted stock units are accounted for as liabilities and accrued in the consolidated balance sheets because they are cash settled. These awards are vested after 1 year of service. However, because these awards are not typically settled until a non-employee director’s separation from service, the value of these awards is re-measured at the end of each reporting period until settlement.

79
The following table summarizes the activity for stock unit awards for fiscal years 2013, 2012 and 2011:
(in thousands, except per share amount) Number of
Units Recorded Liability
Weighted Average Grant Date Fair Value (per unit)
Aggregate Unrecognized Compensation
Period Over Which Expected
to be Recognized (in years)
Balance at January 31, 2010 35 $ 1,389 $ 16.18
$ 232
0.4
Stock units granted 30
16.43
Stock units vested (35 )
16.18
Stock units forfeited —
Change in liability 1,025
Balance at January 30, 2011 30 2,414 16.43
269
0.4
Stock units granted 18 27.60 Stock units vested (30 ) 16.43 Stock units forfeited — Change in liability 1,459
Balance at January 29, 2012 18 3,873 27.60 216 0.4 Stock units granted 20 24.46 Stock units vested (18 ) 27.60 Stock units forfeited — Change in liability 684
Balance at January 27, 2013 20 $ 4,557 $ 24.46 $ 253 0.4
As of January 27, 2013, the total number of vested but unsettled stock units for Non-Employee Directors is 141,155 units which are included in the recorded liability. Note 13: Interest Income and Other (Expense) Income, Net Interest and other expense, net, consist of the following:
Fiscal Year Ended (in thousands) January 27, 2013 January 29, 2012 January 30, 2011 Interest income $ 404 $ 1,213 $ 1,051 Non-recoverable VAT tax (217 ) (156 ) (118 ) Foreign currency transaction loss (354 ) (504 ) (428 ) Miscellaneous (expense) income (810 ) 40 69 Interest income and other (expense), net $ (977 ) $ 593 $ 574

80
Note 14: Income Taxes The (benefit) provision for taxes consists of the following:
Fiscal Year Ended (in thousands) January 27, 2013 January 29, 2012 January 30, 2011 Current tax provision Federal $ 7,100 $ 2,336 $ 3,178 State 784 569 444 Foreign 5,745 4,615 2,822 Subtotal 13,629 7,520 6,444 Deferred tax (benefit) provision Federal (15,812 ) (4,417 ) (1,631 ) State (148 ) 1,232 (5 ) Foreign (39,359 ) 757 1,952 Subtotal (55,319 ) (2,428 ) 316 (Benefit) provision for taxes $ (41,690 ) $ 5,092 $ 6,760
The (benefit) provision for taxes reconciles to the amount computed by applying the statutory federal rate to income before taxes as follows:
Fiscal Year Ended (in thousands) January 27, 2013 January 29, 2012 January 30, 2011 Federal income tax at statutory rate $ 86
$ 32,963 $ 27,766 State income taxes, net of federal benefit (2,472 )
(263 ) 581 Foreign taxes at rates less than federal rates (9,655 )
(16,269 ) (16,367 ) Tax credits generated (5,328 )
(2,222 ) (1,234 ) Changes in valuation allowance 2,703
1,814 (879 ) Changes in uncertain tax positions 132
(3,235 ) 2,755 Deemed dividends 1,101
1,250 1,056 Equity compensation 793
(1,312 ) 1,639 Permanent differences 1,571
1,592 1,652 Sales exclusion - foreign jurisdiction (10,689 )
(11,017 ) (9,429 ) Dividend and U.S. tax on foreign earnings (23,443 )
— — Revaluation of deferred taxes assets and liabilities 3,510
— — Other 1
1,791 (780 ) (Benefit) provision for taxes $ (41,690 )
$ 5,092 $ 6,760
During fiscal year 2013, the Company released $1.1 million of previously recorded reserves for uncertain tax positions as a result of statutes of limitations for the taxing authority to challenge the position expiring.

81
The deferred tax assets and deferred tax liabilities are classified in the consolidated balance sheets as follows:
(in thousands) January 27, 2013 January 29, 2012 Deferred tax assets
Current $ 7,473 $ 5,339 Non-current 33,563 —
Subtotal 41,036 5,339 Deferred tax liabilities
Current (4,221 ) (4,041 ) Non-current (2,042 ) (1,000 )
Subtotal (6,263 ) (5,041 ) Net deferred tax assets $ 34,773 $ 298
The Financial Accounting Standards Board’s (“FASB”) Accounting Standards Codification (“ASC”) Topic 740, Accounting for Income Taxes, requires that for a particular tax-paying component of an enterprise, and within a particular tax jurisdiction, (a) all current deferred tax liabilities and assets shall be offset and presented as a single amount and (b) all noncurrent deferred tax liabilities and assets shall be offset and presented as a single amount. Deferred tax liabilities and assets attributable to different tax-paying components of the enterprise or to different tax jurisdictions should not be offset.
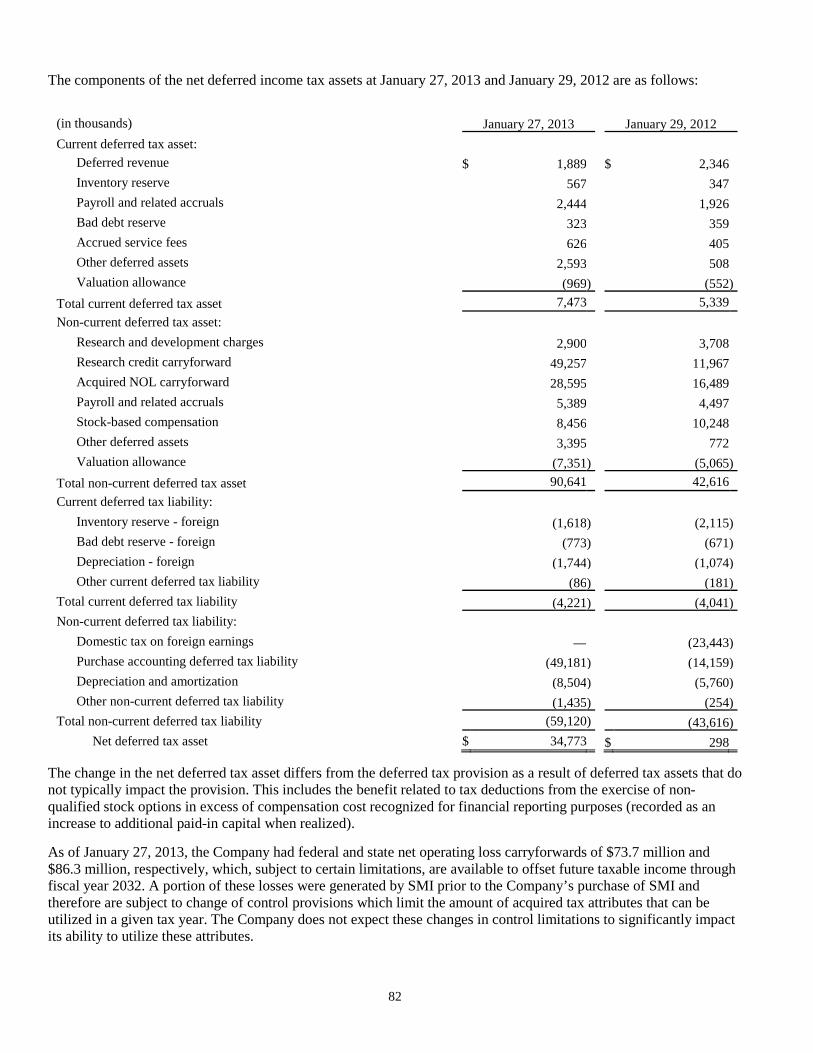
82
The components of the net deferred income tax assets at January 27, 2013 and January 29, 2012 are as follows:
(in thousands) January 27, 2013 January 29, 2012 Current deferred tax asset:
Deferred revenue $ 1,889 $ 2,346 Inventory reserve 567 347 Payroll and related accruals 2,444 1,926 Bad debt reserve 323 359 Accrued service fees 626 405 Other deferred assets 2,593 508 Valuation allowance (969 ) (552 )
Total current deferred tax asset 7,473 5,339 Non-current deferred tax asset:
Research and development charges 2,900 3,708 Research credit carryforward 49,257 11,967 Acquired NOL carryforward 28,595 16,489 Payroll and related accruals 5,389 4,497 Stock-based compensation 8,456 10,248 Other deferred assets 3,395 772 Valuation allowance (7,351 ) (5,065 )
Total non-current deferred tax asset 90,641 42,616 Current deferred tax liability:
Inventory reserve - foreign (1,618 ) (2,115 ) Bad debt reserve - foreign (773 ) (671 ) Depreciation - foreign (1,744 ) (1,074 ) Other current deferred tax liability (86 ) (181 )
Total current deferred tax liability (4,221 ) (4,041 ) Non-current deferred tax liability:
Domestic tax on foreign earnings — (23,443 ) Purchase accounting deferred tax liability (49,181 ) (14,159 ) Depreciation and amortization (8,504 ) (5,760 ) Other non-current deferred tax liability (1,435 ) (254 )
Total non-current deferred tax liability (59,120 ) (43,616 ) Net deferred tax asset $ 34,773 $ 298
The change in the net deferred tax asset differs from the deferred tax provision as a result of deferred tax assets that do not typically impact the provision. This includes the benefit related to tax deductions from the exercise of non-qualified stock options in excess of compensation cost recognized for financial reporting purposes (recorded as an increase to additional paid-in capital when realized).
As of January 27, 2013, the Company had federal and state net operating loss carryforwards of $73.7 million and $86.3 million, respectively, which, subject to certain limitations, are available to offset future taxable income through fiscal year 2032. A portion of these losses were generated by SMI prior to the Company’s purchase of SMI and therefore are subject to change of control provisions which limit the amount of acquired tax attributes that can be utilized in a given tax year. The Company does not expect these changes in control limitations to significantly impact its ability to utilize these attributes.

83
Included in the Company’s net operating loss carryforward deferred tax asset is approximately $8.3 million of deferred tax assets attributable to excess equity deductions related to stock awards that may not be included on the Company’s consolidated balance sheet. Due to a provision within ASC 740, concerning when tax benefits related to excess stock option deductions can be credited to paid-in capital, the portion of the Company’s deferred tax asset related to such excess tax benefits must be excluded from the deferred tax asset balance, even if the facts and circumstances indicate that it is more likely than not that the deferred tax asset can be realized. The deferred tax asset and the related credit to paid-in capital will only be included as the related deferred tax asset is applied to reduce taxes payable. As of January 27, 2013, the Company had gross federal and state research credits available of approximately $6.0 million and $12.3 million, respectively, which are available to offset taxable income. These credits will expire between fiscal years 2022 through 2033. As of January 27, 2013, the Company had federal Alternative Minimum Tax credits available of approximately $1.3 million. The Company also had Canadian research credits available of approximately $34.7 million. These credits will expire between fiscal years 2025 and 2033.
The Company has established valuation allowances against certain U.S. state and foreign deferred tax assets to reflect its concerns regarding the ability of the Company to generate sufficient taxable income to utilize these attributes. The following table summarizes the changes in these allowances during fiscal years 2013, 2012 and 2011:
Fiscal Year Ended (in thousands) January 27, 2013 January 29, 2012 January 30, 2011 Beginning balance $ 5,617 $ 5,053
$ 6,502 Additions 2,703 564
2,767 Releases — —
(4,216 ) Ending balance $ 8,320 $ 5,617
$ 5,053
Realization of the net deferred tax assets is dependent on generating sufficient taxable income during the periods in which temporary differences will reverse. Although realization is not assured, management believes it is more likely than not that the remaining net deferred tax assets will be realized. The amount of the net deferred tax assets considered realizable, however, could be adjusted in the near term if estimates of future taxable income during the reversal periods are revised. As of January 27, 2013, the Company had approximately $383.7 million of unremitted earnings related to the Company’s wholly owned foreign subsidiaries.
In the fourth quarter of fiscal year 2010, in connection with the SMI acquisition, the Company modified its previous assertion that all of its earnings were permanently reinvested offshore and concluded that $120.0 million of foreign earnings were not permanently reinvested offshore. Of this amount, $50.0 million was actually repatriated to the U.S., leaving $70.0 million of unrepatriated foreign subsidiary earnings.
In the first quarter of fiscal year 2013, in connection with the acquisition of Gennum, the Company reviewed its assertion regarding the amount of foreign subsidiary earnings that were considered to be permanently reinvested offshore and concluded that due to post-acquisition foreign operating cash needs, all of its foreign subsidiary earnings, including the aforementioned $70.0 million, are considered to be permanently reinvested offshore. This change in assertion resulted in the recognition of a one-time tax benefit of $23.4 million in the first quarter of fiscal year 2013.
Uncertain Tax Positions
The Company uses a two-step approach to recognize and measure uncertain tax positions (“UTP”). The first step is to evaluate the tax position for recognition by determining if the weight of available evidence indicates that it is more likely than not that the position will be sustained on audit, including resolution of related appeals or litigation

84
processes, if any. The second step is to measure the tax benefit as the largest amount that is more than 50% likely of being realized upon ultimate settlement.
A reconciliation of the beginning and ending amount of gross unrecognized tax benefits (before federal impact of state items) is as follows:
Fiscal Year Ended (in thousands) January 27, 2013 January 29, 2012 January 30, 2011 Beginning balance $ 13,759
$ 17,011 $ 13,795 Additions based on tax positions related to the current year 695
835 449 Additions for tax positions of prior years —
— 3,592 Reductions for tax positions of prior years (647 )
(4,087 ) — Reductions for settlements with tax authorities (663 )
— (825 ) Ending balance $ 13,144
$ 13,759 $ 17,011
Reductions recorded in the current year related to a release of previously recorded reserves for uncertain tax positions as a result of statutes of limitations for the taxing authority to challenge the position expiring and effective settlement of the position through examination.
Included in the balance of unrecognized tax benefits at January 27, 2013 and January 29, 2012, are $11.1 million and $11.6 million, respectively, of net tax benefits (after federal impact of state items) that, if recognized, would impact the effective tax rate.
The liability for uncertain tax positions is reflected on the consolidated balance sheets as follows:
Fiscal Year Ended (in thousands) January 27, 2013 January 29, 2012 Accrued liabilities $ 188 $ 437 Other long-term liabilities 10,887 11,159 Total accrued taxes $ 11,075 $ 11,596
The Company’s policy is to include net interest and penalties related to unrecognized tax benefits within the provision for taxes on the consolidated statements of income. During fiscal years 2013 and 2012, a net increase of $50,000 and $50,000 of interest and penalties was recognized in the consolidated statement of income, respectively. The Company had approximately $293,000 and $243,000 of net interest and penalties accrued at January 27, 2013 and January 29, 2012, respectively.
In the second quarter of fiscal year 2013, the overall statutory tax rate in Canada increased as a result of newly enacted tax legislation. The impact of this tax law change resulted in a $3.4 million discrete charge to the Canadian tax provision and a corresponding adjustment to the Company’s deferred tax liabilities.
As of January 27, 2013, it was reasonably possible that the total amounts of unrecognized tax benefits would decrease by up to $0.2 million within twelve months as a result of statutes of limitations for the taxing authority to challenge the position expiring. If recognized, this decrease will impact the effective tax rate.
Tax years prior to 2009 (the Company’s fiscal year 2010) are generally not subject to examination by the Internal Revenue Service (“IRS”) except for items involving tax attributes that have been carried forward to tax years whose statute of limitations remains open. The Company is currently under IRS audit for fiscal year 2010 and fiscal year 2011. For state returns, the Company is generally not subject to income tax examinations for years prior to 2008 (the Company’s fiscal year 2009). The Company has a primary significant tax presence in Switzerland for which Swiss tax filings have been examined through fiscal year 2010. The Company is also subject to routine examinations by various foreign tax jurisdictions in which it operates.

85
Note 15: Commitments and Contingencies Leases
The Company leases facilities and certain equipment under operating lease arrangements expiring in various years through fiscal year 2020. The aggregate minimum annual lease payments under leases in effect on January 27, 2013 are as follows: Minimum Annual Lease Payments (in thousands) Fiscal Year Ending: 2014 $ 8,743 2015 5,644 2016 4,625 2017 3,321 2018 3,140 Thereafter 11,383 Total minimum lease commitments $ 36,856
Rent expense was $7.9 million, $4.4 million and $4.4 million for fiscal years 2013, 2012 and 2011, respectively. The Company received $133,000, $0 and $158,000 of sub-lease income in fiscal years 2013, 2012 and 2011, respectively.
Vendor Commitments The Company has entered into multiple technology development agreements with one of its key wafer suppliers. Under the terms of these agreements, the Company is required to pay $1.2 million and $0.3 million for fiscal years 2014 and 2015, respectively.
Legal Matters From time to time in the ordinary course of its business, the Company is involved in various claims, litigation, and other legal actions that are normal to the nature of its business, including with respect to intellectual property, contract, product liability, employment, and environmental matters.
In accordance with accounting standards regarding loss contingencies, the Company accrues an undiscounted liability for those contingencies where the incurrence of a loss is probable and the amount can be reasonably estimated, and the Company discloses the amount accrued and the amount of a reasonably possible loss in excess of the amount accrued, if such disclosure is necessary for its financial statements not to be misleading. The Company does not record liabilities when the likelihood that the liability has been incurred is probable but the amount cannot be reasonably estimated, or when the liability is believed to be only reasonably possible or remote.
Because litigation outcomes are inherently unpredictable, the Company’s evaluation of legal proceedings often involves a series of complex assessments by management about future events and can rely heavily on estimates and assumptions. While the consequences of certain unresolved proceedings are not presently determinable, and an estimate of the probable and reasonably possible loss or range of loss in excess of amounts accrued for such proceedings cannot be reasonably made, an adverse outcome from such proceedings could have a material adverse effect on the Company’s earnings in any given reporting period. However, in the opinion of management, after consulting with legal counsel, and taking into account insurance coverage, any ultimate liability related to current outstanding claims and lawsuits, individually or in the aggregate, is not expected to have a material adverse effect on the Company’s financial statements, as a whole.

86
The Company’s currently pending legal matters of note are discussed below:
Environmental Matters. In 2001, the Company was notified by the California Department of Toxic Substances Control (“State”) that it may have liability associated with the clean-up of the one-third acre Davis Chemical Company site in Los Angeles, California. The Company has been included in the clean-up program because it was one of the companies that used the Davis Chemical Company site for waste recycling and/or disposal between 1949 and 1990. The Company joined with other potentially responsible parties and entered into a Consent Order with the State that required the group to perform a soils investigation at the site and submit a remediation plan. The State has approved the remediation plan, which completes the group’s obligations under the Consent Order. Although the Consent Order does not require the group to remediate the site and the State has indicated it intends to look to other parties for remediation, the State has not yet issued “no further action” letters to the group members. To date, the Company’s share of the group’s expenses has not been material and has been expensed as incurred. The Company has used an environmental firm, specializing in hydrogeology, to perform monitoring of the groundwater at the Company’s former facility in Newbury Park, California that was leased for approximately forty years. The Company vacated the building in May 2002. Certain contaminants have been found in the local groundwater and site soils. Groundwater monitoring results to date over a number of years indicate that groundwater contaminants are, in full or in material part, from adjacent facilities. Responsibility for soil contamination remains under investigation. The location of key soil contamination is concentrated in an area of an underground storage tank that the Company believes to have been installed and used in the early 1960s by a former tenant at the site who preceded the Company’s tenancy. There are no claims pending with respect to environmental matters at the Newbury Park site. The applicable regulatory agency having authority over the site issued joint instructions in November 2008, ordering the Company and the current owner of the site to perform additional assessments and surveys, and to create ongoing groundwater monitoring plans before any final regulatory action for “no further action” may be approved. In September 2009, the regulatory agency issued supplemental instructions to the Company and the current site owner regarding previously ordered site assessments, surveys and groundwater monitoring. Most recently, in November 2012, the regulatory agency added two more potentially responsible parties to the matter, based on historical evidence of past occupancy or operations at the site dating to the 1960s. In addition, the regulatory agency has issued draft cleanup and abatement orders to all the parties. Responses to the draft orders were submitted in a timely manner by all the parties in January 2013. The parties are expected to work cooperatively in responding to and determining the appropriate scope and extent of additional site investigative and categorization work, as well as in relation to any ultimate proposed clean up and abatement work.
The Company has accrued liabilities where it is probable that a loss will be incurred and the cost or amount of loss can be reasonably estimated. Based upon, and in anticipation of the likely outcome associated with the November 2012 draft cleanup and abatement order, the Company engaged an environmental firm to assist in an assessment of this site consistent with the direction of the draft order. Based on the Company’s preliminary assessment, it has determined a likely range of probable loss between $2.5 million and $5.7 million. Given the early nature of the draft clean up and abatement order and uncertainties associated with environmental assessment and the remediation activities, the Company is unable to determine a best estimate within the range of loss. Therefore, the Company recorded the minimum amount of $2.5 million in the third quarter of fiscal year 2013 under “Other long-term liabilities” on the consolidated balance sheets, and included in the consolidated statement of income under “Selling, general and administrative.” These estimates could change as a result of changes in planned remedial actions, further actions from the regulatory agency, remediation technology, and other factors.
V SEMICONDUCTOR LITIGATION
Gennum Corporation v. V Semiconductor Inc., et al. In a lawsuit filed by Gennum Corporation against V Semiconductor and the directors of V Semiconductor in the Ontario (Canada) Superior Court of Justice on February 3, 2012, the Company alleged that the defendants (i) misappropriated confidential information, (ii) had created and sold products based on the misappropriated confidential information (the “infringing products”), and (iii) had infringed copyright under applicable Canadian law to specified integrated circuit design scripts and related software code and design files (the “technology”). The Company also alleged that the individual named directors of V Semiconductor

87
were in breach of contract, had unlawfully interfered with the economic interests of the Company, and had breached common law duties owed by them to the Company. The Company sought confirmation that its copyright had been infringed, injunctive relief against further infringement and damages in connection with the alleged infringement and alleged breaches referenced above.
The allegations against the individual defendants arose from and relate to the named defendants’ prior involvement with Gennum as the principals in the sale to Gennum of the business from which the applicable technology at issue arose. Such defendants were also employees subsequent to their sale of the applicable company to Gennum prior to their resignation. V Semiconductor Inc. v. Semtech Corporation et al. A complaint was filed on April 27, 2012 in the U.S. District Court, Eastern District of Michigan, Southern Division, against the Company, certain current and former employees and one non-employee director (the “U.S. litigation”).
The Complaint alleged that the Company and the named individual defendants had, through acts leading up to and connected with the initiation and prosecution of the Gennum Corporation v. V Semiconductor Inc. et. al. litigation in Ontario, Canada discussed above (the “Canadian litigation”) acted in violation of U.S. and Michigan state law regarding restraint of trade by filing a “sham” lawsuit. The Complaint further alleged that the Company and the named individual defendants had conducted a malicious prosecution via the Canadian litigation, had tortiously interfered with prospective economic advantage and business expectations of V Semiconductor, had engaged in unfair competition, and, as for the non-employee director individually, breached non-disclosure and confidentiality obligations owed by the non-employee director to V Semiconductor.
The Complaint alleged that the defendants filed the Canadian litigation frivolously, without merit, without factual substance, and for the primary purposes of causing a pending acquisition of V Semiconductor to fail, causing current and prospective customers of V Semiconductor to cease or avoid doing business with V Semiconductor, and preventing competing and allegedly superior technology and products from entering the marketplace.
The Complaint sought permanent injunctive relief against the alleged anti-competitive and tortious conduct of the defendants, and sought economic and punitive damages from the defendants.
Settlement Status The parties to the Canadian litigation and U.S. litigation entered into a Confidential Settlement Agreement and Mutual Release, under which all claims in all suits have now been dismissed. The settlement was subject to the satisfaction of certain conditions, and became effective on or about September 7, 2012 following completion of the applicable conditions and contingencies. Pursuant to the settlement having become effective, the parties to the Canadian litigation and U.S. litigation have secured the dismissal and termination with prejudice of the applicable legal proceedings. The Company has not accrued any amounts in connection with the settlement.
Commercial Disputes The Company periodically is involved in disputes arising in the normal course of business regarding products or services provided to the Company by vendors or service providers. Historically, the cost of commercial disputes has been immaterial to the Company’s consolidated financial statements.
Product Warranties The Company’s general warranty policy provides for repair or replacement of defective parts. In some cases, a refund of the purchase price is offered. In certain instances the Company has agreed to other warranty terms, including some indemnification provisions. The product warranty accrual reflects the Company’s best estimate of probable liability under its product warranties. The Company accrues for known warranty issues if a loss is probable and can be reasonably estimated, and accrues

88
for estimated incurred but unidentified issues based on historical experience. Historically, warranty expense has been immaterial to the Company’s consolidated financial statements.
Retirement Plans The Company contributed $1.2 million, $1.2 million and $1.0 million, respectively, in fiscal years 2013, 2012 and 2011 to the 401(k) retirement plan maintained for its domestic employees.
The Company contributes to the CSEM Pension fund, a Swiss multiemployer plan, that provides pension benefits (the “Plan”). The Plan is a foundation into which several employers are affiliated. Benefits payable from the pension plan include retirement pension, death, and disability benefits. The risk of participating in this multiemployer plan is different from a single-employer plan due to the comingling of assets and related investment returns and risks and aggregation of actuarial experience and related gains or losses for allocation amongst participating employers; contributions pursuant to prescribed formulae consistent for all participating employers; and, in the event of a participating employer’s withdrawal from the Plan, retirees receiving benefits from the Plan remain within the Plan and will continue to receive future benefit payments funded by the remaining participating employers thereafter.
The Plan is administered on behalf of a labor union, which is similar to common practices found in the United States involving collective bargaining agreements and labor unions. EIN/Pension plan number, Pension protection act zone status, FIP/RP status and Form 5500 are not applicable as the Plan is a Swiss plan governed by pension laws in Switzerland. The Company contributed $0.8 million, $0.8 million and $0.8 million, respectively, in fiscal years 2013, 2012 and 2011 to the Plan. At the date the Company’s financial statements were issued, the Plan’s audited financial statements were not available for the Plan year ending in 2012.
In addition, the Company also contributed $1.5 million in fiscal year 2013 to a defined contribution plan for its employees in Canada.
Deferred Compensation The Company maintains a deferred compensation plan for certain officers and key executives that allow participants to defer a portion of their compensation for future distribution at various times permitted by the plan. This plan provides for a discretionary Company match up to a defined portion of the employee’s deferral, with any match subject to a vesting period. The following table shows the compensation expense and forfeitures under this plan for fiscal years 2013, 2012 and 2011:
Fiscal Year Ended (in thousands) January 27, 2013 January 29, 2012 January 30, 2011 Forfeitures $ — $ (194 ) $ (66 ) Compensation expense 1,839 885 2,166 Compensation expense, net of forfeitures $ 1,839 $ 691 $ 2,100
The Company’s liability for deferred compensation plan for certain officers and key executives is presented below:
(in thousands) January 27, 2013 January 29, 2012 Accrued liabilities $ 530
$ 901 Other long-term liabilities 13,396
10,222 Total deferred compensation liabilities under this plan $ 13,926
$ 11,123
Additionally, pursuant to the earn-out arrangement with Cycleo stockholders, the Company potentially may make payments totaling up to approximately $16 million based on the achievement of a combination of certain revenue and operating income milestones by Cycleo over the period of 4 years beginning on April 30, 2012. For certain of the

89
Cycleo stockholders, payment of the earn-out liability is contingent upon employment at the end of the 4-year period and is accounted for as post-acquisition compensation expense over the service period. The portion of the earn-out liability that is not dependent on continued employment is included in the purchase price allocation at March 7, 2012. During the fiscal year ended January 27, 2013, the Company recognized $1.8 million of compensation expense related to the deferred compensation liability.
The Company has purchased whole life insurance on the lives of certain current deferred compensation plan participants. This Company-owned life insurance is held in a grantor trust and is intended to cover a majority of the Company’s costs of the deferred compensation plan. The cash surrender value of the Company-owned life insurance was $10.0 million and $10.2 million as of January 27, 2013 and January 29, 2012, respectively, and is included in “Other assets” on the consolidated balance sheet.
Indemnification The Company has entered into agreements with its current executive officers and directors indemnifying them against certain liabilities incurred in connection with the performance of their duties. The Company’s Certificate of Incorporation and Bylaws contain comparable indemnification obligations with respect to the Company’s current directors and employees.
Note 16: Geographic Information and Concentration of Risk The Company operates exclusively in the semiconductor industry and primarily within the analog and mixed-signal sector.
The table below provides net sales activity by product line on a comparative basis for all periods. As a result of the acquisition of Gennum and Cycleo (see Note 3) in March 2012, the Company formed a separate Gennum product line while Cycleo is part of the Wireless and Sensing product line.
Fiscal Year Ended (in thousands, except percentages) January 27, 2013 January 29, 2012 January 30, 2011 Advanced Communications $ 133,533 23 % $ 139,695 29 % $ 112,019 25 % Wireless and Sensing 50,444 9 % 57,124 12 % 59,107 13 % Power Management and High Reliability 66,427 12 % 74,056 15 % 87,693 19 % Protection 198,866 34 % 209,726 44 % 195,683 43 % Gennum 129,557 22 % — — % — — %
Total net sales $ 578,827 100 % $ 480,601
100 % $ 454,502 100 %
Net sales activity by geographic region is as follows:
Fiscal Year Ended (in thousands, except percentages) January 27, 2013 January 29, 2012 January 30, 2011 North America $ 98,401 17 % $ 114,552 24 % $ 112,404 25 % Asia-Pacific 405,179 70 % 298,477 62 % 272,079 60 % Europe 75,247 13 % 67,572 14 % 70,019 15 %
Total net sales $ 578,827 100 % $ 480,601 100 % $ 454,502 100 %

90
The Company generally attributes sales to a country based on the ship-to address. The table below summarizes sales activity to countries that represented greater than 10% of total net sales for at least one of the periods indicated:
Fiscal Year Ended (percentage of total sales) January 27, 2013 January 29, 2012 January 30, 2011 United States 17 % 20 % 23 % China (including Hong Kong) 35 % 38 % 34 % Japan 10 % 8 % 7 % South Korea 7 % 8 % 10 %
Total net sales 69 % 74 % 74 %
The Company’s regional income (loss) from continuing operations before income taxes is as follows:
Fiscal Year Ended
(in thousands) January 27,
2013 January 29,
2012 January 30,
2011 Domestic $ (19,867 ) $ (3,070 ) $ (12,540 ) Foreign 20,116 97,249 91,872
Total $ 249 $ 94,179 $ 79,332
Domestic (loss) from continuing operations includes amortization of acquired intangible assets, litigation related expenses and higher levels of stock-based compensation compared to foreign operations.
Long-lived Assets Long-lived assets which consist of property, plant and equipment, net of accumulated depreciation are summarized as follows:
(in thousands) January 27, 2013 January 29, 2012 Located within the United States $ 53,858
$ 47,612 Located outside the United States 47,979
22,101 $ 101,837 $ 69,713
Some of these assets are at locations owned or operated by the Company’s suppliers. The Company has consigned certain equipment to a foundry based in China to support its specialized processes run at the foundry. The Company has also installed its own equipment at some of its packaging and testing subcontractors in order to ensure a certain level of capacity, assuming the subcontractor has ample employees to operate the equipment.
The amount of equipment and machinery consigned to a foundry in China was $7.9 million and $9.4 million as of January 27, 2013 and January 29, 2012, respectively.
Significant Customers Sales to the Company’s customers are generally made on open account, subject to credit limits the Company may impose, and the receivables are subject to the risk of being uncollectible.

91
Each of the following significant customers accounted for at least 10% of net sales for at least one of the periods indicated:
Fiscal Year Ended
(percentage of net sales) January 27,
2013 January 29,
2012 January 30,
2011 Samsung Electronics (and affiliates) 12 % 13 % 12 % Huawei Technologies (and affiliates) 10 % 7 % 8 % Frontek Technology Corp 6 % 10 % 11 %
The following table shows the list of customers that have an outstanding receivable balance that represents at least 10% of total net receivables for at least one of the periods indicated:
Balance as of (percentage of net accounts receivable) January 27, 2013 January 29, 2012 Huawei Technologies (and affiliates) 14 % 11 % Samsung Electronics (and affiliates) 12 % 14 % Frontek Technology Corp 4 % 10 % Dragon Technology 3 % 11 %
Outside Subcontractors and Suppliers The Company relies on a limited number of outside subcontractors and suppliers for the production of silicon wafers, packaging and certain other tasks. Disruption or termination of supply sources or subcontractors, due to natural disasters such as an earthquake or other causes, could delay shipments and could have a material adverse effect on the Company. Although there are generally alternate sources for these materials and services, qualification of the alternate sources could cause delays sufficient to have a material adverse effect on the Company. Several of the Company’s outside subcontractors and suppliers, including third-party foundries that supply silicon wafers, are located in foreign countries, including China, Taiwan, Canada, Europe and Israel. The Company’s largest source of silicon wafers is an outside foundry located in China and a significant amount of the Company’s assembly and test operations are conducted by third-party contractors in China, Malaysia, Korea and the Philippines. Note 17: Reorganization Costs During fiscal year 2013, reorganization costs mainly represent the severance costs associated with the integration of the acquired Gennum business with the Company’s pre-existing business and the consolidation of certain operations of the combined Company. During the third quarter of fiscal year 2012, the Company initiated a reorganization plan which resulted in a consolidation of research and development activities and a reduction of its workforce. There was no reorganization cost in fiscal year 2011.

92
The following table summarizes the reorganization charges incurred and liability balance included in “Accrued liabilities” on the consolidated balance sheet as of January 30, 2011, January 29, 2012 and January 27, 2013. The reorganization charges below were included in “Selling, general and administrative” on the consolidated statements of income for the respective periods.
(in thousands) Severance and related costs Balance at January 30, 2011 $ — Reorganization charges 1,981 Cash payments (1,965 ) Balance at January 29, 2012 16 Reorganization charges 13,387 Cash payments (12,073 ) Balance at January 27, 2013 $ 1,330
Note 18: Stock Repurchase Program and Shares Withheld from Vested Restricted Shares On March 4, 2008, the Company announced that its Board of Directors authorized the repurchase of up to $50 million of the Company’s common stock from time to time through negotiated or open market transactions (the “2008 Program”). The 2008 Program does not have an expiration date. On August 24, 2011, the Company announced a $36 million expansion of the 2008 Program. On November 30, 2011, the Company announced an additional $50 million expansion of the 2008 Program.
In addition to repurchase activity under the 2008 Program, the Company typically withholds shares from vested restricted stock to pay employee payroll and income tax withholding liabilities.
The following table summarizes the stock repurchase activities and shares withheld from vested restricted shares during the periods indicated: Fiscal Year Ended January 27, 2013 January 29, 2012 January 30, 2011 (in thousands, except number of shares) Shares Value Shares Value Shares Value Shares repurchased under the 2008 Program 263,443 $ 7,500 2,252,099 $ 50,000 74,702 $ 1,258 Shares withheld from vested restricted shares 9,696 269 27,427 665 89,934 1,561 Total treasury shares acquired 273,139 $ 7,769 2,279,526 $ 50,665 164,636 $ 2,819
The Company currently intends to hold the repurchased and withheld shares as treasury stock. The Company typically reissues treasury shares to settle stock option exercises and restricted share grants.
Note 19: Recent Accounting Pronouncements In February 2013, the FASB issued an accounting standards update regarding the reporting of reclassifications out of accumulated other comprehensive income. This update, which will be effective prospectively for reporting periods beginning after December 15, 2012, requires disclosure of amounts reclassified out of accumulated other comprehensive income by component. In addition, an entity is required to present either on the face of the statement of operations or in the notes, significant amounts reclassified out of accumulated other comprehensive income by the respective line items of net income but only if the amount reclassified is required to be reclassified to net income in its entirety in the same reporting period. For amounts not reclassified in their entirety to net income, an entity is required to cross-reference to other disclosures that provide additional detail about those amounts. The Company will adopt the disclosure requirements of this update for the quarter ending April 28, 2013.

93
Note 20: Selected Quarterly Financial Data (Unaudited) The following tables set forth the Company’s unaudited consolidated statements of income data for each of the eight quarterly periods ended January 27, 2013, as well as that data expressed as a percentage of the Company’s net sales for the quarters presented. The sum of quarterly per share amounts may differ from year to date amounts due to rounding.
Selected Quarterly Financial Data (Unaudited)
April 29, July 29, October 28, January 27, May 1, July 31, October 30, January 29,2012 2012 2012 2013 2011 2011 2011 2012
Net sales $116,642 $150,704 $ 160,878 $ 150,603 $ 122,371 $130,254 $ 123,944 $ 104,032 Cost of sales 61,305 76,179 64,085 62,646 48,517 51,534 50,537 44,368 Gross profit 55,337 74,525 96,793 87,957 73,854 78,720 73,407 59,664 Operating costs & expenses:Selling, general & administrative 44,818 31,220 35,646 37,386 26,705 22,481 25,110 26,333 Product development & engineering 24,083 32,613 33,354 29,959 18,525 22,228 20,489 19,335 Intangible amortization & impairments 5,578 7,977 8,212 8,177 2,102 2,103 4,573 2,075 Total operating costs & expenses 74,479 71,810 77,212 75,522 47,332 46,812 50,172 47,743 Operating (loss) income (19,142) 2,715 19,581 12,435 26,522 31,908 23,235 11,921 Interest expense (1,843) (4,194) (4,172) (4,154) — — — — Interest income & other (expense) income, net 214 162 (1,071) (282) (440) (117) 729 421 (Loss) income before taxes (20,771) (1,317) 14,338 7,999 26,082 31,791 23,964 12,342 (Benefit) provision for taxes (22,980) (11,339) (2,252) (5,119) 3,500 4,653 (3,015) (46)Net Income $ 2,209 $ 10,022 $ 16,590 $ 13,118 $ 22,582 $ 27,138 $ 26,979 $ 12,388 Earnings per share:
Basic $ 0.03 $ 0.15 $ 0.25 $ 0.20 $ 0.35 $ 0.41 $ 0.41 $ 0.19 Diluted $ 0.03 $ 0.15 $ 0.25 $ 0.19 $ 0.34 $ 0.40 $ 0.40 $ 0.19
Weighted average number of shares used in computing earnings per share:
Basic 65,282 65,587 65,996 66,371 64,552 65,547 65,440 64,856Diluted 67,233 67,165 67,465 67,984 67,123 68,186 67,314 66,776
Fiscal Year 2013 Fiscal Year 2012Quarters Ended Quarters Ended
(in thousands, except per share amounts)

94
Item 9. Changes in and Disagreements With Accountants on Accounting and Financial Disclosure Not applicable. Item 9A. Controls and Procedures Disclosure Controls and Procedures The Company carried out an evaluation, under the supervision and with the participation of the Chief Executive Officer and Chief Financial Officer, of the effectiveness of the Company’s disclosure controls and procedures (as defined in Rules 13a-15(e) and 15d-15(e)) as of January 27, 2013. Based on that evaluation, the Company’s Chief Executive Officer and Chief Financial Officer have concluded that such disclosure controls and procedures were effective as of such date.
Changes in Internal Controls On March 20, 2012, the Company, through its wholly-owned subsidiary Semtech Canada Inc., completed the acquisition of all outstanding equity interests of Gennum, which operated under its own set of systems and internal controls. As of January 27, 2013, we completed transitioning Gennum’s processes to our internal control processes. Other than with respect to our transition of Gennum to our systems and control environment as described above, during the quarter ended January 27, 2013, there was no change in our internal control over financial reporting identified in connection with the evaluation required by paragraph (d) of Rule 13a-15 or Rule 15d-15 that has materially affected, or is reasonably likely to materially affect, our internal control over financial reporting.
Report of Management on Internal Control Over Financial Reporting Our management is responsible for establishing and maintaining adequate internal control over financial reporting, as such term is defined in Exchange Act Rules 13a-15(f) and 15d-15(f). Under the supervision and with the participation of our management, including our principal executive officer and principal financial officer, we conducted an
April 29, July 29, October 28, January 27, May 1, July 31, October 30, January 29,2012 2012 2012 2013 2011 2011 2011 2012
Net sales 100% 100% 100% 100% 100% 100% 100% 100%Cost of sales 53% 50% 40% 42% 40% 40% 41% 43%Gross profit 47% 50% 60% 58% 60% 60% 59% 57%Operating costs & expenses:Selling, general & administrative 38% 21% 22% 25% 22% 17% 20% 25%Product development & engineering 21% 22% 21% 20% 15% 17% 17% 19%Intangible amortization & impairments 5% 5% 5% 5% 2% 2% 4% 2%Total operating costs & expenses 64% 48% 48% 50% 39% 36% 41% 46%Operating (loss) income (17)% 2% 12% 8% 22% 24% 19% 11%Interest expense (2)% (3)% (3)% (3)% 0% 0% 0% 0%Interest income & other (expense) income, net 0% 0% (1)% 0% 0% 0% 1% 0%(Loss) income before taxes (19)% (1)% 8% 5% 22% 24% 20% 11%(Benefit) provision for taxes (20)% (8)% (1)% (3)% 3% 4% (2)% 0%Net Income 1% 7% 9% 8% 19% 20% 22% 11%
Fiscal Year 2012Quarters Ended
Fiscal Year 2013Quarters Ended

95
evaluation of the effectiveness of our internal control over financial reporting based on the framework set forth in Internal Control - Integrated Framework issued by the Committee of Sponsoring Organizations of the Treadway Commission. Based on our evaluation under the framework in Internal Control – Integrated Framework, our management has concluded that as of January 27, 2013 the Company’s internal control over financial reporting was effective to provide reasonable assurance regarding the reliability of financial reporting and the preparation of financial statements for external purposes in accordance with generally accepted accounting principles.
Ernst & Young LLP, the independent registered public accounting firm that audited the consolidated financial statements included in this report, has issued an attestation report on our internal control over financial reporting as of January 27, 2013. Ernst & Young LLP’s attestation report is included below.

96
Report of Independent Registered Public Accounting Firm
The Board of Directors and Stockholders of Semtech Corporation
We have audited Semtech Corporation and subsidiaries’ internal control over financial reporting as of January 27, 2013, based on criteria established in Internal Control-Integrated Framework issued by the Committee of Sponsoring Organizations of the Treadway Commission (the COSO criteria). Semtech Corporation and subsidiaries' management is responsible for maintaining effective internal control over financial reporting, and for its assessment of the effectiveness of internal control over financial reporting included in the accompanying Report of Management on Internal Control Over Financial Reporting. Our responsibility is to express an opinion on the company's internal control over financial reporting based on our audit. We conducted our audit in accordance with the standards of the Public Company Accounting Oversight Board (United States). Those standards require that we plan and perform the audit to obtain reasonable assurance about whether effective internal control over financial reporting was maintained in all material respects. Our audit included obtaining an understanding of internal control over financial reporting, assessing the risk that a material weakness exists, testing and evaluating the design and operating effectiveness of internal control based on the assessed risk, and performing such other procedures as we considered necessary in the circumstances. We believe that our audit provides a reasonable basis for our opinion. A company's internal control over financial reporting is a process designed to provide reasonable assurance regarding the reliability of financial reporting and the preparation of financial statements for external purposes in accordance with generally accepted accounting principles. A company's internal control over financial reporting includes those policies and procedures that (1) pertain to the maintenance of records that, in reasonable detail, accurately and fairly reflect the transactions and dispositions of the assets of the company; (2) provide reasonable assurance that transactions are recorded as necessary to permit preparation of financial statements in accordance with generally accepted accounting principles, and that receipts and expenditures of the company are being made only in accordance with authorizations of management and directors of the company; and (3) provide reasonable assurance regarding prevention or timely detection of unauthorized acquisition, use or disposition of the company's assets that could have a material effect on the financial statements. Because of its inherent limitations, internal control over financial reporting may not prevent or detect misstatements. Also, projections of any evaluation of effectiveness to future periods are subject to the risk that controls may become inadequate because of changes in conditions, or that the degree of compliance with the policies or procedures may deteriorate. In our opinion, Semtech Corporation and subsidiaries maintained, in all material respects, effective internal control over financial reporting as of January 27, 2013, based on the COSO criteria. We also have audited, in accordance with the standards of the Public Company Accounting Oversight Board (United States), the consolidated balance sheets of Semtech Corporation and subsidiaries as of January 27, 2013 and January 29, 2012, and the related consolidated statements of income, comprehensive income, stockholders' equity, and cash flows for each of the three years in the period ended January 27, 2013 and the financial statement schedule listed in the Index at Item 15(a) of Semtech Corporation and subsidiaries and our report dated March 28, 2013, expressed an unqualified opinion thereon.
/s/ Ernst & Young LLP
Los Angeles, California
March 28, 2013

97
Item 9B. Other Information We believe that all information that was required to be disclosed in a report on Form 8-K during the fourth quarter of fiscal year 2013 was reported on a Form 8-K during that period.
PART III Item 10. Directors, Executive Officers and Corporate Governance We have adopted a written Code of Conduct that applies to everyone in the Company, including our Chief Executive Officer, Chief Financial Officer and Controller. Our Code of Conduct serves as our written code of ethics for those officers, and for persons performing similar functions. Our current Code of Conduct is incorporated in this Annual Report on Form 10-K for fiscal year 2013 as Exhibit 14. The Code of Conduct is also available at the Corporate Governance section of the Investors page on our website at www.semtech.com. Alternatively, you can request a copy of the Code of Conduct free of charge by sending a written request to the Company’s Secretary at 200 Flynn Road, Camarillo, CA 93012. If we make any substantive amendments to the Code of Conduct or grant any waiver, including an implicit waiver, from the Code of Conduct to our Chief Executive Officer, Chief Financial Officer or Controller, we will within four business days of the event disclose the nature of the amendment or waiver on our website or in a report on Form 8-K.
The information relating to our directors, our nominees for directors, and our executive officers pursuant to Items 401; and Item 407(c)(3), (d)(4) and (d)(5) of Regulation S-K required by this item will be contained under the caption “Proposal 1: Election of Directors” in our Definitive Proxy Statement relating to our annual meeting of stockholders to be held on June 20, 2013, to be filed with the SEC pursuant to Regulation 14A of the Exchange Act and is hereby specifically incorporated by reference thereto.
The information required pursuant to Item 405 of Regulation S-K will be contained under the caption “Section 16(a) Beneficial Ownership Reporting Compliance” in our Definitive Proxy Statement relating to our annual meeting of stockholders, to be held on June 20, 2013, to be filed with the SEC pursuant to Regulation 14A of the Exchange Act and is hereby specifically incorporated by reference thereto. Item 11. Executive Compensation The information required under this item will appear under the captions “Director Compensation,” “Compensation Discussion and Analysis”, “Executive Compensation” and related discussion and disclosure thereto, in the Definitive Proxy Statement relating to our annual meeting of stockholders to be held on June 20, 2013, to be filed by us with the SEC pursuant to Regulation 14A of the Exchange Act, and is hereby specifically incorporated herein by reference thereto. Item 12. Security Ownership of Certain Beneficial Owners and Management and Related Stockholder Matters The information required under this item will appear under the captions “Beneficial Ownership of Securities,” “Securities Authorized for Issuance under Equity Compensation Plans” and related discussion and disclosure thereto, in the Definitive Proxy Statement relating to our annual meeting of stockholders to be held on June 20, 2013, to be filed by us with the SEC pursuant to Regulation 14A of the Exchange Act, and is hereby specifically incorporated herein by reference thereto. Item 13. Certain Relationships and Related Transactions, and Director Independence The information required under this item will appear under the captions “Election of Directors (Proposal Number 1)” “Corporate Governance, Transactions with Related Parties” and related discussion and disclosure thereto, in the Definitive Proxy Statement relating to our annual meeting of stockholders to be held on June 20, 2013, to be filed by us with the SEC pursuant to Regulation 14A of the Exchange Act, and is hereby specifically incorporated herein by reference thereto.

98
Item 14. Principal Accounting Fees and Services The information required under this item will appear under the captions “Independent Accountant Fees,” and “Policy on Audit Committee Pre-Approval of Audit and Permissible Non-Audit Services” and related discussion and disclosure thereto, in the Definitive Proxy Statement relating to our annual meeting of stockholders to be held on June 20, 2013, to be filed by us with the SEC pursuant to Regulation 14A of the Exchange Act, and is hereby specifically incorporated herein by reference thereto.
PART IV
Item 15. Exhibits, Financial Statement Schedules (a)(1) The financial statements, schedules, and reports included in this Form 10-K are listed in the index under
Item 8 in this report.
(a)(2) Schedules other than those listed in Item 8 are omitted since they are not applicable, not required, or the information required to be set forth herein is included in the consolidated financial statements or notes thereto.
SCHEDULE II
SEMTECH CORPORATION AND SUBSIDIARIES SCHEDULE II - VALUATION AND QUALIFYING ACCOUNTS
THREE YEARS ENDED JANUARY 27, 2013
Balance at
Beginning of Year Charged (Reversal) to Costs and Expenses Deductions
Balance at End of Year
Year ended January 30, 2011 Allowance for doubtful accounts $ 1,302,000
$ 53,924 $ (247,703 ) $ 1,108,221
Year ended January 29, 2012 Allowance for doubtful accounts $ 1,108,221 $ 332,154
$ (887,500 ) $ 552,875 Year ended January 27, 2013
Allowance for doubtful accounts $ 552,875 $ 40,820 $ — $ 593,695
(a)(3) Exhibits. These exhibits are available without charge upon written request directed to the Company’s Secretary at 200 Flynn Road, Camarillo, CA 93012. Documents that are not physically filed with this report are incorporated herein by reference to the location indicated.

99
Exhibit No.
Description
Location
2.1
Agreement and Plan of Merger, dated November 18, 2009, by and among Semtech Corporation, Sierra Monolithics, Inc., SMI Merger Corp. and Shareholder Representative Services
Exhibit 2.1 to the Company’s Current Report on Form 8-K filed December 15, 2009
2.2
First Amendment to Agreement and Plan of Merger, dated December 9, 2009, by and among Semtech Corporation, Sierra Monolithics, Inc., SMI Merger Corp. and Shareholder Representative Services
Exhibit 10.1 to the Company’s Current Report on Form 8-K filed December 15, 2009
2.3
Arrangement Agreement, dated as of January 23, 2012, among Semtech Corporation, Semtech Canada Inc. and Gennum Corporation
Exhibit 2.1 to the Company’s Amendment No. 1 to the Current Report on Form 8-K/A/ filed January 26, 2012
3.1
Restated Certificate of Incorporation of Semtech Corporation
Exhibit 3.1 to the Company’s Quarterly Report on Form 10-Q for the quarterly period ended October 26, 2003
3.2
Bylaws of Semtech Corporation
Exhibit 3.2 to the Company’s Annual Report on Form 10-K for the fiscal year ended January 27, 2008
10.1 * The Company’s Long-Term Stock Incentive Plan, as amended
and restated
Exhibit 10.6 to the Company’s Annual Report on Form 10-K for the fiscal year ended January 28, 2007
10.2 * The Company’s Non-Director and Non-Executive Officer Long-
Term Stock Incentive Plan, as amended and restated
Exhibit 10.4 to the Company’s Quarterly Report on Form 10-Q/A for the quarterly period ended October 29, 2006
10.3 * Form of Long Term Stock Incentive Plan Award Agreement for
Options Awarded to Non-Employee Directors on December 5, 2002
Exhibit 10.2 to the Company’s Quarterly Report on Form 10-Q for the quarterly period ended October 27, 2002
10.4 * Form of Long-Term Stock Incentive Plan Award Agreement
(Non-Employee Directors)
Exhibit 10.1 to the Company’s Current Report on Form 8-K filed July 7, 2006
10.5 * Form of Long-Term Stock Incentive Plan Award Agreement
(Executive Officers)
Exhibit 10.2 to the Company’s Quarterly Report on Form 10-Q for the quarterly period ended July 25, 2004
10.6 * Form of Non-Director and Non-Executive Officer Long-Term
Stock Incentive Plan Award Agreement
Exhibit 10.3 to the Company’s Quarterly Report on Form 10-Q for the quarterly period ended July 25, 2004
10.7 * Form of Long-Term Stock Incentive Plan Award Certificate
Exhibit 10.1 to the Company’s Quarterly Report on Form 10-Q/A for the quarterly period ended October 29, 2006
10.8 * Form of Non-Director and Non-Executive Officer Long-Term
Stock Incentive Plan Award Certificate
Exhibit 10.2 to the Company’s Quarterly Report on Form 10-Q/A for the quarterly period ended October 29, 2006

100
10.9 * Adoption Agreement adopting The Executive Nonqualified “Excess” Plan (known as the Semtech Executive Compensation Plan) as amended and restated effective January 1, 2005
Exhibit 10.11 to the Company’s Quarterly Report on Form 10-Q for the quarterly period ended July 29, 2007
10.10 * Amended and Restated Plan Document for The Executive
Nonqualified “Excess” Plan (known as the Semtech Executive Compensation Plan), effective January 1, 2005
Exhibit 10.12 to the Company’s Quarterly Report on Form 10-Q for the quarterly period ended July 29, 2007
10.11
Trust Agreement dated as of January 1, 2004 between Semtech Corporation and Bankers Trust Company, as Trustee, related to the Semtech Executive Compensation Plan
Exhibit 10.14 to the Company’s Annual Report on Form 10-K for the fiscal year ended January 25, 2004
10.12
Form of Indemnification Agreement for Directors and Executive Officers
Exhibit 10.1 to the Company’s Current Report on Form 8-K filed November 24, 2010
10.13 * Semtech Corporation Bonus Plan, amended and restated effective
January 29, 2007 (also known as the “Executive Bonus Plan”)
Exhibit 10.1 to the Company’s Current Report on Form 8-K filed June 12, 2007
10.14 * Employment Offer Letter to Mohan Maheswaran, accepted as of
March 12, 2006
Exhibit 10.1 to the Company’s Current Report on Form 8-K filed March 14, 2006
10.15 * Employment Offer Letter to Emeka Chukwu, accepted as of
November 11, 2006
Exhibit 10.26 to the Company’s Annual Report on Form 10-K for the fiscal year ended January 28, 2007
10.16 * Memo to Emeka Chukwu dated, April 5, 2007
Exhibit 10.27 to the Company’s Annual Report on Form 10-K for the fiscal year ended January 28, 2007
10.17 * Form of Long-Term Stock Incentive Plan Option Award
Certificate
Exhibit 10.2 to the Company’s Current Report on Form 8-K filed June 12, 2007
10.18 * Form of Long-Term Stock Incentive Plan Restricted Stock Award
Certificate
Exhibit 10.3 to the Company’s Current Report on Form 8-K filed June 12, 2007
10.19 * Form of Long-Term Stock Incentive Plan Performance Unit
Award Certificate
Exhibit 10.4 to the Company’s Current Report on Form 8-K filed June 12, 2007
10.20 * Form of Long-Term Stock Incentive Plan Option Award
Certificate (Non-Employee Directors)
Exhibit 10.5 to the Company’s Current Report on Form 8-K filed June 12, 2007
10.21 * Form of Long-Term Stock Incentive Plan Non-Employee Director
Stock Unit Award Certificate
Exhibit 10.1 to the Company’s Current Report on Form 8-K filed June 19, 2007
10.22 * Form of Long-Term Stock Incentive Plan Restricted Stock Unit
Award Certificate
Exhibit 10.1 to the Company’s Current Report on Form 8-K filed March 20, 2008
10.23
Semtech Corporation Executive Stock Ownership Guidelines
Exhibit 10.39 to the Company’s Annual Report on Form 10-K for the fiscal year ended January 27, 2008

101
10.24
Semtech Corporation Director Stock Ownership Guidelines
Exhibit 10.7 to the Company’s Current Report on Form 8-K filed on July 1, 2008
10.25 * Semtech Corporation 2008 Long-Term Equity Incentive Plan
Exhibit 10.40 to the Company’s Annual Report on Form 10-K for the fiscal year ended January 27, 2008
10.26 * Restricted Stock Unit Award Agreement Cycleo Acquisition
Exhibit 10.26 to the Company's Annual Report on Form 10-K for the fiscal year ended January 29, 2012
10.27
Form of Semtech Corporation 2008 Long-Term Equity Incentive Plan Option Award Agreement for Non-Employee Directors
Exhibit 10.3 to the Company’s Current Report on Form 8-K filed July 1, 2008
10.28
Form of Semtech Corporation 2008 Long-Term Equity Incentive Plan Option Award Agreement for Non-Employee Directors
Exhibit 10.4 to the Company’s Current Report on Form 8-K filed July 1, 2008
10.29 * Form of Semtech Corporation 2008 Long-Term Equity Incentive
Plan Option Award Agreement for Non-Employee Directors
Exhibit 10.5 to the Company’s Current Report on Form 8-K filed July 1, 2008
10.30 * Form of Semtech Corporation 2008 Long-Term Equity Incentive
Plan Option Award Agreement for Non-Employee Directors
Exhibit 10.5 to the Company’s Quarterly Report on Form 10-Q for the quarter ended May 1, 2011
10.31 * Semtech Corporation Chief Executive Officer Bonus Plan, as
amended on February 28, 2012
Exhibit 10.31 to the Company's Annual Report on Form 10-K for the fiscal year ended January 29, 2012.
10.32 * Semtech Corporation 2007 SMI Assumed Plan
Exhibit 4.3 to the Company’s Registration Statement on Form S-8, Registration No. 333-163780, filed on December 16, 2009
10.33 * Semtech Corporation 2000 SMI Assumed Plan
Exhibit 4.2 to the Company’s Registration Statement on Form S-8, Registration No. 333-163780, filed on December 16, 2009
10.34 * Semtech Corporation 2009 Long-Term Equity Inducement Plan
Exhibit 10.2 to the Company’s Current Report on Form 8-K filed December 15, 2009
10.35 * Form of Semtech Corporation 2009 Long-Term Equity
Inducement Plan Award Agreements (Performance-Based Vesting)
Exhibit 10.37 to the Company’s Annual Report on Form 10-K for the fiscal year ended January 31, 2010
10.36 * Form of Semtech Corporation 2009 Long-Term Equity
Inducement Plan Award Agreements (Time-Based Vesting)
Exhibit 10.38 to the Company’s Annual Report on Form 10-K for the fiscal year ended January 31, 2010
10.37 * Restricted Stock Award Agreement dated March 29, 2010 with
respect to time-based restricted stock award to Mohan Maheswaran
Exhibit 10.1 to the Company’s Current Report on Form 8-K filed March 31, 2011
10.38
Master Confirmation dated May 30, 2007 between Semtech Corporation and Goldman, Sachs & Co.
Exhibit 10.1 to the Company’s Current Report on Form 8-K filed June 1, 2007

102
10.39
Supplemental Confirmation dated May 30, 2007 between Semtech Corporation and Goldman, Sachs & Co.
Exhibit 10.2 to the Company’s Current Report on Form 8-K filed June 1, 2007
10.40 * Semtech Corporation Executive Change in Control Retention Plan
Exhibit 10.1 to the Company’s Current Report on Form 8-K filed on October 1, 2010
10.41 * Amended and Restated Semtech Corporation Executive Change
in Control Retention Plan
Exhibit 10.1 to the Company’s Quarterly Report on Form 10-Q for the quarter ended May 1, 2011
10.42 * Form of Participation Agreement under the Semtech Corporation
Executive Change in Control Retention Plan for non-Swiss employees
Exhibit 10.2 to the Company’s Current Report on Form 8-K filed on October 1, 2010
10.43 * Form of Participation Agreement under the Semtech Corporation
Executive Change in Control Retention Plan for Swiss employees
Exhibit 10.3 to the Company’s Current Report on Form 8-K filed on October 1, 2010
10.44 * Semtech Nonqualified Executive Compensation Plan Adoption
Agreement and Plan Document, as amended and restated effective October 12, 2007
Exhibit 10.1 to the Company’s Quarterly Report on Form 10-Q for the quarter ended July 31, 2011
10.45 Credit Agreement dated March 20, 2012 entered into among
Semtech Corporation, the lenders referred to therein and Jefferies Finance LLC. as administrative agent
Exhibit 10.1 to our Current Report on Form 8-K filed on March 23, 2012
10.46 Severance and Release Agreement, effective as of September 20,
2012, between Semtech Corporation and David Schie Exhibit 10.1 to our Current Report on Form 8-K filed on September 21, 2012
10.47 Policy Regarding Director Compensation
Exhibit 10.45 to the Company’s Annual Report on Form 10-K for the fiscal year ended January 29, 2012
10.48 * Semtech Corporation Chief Executive Officer Bonus Plan, effective
January 28, 2013 Filed herewith
14
Semtech Corporation Code of Conduct
Exhibit 14.1 to the Company’s Current Report on Form 8-K filed June 25, 2010
21.1
Subsidiaries of the Company
Filed herewith
23.1
Consent of Independent Registered Public Accounting Firm
Filed herewith
31.1
Certification of the Chief Executive Officer Pursuant to Rule 13a-14(a) or Rule 15d-14(a) under the Securities Exchange Act of 1934 as amended.
Filed herewith
31.2
Certification of the Chief Financial Officer Pursuant to Rule 13a-14(a) or Rule 15d-14(a) under the Securities Exchange Act of 1934 as amended.
Filed herewith

103
32.1
Certification of Chief Executive Officer pursuant to 18 U.S.C. Section 1350 as Adopted Pursuant to Section 906 of the Sarbanes-Oxley Act Of 2002 (As set forth in Exhibit 32.1 hereof, Exhibit 32.1 is being furnished and shall not be deemed “filed”.)
Filed herewith
32.2
Certification of the Chief Financial Officer Pursuant 18 U.S.C. §1350, as Adopted Pursuant to Section 906 of the Sarbanes-Oxley Act of 2002 (Exhibit 32.2 is being furnished and shall not be deemed “filed”)
Filed herewith
101.INS
XBRL Instance Document **
Filed herewith
101.SCH
XBRL Taxonomy Extension Schema Document**
Filed herewith
101.CAL
XBRL Taxonomy Extension Calculation Linkbase Document**
Filed herewith
101.DEF
XBRL Taxonomy Extension Definition Linkbase Document**
Filed herewith
101.LAB
XBRL Taxonomy Extension Label Linkbase Document**
Filed herewith
101.PRE
XBRL Taxonomy Extension Presentation Linkbase Document**
Filed herewith
* Management contract or compensatory plan or arrangement.
** Pursuant to Rule 406T of Regulation S-T, the Interactive Data Files on Exhibit 101 hereto are deemed not filed or part of a registration statement or prospectus for purposes of Sections 11 or 12 of the Securities Act of 1933, as amended, are deemed not filed for purposes of Section 18 of the Securities Exchange Act of 1934, as amended, and otherwise are not subject to liability under those sections.

104
SIGNATURES
Pursuant to the requirements of Section 13 or 15(d) of the Securities Exchange Act of 1934, the registrant has duly caused this report to be signed on its behalf by the undersigned, thereunto duly authorized. Semtech Corporation Date: March 28, 2013 /s/ Mohan R. Maheswaran Mohan R. Maheswaran President and Chief Executive Officer

105
SIGNATURES
Pursuant to the requirements of the Securities Exchange Act of 1934, this report has been signed below by the following persons on behalf of the Registrant and in the capacities and on the dates indicated. Date: March 28, 2013 /s/ Mohan R. Maheswaran Mohan R. Maheswaran President and Chief Executive Officer Director Date: March 28, 2013 /s/ Emeka N. Chukwu Emeka N. Chukwu Senior Vice President and Chief Financial Officer (Principal Accounting and Financial Officer) Date: March 28, 2013 /s/ Rockell N. Hankin Rockell N. Hankin Chairman of the Board Date: March 28, 2013 /s/ Glen M. Antle Glen M. Antle Director Date: March 28, 2013 /s/ W. Dean Baker W. Dean Baker Director Date: March 28, 2013 /s/ James P. Burra James P. Burra Director Date: March 28, 2013 /s/ Bruce C. Edwards Bruce C. Edwards Director Date: March 28, 2013 /s/ James T. Lindstrom James T. Lindstrom Director Date: March 28, 2013 /s/ John L. Piotrowski John L. Piotrowski Director

106
(THIS PAGE INTENTIONALLY LEFT BLANK)

Semtech LeAdeRShip teAm
mohan maheswaran President and Chief Executive Officer
Jean-paul BardynChief Technical Officer and Vice President, R&D, Wireless and Sensing Product Group
Gary BeauchampSenior Vice President and General Manager, Gennum Product Group
emeka chukwuSenior Vice President, Finance and Chief Financial Officer
Alain dantecSenior Vice President and General Manager, Wireless & Sensing Product Group
Sharon FaltemierVice President, Human Resources
Jonathan hahnVice President, Information Technology, Chief Information Officer
charles e. harperSenior Vice President, Strategy and Systems Innovation Group
Randall h. hollidaySenior Vice President, General Counsel and Secretary
James KimSenior Vice President, Worldwide Sales and Marketing
Jeff pohlmanExecutive Vice President and General Manager, Protection and Power Management & High Reliability Product Groups
Asaf SilbersteinSenior Vice President, Worldwide Operations
Sameer VuyyuruSenior Vice President and General Manager, Advanced Communications Product Group
mike WilsonExecutive Vice President, Quality and Reliability
BoARd memBeRS
Rockell N. hankin Chairman of the Board, Semtech Corporation;Vice Chairman, The Kavli Foundation;Investor
Glen m. AntleFormer Chairman and Director of Trident Microsystems, Inc.;Former Chairman of Quickturn Design Systems, Inc.; Former Co-Chairman and CEO of Cadence Design Systems, Inc.
Wilford dean BakerCompensation Committee Chair;President, NanoPrecision Holding Company, Inc.;Consultant in Technology and Management
James p. BurraVice Chairman and Audit Committee Chair;CEO, Endural, LLC and its predecessors
Bruce c. edwardsExecutive Chairman Emeritus, Powerwave Technologies, Inc.
James t. LindstromNominating and Governance Committee Chair; Former CFO, eSilicon Corporation
mohan maheswaranPresident and Chief Executive Officer, Semtech Corporation
John L. piotrowskiGeneral, USAF (Ret.); President and CEO, Aerospace and Management Consulting, Inc.
carmelo J. SantoroIndependent Business Consultant;Board Member, several private companies;Former President and CEO, Attensity, Inc.
Sylvia SummersBoard Member, Headwaters, Inc.Former Chief Executive Officer, President and Director, Trident Microsystems, Inc.
tRANSFeR AGeNt ComputerShare Trust Company, N.A.250 Royall St.Canton, MA 02021 Telephone: 877-868-8019 Web: www.computershare.com/investor
exchANGe NASDAQ
ticKeR SymBoL SMTC
coRpoRAte heAdquARteRS 200 Flynn Road Camarillo, CA 93012 Telephone: 805-498-2111
Semtech WeBSite www.semtech.com
coNtAct WeB e-mAiL [email protected]
iNVeStoR ReLAtioNS Telephone: 805-480-2004
FoRWARd LooKiNG StAtemeNtSOur shareholder letter may contain cer-tain forward-looking statements within the meaning of the Private Securities Litigation Reform Act of 1995 regarding the Company’s financial position and long-term projections and strategy. These forward-looking state-ments are based on current information and expectations, and are subject to risks and uncertainties discussed in our filings with the Securities and Exchange Commission. The Company’s actual results may differ materi-ally from expected results. We undertake no obligation to update or revise forward-looking statements, whether as a result of new infor-mation, future events or otherwise.
corporate information
Annual Report Design by Mentus Annual Reports, www.mentusannualreports.com

Semtech Corporation200 Flynn RoadCamarillo, CA 93012Phone: 805-498-2111Web: www.semtech.com
this is a greener annual report.
Semtech Corporation is committed to reducing its impact on the environment. By producing our printed report using paper made from 30 percent (10-K section) and 10 percent (editorial section) post-consumer recycled fiber as opposed to 100 percent virgin wood fiber, we lessened the impact on the environment in the following ways:
8 trees preserved for the future5,940,480 BTUs of energy conserved3,563 gallons of water reduced
30%
The 10-K portion of this annual report uses paper with a post-consumer recycled percentage of 30%.