streetscape inventory on the indiana university ... · ecosystem services to the iub campus such as...
TRANSCRIPT
Streetscape Inventory on the Indiana University-Bloomington Campus: An
Analysis of Tree Species Demographics, Condition, and Ecosystem Services using
i-Tree Streets
Kaitlyn McClain
Senior School of Public and Environmental Affairs
Spring 2012 Honors Thesis
Professor Burney Fischer Clinical Professor
School of Public and Environmental Affairs Faculty Mentor

2
Table of Contents
List of Figures……………………………………………………………………………………..3
List of Tables……………………………………………………………………………………...4
Abstract…………………………………………………………………………………………...…5
Introduction……………………………………………………………………………………….6
Campus Overview…………………………………………………………………………6
Ecosystem Services………………………………………………………………………..7
Previous Studies…………………………………………………………………………...8
Research Questions………………………………………………………………………..9
Methods…………………………………………………………………………………………..10
i-Tree Streets……………………………………………………………………………..10
Streetscape and Street Trees……………………………………………………………..10
Data Collection…………………………………………………………………………..10
Reportable Data………………………………………………………………………….11
Additional Data for Young Trees………………………………………………………..12
Results……………………………………………………………………………………………13
Species Demographics Analysis…………………………………………………………13
Tree Condition and Maintenance Analysis………………………………………………13
i-Tree Streets Cost-Benefit Analysis…………………………………………………….14
Discussion………………………………………………………………………………………..15
Acknowledgements………………………………………………………………………………18
Literature Cited…………………………………………………………………………………..19
Appendix…………………………………………………………………………………………21

3
List of Figures
Figure 1: Map of streetscape segments sampled on the IUB campus……………………………21
Figure 2: Species population summary, 2012 streetscape inventory…………………………….25
Figure 3: Small tree DBH distribution, 2012 streetscape inventory……………………………..26
Figure 4: Large tree DBH distribution, 2012 streetscape inventory……………………………..26
Figure 5: Distribution of Red maple, Silver maple, and oak trees across site type, 2012 streetscape inventory……………………………………………………………………………..27 Figure 6: Proportion of correct and incorrect mulching in young trees (DBH ≤ 2” class) , 2012 streetscape inventory……………………………………………………………………………..29

4
List of Tables
Table 1: i-Tree Streets Input Values…………………………………………………………..…21
Table 2: i-Tree Streets Excel Database Codes…………………………………………………...22
Table 3: Data Field Names and Possible Values for Young Trees……………………………....24
Table 4: Maintenance Task Definitions………………………………………………………….24
Table 5: Species population summary as a percentage, 2012 streetscape inventory…………….25
Table 6: Campus core streetscape overhead utility lines conflicts…….……………..………….27
Table 7: Campus core streetscape sidewalk heave conflicts…...……………..…………………27
Table 8: Size distribution of trees needing crown cleaning in the campus core streetscape population………………………………………………………………….…………………….28
Table 9: Size distribution of trees needing crown raising in the campus core streetscape population………………………………………………………………..………………………28
Table 10: Size distribution of trees needing crown deduction in the campus core streetscape population…………………………………………………………………….………………….28
Table 11: Size distribution of trees needing to be removed in the campus core streetscape population………………………………………………………………………………………..29
Table 12: i-Tree Streets net benefit summary…………………………………………………...30
Table 13: i-Tree Streets importance values…………………………...…………….…………...30

5
Streetscape Inventory on the Indiana University-Bloomington Campus: An Analysis of Tree Species Demographics, Condition, and Ecosystem Services using i-Tree Streets
Kaitlyn McClain Environmental Management
Senior Abstract submitted for SPEA Undergraduate Honors Thesis Presentations
Professor Burney Fischer Clinical Professor
School of Public and Environmental Affairs Faculty Mentor
Abstract
Throughout its entire history, wooded areas and street trees have played a very important role on the Indiana University-Bloomington (IUB) campus. As the university expanded beyond the original core of campus, this vision of forested areas and natural landscapes on campus was maintained, and tree preservation is still considered to be a priority in new construction and renovation plans. Not only do trees on campus have aesthetic value, but they also provide many ecosystem services to the IUB campus such as air pollution reduction, micro-climate regulation, rainwater drainage and interception, and increased personal well-being. A healthy street tree population is central to achieving urban forest sustainability. Only a sustainable forest will provide the valuable ecosystem services and benefits described previously to IUB’s students, faculty, and staff while preserving the goals of University administrators and planners for years to come. This study evaluates tree species demographics, planting site type, condition, and maintenance requirements, and ecosystem services by executing a sample streetscape analysis using the i-Tree Streets software application. The campus is dominated by Red maple, Silver maple, and oak. Young trees outnumber mature trees indicating increased planting in recent years. Most trees are planted within planting strips and cutouts with only a small number of infrastructure issues with overhead utility lines or sidewalk heaves. While there were only isolated instances of neglected routine maintenance needs in mature trees on campus, young trees on campus were found to be plagued by incorrect mulching that is threatening their health and longevity. The campus street trees provide positive net benefits to campus, with the greatest benefits in the areas of energy and stormwater reduction. This cost-benefit analysis demonstrates that planting and maintaining trees on the IUB campus are a worthwhile investment. Keywords: street tree, streetscape, inventory, i-Tree Streets, ecosystem services, sustainable
6
Introduction
Campus Overview
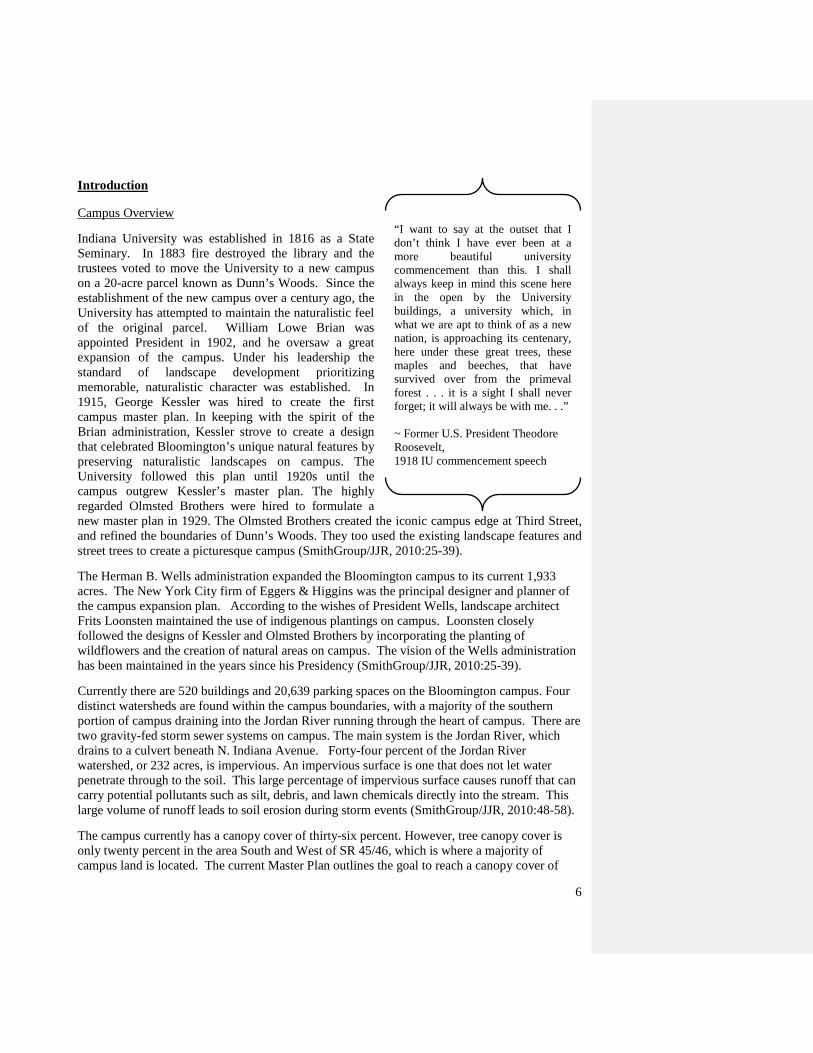
Indiana University was established in 1816 as a State Seminary. In 1883 fire destroyed the library and the trustees voted to move the University to a new campus on a 20-acre parcel known as Dunn’s Woods. Since the establishment of the new campus over a century ago, the University has attempted to maintain the naturalistic feel of the original parcel. William Lowe Brian was appointed President in 1902, and he oversaw a great expansion of the campus. Under his leadership the standard of landscape development prioritizing memorable, naturalistic character was established. In 1915, George Kessler was hired to create the first campus master plan. In keeping with the spirit of the Brian administration, Kessler strove to create a design that celebrated Bloomington’s unique natural features by preserving naturalistic landscapes on campus. The University followed this plan until 1920s until the campus outgrew Kessler’s master plan. The highly regarded Olmsted Brothers were hired to formulate a new master plan in 1929. The Olmsted Brothers created the iconic campus edge at Third Street, and refined the boundaries of Dunn’s Woods. They too used the existing landscape features and street trees to create a picturesque campus (SmithGroup/JJR, 2010:25-39).
The Herman B. Wells administration expanded the Bloomington campus to its current 1,933 acres. The New York City firm of Eggers & Higgins was the principal designer and planner of the campus expansion plan. According to the wishes of President Wells, landscape architect Frits Loonsten maintained the use of indigenous plantings on campus. Loonsten closely followed the designs of Kessler and Olmsted Brothers by incorporating the planting of wildflowers and the creation of natural areas on campus. The vision of the Wells administration has been maintained in the years since his Presidency (SmithGroup/JJR, 2010:25-39).
Currently there are 520 buildings and 20,639 parking spaces on the Bloomington campus. Four distinct watersheds are found within the campus boundaries, with a majority of the southern portion of campus draining into the Jordan River running through the heart of campus. There are two gravity-fed storm sewer systems on campus. The main system is the Jordan River, which drains to a culvert beneath N. Indiana Avenue. Forty-four percent of the Jordan River watershed, or 232 acres, is impervious. An impervious surface is one that does not let water penetrate through to the soil. This large percentage of impervious surface causes runoff that can carry potential pollutants such as silt, debris, and lawn chemicals directly into the stream. This large volume of runoff leads to soil erosion during storm events (SmithGroup/JJR, 2010:48-58).
The campus currently has a canopy cover of thirty-six percent. However, tree canopy cover is only twenty percent in the area South and West of SR 45/46, which is where a majority of campus land is located. The current Master Plan outlines the goal to reach a canopy cover of
“I want to say at the outset that I don’t think I have ever been at a more beautiful university commencement than this. I shall always keep in mind this scene here in the open by the University buildings, a university which, in what we are apt to think of as a new nation, is approaching its centenary, here under these great trees, these maples and beeches, that have survived over from the primeval forest . . . it is a sight I shall never forget; it will always be with me. . .” ~ Former U.S. President Theodore Roosevelt, 1918 IU commencement speech

7
forty percent in the campus core by 2020 to reduce air pollution and save $2.3M by avoiding the need to build new stormwater retention facilities. The plan also outlines a strategy for replacing mature trees as they die off which will be integral in maintaining and hopefully increasing the canopy cover percentage. Under the current design, campus edges will continue to be characterized by deciduous canopy cover coupled with a flowering understory to meet both ecological and aesthetic needs. The Master Plan places great emphasis upon making sure that the campus landscape possesses increased biodiversity of tree and herbaceous species, improved woodland management, and the restoration of degraded landscapes (SmithGroup/JJR, 2010:138-141).
Because this study focuses upon a streetscape analysis, it is important to understand the history of the streetscape development as well. Streets and sidewalks in the older, historic part of campus are lined with planting strips. The sidewalks in these areas areis behind the planting strip panel. Low stone walls can be found beside most sidewalks along the campus edges on the property side of the street. Streets that are characterized by these walls in their streetscape include E. Third Street, E. Seventh Street, and N. Indiana Avenue. In the newer parts of campus established during the campus expansion after World War II, sidewalks can be found directly adjacent to the curb with a landscape buffer behind the walk to the building edge. The campus’ urban streetscape can be described as a social-ecological system, an ecological system influenced by both institutional rules established by people as well as the biological aspects of the landscape (Mincey and Fischer, 2009). Ecosystem Services
By 2030, nearly sixty percent of the world’s population will reside in urban areas (Bolund and Hunhammar, 1999: 293). The importance of maintaining functional, local ecosystems in cities to sustain the level of public health and wellness is greater than ever before. Ecosystem services are the ecological, social, and economic benefits that people derive from their surrounding ecosystems. An ecosystem is defined by Bolund and Hunhammar as the “… set of interacting species and their local, non-biological environment functioning together to sustain life. (1999: 294).” Street trees are regarded as part of the larger local urban ecosystem because they are too small to be considered an ecosystem on their own. However, street trees play a crucial role in sustaining the health of the urban ecosystem. It is important to note that while ecosystem services lessen the effects of problems created in an urban setting, ecosystem services do not solve these problems. In order to maximize outcomes resulting from initiatives to increase the health of the ecosystem, source reduction of pollution should also be enacted. Costanza et al. identifies seventeen categories of ecosystem services, and four have a major influence in the IUB ecosystem (1997).
• Air pollution reduction: Leaves have the ability to filter harmful gases and particulate matter from the air, and it has been estimated that seventy percent of air pollution can be reduced on a tree-lined street. This filtering capacity increases with greater leaf surface area, thus coniferous trees have larger filtering capacity than trees with deciduous leaves due to their greater surface area and because they do not shed their leaves in the winter. Deciduous leaves are better at absorbing gases, however, so a mix of both coniferous and deciduous trees is best. (Bolund and Hunhammar, 1999). The greatest amount of gas absorption occurs during the day throughout the in-leaf season when leaves are

8
transpiring water during photosynthesis. Particulate matter filtration occurs both day and night year-long because matter is intercepted by leaves and bark (Nowak et al., 2006). A secondary benefit is the reduction in air pollution from power plants when energy use is lowered through effective siting of trees (Nowak, “The Effects of Urban Trees on Air Quality”).
• Micro-climate regulation: Trees have the ability regulate changes in the local climate through biological processes and the reduction of energy consumption. A single large tree can transpire 450L of water per day which consumes 1000 MJ of heat energy to drive the evaporation process. This biological consumption of heat energy leads to lower temperatures, regulating the urban heat island effect. Trees also shade buildings in the summer and reduce wind speed in winter which decreases the demand for heating and cooling (Bolund and Hunhammar, 1999).
• Rainwater drainage and interception: The campus has a high amount of impervious surfaces due to itsthe many buildings, sidewalks, and parking lots. These impervious surfaces cause excessive runoff and flooding in parts of campus during storm events. Vegetated areas and trees soak up water by means of their root systems and release it back into the air through evapotranspiration. This process reduces the amount of standing water. Leaves also intercept water as it falls from the atmosphere slowing the rate at which rain reaches the ground. This interception reduces the likelihood of flash flood events and erosion from runoff (Bolund and Hunhammar, 1999).
• Recreational and cultural values: The psychological benefits of trees should not be underestimated. A study was completed whose results revealed that patients in a hospital had a ten percent faster recovery time and required fifty percent less pain medication when recovering in rooms facing a park rather than a building wall. Urban trees provide the possibility for recreation and stress-reduction in what many consider a hectic environment. Urban trees increase the quality of life and personal well-being of community members (Bolund and Hunhammar, 1999).
Previous Studies
Few studies using i-Tree software applications on college campuses have been published. In fact, no published studies were found that used i-Tree Streets software to analyze street trees on a college campus. However, two studies were found that utilized the i-Tree Eco application to examine campus urban forests, which is similar the streetscape analysis described in the “Methods” section of the report. The studies were similar enough to use as a model for this sample streetscape inventory.
A one hundred percent tree inventory was completed using i-Tree Eco on the Auburn University campus located in Auburn, Alabama during 2009-2010. This study was the first published data on a one hundred percent tree inventory using the i-Tree Eco application. The study found that a complete survey of the campus was not as cost-effective as random sampling, but provided a more accurate picture of the state of the urban forest. The i-Tree Eco inventory analysis provided information on forest structure, which is the basis for measuring ecosystem services and compensatory value of trees. i-Tree Eco also allowed the researchers to determine the

9
species composition, size distribution, species diversity, relative value, and tree condition to assist managers in planning and maintaining a healthy, sustainable forest (Martin et al., 2011).
Another study was completed at North Carolina State University (NCSU). This study also examined age distribution, tree condition distribution, species diversity, and resource benefits. Like the Auburn study, this study used i-Tree Eco and additionally used Trimble GeoXT GPS to perform a geographic information system (GIS) analysis. Forty-six percent of the NCSU campus was inventoried. The purpose of the study was to provide methods of inventory to be replicated for Grounds Management staff to create better forest management initiatives (Rudder, 2011).
Research Questions
Gaining an understanding about the species demographics, tree condition, and the benefits to be received by community members allows tree program planners to improve the condition of their urban forest and meet urban forestry goals by being able to better justify funding requests. Knowing this, I began to wonder what IUB campus’ urban forest looked like. A campus tree inventory and GIS analysis was undertaken by the IU Office of Sustainability’s internship program from 2007-2009. While this analysis provided a baseline for further research, there were still some questions left unanswered by the GIS analysis. Due to the limited timeframe of one semester, I decided to conduct a sample streetscape analysis by using the i-Tree Streets software application to answer the following questions:
• Do street tree benefits provided by ecosystem services exceed their initial/maintenance costs? If so, by how much?
• What are the demographics of the IUB streetscape tree population? • Are there any management/maintenance issues that need to be addressed?
My hypothesis was that the streetscape trees would provide positive net benefits because the streets are lined with trees that generally appear to be in good shape, but that the monoculture of species might present some problems due to risks associated with replacement costs resulting from disease or pest events. I also hypothesized that there would be maintenance issues associated with overhead utility lines and sidewalk damage. In addition to issues with infrastructure, I hypothesized that there would be many issues associated with the mismanagement of young trees based upon prior casual observations around the campus.

10
Methods
i-Tree Streets The i-Tree Streets (v. 4.0) software was developed through a cooperative initiative by the United States Department of Agriculture (USDA) Forest Service, the Davey Tree Company, the National Arbor Day Foundation, the Society of Municipal Arborists (SMA), the International Society of Arboriculture (ISA), and Casey Trees of Washington, D.C. i-Tree Streets is adapted from the Street Tree Resource Assessment Tool for Urban Forest Managers (STRATUM). The numerical models were developed from research conducted by Greg McPherson, Scott Maco, and Jim Simpson. The i-Tree software is available free of cost by request through the i-Tree website (www.itreetools.org). i-Tree Streets concentrates on the ecosystem services and structure of a municipality’s street tree population. Streets can be used to conduct a sample or complete street tree inventory. Streets quantifies and places a dollar value on the trees’ annual environmental and aesthetic benefits, including energy conservation, air quality improvement, carbon dioxide reduction, stormwater control, and property value increases (USDA Forest Service, v.4.0). An HP iPAQ PDA was used to collect field data. Data was recorded into the mobile version of i-Tree Streets on the PDA.
Streetscape and Street Trees
The core of the IUB campus was divided into 74 ~0.1mi street segments (see Figure 1). A random twenty percent of the segments were sampled to obtain data about IUB’s streetscape. The following street segments were sampled: 6,8,11, 21, 23, 24, 28, 32, 43, 44, 46, 47, 51, and 55. The streetscape boundary for this study extended from the street curb to the front of a building. In cases where there was no building present within the segment, the streetscape boundary extended 50ft from the street curb, regardless of whatever structures were present within the streetscape boundary such as the low walls found along sidewalks throughout campus. If a parking lot was present within the segment, the boundary extended from the street curb to the pavement edge of the parking lot within the segment, and the first row of trees along the outside of the pavement was sampled.
Trees and tree stumps found within the streetscape boundary that were included in the study are individual trees and stumps not located in a clustered, woodland setting such as those in Dunn Woods or other dense tree clusters like those found near the banks of the Jordan River. When collecting streetscape data, emphasis was placed upon individual trees. Any visible conflicts with utility lines or sidewalks within the streetscape boundary were also recorded.
Data Collection
The data collection process was executed in five steps:
Project data configuration
Transfer of data
configuration to PDA
Field data collection
Transfer of field data from PDA to i-Tree
Streets Data analysis

11
Project Data Configuration and Transfer of Data Configuration to PDA
A new i-Tree Streets sample inventory was created for this study. i-Tree Streets’ requires some information to be collected and input before the inventory is started. All information was based upon IUB campus data from FY2009 and FY2010. An average of the two years was calculated to determine a more representative number, rather than using a smaller snapshot of one year’s worth of data. The Google Earth ruler tool was used to determine all distance measurements. Campus information was entered including total campus budget ($), population, total land area (sq mi), average sidewalk width (ft), total linear miles of street (mi), and average street width (ft). IUB’s annual planting cost was entered. The default benefit prices for Bloomington determined by i-Tree Streets was accepted as accurate and used for this study. Table 1 provides the values for each of these fields. The data fields detailed below in the “Field Data Set” section were selected for use in this study. The project data was then transferred to the PDA.
Field Data Collection and Transfer of Field Data from PDA to i-Tree Streets
Field data collection took place on March 15-March 18, 2012 and on March 25, 2012. All field data, with the exception of the young tree data, was recorded electronically on the PDA. At the end of each data collection session, field data was transferred from the PDA to i-Tree Streets and reviewed to fix any observable human error in data entry. Young tree data was recorded by hand and later entered manually into Microsoft Excel.
Data Analysis
Data analysis was performed by using the i-Tree Streets’ “Report” tool. All species demographics, site type, condition, maintenance, and cost-benefits analysis reports were generated from the uploaded tree records and exported to Microsoft Excel. i-Tree Streets calculated the standard error automatically. Young tree data was analyzed separately in Microsoft Excel.
Field Data Set All data fields used standard i-Tree Streets codes found in the i-Tree Streets manual for inventory values (see Table 2). Tree ID: Each tree and non-tree object was assigned a unique ID number automatically by i-Tree Streets. Street Segment: Each 0.1mi segment has a unique number as labeled in Figure 1. Segments range from 1-74. The street segment number was recorded for each sampled segment. Species: The species was recorded for each tree. The Species Codes are found in i-Tree Streets & STRATUM Species Codes by Climate Region Excel file. Tree species not found on the spreadsheet, were assigned a code not already used on the spreadsheet (consult with http://plants.usda.gov for a species code/symbol). Planting spaces and stumps were also recorded and given a code name to be used. “STUMP” was used to denote a stump, and “PLST” was used to denote a planting site. DBH: The diameter at breast height (DBH) was recorded for each standing tree. DBH measures the diameter of a tree trunk. The measurement was taken at 4.5ft from the ground. For trees with multiple stems, the largest bole diameter was determined. For small statured species of trees with many stems, diameter was measured at 30 centimeters (1 foot) from the ground.

12
Site type: The site type field identifies the type of planting site present. The site type was recorded for each tree or non-tree object. Location Site: The location of the planting site in relation to the building was recorded for each tree or non-tree object. Location Number: To distinguish between multiple trees at the same building, trees were numbered consecutively from left to right when standing on the sidewalk looking at trees. Maintenance: Recommended maintenance and maintenance tasks were recorded for each tree if applicable. Recommended maintenance categories were routine and immediate small tree;, routine and immediate large tree;, and critical concern for public safety. Routine maintenance includes pruning, irrigation, and protection against sunscald, animals, and mowers (Purcell, 2011). Maintenance tasks included staking/training leaning trees, crown cleaning, crown raising, crown thinning, removal, and treatment of pests/disease (see Appendix for task definitions). Conflicts: Visible sidewalk damage (SwD) or wire (WC) conflicts were recorded for each tree if applicable. Condition: The visible tree condition was recorded for each tree. Additional Data for Young Trees This data was not used with i-Tree because it does not fit into the i-Tree Streets data format. However, this information was useful in analyzing current management practices. Young trees are especially vulnerable and deficiencies in the following categories could eventually lead to poor health or premature senescence. A young tree is defined here as any tree in the 0”- 2” diameter. Table 3 contains a summary of the data to be collected and recorded. Root Flare: Each young tree was examined to determine if the trunk entered the soil like a telephone pole with no visible flare. In some instances, examination included minimal removal of any mulch around the base of the tree to make a better determination (KIB, 2012). Lower Stem Damage: Each young tree was examined to determine if there was lower stem damage. Damage includes injuries resulting from mowers or animals. The damages noted were visible and more than a minor scrape, such as missing bark or scars (KIB, 2012). Pruning: Each young tree trunk and main branches were examined to look for evidence of pruning (pruning scars, open wounds, collar not healed over, etc.). Pruning, correct or incorrect, must entail a flat cut, as if done with a handsaw, knife, or other implement that would yield a flat tip of a branch (KIB, 2012). Mulching: The base of each young tree trunk and ground underneath the tree were examined to determine if proper mulching had taken place. Correct mulching implies that mulch was pulled 3-6” away from the base of the trunk. Incorrect mulching implies that mulch was piled up around the trunk in a ‘volcano’ formation (KIB, 2012). Staking: Correct or incorrect staking was determined for each young tree that had one or more stakes holding the tree upright. Correct staking implies that the stake is not pulling the tree over in one direction or the other, or the stake line is not girdling the tree due to being tied too tight. Incorrect staking implies that the stake line is girdling the tree, the stake is pulling the tree over, the stake is placed too close to the trunk of the tree, or other staking methods that may harm the tree (KIB, 2012).

13
Results
Species Demographics Analysis
Information was recorded for a total of 153 trees, stumps, or planting sites from the fourteen segments. The actual tree count by species is displayed in Figure 2. The percentage of each species is displayed in Table 5. Over 21 different species were found. Trees were sampled at the beginning of the leaf-in season, and some trees did not yet have leaves. Trees that could not be identified due to lack of leaves were labeled as Broadleaf Evergreen Small, Medium, or Large; Broadleaf Deciduous Small, Medium, or Large; or Unknown Small, Medium, or Large. A total of 45 (29.1%) Acer rubrum, or Red maple, were found making this species the most abundant. The next most abundant species was the Acer saccharinum, or Silver maple, with a total of 17 (11.9%) found. The third most abundant species were various Quercus species, or oak species, with a total of 14 (9.3%) found. Two stumps (1.3%) were found in the inventory.
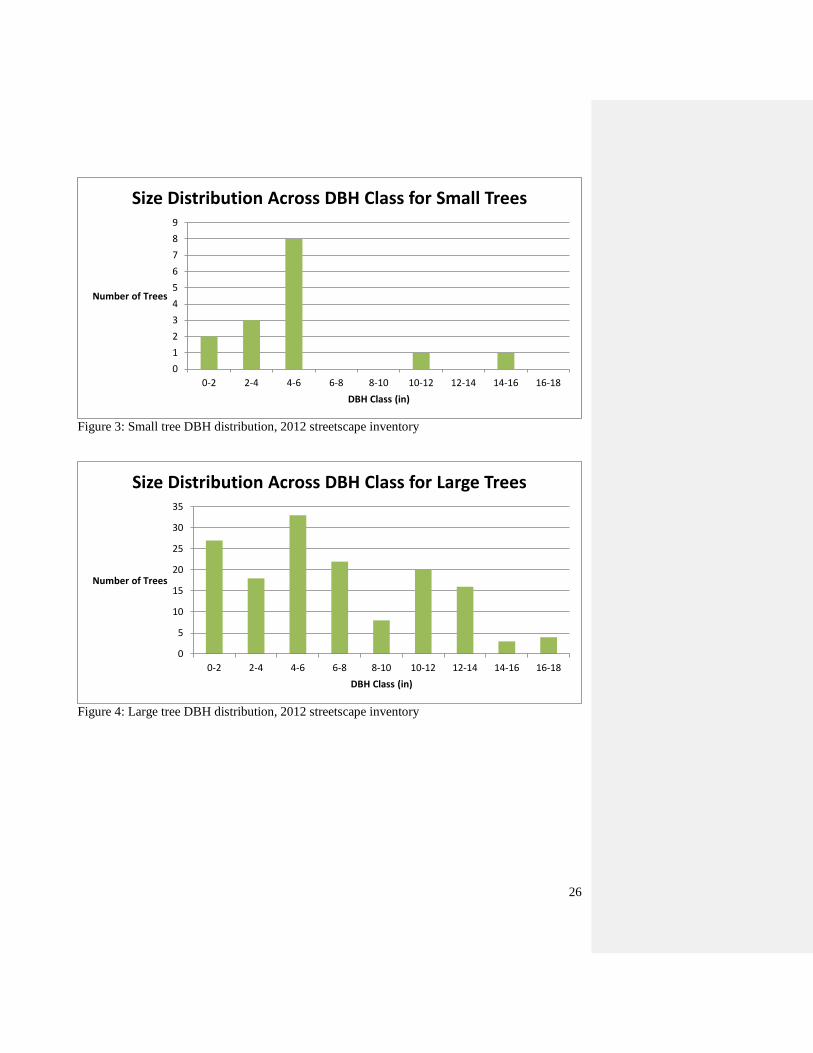
The distribution of DBH across size classes is presented in Figure 3 and Figure 4. DBH can be used to estimate the age of a tree because a tree grows in diameter each year. The classification of small, medium, and large tree species were determined by using the guidelines explained in the City of Bloomington Tree Care Manual (2012). The only small tree species found in the inventory was Cornus florida, or Dogwood. No medium species trees were found, and all other trees are classified as large species trees. The small tree species were distributed unevenly across size classes. All of the trees except for two are found within the 0-8in class range. One tree was found in the 10-12in class, and one tree was found in the 14-16in class. The large tree species were also unevenly distributed across size class. A majority of the trees, 108, are found within the 0-10in class range. A total of 43 trees were found in the 10-18in class range. The greatest amount of trees was found in the 4-6in class with a total of 33 trees.
The site type distribution for the three most abundant species, Red maple, Silver maple, and oak, are displayed in Figure 5. Planting strips were the most utilized planting site type. All three species were planted in the greatest numbers in this site type, with a total of 43 trees. Front yards and cutouts were nearly even with 13 trees planted in front yards and 16 trees planted in cutouts. However, only Red maples and oaks were planted in front yards, while all species were represented in cutouts. Median planting sites were utilized infrequently with only one Red maple and one Silver Maple observed in this site type. Only Red maples were found in other maintained locations such as lawns where no building was present. No species were planted in other unmaintained locations or backyards because these sites are not generally part of the streetscape.
Tree Condition and Maintenance Analysis
I-Tree Streets extrapolated the data from the sample inventory to estimate the number of trees that would be found in a one hundred percent inventory for the condition and maintenance analysis. The results of the overhead utility lines and sidewalk heave conflicts are displayed in Table 6 and Table 7, respectively. Overhead utility lines were found to be present without conflict for 3.3% of trees and present and conflicting for 6% of trees. No wire conflicts were found for 88.7% of trees. Nearly all trees (92.7%) were observed to be free of sidewalk heave issues. Sidewalk heaves of ¾ - 1 ½ inches were found in 4.6% of trees. Only 0.7% of trees displayed sidewalk heaves of >1 ½ inches.

14
The results of the maintenance tasks analysis are displayed in Table 8, Table 9, Table 10, and Table 11. Table 8 presents the distribution of trees requiring crown cleaning across DBH class. 6.6% of trees are in need of a crown cleaning, with half being found within the 6-12in classes. Table 9 presents the distribution of trees in need of crown raising across DBH class. Crown cleaning was required for 8% of trees in the 0-3in class and 4.6% of trees in the 3-6in class. This is consistent with conventional practices, because the canopy needs to be raised in young trees in public spaces as they mature. Table 10 displays the distribution of trees that need a crown reduction across DBH class. While a very small portion of the trees on campus need crown reduction (4%), nearly ¾ of these trees are found within the 12-18in class. The distribution of trees needing to be removed across DBH class is presented in Table 11. A total of 3.3% of trees on campus should be removed with 2% of those trees found within the 12-18in class.
A total of 25 young trees were found in the inventory. The only significant issue that was found in the categories analyzed was with mulching; there were no recorded problems with root flare, lower stem damage, pruning, or staking. Figure 6 depicts the percentage of incorrect and correct mulching of young trees. A total of 8 trees (32%) had correct mulching and a total of 17 (68%) trees had incorrect “volcano” mulching.
i-Tree Streets Cost-Benefit Analysis
The summary of the cost-benefit analysis is displayed in Table 12. The total costs were reduced by 20% of the original value to reflect the 20% sample size. The greatest benefits received come from the “Aesthetic/Other” category with benefits totaling $23,810; however, this category also had the highest amount of standard error (±$1,819). “Stormwater” benefits and “Energy” benefits were the second highest with totals of $7,591 (±$580) and $2,548 (±$195), respectively. The total benefit for all categories combined is $35,285 (±$2,695), and the total adjusted costs are $29,472 yielding a net benefit of $5,813 (±$2,695). This positive net benefit indicates that trees are providing more services than the cost of their planting and maintenance.
The importance values for each species found in the inventory are displayed in Table 13. The importance value expresses the relative value of each species to the total campus tree population. The importance value calcualtioncalculation takes into consideration the number of trees of the species, the total estimated leaf area of the species, and the total estimated canopy cover. i-Tree Streets uses an algorithm to determine the importance value. i-Tree Streets extrapolated the data from the sample inventory to estimate the number of trees that would be found in a one hundred percent inventory. The Red maple species had the highest importance value of 22.68. Oak species had the second highest importance value of 13.39. The Sugar maple species had the third highest importance value of 12.19. The remaining importance values ranged from 0.73 (Chinkapin oak) to 11.34 (Silver maple). The unknown Maple species had the lowest importance value of 0.48, but this finding is irrelevant because it is most likely one of the species accounted for in the analysis. It is interesting to note that the Silver maple species was found in more abundance than oak species, yet oak species had a higher overall importance value due to its higher total estimated leaf area and canopy cover.

15
Discussion
Through the sample streetscape analysis I was able to answer my initial research questions. The cost-benefit analysis fails to reject the null hypothesis that the streetscape would provide positive net benefits. I also found that while there is a larger number of tree species found on campus than I had anticipated, only a handful of species dominate the street tree population. My hypotheses that there would by many issues associated with overhead utility lines, sidewalks, and the mismanagement of young trees were found to be incorrect. Problematic issues for infrastructure and young trees examined in this study were found to be virtually non-existent save for incorrect mulching issues.
The finding that nearly one third of street trees inventoried are Red maples is troubling. If the campus Red maples were to be exposed to a highly specific disease, fungi, or pest the maintenance of the canopy cover percentage would be in jeopardy because nearly one third of trees would be susceptible to early death. This danger presented by the current monoculture can be ameliorated by increasing the number and variety of species being planted on campus. The 10-20-30 Formula should be followed when selecting which species to plant. This formula suggests that an urban forest should contain no more than 10% of a single species, no more than 20% of species from a single genus, and no more than 30% of species from a single family (Santamour, 1990:64). Species to be planted should be native deciduous and coniferous tree species because native species have evolved to be suitable within the local ecosystem. While coniferous trees have a higher particulate matter filtering capacity, they provide visibility issues when planted in the streetscape. Deciduous trees better absorb gases, better intercept rainwater, and have a lower chance of causing visibility issues than coniferous trees. A mix of the two types should be used with a large number of deciduous trees lining the streets and some coniferous trees interspersed in the areas set back from the street. The increased use of long-lived species should also be considered to increase the canopy cover and stormwater interception.
The age distribution was found to be uneven for both small and large tree species. Both categories had a greater number of young trees than older trees. Coupled with the observation of only three stumps found in the inventory, it can be surmised that as trees die they are being replaced at a rapid rate. It can also be assumed that the campus is making a greater attempt to plant trees on campus than in previous decades. Trees should continue to be planted to reach the canopy cover goal of forty percent cover in the campus core by 2020. A doubling of the canopy cover is required to meet this goal, and the only way for the University to achieve success is to increase the number of trees planted, properly care for young and middle-aged trees so that they live healthfully into adulthood, and replace dead or removed trees promptly. Areas where plantings could be increased are in open spaces, campus quads, and parking lots. In 2020, one would expect to see similar age distributions as in 2012 due to the increased amount of young trees being planted and the loss of today’s older tree population.
The most ideal place for street trees to be planted is in a front yard or other maintained location, and it is discouraging to see that only a small number of only one species was found in the this planting site type. A large majority of the trees were planted in planting strips or cutout. These sites can restrict the growth of the tree, especially for large tree species like Red maples, Silver maples, and oaks. Planting strip sites are located between the curb and the sidewalk. Cutouts are planting sites surrounded by the curb and pavement on all sides. Planting strips offer slightly

16
more room because they are only bound by pavement on two sides, but both can be detrimental to long term tree growth as well as resulting in infrastructure maintenance issues such as sidewalk heaves or underground pipe damage. More trees should be planted in building lawns where they have the space and freedom to grow to their full size potential.
As planting strips and cutouts can adversely affect trees, trees can adversely affect infrastructure causing potentially costly damage. It is very encouraging to see that an overwhelming majority of the trees in the streetscape are not adversely affected by overhead utility line conflicts or sidewalk heave conflicts. However, the numbers of sidewalk conflicts will likely increase within the next two decades as all of the young trees being planted now mature. As these trees mature, their root systems will grow outward. Another maintenance activity that is not a significant problem now, but that should be addressed soon is routine tree maintenance. There are a small number of trees that need to undergo crown reduction, and this should be done to prevent future or exaggerated overhead utility conflicts. There is also some crown cleaning to be done with middle-aged and mature trees. If crown cleaning tasks are ignored, there may be increased damage to buildings and infrastructure during storm events due to falling branches or wind. A small number of mature trees should be removed due to public safety concerns. This action should be done promptly and a tree replanted at the site. The most pressing maintenance task is the crown raising of young trees. This was the most prevalent task observed, and failing to execute this routine maintenance could obstruct public walkways or streets.
While it is promising that young trees did not have significant issues with root flare, lower stem damage, pruning, or staking, the discovery that nearly seventy percent of young trees are improperly mulched is very concerning. The trees suffered from “volcano” mulching where the mulch is distributed around the tree with a majority of mulch heaped around the trunk tapering off in a shape similar to that of a volcano. This type of mulching encourages pests, rodents, and fungi to live in the mulch next to the trunk. These organisms can feed on the trunk causing damage and decreasing the chance of survival for a young tree. This type of mulching also prevents water from properly reaching the roots because it is absorbed and held in the mulch before being able to be absorbed into the ground. Maintenance workers should be taught to apply only a 2-4in layer of mulch around the tree to avoid these potential hazards (Mickelbart and Beckerman, 2006).
The cost-benefit analysis revealed that while there are sizable costs associated with tree planting and maintenance, the ecosystem services provided from the street trees have a greater return on the initial investment costs. The benefits associated with energy reduction, carbon dioxide sequestration, air quality improvement, stormwater reduction and interception, and increased aesthetics are a worthwhile investment for the University, both economically and ecologically. Those in charge of the tree care planning and execution should use this analysis or a similar analysis to justify their current level of spending or attempt to increase their annual budget to cover the cost of additional staff and a greater number of new tree plantings. The importance value calculation reveals that Red maples are the most beneficial to the campus because they have the highest amount of leaf area and canopy cover, increasing the species’ ability to provide all ecosystem services. However, it should be noted that this study is just a snapshot in time, and the importance values of the different species will fluctuate in the future as more coniferous species and diverse deciduous species are planted.

17
The next step for the University would be to conduct a more comprehensive inventory of all the streetscapes to gain a more accurate picture of the campus canopy demographics and condition. While this study provides a baseline for research, there is still much work to be done to fully understand what ecosystem services are delivered by the campus’ street trees.

18
Acknowledgements
I would like to thank graduate student Matt Patterson for his help in conducting the i-Tree Streets analysis and Professor Burney Fischer for his continued guidance during every step of the Spring 2012 Honors thesis research process.

19
Literature Cited
Bedker, Peter J., O’Brien, Joseph G., and Manfred M. Mielke. 1995. “How to Prune Trees.” USDA Forest Service. NA-FR-01-95.
Bolund, Per and Sven Hunhammar. 1999. “Ecosystem services in urban areas.” Ecological Economics 29: 293-301.
City of Bloomington Parks and Recreation. 2012. “Tree Care Manual: A Manuel for the Care of Public Trees.”
Costanza, R., d’Arge, R., de Groot, R., Farber, S., Grasso, M., Hannon, B., Limburg, K., Naeem, S., O’Neill, R., Paruelo, J., Raskin R., Sutton, P., and M. van den Belt. 1997. “The value of the world’s ecosystem services and natural capital.” Nature 387(15): 253-260.
Dwyer, John F., McPherson, Gregory, Schroeder, Herbert W., and Rowan A Rowntree. 1992. “Assessing the benefits and costs of the urban forest.” Journal of Arboriculture 18(5):227-234.
“i-Tree Streets and STRATUM Species Codes by Climate Region”. Excel Spreadsheet. <http://itreetools.org/resources/archives.php>.
“i-Tree Streets User’s Manual.” v.4.0
“Indiana University Bloomington Tree Care Plan.” 2009.
Indiana University Budget Office. 2008. “Indiana University 2008-09 Official Budget.”
Indiana University Budget Office. 2009. “Indiana University 2009-10 Official Budget.”
Keep Indianapolis Beautiful. 2012. “Young Tree Protocol”. Unpublished paper for Keep Indianapolis Beautiful.
Martin, Nicholas A., Chappelka, Arthur H., Keever, Gary J., and Edward F. Loewenstein. 2011. “A 100% Tree Inventory Using i-Tree Eco Protocol: A Case Study at Auburn University, Alabama, U.S.” Arboriculture and Urban Forestry 37(5): 207-212.
Mickelbart, Mike and Janna Beckerman. 2006. “Mulch Volcanoes.” Purdue Plant and Pest Diagnostic Library. < http://www.ppdl.purdue.edu/PPDL/weeklypics/5-1-06.html>.
Mincey, Sarah and Burney Fischer. 2009. “The Woodland Campus: Indiana University-Bloomington, A Historic Walking Tour.” Indiana University-Bloomington School of Public and Environmental Affairs.
Nowak, David J. “The Effects of Urban Trees on Air Quality.” USDA Forest Service, Syracuse, NY. <http://www.fs.fed.us/ne/syracuse/TREE%20Air%20Qual.pdf>.

20
Nowak, David J., Crane, Daniel E., and Jack C. Stevens. 2006. “Air pollution removal by urban trees and shrubs in the United States.” Urban Forestry and Urban Greening 4:115-123.
Purcell, Lindsey. 2011. “Tree Installation: Process and Practices.” Purdue Extension. FNR-433-W.
Rudder, Charles L. 2011. NCSU Campus Forest Inventory Data Collection Method for Sustainability Management. Unpublished paper for North Carolina State University.
Santamour, Frank S., Jr. 1990. Trees for Urban Planting: Diversity, Uniformity, and Common Sense. Proc. 7th Conf. Metropolitan Tree Improvement Alliance (METRIA). 7:5765.
SmithGroup/JJR. 2010. Indiana University-Bloomington Campus Master Plan.
Whiting, D., Bousselot, J., Cox, R., and C. O’Meara. 2004. “Pruning Mature Shade Trees.” Colorado Master Gardner. No. 7.825.

21
Appendix
Figure 1: Map of streetscape segments sampled on the IUB campus Table 1: i-Tree Streets Input Values Field name Input Value Total Campus Budget ($) 1,158,194,795 Population (student and faculty) 42,479 Total Land Area (sq mi) 0.46 Average Sidewalk Width (ft) 9.5 Total Linear Miles of Street (mi) 5.8 Average Street Width (ft) 32 Annual Planting Cost ($) 147,361 Electricity ($/Kwh) 0.068 Natural Gas ($/Therm) 0.973 Carbon dioxide CO2 ($/lb) 0.0033 Particulate matter 10PM10 ($/lb) 0.99 Nitrogen dioxide NO2 ($/lb) 0.82 Sulfur dioxide SO2 ($/lb) 1.5 Volatile Organic Compounds VOC ($/lb) 0.3 Stormwater Interception ($/gallon) 0.0062 Average Home Resales Value ($) 135,400

22
Table 2: i-Tree Streets Excel Database Codes
Field name Possible values
ID 0-4,000,000,000
StreetSeg 1-74
SpCode Species Code found in i-Tree Streets & STRATUM Species Codes by Climate Region PDF
If Species Code not found, enter unique code DBH 1 = 0-2 in
2 = 2-4 in 3 = 4-6 in 4 = 6-8in 5 = 8-10in 6 = 10-12in 7 = 12-14in 8 = 14-16in 9 = 16-18in 10 = 18+in
SiteType (SiteT)
1 = Front yard 2 = Planting strip 3 = Cutout 4 = Median 5 = Other maintained locations 6 = Other unmaintained locations 7 = Backyard
LocSite (LocS)
1 = Front 2 = Rear 3 = Side-right 4 = Side-left
LocNo (Loc#)
Label trees numerically from left to right
MtncRec (MtncR)
1 = None 2 = Small tree (routine) 3 = Small tree (immediate) 4 = Large tree (routine) 5 = Large tree (immediate) 6 = Critical concern (public safety)
MtncTask (MtncT)
1 = None 2 = Stake/train 3 = Crown cleaning 4 = Crown raising 5 = Crown reduction/thinning 6 = Remove

23
7 = Treat pests/disease
SwDamg (SwD)
1 = 0- ¾ in 2 = ¾ - 1 ½ in 3 = > 1 ½ in
WireConflict (WC)
1 = No lines 2 = Present and no potential conflict 3 = Present and conflicting
CondWood (Wood)
1 = Dead or dying 2 = Poor 3 = Fair 4 = Good
StreetName Street name
StreetNumber (Street#)
Building address, if available
SurveyorId (ID)
Surveyor initials
SurveyDate (Date)
Date on which tree was inventoried (mm/dd/yy)
Comments Any additional notes or comments, up to 255 characters

24
Table 3: Data Field Names and Possible Values for Young Trees Field Name Possible Values Root Flare 0 = No visible root flare
1 = Root flare visible Lower Stem Damage 0 = No evidence of damage
1 = Evidence of damage Pruning Correct = Yes, pruned correctly
Incorrect = Yes, pruned incorrectly None = No evidence of pruning
Mulching Correct = Yes, mulched correctly Incorrect = Yes, mulched incorrectly None = No evidence of recent mulching
Staking Correct = Yes, staked correctly Incorrect = Yes, staked incorrectly None = No evidence of recent staking
Table 4: Maintenance Task Definitions Task Definition Crown cleaning Removal of dead and dying branches; mostly
mature trees; every 6 months to 5 years (Whiting et al., 2004)
Crown raising Removal of branches from the bottom of the crown to achieve minimum clearance for pedestrians for vehicles; annually (Bedker et al., 1995)
Crown reduction/thinning Selective removal of larger upper branches to lower tree height or the thinning of the canopy by removing small branches; performed upon trees prone to wind damage (Whiting et al., 2004)

25
Figure 2: Species population summary, 2012 streetscape inventory Table 5: Species population summary as a percentage, 2012 streetscape inventory Species Percent Red maple 29.1 Silver maple 11.9 Oak 9.3 Sugar maple 7.9 Broadleaf Deciduous Small 6.6 Broadleaf Deciduous Large 6.0 Broadleaf Deciduous Medium 5.3 Dogwood 3.3 Unknown Large 2.6 Fir 2.0 Other Species 15.9 Total 100
0
5
10
15
20
25
30
35
40
45
50
Red maple Silvermaple
Oak Sugarmaple
BroadleafDeciduous
Small
BroadleafDeciduous
Large
BroadleafDeciduousMedium
Dogwood UnknownLarge
Fir Other
26
Figure 3: Small tree DBH distribution, 2012 streetscape inventory
Figure 4: Large tree DBH distribution, 2012 streetscape inventory
0123456789
0-2 2-4 4-6 6-8 8-10 10-12 12-14 14-16 16-18
Number of Trees
DBH Class (in)
Size Distribution Across DBH Class for Small Trees
0
5
10
15
20
25
30
35
0-2 2-4 4-6 6-8 8-10 10-12 12-14 14-16 16-18
Number of Trees
DBH Class (in)
Size Distribution Across DBH Class for Large Trees

27
Figure 5: Distribution of Red maple, Silver maple, and oak trees across site type, 2012 streetscape inventory Table 6: Campus core streetscape overhead utility lines conflicts Conflict Tree Count Standard Error % of Campus Trees No lines 708 (±65) 88.74 Present and no potential conflict 26 (±19) 3.31 Present and conflicting 48 (±29) 5.96
Table 7: Campus core streetscape sidewalk heave conflicts Conflict Tree Count Standard Error % of Campus Trees 0 - 3/4 inches 740 (±50) 92.72 3/4 - 1 1/2 inches 37 (±14) 4.64 >1 1/2 inches 5 (±5) 0.66
0
2
4
6
8
10
12
14
16
18
Front Yard Planting Strip Cutout Median OtherMaintainedLocations
OtherUnmaintained
Locations
Backyard
Num
ber
of T
rees
Site Type
Red maple
Silver maple
Oak

28
Table 8: Size distribution of trees needing crown cleaning in the campus core streetscape population DBH Class (in) Tree Count Standard Error % of Campus Trees 0 - 3 5 (±5) 0.66 3 - 6 11 (±6) 1.32 6 - 12 26 (±13) 3.31 12 - 18 11 (±6) 1.32 18 - 24 0 (±0) 0.00 24 - 30 0 (±0) 0.00 30 - 36 0 (±0) 0.00 36 - 42 0 (±0) 0.00 > 42 0 (±0) 0.00 Total 53 (±16) 6.62
Table 9: Size distribution of trees needing crown raising in the campus core streetscape population DBH Class (in) Tree Count Standard Error % of Campus Trees 0 - 3 63 (±24) 7.95 3 - 6 37 (±19) 4.64 6 - 12 5 (±5) 0.66 12 - 18 0 (±0) 0.00 18 - 24 0 (±0) 0.00 24 - 30 0 (±0) 0.00 30 - 36 0 (±0) 0.00 36 - 42 0 (±0) 0.00 > 42 0 (±0) 0.00 Total 106 (±29) 13.25
Table 10: Size distribution of trees needing crown deduction in the campus core streetscape population DBH Class (in) Tree Count Standard Error % of Campus Trees 0 - 3 0 (±0) 0.00 3 - 6 11 (±10) 1.32 6 - 12 0 (±0) 0.00 12 - 18 21 (±11) 2.65 18 - 24 0 (±0) 0.00 24 - 30 0 (±0) 0.00 30 - 36 0 (±0) 0.00 36 - 42 0 (±0) 0.00 > 42 0 (±0) 0.00 Total 32 (±19) 3.97
Comment [K1]: Streets uses the sample inventory to extrapolate to data to estimate what a 100% sample would look like. These numbers are based upon the estimated population demographics. i.e. 53 trees in the campus core population need crown cleaning. I mentioned this in the discussion section. I wrote about this on the bottom of page 13, but I will try to clarify.

29
Table 11: Size distribution of trees needing to be removed in the campus core streetscape population DBH Class (in) Tree Count Standard Error % of Campus Trees 0 - 3 0 (±0) 0.00 3 - 6 5 (±5) 0.66 6 - 12 5 (±5) 0.66 12 - 18 16 (±8) 1.99 18 - 24 0 (±0) 0.00 24 - 30 0 (±0) 0.00 30 - 36 0 (±0) 0.00 36 - 42 0 (±0) 0.00 > 42 0 (±0) 0.00 Total 26 (±11) 3.31
Figure 6: Proportion of correct and incorrect mulching in young trees (DBH ≤ 2” class) , 2012 streetscape inventory
32%
68%
Correct Incorrect

30
Table 12: i-Tree Streets net benefit summary
Benefits Total ($)
Standard Error Total $/tree
Standard Error Per Tree $/capita
Standard Error Per Capita
Energy 2,548 (±195) 3.19 (±.24) 0.06 (±) CO2 440 (±34) 0.55 (±.04) 0.01 (±) Air Quality 896 (±68) 1.12 (±.09) 0.02 (±) Stormwater 7,591 (±580) 9.51 (±.73) 0.18 (±.01) Aesthetic/Other 23,810 (±1,819) 29.84 (±2.28) 0.56 (±.04) Total Benefits 35,285 (±2,695) 44.22 (±3.38) 0.83 (±.06) Total Costs 147,361 184.66 3.47 Total Costs Adjusted 29,472 36.93 0.70 Net Benefits 5,813 (±2,695) 7.29 (±3.38) 0.13 (±.06)
Table 13: i-Tree Streets importance values
Species Number of Trees
% of Total Trees
Leaf Area (ft2)
% of Total Leaf Area
Canopy Cover (ft2)
% of Total Canopy Cover
Importance Value
Red maple 233 29.14 230,894.42 18.77 64,237.73 20.13 22.68 Silver maple 95 11.92 162,998.05 13.25 28,249.59 8.85 11.34 Oak 74 9.27 173,910.19 14.14 53,441.26 16.75 13.39 Sugar maple 63 7.95 201,462.34 16.38 39,092.85 12.25 12.19 Broadleaf Deciduous Small Other 53 6.62 20,297.17 1.65 6,926.22 2.17 3.48 Broadleaf Deciduous Large Other 48 5.96 115,682.04 9.40 33,163.81 10.39 8.59 Broadleaf Deciduous Medium Other 42 5.30 37,947.20 3.09 12,894.09 4.04 4.14 Dogwood 26 3.31 25,397.07 2.06 8,048.62 2.52 2.63 Unknown Large 21 2.65 70,266.18 5.71 19,836.03 6.22 4.86 Fir 16 1.99 38,764.73 3.15 7,955.75 2.49 2.54 Broadleaf Evergreen Large Other 16 1.99 32,652.36 2.65 8,150.32 2.55 2.40 Callery pear 16 1.99 13,243.62 1.08 4,493.10 1.41 1.49 Chinkapin oak 16 1.99 942.36 0.08 413.53 0.13 0.73 Eastern hemlock 16 1.99 15,025.93 1.22 4,271.31 1.34 1.52 Maple 11 1.32 490.95 0.04 215.81 0.07 0.48 American beech 11 1.32 25,171.32 2.05 7,447.91 2.33 1.90 Unknown Small 11 1.32 6,362.65 0.52 2,051.33 0.64 0.83 Unknown Medium 11 1.32 16,752.72 1.36 5,477.04 1.72 1.47 OTHER TREES 21 2.65 41,747.21 3.39 12,672.12 3.97 3.34
Total 798
100.00
1,230,008.49
100.00
319,038.41 100.00 100.00