stream-water geochemistry as a guide to sources of …
TRANSCRIPT

Current Research (2002) Newfoundland Department of Mines and EnergyGeological Survey, Report 02-1, pages 277-287
STREAM-WATER GEOCHEMISTRY AS A GUIDE TO SOURCES OFACID-MINE DRAINAGE IN THE FORMER RAMBLER MINES AREA
J.W. McConnellGeochemistry, Geophysics and Terrain Sciences Section
ABSTRACT
This paper describes the results of stream-water sampling in the South Brook watershed around the former RamblerMines property on the Baie Verte Peninsula. The Rambler Mines produced primarily, Cu and lesser amounts of Au, Ag andZn from five volcanogenic massive sulphide deposits. The ore was milled onsite, and a tailings compound and water-coursediversions were built in an effort to prevent the generation of acid-mine drainage. Water sampling in 1993, 2000 and 2001indicate that acid-mine drainage is prevalent and affects several streams, including the largest river in the area (South Brook)from the mining area downstream to its mouth at Baie Verte.
Comparison of data from the same sites over an eight-year period suggests that acidification and metal contamination ofthe affected streams is now the same or more severe than earlier. The major contaminants, with respect to impacts on aquat-ic life, are the high levels of Cu and acidification of affected streams. Stream-water geochemistry has identified three majorsources of acid drainage. The largest source appears to be near the head of the North Diversion Ditch. The actual source orsources is unclear but may include leakage from the tailings compound and sulphidic waste-rock exposed in the catchmentbasin. A second source occurs in the vicinity of the Ming Mine as shown by high base-metal contents and acidification of thestream draining to the northwest from the former mine site. A third source is the Ming West Mine, which gives rise to a smallstream having extremely high Cu contents flowing north into South Brook. More detailed sampling will be required to accu-rately delineate the sources of the metals.
INTRODUCTION
The former Consolidated Rambler Mines operation onthe Baie Verte Peninsula (Figure 1) produced 4 300 000 tonsof Cu, Au, Ag and Zn ore from five separate volcanogenic,massive sulphide orebodies during the period 1964 to 1982.An additional 150 000 tons were mined from the Ming Westorebody by Ming Minerals Inc. from 1995 to 1996. Subse-quent to the cessation of mining, acid-mine drainage fromthe property into the surrounding drainage system was rec-ognized. Stream-water geochemistry is being used to identi-fy and document the nature and sources of the acid-minedrainage that is being generated by the interaction of air andwater, both with the tailings and with various sources out-side the tailings compound (thought to be principally sul-phide-bearing waste rock). This report summarizes theresults of the current stream-water assessment.
PREVIOUS WORK
During an earlier project conducted in 1992 on the BaieVerte Peninsula to evaluate stream-water geochemistry as amineral exploration tool, acid-mine drainage was recog-nized in the Rambler Mines area (Hall, 1993). As part of an
277
Figure 1. Index map of the study area.

CURRENT RESEARCH, REPORT 02-1
exploration-focused project, several stream sites were sam-pled in the Rambler area during 1993 (McConnell, 1995).Results of that work indicated that waters in South Brookdownstream of the tailings compound, as well as some siteson tributary streams, were very acidic and contained toxiclevels of heavy metals, particularly Cu (McConnell, op.cit.). In 2000, several of the 1993 sites, as well as addition-al sites were sampled. Similar water chemistry to that ana-lyzed in 1993 was found; some results of that study werepublished by Lee (2001). Most recently, Environment Cana-da conducted a mortality study of rainbow trout using watercollected from the effluent stream from the tailings areapond. The test resulted in the complete mortality of the fin-gerlings. The tested water had a pH of 3.2 and analyzed 712ppb Cu (Ronald Hunter, personal communication, 2001)
DESCRIPTION OF MINE WORKINGS
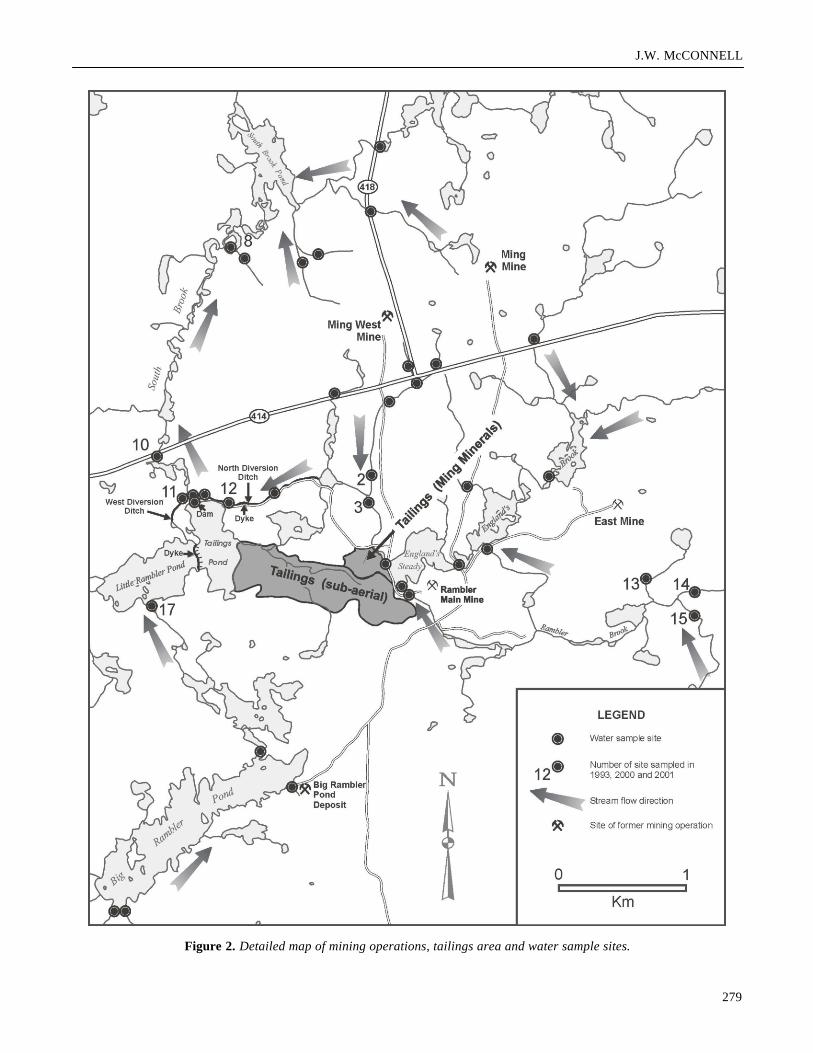
During the life of the mining operation, four major ore-bodies, and a small deposit east of Big Rambler Pond weredeveloped and exploited. Ore was processed at a mill locat-ed near the Rambler Main Mine and tailings were discardedsubaerially into a partially isolated compound created bydiverting and damming existing streams and ponds in thearea. Figure 2 shows details of the mining area, streamdiversion structures and the water-sample sites within thedetailed area. The mill was connected to the mining areas bygravel haulage roads, which in some cases were built withsulphide-bearing waste rock from the mining operations.The major drainage network in the area consists of SouthBrook and its tributaries, which form a drainage basin ofapproximately 120 km2 and empty into the east side of BaieVerte, about 2.5 km northeast of the town of Baie Verte. Topreserve the water quality of this watershed, an effort wasmade to isolate the tailings compound by excavating diver-sion ditches around the west and north sides of the com-pound and constructing a dyke across Little Rambler Pondto prevent the water of South Brook from gaining contactwith tailings (Plate 1). Rambler Brook and England's Brookwere also re-routed to avoid flowing into the tailings area.As with the haulage roads, sulphide-bearing waste rock wasused in several locations to line the banks of the ditches. Inthe early 1990s, the western diversion ditch was reportedlydammed by beavers causing the newly created western halfof Little Rambler Pond to breach and erode the dyke and re-route South Brook into the tailings compound. Removal ofthe beaver dam and work by the Mineral Lands Division ofthe provincial Department of Mines and Energy on the dykehas largely alleviated this problem with the possible excep-tion of flood periods such as spring run-off.
SAMPLE COLLECTION, PREPARATION ANDANALYSES
Sample collection and analytical procedures for resultsdiscussed here were similar to that described in previousyears. In 2001, 45 samples were collected from 42 sitesincluding 12 sites that were also sampled in 1993 and 2000.Two 250 ml, clean, nalgene bottles were filled at each site.One was used for conductivity and pH determinations. Thecontent of the other was filtered through 0.45 µm filter paperand then acidified prior to analysis.
Conductivity measurement were made using a Corningmeter with a conductivity sensor. Acidity (pH) determina-tions were made using a Corning meter having a combina-tion electrode. Samples were analyzed for a suite of ele-ments using two methods. The department's geochemicallaboratory employed both inductively coupled plasma–emission spectrometry (ICP-ES) and inductively coupledplasma–emission spectrometry using an ultrasonic nebuliz-er (ICP-USN). The elements determined by each method aresummarized in Table 1.
278
Plate 1. Looking southwest from tailings pond acrossbreach in dyke into Little Rambler Pond. Note the abun-dance of weathering, sulphide-rich, waste rock used in dykeconstruction.
J.W. McCONNELL
279
Figure 2. Detailed map of mining operations, tailings area and water sample sites.

CURRENT RESEARCH, REPORT 02-1
DESCRIPTION AND DISCUSSIONOF RESULTS
STATISTICAL SUMMARY
Histograms provide a visual depiction of the distribu-tion of data for a given population. Histograms of data fromthe 42 sites sampled in 2001 are presented for pH, Cu, SO4
and Zn (Figure 3). Note that the X-axes have an exponentialscale. All four plots produce bimodal populations where SO4
and pH have particularly sharp separations. The most popu-lous intervals for Cu and Zn analyses are below their respec-tive detection limits giving misleading spikes in the lowestintervals. The histogram of pH suggests a population breakat pH=5; for Cu, a break is suggested at about 5 ppb; forSO4, at about 3.2 ppm and for Zn, at about 2 ppb.
Since Cu is the most biotoxic element in the streams, itsdistribution is used as a means of dividing the sites into twogroups for comparison purposes. Those having Cu >5 ppbare regarded as being from streams affected by acid-minedrainage and those <5 ppb are from stream not affected byacid-mine drainage (background streams). Table 2 showssummary statistics for data from the 2 populations. Variablesare listed in order of decreasing value of the "enrichmentratio", determined by dividing the median value of the themine-affected streams by the median value of the back-ground streams. These ratios should be regarded as order-of-magnitude estimates, particularly for Zn, Cu, Co and Ni,which have several analyses less than the detection limit.Nevertheless, this table provides a guide to the relativeenrichment of several elements in the mine-affected streamsrelative to the background streams in the area. Acidity (pH)is treated differently in Table 2. The value of pH is the neg-ative logarithm of the hydrogen ion concentration, hence the
corresponding enrichment ratio is calculated by dividing theantilog of the median background by the antilog of the medi-an mine-affected value.
DATA DISTRIBUTION MAPS
Distribution of Cu, pH, Zn and SO4 in stream water arediscussed here. Loadings in Cu and pH are likely causingthe greatest damage to the biotic environment. Copper con-tents in water above 2 to 8 ppb, depending on water hard-ness, are lethal to most aquatic life including the manymicroscopic organisms at the base of the food chain onwhich fish and other aquatic and avian life depend (Ministryof Environment, Lands and Parks, 2001). Low pH valuespromote the dissolution of heavy metals, and pH valuesbelow 4.5 produce lethal effects on aquatic life (ibid). Zincin high concentrations is also toxic to aquatic life, and likeCu, its toxicity is a function of water hardness. Water hard-ness can be regarded primarily as a measure of the dissolvedcalcium and magnesium ions. Using the equation CaCO3equiv-
alent= (2.497*Ca + 4.116*Mg), hardness values were calcu-lated for the water samples collected from 42 sites in 2001.The resulting values ranged from 4.52 to 500.4 mg/L havinga median value of 27.6 mg/L. Thirty-eight of the 42 sampleshad values <65 mg/L. If a value of 65 mg/L is assumed forall samples, the highest non-lethal level for Cu is 8.1 ppb.This is derived from the equation Cumax=(0.094 (hardness) +2) = ((0.094*65) + 2).
The distribution of Cu in water is shown in Figure 4.The range of Cu values associated with each symbol isshown on the cumulative frequency plot. The bimodalnature of the distribution is clearly shown by the sharp breakin the curve. Most samples fall into one of two groups –those having Cu values >100 ppb and those <5 ppb. The
280
Table 1. Analytical methods for stream-water samples
ANALYSIS METHOD PREPARATION
pH Corning combination pH electrode None
Conductivity Corning conductivity sensor None
Ca, Fe, K, Mg, Mn, Na, Si, So4 ICP-emission spectroscopy1 Filtration (0.45 mm) and HNO3
acidification
Al, Ba, Be, Co, Cr, Cu, Li, Mo, Ni, P, Pb 2, ICP ultrasonic nebulizer1 Filtration (0.45 mm) and HNO3
Sr, Ti, Y, Zn acidification
1 Finch, C.J., 1998.2 2001 analyses only

J.W. McCONNELL
blue and green symbols reflect Cu levels that are non-toxicto aquatic life. Orange and red dots and red stars reflect sitesthat have lethal Cu contents. The most serious toxic valuesare streams indicated with red stars, in which Cu contentsrange from 800 to 7000 ppb. The 7000 ppb site is located900 m northwest of the Ming West Mine. Another serious
problem is in the stream crossing Highway 418 (2200 ppbCu) that drains the area of the Ming Mine.
Perhaps the most serious problem with Cu levels isfound in the North Diversion Ditch, which carries high vol-umes of water and drains England's Steady, the pond into
281
Figure 3. Histograms of pH, Cu, SO4 and Zn in 2001 water samples.

CURRENT RESEARCH, REPORT 02-1
which England's Brook discharges (Figure 2 and Plate 2).The five samples collected along the ditch range from 560to 1000 ppb Cu and the highest values occur in the first 2sites, downstream of the pond. The largest stream flowinginto the pond has a content of 2.9 ppb. The content at the dis-charge site from the pond is 808 ppb. The only other streamflowing into the pond at the south end has elevated Cu val-ues (110 and 135 ppb) but does not account for the extremevalues leaving the pond. The pond is flanked on the west bythe subaerial tailings pile and by a mine-access road. Itseems likely that the principal sources of Cu include ground-water flow from the tailings, interaction of stream waterwith bank material, contributions from the southern streamand possibly leaching from sulphide-rich rock used in theroad construction. Water leaving the tailings pond over thespillway is also high in Cu (1110 ppb) however the flow rateis relatively low because the net addition to the Cu load inSouth Brook is less significant than that from the NorthDiversion Ditch.
282
Table 2. Summary statistics for data from background (N=17) and mine-affected (N=25) streams
Background (<5 ppb Cu) Mine-affected streams(>5 ppb Cu) EnrichmentRatio*
median minimum maximum median minimum maximum
Zn 0.1 0.1 2.93 500 5.54 5760 5000Cu 0.1 0.1 2.90 254 6.2 7066 2540pH 6.36 5.4 7.43 4.18 2.86 6.73 151**Co 0.1 0.1 2.71 11.7 0.1 134 117Ni 0.1 0.1 2.54 10.7 0.1 86.2 107SO4 0.21 0.11 1.60 16.1 0.34 214 76.7Mn 16 8 349 581 4 6775 36.3Y 0.01 0.01 0.23 0.27 0.01 2.71 27.0Pb 0.1 0.1 0.5 2.1 0.1 173 21.0Al 83 13 323 949 66 5284 11.4Fe 269 70 676 1994 177 62480 7.4Cr 0.11 0.10 1.08 0.71 0.10 8.45 6.5Conductivity 34 20 77 213 39 1475 6.3Mg 0.76 0.46 1.74 2.98 0.88 38.54 3.9Ca 3.22 1.02 10.13 12.34 2.42 177.6 3.8Li 0.22 0.22 0.50 0.61 0.22 9.54 2.8Si 0.43 0.18 0.99 1.09 0.49 5.94 2.5Sr 6.84 4.19 20.9 16.6 6.72 176.8 2.4K 0.25 0.11 0.52 0.53 0.16 4.18 2.1Ba 3 1.5 6.3 6.1 2.0 26.9 2.0Na 2.83 2.17 4.87 4.05 2.81 17.94 1.4Ti 0.09 0.05 3.90 0.05 0.05 4.28 0.6V 0.14 0.05 2.20 0.07 0.05 1.72 0.5P 10.1 6.3 23.6 0.5 0.5 83.7 0.05
All element values in ppb except SO4, Mg, Ca, Si, K and Na which are ppm. Conductivity is expressed in µS.* ratio of (background median)÷ (mine-affected median)** pH is a negative log value, hence the ratio was determined by dividing the anti-log of the median background by the anti-log of the median mine-affected value.
Plate 2. Looking north down South Brook at the confluenceof North Diversion Ditch (right) and South Brook (left).Analyses at this location in 2001 from South Brook includedCu: <1 ppb and pH: 5.6; analyses of the North DiversionDitch were Cu: 565 ppb and pH: 3.7.

J.W. McCONNELL
Water acidity in streams is shown by the map of pH(Figure 5). Values of pH <7 are increasingly acidic and val-ues >7, increasingly alkaline. The values are logarithmic sothat a 1 unit difference in pH represents a 10-fold differencein acidity. The distribution pattern of pH is similar to that ofCu with a few distinct differences. As with Cu, blue andgreen symbols reflect water quality that supports aquatic life(pH>4.5). As with Cu, all streams above the mining activi-ties are permissive of aquatic life whereas most streamsbelow the start of the North Diversion Ditch, and below theconfluence of the ditch with South Brook, are not. The prob-lem areas are the North Diversion Ditch, South Brookbetween the tailings pond and Baie Verte and the streamdraining to the northwest from the Ming Mine. The streamwith 7000 ppb Cu is only moderately acidic (pH=4.2). The
sources of this acid drainage are likely the same sources pro-ducing high Cu levels in the streams
The distribution of Zn in streams is shown in Figure 6.The distribution pattern is nearly identical to that of Cu. Oneminor difference is that the Zn contents in the stream enter-ing the south end of the England's Brook pond are propor-tionately higher than the Cu contents.
The distribution of sulphate (SO4) in water is shown inFigure 7. The shape of the cumulative frequency plot isstrongly bimodal and similar to those of the metals and pH.The distribution pattern of the values is also similar to theothers.
283
Figure 4. Cu in stream water. Data from 2001 water samples. See text for explanation of symbols.

CURRENT RESEARCH, REPORT 02-1
Site Duplicates
Copper analyses are available from 12 sites that weresampled in 1993, 2000 and 2001. Determinations of pHfrom 1993 are not regarded as reliable and are not included.These data may be used to monitor changes in water chem-istry over time. Figures 8 and 9 plot the results for Cu andpH, respectively. For ease of comparison, data are sorted byincreasing value of the 2000 data. Locations of site dupli-cates falling within the detailed map area are shown in Fig-ure 2. The Cu plot indicates that Cu levels in the mine-affected sites (>10 ppb Cu in Figure 8) were very similar in1993 and 2000 but considerably higher in the most recentsampling. The lower values for the background streams inthe 2001 data likely result mostly from a lowered analyticaldetection limit in the new data. The sites with high Cu are
also the same sites with low pH values (<5.0). The pHanalyses from the 2001 samples are similar to the 2000 datafor the background streams but are considerably more acidin five of the six mine-affected samples. These five samplesare all from the North Diversion Ditch or from various sitesalong South Brook – drainages that carry most of the mine-affected stream water. The sixth site is from a south-drain-ing tributary of the North Diversion Ditch. This lowering ofpH levels in the most recent sampling and the correspondingincreased metal levels, indicates that the problem with acidmine drainage is not improving with time.
SUMMARY
The mining operation at the Rambler Mines propertyproduced primarily Cu and lesser amounts of Au, Ag and Zn
284
Figure 5. pH in stream water. Data from 2001 water samples. See text for explanation of symbols.

J.W. McCONNELL
from five volcanogenic massive sulphide deposits. The orewas milled onsite and a tailings compound and water-coursediversions were built in an effort to prevent the generationof acid mine drainage. Water sampling in 1993, 2000 and2001 of streams in the area indicate that acid mine drainageis prevalent and affects several streams including the largestriver in the area (South Brook) from the mining area down-stream to its mouth at Baie Verte. Comparison of data fromthe same sites over an eight-year period suggests that acidi-fication and metal contamination of the affected streams isnow the same or more severe than earlier. The major con-taminants, with respect to impacts on aquatic life are highlevels of Cu and acidification of affected streams. Stream-
water geochemistry has identified three major sources ofacid drainage. The largest source appears to be near the headof the North Diversion Ditch. The actual source or sourcesis unclear but may include leakage from the tailings com-pound and sulphidic waste rock exposed in the catchmentbasin. A second source occurs in the vicinity of the MingMine as shown by high base-metal contents and acidifica-tion of the stream draining to the northwest from the formermine site. A third source is the Ming West Mine that givesrise to a small stream having extremely high Cu contentsflowing north into South Brook. More detailed sampling inthe Rambler Mines area will be required to further delineatethe sources of the metals.
285
Figure 6. Zn in stream water. Data from 2001 water samples. See text for explanation of symbols.

CURRENT RESEARCH, REPORT 02-1
286
Figure 7. SO4 in stream water. Data from 2001 water samples. See text for explanation of symbols.
Figure 8. Cu in site duplicates. From 1993, 2000 and 2001data.
Figure 9. pH in site duplicates. From 2000 and 2001 data.

J.W. McCONNELL
ACKNOWLEDGMENTS
Several people contributed to the success of the fieldaspects of this project including Jody Hodder (1993), Vanes-sa Lee (2000) and Peter McConnell (2001). Discussionswith Ned Vukomanovich, Brad Way and Chris Finch wereinvaluable in preparing this report. Dave Leonard is thankedfor applying his graphics skills to the figures.
REFERENCES
Finch, C.J.1998: Inductively coupled plasma-emission spectrome-try (ICP-ES) at the Geochemical Laboratory. In CurrentResearch. Newfoundland Department of Mines andEnergy, Geological Survey, Report 98-1, pages 179-193.
Hall, G.E.M.1993: Elemental signatures in stream waters from theBaie Verte Peninsula, Newfoundland. In Report ofActivities. Newfoundland Department of Mines andEnergy, Geological Survey Branch, pages 19-24.
Lee, V.E.2001: Geochemical characterization of surface watersand lichen at the Consolidated Rambler Mines site,Baie Verte Peninsula. Unpublished B.Sc. thesis (Hons.).Department of Earth Sciences, Memorial University ofNewfoundland, St. John's, Newfoundland, 68 pages.
McConnell. J.W.1995: Seasonal and mining influences on stream-watergeochemistry in the Rambler Mines area: implicationsfor mineral exploration and environmental monitoring.In Current Research. Newfoundland Department ofMines and Energy, Geological Survey, Report 95-1,pages 129-137.
Ministry of Environment, Lands and Parks2001: Guidelines for interpreting water quality data.Ministry of Environment, Lands and Parks, Govern-ment of British Columbia, www.for.gov.bc.ca/ric/pubs/aquatic/interp/
287