stratigraphic and structural evolution of nakhon basin
TRANSCRIPT

*Corresponding author
Email address: [email protected]
Songklanakarin J. Sci. Technol.
42 (6), 1334-1343, Nov. - Dec. 2020
Original Article
Stratigraphic and structural evolution of Nakhon Basin, Gulf of Thailand
Nattaphan Bangpa, Christopher K. Morley, Jaydeep Ghosh,
and Niti Mankhemthong*
Department of Geological Sciences, Faculty of Science,
Chiang Mai University, Mueang, Chiang Mai, 50200 Thailand
Received: 17 May 2019; Revised: 10 August 2019; Accepted: 18 September 2019
Abstract
The Late Eocene (?)/Oligocene-Recent Nakhon Basin located in the western portion of the Gulf of Thailand has a NW-
SE trending half-graben structure controlled by a NE dipping boundary fault on the SW margin of the basin. Six marker horizons
were interpreted to determine significant geological events in the basin. Faults are subdivided into two sets based on orientation.
The NW-SE, NE dipping boundary fault comprises two segments, Y and X. The two fault segments are inferred to follow NW-
SE pre-existing fabrics in the pre-rift section. The N-S trending fault sets are separated into two groups, early syn-rift faults and
syn-rift faults. During the syn-rift stage (Oligocene-Middle Miocene), the basin was dominated by N-S early syn-rift faults then
segment Y exhibited strong displacement in the Oligocene. The fault grew from several isolated strands, reached a maximum
length then towards the end of extension. The western part of the fault remained active while the eastern part was inactive.
Keywords: Nakhon Basin, stratigraphic facies interpretation, modeling of basin evolution, pre-existing fabric,
fault development
1. Introduction
The Nakhon Basin is one major rift basins located
on the western margin of the Gulf of Thailand (Figure 1a).
The basins in the gulf are divided by the N-S trending of the
Koh Kra Ridge in two portions which are the eastern portion
(large basins e.g. the Pattani Basin) and western portion
(small, narrow and elongate basins, e.g. the Nakhon and the
Chumphon Basins) (Morley, Charusiri, & Watkinson, 2011;
Sautter et al., 2017) (Figure 2a). There is little published
information on the study area with regard to seismic
stratigraphy, depositional environment and tectonic evolution
(Chenrai, 2011). The basin initially formed in the Late Eocene
or possibly the Oligocene with deposition continuing to the
Holocene (Morley & Racey, 2011). The basin has a half-
graben geometry with sedimentary packages expanding
toward a boundary fault on the west side (Figure 2b). The
orientation of the basin is NW-SE following the east-dipping
high angle bounding fault that controls rifting of the basin and
provides accommodation space for the syn-rift package. Major
and minor unconformities which present in the basin imply
changing depositional environments, erosional/non-deposi-
tional periods, and variations in sedimentary processes.
This study focuses on understanding how growth
faults affected sediment deposition and basin geometry in the
context of rift basin evolution. The geometry of the major
bounding fault is investigated to understand how the deve-
lopment of the fault controls sediment deposition of the basin.
There are significant variations in the footwall geometry of
the bounding fault, and the seismic character of sedimentary
units on the flexural margin of the half-graben. The boundary
fault geometry changes its displacement and orientation in
response to subsurface geology. The seismic amplitude,
continuity and frequency of sediment packages in the footwall
shows differences with the hanging wall sediment packages.
Interpretations of 2D and 3D seismic data were used to create
a schematic model of the different stages of evolution and
environment variation of the Nakhon Basin.

N. Bangpa et al. / Songklanakarin J. Sci. Technol. 42 (6), 1334-1343, 2020 1335
Figure 1. a) Location of the Nakhon Basin in the Gulf of Thailand (a blue rectangle) with an inset figure of area coverage of 2D and 3D seismic data (Coastal Energy, 2012). A solid orange line represents a profile of Figure 2a. b) Regional tectonic map of Southeast Asia region
(modified from Searle & Morley, 2011 and Phoosongsee & Morley, 2019).
Figure 2. a) W-E cross-section throughout the Cenozoic basins in the Gulf of Thailand (modified from Sautter et al., 2017). RF·is the Ranong Fault; KMF is the Klong Marui Fault; KKR is the Koh Kra Ridge; STPF is the South Three Pagodas Fault; SMPF is the South Mae
Ping Fault. b) Stratigraphic interpretation from 2D seismic data of the Nakhon Basin (modified from Sautter et al., 2017).
c) Stratigraphic correlation established from seismic data and well data. The stratigraphy of the Chumphon and Nakhon Basins was
from unpublished 2D seismic and well data, for the Malay Basin from Mansor, Rahman, Menier, and Pubellier (2014), and for the
Pattani Basin from Morley and Racey (2011).

1336 N. Bangpa et al. / Songklanakarin J. Sci. Technol. 42 (6), 1334-1343, 2020
2. Geologic Background
Major tectonic fabric and fault pattern of Cenozoic
rifting in Thailand is a result of the India-Eurasian collision in
Eocene (Fyhn, Boldreel, & Nielsen, 2010; Tapponnier &
Molnar, 1975). It is also partly the result of processes in other
parts of the region, for examples, subduction along the
Andaman-Sumatra Trench, seafloor spreading in the South
China Sea oceanic crust, and the transform boundary along the
Ailao Shan-Red River shear zone (Figure 1b) (Pubellier &
Morley, 2014; Searle & Morley, 2011). As a consequence of
the different geologic setting in each geotectonic terrane, the
fault, transfer zone, and fault linkage patterns and the sedi-
mentation sequences can be complex (Morley, 2016).
Extension along predominantly N-S trending fault
systems from the northern part of Thailand to the Gulf of
Thailand caused formation of Cenozoic rift basins (Morley et
al., 2011). The extensional regime contains a large number of
Cenozoic basins, which formed between the Paleogene and
Middle Miocene (Morley & Racey, 2011). Several models for
the origin of the basins have been proposed including their
origin as pull-apart basins (Polachan & Sattayarak, 1989), and
extensional basins related to the extensional collapse of
thickened crust, and subduction rollback in the Andaman Sea
(Morley, 2002; Watcharanantakul & Morley, 2000). The
basins pass through a region dominated by extension (Gulf of
Thailand, Central Thailand), westwards to a region (Shan
Plateau) controlled by strike-slip faults that develop pull-apart
basins particularly of Late Oligocene-Early Miocene age
(Figure 1b) (Morley et al., 2011). Seismic reflection data
suggests that the western basins in the Gulf of Thailand are
characterized by Late Oligocene-Mid Miocene extension in
half-graben basins and Late Miocene-Pliocene post-rift subsi-
dence (Morley & Racey, 2011; Pradidtan & Dook, 1992).
The Nakhon Basin, one of the major Cenozoic
extensional basins in the Gulf of Thailand, is a half-graben
oriented NW-SE mapped from gravity anomalies and seismic
lines (Milsom, 2011). This orientation is oblique to the typical
N-S trend of basins in the region. In the Northern part of the
basin, extension is accommodated via a large NE dipping low
angle normal fault (Chenrai, 2011). A second bounding fault
is oriented N-S and dips west, conjugated with an antithetic
fault further east. Both faults were active from the Late
Eocene (?) to the Middle-Late Miocene (Chenrai, 2011).
The stratigraphy of the Nakhon Basin consists of
sediment packages from the Eocene (?) to the Upper Miocene
that expand towards the bounding fault zone on the western
side of the basin (Figure 2b) (Morley & Racey, 2011). The
Eocene syn-rift section was possibly controlled by lower angle
normal faults that were later replaced by a higher angle boun-
dary fault. The syn-rift sediments of the basin are restricted to
the upper Eocene/Lower Miocene and are sealed by the
Middle Miocene post-rift sequences (Figure 2b, c).
3. Materials and Methods
The study area located in the Nakhon Basin covers
approximately 1,200 sq km, where 2D or/and 3D seismic
reflection surveys are available (Figure 1a). IHS Kingdom
software was mainly used for this project. The seismic
interpretation, seismic attributes, quantitative interpretation
and geological analysis were conducted using this software.
3.1 Seismic interpretation
The faults and key horizons were interpreted based
on both 2D and 3D seismic data. The seismic data provide
good subsurface images, however the data cannot be shown
due to confidentiality as well as information of data depth
cannot be given. The seismic data were reinterpreted from
Morley (2016). Six horizons were picked in all 2D lines, and
every 50 lines for both inlines and crosslines in 3D data.
Closer spaced picking (in every 25 lines) was done to achieve
more accurate interpretation in areas with complex structure.
As the data lacked marker and well information, the key
horizons were picked based on seismic characteristics and
reflection termination. Faults were picked on all 2D lines and
every 25 lines for both inlines and crosslines on 3D data. Fault
polygons were generated to determine fault geometry in a map
view and to generate time-structure maps.
3.2 Throw - length of fault
Faults tend to express a maximum displacement in
the central part of the fault trace that gradually declines
toward the tips (Fossen, 2010). The fault displacement history
is determined by observing the maximum vertical displace-
ment (throw) of the particular horizons. The throw-length
profile along the boundary fault system is composed of linked
fault segments and minor splay faults. The throw was
calculated by measuring the separation in time of the footwall
and the hanging wall for each horizon across the fault plane
along the fault strike.
3.3 Isochron map
An isochron map is a contour map representing an
equal value of seismic traveltime between selected horizons
(Brown, 2010). The map illustrates variations in the strati-
graphic thickness of an interval between two horizons or
grids. The map illustrates relationships between depositional
processes, depocenter location and fault activity.
3.4 Seismic attribute
Seismic attributes are measurements derived from
seismic that help to highlight pattern recognition by quanti-
fying the morphological features and amplitude seen in
seismic data. A seismic attribute is based on measurements of
time, amplitude, frequency, and/or attenuation (Roberts,
2001). Seismic attributes are used to delineate geological
features in both structural and stratigraphic images.
3.4.1 Coherence
Coherence is a similarity measurement between
traces or waveforms on a processed section. Frequency,
amplitude, and phase can change by the acoustic impedance
difference and the layer thicknesses below and above the
geological boundary (Roberts, 2001). This attribute can
identify discontinuities within seismic data from geological
elements including stratigraphic features and faults.

N. Bangpa et al. / Songklanakarin J. Sci. Technol. 42 (6), 1334-1343, 2020 1337
3.4.2 Curvature
Curvature is a two-dimensional property of a curve
that defines the tightness of a curve at a particular point, or
how much the curve deviates from a straight line at a given
point (Chopra & Marfurt, 2007). Anticlines exhibit positive
curvature, while synclines have negative curvature. Linear
(straight-line) parts of a curve have zero curvature. The most-
positive curvature identifies the margins of levees and chan-
nels, whereas the most-negative curvature emphasizes the
thalweg or channel axis (Chopra & Marfurt, 2007).
4. Results and Interpretations
4.1 Horizon interpretations
Six marker horizons (Figure 3) were interpreted in
order to understand fault geometry and stratigraphic distri-
bution in the study area. Horizon 1 to Horizon 6 were named
as H1 to H6, respectively, in order from the oldest horizon to
the youngest horizon. Horizon 1 (H1, green line) marks the
top of the basement/base syn-rift section. The top of possible
Eocene section was mapped as Horizon 2 (H2, blue line).
Horizon 3 (H3, pink line) was interpreted as the top of the
Early Oligocene section, Horizon 4 (H4, violet line) as the top
of the Late Oligocene section and Horizon 5 (H5, sky blue
line) as the top of the Early Miocene section. Horizon 6 (H6,
yellow line) is the top of the Middle Miocene post-rift section.
This horizon covers all of the study area, even the basement
high of upthrow side of the boundary faults.
4.2 Fault interpretations
Faults trend predominantly NW-SE and N-S. One of
them is the NE dipping, NW-SE trending boundary fault
(NBF; Figure 4b). The N-S direction is followed by major and
minor faults (Figure 4a). The NE dipping boundary fault
bifurcates into Segments X and Y. Both segments dip steeply
(60°-70°) in the shallow sections and gently (35°-45°) in the
deep sections. Segment X turns to a N-S trend and terminates
in the center of the fault. Segment Y is the main fault that
controls the basin along with the NW-SE trend. Segment Y
exhibits high displacement especially in the syn-rift sections
and loses displacement passing up section (e.g. Horizons 3
and 4) and dies out before the upper syn-rift sections (Figures
3 and 5a). Segment X shows lower displacement than the
segment Y and also exhibits decreasing fault displacement in
the shallow section. Segment X cuts Horizons 4, 5, and 6
(Figure 3). These relationships indicate that Segment Y has
developed before Segment X.
The other trend of faults in the study area is N-S.
The faults can be subdivided into two groups, early syn-rift
faults and main syn-rift faults. The early syn-rift faults (Faults
P and Q; Figure 5b) lie in the center of the study area. These
faults are characterized by high displacement that can be
observed in the base-syn rift level (Horizon 1). The displace-
ment gradually decreases in the upper section. Some of these
faults terminate in the early syn-rift section. However, some
faults extend to the upper section (late syn-rift and transition)
or are linked to the syn-rift faults (Figure 5b).
The syn-rift faults are the other group of N-S
trending faults. These faults are located in the middle of the
Figure 3. Dim 2D vertical seismic section across the basin shows six
interpreted horizons and the basin boundary faults (Seg-
ments X and Y). See Figures 4 and 5 for the location.
study area and have a fault length of approximately 2.8 km.
The faults dip toward the east and west and exhibit an en-
echelon rotated fault block style (Figure 5c). Some of these
are recognized as listric faults with dips in the shallow part
around 65°-70° and lower dipping angle (35°- 45°) in the deep
part. The fault group probably nucleated within the syn-rift
section and propagated radially. The faults die out in the syn-
rift-post-rift transitional section. Some faults extend to post-
rift section (Figure 5c).
4. 3 Fault activity (Throw-length profile)
A throw-length profile plot was created along the
strike of the boundary fault to investigate activities of the
boundary fault (NBF, Figures 3 and 6). The throws of Seg-
ments X and Y were summed to provide the total throw of the
boundary fault (Figure 6). In general, throw of the boundary
fault decreases up section. Due to the lack of seismic data in
the NW, we cannot observe the NW fault tip, and the fault
shows high throw at the first point of measurement (Location
1, Figure 6). The throw of Horizons 1 and 2 is high in the
NW, and then it decreases in the middle part of the fault and
shows minimum displacement at Location 5. After that, the
throw gradually increases toward the SW and then rapidly
decreases at Location 6 and terminates at Location 7. Horizon
3 does not show boundary fault throw in the middle part and
NW part, because of the horizon onlaps to the inactive
basement high in those areas.
The throw distribution patterns of Horizons 4, 5, and
6 are comparable. The throws of these three horizons are
measured only in Segment X as the Segment Y ceased. At
Location 4 (Figure 6), the throw dramatically decreases as the
throw measurement of Segment X is stopped at Location 3. At
Locations 2, 5, and 6, the displacement abruptly decreases due
to a presence of splay faults or hard-linkage as strain transfers
to these faults especially for Horizons 1, 2, and 3.
5. Discussions
5.1 Orientation and development of the boundary
fault
The NE dipping boundary fault of the Nakhon Basin
strikes NW-SE and its development control the basin geo-
metry. The boundary fault orientation is different from adja-
cent basins in the western portion of the Gulf of Thailand
1338 N. Bangpa et al. / Songklanakarin J. Sci. Technol. 42 (6), 1334-1343, 2020
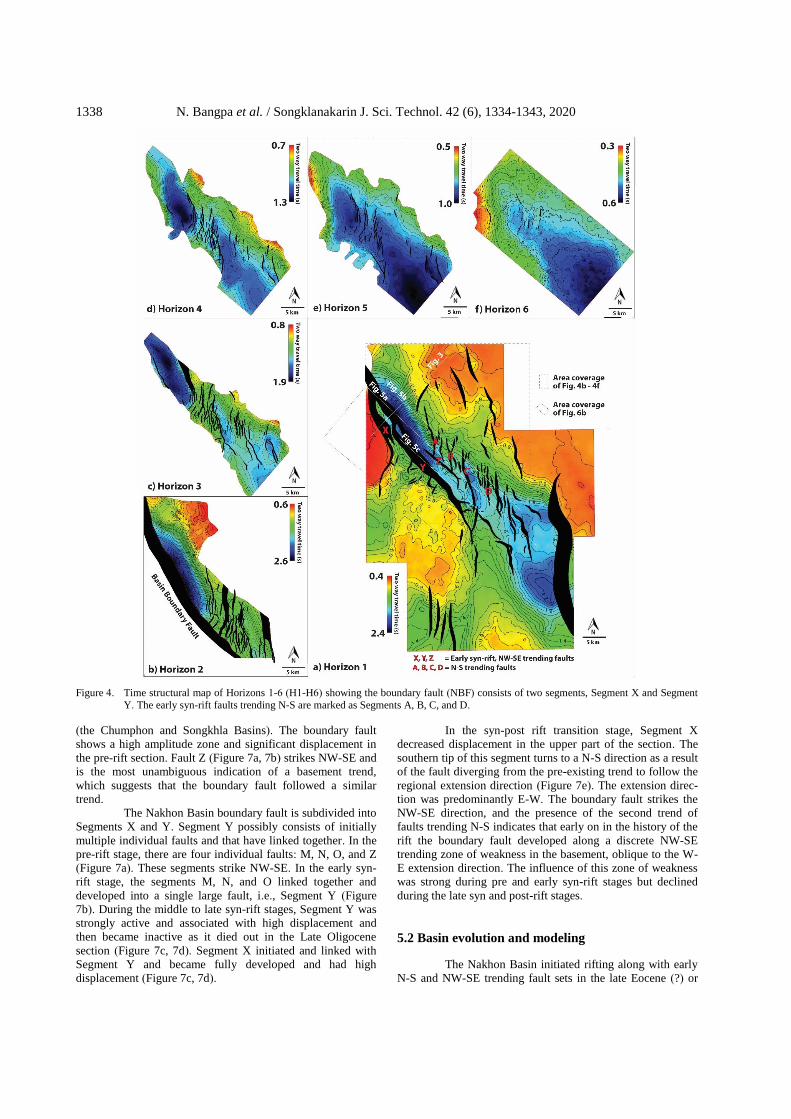
Figure 4. Time structural map of Horizons 1-6 (H1-H6) showing the boundary fault (NBF) consists of two segments, Segment X and Segment
Y. The early syn-rift faults trending N-S are marked as Segments A, B, C, and D.
(the Chumphon and Songkhla Basins). The boundary fault
shows a high amplitude zone and significant displacement in
the pre-rift section. Fault Z (Figure 7a, 7b) strikes NW-SE and
is the most unambiguous indication of a basement trend,
which suggests that the boundary fault followed a similar
trend.
The Nakhon Basin boundary fault is subdivided into
Segments X and Y. Segment Y possibly consists of initially
multiple individual faults and that have linked together. In the
pre-rift stage, there are four individual faults: M, N, O, and Z
(Figure 7a). These segments strike NW-SE. In the early syn-
rift stage, the segments M, N, and O linked together and
developed into a single large fault, i.e., Segment Y (Figure
7b). During the middle to late syn-rift stages, Segment Y was
strongly active and associated with high displacement and
then became inactive as it died out in the Late Oligocene
section (Figure 7c, 7d). Segment X initiated and linked with
Segment Y and became fully developed and had high
displacement (Figure 7c, 7d).
In the syn-post rift transition stage, Segment X
decreased displacement in the upper part of the section. The
southern tip of this segment turns to a N-S direction as a result
of the fault diverging from the pre-existing trend to follow the
regional extension direction (Figure 7e). The extension direc-
tion was predominantly E-W. The boundary fault strikes the
NW-SE direction, and the presence of the second trend of
faults trending N-S indicates that early on in the history of the
rift the boundary fault developed along a discrete NW-SE
trending zone of weakness in the basement, oblique to the W-
E extension direction. The influence of this zone of weakness
was strong during pre and early syn-rift stages but declined
during the late syn and post-rift stages.
5.2 Basin evolution and modeling
The Nakhon Basin initiated rifting along with early
N-S and NW-SE trending fault sets in the late Eocene (?) or

N. Bangpa et al. / Songklanakarin J. Sci. Technol. 42 (6), 1334-1343, 2020 1339
Figure 5. Dim 2D vertical seismic sections of fault interpretations. a) Regional seismic section across the study area shows the interpretation of horizons and faults. b) The example of early syn-rift faults (Faults P and Q) shows high displacement on Horizon 1 and links to the
syn-rift faults in the upper sections. c) Main syn-rift faults represent west and east dipping, en-echelon normal fault style. Brown
arrows point out listric faults, and blue arrows are the examples of faults that propagate to the post-rift transition (Horizon 6).
Early Oligocene (Figure 8a) based on analogy with the nearby
Songkhla Basin (Morley & Racey, 2011). The basin is
controlled by the N-S early syn-rift faults showing strong
displacement on the base syn-rift Horizon (H1). The depo-
center is located adjacent to the early syn-rift faults indicating
their influence on the basin rather than the boundary fault. The
western boundary fault developed (Segment Y; Figure 8b)
with high displacement during the Early Oligocene; Segment
X formed during this time resulting in the basin exhibiting the
half-graben basin geometry. The sediment package strongly
exhibits expansion toward the boundary fault (Segment Y).
Segment Y died out during the Late Oligocene
(Figure 8c), while Segment X became more strongly active
and shows high displacement. The entire N-S en-echelon syn-
rift faults are active into the upper sections. The basin
developed until the Early Miocene. The Miocene depocentre
is located in the center of the basins where the topography is
low (Figure 8d).
The syn-rift-post-rift transition stage occurred
during the Middle Miocene (Figure 8e). Some syn-rift faults
extend into this section and exhibit sufficient displacement
that affects the geometry of the sediment package expanding
toward the syn-rift fault. Faulting ceased since Late Miocene
(Figure 8f). From the Late Miocene onwards, the basin was
stable without major tectonic activity, and sedimentation was
independent of any boundary fault control.
5.3 Basin environment variation
The depositional environments of the basin change
through time in responding to basin evolution particularly the
boundary fault development (Phoosongsee & Morley, 2019).
In the first stage (Figure 9a), the basin was possibly domi-
nated by fluvial systems. Small alluvial fans formed along the
boundary fault-bounded uplifted footwall. In the second stage
(Figure 9b), the boundary fault predominately influenced the
basin, with the sediment package shows thickening toward the
boundary fault. Alluvial fans are well developed along the
fault scarp. In fluvial systems, alternating packages of sand
and shale are dominant away from the boundary fault zone,
which may comprise alluvial fans (Morley & Racey, 2011).
During the third stage (Figure 9c), Segment X of the boundary
fault was strongly active and Segment Y became inactive.
Small channels and moderate amplitude continuous reflectors
from the floodplain/lacustrine shales are observed. The inter-
pretation implies that a low energy fluvial environment was
dominant in the basin. During the fourth stage (Figure 8d),
high energy fluvial systems probably dominated the basin as
broad channels are identified in the upper section. After that,
the basin environments are assumed to have fluctuated
between marine and continental condition since this is the
general pattern for the Gulf of Thailand (Morley & Racey,
2011).

1340 N. Bangpa et al. / Songklanakarin J. Sci. Technol. 42 (6), 1334-1343, 2020
Figure 6. a) Fault throw profile along the boundary fault. b) Time structural map of the top of basement/base syn-rift. Coverage of cropped structural map is shown in Figure 4a. Inset figures display a displacement profile indicating maximum displacement near the center
(modified from Fossen, 2010).
Figure 7. Fault development through time. a) Pre-rift stage, b) Early syn-rift stage (Eocene (?)), c) Middle syn-rift stage (Early Oligocene), d) Late syn-rift stage (Late Oligocene-Early Miocene), and e) Syn-post-rift stage (Middle-Late Miocene).

N. Bangpa et al. / Songklanakarin J. Sci. Technol. 42 (6), 1334-1343, 2020 1341
Figure 8. Schematic models of the Nakhon Basin evolution with isochron maps in a) Eocene (?), b) Early Oligocene, c) Late Oligocene,
d) Early Miocene, e) Middle Miocene, and f) Late Miocene-Recent. Isochron maps show depocenter locations (dashed red polygons)
for each stage of development.
6. Conclusions
The Nakhon Basin is an Eocene (?) to Middle
Miocene half-graben, where the boundary fault orientation is
affected by pre-existing fabrics. The boundary fault is located
on the SW side of the basin and trends NW-SE and dips
toward NE. The fault can be subdivided into two branches
including Segments X and Y. Both segments follow a discrete
zone of weakness zone in the pre-rift section. Segment Y
controls the basin formed by the linkage of the three indi-
vidual fault segments in the early stage of rifting. The N-S
faults are separated into two sets, early syn-rift and syn-rift
faults. Two other fault sets were identified, both trend N-S,
but differ regarding timing. Hence they are separated into
early syn-rift and syn-rift faults. The early syn-rift faults are
characterized by high displacement at the base syn-rift horizon
and die out or link with the syn-rift faults in the upper
sections. The N-S early syn-rift faults are dominant in the
youngest syn-rift section where the influence of the pre-
existing fabric declines. The syn-rift faults are conjugate
normal faults with en-echelon map patterns. These faults are
dominant in the basin during the syn-rift-post-rift transition
stage.
The environment of the basin in the early stage is
probably a fluvial system since narrow channels, and
moderate amplitude continuous reflectors from floodplain/
lacustrine shale are identified. Alluvial fan and coarse clastic
sediments deposition adjacent to the boundary fault is charac-

1342 N. Bangpa et al. / Songklanakarin J. Sci. Technol. 42 (6), 1334-1343, 2020
Figure 9. Basin environment variations through time. a) Stage 1 (Eocene(?)), b) Stage 2 (Early Oligocene), c) Stage 3 (Early Miocene), and d) Stage 4 (Middle Miocene).
terized by moderate amplitude, chaotic reflectors. Marine
condition influences the basin when the basin is gradually
subsiding in the post-rift stage, and was probably episodically
present during the syn-rift stage too.
Acknowledgements
We are grateful to Petroleum Geophysics Program,
Department of Geological Sciences, Chiang Mai University
for the IHS Kingdom software supports and PTT Exploration
and Production Public Company Limited for a research scho-
larship. We thank anonymous reviewers for comments that
improved the manuscript. The seismic data were reinterpreted
from Morley (2016). This work was selected for publication
from the 8th International Conference on Applied Geophysics,
Songkhla, November 8-10, 2018.
References
Brown, A. R. (2010). Interpretation of three dimensional
seismic data. AAPG Memoir 42, SEG Investigation
in Geophysics, No. 9 (7th ed.). Tulsa, Ok: AAPG and
SEG.
Chenrai, P. (2011). Structural style and tectonic evolution of
the Nakhon Basin, Gulf of Thailand. Bulletin of
Earth Sciences of Thailand, 4, 70-75.

N. Bangpa et al. / Songklanakarin J. Sci. Technol. 42 (6), 1334-1343, 2020 1343
Chopra, S., & Marfurt, K. (2007). Seismic curvature attributes
for mapping faults/fractures, and other stratigraphic
features. Recorder, 32, 37-41.
Coastal Energy. (2012, March 31). Offshore Thailand.
Retrieved from http://www.coastalenergy.com/opera
tions/offshore- thailand.html
Fossen, H. (2010). Structural geology. Cambridge, England:
University Printing House.
Fyhn, M., Boldreel, L., & Nielsen, L. (2010). Escape
tectonism in the Gulf of Thailand: Paleogene left-
lateral pull-apart rifting in the Vietnamese part of
the Malay Basin. Tectonophysics, 484, 365-376. doi:
10.1016/j.tecto.2009.11.004.
Mansor, M. Y., Rahman, A. H., Menier, D., & Pubellier, M.
(2014). Structural evolution of Malay Basin, its link
to Sunda block tectonics. Marine and Petro-
leum Geology, 58, 736-748.
Milsom, J. (2011). Regional geophysics. In M. F. Ridd, A. J.
Barber, & M. J. Crow (Eds.), The geology of Thai-
land (pp. 493-506). London, England: Geological
Society.
Morley, C. K. (2002). A tectonic model for the Tertiary
evolution of strike-slip faults and rift Basins in SE
Asia. Tectonophysics, 347, 189-215. doi:10.1016/
S0040-1951(02)00061-6.
Morley, C. K. (2016). The impact of multiple extension
events, stress rotation and inherited fabrics on
normal fault geometries and evolution in the
Cenozoic rift basins of Thailand. In C. Childs, R. E.
Holdsworth, C. A.-L. Jackson, T. Manzocchi, J. J.
Walsh, & G. Yielding (Eds.), The geometry and
growth of normal faults (Vol. 439, pp. 413-445).
London, England: Geological Society.
Morley, C. K., & Racey, A. (2011). Tertiary stratigraphy, The
Geology of Thailand (Vol. 10, pp. 223-271).
London, England: Geological Society.
Morley, C. K., Charusiri, P., & Watkinson, I. M. (2011).
Structural geology of Thailand during Cenozoic,
The Geology of Thailand (Vol. 11, pp. 273-334).
London, England: Geological Society.
Phoosongsee, J., & Morley, C. K. (2019). Evolution of a
major extensional boundary fault system during
multi-phase rifting in the Songkhla Basin, Gulf of
Thailand. Journal of Asian Earth Sciences, 172, 1-
13.
Polachan, S., & Sattayarak, N. (1989). Strike-slip tectonics
and the development of tertiary basins in Thailand.
International Symposium on Intermontaine Basins:
Geology and Resources (pp. 243-253). Chiang Mai,
Thailand: Chiang Mai University.
Pradidtan, S., & Dook, R. (1992). Petroleum geology of the
Northern part of the Gulf of Thailand. National
Conference on Geologic Resources of Thailand:
Potential for Future Development (pp. 235-246).
Bangkok, Thailand: Department of Mineral Re-
sources.
Pubellier, M., & Morley, C. K. (2014). The basins of Sunda-
land (SE Asia): Evolution and boundary conditions.
Marine and Petroleum Geology, 58, 555-578.
Roberts, A. (2001). Curvature attributes and their application
to 3D interpreted horizons. First Break, 19, 85-99.
Sautter, B., Pubellier, M., Jousselin, P., Dattilo, P., Kerdraon,
Y., Choong, C. M., & Menier, D. (2017). Late
Paleogene rifting along the Malay Peninsula
thickened crust. Tectonophysics, 710-711, 205-224.
Searle, M. P., & Morley, C. K. (2011). Tectonic and thermal
evolution of Thailand in the regional context of SE
Asia. In M. F. Ridd, A. J. Barber, & M. J. Crow
(Eds.), The Geology of Thailand (pp. 539-571).
London, England: Geological Society.
Tapponnier, P., & Moinar, P. (1975). Cenozoic tectonics of
Asia: Effects of a Continental Collision. Science,
189, 419-426.
Watcharanantakul, R., & Morley, C. K. (2000). Syn-rift and
post-rift modeling of the Pattani Basin, Thailand:
Evidence for a ramp-flat detachment. Marine and
Petroleum Geology, 17, 937-958.