strategies to control & eliminate prrsv - iowapork.org · outline 1. background – applied...
TRANSCRIPT

Daniel Linhares, DVM, MBA, PhD
Assistant Professor, Veterinary Diagnostic and Production Animal Medicine
Iowa State University College of Veterinary Medicine
Altoona, IA
Feb10th, 2016
Dr Corzo
Strategies to
control & eliminate PRRSv from breeding herds
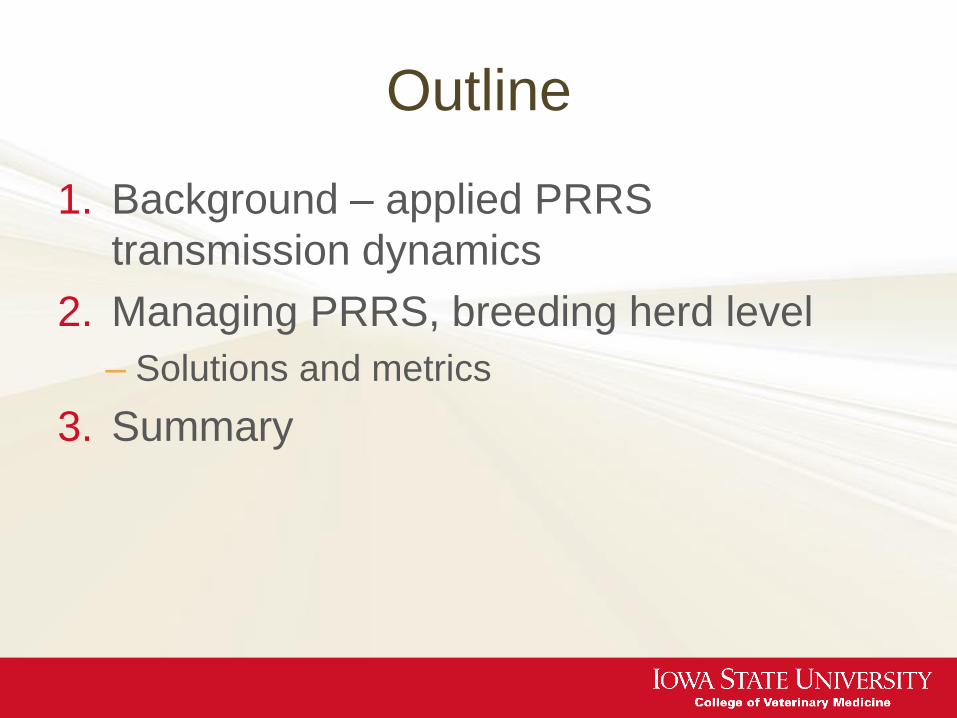
Outline
1. Background – applied PRRS
transmission dynamics
2. Managing PRRS, breeding herd level
– Solutions and metrics
3. Summary

PRRSv
• Costs over $ 1.0 B / year to the US swine industry (Holtkamp et al., 2013)
• North America: efforts towards PRRSv regional elimination
• Regional elimination depends on ability to
– decrease infection frequency in breeding herds and growing pig sites
– increase success rate of PRRSv control & elimination projects

PRRS incidence, US swine industry
4
Betlach & Morrison, Feb 5th
2016

HOW? via aerosols, direct contact (pigs, semen), indirect
contact: contaminated boots, coveralls, vehicles, supplies...
PRRSv infection dynamics: key points PRRSv
infection
Virus in blood (PCR)
1 to ~ 35 dpi
Peak ~ 1 week
Antibodies (ELISA): Beginning ~ 1 wk, ~90% @ 2wks
Virus in lung, tonsils, lymph nodes (PCR)
1st day to ~ 5-6 months
time
Shedding (transmission): from day 1 to ~ 3 months
~ 3-6 weeks: Protective immunity
This is at
individual (pig)
level. At pop’n level,
all pigs don’t get
infected at the same time. Thus,
depending on
pig flow, infection can
persist in the
population forever.
This is why we
want to manage
(control / stabilize)
PRRSv infection in
farms and
whenever feasible,
we want to
eliminate it from
herds, systems,
regions.

Science of herd closure
Susceptible Infected
(shedding)
Resistant
(no shedding, no disease)
No PRRS transmission
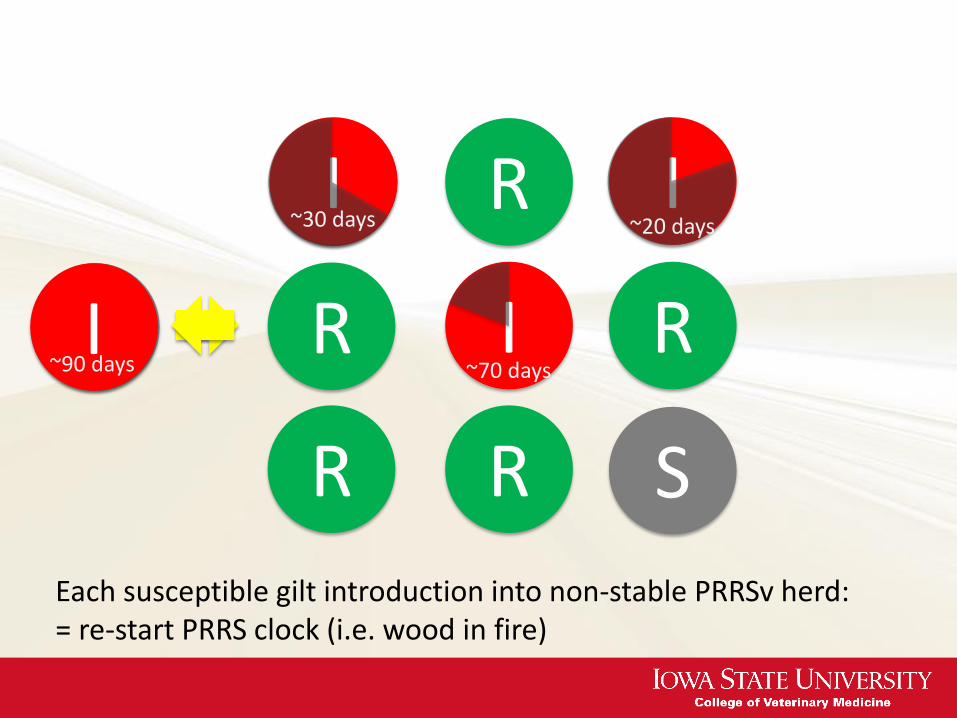
S
I R I
I
S
I
I R R
R R
~90 days
Each susceptible gilt introduction into non-stable PRRSv herd: = re-start PRRS clock (i.e. wood in fire)
~30 days
~70 days
~20 days

S
I R R
R
R
R
R
R
S
Introduction of susceptible gilt into stable PRRSv herd: = keeps gilt “susceptible” (not infected, not sick, not PRRSv source)
S
S

LCE with serum or vaccine?
Time to PRRSv-stability
(negative pig)
Impact on productivity
Time to baseline
production
Total production loss
Success rate
Cost / benefit
Evaluation of immune management
strategies to control PRRSv

Study design & methods
Breeding herds acutely infected with PRRSv
Herd closure + MLV (n=20)
Herd closure + LVI (n=41)
▼ ▼
Time to negative pig (TTNP)
▼ ▼
TTNP definition based on PRRSv monitoring:
• Herds were monitored for PRRSv by serum RT-PCR
• Monthly testing 30 piglets, starting at 12 weeks post intervention
• Herds achieved TTNP when 4 consecutive negative tests were obtained
• Based on Am. Assoc. Swine Vet.’s PRRS herd classification 2b (Holtkamp et al., 2011)
Prospective study:

The effect of treatment (LVI, MLV) on TTS was
adjusted by the following covariates*:
LVI vs
MLV
Number exposures
(doses)
Veterinary clinic
Days from detection
to LCE
RFLP pattern 1-
4-4
Prior PRRSv
infection
Statistical analysis:
• Descriptive
statistic
• Kaplan-Meier &
Cox proportional
hazards regression
* Information on covariates collected using a survey at the
moment of farm enrollment

0
1001
2.0
15
.1
16
.3
16
.9
20
.5
21
.0
21
.6
22
.9
24
.0
26
.0
26
.6
29
.4
30
.6
32
.0
33
.0
34
.6
38
.1
41
.7
% h
erd
s th
at a
chie
ved
TTN
P
Weeks post whole-herd inoculation
Cumulative TTNP - all farms
“200 days” was not enough to achieve TTNP for ~half of the herds:
200 days 300 days 84 days
~40% herds: ≥ 1 PCR-neg followed by PCR-positive

Treatment: LVI vs MLV
26.3
Median TTNP and 95% CI:
LVI: 26.3 (22.57, 29.57)
MLV: 33.0 (32.00, 41.00)
TTN
P p
rob
ab
ility
50%
(Log rank p-value 0.0171)
33.0

Median TTNP and 95% CI:
Prior_infect.: 26.00 (20.71, 30.57)
No prior inf.: 32.57 (26.28, 38.00)
(Log rank p-value 0.0066)
Prior PRRSv-infection: yes vs no TT
NP
pro
ba
bili
ty
Effect of LCE treatment on productivity
Part 2 of the study…

MLV herds had less total losses
Wilcoxon p-value 0.0171
Difference of 1,443 pigs / 1,000 sows
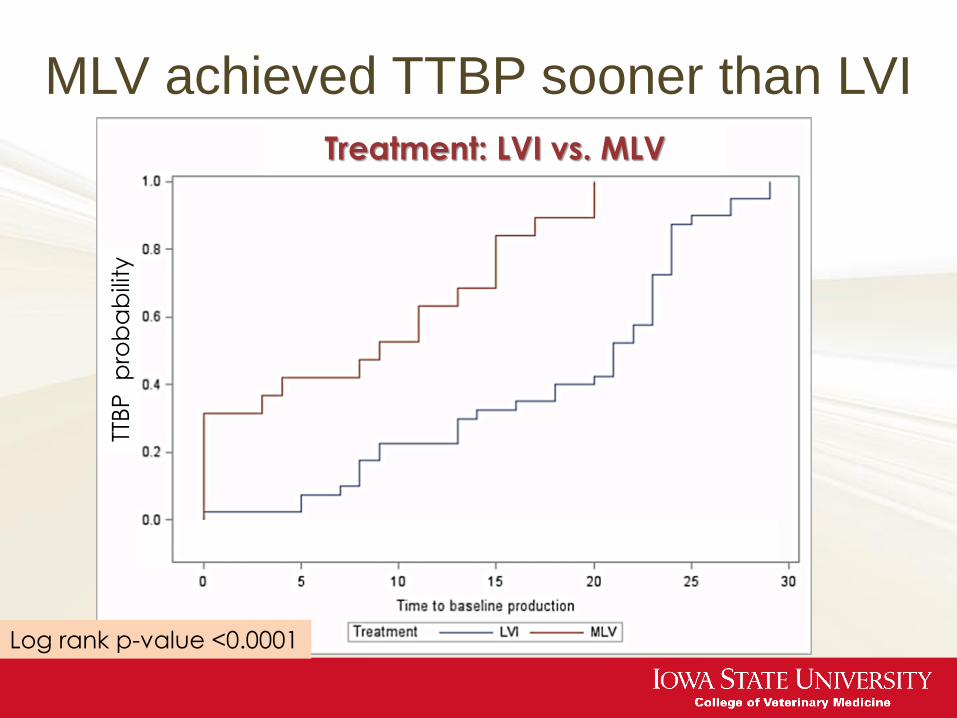
MLV achieved TTBP sooner than LVI
Treatment: LVI vs. MLV TT
BP
p
rob
ab
ility
Log rank p-value <0.0001

TTBP was shorter for herds w/ “prior PRRS-infection”
and herds of a specific veterinary clinic:
Log rank p-value <0.0014
Vet clinic “B” vs other herds
TTB
P
pro
ba
bili
ty
Prior PRRSv infection status
TTB
P
pro
ba
bili
ty
Log rank p-value <0.0031

0 10 20 30 40 50
LVI
MLV
Time (weeks)
Tre
atm
en
t PRRSv Load-Close-Homogenize
programs: 1-year timeline
TTS
TTBP Silent PRRS (!)
TTS
TTBP
Silent PRRS
virus shedding no signs
Production level was not good predictor of time-to-negative. Biosecurity and management practices should remain strict until Negative
Linhares, Cano, Torremorell, Morrison, Prev Vet Med, 2013

Economic analysis of immunization
strategies for PRRS control
Linhares D; Johnson C; Morrison R. PLOS One 10(12).
Production loss
TTNP
TTBP
LVI or MLV? Preventive vaccination?

The MLV program was economically
advantageous compared to the LVI
program
LVI MLV
Treatment Cost to
expose
Opportunity Cost for
pigs not weaned
Opportunity cost
for W-F
performance
Exposure TTBP Total
loss OC* TTNP OC* Total OC*
MLV $3,000
+ 12 1,222 $81,532
+
33 $199,799 = $284,330
LVI $100
+ 20 2,665 $177,809
+
26 $132,969 = $310,878
Difference (MLV-LVI) $96,277 ($66,829) $26,548 * OC = Opportunity cost

Economically worth it to preventively vaccinate
herds to “build” PRRSv herd immunity?
Lower production
impact if wild type PRRSv is introduced*
Continuous impact on PSY, growth performance**
It depends on frequency of PRRSv introduction
* Linhares et al., 2013 **Johnson, 2013 (field data); Bøtner et al., 1997; Dewey et al., 1999 and 2004; Nielsen et al., 2002
Considering attenuated PRRSv impact: 1.5 PSY, $ 1.00 growth performance Break even = 1 year & 9 months (Linhares, Johnson, Morrison, 2015 PLOS One)

Couple slides on success rate…
Part 4 of the study…

Herds that adopted LCE and completed PRRSv monitoring:
70% LVI and 75% MLV reached AASV category III
Failures: LVI: 3 new, 9 old; MLV: 3 new, 1 old
OLD and NEW virus OLD only
P = 0.2441
Failure (reinfected)
Success (negative)
LVI 12 (30%) 28 (70%)
MLV 4 (25%) 12 (75%)
Failure (reinfected)
Success (negative)
LVI 9 (24%) 28 (76%)
MLV 1 (8%) 12 (92%)
P = 0.1574

For herds that achieved TTNP :
80% LVIs and 86% MLVs reached AASV Category III
Failures: LVI: 2 new, 5 old; MLV: 2 new
OLD and NEW OLD only
Failure (reinfected)
Success (negative)
LVI 7 (20%) 28 (80%)
MLV 2 (14%) 12 (86%)
P = 0.2979
Failure (reinfected)
Success (negative)
LVI 5 (15%) 28 (85%)
MLV 0 (0 %) 12 (100%)
P = 0.1943

Summary

LCE with serum or vaccine?
time to PRRSv-
negative pig
Impact on productivity
time to baseline
production
Total production loss
Success rate
Cost / benefit
Success
rate
MLV ≈ LVI
TTNP
⬇ LVI
Total loss
⬇ MLV
TTBP
⬇ MLV
productivity
⬇ MLV
Cost/benefit:
MLV
General conclusions

General conclusions (continued)
• Herds achieved TTS sooner and had a less severe PRRSv break when:
– There was prior PRRSv infection in the 3 years prior to study
– Herds were part of a particular production system
• PRRSv monitoring:
– Needs to be repeated over time
– Monitoring scheme suggested by AASV (2011), which is based on n=30 samples/month over 4 months assumes that PRRSv infection dies out within 90 days once prevalence is below 10%. We showed that this was not always the case
– Don’t rely on sow farm productivity as sign that PRRSv is out

Best strategy?
Success Time to produce negative pig Time to baseline production Total loss attributed to PRRS
Practices to control PRRSv infection
Gilt exposure Time gilt exposed to
sow farm introduction
Sow exposure program
bio-management practices
Frequency of whole herd exposure
Herd closure-associated practices
Herd characteristics and PRRSv infection history prior
immunity nearby swine
density frequency of virus
introduction building layout
overall biosecurity level
parity segregation, batch farrowing
PRRSv status and PRRSv genetic line
Proposed model: Linhares & Holtkamp

General recommendations for PRRSv
control / elimination – sow herds
What Target,
Elimination path Target,
Control path
Virus circulation (prevalence)
Zero Low
Type of PRRS virus From wild type to none From wild type to MLV
Incoming gilts Naïve when prevalence reaches zero
Previously immunized (2-3 months)
Semen Naïve Naïve
Weaned pig vaccination strategy
Depends on probability of infection and type/severity of PRRSv in the neighborhood
Depends on probability of infection and type/severity of PRRSv in the neighborhood

Daniel Linhares, DVM, MBA, PhD
Veterinary Diagnostic and Production Animal Medicine
Iowa State University College of Veterinary Medicine
Office: (515) 294-9358 · Mobile: (515) 357-1044
http://field-prrs.blogspot.com/
http://www.smec.iastate.edu
Thank you very much!