strategies for lipid identification, profiling, and
TRANSCRIPT

The Pennsylvania State University
The Graduate School
Department of Chemistry
STRATEGIES FOR LIPID IDENTIFICATION, PROFILING, AND
QUANTIFICATION USING MASS SPECTROMETRY
A Dissertation in
Chemistry
by
Michael C. Stagliano
© 2010 Michael C. Stagliano
Submitted in Partial Fulfillment of the Requirements
for the Degree of
Doctor of Philosophy
December 2010

The dissertation of Michael C. Stagliano was reviewed and approved* by the following:
Mark P. Maroncelli Professor of Chemistry Chair of Committee
Alan J. Benesi Lecturer in Chemistry
James B. Anderson Evan Pugh Professor of Chemistry
Douglas D. Archibald Research Associate Department of Crop and Soil Sciences
A. Daniel Jones Professor of Biochemistry & Molecular Biology Professor of Chemistry Special Member, Michigan State University Dissertation Advisor
Barbara J. Garrison Shapiro Professor of Chemistry Head of the Department of Chemistry
*Signatures are on file in the Graduate School

iii
ABSTRACT
As recognition of the importance of the role of lipids in human biology, chemical
signaling, and plant defense mechanisms becomes more prevalent, new rapid methods for
identification, detection, and quantification are needed. Chapter 2 reports a new method
for filtering mass spectrometric data using the percent hydrogen of a compound. To
demonstrate the utility of the data filter, it was used to accelerate bioactive compound
discovery by directing biological assays toward anticipated neutral lipids. Through the
use of accurate mass measurements from time-of-flight (TOF) mass spectrometry (MS)
and fragment ion masses generated using nonselective collision-induced dissociation
(CID), a previously unknown lipid activator of constitutive androstane receptor 2 (CAR2)
was identified as di(2-ethylhexyl) phthalate (DEHP). Chapter 3 advances the ability of
mass spectrometry to selectively detect isomers, using a rapid ultra high performance
liquid chromatography-tandem mass spectrometry (UHPLC-MS/MS) method for
distinguishing two dioctyl phthalate esters, di(2-ethylhexyl) phthalate and di-n-octyl
phthalate (DNOP). Elution of the lipid standards is achieved in a 5 minute
chromatography run and multiple reaction monitoring (MRM) tandem mass spectrometry
methods yield data for quantification. In Chapter 4, a MS/MS method is developed upon
existing technologies to determine the relative ratios of isomeric
phosphatidylethanolamine (PE) lipids in Arabidopsis thaliana extracts. After
demonstrating the ability of the method to distinguish between isomers, the fragmentation
behavior of PE lipids was investigated. Commercially available PE standards, along with
custom, in-house synthetic standards were subjected to collision-induced dissociation at
various collision cell potentials to determine the effects of double bonds and head group
iv
modification on sn-1 compared to sn-2 position fragmentation. Results indicate that PE
lipid fragmentation can be directed by both of the aforementioned modifications,
resulting in a shift from sn-1 to sn-2 position fragmentation and formation of the
corresponding fatty acid ion.
The methods described in this dissertation serve to decrease the complexity of
mass spectral data sets, increase the ability to discover and quantify novel small molecule
metabolites, and enhance the understanding of lipid fragmentation behavior.
v
TABLE OF CONTENTS
LIST OF FIGURES .......................................................................................................... vii LIST OF TABLES............................................................................................................. xi PREFACE......................................................................................................................... xii ACKNOWLEDGEMENTS............................................................................................. xiv Chapter 1: Introduction .......................................................................................................1
1.1. The Quest to Discover Biological Functions of Genes........................................... 2 1.2. Structures and Functions of Lipids ......................................................................... 6
1.2.1. The Role of Lipids in Human Health – Nuclear Receptors ............................. 6 1.2.2. Functional Roles of Lipids in Plants................................................................ 8 1.2.3. Characteristics of Lipids ................................................................................ 11 1.2.4. Nomenclature of Phospholipids..................................................................... 12
1.3. Lipidomic Analyses and Related Analytical Challenges...................................... 14 1.4. Current Methods of Lipid Analysis ...................................................................... 17
1.4.1. Separation of Lipids....................................................................................... 17 1.4.2. Lipid Detection .............................................................................................. 23 1.4.3. Contemporary Approaches to Lipidomics ..................................................... 27
1.5. Summary of Research Goals................................................................................. 30 1.6. References............................................................................................................. 31
Chapter 2: Bioassay-Directed Fractionation for Discovery of Bioactive Neutral
Lipids Guided by Relative Mass Defect Filtering and Multiplexed Collision-Induced Dissociation.......................................................................................................41 2.1. Introduction........................................................................................................... 43 2.2. Materials and Methods.......................................................................................... 47
2.2.1. Materials ........................................................................................................ 47 2.2.2. Avoidance of Contamination ......................................................................... 47 2.2.3. Extraction of Lipids for GC-MS Analysis ..................................................... 47 2.2.4. Extraction of Lipids for Discovery and Fractionation ................................... 48 2.2.5. Fractionation of Lipid Extracts (Process 1) ................................................... 48 2.2.6. Reporter Assay............................................................................................... 49 2.2.7. Flow Injection Analysis-MS and HPLC-MS of Serum Fractions ................. 50 2.2.8. GC-MS of Phthalate Ester Standards and Extracts of Fetal Bovine Serum .. 51
2.3. Results and Discussion ......................................................................................... 52 2.3.1. Bioassay-Directed Fractionation.................................................................... 52 2.3.2. Identification of Bioactive Compound........................................................... 60
2.4. Conclusions........................................................................................................... 65 2.5. References............................................................................................................. 66

vi
Chapter 3: Rapid Isomer-Resolved Determination of Phthalate Ester Plasticizers using Ultra High Performance Liquid Chromatography-Tandem Mass Spectrometry ..72 3.1. Introduction........................................................................................................... 74 3.2. Materials and Methods.......................................................................................... 78
3.2.1. Materials ........................................................................................................ 78 3.2.2. Avoidance of Contamination ......................................................................... 78 3.2.3. Fetal Bovine Serum Extraction...................................................................... 78 3.2.4. Chromatography and Mass Spectrometry Conditions ................................... 79
3.2.4.1. Mobile Phase Composition ..................................................................... 79 3.2.4.2. Effect of Column Temperature on Phthalate Retention and Separation. 80 3.2.4.3. Collision-Induced Dissociation of Dioctyl Phthalate Isomers................ 81 3.2.4.4. Quantification of Dioctyl Phthalate Isomers in Fetal Bovine Serum ..... 81
3.3. Results and Discussion ......................................................................................... 83 3.3.1. Optimization of Chromatographic Resolution of Isomeric Phthalate Esters. 83
3.3.1.1. Effect of Mobile Phase Composition on Retention ................................ 83 3.3.1.2. Effect of Column Temperature on Retention.......................................... 86
3.3.2. Collision-Induced Dissociation of Dioctyl Phthalate Ions............................. 88 3.3.3. Quantification of DEHP in Fetal Bovine Serum............................................ 94
3.4. Conclusions........................................................................................................... 96 3.5. References............................................................................................................. 97
Chapter 4: Quantification of Target Phosphatidylethanolamine Plant Lipids using
Flow Injection Analysis with Multiple Reaction Monitoring.......................................104 4.1. Introduction......................................................................................................... 105 4.2. Materials and Methods........................................................................................ 109
4.2.1. Materials ...................................................................................................... 109 4.2.2. Synthesis of 1-Palmitoyl-2-Stearoyl-sn-Glycero-3-Phosphoethanolamine. 109 4.2.3. Flow Injection Analysis-Multiple Reaction Monitoring of PE Lipids ........ 110 4.2.4. Collision-Induced Dissociation of PE Lipid Standards ............................... 110 4.2.5. Effect of Phosphoethanolamine Head Group Modification......................... 111
4.3. Results and Discussion ....................................................................................... 112 4.3.1. Development and Application of a MRM Method ...................................... 112 4.3.2. Collision-Induced Dissociation of PE Lipid Standards ............................... 118 4.3.3. Effect of Phosphoethanolamine Head Group Modification......................... 125
4.4. Conclusions......................................................................................................... 128 4.5. References........................................................................................................... 129
Chapter 5: Concluding Remarks.....................................................................................133 APPENDIX 1: List of Acronyms ...................................................................................137

vii
LIST OF FIGURES
Figure 1-1: The structure of three lipids of different classes: cholesterol, a sterol; trilaurin, a triacylglycerol; and palmitic acid, a fatty acid ...........................................12
Figure 1-2: Example of the structure of a phosphatidylethanolamine lipid......................13 Figure 1-3: Examples of different MS/MS scanning modes for a triple quadrupole
mass spectrometer........................................................................................................26 Figure 2-1: Work flow for the discovery and identification of bioactive compounds......53 Figure 2-2: Total ion chromatogram from the LC separation of the active fraction
from Process 1 (fraction 17), highlighting the retention time window selected for summation of mass spectra ..........................................................................................54
Figure 2-3: The relationship between relative mass defect and % hydrogen for an
assortment or organic compounds. The dashed line indicates the range of interest, 600 to 1000 ppm ..........................................................................................................56
Figure 2-4: Histogram representing the frequency of relative mass defects for the
1345 discrete m/z values obtained by summing all mass spectra from retention times 4-8 min. The range of RMD values of interest, 600-1000 ppm, which likely target neutral lipids, is highlighted in orange...............................................................57
Figure 2-5: A summed spectrum obtained from the m/z values in the selected range
of Figure 2-4, representing all m/z values from this range. Peak A = m/z 214, B = m/z 251, C = m/z 279, D = m/z 374, E = m/z 391, F = m/z 448, G = m/z 638, H = m/z 680 .........................................................................................................................58
Figure 2-6: A summed spectrum obtained from the m/z values in the selected range
of Figure 2-4, represents the 21 remaining m/z values after intensity filtering and deisotoping. Peak D = m/z 374, E = m/z 391, F = m/z 448, G = m/z 638, H = m/z 680................................................................................................................................59
Figure 2-7: Extracted ion chromatograms depicting the second fractionation scheme
(Process 2) in which the three m/z values of interest are distributed among two collected fractions ........................................................................................................60
Figure 2-8: Structures of three dioctyl phthalate isomers, the branched-chained
isomers di(2-ethylhexyl) phthalate (DEHP) and di-isooctyl phthalate (DIOP), and the straight-chained di-n-octyl phthalate (DNOP).......................................................62

viii
Figure 2-9: GC-MS extracted ion chromatogram for m/z 149 for 5 µM DEHP and 5 µM DNOP standards. The peaks eluting at 12.22 minutes and 13.92 minutes correspond to DEHP and DNOP, respectively ............................................................63
Figure 2-10: GC-MS extracted ion chromatogram for m/z 149 for extract of 100 µL
of fetal bovine serum. The peak eluting at 12.22 minutes corresponds to DEHP, confirming the presence of DEHP in extracts of fetal bovine serum ..........................64
Figure 3-1: Structures of two phthalate isomers, branched-chained di(2-ethylhexyl)
phthalate (DEHP) and straight-chained di-n-octyl phthalate (DNOP) ........................74 Figure 3-2: Relationship between mobile phase methanol content upon capacity
factor showing mean k’ values (N = 3) for four different ammonium acetate concentrations (♦ 0 mM, ▲ 10 mM, ■ 50 mM, and ● 100 mM ammonium acetate). The inset groups of data represent a 5 fold magnification ...........................84
Figure 3-3: The relationship between the rate of change of k’ with the rate of change
in mobile phase ammonium acetate concentration, at different millimolar methanol concentrations. The equation of the best exponential fit is y = 118000e-
0.129x ..............................................................................................................................86 Figure 3-4: A van’t Hoff plot comparing the effect of temperature on the capacity
factor of the two phthalate standards. Each data point represents the mean of N = 3 analytical replicates...................................................................................................88
Figure 3-5: The proposed fragmentation pathway of protonated DNOP to a fragment
ion with m/z 149...........................................................................................................89 Figure 3-6: The proposed fragmentation pathway of protonated DEHP to a fragment
ion at m/z 149, showing the two observed intermediate fragments that are specific to this branched-chain isomer ......................................................................................90
Figure 3-7: Breakdown curves for two fragment ions (♦ m/z 149, ■ m/z 261) derived
from CID of protonated DNOP at nine different collision cell potentials...................91 Figure 3-8: Breakdown curves for four fragment ions (♦ m/z 149, ■ m/z 261, ▲ m/z
279, and ● m/z 167) derived from CID of protonated DEHP at nine different collision cell potentials ................................................................................................92
Figure 3-9: LC-MRM chromatogram of 5 µM each of DEHP and DNOP standards
showing the transition from the molecular ion [M+H]+ to a fragment ion common to both phthalates (m/z 149). Spectra were collected in ESI+ mode. Chromatograms were smoothed using the Savitzky-Golay method (3 scans, 3 smooths).......................................................................................................................93

ix
Figure 3-10: LC-MRM chromatogram of 5 µM each of DEHP and DNOP standards showing the transition from the molecular ion [M+H]+ to a fragment ion specific to DEHP (m/z 167). Spectra were collected in ESI+ mode. Chromatograms were smoothed using the Savitzky-Golay method (3 scans, 3 smooths)..............................94
Figure 4-1: The structure of a PE 34:0 (16:0-18:0), 1-palmitoyl-2-stearoyl-sn-
glycero-3-phosphatidylethanolamine, and the corresponding acylium ions generated by CID .......................................................................................................113
Figure 4-2: Mole percentage of Arabidopsis leaf fatty acids as determined using TLC
followed by GC FID analysis of FAMEs blue bars), by FIA-MRM Method 1 (orange) and FIA-MRM Method 2 (orange shaded). The error bars represent the standard error of N = 4 biological replicates .............................................................116
Figure 4-3: Relative amounts of fatty acid compositions for three isomers of PE 34:4
in an extract of Arabidopsis leaf tissue. The blue bar presents results obtained using FIA-MRM Method 1, monitoring the transition from sodiated 34:4 16:1 acylium fragment ion, and the maize bar presents results from FIA-MRM Method 2, monitoring the transition from sodiated 34:4 18:3 acylium ion. The peak areas for the two methods were normalized to the larger value ................................118
Figure 4-4: Observed fragmentation products of collision-induced dissociation of
protonated PE 34:1 (16:0-18:1) .................................................................................119 Figure 4-5: Breakdown curves for three fragment ions (♦ m/z 265, ■ m/z 239, ▲ m/z
577) derived from CID of protonated PE 34:1 (16:0-18:1) at 10 different collision cell potentials. At potentials of 5 V and below, only the protonated molecule was observed .....................................................................................................................120
Figure 4-6: Breakdown curves for three fragment ions (♦ m/z 263, ■ m/z 239, ▲ m/z
575) derived from CID of protonated PE 34:2 (16:0-18:2) at 10 different collision cell potentials .............................................................................................................121
Figure 4-7: The fragmentation products for deprotonated PE 34:1 (16:0-18:1) in
negative ion mode ......................................................................................................122 Figure 4-8: Breakdown curves for the two fatty acid anion fragments (♦ m/z 281, ■
m/z 255) derived from CID of deprotonated PE 34:1 (16:0-18:1) at 10 different collision cell potentials ..............................................................................................123
Figure 4-9: Breakdown curves for the two fatty acid anion fragments (♦ m/z 279, ■
m/z 255) derived from CID of deprotonated PE 34:2 (16:0-18:2) at 10 different collision cell potentials ..............................................................................................124

x
Figure 4-10: Product ion MS/MS spectrum for deprotonated BOC-protected PE 34:0 (sn-1 16:0-sn-2 18:0, at m/z 818). The peak at m/z 283 represents the C18:0 anion and the peak at m/z 255 represents the C16:0 anion. The structure of the lipid [M-H]- anion is inset on the spectrum. Note that the sn-2 fatty acid anion is the dominant product .......................................................................................................126
Figure 4-11: Product ion MS/MS spectrum for deprotonated PE 34:0 (sn-1 16:0-sn-2
18:0, at m/z 718). The peak at m/z 283 represents C18:0 anion and the peak at m/z 255 represents the C16:0 anion. The structure of the lipid [M-H]- anion is inset on the spectrum. Note that the sn-1 fatty acid anion is the dominant product...............127
xi
LIST OF TABLES
Table 3-1: Mobile Phase Composition of the Optimized UHPLC Gradient ....................81 Table 3-2: Optimized Source Cone and Collision Cell Potentials for MRM
Experiments .................................................................................................................82 Table 4-1: List of PE Lipids for MRM Method..............................................................114

xii
PREFACE
The research presented in Chapters 2 and 3 is the result of collaboration between
the Jones laboratory, at Michigan State University, and the Omiecinski laboratory at the
Pennsylvania State University. This work was supported, in part, by the National
Institutes of Health National Institute of General Medical Sciences [Grant GM066411 to
CJO]; by the Intramural Research program of the National Institutes of Health National
Institute of Environmental Health Sciences; by the National Institutes of Health National
Institute of Diabetes and Digestive and Kidney Diseases [Contract N01-DK-7-
0004/HHSN267200700004c]; by the Michigan Agricultural Experiment Station; and by
Michigan State University. Chapter 2 reports the analytical method for discovery of
DEHP as an activator of CAR2, while Chapter 3 investigates the effects of mobile phase
composition and column temperature on analyte retention. The biological studies of
CAR2 activation is discussed in a previous publication (DeKeyser, J. G.; Stagliano, M.
C.; Auerbach, S. S.; Prabhu, K. S.; Jones, A. D.; Omiecinski, C. J., Di(2-ethylhexyl)
Phthalate is a Highly Potent Agonist for the Human Constitutive Androstane Receptor
Splice Variant CAR2. Molecular Pharmacology 2009, 75, (5), 1005-1013.) The reporter
cell assays mentioned in Chapter 2 were conducted by Dr. Joshua G. DeKeyser (now at
Amgen in Thousand Oaks, CA). He also provided the fetal bovine samples (FBS) and
conducted the extraction and normal-phase liquid chromatography (LC) separation of
lipids from fetal bovine serum. The research in Chapter 2 was submitted to Rapid
Communications in Mass Spectrometry on June 7, 2010, and was accepted for publication
on September 21, 2010. For Chapter 4, lipid extracts from Arabidopsis thaliana and the
fatty acid methyl ester (FAME) gas chromatography (GC) flame ionization detector

xiii
(FID) data were collected by Terry M. Ball, a staff member in the laboratory of Dr.
Robert L. Last at Michigan State University. Assistance with the PE lipid synthesis was
obtained from Sarah E. Marshall, a graduate student in the research laboratory of Dr.
Babak Borhan at Michigan State University. All other content of this dissertation
represents the original contributions of the author.

xiv
ACKNOWLEDGEMENTS
As my long journey through graduate school comes to a close, there a number of
people I must thank. First and foremost, I must acknowledge my advisor Dr. A. Daniel
Jones. Over the last seven years, he has provided everything any graduate student could
ask for in an advisor: promoting of an atmosphere conducive to success (and failure
when needed), providing useful scientist discussions, and being a great mentor and
friend. Second, I thank my parents Deanna and A. J., along with my sisters Christina and
Angela for all their love, support, and encouragement along the way. I could not have
made this journey without you.
I would also like to thank Dr. John C. Hanley, Jr., a former Jones lab member, for
his friendship over the past six years, providing a forum for scientific discussion and
companionship for many ASMS, Penn State football, and California adventures; I am
sure there are many more to come! I am also grateful for the life-long friendships forged
at Penn State, in my brief time there, especially those of Seth, Mike, Pat, TJ, and Lander.
I also want to thank my friends at Michigan State: Nileena, Sue, Siobhan, Kris, Alex,
Danielle, Aaron, Eric, and Sarah – you guys always made a tough day seem brighter. It
truly has been a pleasure to get to know (and work with some of) you. You are the best
graduate school companions and lifelong friends anyone could ask for; thank you. To my
friends from U of M (Kevin, Dan, Mel, Kramer, Adam, and Jared) and from back home
in Philadelphia (E. J. and Chris), thank you for your encouragement along the way. You
ensured that I remained sane for the past seven years by visiting Michigan, and providing
an ear for when I needed to vent. Thank you.

“A pessimist sees the difficulty in every opportunity; an optimist sees the opportunity in
every difficulty.” – Winston Churchill

Chapter 1: Introduction

2
1.1. The Quest to Discover Biological Functions of Genes
Since prehistoric times, humankind has exploited the recognition that biological
traits are passed along from parent to progeny, and this awareness served as the
foundation for improvements in crop and other agricultural production. In the mid-19th
century, the pioneering work of Gregor Mendel provided a mathematical analysis of
inheritance suggesting that traits were inherited as discrete units. In the early 20th
century, the Danish plant researcher Wilhelm Johansen first coined the term “gene” to
describe these discrete units,1 but the chemical nature of genes remained elusive for
years. In the 1940s, Oswald Avery and colleagues demonstrated that genetic information
was encoded by deoxyribonucleic acid (DNA),2 and this discovery was soon followed by
characterization of the chemical structure of DNA by Crick, Watson, Wilkins, and
Franklin.3-7 The dawn of the 21st century has coincided with the emergence of whole
genome DNA sequencing, and a complete draft of the human genome was released to the
public in 2003.8
The human genome consists of 2.9 billion base pairs that encode for an estimated
20,000-25,000 genes,9 but despite the explosion of genomic information, the functions of
many genes remain unknown. While faster analytical technologies aim to make personal
genome sequencing an affordable reality, what is missing are comparable advances
capable of assessing biological phenotypes, which are the functional outcomes of the
combined influences of genetics and environment. In the realm of human health, recent
policy changes are shifting the emphasis of healthcare from standardized treatment of
disease to preventive and personalized medicine.10 This will require analytical
technologies that can better define an individual’s physiological state, and will rely on

3
cost-effective measurements of protein, nucleic acid, and metabolite biomarkers in
accessible materials such as blood and urine. One such test, PreDxTM, recently developed
by Tethys Corporation uses 7 biomarkers to determine the likelihood of developing Type
II diabetes within 5 years.11
Over the past decade, numerous whole genomes have been sequenced for various
microbes, plants, animals, and individual humans. While these results were awaited with
anxious anticipation, the release of whole genome sequences was followed by realization
that functions of most genes were not readily discerned from their DNA sequences.
There were still many questions to be answered, including: are the genes expressed (is
genetic information converted into protein synthesis), does a single gene encode for more
than one protein (as a result of alternative messenger ribonucleic acid (mRNA) splicing),
and how are gene expression and functions regulated by interactions with various small
molecule metabolites. While the function of some genes can be inferred from those with
similar DNA sequences and known functions, functions of a substantial fraction of genes
remain unknown.
To address these issues, researchers used the tools of modern molecular biology
to define phenotypes using an approach termed transcriptomics, or profiling of the set of
mRNA molecules present in tissues or cells. The quantity of each mRNA serves as a
measure of the levels of gene expression. Characterization of fragments of mRNA,
known as expressed sequence tag sequencing, and mRNA profiling with either
microarrays or serial analysis of gene expression, enables researchers to achieve
comprehensive transcriptome analysis.12 However, it is well documented that changes in
mRNA levels do not always correspond to changes in protein levels.13-15 Furthermore, a

4
change in protein expression does not guarantee a change in activity. As a result,
profiling of mRNA or proteins often fails to reveal mechanisms that regulate cellular
functions, and these approaches yield an incomplete view of the physiological state of
cells, tissues, or organisms. Small molecule metabolites can fill many of these
information gaps, as they are both end products and regulators of many protein functions.
Therefore, the regulation of protein function is best determined by detection,
identification, and quantification of the small molecule products, or metabolites, from
these proteins.
Comprehensive analysis of metabolites in a system has been termed
metabolomics. Metabolites, small molecules not directly encoded for by DNA, including
lipids, sugars, and organic acids, are the end products of enzyme and transporter
functions. Changes in the metabolome can serve as a marker of an organism’s
physiological state, including responses to disease, environmental influences, or genetic
differences, thus making the metabolome the most predictive of phenotype.16 Therefore,
a powerful approach to understanding the functions of genes and the roles of proteins
involves measuring all of the chemical constituents of tissues or biological fluids. By
coupling information about the dynamics of metabolite levels with genomic DNA
sequences and comprehensive measurements of protein and transcript abundances, a
more complete understanding of the inner workings of living systems can be attained.
One of the major foci of metabolomics involves the quest to identify functions of
individual genes through studies of organisms with specific genes inactivated (knockout
mutants) or silenced, and understand cellular responses to genetic and environmental
factors, as well as discover new biomarkers for disease.

5
The “omics” revolution, which assesses genetic and phenotypic information in a
global manner, has changed the approaches taken to elucidate the roles of proteins,
metabolites, lipids, and other compounds in biological systems. Instead of focusing an
analysis on one particular compound, a systems biology (global) approach is taken.
Similar to proteomics, analysis of the entire complement of proteins, and metabolomics,
analysis of the complete suite of metabolites, comprehensive analyses of all lipids, or
lipidomics, deals with the lipid subset of the metabolome. Lipidomic analyses will
simultaneously reveal the dynamics of thousands of lipids across multiple classes. Where
older one-at-a-time methods yield limited information, lipidomics can provide
information about dynamic changes in lipid levels, allowing conclusions to be drawn
about relationships between specific lipids and various biological functions including
chemical signaling and plant defense mechanisms.17,18 Lipidomic analyses have enabled
a worldwide research community to comprehend the basic principles of biology across
several biological kingdoms. However, one of the great challenges facing lipidomic
research continues to involve how to process, manage, and interpret the large volumes of
data generated by lipidomic analyses.
6
1.2. Structures and Functions of Lipids
1.2.1. The Role of Lipids in Human Health – Nuclear Receptors
Living things are exposed to numerous chemicals including reactive metabolic
intermediates, hormones, and xenobiotics. All cell types respond to these chemicals in a
variety of ways, with recent focus on the expression of a group of proteins known as
nuclear receptors (NRs). NRs are activated by the binding of various endogenous and
exogenous compounds followed by protein translocation to the cell nucleus. Once within
the nucleus, these proteins can interact with other proteins and DNA, initiating gene
transcription.19 Based on these functions, NRs are considered to make up a superfamily
of transcription factors. Activated NRs regulate the expression of target genes, many of
which control cell development, reproduction, and metabolism. Failure of these receptors
to execute their physiological tasks often results in carcinogenesis, infertility, cancer,
diabetes, inflammation, and obesity.20-22 Therefore, improving our understanding of the
events that activate nuclear receptors provides an important step toward determining gene
function. The roles of these receptors in various disease states also makes them excellent
targets for pharmaceuticals, with current drugs, such as tamoxifen (breast cancer) and
retinoids (skin disorders) targeting these receptors.23
Although numerous nuclear receptors have been discovered, the endogenous
ligands that activate many NRs remain unknown, as do their physiological functions.
These NRs are termed orphan nuclear receptors. Studies have shown that many of these
orphan NRs have a strong affinity for lipid binding, acting as a lipid sensor and protecting
cells from lipid overload.22 Even more important is evidence that dietary lipids, fatty
acids, bile acids, oxysterols, and xenobiotics bind to these receptors. Activation of

7
orphan nuclear receptors often triggers a metabolic cascade, maintaining lipid
homeostasis by governing transcription of genes involved in the metabolism, storage,
transport, and elimination of lipids. Discoveries of orphan nuclear receptors have
enabled scientists to identify three families of proteins responsible for the auto-regulation
of lipid homeostasis: cytochrome P450 enzymes responsible for oxidation of lipids to
non-reactive metabolites, intracellular lipid-binding proteins responsible for buffering
and transporting hydrophobic ligands within cells, and ATP-binding cassette transporters,
which remove lipid ligand precursors from the cytosol to organelles or extracellular
environment.22 Despite recent efforts, over half of the proposed orphan nuclear receptors
are still without any identified ligands.19
The discovery of endogenous ligands for orphan receptors involves an intensive
process. Traditional approaches for discovery start with development of assays that can
assess receptor activation, often using synthetic molecules, followed by purification of a
ligand from biological fluids by continuous fractionation. After isolation and
purification, the ligand’s activity is characterized, before receptor-coding circular DNA
(cDNA) segments are “fished for” using either receptor purification or expression
cloning. Amplification of the cDNA by polymerase chain reaction enables incorporation
of the NR gene into cells for large-scale screening of compound libraries for antagonists
and agonists.24
In the last decade, numerous researchers21,25-27 have used a new method for NR
discovery proposed by Sidney Brenner and popularized by Craig Venter. Named the
reverse molecular pharmacology model, this method sequences random cDNA segments
chosen from libraries before making the nuclear receptor. Then, extensive bioinformatic

8
analysis to predict structural characteristics of the coded protein is conducted. The cDNA
is recombinantly expressed in cells, and then a bioassay is used to screen thousands of
compounds for activity. In some cases, the libraries used have been selected for by
computational modeling, and often companies will make or buy specific libraries of
compounds for screening.24
Recent discoveries indicate lipids, only behind hormones, act as the largest group
of nuclear receptor activators, playing an important role in cell, tissue, and organ
physiology.28 In the form of fats, cholesterol, and phospholipids, lipids are present in
most foods, and diet serves as the greatest source of lipids in the human body. In
addition, science has demonstrated that cells recognize lipids with exquisite specificity,
and that the roles of individual lipids depend on their local concentrations.29 Therefore,
the identification of lipids that activate both known and orphan nuclear receptors will
enable scientists to better probe and control physiological changes in an organism, thus
bridging the current gap in knowledge between cellular response to environmental and
dietary changes. The need to discover new bioactive compounds is not only beneficial to
the pharmaceutical industry, but also to advancing the science of human health. To
accomplish this goal, new high-throughput and low cost methods for lipid detection and
quantification are needed.
1.2.2. Functional Roles of Lipids in Plants
Lipids are also important components of plants, playing crucial roles in cell
signaling, sequestration of molecules in various cellular compartments, and regulating

9
functions of membrane proteins. One example of the role of lipids in chemical signaling
occurs when a cell is damaged, releasing calcium ions from inside the cell to the
surroundings, activating phospholipases, enzymes that hydrolyze ester groups on
phospholipids. Hydrolyzed phospholipids exert a vast range of regulatory functions
ranging from membrane trafficking and lipid degradation to cell growth, survival, and
cell signaling.30 In plants, phospholipids, sphingolipids, fatty acids, and sterols play roles
in chemical signaling.31
Plants provide convenient model systems for investigating gene functions because
genetic and genomic resources are plentiful, and genetic transformations are often easily
performed. It is important to understand the effect of genetic modifications of plants on
changes in mechanisms that respond to different stresses. In any organism, the benefit of
expressing a desired trait is lost if its ability to protect itself from different stresses is
weakened. This is especially true in plants because they are immobile, preventing them
from escaping predators the way animals can. Instead, plants must rely on biochemical
mechanisms to defend themselves and prevent further attack and wounding. Plants must
have distinct chemical responses to different forms of environmental stress in order to
thrive. Recent research has shown that plants can respond to a wide range of biotic and
abiotic factors, including temperature, water, air, chemicals, light, touch, motion, insects,
and pathogens, but a more thorough investigation in the chemical changes undergone
during wounding is needed.32
The assortment of responses triggered in plants occurs through mechanisms that
widely remain unknown. Research by Ted Farmer of the University of Lausanne has

10
shown that when a plant is stressed, either by injury or lack of nutrients, lipid-signaling
enzymes are activated and oxylipins, which are oxidized lipids, are produced.33 In related
work, Professor Xuemin Wang of the Danforth Center noted that when a plant
experiences extreme temperature conditions or is wounded, there is an increase in
concentration of phosphatidic acid in cells. Under similar conditions, the same is true for
free fatty acids.30 Moreover, the effects of stress or wounding can be seen as a change of
lipid membrane composition with incorporation of more lysophospholipids.34 Therefore,
the change in levels of these signaling lipids can be measured to study chemical signaling
using the model plant, Arabidopsis thaliana.
Lipid profiles present information important for discerning how plants respond to
mechanical wounding and herbivory by insects. When a plant is wounded by an insect,
there are two marks left, one is the mechanical damage, and the other is the change in
chemistry that results from stress-altered metabolic processes. Mayer and colleagues
showed that plants exhibit different lipid profiles corresponding to attack by different
insects, indicating a mechanism of recognition to a “specific chemical fingerprint” of the
insect. The levels of different lipids can then be analyzed to explore mechanistic
relationships between wounding and biochemical signaling. Such lipid profiles can be
related to other changes in both plants and insects such as the expression of individual
genes. For example, oxylipins mediate a plant’s response to wounding by an insect,
while phospholipids signal for the plant to take appropriate action.33,35,36
Numerous plant lipids serve as phytohormones that regulate plant responses to
stress. Profiling of plant signaling lipids provides a powerful approach toward

11
understanding the underlying chemistry that occurs between a wounded plant and an
insect, and the genetic and biochemical basis for these interactions. Not only do plants
respond to different types of wounding, but their responses are distinct for injuries from
different species of insect,37 and it is presumed that lipid hormones regulate much of this
response. Furthermore, development of more stress-resistant agricultural crops will
require better understanding of the genes and biochemical pathways responsible for the
molecular events that trigger specific responses and the mechanisms by which lipids and
other metabolites transmit signals between cells and tissues.31 One of the most
challenging aspects of lipid profiling lies in identifying which signaling lipids activate
specific receptors and to elucidate the associated network of induced gene expression.30
While many current methods detect appreciable changes in many metabolites, it is often
the changes in the levels of low concentration lipids that go undetected. The challenge of
identifying these remaining unknown compounds requires the development of more
robust LC-MS approaches for lipid analysis.
1.2.3. Characteristics of Lipids
Lipids consist of a broad class of structurally diverse compounds with biological
origin, including fats, waxes, and fat soluble vitamins, sharing only common solubility
properties. Some examples of lipid structures are depicted in Figure 1-1 and Figure 1-2.
They are amphiphilic compounds with a hydrophobic tail, usually long carbon chains,
and hydrophilic head groups. The characteristic that defines lipids is that they have
limited solubility in water, but are soluble in organic solvents such as ether, chloroform,
benzene, acetone, isopropanol, and methanol.38 The number of structural classes of lipids

12
is large. The most commonly studied lipids include fatty acids, sterols, glycerolipids,
phospholipids (glycerophospholipids), and sphingolipids. Lipids can also be classified as
neutral (glycerolipids and steroids) and lipids with more polar, sometimes ionic
functional groups (fatty acids, sphingolipids, and phospholipids).38
Figure 1-1: The structure of three lipids of different classes: cholesterol, a sterol; trilaurin, a triacylglycerol; and palmitic acid, a fatty acid.
1.2.4. Nomenclature of Phospholipids
The most common phospholipids are constructed of a glycerol backbone with
fatty acids esterified in sn-1 and sn-2 positions, and a phosphate group at sn-3. Other
groups may be attached to the phosphate group, and these confer different properties such
as size and charge. For example, the phospholipid pictured in Figure 1-2 is 1-palmitoyl-
2-oleoyl-sn-glycero-3-phosphoethanolamine. In position 1 is a 16 carbon fatty acid with

13
no double bonds and in position 2 is an 18 carbon fatty acid with 1 double bond.
Shorthand notation for phospholipids lists the number of carbons and double bonds in
both sn-1 and sn-2 positions, followed by the type of lipid. Therefore, the lipid below is
labeled PE 16:0-18:1. In cases where the position of the fatty acids is unknown, a generic
name, PE 34:1, which lists the total number of carbon atoms and double bonds in the two
fatty acyl chains, is used.
Figure 1-2: Example of the structure of a phosphatidylethanolamine lipid.
14
1.3. Lipidomic Analyses and Related Analytical Challenges
Comprehensive analyses of intact lipids are a recent advance that has been made
possible by the development of LC-MS technologies. Previous lipid profiling consisted
of fractionating lipids by their chemical classes, and in many cases, releasing fatty acids
by solvolysis and analyzing them, usually by gas chromatography. In recent years, it has
been suggested that comprehensive profiling of all lipids be termed lipidomics. The
primary goal of lipidomics is to determine the effects of genetics and environment on
biological functions, as revealed by using lipid profiles as biomarkers. As noted in the
previous section, scientists are building a more complete understanding of the important
role lipids play in regulation of gene expression and protein functions, and as indicators
of physiological state. These distinctive biochemical roles and biophysical properties
make lipids excellent targets for quantifying as biomarkers. For lipidomics to reach its
full potential, researchers should strive for quantitative measurement of all lipids and
identification of their functions at the cellular level.29 This requires knowledge of the
localized lipid profile at a given time, the dynamics of lipid concentrations over multiple
time points, and identification of other molecules with which lipids interact.
Accomplishing these goals presents a formidable challenge and provides the
impetus for development of tools and protocols capable of providing complete
information about lipids. Unlike comprehensive screening methods such as whole
genome microarrays that can profile expression of all genes, there is no boxed kit or pre-
determined method that routinely measures all lipids. This is due, in part, to the
structural diversity of lipids, our lack of knowledge about the structures of all lipids of
biological relevance, and the wide and dynamic range of lipid concentrations within cells

15
or tissue extracts. Researchers have suggested that there are more than 180,000 different
phospholipid structures that could be present in any sample.39 Therefore, akin to other
“omics” it is challenging to establish a link between levels of individual lipids and gene
functions or physiological states because these lipids may act as part of complex
networks that influence biological functions.
With such a daunting number of compounds to screen for and analyze, it is
appropriate to begin by choosing a single analytical technique capable of providing the
broadest coverage of the lipidome. Such a technique should provide reliable quantitative
measurements for numerous lipids. For individual components, the dymanic range of the
most powerful analytical techniques lies between 104 and 106 in terms of the range of
concentrations that can be measured.40 The ideal technique would be free from matrix
interferences that could mask measurement of specific compounds or yield false positive
measurements. Modern mass spectrometric methods address many of these concerns,
with the latest generation of instruments providing capabilities to detect and quantify
substances at levels of less than 10-15 moles while providing molecular and fragment
mass information that can distinguish many lipids. However, methodologies based on
MS methods suffer from incomplete selectivity, as numerous substances may share a
common nominal molecular mass. Furthermore, other compounds from the sample
matrix may interfere with accurate quantification by suppressing ionization of target
compounds.
Another challenge in lipidomics lies in the process of sampling biological tissues.
Typical sampling of lipids from tissues is invasive, and often involves harvesting of
tissues or biological fluids that perturb the organism by inflicting new stresses, and in
16
some cases, requires death of sample sources.41,42 Therefore, establishing the dynamics
of lipids often requires study of model laboratory plants and animals.
The lack of many pure lipid standards presents an additional challenge to
scientists performing lipidomics. Commercially available standards are often a mixture
of isomers, having been extracted and purified from biological tissues. This makes
method development for lipidomics rather difficult, and requires the use of model
organisms with well documented metabolome and lipidome profiles. The unavailability
of a wide range of lipid standards, especially isomeric lipid standards, make absolute
quantification equally difficult.

17
1.4. Current Methods of Lipid Analysis
1.4.1. Separation of Lipids
The complexity of the lipidome often requires physical separation of individual
lipid forms before detection. Many methods have been developed that achieve partial
separation, but no single separation procedure can resolve all of the potential lipids
present in biological tissues or fluids.
A separation is “the art and science of maximizing separative transport relative to
dispersive transport”43 or more simply, the “unmixing” of a mixture into its components.
The documented use of separations dates back to the late 1600s, indicating the
importance of compound purification.38 Chromatography, the collective term for a
group of analytical techniques for separating mixtures, involves passing a mixture of
analytes dissolved in a mobile phase across a stationary phase, isolating analytes from
other molecules in the mixture by partitioning based on differences in their relative
affinities for the mobile and stationary phases.
Chromatographic methods commonly used for lipid separation include thin layer
chromatography (TLC), GC-MS of FAMEs, and high performance liquid
chromatography (HPLC). TLC is the simplest and most widely used chromatographic
method for the separation of lipids, and is still popular today.44-47 The stationary phase is
usually comprised of silica gel (or sometimes alumina) that presents a polar medium that
is immobilized on a glass plate. The mobile phase usually consists of a mixture of
solvents of varied polarity including chloroform, methanol, and water, although
isopropanol, hexane, ethanol, acetone, toluene, and triethylamine are sometimes used.
Small aliquots of sample are spotted 1-2 cm from the bottom of the plate, and the bottom
18
of the plate is placed in a small amount of mobile phase. Capillary action drives the
liquid to move from the bottom of the plate toward the top. Analytes migrate towards the
top at different rates, based on their partitioning between the mobile and stationary
phases. After the mobile phase front has migrated to the top of the plate, the plate is
removed. Different classes of lipids will have migrated different distances because their
partition behavior is largely determined by the polarity of their most polar functional
groups. Since many lipids lack useful visible or ultraviolet chromophores, visualization
of lipids on the plate requires that the plates be stained: for UV detection berberine or
rhodamine 6G is used, whereas for conversion of lipids to visible products, treatments are
performed using sulfuric acid, phosphomolybdic acid, or copper sulfate in phosphoric
acid, followed by heating at 180 °C for about an hour. Lipid classes are then identified
based on comparing their retention factor (Rf), which is the ratio of the distance the
analyte traveled to the total distance the solvent traveled, to Rf values for lipid standards.
The spots can be quantified using densitometry, or scraped off the plate for subsequent
identification using GC-MS.38,48,49 Improvements to TLC separations include attempts to
better the resolution through addition of both organic and inorganic compounds to the
silica gel50-52 and to obtain faster and more efficient separations using smaller particles or
finer gel grades.48 Such improvements are known as high performance TLC.
The advantages of TLC separations include speed of analysis, low cost, little or
no sample preparation, visualization of results, and simultaneous analysis of multiple
samples in parallel.48,49 Inadequate resolution can be quickly improved. Modifying the
solvent system or rotating the plate 90 degrees and use of a different solvent system (two-
dimensional TLC) allow for additional separations on the same plate.50 However, TLC is

19
not easily automated, offers limited resolving power, and suffers from poor
reproducibility in retention. Separated lipids on the silica coated plate are susceptible to
oxidation and hydrolysis while exposed to the atmosphere. In addition, silica gel
particles used for TLC are not uniform, creating uneven voids in the stationary phase that
limit analyte resolution.
While TLC is useful for separating different classes of lipid based largely on their
polar head group, silica TLC separations usually do not resolve variations within a class
that involve changes in fatty acid composition. The most common method to analyze
individual fatty acyl chains on phospholipids is GC-MS of fatty acids that have been
converted to their methyl esters, confering improved volatility and separation.50
Phospholipids are nonvolatile, and are derivatized for analysis by methyl esterification
after they are removed from the glycerol backbone by hydrolysis, or in a single
transesterification reaction. By using a nonpolar capillary column, FAMEs will elute
based on their boiling point. This approach may separate some fatty acids, but improved
separations based on the number of double bonds is achieved using columns with more
polar constituents such as cyanopropyl groups, achieving greater retention of FAMEs
with increasing unsaturation. A flame ionization detector or a mass spectrometer can be
used to accurately quantify the sample constituents.48 The principal drawbacks of FAME
GC analyses include the loss of information pertaining to the attachment of the fatty acyl
chains to the glycerol backbone and lack of automation.48
A few research groups have demonstrated phospholipid separations by class using
capillary electrophoresis (CE) and have described experimental setup and operating
conditions.53-56 Developed in 1981 by Jorgenson and Lukacs, CE separation is driven by

20
an electric field and flow through a capillary. Through the use of small diameter silica
capillaries (10-100 µm) CE offers analysis of small (< 1 µl) sample volumes and a high
number of theoretical plates (efficient separation).56 The drawbacks of CE include low
throughput due to single sample analysis57 and the need for complex buffer systems,
which can be incompatible with some lipids and the mode of sample detection.58 Since
most lipids exhibit low solubility in electrically conducting solvents, because of the high
water content, lipid separations that rely on CE instrumentation often employ micellar
electrokinetic chromatography (MEKC) which incorporates detergents in the mobile
phase at concentrations that form micelles. Lipid separations are then driven by
partitioning between micelle and mobile phase. Since coupling MEKC to mass
spectrometry is difficult because of the presence of detergents, some researchers have
obtained similar separations using non-aqueous CE.54,56 However, more traditional liquid
chromatographic methods are generally preferable for comprehensive lipid separations.
In 1900, Mikhail Tswett used a packed column of calcium carbonate to separate
plant pigments. His findings, published in 1903, were dismissed by the scientific
community, did not resurface until 1931, when Kuhn and coworkers conducted
carotenoid studies. Their work re-introduced the scientific community to column
chromatography (liquid chromatography). In the 1970s, improvements included
pressurization of the column, use of smaller particle sizes for packing material, smaller
column inner diameter, and shorter columns. This new technology, termed high
performance liquid chromatography, led to reduced separation times and improved
chromatographic resolution. Recent improvements include the use of sub-2µm particles
and even shorter columns, leading to the coining of the term ultra high performance

21
liquid chromatography which has become the standard technique used for a wide range of
separations.
High performance liquid chromatography offers many benefits for separations. A
wide range of mobile phases can be tailored for the separation of multiple lipid classes
and mobile phase gradients and temperature gradients are easily controlled to enhance
separation selectivity. This latter feature is not feasible using CE, which is one of its
great shortcomings.55 Also, unlike TLC, HPLC offers the ability to control the flow rate.
Optimal liquid chromatographic separations require higher flow rates that are only
delivered by high pressure pumps. Furthermore, HPLC methods can be fully automated
and require minimal sample preparation. Research by Moreau,59 Christie,60 and
Karlsson61 demonstrated that HPLC is a practical method for lipid separation by class,
currently making HPLC the preferred method of separation.
Reversed-phase (RP) HPLC, which entails use of nonpolar columns and relatively
polar mobile phases, has become the dominant approach to liquid chromatographic
separations.62 There are two models to describe retention in reversed-phase HPLC.
Solvophobic theory is the oldest accepted model, attributing retention to mobile phase
characteristics.63 This theory assumes the stationary phase is a passive entity, and only
provides a sorptive site for analyte retention. The driving force for retention is based on
the differences in the Gibbs free energy of formation for the solvation sphere for the
solute in the mobile phase compared to complexation of the solute to the stationary
phase. Adsorption onto the stationary phase is described as being driven by unfavorable
energetics of analyte solvation by the mobile phase. Recent studies64,65 of the shape and
chain density of the bonded hydrocarbon stationary phase suggest that the solvophobic
22
theory is incomplete. The results indicate that controlling the two factors above can
greatly affect retention in reversed-phase LC, concluding that the stationary phase does
play an active thermodynamic role in retention, with solute molecules partitioning
between the stationary and mobile phases.63
The second, more advanced model to describe RP retention was developed by
Jaroniec in the late 1980s. His explanation of analyte retention invokes a combination of
RP partitioning mechanisms and solute adsorption. Specifically, he attributes the
distribution of solute molecules between the stationary and mobile phases as the direct
result of two different molecular processes. The first is the difference between the
adsorption potentials of the analyte of interest and other solute molecules to the surface of
the mobile phase. The second is the differences in the interaction free energies of the
analyte molecules with the stationary and mobile phases.66 Jaroniec and Martire verified
their model by conducting a series of LC experiments on solute-solvent interactions using
mixed mobile phases.67
Solution thermodynamic studies63 have determined that the driving forces for
retention in reversed-phase liquid chromatography are solute partitioning between the
two phases, with most of the free energy of retention coming from solute interactions
with the stationary phase. In other words, retention is controlled through the interactions
of the hydrophobic part of the solute molecule with the hydrophobic part of the stationary
phase, while selectivity is controlled by interactions of the hydrophilic part of the solute
with the mobile phase.
Retention and elution of solute compounds in reversed-phase liquid
chromatography is a complex, yet controllable process. Research has shown that
retention is directed by many factors, including the composition of the stationary phase
and the solvent composition of the mobile phase. After selection of a column, the
23
thermodynamics of both solute-stationary phase and solute-solvent interactions can be
further manipulated by adjustment of the column temperature, solvent selection, and
addition of additives, such as ammonium acetate, to the mobile phase.
1.4.2. Lipid Detection
Lipids span a diverse group of structural classes, and many lack useful ultraviolet
(UV) or visible chromophores that can be used for universal lipid detection. Moreau59
and Christie60 have demonstrated the use of UV-visible spectroscopy to detect some
lipids. Drawbacks of this technique include the lack of detection of non-chromophore
containing lipids and the lack of detection of low abundance lipids. Other researchers
have employed nuclear magnetic resonance (NMR) for lipid detection,68,69 but this often
requires high concentration (1 mg/mL) and relatively pure samples. Although both
chromatographic and NMR methods have contributed to the advancement of lipidomics,
“it is inarguably the recent advances in mass spectrometry that have propelled the field
forward.”39 These advances make MS the analytical technique of choice for quantitative
lipidomics because of its high sensitivity, wide mass range, and ability to offer structural
data for compounds in low picomolar amounts.70
The preferred ionization method for lipid mass spectrometry would employ a
“soft ionization” technique, one that ionizes molecules and causes minimal
fragmentation. This is important because the resulting mass spectrum will offer accurate
molecular weight of the analytes and will primarily display molecular mass information.
Such mass spectra minimize chances that more abundant lipids will obscure those less
abundant as long as the lipids do not have the same molecular mass.39 “Soft ionization”

24
techniques include field desorption, chemical ionization, fast atom bombardment, and
electrospray ionization (ESI). Some problems with some of these ionization methods
include poor reproducibility (field desorption), the need to derivatize samples to make
them volatile (chemical ionization), and the presence of matrix background signal and
moderate sensitivity (fast atom bombardment).71 ESI is a major breakthrough for the
analysis of biological samples by mass spectrometry because this technique is applied
directly to the analytes in solution, usually requires no derivatization, has high sensitivity,
and provides reproducible results.72
For lipid analyses described in the following chapters, two kinds of mass
spectrometers will be used. The first, a Waters LCT PremierTM, employs an orthogonal
acceleration time-of-flight mass analyzer. A TOF mass analyzer employs a field-free
drift tube to which all the ions are introduced at the same time and with minimal spread
in kinetic energy. Since mass and velocity are inversely related for ions with the same
kinetic energy, the lighter particles will have a greater velocity than the heavier ones and
will arrive at the detector first.73,74 One advantage of this instrument is the precision and
accuracy at which it measures ion masses. With mass accuracy of 5 ppm, the TOF-MS
can not only distinguish between compounds with the same nominal mass, but can also
accurately distinguish ions with the same nominal mass but different elemental formulas.
The mass accuracy, fast processing of data signals, adequate dynamic range, and medium
to high mass resolution75 make these analyzers excellent choices for unknown lipid
identification. The second type of instrument is a triple quadrupole (QQQ) mass
spectrometer, which enable tandem MS experiments in which fragmentation of a
molecular ion is used to conduct a variety of scans.
25
For lipidomic analyses, three different MS/MS techniques can be employed with
triple quadrupole mass spectrometers: daughter (also known as product) ion scans,
parent (also known as precursor) ion scans, and neutral loss scans. The first, a daughter
ion scan, uses the first quadrupole (Q1) as a mass filter allowing only a specific mass
through. The second quadrupole (or sometimes a radio frequency hexapole) serves as a
collision cell, where energetic argon gas collides with analyte molecules and induces
fragmentation. The third quadrupole (Q3) scans over a user defined m/z range, producing
a spectrum of fragment ions derived from the m/z selected for by Q1. A parent ion scan
reverses the roles of Q1 and Q3, with Q1 now scanning over the user defined mass range
and Q3 selecting for a specific m/z. For the third, a neutral loss scan, Q1 scans across a
user defined m/z range, while Q3 scans across a m/z range that is offset for the mass of
the neutral fragment. A special case of a daughter ion scan, called single reaction
monitoring (SRM), uses Q1 to select for a specific m/z value, but instead of scanning Q3
over a specified m/z range, selects for a specific fragment m/z value. Selection of two or
more specific m/z values is then termed multiple reaction monitoring, or MRM.
Examples of the MS/MS scans described above are depicted in Figure 1-3.

26
Figure 1-3: Examples of different MS/MS scanning modes for a triple quadrupole mass spectrometer.
Quadrupole 1 Quadrupole 2 Quadrupole 3
Daughter Ion Scan
Parent Ion Scan
Quadrupole 2 Quadrupole 1 Quadrupole 3
Neutral Loss Scan
Quadrupole 1 Quadrupole 3 Quadrupole 2
SRM (MRM)
Quadrupole 1 Quadrupole 3 Quadrupole 2
Select for m/z 391 CID
CID
CID
CID
Select for m/z 391
Offset m/z scan by 141 Scan all m/z
Scan all m/z Select for m/z 149
Scan all m/z
Select for m/z 149

27
1.4.3. Contemporary Approaches to Lipidomics
Recent lipidomic methods utilizing mass spectrometry have taken two
approaches: global lipidomics, in which the main goal is identification and quantification
of all lipids in a cell or tissue sample, and targeted lipid profiling, which focuses on
identifying and quantifying a large number of lipids within a single class.39
Han and Gross developed one of the first widely used methods for profiling
cellular lipids using ESI-MS.76 For analysis, samples dissolved in chloroform were
introduced into a quadrupole mass spectrometer without any chromatographic separation.
Spectra were produced by scanning the spectrometer over a selected mass range and
ionized lipids were identified by their masses. For isobaric lipids (lipids of different
classes that have the same nominal mass) tandem mass spectrometry or MS/MS is used to
perform product or daughter ion scans, using a triple quadrupole mass spectrometer.34,76
However, since some lipids present at low concentrations will not be detected due to
suppression of ionization by high abundance lipids, physical separation of lipids using
chromatography becomes valuable, if not essential, before introduction into the mass
spectrometer. Therefore, lipids would enter the instrument presorted by chromatographic
separation, reducing the interference from other compounds in the sample, and making
low abundance lipids more readily detectable.
Brügger and colleagues expanded the use of tandem MS methods when
developing a lipid analysis method that employs various scanning modes of a triple
quadrupole mass spectrometer.72 Their method exploits the difference in fragmentation
behavior conferred by different phospholipid head groups. When fragmentation occurs, a
common fragment (either charged or neutral) for a specific phospholipid group is

28
produced. For example, characteristic fragmentation in ESI+ mode for
phosphatidylethanolamine lipids is the loss of the neutral ethanolamine head group.
Therefore, PE lipids are selectively detected for by performing neutral loss of 141 Da
scans. For phosphatidylcholine lipids (PC), fragmentation causes the loss of the head
group with a positive charge attached, so PC lipids are detected by parent ion scans for
m/z 184. Unlike the Han and Gross method, spectra contain only lipids from a specific
class. For each class, the number of carbon atoms and double bonds in the fatty acyl tail
groups can be deduced from the molecular masses that undergo head group-specific
fragmentation.
Improving upon Brügger’s research, Ruth Welti, Xuemin Wang, and coworkers at
Kansas State developed a “high-throughput” profiling method, to identify and quantify
lipids in a plant sample, analyzing 140 lipid species in an hour. Specifically, this method
is based on the precursor and neutral loss scanning ability of tandem MS/MS, which is
used for selective detection of lipids with specific functional groups.72 Welti’s method
can obtain a lipid profile for each class by continuous infusion of solvent extract into the
mass spectrometer, conducting separate scans for each lipid class, and quantifying the
lipids by comparison to two internal standards (for each head group) that have shorter and
longer fatty acyl groups than the sample lipids.34,36,77 This method identifies the total
number of carbons and double bonds in the fatty acyl chains, and can identify the fatty
acyl chains present. Using this method relative amounts of isomeric lipids cannot be
quantified because they do not give distinguishing fragment ions. Both Brügger and
Welti demonstrated the ability of a triple quadrupole mass spectrometer to differentiate
between fatty acyl chains and to quantify lipids by performing class-based analyses.

29
However, since these MS/MS methods require previous knowledge about the lipids to be
detected, i.e. the mass of the parent and daughter ions must be known, targeted lipidomic
analysis is useful for quantification of known lipids, but has limited utility for discovery
and identification of novel lipids.

30
1.5. Summary of Research Goals
The aims of the research described in this dissertation have been to address two
shortcomings of current methodologies for lipid discovery and analysis: the need for new
data filtering techniques for detection and recognition of unknown lipids that often occur
at low levels in complex mixtures, and the need for new mass spectrometric methods to
detect and quantify neutral and steroidal based isomeric lipids and positional isomers of
phospholipids. In Chapter 2, a new concept termed relative mass defect, (RMD), is
introduced as a method for filtering mass spectrometric data based on the percent
hydrogen content of m/z values. Filtering mass spectra using the mass defect is not a new
idea, but is not always productive since fragment ions often have mass defects very
different from their parent compounds. The application of this new filtering technique is
demonstrated by its ability to identify an unknown neutral lipid activator of a nuclear
receptor.
In Chapter 3, the chromatographic fundamentals for the separation of two
phthalate isomers are explored. In addition, a new isomer-specific mass spectrometric
technique is explained which allows for selective detection of one isomer. Chapter 4
presents investigations of the fragmentation of two pure positional isomeric PE lipid
standards to develop a model for fragmentation at the sn-1 and sn-2 positions, with the
intent of generating improved standardization of mass spectrometric analyses of
phospholipids. The following chapters provide important analytical tools for moving the
fields of lipidomics and lipid discovery forward.

31
1.6. References
1. Johannsen, W., Elemente der Exakten Erblichkeitslehre: Mit Gründzugen der
Biologischen Variationsstatistik. 3rd ed.; Gustav Fischer: Jena, 1926.
2. Avery, O. T.; MacLeod, C. M.; McCarty, M., Studies on the Chemical Nature of
the Substance Inducing Transformation of Pneumococcal Types. The Journal of
Experimental Medicine 1944, 79, (2), 137-158.
3. Watson, J. D.; Crick, F. H. C., A Structure for Deoxyribose Nucleic Acid. Nature
1953, 171, 737-738.
4. Watson, J. D.; Crick, F. H. C., Genetical Implications of the Structure of
Deoxyribonucleic Acid. Nature 1953, 171, 964-967.
5. Wilkins, M. H. F.; Stokes, A. R.; Wilson, H. R., Molecular Structure of
Deoxypentose Nucleic Acids. Nature 1953, 171, 738-740.
6. Franklin, R.; Gosling, R. G., Molecular Configuration in Sodium Thymonucleate.
Nature 1953, 171, 740-741.
7. Franklin, R.; Gosling, R. G., Evidence of 2-Chain Helix in Crystalline Structure
of Sodium Deoxyribonucleate. Nature 1953, 172, 156-157.
8. National Human Genome Research Institute. http://www.genome.gov.
9. Lander, E. S.; et. al., Initial Sequencing and Analysis of the Human Genome.
Nature 2001, 409, 860-921.
10. How Not to Get Sick. Time June 22, 2010.
11. Tethys Announces Issuance of Key Patent Relating to PreDxTM Diabetes Risk
Score Test. http://www.tethysbio.com.

32
12. Trethewey, R. N.; Krotzky, A. J.; Willmitzert, L., Metabolic Profiling: A Rosetta
Stone for Genomics? Current Opinion in Plant Biology 1999, 2, (2), 83-85.
13. Nie, L.; Wu, G.; Zhang, W., Correlation of mRNA Expression and Protein
Abundance Affected by Multiple Sequence Features Related to Translational
Efficiency in Desulfovibrio vulgaris: A Quantitative Analysis. Genetics 2006,
174, (4), 2229-2243.
14. Nie, L.; Wu, G.; Zhang, W., Correlation Between mRNA and Protein Abundance
in Desulfovibrio vulgaris: A Multiple Regression to Identify Sources of
Variations. Biochemical and Biophysical Research Communications 2006, 339,
(2), 603-610.
15. Gygi, S. P.; Rochon, Y.; Franza, B. R.; Aebersold, R., Correlation Between
Protein and mRNA Abundance in Yeast. Molecular and Cellular Biology 1999,
19, (3), 1720-1730.
16. Dettmer, K.; Hammock, B. D., Metabolomics--A New Exciting Field Within the
"Omics" Sciences. (Guest Editorial). Environmental Health Perspectives 2004,
112, (7), A396(2).
17. Spener, F.; Lagarde, M., Editorial: What is lipidomics? European Journal of
Lipid Science and Technology 2003, 105, (9), 481-482.
18. Watson, A. D., Thematic Review Series: Systems Biology Approaches to
Metabolic and Cardiovascular Disorders. Lipidomics: A Global Approach to
Lipid Analysis in Biological Systems. Journal of Lipid Research 2006, 47, (10),
2101-2111.

33
19. Gustafsson, J.-A., Biochemistry: Seeking Ligands for Lonely Orphan Receptors.
Science 1999, 284, (5418), 1285-1286.
20. Skretas, G.; Wood, D. W., Rapid Detection of Subtype-Selective Nuclear
Hormone Receptor Binding with Bacterial Genetic Selection. Applied and
Environmental Microbiology 2005, 71, (12), 8995-8997.
21. Schapira, M.; Raaka, B. M.; Samuels, H. H.; Abagyan, R., Rational Discovery of
Novel Nuclear Hormone Receptor Antagonists. Proceedings of the National
Academy of Science 2000, 97, (3), 1008-1013.
22. Chawla, A.; Repa, J. J.; Evans, R. M.; Mangelsdorf, D. J., Nuclear Receptors and
Lipid Physiology: Opening the X-Files. Science 2001, 294, 1866-1870.
23. Shi, Y., Orphan Nuclear Receptors in Drug Discovery. Drug Discovery Today
2007, 12, (11-12), 440-445.
24. Stadel, J. M.; Wilson, S.; Bergsma, D. J., Orphan G Protein-Coupled Receptors:
A Neglected Opportunity for Pioneer Drug Discovery. Trends in
Pharmacological Sciences 1997, 18, (11), 430-437.
25. Hinuma, S.; Onda, H.; Fujino, M., The Quest for Novel Bioactive Peptides
Utilizing Orphan Seven-Transmembrane-Domain Receptors. Journal of
Molecular Medicine 1999, 77, 495-504.
26. McDonnell, D. P.; Vegeto, E.; Gleeson, M. A. G., Nuclear Hormone Receptors as
Targets for New Drug Discovery. Nature Biotechnology 1993, 11, (11), 1256-
1261.
34
27. Wise, A.; Jupe, S. C.; Rees, S., The Identification of Ligands at Orphan G-Protein
Coupled Receptors. Annual Review of Pharmacology and Toxicology 2004, 44,
(1), 43-66.
28. Wenk, M. R., The Emerging Field of Lipidomics. Nature Reviews Drug
Discovery 2005, 4, (7), 594-610.
29. van Meer, G., Cellular Lipidomics. The EMBO Journal 2005, 24, (18), 3159-
3165.
30. Wang, X., Lipid Signaling. Current Opinion in Plant Biology 2004, 7, (3), 329-
336.
31. Wang, X., Phospholipase D in Hormonal and Stress Signaling. Current Opinion
in Plant Biology 2002, 5, (5), 408-414.
32. Schultz, J. C., Shared Signals and the Potential for Phylogenetic Espionage
Between Plants and Animals. Integrative & Comparative Biology 2002, 42, (3),
454-462.
33. Farmer, E. E.; Alméras, E.; Krishnamurthy, V., Jasmonates and Related Oxylipins
in Plant Responses to Pathogenesis and Herbivory. Current Opinion in Plant
Biology 2003, 6, (4), 372-378.
34. Welti, R.; Wang, X., Lipid Species Profiling: A High-Throughput Approach to
Identify Lipid Compositional Changes and Determine the Function of Genes
Involved in Lipid Metabolism and Signaling. Current Opinion in Plant Biology
2004, 7, (3), 337-344.
35. Wang, X.; Devaiah, S. P.; Zhang, W.; Welti, R., Signaling Functions of
Phosphatidic Acid. Progress in Lipid Research 2006, 45, (3), 250-278.

35
36. Welti, R.; Li, W.; Li, M.; Sang, Y.; Biesiada, H.; Zhou, H.-E.; Rajashekar, C. B.;
Williams, T. D.; Wang, X., Profiling Membrane Lipids in Plant Stress Responses.
Role of Phospholipase D-alpha in Freezing-Induced Lipid Changes in
Arabidopsis. The Journal of Biological Chemistry 2002, 277, (35), 31994-32002.
37. Schultz, J. C.; Appel, H. M., Cross-Kingdom Cross-Talk: Hormones Shared by
Plants and Their Insect Herbivores. Ecology 2004, 85, (1), 70-77.
38. Cyberlipid Center. http://www.cyberlipid.org.
39. Blanksby, S. J.; Mitchell, T. W., Advances in Mass Spectrometry for Lipidomics.
Annual Review of Analytical Chemistry 2010, 3, (1), 433-465.
40. Sumner, L. W.; Mendes, P.; Dixon, R. A., Plant Metabolomics: Large-Scale
Phytochemistry in the Functional Genomics Era. Phytochemistry 2003, 62, (6),
817-836.
41. Piomelli, D., The Challenge of Brain Lipidomics. Prostaglandins & Other Lipid
Mediators 2005, 77, (1-4), 23-34.
42. Han, X. L., Neurolipidomics: Challenges and Developments. Frontiers in
Bioscience 2007, 12, 2601-2615.
43. Giddings, J. C., Unified Separation Science. John Wiley & Sons, Inc.: New
York, 1991.
44. Sowa, J. M.; Subbaiah, P. V., Variable Recoveries of Fatty Acids Following the
Separation of Lipids on Commercial Silica Gel TLC Plates: Selective Loss of
Unsaturated Fatty Acids on Certain Brands of Plates. Journal of Chromatography
B 2004, 813, (1-2), 159-166.
36
45. Lecomte, M.; Claire, M.; Deneuville, M.; Wiernsperger, N., Fatty Acid
Composition of Phospholipids and Neutral Lipids from Human Diabetic Small
Arteries and Veins by a New TLC Method. Prostaglandins, Leukotrienes and
Essential Fatty Acids 1998, 59, (6), 363-369.
46. Taki, T.; Ishikawa, D., TLC Blotting: Application to Microscale Analysis of
Lipids and as a New Approach to Lipid-Protein Interaction. Analytical
Biochemistry 1997, 251, (2), 135-143.
47. Furutani, M.; Itoh, T.; Ijuin, T.; Tsujita, K.; Takenawa, T., Thin Layer
Chromatography-Blotting, a Novel Method for the Detection of
Phosphoinositides. The Journal of Biochemistry 2006, 139, (4), 663-670.
48. Peterson, B. L.; Cummings, B. S., A Review of Chromatographic Methods for the
Assessment of Phospholipids in Biological Samples. Biomedical
Chromatography 2006, 20, (3), 227-243.
49. Christie, W. W., Lipid Analysis. Third ed.; The Oily Press: Bridgewater, 2003.
50. Myher, J. J.; Kuksis, A., General Strategies in Chromatographic Analysis of
Lipids. Journal of Chromatography B: Biomedical Sciences and Applications
1995, 671, (1-2), 3-33.
51. Singh, A. K.; Jiang, Y., Quantitative Chromatographic Analysis of Inositol
Phospholipids and Related Compounds. Journal of Chromatography B:
Biomedical Sciences and Applications 1995, 671, (1-2), 255-280.
52. Kaulen, H. D., Separation of Phosphatidylserine and -Inositol by One-
Dimensional Thin-Layer Chromatography of Lipid Extracts. Analytical
Biochemistry 1972, 45, (2), 664-667.

37
53. Raith, K.; Wolf, R.; Wagner, J.; Neubert, R. H. H., Separation of Phospholipids
by Nonaqueous Capillary Electrophoresis with Electrospray Ionization Mass
Spectrometry. Journal of Chromatography A 1998, 802, (1), 185-188.
54. Haddadian, F.; Shamsi, S. A.; Schaeper, A. P.; Danielson, N. D., Capillary
Electrophoresis of Phospholipids with Indirect Photometric Detection. Journal of
Chromatographic Science 1998, 36, (8), 395-400.
55. Blomberg, L. G.; Andersson, P. E., Capillary Electrophoresis for Lipid Analysis.
INFORM 1994, 5, (9), 1030-1037.
56. Guo, B.-Y.; Wen, B.; Shan, X.-Q.; Zhang, S.-Z.; Lin, J.-M., Separation and
Determination of Phospholipids in Plant Seeds by Nonaqueous Capillary
Electrophoresis. Journal of Chromatography A 2005, 1074, (1-2), 205-213.
57. Li, F. A.; Wu, M. C.; Her, G. R., Development of a Multiplexed Interface for
Capillary Electrophoresis-Electrospray Ion Trap Mass Spectrometry. Analytical
Chemistry 2006, 78, (15), 5316-5321.
58. Gao, F.; Dong, J.; Li, W.; Wang, T.; Liao, J.; Liao, Y.; Liu, H., Separation of
Phospholipids by Capillary Zone Electrophoresis with Indirect Ultraviolet
Detection. Journal of Chromatography A 2006, 1130, (2), 259-264.
59. Moreau, R. A.; Powell, M. J.; Agnew, J.; Young, D. H., Chlorophyll-Derived
Porphyrins Co-Chromatograph with Phospholipids in High Performance Liquid
Chromatographic Separations of Plant Lipid Classes. Phytochemical Analysis
1998, 9, (1), 1-4.

38
60. Christie, W. W.; Gill, S.; Nordbäck, J.; Itabashi, Y.; Sanda, S.; Slabas, A. R., New
Procedures for Rapid Screening of Leaf Lipid Components from Arabidopsis.
Phytochemical Analysis 1998, 9, (2), 53-57.
61. Karlsson, A. Å.; Michelsen, P.; Larsen, Å.; Odham, G., Normal-Phase Liquid
Chromatography Class Separation and Species Determination of Phospholipids
Utilizing Electrospray Mass Spectrometry/Tandem Mass Spectrometry. Rapid
Communications in Mass Spectrometry 1996, 10, (7), 775-780.
62. Snyder, L. R.; Carr, P. W.; Dolan, J. W.; Majors, R. E., New Horizons in
Reversed-Phase Chromatography Selectivity. LCGC North America 2010, 28,
(6), 418-430.
63. Dorsey, J. G.; Cooper, W. T., Retention Mechanisms of Bonded-Phase Liquid
Chromatography. Analytical Chemistry 1994, 66, (17), 857A-867A.
64. Sander, L. C.; Wise, S. A., Synthesis and Characterization of Polymeric C18
Stationary Phases for Liquid Chromatography. Analytical Chemistry 1984, 56,
(3), 504-510.
65. Sentell, K. B.; Dorsey, J. G., Retention Mechanisms in Reversed-Phase Liquid
Chromatography. Stationary-Phase Bonding Density and Partitioning. Analytical
Chemistry 1989, 61, (9), 930-934.
66. Jaroniec, M.; Martire, D. E., Models of Solute and Solvent Distribution for
Describing Retention in Liquid Chromatography. Journal of Chromatography A
1987, 387, 55-64.

39
67. Jaroniec, M.; Martire, D. E., Description of Non-Specific and Specific Solute-
Solvent Interactions in Liquid Chromatography with Mixed Eluents. Journal of
Liquid Chromatography & Related Technologies 1987, 10, (4), 541-559.
68. Zietkowski, D.; Davidson, R. L.; Eykyn, T. R.; De Silva, S. S.; deSouza, N. M.;
Payne, G. S., Detection of Cancer in Cervical Tissue Biopsies Using Mobile Lipid
Resonances Measured with Diffusion-Weighted 1H Magnetic Resonance
Spectroscopy. NMR in Biomedicine 23, (4), 382-390.
69. Musacchio, T.; Toniutti, M.; Kautz, R.; Torchilin, V. P., 1H NMR Detection of
Mobile Lipids as a Marker for Apoptosis: The Case of Anticancer Drug-Loaded
Liposomes and Polymeric Micelles. Molecular Pharmaceutics 2009, 6, (6),
1876-1882.
70. Costello, C. E., Time, Life... and Mass Spectrometry. New Techniques to
Address Biological Questions. Biophysical Chemistry 1997, 68, (1-3), 173-188.
71. Skoog, D. A.; Holler, F. J.; Nieman, T. A., Chapter 20: Molecular Mass
Spectrometry. In Principles of Instrumental Analysis, Fifth ed.; Harcourt Brace
College Publishers: Chicago, 1998; pp 498-334.
72. Brügger, B.; Erben, G.; Sandhoff, R.; Wieland, F. T.; Lehmann, W. D.,
Quantitative Analysis of Biological Membrane Lipids at the Low Picomole Level
by Nano-Electrospray Ionization Tandem Mass Spectrometry. Proceedings of the
National Academy of Sciences 1997, 94, (6), 2339-2344.
73. Wiley, W. C.; McLaren, I. H., Time-of-Flight Mass Spectrometer with Improved
Resolution. Review of Scientific Instruments 1955, 26, (12), 1150-1157.

40
74. Proceedings of the American Physical Society. Physical Review 1946, 69, (11-
12), 674.
75. Waters Corporation Technical Note. http://www.waters.com.
76. Han, X.; Gross, R. W., Global Analyses of Cellular Lipidomes Directly from
Crude Extracts of Biological Samples by ESI Mass Spectrometry: A Bridge to
Lipidomics. Journal of Lipid Research 2003, 44, (6), 1071-1079.
77. Devaiah, S. P.; Roth, M. R.; Baughman, E.; Li, M.; Tamura, P.; Jeannotte, R.;
Welti, R.; Wang, X., Quantitative Profiling of Polar Glycerolipid Species from
Organs of Wild-Type Arabidopsis and a Phospholipase D[alpha]1 Knockout
Mutant. Phytochemistry 2006, 67, (17), 1907-1924.

Chapter 2: Bioassay-Directed Fractionation for Discovery of Bioactive Neutral
Lipids Guided by Relative Mass Defect Filtering and Multiplexed Collision-Induced
Dissociation

42
Abstract
In this chapter, I report a synergistic method using bioassay-directed liquid
chromatography fractionation and time-of-flight mass spectrometry to guide and
accelerate bioactive compound discovery. To steer purification and assays toward
anticipated neutral lipid activators of a constitutive androstane receptor splice variant, a
relative mass defect filter was calculated, based on the ratio of the mass defect to the
measured ion mass, and used to reduce the number of candidate ion masses. When mass
measurements are unable to provide unambiguous assignments of elemental
compositions, the relative mass defect, largely reflective of fractional hydrogen content,
can be used to relate a compound’s biosynthetic precursors. A relative mass defect
window ranging from 600-1000 ppm, consistent with an assortment of lipids, was chosen
to assess the number of candidate ions in fractions of fetal bovine serum. This filter
reduced the number of candidate ion m/z values from 1345 to 892, which was further
reduced to 21 by intensity and isotope filtering. Accurate mass measurements from time-
of-flight mass spectrometry and fragment ion masses generated using nonselective
collision-induced dissociation suggested dioctyl phthalate as one of few neutral lipid
constituents in the active fraction. The identity of this compound was determined to be
di(2-ethylhexyl) phthalate by GC-MS, and it was ranked as a promising candidate for
reporter assay screening.

43
2.1. Introduction
Research in recent years has led to discoveries of numerous receptors and
signaling mechanisms that regulate a wide variety of biological functions, but
identification of potent bioactive compounds that activate these receptors involves
lengthy and expensive efforts.1,2 Contributing to these costs is the need to screen an
enormous number of compounds in both complex biological samples and combinatorial
libraries for activity. Once a receptor ligand is identified, efforts to accelerate compound
discovery often generate large libraries of compounds with structural similarity to known
active substances, followed by activity screening.3,4 Complementary efforts have focused
on reducing discovery time by improving technologies for bioactivity assays and
compound fractionation, including development of high-throughput microfluidic assays,5
two-dimensional HPLC, and microdialysis-HPLC methods.6
Despite these advances, discoveries of ligands that activate newly discovered
receptors still depend on exhaustive and challenging bioassay-guided purification of
active ligands followed by their identification based on NMR and mass spectrometry.7-9
There is a need for a rapid screening tool to direct fractionation or exclude fractions by
preselecting specific compounds to minimize the number of bioassays that must be
performed. The aim in this study has been to develop and implement an efficient
approach to use mass spectrometry data to guide bioassay-directed fractionation. In this
specific case, efforts were focused on isolation of a previously unknown component of
fetal bovine serum that activates a splice variant of constitutive androstane receptor,
CAR2. My approach exploits accurate measurements of ion masses and calculations of
ion mass defects to distinguish likely candidates and guide this fractionation.

44
The importance of accurate ion mass measurements was established in 1920 by F.
W. Aston.10 Using an early form of mass spectrometry described as “positive-ray
spectrography”, he determined the masses, within 1 part-per-thousand, of hydrogen,
carbon, and oxygen to be 1.008, 12.000, and 16.000 Da, respectively. These
measurements were the first to suggest that atomic masses could deviate from integer
values. Aston and Eddington soon verified that the mass difference between two
hydrogen atoms and one helium atom corresponded to a measurable value of energy
release,11-13 and recognition of this deviation became the foundation of assessing nuclear
binding energies.14 While accurate mass measurements are frequently used to confirm a
suspected elemental composition, even measurements accurate to less than 1 ppm error
often cannot provide unambiguous assignment of a unique elemental formula.15 Despite
this shortcoming, accurate measurements of ion masses retain value even when mass
measurement accuracy is insufficient to define elemental composition. One important
concept, known as the mass defect, is defined as the deviation of an ion’s measured mass
from its nominal mass, which is the truncated integer value. Most elements (oxygen and
heavier) have a negative mass defect, or a mass deficiency, caused by increases of
nuclear binding energy with increasing atomic number. Only the six elements preceding
oxygen, except carbon, have a positive mass defect, or a mass sufficiency, but hydrogen’s
is most notable at +7.825 mDa.16 Since many organic molecules have a multitude of
hydrogen atoms, an ion’s mass defect is largely influenced by its hydrogen content.
Several precedents for the utility of mass defects have been reported, including
the development of the Kendrick scale, based on the deviation in mass from –CH2–
groups, which were defined as “exactly 14 amu”.17 This approach has been particularly

45
useful in characterization of petroleum products where homologs differing by the number
of –CH2– groups are abundant.18 In a more recent development, Zhang and co-workers
implemented an absolute mass defect filter to aid drug metabolite identification.19-21
Taking advantage of the observation that most modifications to a drug compound by
metabolism change the mass defect by less than +/-0.050 Da relative to the parent
compound, their software filter removes all m/z values outside of this range, eliminating
potentially interfering endogenous compounds from consideration. Since then, other
researchers have used mass defect to aid identifications for other compound classes.
Koulman and Volmer used mass defect to distinguish phosphatidylcholine and
phosphatidylethanolamine lipids by assigning differences in m/z values to addition of
different two-carbon units (–C2–, –C2H2–, and –C2H4–) within each class.22 Mass defects
have also been used to identify peptides from other compounds in biological extracts.23
The concept of fractional mass, which represents the mass defect, has also been used in
proteomics to distinguish peptides from non-peptide ions in analyses of complex
digestion mixtures, with utility for on-the-fly selection of ions for MS/MS analysis.24,25
While the Kendrick mass defect, mass defect filters, and fractional mass have
provided important steps toward identifying many unknown compounds, mass
measurement alone is often inadequate to provide unambiguous elemental formulae.
With the Kendrick method, the difference between the nominal mass and the Kendrick
mass defect becomes greater as the molecular weight increases, creating more potential
molecular formulae. Also, this method is intended for simple organic compounds. The
main disadvantage of mass defect filtering is that a priori knowledge is essential for
determining the mass window for filtering. The most useful data mining tool would not

46
require a specific m/z value to start from, nor would it require knowledge of what types of
compounds are in a sample, but could still categorize all m/z values in a spectrum in
terms of their similarity to a target range of elemental compositions. In this chapter, I
exploit the notion that hydrogen atoms provide the major contribution to molecular mass
defects, and suggest an approach based on filtering measured ion masses according to a
relative mass defect in a manner that helps classify ions based upon the fraction of
molecular mass accounted for by hydrogen atoms.

47
2.2. Materials and Methods
2.2.1. Materials
Fetal bovine serum was purchased from Invitrogen (Carlsbad, CA, USA).
Activated charcoal/Dextran treated FBS was purchased from Hyclone (Logan, UT,
USA). Di(2-ethylhexyl) phthalate (CAS No. 117-81-7) was purchased from Sigma-
Aldrich (St. Louis, MO, USA). Di-n-octyl phthalate (CAS No. 117-84-0) was purchased
from Alfa Aesar (Ward Hill, MA, USA). Ammonium acetate was purchased from EMD
Chemicals, Inc. (Gibbstown, NJ, USA). Methanol, 2-propanol, and chloroform were all
HPLC grade.
2.2.2. Avoidance of Contamination
During sample preparation, glass containers were used whenever feasible,
limiting exposure to plastics and minimizing contamination. In some cases, the
availability of labware required the use of phthalate-free polypropylene plastics. All
procedural blanks using polypropylene labware analyzed over six months yielded
phthalate ester levels below our limit of detection (90 nM in extracts).
2.2.3. Extraction of Lipids for GC-MS Analysis
Lipids were extracted from 100 µL aliquots of serum samples in 15 mL
polypropylene conical tubes using 3 mL of 2:1 methanol/chloroform (v/v). Tubes were
vortexed for 15 seconds, then placed in a hot water bath (50-55 °C) for 15 minutes to
inactivate and precipitate proteins. Afterwards, samples were centrifuged for 15 minutes
at 3200 g and 25 °C. The supernatant was removed and washed twice with 1 mL of 1 M

48
aqueous KCl. The resulting lower organic layer (400 µL) was added to a clean glass
autosampler vial. After evaporation to dryness under a stream of nitrogen gas, the
residue was redissolved in 200 µL of 100 mM aqueous 1:1 ammonium acetate/2-
propanol (v/v).
2.2.4. Extraction of Lipids for Discovery and Fractionation
Serum lipids were extracted from 50 mL of FBS using a method adapted from
Frost and Wells.26 Briefly, 50 mL of serum was mixed with 310 mL of 1:2:0.1
chloroform/methanol/1 N aqueous H2SO4 (v/v/v). This mixture was incubated for 1 hour
at room temperature with mixing every 15 min, followed by addition of 1 volume of
chloroform and 1 volume of 0.36 M aqueous H2SO4 containing 15 mM NaCl. The sample
was then centrifuged at 25 ˚C for 20 min at 4000 g. The lower organic phase was
collected and the volume was reduced to about 17 mL using a rotary evaporator. The
liquid residue was mixed 1:1 with chloroform, washed with water, and the lower organic
phase was collected using a separatory funnel. The organic phase was transferred to a
glass test tube and evaporated to approximately 3 mL under a stream of argon gas.
2.2.5. Fractionation of Lipid Extracts (Process 1)
From the extracts obtained by the first extraction protocol above, a neutral lipid
fraction was generated using a 1000 mg BondElut Jr. NH2 solid-phase extraction (SPE)
column (Varian, Inc., Palo Alto, CA, USA) by sequential elution with various solvents as
described.27 The hexane fraction was evaporated to dryness under argon gas and
redissolved in 200 µL of hexane before the second stage of fractionation, which

49
employed a 1 mL Bakerbond SPE silica gel column (Mallinckrodt Baker, Inc.,
Phillipsburg, NJ, USA), eluting with an isocratic mobile phase of 95:5 hexane/2-propanol
(v/v). A 10 mL volume of this mobile phase was used to elute the sample, which was
further fractionated using a modified method developed by Murphy.28 In this third stage
of fractionation, the silica SPE column eluant was evaporated to dryness under argon gas
and dissolved in 1 mL of hexane. A 100 µL aliquot of this solution was then applied to a
µPorasil silica analytical HPLC column (3.9 x 300 mm, 10 µm; Waters Corp., Milford,
MA, USA) and fractionated by isocratic separation using a HPXL solvent delivery
system (Rainin, Oakland, CA, USA). The mobile phase consisted of 1.08% 2-propanol
and 0.09% acetic acid in hexane. Column temperature was maintained at 55 ˚C and the
flow rate at 0.6 mL/min while fractions were collected every minute over 30 min.
Fractions were then dried under nitrogen gas then dissolved in 200 µL of 1:1 100 mM
aqueous ammonium acetate/2-propanol (v/v) for mass spectrometric analysis.
2.2.6. Reporter Assay
Bioassay-guided fractionation of substances with CAR2 ligand activity was
guided through use of a cell-based luciferase reporter assay based on cytomegalovirus
(CMV) promoter and human liver CAR2 as previously described.29 All DNA
transfections were performed in a 48-well format using COS-1 cells and a CMV-CAR2
plasmid. Luciferase assays were performed using the Dual-Luciferase Reporter Assay
System (Promega, Madison, WI, USA) and a Veritas Microplate Luminometer (Turner
Biosystems, Sunnyvale, CA, USA).

50
2.2.7. Flow Injection Analysis-MS and HPLC-MS of Serum Fractions
Aliquots (10 µL) of individual fractions isolated from FBS were analyzed using
flow injection analysis (FIA) on a LCT PremierTM time-of-flight mass spectrometer
(Waters Corp.) employing ESI+ and ESI- with V mode ion path. The sample cone was
held at 25 V, and the ESI capillary at 3200 V. Spectrum acquisition covered m/z 100-
1500 with a spectrum accumulation time of 0.2 seconds. Multiplexed in-source CID was
performed using quasi-simultaneous acquisition of spectra with three different aperture 1
settings: 15, 40, and 65 volts.30,31 FIA analyses of samples employed a 100% methanol
mobile phase flowing at 0.2 mL/min supplied by Prominence LC-20AD high
performance LC solvent delivery modules (Shimadzu Corp., Kyoto, Japan).
Individual fractions from fetal bovine serum from Process 1 showing activity in
the reporter assay were fractionated further (Process 2) using a Hypersil GOLD C18
column (2.1 x 50 mm, 1.9 µm particle size, Thermo Fisher Scientific, Waltham, MA,
USA). Each FBS fraction was divided further into six new fractions (with collection
times at 4.9, 5.5, 6.5, 10, 15, and 20 minutes) using a 20 minute ternary gradient with a
flow of 0.2 mL/min. Solvent A (10 mM NH4OAc), solvent B (methanol) and solvent C
(2-propanol) were programmed using linear gradients as follows: initial = 99% A/1% B,
linear to 100% B at 1 min, then linear to 95% B/5% C at 11 min, then to 50% B/50% C at
13 min, and 100% C at 14 min. After holding at 100% C for 1 min the gradient was
returned to initial conditions for the remaining 5 minutes.
51
2.2.8. GC-MS of Phthalate Ester Standards and Extracts of Fetal Bovine Serum
Gas chromatography-mass spectrometry analyses for phthalate esters were
performed using a 6890 GC coupled to a model 5973 mass spectrometer (Agilent
Technologies, Santa Clara, CA, USA). Samples were injected onto a DB-5-MS column
(30 m x 0.25 mm, 0.25 µm film) using pulsed splitless mode, helium carrier gas at 43
cm/s, and an initial injector temperature of 280 °C. The column was held initially at 50
°C, then programmed to 240 °C (35 °C/min), then to 300 °C (6 °C/min) with a 5 minute
hold. Electron ionization (EI) was employed (70 eV), and spectra were acquired over m/z
40-500 at 3.14 spectra per second.
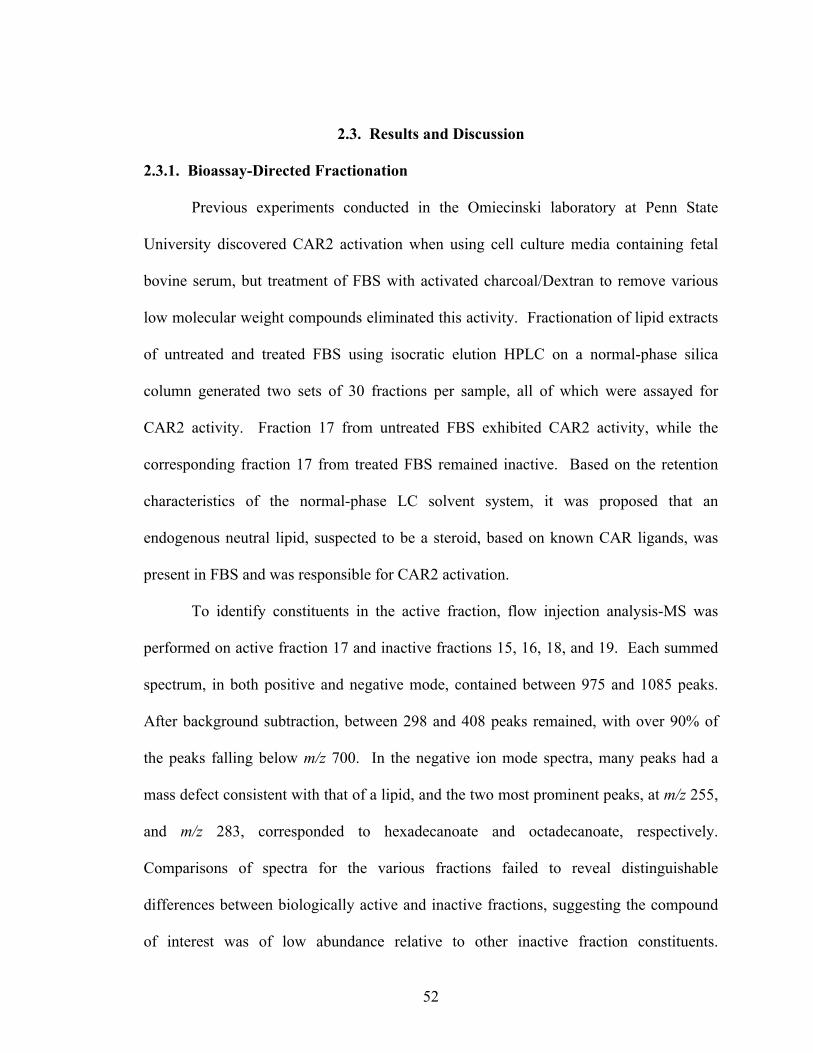
52
2.3. Results and Discussion
2.3.1. Bioassay-Directed Fractionation
Previous experiments conducted in the Omiecinski laboratory at Penn State
University discovered CAR2 activation when using cell culture media containing fetal
bovine serum, but treatment of FBS with activated charcoal/Dextran to remove various
low molecular weight compounds eliminated this activity. Fractionation of lipid extracts
of untreated and treated FBS using isocratic elution HPLC on a normal-phase silica
column generated two sets of 30 fractions per sample, all of which were assayed for
CAR2 activity. Fraction 17 from untreated FBS exhibited CAR2 activity, while the
corresponding fraction 17 from treated FBS remained inactive. Based on the retention
characteristics of the normal-phase LC solvent system, it was proposed that an
endogenous neutral lipid, suspected to be a steroid, based on known CAR ligands, was
present in FBS and was responsible for CAR2 activation.
To identify constituents in the active fraction, flow injection analysis-MS was
performed on active fraction 17 and inactive fractions 15, 16, 18, and 19. Each summed
spectrum, in both positive and negative mode, contained between 975 and 1085 peaks.
After background subtraction, between 298 and 408 peaks remained, with over 90% of
the peaks falling below m/z 700. In the negative ion mode spectra, many peaks had a
mass defect consistent with that of a lipid, and the two most prominent peaks, at m/z 255,
and m/z 283, corresponded to hexadecanoate and octadecanoate, respectively.
Comparisons of spectra for the various fractions failed to reveal distinguishable
differences between biologically active and inactive fractions, suggesting the compound
of interest was of low abundance relative to other inactive fraction constituents.
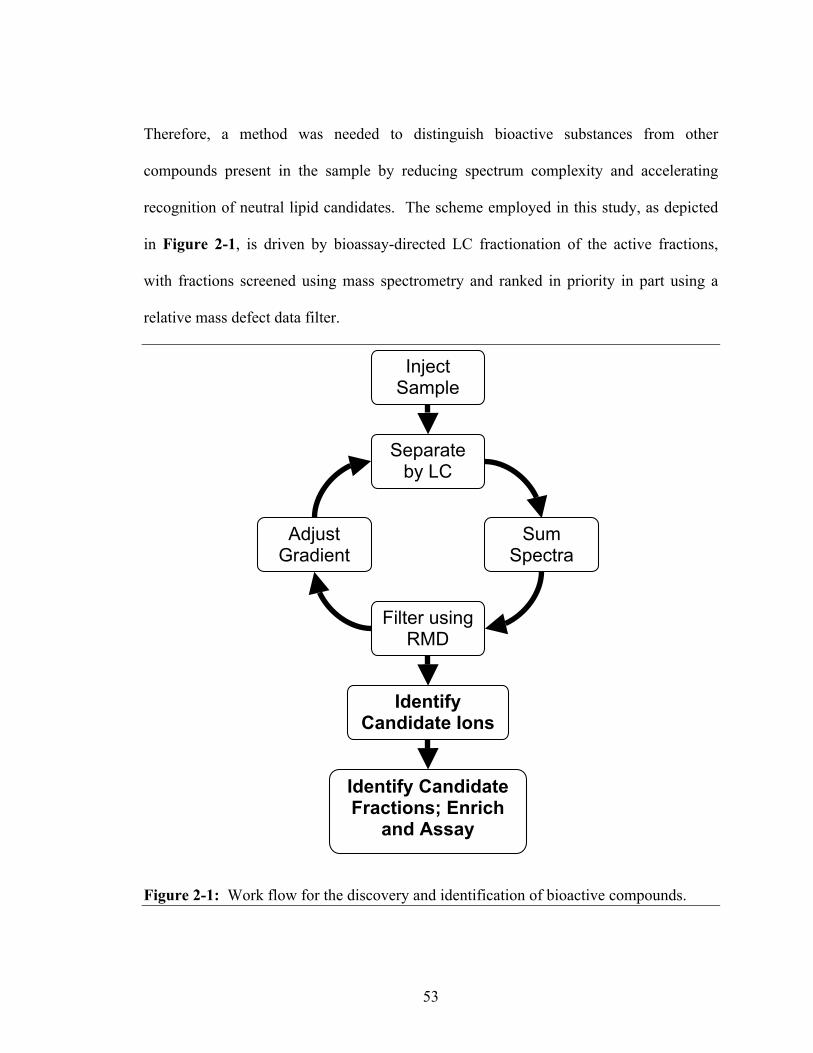
53
Therefore, a method was needed to distinguish bioactive substances from other
compounds present in the sample by reducing spectrum complexity and accelerating
recognition of neutral lipid candidates. The scheme employed in this study, as depicted
in Figure 2-1, is driven by bioassay-directed LC fractionation of the active fractions,
with fractions screened using mass spectrometry and ranked in priority in part using a
relative mass defect data filter.
Figure 2-1: Work flow for the discovery and identification of bioactive compounds.
Inject Sample
Separate by LC
Sum Spectra
Filter using RMD
Adjust Gradient
Identify Candidate Ions
Identify Candidate Fractions; Enrich
and Assay

54
The untreated FBS fraction with greatest activity was fractionated further using
reversed-phase LC on an ultra performance C18 column with a ternary gradient. Owing
to concerns that some neutral lipids might not yield protonated molecules during
electrospray, ammonium acetate was added to the mobile phase to enhance the possibility
of forming [M+NH4]+ ions for such compounds.
Based on previous experiments, the retention time range from 4 to 8 minutes in
the reversed-phase HPLC separation corresponds to compounds that elute in high
methanol concentration (Figure 2-2). Spectra were then summed over this retention time
range using a 25 mDa mass window and a 0.1% intensity filter followed by lock
Figure 2-2: Total ion chromatogram from the LC separation of the active fraction from Process 1 (fraction 17), highlighting the retention time window selected for summation of mass spectra.

55
mass correction using m/z 214.0896 (protonated N-butyl benzenesulfonamide, a common
source contaminant). This process generated a list of 1345 discrete m/z values.
To narrow the list of m/z values to those candidates most consistent with an
expected neutral lipid, my attention was focused on compounds rich in hydrogen content.
Hydrogen is unusual among elements in having a large positive mass defect. For quick
recognition of ions with high hydrogen content, one can calculate a relative mass defect
as follows:
Values of RMD provide a measure of elemental composition analogous to % H
determined by combustion and gravimetric analysis, long established techniques for
structure confirmation. The RMD shows substantial correlation with % H, and the
former can be useful for grouping ions of similar structural classes because they share
similar % H content. Compounds with large RMD values have a greater percent of
hydrogen and a smaller percent of heavier elements with negative or neutral mass defects
such as phosphorus and oxygen. For example, alkanes have relative mass defects greater
than 1000 ppm, membrane lipids and steroids often lie between 600-1000 ppm, sugars
such as sucrose between 300-400 ppm, and organic acids such as citric acid have RMDs
less than 300 ppm. Examples are shown in Figure 3-3. As per the Kendrick mass defect,
no heteroatom-containing organic compound should yield a RMD value much greater
than 1200 ppm. In these cases, the mass defect should be treated as negative, or arising
from multiple charging.

56
Figure 2-3: The relationship between relative mass defect and % hydrogen for an assortment or organic compounds. The dashed line indicates the range of interest, 600 to 1000 ppm.
Since a relative mass defect filter can narrow the list of candidate ions to those
with targeted hydrogen content, lipids were selected by eliminating all m/z values except
those with a RMD between 600 and 1000 ppm. Figure 2-4 depicts a histogram of the
calculated RMDs for all 1345 m/z values and Figure 2-5 the corresponding mass
spectrum. Ions with mass defects outside this range, including those introduced during
the preparative HPLC steps in Process 1, were judged to be unlikely neutral lipid
candidates and were excluded from further consideration.
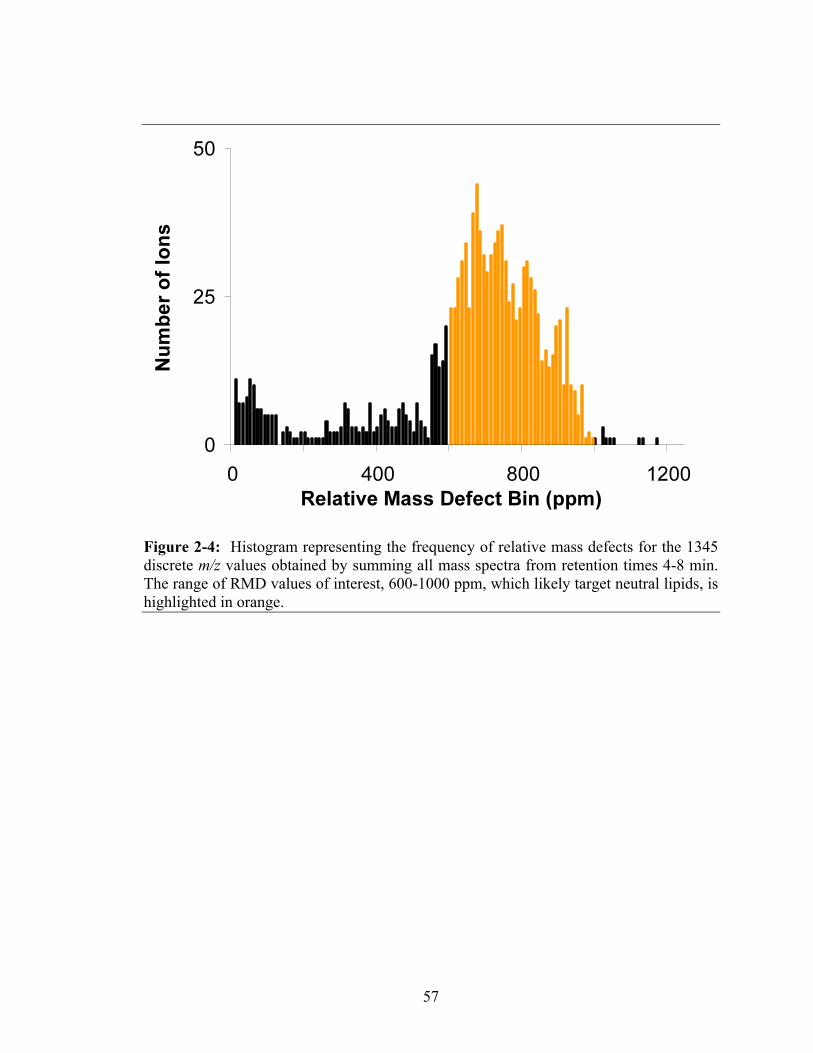
57
Figure 2-4: Histogram representing the frequency of relative mass defects for the 1345 discrete m/z values obtained by summing all mass spectra from retention times 4-8 min. The range of RMD values of interest, 600-1000 ppm, which likely target neutral lipids, is highlighted in orange.

58
Figure 2-5: A summed spectrum obtained from the m/z values in the selected range of Figure 2-4, representing all m/z values from this range. Peak A = m/z 214, B = m/z 251, C = m/z 279, D = m/z 374, E = m/z 391, F = m/z 448, G = m/z 638, H = m/z 680.
The remaining m/z values were filtered by relative ion abundance, with the
highest 10% selected, before a final filtering to remove m/z values corresponding to 13C
isotopes. The resulting spectrum list contained 21 candidate ion m/z values (Figure 2-6).
Of these values, three represented extracted ion chromatograms (XICs) with well defined
peaks, m/z 391, m/z 448, and m/z 680. The other 18 values were excluded because their
extracted ion chromatograms had a similar profile to the total ion chromatogram,
suggesting their presence was from the HPLC solvent system or the column, not the FBS
sample.
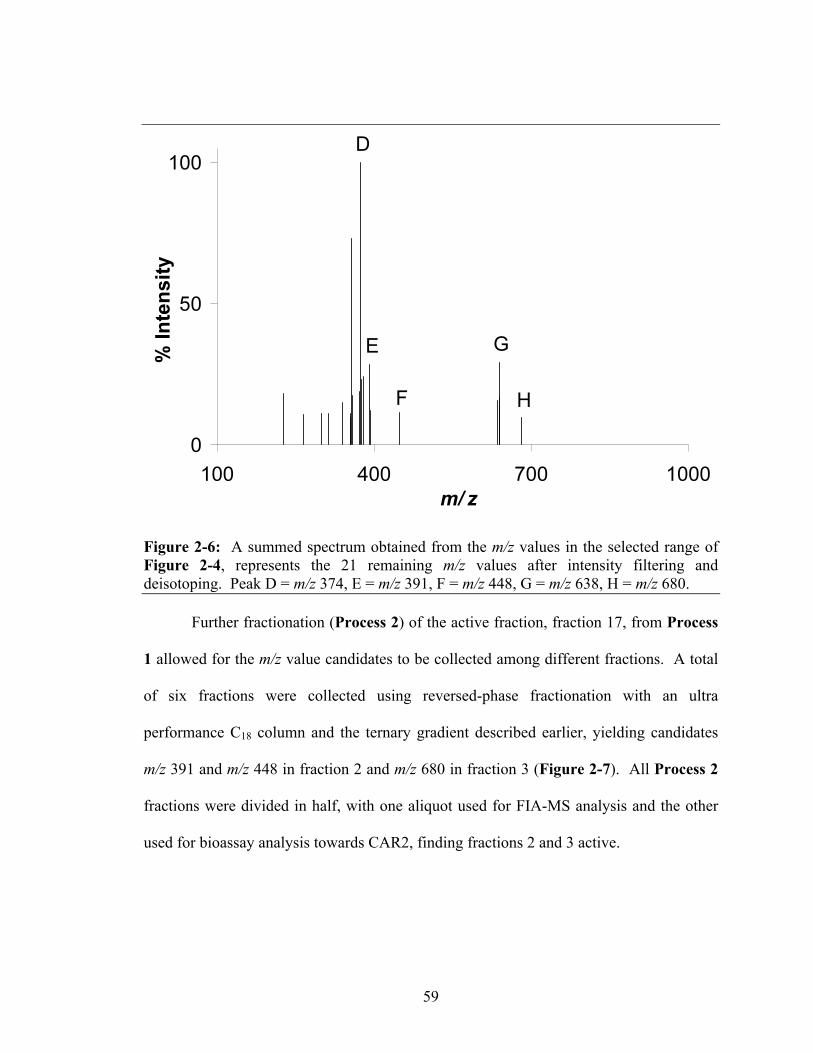
59
Figure 2-6: A summed spectrum obtained from the m/z values in the selected range of Figure 2-4, represents the 21 remaining m/z values after intensity filtering and deisotoping. Peak D = m/z 374, E = m/z 391, F = m/z 448, G = m/z 638, H = m/z 680.
Further fractionation (Process 2) of the active fraction, fraction 17, from Process
1 allowed for the m/z value candidates to be collected among different fractions. A total
of six fractions were collected using reversed-phase fractionation with an ultra
performance C18 column and the ternary gradient described earlier, yielding candidates
m/z 391 and m/z 448 in fraction 2 and m/z 680 in fraction 3 (Figure 2-7). All Process 2
fractions were divided in half, with one aliquot used for FIA-MS analysis and the other
used for bioassay analysis towards CAR2, finding fractions 2 and 3 active.

60
Figure 2-7: Extracted ion chromatograms depicting the second fractionation scheme (Process 2) in which the three m/z values of interest are distributed among two collected fractions.
2.3.2. Identification of Bioactive Compound
Positive mode ESI FIA-MS analysis was conducted for each of the six C18
Process 2 fractions. Comparison of spectra from the active fractions (2 and 3) to spectra
from inactive fractions (1, 4, 5, and 6) discovered a dominant ion, at m/z 391, present
only in the active fractions. To identify this compound, the accurate mass, m/z 391.2836
was selected from the mass spectrum (fraction 2) and submitted to an elemental
composition calculator. With the tolerance set to 10 ppm, the range of double bond
equivalents set to -1.5 to 20, and the range of potential elements set to 0-50 carbon, 0-200
61
hydrogen, 0-4 nitrogen, and 0-25 oxygen, three potential formulae were displayed, two of
which were eliminated owing to the low likelihood that this neutral lipid would contain
nitrogen atoms. The only non-nitrogen containing formula, C24H39O4+ (m/z 391.2843, 1.8
ppm error) was present in fractions 2 and 3, and was selected as the most likely candidate
based on both mass measurement and isotope pattern matching.
The use of multiplexed in-source CID allows for analyses as an extension of MSE
(generating separate mass spectra with two collision induced dissociation conditions) on
a time-of-flight mass spectrometer,32,33 which is advantageous over common MS/MS
experiments in that varying degrees of fragmentation are generated without the need for
predetermined or data-dependent selection of the precursor ion mass. This technique is
performed by switching the voltage on aperture 1, a focusing lens in the transit region
between the source and analyzer. For fraction 2, at the low voltage setting of 15 V, the
ion at m/z 391 dominates the spectrum, but at 65 V, fragment ions at m/z 279, 167, and
149 dominate the spectrum. Follow-up LC-MS analyses of the active fraction confirmed
that these three fragments co-eluted with m/z 391. These fragment ion masses are
consistent with published EI spectra of dioctyl phthalate suggesting that m/z 391 is
protonated dioctyl phthalate.34
Three dioctyl phthalate isomers, differing only in the aliphatic ester group, are
commonly used as plasticizers (Figure 2-8); branched-chain isomers di(2-ethylhexyl)
phthalate and di-isooctyl phthalate (DIOP), and the straight-chained di-n-octyl phthalate.
However, similarities in the physical properties of the isomers, as well as expected
similarities in fragmentation, the initial LC-MS analyses did not distinguish which isomer

62
was present. Therefore, established GC-MS techniques were used to determine the
isomer content.35,36
Figure 2-8: Structures of three dioctyl phthalate isomers, the branched-chained isomers di(2-ethylhexyl) phthalate (DEHP) and di-isooctyl phthalate (DIOP), and the straight-chained di-n-octyl phthalate (DNOP). A standard solution of both DEHP and DNOP was tested and compared to a
sample of untreated FBS. Figure 2-9 and Figure 2-10 depict the GC-MS results for the
analysis, showing that only DEHP is present in the fetal bovine serum sample,
confirming it as the bioactive compound since it is present in both chromatograms and
DNOP is absent from the serum extract sample. These results were confirmed by
bioassay testing of the individual isomers with a cell-based reporter assay, yielding an
EC50 value of 0.21 µM DEHP and no DNOP activity.37

63
Figure 2-9: GC-MS extracted ion chromatogram for m/z 149 for 5 µM DEHP and 5 µM DNOP standards. The peaks eluting at 12.22 minutes and 13.92 minutes correspond to DEHP and DNOP, respectively.

64
Figure 2-10: GC-MS extracted ion chromatogram for m/z 149 for extract of 100 µL of fetal bovine serum. The peak eluting at 12.22 minutes corresponds to DEHP, confirming the presence of DEHP in extracts of fetal bovine serum.
65
2.4. Conclusions
Relative mass defect filtering offers a rapid way to screen lists of ion masses for
compounds with fractional hydrogen content characteristic of specific compound classes
or common biosynthetic origins. This approach accelerates processing of ion mass
information and allows grouping of compounds based upon hydrogen content even when
their absolute mass defects differ. Such is the case when the molecular masses within a
class span a wide range. Coupling the use of relative mass defects with bioassay-directed
LC fractionation offers a quick alternative to traditional bioactive compound discovery,
focusing on targeted compound classes, and requiring fewer processing steps compared
to the traditional cycle of fractionation, bioassay, and characterization. Calculations of
relative mass defects could be performed on-the-fly to guide data-dependent MS/MS
analyses, if implemented in instrument control software. Furthermore, this approach
facilitates mining of LC-MS or GC-MS data for nontarget metabolite analyses, where a
substantial fraction of detected signals are often unassigned to compound classes or
elemental formulae.

66
2.5. References
1. DiMasi, J. A.; Hansen, R. W.; Grabowski, H. G.; Lasagna, L., Cost of Innovation
in the Pharmaceutical Industry. Journal of Health Economics 1991, 10, (2), 107-
142.
2. DiMasi, J. A.; Hansen, R. W.; Grabowski, H. G., The Price of Innovation: New
Estimates of Drug Development Costs. Journal of Health Economics 2003, 22,
(2), 151-185.
3. Fauchère, J.-L.; Boutin, J. A.; Henlin, J.-M.; Kucharczyk, N.; Ortuno, J.-C.,
Combinatorial Chemistry for the Generation of Molecular Diversity and the
Discovery of Bioactive Leads. Chemometrics and Intelligent Laboratory Systems
1998, 43, (1-2), 43-68.
4. Ertl, P.; Roggo, S.; Schuffenhauer, A., Natural Product-likeness Score and Its
Application for Prioritization of Compound Libraries. Journal of Chemical
Information and Modeling 2007, 48, (1), 68-74.
5. Young, S. M.; Curry, M. S.; Ransom, J. T.; Ballesteros, J. A.; Prossnitz, E. R.;
Sklar, L. A.; Edwards, B. S., High-Throughput Microfluidic Mixing and
Multiparametric Cell Sorting for Bioactive Compound Screening. Journal of
Biomolecular Screening 2004, 9, (2), 103-111.
6. Huang, X.; Kong, L.; Li, X.; Chen, X.; Guo, M.; Zou, H., Strategy for Analysis
and Screening of Bioactive Compounds in Traditional Chinese Medicines.
Journal of Chromatography B 2004, 812, (1-2), 71-84.

67
7. Wise, A.; Jupe, S. C.; Rees, S., The Identification of Ligands at Orphan G-Protein
Coupled Receptors. Annual Review of Pharmacology and Toxicology 2004, 44,
(1), 43-66.
8. He, W.; Miao, F. J.-P.; Lin, D. C.-H.; Schwandner, R. T.; Wang, Z.; Gao, J.;
Chen, J.-L.; Tian, H.; Ling, L., Citric Acid Cycle Intermediates as Ligands for
Orphan G-Protein-Coupled Receptors. Nature 2004, 429, (6988), 188-193.
9. Byers, J. A., Optimal Fractionation and Bioassay Plans for Isolation of
Synergistic Chemicals: The Subtractive-Combination Method. Journal of
Chemical Ecology 1992, 18, (9), 1603-1621.
10. Aston, F. W., Isotopes and Atomic Weights. Nature 1920, 105, (2646), 617-619.
11. Eddington, A. S., The Internal Constitution of the Stars. Dover Edition ed.;
Dover Publications, Inc.: New York, 1959.
12. Aston, F. W., Mass Spectra and Isotopes. 2nd ed.; Longmans, Green & Co.:
New York, 1942.
13. Eddington, A. S., The Internal Constitution of the Stars. Nature 1920, 106,
(2653), 14-20.
14. Feather, N., An Introduction to Nuclear Physics. University Press: Cambridge,
Great Britain, 1948.
15. Kind, T.; Fiehn, O., Metabolomic Database Annotations Via Query of Elemental
Compositions: Mass Accuracy is Insufficient Even at Less Than 1 ppm. BMC
Bioinformatics 2006, 7, (1), 234.
16. Gross, J. H., Mass Spectrometry: A Textbook. Springer: New York, 2004.

68
17. Kendrick, E., A Mass Scale Based on CH2 = 14.0000 for High Resolution Mass
Spectrometry of Organic Compounds. Analytical Chemistry 1963, 35, (13), 2146-
2154.
18. Hughey, C. A.; Hendrickson, C. L.; Rodgers, R. P.; Marshall, A. G.; Qian, K.,
Kendrick Mass Defect Spectrum: A Compact Visual Analysis for Ultrahigh-
Resolution Broadband Mass Spectra. Analytical Chemistry 2001, 73, (19), 4676-
4681.
19. Zhang, H.; Zhang, D.; Ray, K., A Software Filter to Remove Interference Ions
from Drug Metabolites in Accurate Mass Liquid Chromatography/Mass
Spectrometric Analyses. Journal of Mass Spectrometry 2003, 38, (10), 1110-
1112.
20. Zhang, H.; Zhu, M.; Ray, K. L.; Ma, L.; Zhang, D., Mass Defect Profiles of
Biological Matrices and the General Applicability of Mass Defect Filtering for
Metabolite Detection. Rapid Communications in Mass Spectrometry 2008, 22,
(13), 2082-2088.
21. Zhu, M.; Ma, L.; Zhang, D.; Ray, K.; Zhao, W.; Humphreys, W. G.; Skiles, G.;
Sanders, M.; Zhang, H., Detection and Characterization of Metabolites in
Biological Matrices Using Mass Defect Filtering of Liquid Chromatography/High
Resolution Mass Spectrometry Data. Drug Metabolism and Disposition 2006, 34,
(10), 1722-1733.

69
22. Koulman, A.; Volmer, D. A. In Mass Defects in Lipidomics; Strategies for
Exploiting High Resolution Mass Spectra from Human Lipid Profiles, 57th ASMS
Conference on Mass Spectrometry and Allied Topics, Philadelphia, PA, May 31 -
June 4, 2009; Philadelphia, PA, 2009; MP 242.
23. Toumi, M. L.; Desaire, H. In Mass Defect Analysis of Tryptic Peptides from
Human Biofluids: A Fresh Look, 57th ASMS Conference of Mass Spectrometry
and Allied Topics, Philadelphia, PA, May 30 - June 4, 2009; Philadelphia, PA,
2009; ThP 495.
24. Dodds, E. D.; An, H. J.; Hagerman, P. J.; Lebrilla, C. B., Enhanced Peptide Mass
Fingerprinting Through High Mass Accuracy: Exclusion of Non-Peptide Signals
Based on Residual Mass. Journal of Proteome Research 2006, 5, (5), 1195-1203.
25. Kirchner, M.; Timm, W.; Fong, P.; Wangemann, P.; Steen, H., Non-Linear
Classification for on-the-Fly Fractional Mass Filtering and Targeted Precursor
Fragmentation in Mass Spectrometry Experiments. Bioinformatics 26, (6), 791-
797.
26. Frost, S. C.; Wells, M. A., A Comparison of the Utilization of Medium and Long-
Chain Fatty Acids for Oxidation and Ketogenesis in the Suckling Rat: in vivo and
in vitro Studies. Archives of Biochemistry and Biophysics 1981, 211, (2), 537-
546.
27. Kaluzny, M. A.; Duncan, L. A.; Merritt, M. V.; Epps, D. E., Rapid Separation of
Lipid Classes in High Yield and Purity using Bonded Phase Columns. Journal of
Lipid Research 1985, 26, (1), 135-140.

70
28. Murphy, E. J.; Rosenberger, T. A.; Horrocks, L. A., Separation of Neutral Lipids
by High-Performance Liquid Chromatography: Quantification by Ultraviolet,
Light Scattering and Fluorescence Detection. Journal of Chromatography B:
Biomedical Sciences and Applications 1996, 685, (1), 9-14.
29. Auerbach, S. S.; DeKeyser, J. G.; Stoner, M. A.; Omiecinski, C. J., CAR2
Displays Unique Ligand Binding and RXRα Heterodimerization Characteristics.
Drug Metabolism and Disposition 2007, 35, (3), 428-439.
30. Gu, L.; Jones, A. D.; Last, R. L., Broad Connections in the Arabidopsis Seed
Metabolic Network Revealed by Metabolite Profiling of an Amino Acid
Catabolism Mutant. The Plant Journal 2010, 61, (4), 579-590.
31. Schilmiller, A.; Shi, F.; Kim, J.; Charbonneau, A. L.; Holmes, D.; Jones, A. D.;
Last, R. L., Mass Spectrometry Screening Reveals Widespread Diversity in
Trichome Specialized Metabolites of Tomato Chromosomal Substitution Lines.
The Plant Journal 2010, 62, (3), 391-403.
32. Bateman, K. P.; Castro-Perez, J.; Wrona, M.; Shockcor, J. P.; Yu, K.; Oballa, R.;
Nicoll-Griffith, D. A., MSE with Mass Defect Filtering for in vitro and in vivo
Metabolite Identification. Rapid Communications in Mass Spectrometry 2007,
21, (9), 1485-1496.
33. Silva, J. C.; Denny, R.; Dorschel, C. A.; Gorenstein, M.; Kass, I. J.; Li, G.-Z.;
McKenna, T.; Nold, M. J.; Richardson, K.; Young, P.; Geromanos, S.,
Quantitative Proteomic Analysis by Accurate Mass Retention Time Pairs.
Analytical Chemistry 2005, 77, (7), 2187-2200.

71
34. Yinon, J., Mass Spectral Fragmentation Pathways in Phthalate Esters. A Tandem
Mass Spectrometric Collision-Induced Dissociation Study. Organic Mass
Spectrometry 1988, 23, (11), 755-759.
35. Bove, J. L.; Dalven, P., A GC/MS Method of Determining Airborne Di-n-Butyl-
and DI(2-Ethyl Hexyl) Phthalates. International Journal of Environmental
Analytical Chemistry 1981, 10, (3), 189-196.
36. Bove, J. L.; Dalven, P.; Kukreja, V. P., Airborne di-Butyl and di-(2-Ethylhexyl)-
Phthalate at Three New York City Air Sampling Stations. International Journal
of Environmental Analytical Chemistry 1978, 5, (3), 189-194.
37. DeKeyser, J. G.; Stagliano, M. C.; Auerbach, S. S.; Prabhu, K. S.; Jones, A. D.;
Omiecinski, C. J., Di(2-ethylhexyl) Phthalate is a Highly Potent Agonist for the
Human Constitutive Androstane Receptor Splice Variant CAR2. Molecular
Pharmacology 2009, 75, (5), 1005-1013.
Chapter 3: Rapid Isomer-Resolved Determination of Phthalate Ester Plasticizers
using Ultra High Performance Liquid Chromatography-Tandem Mass
Spectrometry
73
Abstract
Phthalate esters are common contaminants of blood products, but various
phthalate derivatives exhibit differing biological activities. In this chapter, I report a
rapid ultra high performance liquid chromatography-tandem mass spectrometry method
for distinguishing two dioctyl phthalate esters, di(2-ethylhexyl) phthalate and di-n-
octylphthalate, and quantifying them in serum extracts. The procedure achieves
separation of both phthalate isomers with elution in less than 3 minutes by employing a
binary gradient of 10 mM aqueous ammonium acetate and methanol. Empirical
dependence of analyte retention selectivity upon column temperature and mobile phase
composition served as the basis for optimization of the chromatographic separation. Both
isomeric phthalates were detected by multiple reaction monitoring mass spectrometric
detection using the common transition from [M+H]+ at m/z 391 to the dominant fragment
ion at m/z 149. Isomer-selective detection of DEHP was accomplished by monitoring the
two transitions m/z 391 m/z 279 and m/z 391 m/z 167. This protocol allowed
identification and quantification of DEHP as the exclusive isomer of dioctyl phthalate in
untreated serum, and validated the efficacy of activated charcoal/Dextran treatment for
removal of DEHP.
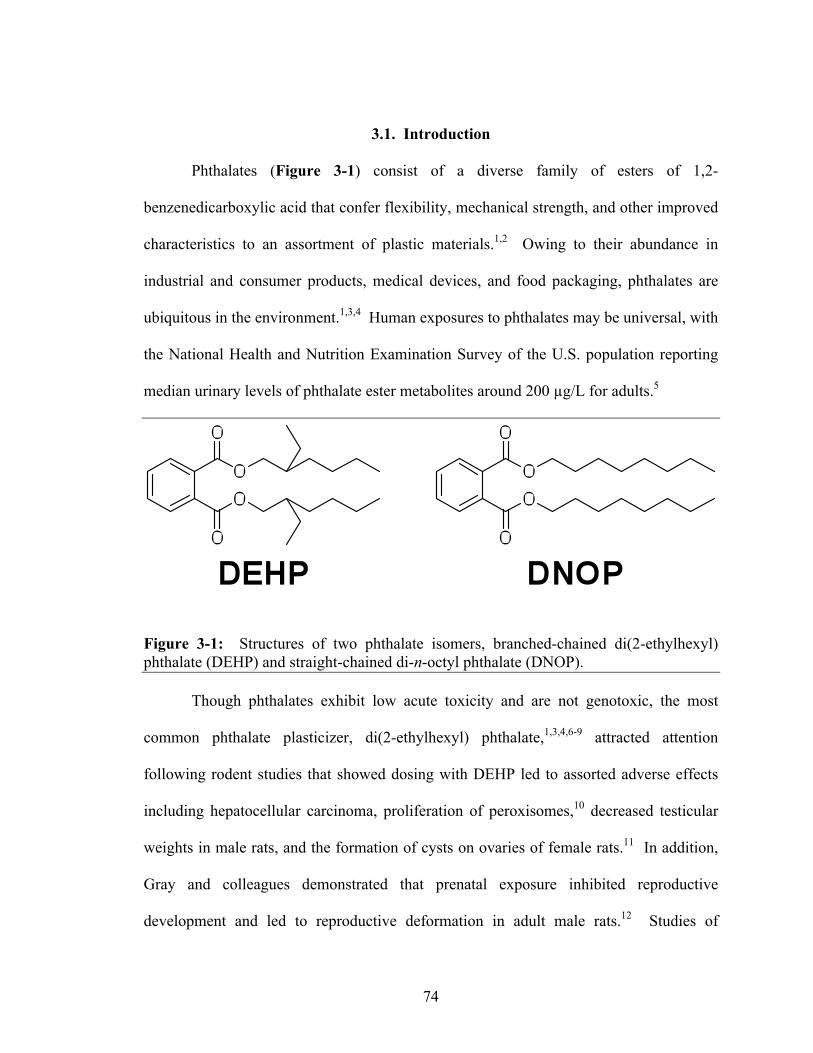
74
3.1. Introduction
Phthalates (Figure 3-1) consist of a diverse family of esters of 1,2-
benzenedicarboxylic acid that confer flexibility, mechanical strength, and other improved
characteristics to an assortment of plastic materials.1,2 Owing to their abundance in
industrial and consumer products, medical devices, and food packaging, phthalates are
ubiquitous in the environment.1,3,4 Human exposures to phthalates may be universal, with
the National Health and Nutrition Examination Survey of the U.S. population reporting
median urinary levels of phthalate ester metabolites around 200 µg/L for adults.5
Figure 3-1: Structures of two phthalate isomers, branched-chained di(2-ethylhexyl) phthalate (DEHP) and straight-chained di-n-octyl phthalate (DNOP).
Though phthalates exhibit low acute toxicity and are not genotoxic, the most
common phthalate plasticizer, di(2-ethylhexyl) phthalate,1,3,4,6-9 attracted attention
following rodent studies that showed dosing with DEHP led to assorted adverse effects
including hepatocellular carcinoma, proliferation of peroxisomes,10 decreased testicular
weights in male rats, and the formation of cysts on ovaries of female rats.11 In addition,
Gray and colleagues demonstrated that prenatal exposure inhibited reproductive
development and led to reproductive deformation in adult male rats.12 Studies of

75
phthalate exposures in humans drew correlations between phthalate exposure and
changes in the levels of reproductive hormones in males, reduced sperm quality and
damaged sperm DNA.8,13-15 In addition, altered thyroid hormone levels in men and a
higher incidence of asthma in premature infants were observed.15,16 Concerns about
human exposures to DEHP have also focused on children because the greatest effects are
predicted for premature infants including those cared for in neonatal intensive care units,
where prolonged exposure to developing bodies can cause the most damage.1,2,11
Screening of human biological fluids for phthalates and their metabolites can
document the extent of an individual’s exposure to phthalates, and offers the potential for
prediction of the effects on the subject’s health. For screening of large populations to
become feasible, the analytical costs and analysis times must be kept to a minimum
without sacrificing data quality. Furthermore, phthalate esters are near-ubiquitous
laboratory contaminants that can be introduced into blood products when blood is drawn
through plastic devices, and their presence may exert effects on cell-based bioassays. As
a result, there is a need for rapid and inexpensive screening of research and clinical
products for bioactive phthalates. Such assays should provide capability for
distinguishing phthalate isomers, particularly following the discovery that DEHP (and not
its straight-chain isomer, DNOP) is a potent activator of constitutive androstane receptor
2, a receptor capable of regulating metabolism of endogenous and exogenous
substances.17 Common practice of phthalate analysis has employed gas chromatography-
mass spectrometry,18-21 offering baseline separation of isomeric phthalates, but sample
analysis times often exceed 20 minutes. Newer methods for phthalate ester analysis have
coupled high performance liquid chromatography to UV22 and diode-array detectors,6,23

76
or mass spectrometry24-28 yielding decreased analysis times. While initial HPLC
methods did not address whether DEHP is distinguished from other phthalate ester
isomers,29 newer HPLC methods demonstrated the ability to resolve phthalate
isomers.30,31 With the advent of LC columns with sub-2 µm particles and ultra high
performance liquid chromatography pumps capable of 15,000 psi, phthalate isomers can
be separated in under 5 minutes.31 Therefore, my aim has been to design and implement
efficient UHPLC-MS/MS procedures to selectively detect and quantify the bioactive
phthalate, DEHP, in mixtures containing two common dioctyl phthalate isomers, using
fetal bovine serum as a documented source of phthalate contamination.32
The primary objective of UHPLC separations is often not increased speed, but
increased resolving power. When converting a HPLC method to an UHPLC method, the
challenge for the chromatographer is to decide whether to keep the analysis time the same
and maximize resolution, keep the resolution the same and minimize analysis time, or
choose a compromise.33 An equation for chromatographic resolution of two peaks is
given below,34 where R is resolution, N is the number of theoretical plates, α is selectivity
factor, k’ is capacity factor (B is the more retained compound, A is the less retained
compound), tR is compound elution time, and tM is dead time (dead volume). To improve
resolution, any of the three components of the equation below may be adjusted.
The first term, dependent on N, is improved by increasing column length, L, or
decreasing theoretical plate height, H. Plate height is decreased by adjusting the flow rate
toward the minimum value of H along the van Deemter curve. In addition, one can

77
increase the column temperature to shift the van Deemter curve. Increasing the
temperature will have minimal effects on eddy diffusion and longitudinal diffusion,
respectively, but rates of mass transfer will increase. This in turn will shift the minima of
the van Deemter curves down (lower plate height) and towards the right (increased
mobile phase velocity), yielding an increased optimum flow rate with smaller plate
heights. The second and third terms in the equation above, α and k’, are related to one
another, and can be adjusted for a specific column by changing mobile phase
composition. The results from experiments, altering column temperature, k’, and α, are
described in the following two sub-sections.

78
3.2. Materials and Methods
3.2.1. Materials
Fetal bovine serum was purchased from Invitrogen (Carlsbad, CA, USA).
Activated charcoal/Dextran treated FBS was purchased from Hyclone (Logan, UT,
USA). Di(2-ethylhexyl) phthalate (CAS No. 117-81-7) was purchased from Sigma-
Aldrich (St. Louis, MO, USA). Di-n-octyl phthalate (CAS No. 117-84-0) was purchased
from Alfa Aesar (Ward Hill, MA, USA). Ammonium acetate was purchased from EMD
Chemicals, Inc. (Gibbstown, NJ, USA). Methanol, 2-propanol, and chloroform were all
HPLC grade.
3.2.2. Avoidance of Contamination
To prevent contamination, whenever possible, labware made of soft plastics was
avoided except for use of batches made of polypropylene, determined to be free of
detectable phthalate esters. To minimize sample-to-sample carry over of DEHP in the
UHPLC system when doing quantitative experiments (section 3.2.4.4.), the autosampler
needle and injector were washed with 20 mL of 2-propanol prior to each batch of samples
analyzed. UHPLC-MS/MS analysis of Milli-Q® water blanks after each sample
monitored phthalate carryover levels.
3.2.3. Fetal Bovine Serum Extraction
Lipids were extracted from 100 µL aliquots of serum samples in 15 mL
polypropylene conical tubes using 3 mL of 2:1 methanol/chloroform (v/v). Tubes were
vortexed for 15 seconds, then placed in a hot water bath (50-55 °C) for 15 minutes to
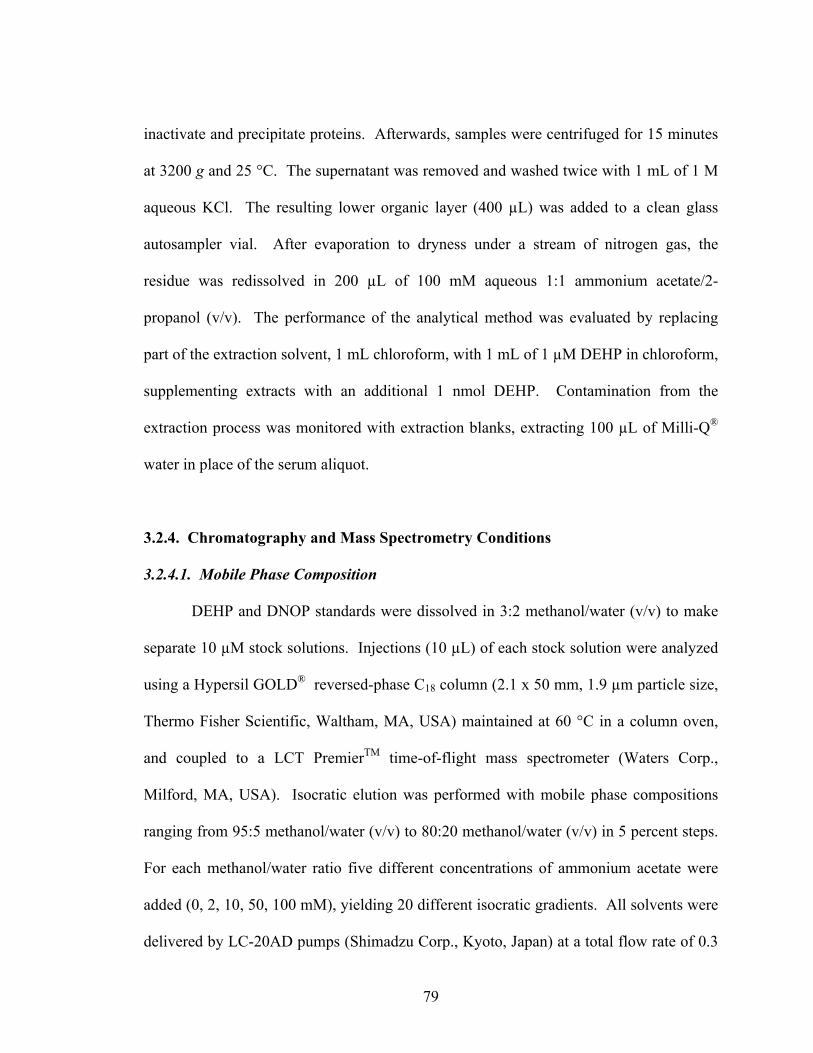
79
inactivate and precipitate proteins. Afterwards, samples were centrifuged for 15 minutes
at 3200 g and 25 °C. The supernatant was removed and washed twice with 1 mL of 1 M
aqueous KCl. The resulting lower organic layer (400 µL) was added to a clean glass
autosampler vial. After evaporation to dryness under a stream of nitrogen gas, the
residue was redissolved in 200 µL of 100 mM aqueous 1:1 ammonium acetate/2-
propanol (v/v). The performance of the analytical method was evaluated by replacing
part of the extraction solvent, 1 mL chloroform, with 1 mL of 1 µM DEHP in chloroform,
supplementing extracts with an additional 1 nmol DEHP. Contamination from the
extraction process was monitored with extraction blanks, extracting 100 µL of Milli-Q®
water in place of the serum aliquot.
3.2.4. Chromatography and Mass Spectrometry Conditions
3.2.4.1. Mobile Phase Composition
DEHP and DNOP standards were dissolved in 3:2 methanol/water (v/v) to make
separate 10 µM stock solutions. Injections (10 µL) of each stock solution were analyzed
using a Hypersil GOLD® reversed-phase C18 column (2.1 x 50 mm, 1.9 µm particle size,
Thermo Fisher Scientific, Waltham, MA, USA) maintained at 60 °C in a column oven,
and coupled to a LCT PremierTM time-of-flight mass spectrometer (Waters Corp.,
Milford, MA, USA). Isocratic elution was performed with mobile phase compositions
ranging from 95:5 methanol/water (v/v) to 80:20 methanol/water (v/v) in 5 percent steps.
For each methanol/water ratio five different concentrations of ammonium acetate were
added (0, 2, 10, 50, 100 mM), yielding 20 different isocratic gradients. All solvents were
delivered by LC-20AD pumps (Shimadzu Corp., Kyoto, Japan) at a total flow rate of 0.3

80
mL/min. Mass spectra were collected from m/z 100 to 1000 at 2 spectra per second
using positive mode electrospray ionization (ESI+). Using MassLynx software (Waters
Corp.), chromatographic retention times for peak tops were obtained from smoothed
(Savitzky-Golay, 5 scans, 5 smooths) extracted ion chromatograms for the protonated
phthalate esters ([M+H]+) at m/z 391.
3.2.4.2. Effect of Column Temperature on Phthalate Retention and Separation
DEHP and DNOP standards were dissolved in 1:1 2-propanol/100 mM
ammonium acetate (v/v) to make a solution with final concentrations of 5 µM each.
Aliquots (10 µL) of this solution were injected on the LC-MS instrument and were
analyzed using a binary gradient (Table 3-1) of 10 mM aqueous ammonium acetate and
methanol on the same column from above with positive mode electrospray ionization.
All solvents were delivered by an AcquityTM Ultra Performance LC (Waters Corp.) at a
total flow rate of 0.5 mL/min, coupled to a Quattro PremierTM XE triple quadrupole mass
spectrometer (Waters Corp.) operated in full scan mode over m/z 50 to 500, with spectra
collection at 4 spectra per second. The column temperature was varied from 30-60 °C in
5 °C increments. Retention times were obtained from the smoothed (Savitzky-Golay, 4
scans, 5 smooths) extracted ion chromatogram for the molecular ion, [M+H]+, at m/z 391.

81
Table 3-1: Mobile Phase Composition of the Optimized UHPLC Gradient.
Time (minutes) % 10 mM Ammonium Acetate % Methanol 0.00 99 1 0.50 20 80 4.00 15 85 4.01 99 1 5.00 99 1
3.2.4.3. Collision-Induced Dissociation of Dioctyl Phthalate Isomers
DEHP and DNOP standards were dissolved in 1:1 2-propanol/100 mM
ammonium acetate (v/v) to make 10 µM solutions. Injections (10 µL) were made using
the binary gradient in Table 3-1 on the same column from above coupled to a Quattro
PremierTM XE triple quadrupole mass spectrometer. Using a cone potential of 20 V,
product ion spectra were generated for the protonated molecules, [M+H]+, at ten collision
cell energies (5, 10, 15, 20, 25, 30, 45, 60, 75, and 90 V). Spectra were collected over a
mass range of m/z 50 to 400 at 2 spectra per second. All solvents were delivered by an
AcquityTM Ultra Performance LC at a flow rate of 0.5 mL/min, and the column
temperature was held at 60 °C.
3.2.4.4. Quantification of Dioctyl Phthalate Isomers in Fetal Bovine Serum
The source cone voltage and collision cell were optimized using QuanOptimize
routines within Waters MassLynx software v.4.1 as follows. To optimize the cone
voltage, separate 10 µM solutions of DEHP and DNOP in chloroform, were introduced
by flow injection analysis, with the target ion mass set to m/z 391 ([M+H]+). The

82
instrument collected mass spectra over a range of cone voltages from 10-70 V at 10 volt
increments by scanning the first quadrupole analyzer. Extracted ion chromatograms for
m/z 391 were generated for each cone voltage, returning the voltage that yielded the
greatest peak area. For both DEHP and DNOP, the optimized source cone voltage was
20 V. To optimize the collision cell potential, separate 10 µM solutions of DEHP and
DNOP were injected and the cone voltage was set to 20 volts. Automated optimization
of collision energy for the transition from m/z 391 to m/z 149 was performed by quasi-
simultaneous acquisition of product ion spectra, using collision potentials stepped in 5 V
increments from 5 to 40 V. The optimized collision potential for the transition from m/z
391 to m/z 167 was established by manual processing of the product ion spectra described
above. The optimized collision cell energy voltages are in Table 3-2.
Aliquots of 10 µL of fetal bovine serum extracts and 2.5 µL of spiked fetal bovine
serum extracts were injected for LC-MS/MS analysis of both phthalate esters using
multiple reaction monitoring in ESI positive mode. The sample cone was set at 20 volts
and the collision cell at 27 volts while monitoring transitions from the protonated
molecule ([M+H]+) at m/z 391 to a fragment at m/z 149. Chromatograms for this
transition were integrated using QuanLynx, part of the MassLynx software package.
Table 3-2: Optimized Source Cone and Collision Cell Potentials for MRM Experiments.
Analyte m/z Transition Source Cone Potential (V) Collision Cell Potential (V) 391 167 20 15 DEHP 391 149 20 30
DNOP 391 149 20 25

83
3.3. Results and Discussion
3.3.1. Optimization of Chromatographic Resolution of Isomeric Phthalate Esters
3.3.1.1. Effect of Mobile Phase Composition on Retention
Two components of the aqueous mobile phase, methanol/water ratio and
concentration of ammonium acetate, were independently altered to determine their effect
on DEHP retention. Figure 3-2 shows that when the ammonium acetate concentration is
held constant at 0, 10, 50, or 100 mM, the capacity factor decreases exponentially with
increasing methanol content. In fact, the capacity factor decreases by almost 50% with
each 5% increase in methanol. As the methanol component of the mobile phase
increases, the solvation of ions becomes less favorable, changing the polarizability of the
mobile phase and allowing it to more easily solvate phthalate molecules, making them
less retained.35,36
A contrasting effect is observed when the percent methanol component of the
mobile phase is constant and the ammonium acetate concentration is increased. The inset
data points in Figure 3-2 depict at each percent methanol composition, incremental
increases in ammonium acetate concentration, from 0 mM to 100 mM, yield an increase
in k’. However, the effect of changing ammonium acetate concentration has a larger
relative effect at higher methanol concentrations, demonstrated by the calculated k’
values, which increase 10% from 0 mM to 100 mM ammonium acetate at 90% methanol,
but only 6.2% at 75% methanol. The larger relative effect of ammonium acetate at
higher percent methanol compositions is due to fewer water molecules being present to
solvate the ammonium acetate, causing methanol to aid in salt solvation. This results in a
disruption of methanol/water interactions and alters the bulk solvent.
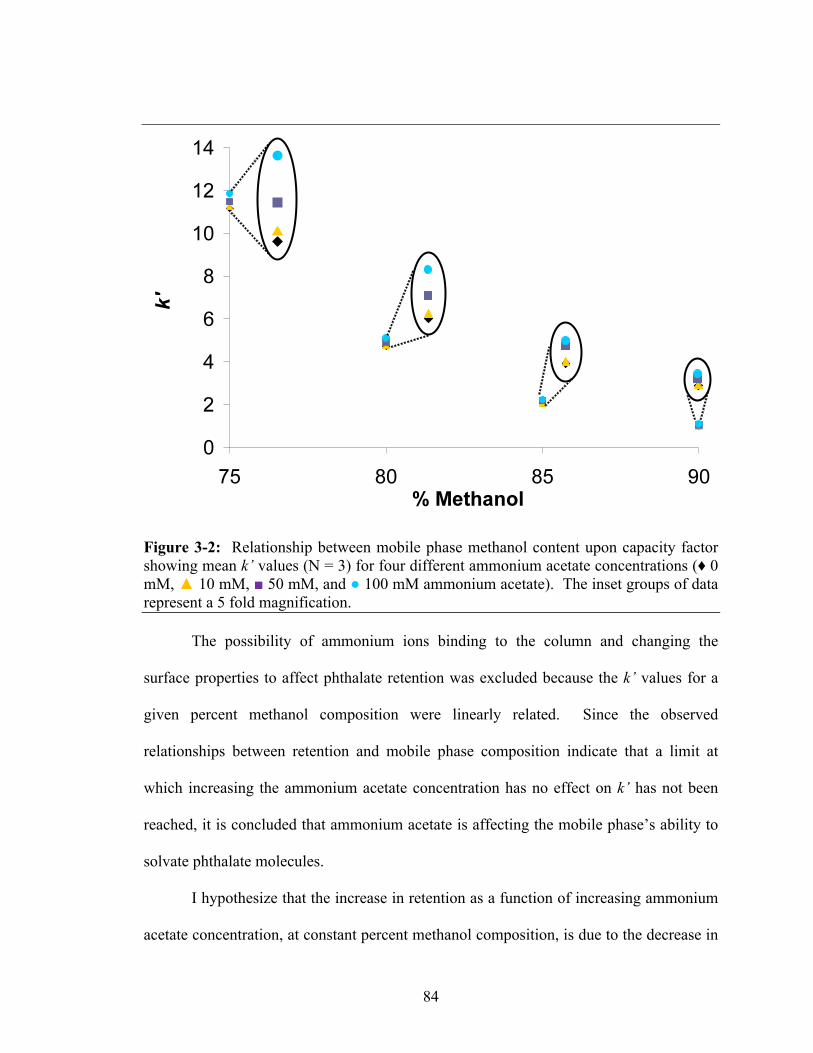
84
Figure 3-2: Relationship between mobile phase methanol content upon capacity factor showing mean k’ values (N = 3) for four different ammonium acetate concentrations (♦ 0 mM, ▲ 10 mM, ■ 50 mM, and ● 100 mM ammonium acetate). The inset groups of data represent a 5 fold magnification.
The possibility of ammonium ions binding to the column and changing the
surface properties to affect phthalate retention was excluded because the k’ values for a
given percent methanol composition were linearly related. Since the observed
relationships between retention and mobile phase composition indicate that a limit at
which increasing the ammonium acetate concentration has no effect on k’ has not been
reached, it is concluded that ammonium acetate is affecting the mobile phase’s ability to
solvate phthalate molecules.
I hypothesize that the increase in retention as a function of increasing ammonium
acetate concentration, at constant percent methanol composition, is due to the decrease in

85
solubility of phthalates in the mobile phase. For example, at 75 percent methanol
composition, the effect of ammonium acetate on phthalate retention at 100 mM is greater
than at 10 mM. This is attributed to disruption of methanol-water interactions by
ammonium acetate, thus decreasing solvation of phthalate esters by the mobile phase and
increasing k’.
As seen in Figure 3-2 and Figure 3-3, phthalate partitioning into the mobile
phase increases as either the percent methanol increases or the ammonium acetate
concentration decreases. While changing both ammonium acetate concentration and
percent methanol composition affects the solvation of phthalate molecules by the mobile
phase, changes in methanol content of the mobile phase provide a more practical option
than massive changes in mobile phase electrolyte content, particularly when mass
spectrometric detection is employed. Therefore, the gradient in Table 3-1 was developed
so that the mobile phase composition would correspond to k’ > 10 at time 0, a fast jump
to k’ ~ 4 at 0.5 min, corresponding to 80% methanol, and k’ ~ 2 (85% methanol) at the
end of the gradient (Figure 3-3).

86
Figure 3-3: The relationship between the rate of change of k’ with the rate of change in mobile phase ammonium acetate concentration, at different millimolar methanol concentrations. The equation of the best exponential fit is y = 118000e-0.129x.
3.3.1.2. Effect of Column Temperature on Retention
The relationship between (column) temperature and the equilibrium constant, Keq,
can be described by the van’t Hoff equation.37 Substitution of k’ for the equilibrium
constant, Keq, yields a modified van’t Hoff equation for phthalate partitioning between
the stationary and mobile phases (below), where ΔH° and ΔS° are the changes in
enthalpy and entropy, respectively, T is temperature, and R is the universal gas constant.

87
The relationship between k’ and temperature, plotted in Figure 3-4, indicates that
increased temperature decreases the k’ values for both phthalate isomers, with the slopes
being similar for the two isomers. The calculated values for ∆H° for transfer of DNOP
and DEHP from the mobile to the stationary phase are -11.5 KJ/mol and -10.6 KJ/mol,
respectively, and are comparable to values reported for a series of arylalkanoic acids
which ranged from -13 to -25 KJ/mol using 40% acetonitrile in water and between -6 to -
14 KJ/mol using 40% tetrahydrofuran in water.38 The small (~1 KJ/mol) difference in
∆H° values for the phthalate isomers can be attributed to the small difference (12
cm3/mol greater for DNOP) in critical volume (calculated using ChemBioDraw Ultra, v.
12.0, CambridgeSoft, Cambridge, MA, USA) and associated differences in energy costs
of accommodating space for the two solutes. The difference in entropy, ∆S°, for the two
phthalates is ~1.5 KJ/mol·K, indicating a major contribution to selectivity of partitioning
from entropy. Since elevated temperatures provide faster mass transport, particularly at
high flow rates, separations were conducted using a column temperature of 60 °C to
achieve rapid elution times.
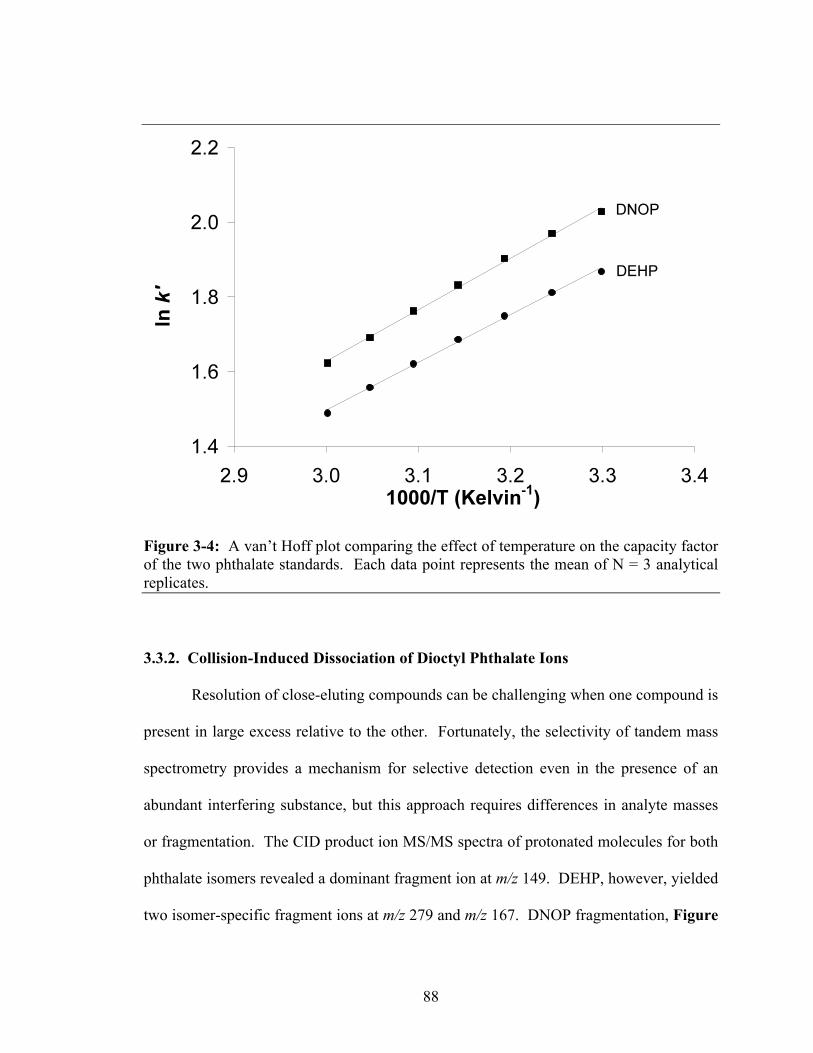
88
Figure 3-4: A van’t Hoff plot comparing the effect of temperature on the capacity factor of the two phthalate standards. Each data point represents the mean of N = 3 analytical replicates.
3.3.2. Collision-Induced Dissociation of Dioctyl Phthalate Ions
Resolution of close-eluting compounds can be challenging when one compound is
present in large excess relative to the other. Fortunately, the selectivity of tandem mass
spectrometry provides a mechanism for selective detection even in the presence of an
abundant interfering substance, but this approach requires differences in analyte masses
or fragmentation. The CID product ion MS/MS spectra of protonated molecules for both
phthalate isomers revealed a dominant fragment ion at m/z 149. DEHP, however, yielded
two isomer-specific fragment ions at m/z 279 and m/z 167. DNOP fragmentation, Figure

89
3-5, is directed by the formation of the isobenzofuran-1,3-dione fragment at m/z 149,
while DEHP fragmentation, Figure 3-6, is directed by the loss of the acyl chains to form
protonated phthalic acid (m/z 167), followed by dehydration to form the isobenzofuran-
1,3-dione ion.
Figure 3-5: The proposed fragmentation pathway of protonated DNOP to a fragment ion with m/z 149.

90
Figure 3-6: The proposed fragmentation pathway of protonated DEHP to a fragment ion at m/z 149, showing the two observed intermediate fragments that are specific to this branched-chain isomer.
The fragmentation behavior of DEHP is attributed to migration of the tertiary
hydrogen at the C2 position to one of the carbonyl oxygens. The positive charge on the
tertiary carbon at the C2 position is stable relative to the corresponding ion from the
linear alkyl phthalate ester. This is because the tertiary carbon in DEHP has three
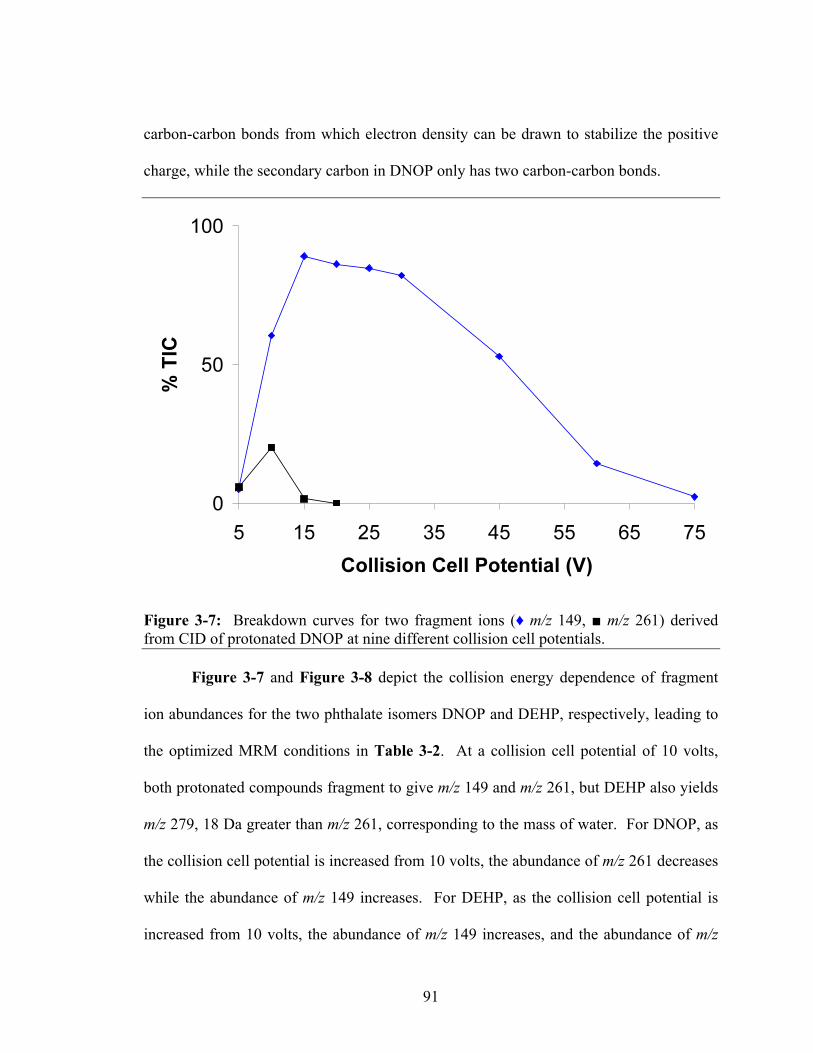
91
carbon-carbon bonds from which electron density can be drawn to stabilize the positive
charge, while the secondary carbon in DNOP only has two carbon-carbon bonds.
Figure 3-7: Breakdown curves for two fragment ions (♦ m/z 149, ■ m/z 261) derived from CID of protonated DNOP at nine different collision cell potentials.
Figure 3-7 and Figure 3-8 depict the collision energy dependence of fragment
ion abundances for the two phthalate isomers DNOP and DEHP, respectively, leading to
the optimized MRM conditions in Table 3-2. At a collision cell potential of 10 volts,
both protonated compounds fragment to give m/z 149 and m/z 261, but DEHP also yields
m/z 279, 18 Da greater than m/z 261, corresponding to the mass of water. For DNOP, as
the collision cell potential is increased from 10 volts, the abundance of m/z 261 decreases
while the abundance of m/z 149 increases. For DEHP, as the collision cell potential is
increased from 10 volts, the abundance of m/z 149 increases, and the abundance of m/z

92
261 decreases, as in DNOP. The abundance of m/z 279 also decreases after 10 volts,
coinciding with the increase in abundance of m/z 167. This demonstrates that two
different fragmentation pathways are available for DEHP: the formation of the furan
ring, as in DNOP, and the loss of the acyl chain with ring formation. The second
pathway is possible in DEHP and not DNOP because the branched-chain phthalate can
form a stable tertiary carbocation, while the straight-chained isomer can only form a
secondary carbocation.
Figure 3-8: Breakdown curves for four fragment ions (♦ m/z 149, ■ m/z 261, ▲ m/z 279, and ● m/z 167) derived from CID of protonated DEHP at nine different collision cell potentials.
Selective detection of DEHP can be achieved by monitoring the transition from
the protonated molecule to an isomer-selective fragment formed upon collision-induced

93
dissociation. To test this idea, a MRM method was developed to monitor a transition
common to both DEHP and DNOP (m/z 391 149) as well as a DEHP-selective
transition (m/z 391 167). As seen in Figure 3-9 the extracted ion chromatogram for an
equimolar mixture of the two isomers shows two peaks for the transition to the common
fragment at m/z 149 corresponding to DEHP and DNOP. However, as seen in Figure 3-
10,the XIC for the transition to the DEHP-selective fragment at m/z 167 shows only a
single chromatographic peak corresponding to DEHP. This approach yielded greater
than 100-fold improvement in selectivity of detection of the DEHP isomer relative to
DNOP.
Figure 3-9: LC-MRM chromatogram of 5 µM each of DEHP and DNOP standards showing the transition from the molecular ion [M+H]+ to a fragment ion common to both phthalates (m/z 149). Spectra were collected in ESI+ mode. Chromatograms were smoothed using the Savitzky-Golay method (3 scans, 3 smooths).

94
While m/z 149 is the predominant fragment ion for both isomers, the relative
abundance from DNOP is greater than that of DEHP. DNOP yields greater signal
intensity at low collision energies because DEHP forms other fragments, m/z 167 and m/z
279. These lower energy fragments from DEHP causes the optimum collision cell energy
for m/z 149 to be around 30 volts, while it is 25 volts for DNOP.
Figure 3-10: LC-MRM chromatogram of 5 µM each of DEHP and DNOP standards showing the transition from the molecular ion [M+H]+ to a fragment ion specific to DEHP (m/z 167). Spectra were collected in ESI+ mode. Chromatograms were smoothed using the Savitzky-Golay method (3 scans, 3 smooths).
3.3.3. Quantification of DEHP in Fetal Bovine Serum
To validate the protocol, the method of standard addition was employed to
determine the concentration of DEHP in fetal bovine serum. A standard addition curve

95
was constructed using various concentrations of DEHP from stock solutions; and the
DEHP concentration was calculated by spiking a FBS sample with a known amount of
DEHP. The calculated level of DEHP in FBS was 5.7 µM with a standard deviation of
0.7 µM, almost 4 times higher than the previously reported value of 1.5 µM.32 DEHP
was not detectable in the activated charcoal/Dextran treated FBS. The propagation of
error method was used to determine the error in our final DEHP concentration
calculation.39 The limit of detection, three times the standard deviation, was 0.09 µM and
limit of quantification, ten times the standard deviation was 0.3 µM.

96
3.4. Conclusions
This work demonstrates the performance of a triple quadrupole mass spectrometer
as a filter for selective detection and quantification of specific isomers. Employing a
multiple reaction monitoring tandem mass spectrometry method that was developed to
take advantage of isomer-specific fragmentation, incorporating a 5 minute UHPLC
gradient, phthalate isomers were separated, detected, and quantified. This procedure can
be used as a high-throughput screen for phthalates in blood products.
The optimized chromatographic conditions were determined by varying column
temperature and mobile phase composition (water, methanol, and ammonium acetate), so
that the phthalates would elute when the capacity factor was decreasing from 4 to 2. The
retention times of phthalates decrease as the percent methanol in the mobile phase
increases, while the addition of ammonium acetate has a smaller, but opposite effect,
enhancing phthalate retention. Increasing the percent methanol in the mobile phase had a
larger effect on the capacity factor than decreasing the ammonium acetate concentration.
While this change signifies that there are multiple ways to control retention and thus alter
k’, changing the methanol composition of the mobile phase is more direct.
This research will guide development of future rapid UHPLC-MS/MS screening
methods for detection and quantification of isomeric compounds, especially in instances
when baseline resolution is unattainable. The use of isomer-specific fragmentation to
develop a MRM MS/MS method will still yield quantitative data even in cases when
baseline chromatographic resolution cannot be achieved.

97
3.5. References
1. Green, R.; Hauser, R.; Calafat, A. M.; Weuve, J.; Schettler, T.; Ringer, S.;
Huttner, K.; Hu, H., Use of di(2-ethylhexyl) Phthalate-Containing Medical
Products and Urinary Levels of Mono(2-ethylhexyl) Phthalate in Neonatal
Intensive Care Unit Infants. Environmental Health Perspectives 2005, 113, (9),
1222-1225.
2. Kavlock, R.; Barr, D.; Boekelheide, K.; Breslin, W.; Breysse, P.; Chapin, R.;
Gaido, K.; Hodgson, E.; Marcus, M.; Shea, K.; Williams, P., NTP-CERHR Expert
Panel Update on the Reproductive and Developmental Toxicity of Di(2-
ethylhexyl) Phthalate. Reproductive Toxicology 2006, 22, (3), 291-399.
3. Heudorf, U.; Mersch-Sundermann, V.; Angerer, E., Phthalates: Toxicology and
Exposure. International Journal of Hygiene and Environmental Health 2007,
210, (5), 623-634.
4. Hogberg, J.; Hanberg, A.; Berglund, M.; Skerfving, S.; Remberger, M.; Calafat,
A. M.; Filipsson, A. F.; Jansson, B.; Johansson, N.; Appelgren, M.; Hakansson,
H., Phthalate Diesters and Their Metabolites in Human Breast Milk, Blood or
Serum, and Urine as Biomarkers of Exposure in Vulnerable Populations.
Environmental Health Perspectives 2008, 116, (3), 334-339.
5. Barr, D. B.; Silva, M. J.; Kato, K.; Reidy, J. A.; Malek, N. A.; Hurtz, D.;
Sadowski, M.; Needham, L. L.; Calafat, A. M., Assessing Human Exposure to
Phthalates Using Monoesters and Their Oxidized Metabolites as Biomarkers.
Environmental Health Perspectives 2003, 111, (9), 1148-1151.
98
6. Mazzeo, P.; Di Pasquale, D.; Ruggieri, F.; Fanelli, M.; D'Archivio, A. A.;
Carlucci, G., HPLC with Diode-Array Detection for the Simultaneous
Determination of Di(2-ethylhexyl)phthalate and Mono(2-ethylhexyl)phthalate in
Seminal Plasma. Biomedical Chromatography 2007, 21, (11), 1166-1171.
7. Adibi, J. J.; Whyatt, R. M.; Williams, P. L.; Calafat, A. M.; Camann, D.; Herrick,
R.; Nelson, H.; Bhat, H. K.; Perera, F. A.; Silva, M. J.; Hauser, R.,
Characterization of Phthalate Exposure Among Pregnant Women Assessed by
Repeat Air and Urine Samples. Environmental Health Perspectives 2008, 116,
(4), 467-473.
8. Duty, S. M.; Calafat, A. M.; Silva, M. J.; Ryan, L.; Hauser, R., Phthalate
Exposure and Reproductive Hormones in Adult Men. Human Reproduction
2005, 20, (3), 604-610.
9. Wittassek, M.; Angerer, J., Phthalates: Metabolism and Exposure. International
Journal of Andrology 2008, 31, (2), 131-136.
10. National Toxicology Program-CERHR Expert Panel Update on the Reproductive
and Developmental Toxicity of Di(2-ethylhexyl) Phthalate.
http://cerhr.niehs.nih.gov. In Services, U. S. Department of Health and Human
Services, 2005.
11. Calafat, A. M.; Needham, L. L.; Silva, M. J.; Lambert, G., Exposure to Di-(2-
Ethylhexyl) Phthalate Among Premature Neonates in a Neonatal Intensive Care
Unit. Pediatrics 2004, 113, (5), e429-434.

99
12. Howdeshell, K. L.; Furr, J.; Lambright, C. R.; Rider, C. V.; Wilson, V. S.; Gray,
L. E., Cumulative Effects of Dibutyl Phthalate and Diethylhexyl Phthalate on
Male Rat Reproductive Tract Development: Altered Fetal Steroid Hormones and
Genes. Toxicological Sciences 2007, 99, (1), 190-202.
13. Hoppin, J. A., Male Reproductive Effects of Phthalates: An Emerging Picture.
Epidemiology 2003, 14, (3), 259-260.
14. Hauser, R., Urinary Phthalate Metabolites and Semen Quality: A Review of a
Potential Biomarker of Susceptibility. International Journal of Andrology 2008,
31, (2), 112-116.
15. Hauser, R.; Calafat, A. M., Phthalates and Human Health. Occupational and
Environmental Medicine 2005, 62, (11), 806-818.
16. Meeker, J. D.; Calafat, A. M.; Hauser, R., Di(2-ethylhexyl) Phthalate Metabolites
May Alter Thyroid Hormone Levels in Men. Environmental Health Perspectives
2007, 115, (7), 1029-1034.
17. DeKeyser, J. G.; Stagliano, M. C.; Auerbach, S. S.; Prabhu, K. S.; Jones, A. D.;
Omiecinski, C. J., Di(2-ethylhexyl) Phthalate Is a Highly Potent Agonist for the
Human Constitutive Androstane Receptor Splice Variant CAR2. Molecular
Pharomacology 2009, 75, (5), 1005-1013.
18. Aparicio, I.; Santos, J. L.; Alonso, E., Simultaneous Sonication-Assisted
Extraction, and Determination by Gas Chromatography-Mass Spectrometry, of
Di-(2-ethylhexyl)phthalate, Nonylphenol, Nonylphenol Ethoxylates and
Polychlorinated Biphenyls in Sludge from Wastewater Treatment Plants.
Analytica Chimica Acta 2007, 584, (2), 455-461.

100
19. Ezerskis, Z.; Morkunas, V.; Suman, M.; Simoneau, C., Analytical Screening of
Polyadipates and Other Plasticisers in Poly(vinyl chloride) Gasket Seals and in
Fatty Food by Gas Chromatography-Mass Spectrometry. Analytica Chimica Acta
2007, 604, (1), 29-38.
20. Farahani, H.; Norouzi, P.; Dinarvand, R.; Ganjah, M. R., Development of
Dispersive Liquid-Liquid Microextraction Combined with Gas Chromatography-
Mass Spectrometry as a Simple, Rapid and Highly Sensitive Method for the
Determination of Phthalate Esters in Water Samples. Journal of Chromatography
A 2007, 1172, (2), 105-112.
21. Cao, X. L., Determination of Phthalates and Adipate in Bottled Water by
Headspace Solid-Phase Microextraction and Gas Chromatography/Mass
Spectrometry. Journal of Chromatography A 2008, 1178, (1-2), 231-238.
22. Li, J. D.; Cai, Y. Q.; Shi, Y. L.; Mou, S. F.; Jiang, G. B., Analysis of Phthalates
Via HPLC-UV in Environmental Water Samples After Concentration by Solid-
Phase Extraction using Ionic Liquid Mixed Hemimicelles. Talanta 2008, 74, (4),
498-504.
23. Chafer-Pericas, C.; Campins-Falco, P.; Prieto-Blanco, M. C., Automatic In-Tube
SPME and Fast Liquid Chromatography: A Cost-Effective Method for the
Estimation of Dibuthyl and Di-2-Ethylhexyl Phthalates in Environmental Water
samples. Analytica Chimica Acta 2008, 610, (2), 268-273.

101
24. Quintana, J. B.; Rodil, R.; Reemtsma, T., Determination of Phosphoric Acid
Mono- and Diesters in Municipal Wastewater by Solid-Phase Extraction and Ion-
Pair Liquid Chromatography-Tandem Mass Spectrometry. Analytical Chemistry
2006, 78, (5), 1644-1650.
25. Sorensen, L. K., Determination of Phthalates in Milk and Milk Products by Liquid
Chromatography/Tandem Mass Spectrometry. Rapid Communications in Mass
Spectrometry 2006, 20, (7), 1135-1143.
26. Kato, K.; Silva, M. J.; Needham, L. L.; Calafat, A. M., Quantifying Phthalate
Metabolites in Human Meconium and Semen using Automated Off-Line Solid-
Phase Extraction Coupled with On-Line SPE and Isotope-Dilution High-
Performance Liquid Chromatography-Tandem Mass Spectrometry. Analytical
Chemistry 2006, 78, (18), 6651-6655.
27. Ito, R.; Miura, N.; Kawaguchi, M.; Ushiro, M.; Iguchi, H.; Iwasaki, Y.; Saito, K.;
Nakazawa, H., Simultaneous Determination of Di(2-ethylhexyl)phthalate,
Mono(2-ethylhexyl)phthalate, and Phthalic Acid Migrating from Gamma-Ray
Irradiated Polyvinyl Chloride Sheet by Liquid Chromatography-Tandem Mass
Spectrometry. Journal of Liquid Chromatography & Related Technologies 2008,
31, (2), 198-209.
28. Preuss, R.; Koch, H. M.; Angerer, J., Biological Monitoring of the Five Major
Metabolites of Di-(2-ethylhexyl)phthalate (DEHP) in Human Urine using
Column-Switching Liquid Chromatography-Tandem Mass Spectrometry.
Journal of Chromatography B-Analytical Technologies in the Biomedical and
Life Sciences 2005, 816, (1-2), 269-280.

102
29. Inoue, K.; Higuchi, T.; Okada, F.; Iguchi, H.; Yoshimura, Y.; Sato, A.;
Nakazawa, H., The Validation of Column-Switching LC/MS as a High-
Throughput Approach for Direct Analysis of Di(2-ethylhexyl) Phthalate Released
from PVC Medical Devices in Intravenous Solution. Journal of Pharmaceutical
and Biomedical Analysis 2003, 31, (6), 1145-1152.
30. Fromme, H.; Gruber, L.; Schlummer, M.; Wolz, G.; Böhmer, S.; Angerer, J.;
Mayer, R.; Liebl, B.; Bolte, G., Intake of Phthalates and Di(2-ethylhexyl)adipate:
Results of the Integrated Exposure Assessment Survey Based on Duplicate Diet
Samples and Biomonitoring Data. Environment International 2007, 33, (8),
1012-1020.
31. Wu, T.; Wang, C.; Wang, X.; Xiao, H.; Ma, Q.; Zhang, Q., Comparison of UPLC
and HPLC for Analysis of 12 Phthalates. Chromatographia 2008, 68, (9), 803-
806.
32. Inoue, K.; Kawaguchi, M.; Okada, F.; Yoshimura, Y.; Nakazawa, H., Column-
Switching High-Performance Liquid Chromatography Electrospray Mass
Spectrometry Coupled with On-Line of Extraction for the Determination of
Mono- and Di-(2-ethylhexyl) Phthalate in Blood Samples. Analytical and
Bioanalytical Chemistry 2003, 375, (4), 527-533.
33. Arnaud, C. H., Speeding up Separations. Chemical & Engineering News 2010,
88, (24), 40-44.
34. Skoog, D. A.; Holler, F. J.; Nieman, T. A., Optimization of Column Performance.
In Principles of Instrumental Analysis, 5th ed.; Harcourt Brace College
Publishing: Chicago, 1998; pp 674-700.
103
35. Castells, C. B.; Ràfols, C.; Rosés, M.; Bosch, E., Effect of Temperature on pH
Measurements and Acid-Base Equilibria in Methanol-Water Mixtures. Journal of
Chromatography A 2003, 1002, (1-2), 41-53.
36. Buckenmaier, S. M. C.; McCalley, D. V.; Euerby, M. R., Determination of
Ionization Constants of Organic Bases in Aqueous Methanol Solutions using
Capillary Electrophoresis. Journal of Chromatography A 2004, 1026, (1-2), 251-
259.
37. Atkins, P., Thermodynamics: The Second Law. In The Elements of Physical
Chemistry, W. H. Freeman and Company: New York, 1997; pp 75-113.
38. Kuchar, M.; Kraus, E.; Rejholec, V.; Miller, V., Enthalpy-Entropy Compensation
in Reversed-Phase High-Performance Liquid Chromatography of Series of
Aryloxoalkanoic and Arylhydroxyalkanoic Acids. Journal of Chromatography A
1988, 449, 391-401.
39. Meyer, S. L., Data Analysis for Scientists and Engineers. John Wiley & Sons,
Inc.: New York, 1975.

Chapter 4: Quantification of Target Phosphatidylethanolamine Plant Lipids using
Flow Injection Analysis with Multiple Reaction Monitoring

105
4.1. Introduction
Plant chloroplasts have complex membranes which play important roles in lipid
biosynthesis, transport, and degradation, a process regulated by various enzymes.
Alterations in membrane composition have potential to influence numerous cellular
functions. While the roles of many chloroplast genes remain unclear, many enzymes
have high specificity to lipid substrates with a specific head group, number of fatty acyl
carbons, and units of unsaturation. Extensive resources of Arabidopsis knockout mutants
allow gene functions to be explored through comprehensive screening of metabolic
phenotypes for thousands of mutant lines, using an approach termed reverse genetics.
Using these mutant lines in combination with environmental or pathogen stresses,
researchers have begun to measure the relationship between genes, and the enzymes they
code for, and phenotypic behavior, including changes in abundance of different lipids.
Often, the change in fatty acid composition of lipids correlates to specific stresses.1-5
In Arabidopsis, the major classes of chloroplast lipids are phospholipids
(phosphatidic acid, PA, phosphatidylcholine, PC, and phosphatidylethanolamine) and
galactolipids (e.g. monogalactosyldiacylglycerol, MGDG). Fatty acids, synthesized in
the chloroplast, can be exported to other organelles including the endoplasmic reticulum
for incorporation into PA lipids, or can remain in the chloroplast to become PA lipids or
diacylglycerols (DAG). PA lipids that are assembled outside the chloroplast are used in
the synthesis of other phospholipids via attachment of various groups (e.g. ethanolamine)
and diacylglycerols which are produced by removal of the phosphate group. The
diacylglycerols can serve as precursors of other lipids including triacylglycerols
(triglycerides), which are of increasing interest because of their potential use as biofuels.
106
Many of these lipids, including PA, that are assembled outside the chloroplast undergo
either chain length modification or desaturation (or both) before transport back into the
chloroplast.6-8 All of these modifications have potential importance to cellular functions
and as end products with potential economic value.
The synthesis of PA, the building block of all plant lipids, is also highly
regulated. The substrate specificities of the acyltransferases expressed inside the
chloroplast and outside, in the endoplasmic reticulum (ER), lead to very different lipid
products. In the chloroplast, phosphatidic acid is formed with a 16:0 fatty acid at the sn-2
position and an 18 carbon fatty acid, usually 18:1, at the sn-1 position. However, outside
the chloroplast, PA is always synthesized with an 18:1 fatty acid attached at the sn-2
position and only has 18:1 at the sn-1 position when 16:0 is not available.9 Many of the
PA lipids and their downstream products inside the chloroplast will be structural isomers
of the PA lipids outside in the ER. To understand the contributions of lipid biosynthetic
pathways that occur in different parts of the plant cell, there is a need to quantify complex
lipids in plants, including discrimination of isomeric lipids that differ in the positions of
fatty acid substitution. Current mass spectrometry methods are powerful tools that can
use molecular mass to assign the number of carbon atoms in the fatty acyl groups within
some phospholipids, but mass spectrometry usually has difficulty distinguishing isomers.
Identification of plant lipids is still accomplished by TLC.10-12 While this is an
inexpensive way to identify large changes in levels of lipids within specific chemical
classes, more subtle changes in lipid composition often go undetected. In addition to
TLC, gas chromatography-mass spectrometry of FAMEs, which analyzes the fatty acid
methyl esters derived from lipids present, has been employed, but in releasing fatty acids

107
from the complex lipid, structural information about positions of attachment is lost.13-15
Another approach pioneered by Welti and Wang,2 and Han and Gross,16 has been to use
direct-infusion MS/MS, where lipid classes are selected for by a characteristic fragment
ion or neutral loss, and then fragmented to measure the relative amounts of fatty acids.
One of the drawbacks of these lipid analyses is that no information on the relative ratios
of positional isomers is reported. Han and Gross even state that, “Lipidomics at its
current stage is unable to accurately discriminate the sn-1 and sn-2 acyl moieties present
in a diacyl phospholipid species.…”16
The challenge of performing isomer-specific lipid quantification is magnified
when lipids are extracted from whole plant leaves, which contain lipids from all
organelles including the ER as well as the chloroplast. An extract now contains an
isomeric mixture of the very lipids nature had intentionally segregated. One approach to
avoid this problem is to physically separate the chloroplasts from the ER based on
differential densities, and extract each separately.17 While this keeps the chloroplast
contents separate, it is a time consuming procedure.
The above methods are approaches that help build understanding of the
connections between gene functions, tissue lipid composition, and environmental factors.
One issue remaining to be resolved is that a change in isomeric composition of lipids may
be an important biological marker of the efficiency of biosynthesis and transport of lipids
in and between subcellular compartments, and may lead to identification of new roles for
existing genes and new lipid transporters. It remains clear that a method to determine the
relative ratios of positional isomers is required to identify bottlenecks in accumulation of
lipids by plant tissues. Therefore, the aim of this chapter is two-fold: to improve upon

108
current MS/MS technologies and develop rapid FIA-MRM MS quantification methods
for PE lipids, and to probe the fragmentation of PE lipids by examining the effects of the
number of double bonds, and the effect of modifying the head group.
109
4.2. Materials and Methods
4.2.1. Materials
Lipid standards, 1-palmitoyl-2-oleoyl-sn-glycero-3-phosphoethanolamine (PE
16:0-18:1), 1-palmitoyl-2-linoleoyl-sn-glycero-3-phosphoethanolamine (PE 16:0-18:2),
and 1-palmitoyl-2-hydroxy-sn-glycero-3-phosphoethanolamine (lyso PE 16:0) were
purchased from Avanti Polar Lipids, Inc. (Alabaster, AL, USA). Di-tert-butyl
dicarbonate (CAS No. 24424-99-5), triethylamine (CAS No. 121-44-8), and reagent
grade trifluoroacetic acid (CAS No. 76-05-1) were purchased from Sigma-Aldrich (St.
Louis, MO, USA). Stearoyl chloride (CAS No. 112-76-5) was purchased from Alfa
Aesar (Ward Hill, MA, USA). Sodium chloride was purchased from EMD Chemicals,
Inc. (Gibbstown, NJ, USA) and sodium acetate from Mallinckrodt Baker, Inc.
(Phillipsburg, NJ, USA). Methanol, 2-propanol, THF, and chloroform were all HPLC
grade.
4.2.2. Synthesis of 1-Palmitoyl-2-Stearoyl-sn-Glycero-3-Phosphoethanolamine
The following procedure was developed after a literature search into PE lipid
synthesis.18,19 Lyso PE 16:0, 25 mg, was dissolved in 10 mL of 1:1 THF/chloroform
(v/v) and stored at -4 °C. A 2 mL aliquot containing 5 mg of the lyso PE lipid was added
to a 25 mL round bottom flask along with 15 µL of triethylamine and 12 µL of di-tert-
butyl dicarbonate (amine protecting group). An additional 3 mL of chloroform was
added to the reaction vessel, which was capped and stirred for 45 minutes. The liquid
was then washed three times with 1 M NaCl and the organic layer was collected and
dried under nitrogen gas. After dissolving the solid in 5 mL of chloroform, 8 µL of

110
triethylamine and 5 µL of stearoyl chloride were added and the reaction vessel was
capped and stirred for 45 minutes. The chloroform layer was washed three times with 10
mL of Milli-Q® water, collected, and transferred to a clean 25 mL round bottom flask.
The protecting group was removed by reaction with 1 µL of trifluoroacetic acid for 45
minutes, followed by three Milli-Q® water washes. The resulting 5 mL of chloroform
was stored at -4 °C. Flow injection analysis and negative mode electrospray ionization
mass spectrometry were used to monitor the reaction progress.
4.2.3. Flow Injection Analysis-Multiple Reaction Monitoring of PE Lipids
Aliquots (10 µL) of individual plant extracts in 2:1 methanol/chloroform
containing 5 mM sodium acetate were analyzed using flow injection analysis on a
Quattro MicroTM triple quadrupole mass spectrometer (Waters Corp., Milford, MA,
USA), employing ESI+. The sample cone was held at 40 V, and the ESI capillary at
3500 V. Spectrum acquisition covered the 20 m/z transitions listed in Table 4-1, with a
spectrum accumulation time of 0.038 seconds per transition. FIA analyses of samples
employed a 2:1 methanol/chloroform (v/v) mobile phase flowing at 0.1 mL/min supplied
by Prominence LC-20AD high performance LC solvent delivery modules (Shimadzu
Corp., Kyoto, Japan).
4.2.4. Collision-Induced Dissociation of PE Lipid Standards
Aliquots (10 µL) of two PE lipid standards, 100 µM in 2-propanol, were analyzed
using flow injection analysis on a Quattro PremierTM XE triple quadrupole mass
spectrometer (Waters Corp.). Using a cone potential of 20 V and an ESI capillary

111
voltage of 3330 V, daughter ion spectra were generated for the protonated molecules,
[M+H]+, and the deprotonated molecules [M-H]- at twelve collision cell energies (5, 10,
15, 20, 25, 30, 35, 40, 45, 60, 75, and 90 V). Spectra were collected over a mass range of
m/z 50 to 800 at 2 spectra per second. A 100% methanol mobile phase was delivered by
an AcquityTM Ultra Performance LC (Waters Corp.) at a flow rate of 0.2 mL/min.
Spectra (scans 10-50) were summed and background subtracted before the peak intensity
list was exported to Microsoft Excel for data analysis.
4.2.5. Effect of Phosphoethanolamine Head Group Modification
Aliquots (50 µL in chloroform) of two lipids, tert-butyl carbamate (BOC)-PE
16:0-18:0 and PE 16:0-18:0, were added to 500 µL 2-propanol. Injections (10 µL) were
analyzed using flow injection analysis on a Q-TOF UltimaTM mass spectrometer (Waters
Corp.). Using a cone potential of 45 V and an ESI capillary voltage of 3000 V, daughter
ion spectra were generated for the protonated molecules, [M+H]+ using a collision cell
energies of 40. Spectra were collected over a mass range of m/z 50 to 1000 at 2 spectra
per second. A 100% methanol mobile phase was delivered by a Waters 2795 Separation
Module at a flow rate of 0.2 mL/min.

112
4.3. Results and Discussion
4.3.1. Development and Application of a MRM Method
Unlike the genome, the metabolome is not static, responding over time to stresses,
pathogens, and chemical signals. Therefore, to conduct a full-scale metabolomics or
lipidomics study, thousands of samples from different time points, chronicling different
metabolome states, are collected. The demand for analysis of large sample sets mandates
rapid, high-throughput methods. While the methods developed by Welti and colleagues
are powerful, they involve continuous infusion of tissue extracts over periods ranging
from 25 minutes to nearly 1 hour per sample. Since reverse genetics studies of mutant
plant lines often require profiling of thousands of samples per study, the needs of such
studies propel efforts to accelerate the speed of mass spectrometric lipid analyses.
The lipid species in Arabidopsis thaliana have been well cataloged,2,20,21 making
it possible to generate a table of all lipids and their molecular masses likely to be present
in a tissue extract. Complex lipids, such as phosphatidylethanolamines (Figure 4-1),
contain two fatty acyl chains, each of which can fragment in the mass spectrometer under
collision-induced dissociation to yield the corresponding acylium ions in positive ion
mode.

113
Figure 4-1: The structure of a PE 34:0 (16:0-18:0), 1-palmitoyl-2-stearoyl-sn-glycero-3-phosphatidylethanolamine, and the corresponding acylium ions generated by CID.
Exploiting the knowledge about which PE lipid species are present in Arabidopsis
thaliana leaves and what fatty acyl chains are likely to be attached, a table was
constructed containing masses of all sodiated PE lipids and their acylium fragment ions
(Table 4-1). By monitoring specific mass transitions, instrumental signals are generated
for each PE lipid isomer, and the relative amounts of each lipid can be determined.
Lipids that contain fatty acyl chains of different masses are detected by measuring either
transition of precursor to product ion. For example, PE 34:1 can be made up of two
different combinations of fatty acids (16:0 plus 18:1, and 16:1 plus 18:0). For lipids

114
containing two of the same fatty acyl chains, only one transition can be measured.
Therefore, two complementary methods were used, the first measuring the transition
from the sodiated lipid to acylium ion 1 (Method 1) and the second to the
complementary acylium ion 2 (Method 2). Using the ion transitions in Table 4-1, 20 PE
lipids are detected and quantified in a single 3 minute analysis using flow injection
analysis (FIA).
Table 4-1: List of PE Lipids for MRM Method.
Lipid Chain 1 fatty acid
Chain 2 fatty acid
[M+Na]+
(m/z) Acylium Ion 1
(m/z) Acylium Ion 2
(m/z) 16:0 18:1 239.24 265.25 PE (34:1) 16:1 18:0 740.52 237.22 267.27 16:0 18:2 239.24 263.24 16:1 18:1 237.22 265.25 PE (34:2) 16:2 18:0
738.50 235.21 267.27
16:0 18:3 239.24 261.22 16:1 18:2 237.22 263.24 16:2 18:1 235.21 265.25 PE (34:3)
16:3 18:0
736.49
233.19 267.27 16:1 18:3 237.22 261.22 16:2 18:2 235.21 263.24 PE (34:4) 16:3 18:1
734.47 233.19 265.25
18:0 18:2 267.27 263.24 PE (36:2) 18:1 18:1 766.54 265.25 265.25 18:0 18:3 267.27 261.22 PE (36:3) 18:1 18:2 764.52 265.25 263.24 18:1 18:3 265.25 261.22 PE (36:4) 18:2 18:2 762.50 263.24 263.24
PE (36:5) 18:2 18:3 760.49 263.24 261.22 PE (36:6) 18:3 18:3 758.47 261.22 261.22
To compare the performance of the FIA-MRM method to traditional lipid analysis
methods, PE lipids were extracted from leaves of Arabidopsis thaliana (Col-0) and were
quantified using two methods: the FIA-MRM method and the TLC method followed by
115
analysis of FAMEs using GC FID. The FIA-MRM method generates separate profiles of
signal intensity for each MRM channel. Peak areas for each MRM transition from
Method 1 and Method 2 were determined by integration using QuanLynx software. To
determine the relative amounts of fatty acids present, a relative response factor of 0.5 was
used for all lipids with differing fatty acyl chains, and a value of 1 was used for all lipids
with the same fatty acyl chains because both chains will yield the same fragment ion. For
example, the peak area for 18:0 from PE 36:0 was not adjusted, but the peak area for 18:0
from 36:1 was doubled to calculate the number of moles of each lipid. This is based on
the fragmentation of 36:1 to 18:0 and 18:1, with only the transition 36:1 18:0 being
monitored, while the fragmentation of 36:0 always leads to 18:0. The amounts of each
fatty acid chain were totaled and are displayed in Figure 4-2.
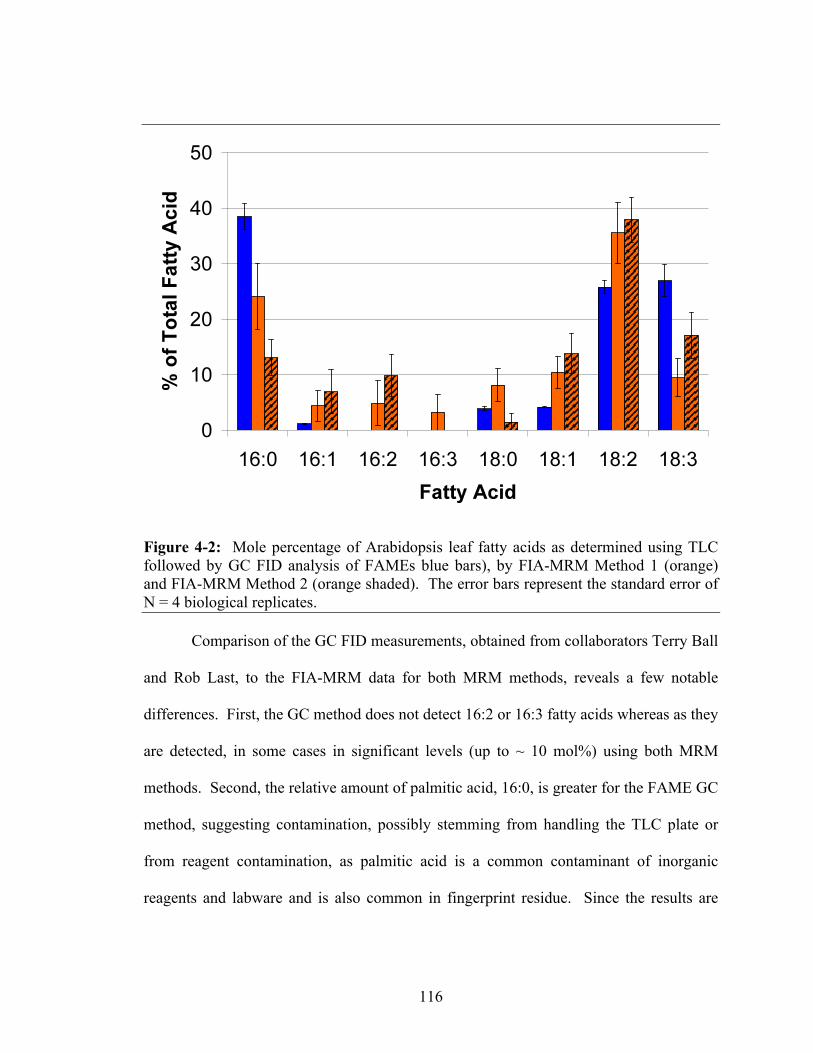
116
Figure 4-2: Mole percentage of Arabidopsis leaf fatty acids as determined using TLC followed by GC FID analysis of FAMEs blue bars), by FIA-MRM Method 1 (orange) and FIA-MRM Method 2 (orange shaded). The error bars represent the standard error of N = 4 biological replicates.
Comparison of the GC FID measurements, obtained from collaborators Terry Ball
and Rob Last, to the FIA-MRM data for both MRM methods, reveals a few notable
differences. First, the GC method does not detect 16:2 or 16:3 fatty acids whereas as they
are detected, in some cases in significant levels (up to ~ 10 mol%) using both MRM
methods. Second, the relative amount of palmitic acid, 16:0, is greater for the FAME GC
method, suggesting contamination, possibly stemming from handling the TLC plate or
from reagent contamination, as palmitic acid is a common contaminant of inorganic
reagents and labware and is also common in fingerprint residue. Since the results are

117
presented as mole %, an increase in C16:0 in the FAME results would also be reflected in
decreased mole % of all other fatty acids.
The three greatest drawbacks of FAME GC are: (1) a substantial amount of
sample handling occurs, which increases likelihood of contamination; (2) separation of
lipid classes by TLC may be incomplete, leading to cross-contamination by other lipid
classes, and (3) all information about positions of fatty acyl substitution on the glycerol
backbone is lost after transesterification, as seen in Figure 4-2. Two primary advantages
of the MRM method are that handling of the extracts is minimal, and detection is more
selective because it is based on both the lipid molecular mass and a characteristic
fragment ion.
Figure 4-3 documents how well the FIA-MRM approach determines which fatty
acid groups are present for a specific PE lipid. Both FIA-MRM Method 1 and Method 2
successfully identified 16:1-18:3 as the only detected isomer of PE 34:4, with neither
method detecting 16:2-18:2 or 16:3-18:1. In addition, the difference in detected peak
areas from the two MRM methods was 6%. This demonstrates that the MRM method
provides a rapid and quantitative alternative to GC-MS of FAMEs and yields information
about intact lipids rather than their transesterification products. One drawback of the
MRM method is that the relative amounts of positional isomers are unavailable (16:3 in
position sn-1 and 18:1 at position sn-2 vs. 18:1 at position sn-1 and 16:3 at position sn-2).
Having fatty acyl chains of differing length and different number of double bonds may
influence the fragmentation efficiency at the sn-1 and sn-2 positions, but the lack of
isomer-specific standards to date has hindered testing of this hypothesis.

118
Figure 4-3: Relative amounts of fatty acid compositions for three isomers of PE 34:4 in an extract of Arabidopsis leaf tissue. The blue bar presents results obtained using FIA-MRM Method 1, monitoring the transition from sodiated 34:4 16:1 acylium fragment ion, and the maize bar presents results from FIA-MRM Method 2, monitoring the transition from sodiated 34:4 18:3 acylium ion. The peak areas for the two methods were normalized to the larger value.
4.3.2. Collision-Induced Dissociation of PE Lipid Standards
Traditional analysis of PE lipids using positive mode electrospray and MS/MS
employs neutral loss of 141 Da, corresponding to the ethanolamine head group being
released from the glycerol backbone as a neutral fragment. Since the two fatty acyl
chains are part of the fragment that retains charge and is detected by the mass
spectrometer, measurement of the mass of the fragments that arise from neutral loss of
141 Da is an excellent way to distinguish PE lipids in a sample (i.e., PE 34:1 vs. PE 34:2)

119
Unfortunately, this approach does not allow the position of the fatty acyl chains on the
glycerol backbone to be deduced. To determine the positional isomeric content, focus
must be directed towards ions derived from the fatty acyl chains at the sn-1 and sn-2
positions, in the hope that the yields of fragment ions will display some dependence on
the position of attachment. The fragmentation products for one of the examined lipid
standards, PE 34:1 (16:0-18:1) are depicted in Figure 4-4.
Figure 4-4: Observed fragmentation products of collision-induced dissociation of protonated PE 34:1 (16:0-18:1). Figure 4-5 and Figure 4-6 depict the collision energy dependence of abundances
of fragment ions derived from protonated PE 34:1 (16:0-18:1) and PE 34:2 (16:0-18:2),
respectively. Both figures show that the dominant fragment ions, m/z 577 and m/z 575,

120
which correspond to the neutral loss of phosphoethanolamine (141 Da) from the
precursor ions, increase in abundance as collision cell potential is increased to 25 volts.
As the voltage is increased beyond 25 volts, the abundances of m/z 577 and m/z 575
decrease, and acylium ions are observed. Since their appearance is concomitant with the
disappearance of the fragment ions at m/z 577 and m/z 575, it is suggested that they may
form from m/z 577 and m/z 575.
Figure 4-5: Breakdown curves for three fragment ions (♦ m/z 265, ■ m/z 239, ▲ m/z 577) derived from CID of protonated PE 34:1 (16:0-18:1) at 10 different collision cell potentials. At potentials of 5 V and below, only the protonated molecule was observed.
Further comparison of Figure 4-5 and Figure 4-6 indicate that the two PE lipid
standards have almost identical fragmentation behavior. Both fragment to yield acylium
ions derived from the fatty acyl groups substituted at both sn-1 and sn-2 positions, with
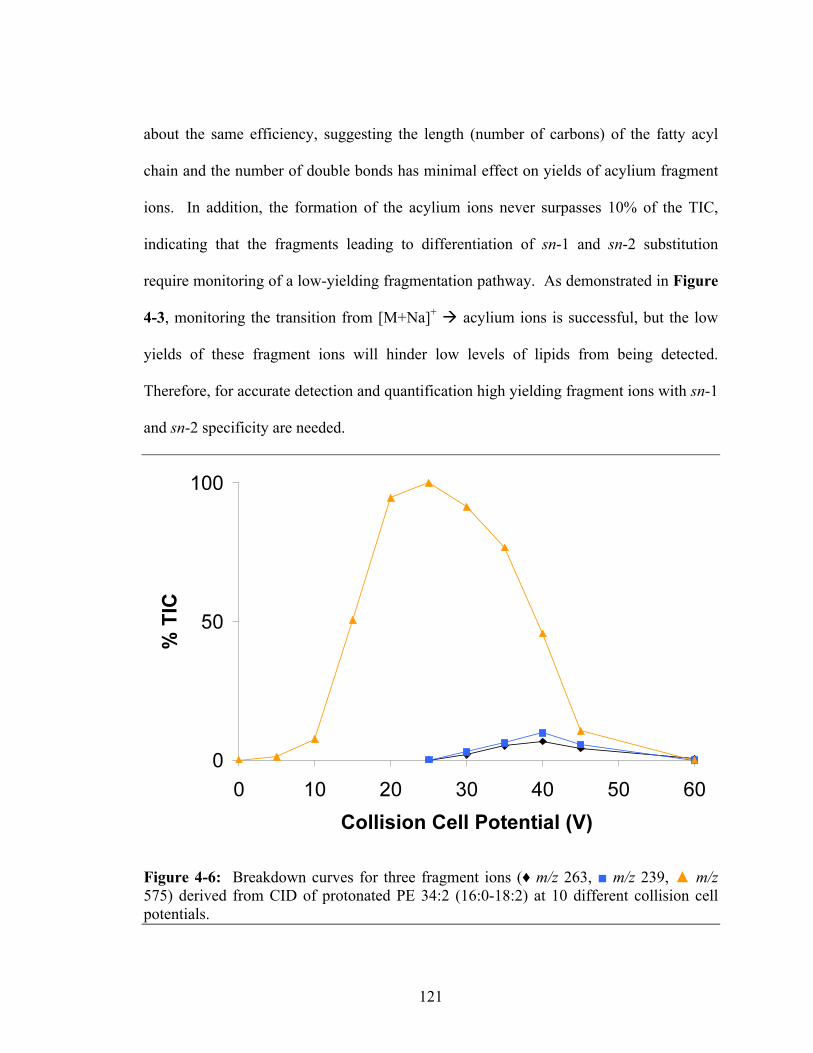
121
about the same efficiency, suggesting the length (number of carbons) of the fatty acyl
chain and the number of double bonds has minimal effect on yields of acylium fragment
ions. In addition, the formation of the acylium ions never surpasses 10% of the TIC,
indicating that the fragments leading to differentiation of sn-1 and sn-2 substitution
require monitoring of a low-yielding fragmentation pathway. As demonstrated in Figure
4-3, monitoring the transition from [M+Na]+ acylium ions is successful, but the low
yields of these fragment ions will hinder low levels of lipids from being detected.
Therefore, for accurate detection and quantification high yielding fragment ions with sn-1
and sn-2 specificity are needed.
Figure 4-6: Breakdown curves for three fragment ions (♦ m/z 263, ■ m/z 239, ▲ m/z 575) derived from CID of protonated PE 34:2 (16:0-18:2) at 10 different collision cell potentials.

122
Depicted in Figure 4-7 is the fragmentation of deprotonated PE 34:1 in negative
ion mode. Fragmentation can be directed by backside nucleophilic substitution, or SN2
reaction of the negatively charged oxygen on the phosphate group with the sn-1 and sn-2
position carbon in the glycerol backbone. The resulting, high-yield fragment ions are the
anions corresponding to deprotonated fatty acids, in this case at m/z 255 (C16:0) and m/z
281 (C18:1) for PE 34:1 and m/z 255 and m/z 279 (C18:2) for PE 34:2. The analysis of
PE lipids in ESI- mode allows for the monitoring of the transition of [M-H]- to the
dominant fragment ions.
Figure 4-7: The fragmentation products for deprotonated PE 34:1 (16:0-18:1) in negative ion mode. Figure 4-8 and Figure 4-9 show the collision energy dependence of fragment ion
abundances generated from CID of deprotonated PE 34:1 (16:0-18:1) and PE 34:2 (16:0-
18:2), respectively. Both figures show that the fragment ions corresponding to the fatty
acid anions are the dominant fragment ions. As the collision potential is increased, the
abundance of the fatty acid anion derived from the sn-2 position increases until it reaches

123
a maximum at a potential of 35 volts. The abundance of the C16:0 fatty acid anion from
PE 34:1 increases sharply from 15 to 30 volts, then gradually increases until it reaches the
maximum at 60 volts. However, for the formation of the fatty acid anion of C16:0 from
PE 34:2, the slope from 30 to 60 volts (Figure 4-9) is steeper. This suggests that the
addition of a second double bond to the sn-2 position fatty acid requires more collision
energy to drive the fragmentation of C16:0. This may be due to the double bonds
interacting with the amine piece of the head group, requiring more vibration energy for
the negatively charged oxygen in the phosphate group to approach and interact with the
glycerol backbone and drive fragmentation.22
Figure 4-8: Breakdown curves for the two fatty acid anion fragments (♦ m/z 281, ■ m/z 255) derived from CID of deprotonated PE 34:1 (16:0-18:1) at 10 different collision cell potentials.

124
Figure 4-9: Breakdown curves for the two fatty acid anion fragments (♦ m/z 279, ■ m/z 255) derived from CID of deprotonated PE 34:2 (16:0-18:2) at 10 different collision cell potentials.
Additionally, examination of the two figures indicates that at a collision cell
potential of 35 volts, the two PE lipids generate the two fragment ions with different
efficiencies. For PE 34:1, Figure 4-8 shows that the fragmentation of the C18:1 is a little
more than twice the abundance of the fragmentation leading to C16:0. But, Figure 4-9
indicates that the abundance of the C18:2 fragment ion is almost three times the
abundance of C16:0, again suggesting that the number of double bonds affects
fragmentation efficiency. Furthermore, comparison of the two sets of breakdown curves
shows that the ratio of the two fragment ions is not a constant value, but changes as a
function of the collision cell potential. This indicates that a ratio to describe the

125
fragmentation of the two fatty acyl chains is only relevant for one specific voltage, and
development of a more complete set of fragmentation ratios is needed.
4.3.3. Effect of Phosphoethanolamine Head Group Modification
Recent experiments23,24 have indicated that different head groups, along with head
group modification have a greater effect on fragmentation than fatty acid chain length.
The central issue is the efficiency of fragmentation, the relative ratios of the sn-1 versus
sn-2 position fragments observed, and mechanisms that could explain observed behavior.
To address these important issues, in-house custom synthesis of a pure PE 34:0 standard,
with palmitic acid exclusively at the sn-1 position and stearic acid exclusively at the sn-2
position was performed. After the second step of the reaction, the PE lipid has been
synthesized but still has a BOC protecting group on the nitrogen atom of its ethanolamine
head group (Figure 4-10). This protecting group is removed in the third synthetic step,
resulting in the desired isomer of PE 34:0 (Figure 4-11). This provided an authentic
standard of a PE lipid with position-specific fatty acid substitution to investigate whether
head group modification provided any difference in fragmentation for PE lipids in ESI-
mode.
Comparison of Figure 4-10 and Figure 4-11 reveals a dramatic difference in PE
lipid fragmentation when the amino group is modified by the BOC protecting group. For
the BOC-PE 34:0 lipid (Figure 4-10), formation of the fragment by substitution at the sn-
2 position (formation of C18:0 anion at m/z 283) yields 7 times more product than the
corresponding displacement at the sn-1 position (m/z 255). For the unmodified PE 34:0
lipid specifically substituted as (sn-1 16:0-sn-2 18:0) (Figure 4-11), the fragmentation is

126
reversed, with the yield of the sn-1 displacement product (m/z 255) being 25 times greater
than the yield of the sn-2 displacement product (m/z 283).
Figure 4-10: Product ion MS/MS spectrum for deprotonated BOC-protected PE 34:0 (sn-1 16:0-sn-2 18:0, at m/z 818). The peak at m/z 283 represents the C18:0 anion and the peak at m/z 255 represents the C16:0 anion. The structure of the lipid [M-H]- anion is inset on the spectrum. Note that the sn-2 fatty acid anion is the dominant product.

127
Figure 4-11: Product ion MS/MS spectrum for deprotonated PE 34:0 (sn-1 16:0-sn-2 18:0, at m/z 718). The peak at m/z 283 represents C18:0 anion and the peak at m/z 255 represents the C16:0 anion. The structure of the lipid [M-H]- anion is inset on the spectrum. Note that the sn-1 fatty acid anion is the dominant product.
Detailed mechanistic interpretation of this result will undoubtedly require more
extensive studies of other PE analogs synthesized with specific fatty acyl substitution
positions. Since standards of these compounds are not available, they are beyond the
scope of the current work. However, the principal finding of these results suggests that
displacements of fatty acids from PE lipids to generate fatty acid anions will be
influenced by many structural factors. Because a comprehensive assessment of
instrument response factors will require a better understanding of the factors that govern
yields of fragment ions, future efforts should be directed toward synthesis of isomer-
specific reference standards for all PE lipid compositions and substitution patterns.

128
4.4. Conclusions
The utility of a flow injection analysis-multiple reaction monitoring protocol, as
demonstrated in this chapter expands well beyond PE lipid analysis. The benefit of a
MRM method is that instead of performing neutral loss scans which spend a tiny fraction
of data acquisition on any single mass transition, the duty cycle of the instrument can be
more completely devoted to detection of anticipated lipids. The FIA-MRM protocol
provides a rapid procedure with minimal sample handling that is capable of quantifying
low level lipids in a biological extract. Using the MRM protocol to probe the exact
makeup of specific PE lipid isomers takes advantage of the position-selective
displacement of fatty acids to yield their deprotonated ions.
To quantify all PE lipids in an isomer-specific manner, more information is
needed about fragmentation behavior of specific PE isomers. Unfortunately, these are
not commercially available.

129
4.5. References
1. Farmer, E. E.; Alméras, E.; Krishnamurthy, V., Jasmonates and Related Oxylipins
in Plant Responses to Pathogenesis and Herbivory. Current Opinion in Plant
Biology 2003, 6, (4), 372-378.
2. Welti, R.; Li, W.; Li, M.; Sang, Y.; Biesiada, H.; Zhou, H.-E.; Rajashekar, C. B.;
Williams, T. D.; Wang, X., Profiling Membrane Lipids in Plant Stress Responses.
Role of Phospholipase D-alpha in Freezing-Induced Lipid Changes in
Arabidopsis. The Journal of Biological Chemistry 2002, 277, (35), 31994-32002.
3. Wang, X., Lipid Signaling. Current Opinion in Plant Biology 2004, 7, (3), 329-
336.
4. Wang, X., Phospholipase D in Hormonal and Stress Signaling. Current Opinion
in Plant Biology 2002, 5, (5), 408-414.
5. McGibbon, L.; Russell, N. J., Fatty Acid Positional Distribution in Phospholipids
of a Psychrophilic Bacterium During Changes in Growth Temperature. Current
Microbiology 1983, 9, (5), 241-244.
6. Xu, C.; Fan, J.; Froehlich, J. E.; Awai, K.; Benning, C., Mutation of the TGD1
Chloroplast Envelope Protein Affects Phosphatidate Metabolism in Arabidopsis.
Plant Cell 2005, 17, (11), 3094-3110.
7. Benning, C.; Xu, C.; Awai, K., Non-Vesicular and Vesicular Lipid Trafficking
Involving Plastids. Current Opinion in Plant Biology 2006, 9, (3), 241-247.
8. Ohlrogge, J. B.; Browse, J.; Somerville, C. R., The Genetics of Plant Lipids.
Biochimica et Biophysica Acta (BBA) - Lipids and Lipid Metabolism 1991, 1082,
(1), 1-26.

130
9. Roughan, P. G.; Slack, C. R., Cellular Organization of Glycerolipid Metabolism.
Annual Review of Plant Physiology 1982, 33, (1), 97-132.
10. Ekman, Å.; Bülow, L.; Stymne, S., Elevated Atmospheric CO2 Concentration and
Diurnal Cycle Induce Changes in Lipid Composition in Arabidopsis thaliana.
New Phytologist 2007, 174, (3), 591-599.
11. Guedes, A. C.; Meireles, L. A.; Amaro, H. M.; Malcata, F. X., Changes in Lipid
Class and Fatty Acid Composition of Cultures of Pavlova lutheri, in Response to
Light Intensity. Journal of the American Oil Chemists Society 2010, 87, (7), 791-
801.
12. Faure, L.; Coulon, D.; Laroche-Traineau, J.; Le Guedard, M.; Schmitter, J.-M.;
Testet, E.; Lessire, R.; Bessoule, J.-J., Discovery and Characterization of an
Arabidopsis thaliana N-Acylphosphatidylethanolamine Synthase. The Journal of
Biological Chemistry 2009, 284, (28), 18734-18741.
13. Shin, E.-C.; Pegg, R. B.; Phillips, R. D.; Eitenmiller, R. R., Commercial Runner
Peanut Cultivars in the USA: Fatty Acid Composition. European Journal of
Lipid Science and Technology 2010, 112, (2), 195-207.
14. Ichihara, K.; Fukubayashi, Y., Preparation of Fatty Acid Methyl Esters for Gas-
Liquid Chromatography. Journal of Lipid Research 2010, 51, (3), 635-640.
15. Yamamoto, K.; Kinoshita, A.; Shibahara, A., Gas Chromatographic Separation of
Fatty Acid Methyl Esters on Weakly Polar Capillary Columns. Journal of
Chromatography A 2008, 1182, (1), 132-135.
131
16. Yang, K.; Zhao, Z.; Gross, R. W.; Han, X., Shotgun Lipidomics Identifies a
Paired Rule for the Presence of Isomeric Ether Phospholipid Molecular Species.
PLoS ONE 2007, 2, (12), e1368.
17. Rödiger, A.; Baudisch, B.; Bernd Klösgen, R., Simultaneous Isolation of Intact
Mitochondria and Chloroplasts from a Single Pulping of Plant Tissue. Journal of
Plant Physiology 2010, 167, (8), 620-624.
18. Allen, C. F. H.; Byers Jr., J. R.; Humphlett, W. J., Oleoyl Chloride. Organic
Syntheses 1957, 37, 66-69.
19. Sun, X.-L.; Liu, H.; Orban, J. M.; Sun, L.; Chaikof, E. L., Synthesis and Terminal
Functionalization of a Polymerizable Phosphatidylethanolamine. Bioconjugate
Chemistry 2001, 12, (5), 673-677.
20. Welti, R.; Wang, X., Lipid Species Profiling: A High-Throughput Approach to
Identify Lipid Compositional Changes and Determine the Function of Genes
Involved in Lipid Metabolism and Signaling. Current Opinion in Plant Biology
2004, 7, (3), 337-344.
21. Devaiah, S. P.; Roth, M. R.; Baughman, E.; Li, M.; Tamura, P.; Jeannotte, R.;
Welti, R.; Wang, X., Quantitative Profiling of Polar Glycerolipid Species from
Organs of Wild-Type Arabidopsis and a Phospholipase D[alpha]1 Knockout
Mutant. Phytochemistry 2006, 67, (17), 1907-1924.
22. Pryadun, R.; Sukumaran, D.; Bogadi, R.; Atwood, J. D., Amine Attack on
Coordinated Alkenes: An Interconversion from Anti-Markovnikoff to
Markovnikoff Products. Journal of the American Chemical Society 2004, 126,
(39), 12414-12420.

132
23. Pulfer, M.; Murphy, R. C., Electrospray Mass Spectrometry of Phospholipids.
Mass Spectrometry Reviews 2003, 22, (5), 332-364.
24. Kim, H.-Y.; Wang, T.-C. L.; Ma, Y.-C., Liquid Chromatography/Mass
Spectrometry of Phospholipids using Electrospray Ionization. Analytical
Chemistry 1994, 66, (22), 3977-3982.

Chapter 5: Concluding Remarks

134
In the modern era of systems biology, new high-throughput technologies that
define an organism’s behavior, or phenotype, are central to efforts to link genetics and
environment to biological traits. Within the last decade, these “omics” technologies have
begun to revolutionize analytical chemistry, replacing the one compound at-a-time
approach with comprehensive measurements of many metabolites that can link gene
expression to metabolic phenotypes in humans, plants, and other organisms. One class of
metabolites, lipids, has been discovered to play important roles in both activation of
nuclear receptors in humans and animal model organisms, and in biochemical defense
mechanisms used by plants. For an individual organism, the lipidome is not static like
the genome, and temporal changes in the physiological state of an organism resulting
from stress, environmental changes, and xenobiotics must be measured over many time
points, and preferably, in multiple tissues or cell types, to fully assess the dynamics of the
physiological state. Such studies, when applied to genetically diverse populations, have
potential to generate thousands of samples that must be analyzed, which is a daunting
task, considering many of the lipids responsible for these changes have yet to be
identified and quantified. To move the state-of-the-art toward such capabilities, the
research presented in this dissertation has developed mass spectrometry concepts and
protocols that enhance the rate at which new lipid species are detected and quantified,
while using relatively low cost time-of-flight and triple quadrupole mass spectrometers.
Technologies for the identification of bioactive lipids have lagged behind other
systems biology methods such as genomics and proteomics, in large part because
metabolite structures cannot be predicted from DNA sequences, and identification of
previously unknown metabolites remains a substantial bottleneck to the discovery
135
process. To this end, Chapter 2 introduced the development of a new MS data filtering
technique called relative mass defect, which when coupled with traditional biological
assay screens offers rapid assistance for annotation of metabolites that share hydrogen
content with compounds within selected classes. For any metabolite screening method,
metabolite profiling may generate mass measurements for hundreds to thousands of
compounds. Though this information alone will usually not be sufficient to provide
unambiguous compound identification, assessment of the hydrogen content from the
relative mass defect can help assign unknown masses to specific compound classes. In
an era where data mining from metabolite databases will become more commonplace,
such assignments help researchers group compounds based on biosynthetic precursors of
known hydrogen content. While this approach has been developed for bioactive lipid
discovery, other efforts in the Jones laboratory are already applying RMD filtering to
mining of plant metabolomic data.
In Chapter 3, the fragmentation of isomeric lipids resulted in a new tandem mass
spectrometry protocol for selective detection of phthalate isomers. Based on the
hypothesis that straight-chain and branched-chain isomeric phthalates would undergo
different fragmentation reactions, a tandem mass spectrometer served as a separation
tool, minimizing the need for chromatographic resolution of isomers. The net result is
faster quantitative procedures capable of distinguishing a bioactive isomer from an
inactive isomer. Since my research indicates that the presence of a branch point on an
alkyl chain affects fragmentation, this research may serve as a foundation for
development of isomer discrimination methods employing mass spectrometry. Having a
rapid and quantitative method is important for screening a large number of samples,

136
reducing cost and analysis time, while using a relatively inexpensive triple quadrupole
mass spectrometer.
In Chapter 4, lipid fragmentation is discussed for a different class of lipids,
phosphatidyethanolamines. Here, a protocol is presented that extends the performance of
a triple quadrupole mass spectrometer to quantification of lipids using short analysis
times. The information obtained by traditional GC FID analysis of FAMEs from
phospholipids is limited to the relative amounts of each fatty acid present. The developed
method discussed in Chapter 4 can quantify the amounts of isomeric phospholipids
present (16:1-18:3, 16:2-18:2, 16:3-18:1). Other results in Chapter 4 suggest that
fragmentation of phospholipids can be altered by head group modification or by a change
in the number of units of unsaturation in the fatty acyl chains.
In a fast-paced world where time and cost are important, acceleration of the
analytical workflow is necessary to solve important biological problems. The use of
inexpensive time-of-flight and triple quadrupole mass spectrometers to address these
challenges will help advance the field of lipidomics, leading to the development of rapid
and cost effective screens for lipids from human and plant specimens.
137
APPENDIX 1: List of Acronyms
BOC – tert-butyl carbamate
cDNA – circular DNA
CAR – constitutive androstane receptor
CAR2 – constitutive androstane receptor 2
CE – capillary electrophoresis
CID – collision-induced dissociation
CMV – cytomegalovirus
DEHP – di(2-ethylhexyl) phthalate
DNA – deoxyribonucleic acid
DNOP – di-n-octyl phthalate
DIOP – di-isooctyl phthalate
DAG – diacylglycerol
EI – electron ionization
ER – endoplasmic reticulum
ESI – electrospray ionization
FAME – fatty acid methyl ester
FBS – fetal bovine serum
FIA – flow injection analysis
FID – flame ionization detector
GC – gas chromatography
HPLC – high performance liquid chromatography
LC – liquid chromatography

138
mRNA – messenger ribonucleic acid
MEKC – micellar electrokinetic chromatography
MRM – multiple reaction monitoring
MS – mass spectrometry
MS/MS – tandem mass spectrometry
NMR – nuclear magnetic resonance
NR – nuclear receptor
PA – phosphatidic acid
PC – phosphatidylcholine
PE – phosphatidylethanolamine
QQQ – triple quadrupole
Rf – retention factor
RMD – relative mass defect
RP – reversed-phase
SPE – solid-phase extraction
SRM – single reaction monitoring
TIC – total ion current
TLC – thin layer chromatography
TOF – time-of-flight
UHPLC – ultra high performance liquid chromatography
UV – ultraviolet
XIC – extracted ion chromatogram

VITA
Michael C. Stagliano
Michael C. Stagliano was born in Silver Spring, Maryland on October 12, 1981
to Deanna L. Stagliano and Dr. A. J. Stagliano. At age 4 he moved to Broomall,
Pennsylvania, where his parents still reside. It was there, while attending Marple-
Newtown Senior High School that Michael developed his passion for chemistry. After
graduation in June 1999, Michael attended the University of Michigan in Ann Arbor.
There he had the opportunity to interact with many faculty, including his undergraduate
research advisor, Dr. Vincent L. Pecoraro. After graduating in April 2003 with a
Bachelor of Science in Chemistry degree, majoring in both chemistry and biochemisty,
Michael began pursuing his Ph.D. in analytical chemistry at the Pennsylvania State
University. During his time at Penn State, Michael served as a TA and Super-TA under
the direction of Dr. Joseph T. Keiser, and in May 2004 joined the research group of Dr.
A. Daniel Jones. In August 2005, as the sole member of the Jones’ group, Michael and
Dan relocated to Michigan State University.
When not in the lab, Michael enjoys going to Michigan football games, both at
the Big House in Ann Arbor, as well as the occasional road venue. He also enjoys
traveling and cooking. Michael is also an avid hockey fan, cheering for the Flyers, and
tries to visit Yost Ice Arena at least once each season for a Michigan hockey game.