protein & ptm profiling and identification core center eab... · protein & ptm profiling...
TRANSCRIPT
Protein & PTM Profiling and Identification Core
Yale/NIDA Neuroproteomics Center EAB Meeting
TuKiet T. Lam, PhD
May 1st, 2019
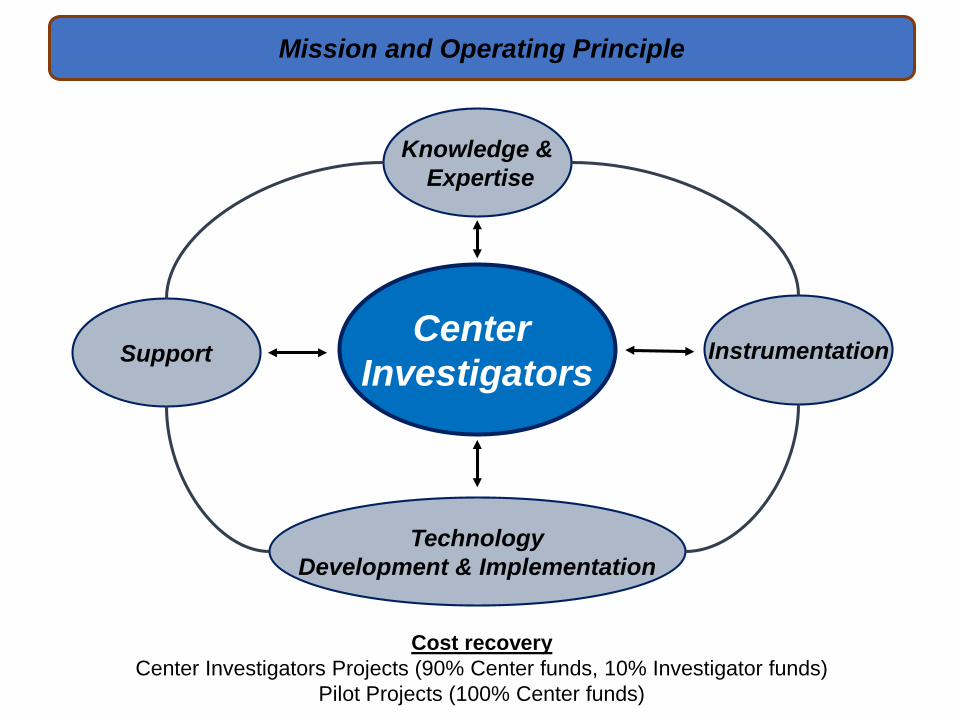
Mission and Operating Principle
Center Investigators
Instrumentation
Knowledge &Expertise
TechnologyDevelopment & Implementation
Support
Cost recoveryCenter Investigators Projects (90% Center funds, 10% Investigator funds)
Pilot Projects (100% Center funds)
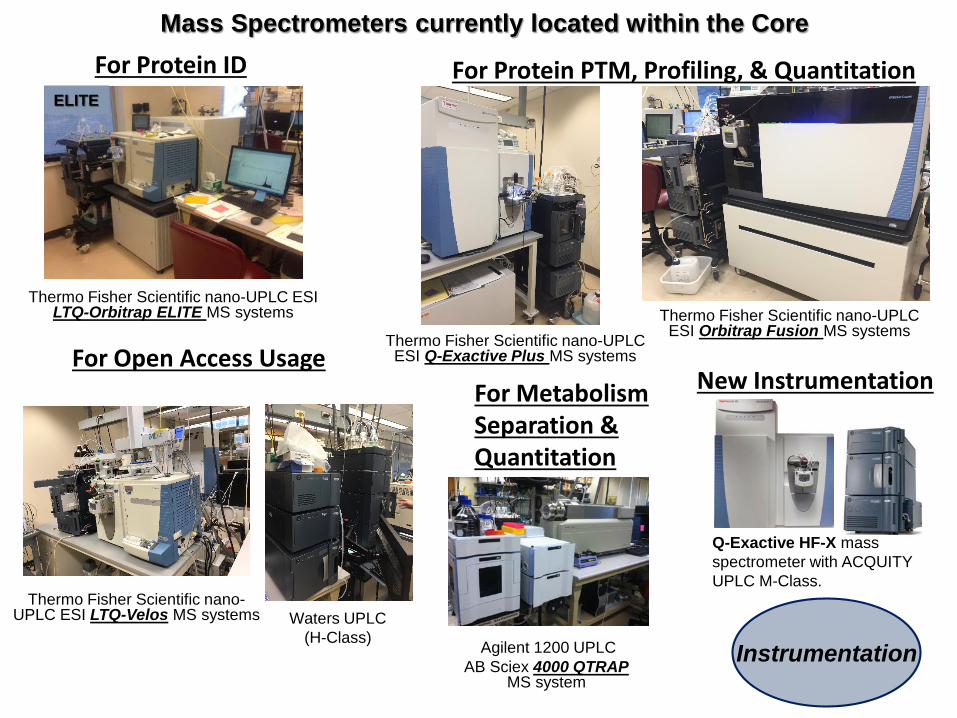
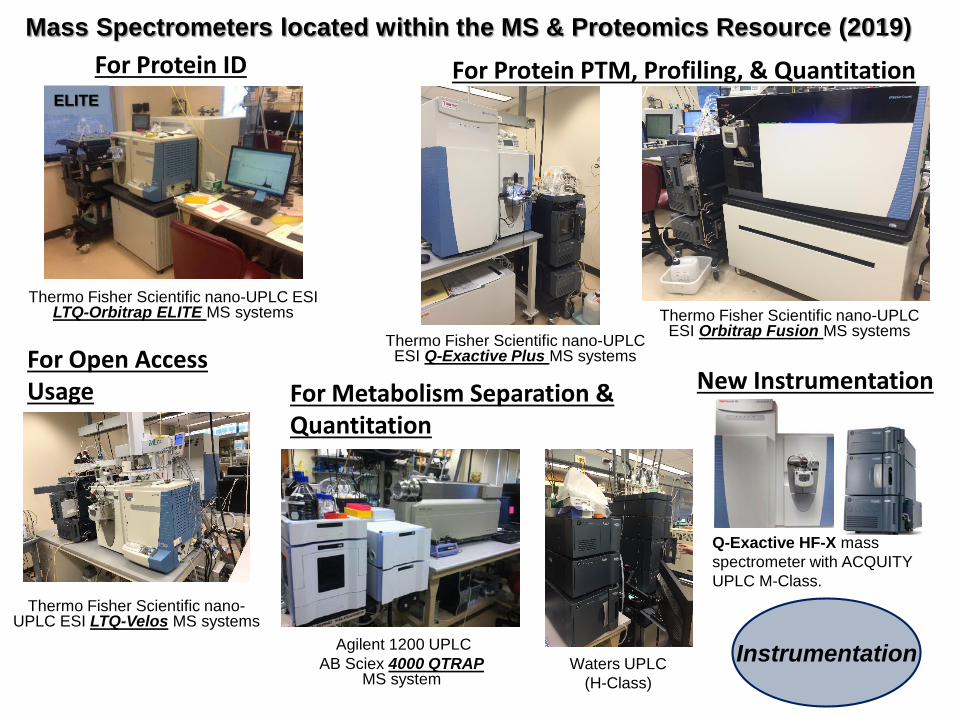
Thermo Fisher Scientific nano-UPLC ESI LTQ-Orbitrap ELITE MS systems
Agilent 1200 UPLCAB Sciex 4000 QTRAP
MS system
Mass Spectrometers currently located within the Core
ELITE
Thermo Fisher Scientific nano-UPLC ESI Q-Exactive Plus MS systems
Thermo Fisher Scientific nano-UPLC ESI Orbitrap Fusion MS systems
Thermo Fisher Scientific nano-UPLC ESI LTQ-Velos MS systems
For Protein ID For Protein PTM, Profiling, & Quantitation
For Metabolism Separation & Quantitation
For Open Access Usage
Waters UPLC (H-Class)
Q-Exactive HF-X mass spectrometer with ACQUITY UPLC M-Class.
New Instrumentation
Instrumentation

ResolutionMass Accuracy
Fragmentation Capabilities
Mass Spectrometer Capabilities
H2N C C NOR1
C C NORn-1
C CORn
OH
m+nHn+
y1
bn-1
z1·
cn-1
...
ETD
CID/HCDRetention of labile modificationsNo X-P cleavage
Facile loss of H3PO4X-P cleavage preferred
m/z 434432430428
429.22623
Deuterated (D)
Protonated (P)
430.22990431.23346
429.22657
430.22835
430.23262
431.23617 432.23963P
DD
D
P
P
P
P
220 260 300 340 380 m/z
263 264 265 266 267m/z
265.04689 (Exp.)
Zoom
265.04713 (Cal.)
0.00024 (Diff.)- 0.9 ppm (Error)
Quantitation
40 80 120 160 200 240 280 320 360 400m/z, Da
62.2
326.8
309.7
265.3
1.2 1.6 2.0 2.4 2.8 3.2 3.6 4.0Time, min
2.03 min

Insturment QE-Focus QE QE-Plus QE-HF QE-HFXQE-
UHMR O-FusionO-Fusion
Lumos O-ID-XMax resolution (FWHM)
@m/z 20070k 140k 140k
(Opt. 280k)240k 240
200k at m/z 400
500k 1,000k 7.5-500k
Mass accuracy, (internal)Mass accuracy (external)
Mass range50 to 3,000 m/z
350 to 80,000
m/z50-2,000 m/z
Dynamic Range - - -
Scan ratesUp to 18
HzUp to 40
HzUp to 12
Hz20Hz 40Hz
30Hz Orbitrap 40Hz ion trap
Polarity switch <1.1sec <1.1sec 1.1 SecPRM -
Multiplex (precursor/ scan) - 10 20 10Decision-tree (CID/HCD/
ETD)ETD option Yes
Yes
<1 ppm<3 ppm
Yes<1 sec
10
50 to 6,000 m/z 50 to 8,000 m/z
>5000:1
Up to 12 Hz
Comparison of Thermo MS (QE and Orbitrap)
From Thermo Fisher Scientific Brochure
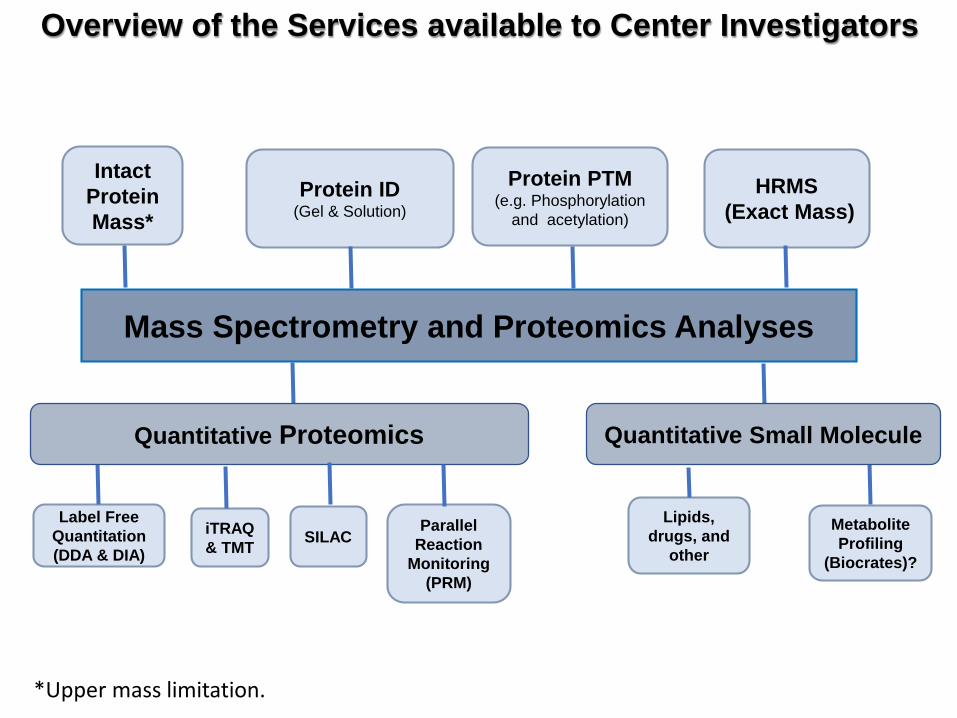
Mass Spectrometry and Proteomics Analyses
Protein ID(Gel & Solution)
Protein PTM(e.g. Phosphorylation
and acetylation)
Intact Protein Mass*
HRMS(Exact Mass)
Label Free Quantitation (DDA & DIA)
iTRAQ& TMT SILAC
Parallel Reaction
Monitoring (PRM)
Metabolite Profiling
(Biocrates)?
Quantitative Proteomics Quantitative Small Molecule
Lipids, drugs, and
other
*Upper mass limitation.
Overview of the Services available to Center Investigators

Identification of Protein and Protein Posttranslational Modifications
Cell Lysate Tissue Biological Fluid
Protein Extraction
Enzymatic Digestion
Cellular Fractionation
Protein Fractionation
Peptide Fractionation
Protein enrichment
Peptide enrichment
1st Dimension Chromatography
2nd Dimension Chromatography
Mass Spectrometry
Data analyses
Subcellular Fractionation
Results Interpretation
Sample Preparation
Data Acquisition
Data Processing
Resource
Users
Optional
400 600 800 1000 1200 1400 1600 1800 2000m/z
b(12)
b(15)b(13)
b(10)
b(14)++
b(19)++
y(13)
y(12)
y(10)y0(17)++
y0(11)++y(10)++
b0(17)++
MATKAVCVLKGDGPVQGIINFE
MS/MS
0 5 10 15 20 25 30 35 40 45 50 55 60 65Time (min)
20.42 24.3335.14
27.96
39.02TIC
YHGHS293MSDPGVS300YR
300 500 700 900 1100 1300 1500 1700m/z
~ 2X
~ 2X
~ 2X
~ 2X
b(3)
b(8)
y(9)
y(6)
y(12)
y(4)
y(6)-98
y(10)-196
y(8)-98
b(2)
y(3)-98
y(2)b(8)-98
b(4)
b(5)-98
b(13)-196
b(11)-98
b(11)y(12)-196
y(11)-196
600 800 1000 1200m/z
782.4141z=3
1173.1164z=2899.9755
z=2
1164.1116z=2
776.4110z=3
1101.5878z=2734.7281
z=3561.6306
z=3*
Start
End
SOP

Quantitative Proteomics Workflow
Enzymatic Digest
Quantitation carried out by additional software:• Progenesis QI Software• Proteome Discoverer• Scaffold Software• Skyline• MASCOT Quantitation
Tool Box
on-line LC MS and LC MS/MS separationand data acquisition
PTM Peptide
enrichment +Flow
through (FT) fraction
Enriched (EN) fraction
Acquired raw Spectral data are processed and detectedfeatures are searched against selected Protein Database using MASCOT/Sequest Search Engine
ReportingTabulated protein list with calculated abundances and expression changes
Biological Source
proteins extraction
SOP
RobustnessStandardized Thoroughness

Intact Protein Analysis Workflow: Determination of Intact Protein MW
Desalting
Desalting image from: http://www.glysci.com/products/Protein%7B47%7DPeptide-Desalting-TopTip.html
Direct Injection ESI MS for data acquisition
MS spectral data are processed and analyzed using Deconvolution Software to obtain accurate high resolution protein mass
Deconvolution of MS to obtain Protein MW
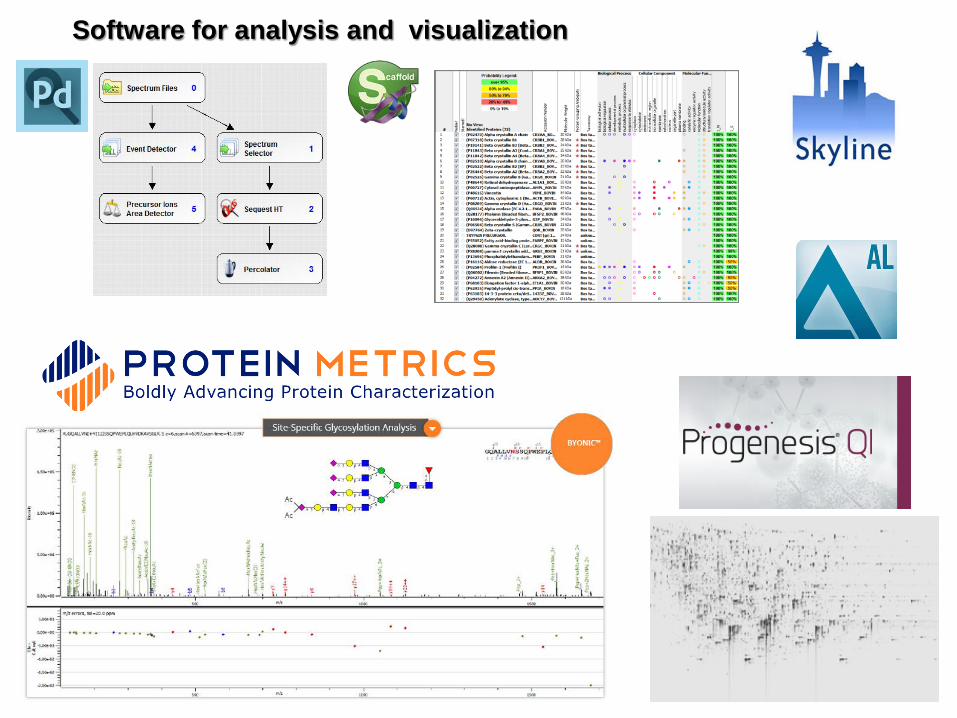
Software for analysis and visualization
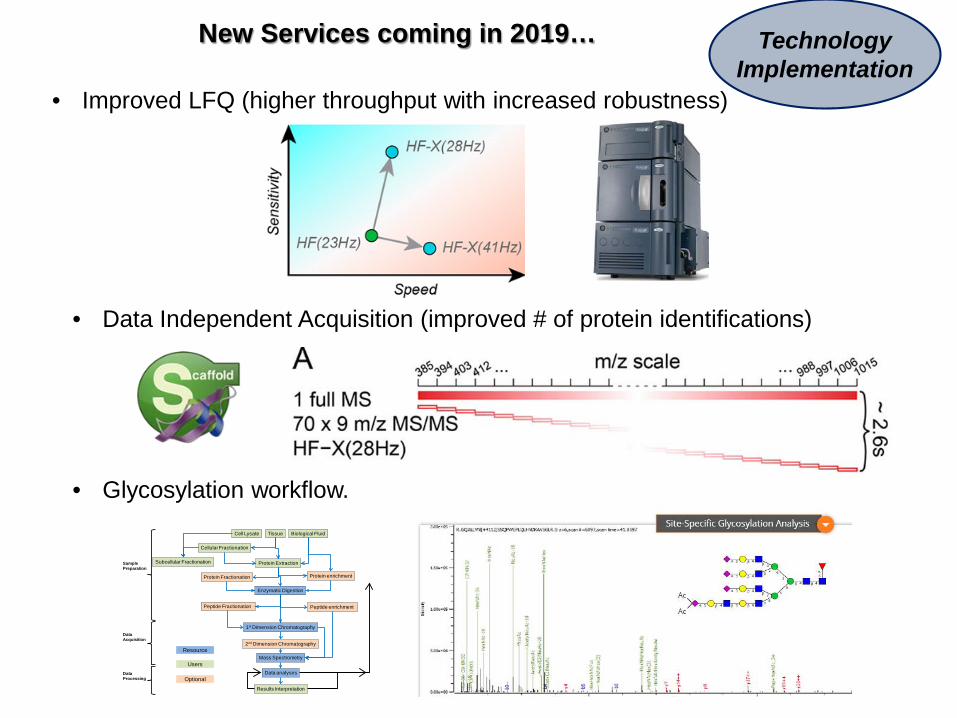
New Services coming in 2019…
• Glycosylation workflow.
• Improved LFQ (higher throughput with increased robustness)
• Data Independent Acquisition (improved # of protein identifications)
Cell Lysate Tissue Biological Fluid
Protein Extraction
Enzymatic Digestion
Cellular Fractionation
Protein Fractionation
Peptide Fractionation
Protein enrichment
Peptide enrichment
1st Dimension Chromatography
2nd Dimension Chromatography
Mass Spectrometry
Data analyses
Subcellular Fractionation
Results Interpretation
Sample Preparation
Data Acquisition
Data Processing
Resource
Users
Optional
TechnologyImplementation
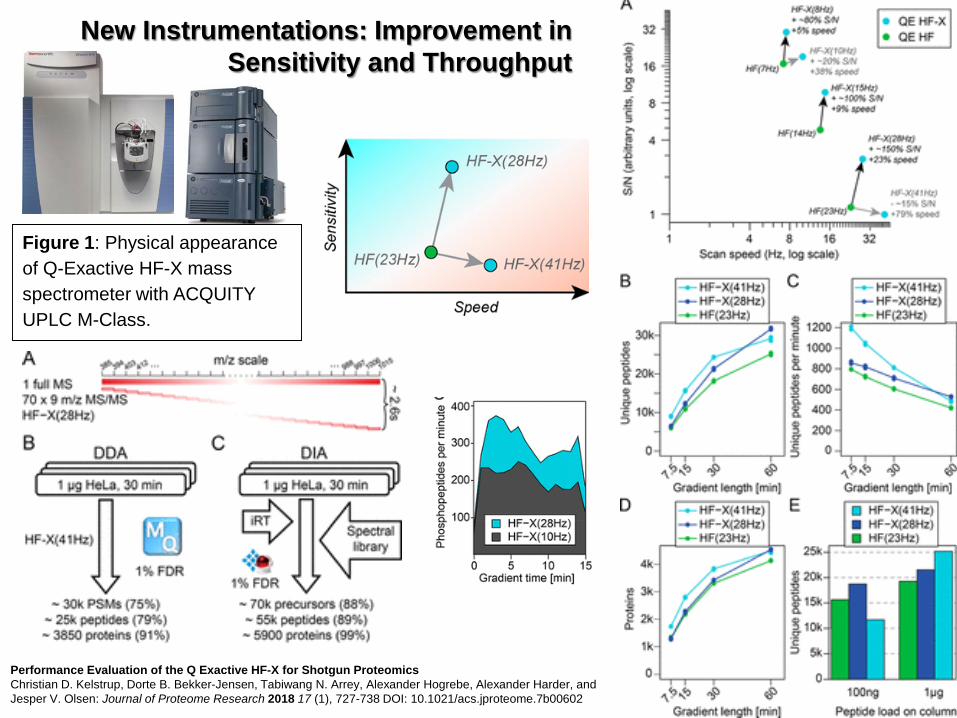
Figure 1: Physical appearance of Q-Exactive HF-X mass spectrometer with ACQUITY UPLC M-Class.
New Instrumentations: Improvement in Sensitivity and Throughput
Performance Evaluation of the Q Exactive HF-X for Shotgun ProteomicsChristian D. Kelstrup, Dorte B. Bekker-Jensen, Tabiwang N. Arrey, Alexander Hogrebe, Alexander Harder, and Jesper V. Olsen: Journal of Proteome Research 2018 17 (1), 727-738 DOI: 10.1021/acs.jproteome.7b00602
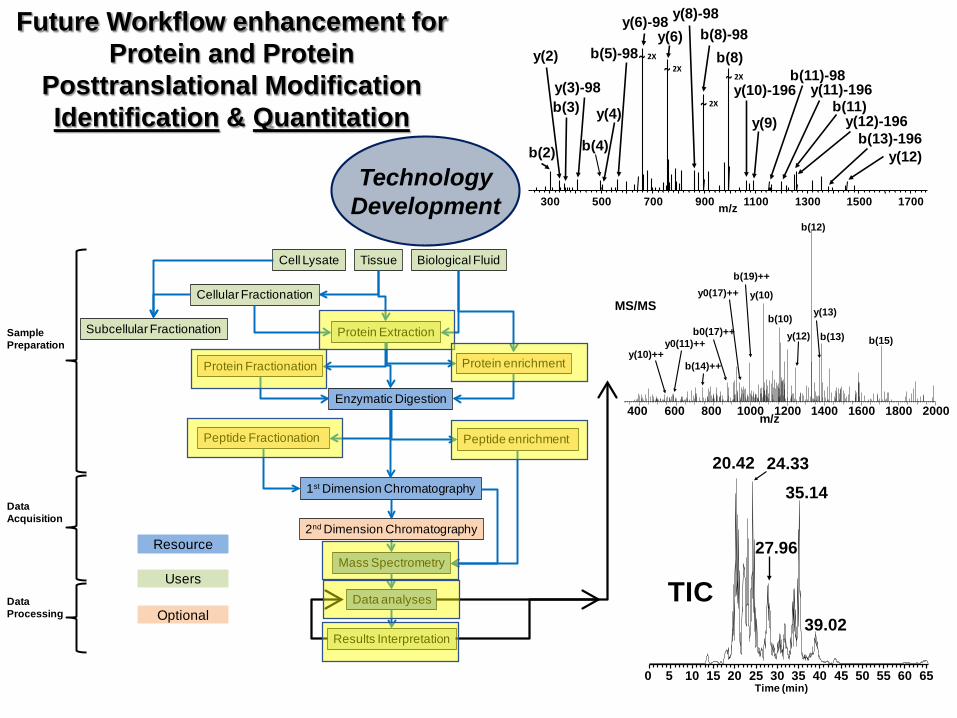
Future Workflow enhancement for Protein and Protein
Posttranslational Modification Identification & Quantitation
Cell Lysate Tissue Biological Fluid
Protein Extraction
Enzymatic Digestion
Cellular Fractionation
Protein Fractionation
Peptide Fractionation
Protein enrichment
Peptide enrichment
1st Dimension Chromatography
2nd Dimension Chromatography
Mass Spectrometry
Data analyses
Subcellular Fractionation
Results Interpretation
Sample Preparation
Data Acquisition
Data Processing
Resource
Users
Optional
0 5 10 15 20 25 30 35 40 45 50 55 60 65Time (min)
20.42 24.3335.14
27.96
39.02TIC
TechnologyDevelopment
YHGHS293MSDPGVS300YR
300 500 700 900 1100 1300 1500 1700m/z
~ 2X
~ 2X
~ 2X
~ 2X
b(3)
b(8)
y(9)
y(6)
y(12)
y(4)
y(6)-98
y(10)-196
y(8)-98
b(2)
y(3)-98
y(2)b(8)-98
b(4)
b(5)-98
b(13)-196
b(11)-98
b(11)y(12)-196
y(11)-196
400 600 800 1000 1200 1400 1600 1800 2000m/z
b(12)
b(15)b(13)
b(10)
b(14)++
b(19)++
y(13)
y(12)
y(10)y0(17)++
y0(11)++y(10)++
b0(17)++
MATKAVCVLKGDGPVQGIINFE
MS/MS

Progress…

Beckman-Coulter PF2D
Chromatofocusing & NPS-RPLC
2D Protein Separation System
Bruker APEX Qe 9.4TeslaFT-ICR MS System
Accurate mass, Top Down, PTM
AB 4700 MALDI TOF/TOF MS System
DIGE, 1D SDS PAGE, LC-MALDI
AB QSTAR XL ESI QTOF
SystemICAT, MudPIT
Micromass QTOF API MS System
Phosphoprotein Profiling
Micromass MALDI TOF MS
Serum Biomarkers, QC
Micromass QTOF Micro MS System
Lipid ProfilingIntact Protein MWMicromass QTOF API
MS SystemPhosphoprotein
Profiling
Micromass MALDI TOF MS
Serum Biomarkers, QC
MS and Protein Profiling Core: Instrumentations (2006)
Thermo Fisher Scientific nano-UPLC ESI LTQ-Orbitrap ELITE MS systems
Agilent 1200 UPLCAB Sciex 4000 QTRAP
MS system
Mass Spectrometers located within the MS & Proteomics Resource (2019)
ELITE
Thermo Fisher Scientific nano-UPLC ESI Q-Exactive Plus MS systems
Thermo Fisher Scientific nano-UPLC ESI Orbitrap Fusion MS systems
Thermo Fisher Scientific nano-UPLC ESI LTQ-Velos MS systems
For Protein ID For Protein PTM, Profiling, & Quantitation
For Metabolism Separation & Quantitation
For Open Access Usage
Waters UPLC (H-Class)
Q-Exactive HF-X mass spectrometer with ACQUITY UPLC M-Class.
New Instrumentation
Instrumentation

2nd Dimension: Non-Porous-Silica Reversed Phase Chromatography Each pH fraction is run for 20-24 min. with 1 minute fraction collection (UV 214nm);
ProteomeLab PF2D (Beckman-Coulter): 2D Chromatofocusing & non-porous RP-HPLC
Samples are run serially
1st Dimension:Chromatofocusing (pH 8.5 to 4.0) (UV 280nm)
Fractions collected every 0.3 pH unit change
Comparative“gel” and UV
view of samples1 and 2
PI: Geoffrey Chupp, Yale University, Int. Med.
0.2 – 1 mg needed per sample condition

Comparative pI – LC (UV) Protein Profiling before/after Drug Treatment
- Partial pI/UV map - The RP-HPLC profiles illustrate differences in the pI 6.0-6.2 fraction - Both the UV and color coded band depictions of these RP-HPLC profiles
(from Beckman-Coulter)

YPED
#spots picked/analyzed 85#spots with proteins id'd 69#proteins id'd with 1 peptide 0#spots with C5/C3 >= 2 fold difference (all spots)
22
#spots with C5/C3 >= 2 fold difference (proteins Id'd)
18
DIGE Results for Sample: DIGE_GEL409 (12092005)Database – NCBInrSearch Engine - MASCOT
Red – Down regulatedBlue – Up regulatedDark Red/Blue – Protein Id’dLight Red/Blue – Protein not Id’d
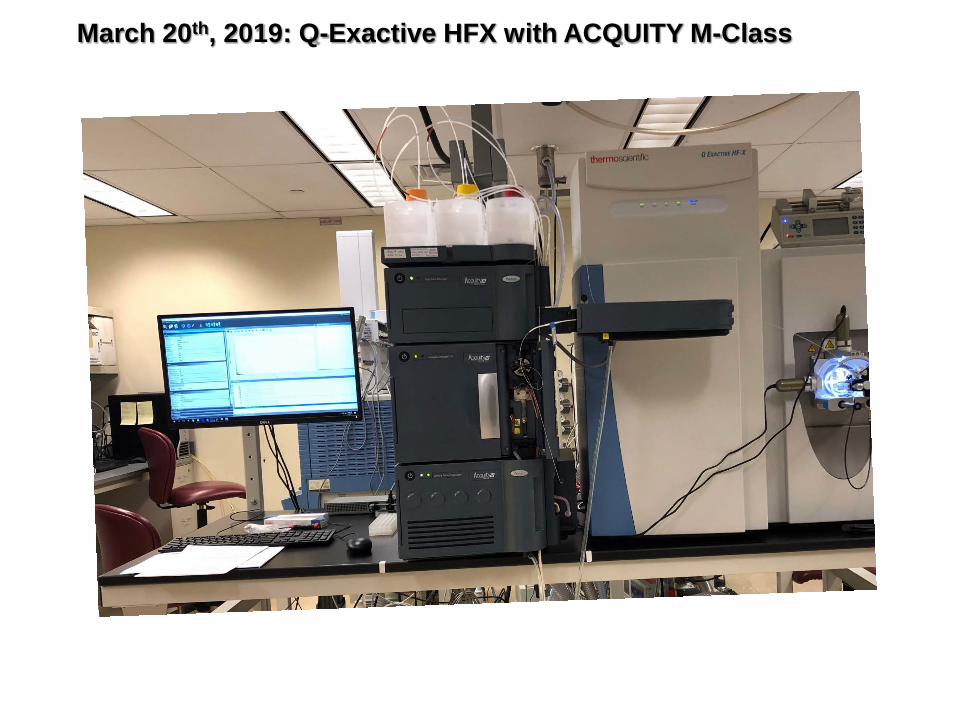
March 20th, 2019: Q-Exactive HFX with ACQUITY M-Class

Provide support letter for grant applications
Help with grant write-up materials (budgeting, methodology, aims)
Training and education (from Sample preparation to software use)
In person initial consultation
Free access to licensed Proteomics Software Within the MS & Proteomics Resource At Cushing/Whitney Medical Library (contact Rolando Garcia-
Milian) Write our own grants as a PI (NIH SIG, Pilot, NIH R21)
Developing Technology catering to Users experimental needs
Supporting Users
22
Acknowledgement
MS & Proteomics Group
Rashaun Wilson, PhDJean KanyoWendy Wang
All collaborators and clients
Funding
Instrumentations:NIH SIG S10OD023651-01A1: QE-HFX (PI: Lam)NIH SIG 1S10OD019967-01: UPLC (PI: Lam)NIH SIG 1S10OD018034-01 + YSM: Orbitrap Fusion & Q-Exactive PlusNIH CTSA,UL1 RR024139: 4000 QTRAPNIH SIG, RR031795: LTQ Orbitrap ELITEDonation: LTQ Velos
Collaborations and other support:R01 NS109358-01 (2018; PI:Kahle, Collaborator: Lam)R01 AG057912-02 (2018; PI:Levine, Collaborator: Lam)R01 MH115939-01 (2018; PI:Koleske, Collaborator: Lam)R01 GM102262-01 (2017; PI:Turk, Collaborator: Lam)P30DA018343 (2016; PI’s:Narin & Williams; Discovery Core Director: Lam)
Contact: (Tu) [email protected], Yale/Keck MS & Proteomics ResourceDirector, Discovery Proteomics Core of Yale/NIDA Neuroproteomics ResourceDepartment of Molecular Biophysics & BiochemistryYale University300 George Street, Room G008New Haven, CT 06511Phone (203) 785-5086Fax (203) 737-2638http://keck.med.yale.edu/See my publications in PubMed
Investigators
Support
23
WM Keck Biotechnology Resource LaboratoryMS & Proteomics Resource300 George StreetRoom G001New Haven, CT 06510Phone: (203) 737-2205Email: [email protected]: https://medicine.yale.edu/keck/proteomics/
Resource Team Members: TuKiet.LamRashaun.WilsonJean.KanyoWendy.Wang
Contact:
@yale.edu