strategic school profile
DESCRIPTION
Strategic School Profile. Ellington Schools 2009-2010. Cumulative Enrollment Increase. YearEnrollment Increase Cumulative 00-01 22665858 01-02 22831775 02-03 235168 143 03-04 239039 182 04-05 243444 226 - PowerPoint PPT PresentationTRANSCRIPT

Strategic School Strategic School ProfileProfile
Ellington SchoolsEllington Schools
2009-20102009-2010

Cumulative EnrollmentCumulative EnrollmentIncreaseIncrease
► YearYear EnrollmentEnrollment Increase Increase Cumulative Cumulative► 00-0100-01 2266 2266 5858 5858► 01-0201-02 2283 2283 1717 7575► 02-0302-03 2351 2351 6868 143 143► 03-0403-04 2390 2390 3939 182 182► 04-0504-05 2434 2434 4444 226 226► 05-0605-06 2494 2494 6060 286 286► 06-0706-07 2537 2537 4343 329 329► 07-0807-08 2597 2597 6060 389 389► 08-0908-09 2634 2634 3636 425 425► 09-1009-10 2667 2667 3333 458 458

District NeedDistrict Need
►Free/Reduced Price MealsFree/Reduced Price Meals►K-12 Students Not Fluent in EnglishK-12 Students Not Fluent in English►PK-12 Students Receiving Special PK-12 Students Receiving Special
EducationEducation►Kindergarten Students Who Attended Kindergarten Students Who Attended
Preschool, Nursery School, HeadstartPreschool, Nursery School, Headstart► Jrs/Srs working 16/More Hours/WeekJrs/Srs working 16/More Hours/Week

Free/Reduced Price MealsFree/Reduced Price Meals
06-0706-07 07-0807-08 08-09 08-09 09-1009-10
District District 4.4%4.4% 4.7% 6%4.7% 6% 7.6%7.6%
CenterCenter 5.7%5.7% 5.4% 8.2% 8.2%5.4% 8.2% 8.2%
Crystal LakeCrystal Lake 8.2%8.2% 5.8% 5.9%5.8% 5.9% 7.2%7.2%
WindermereWindermere 4.7%4.7% 4.2% 6.3% 8.3%4.2% 6.3% 8.3%
IntermediateIntermediate 5.5% 7.1% 8.5%5.5% 7.1% 8.5%
EMSEMS 4.9%4.9% 4.9% 4.9% 8.6%4.9% 4.9% 8.6%
EHSEHS 2.2%2.2% 3.8% 4.5% 6.0%3.8% 4.5% 6.0%

K-12 Students Not Fluent in K-12 Students Not Fluent in EnglishEnglish
06-0706-07 07-08 08-09 07-08 08-09 09-1009-10DistrictDistrict 2.0 .9% .8%2.0 .9% .8% 1.2%1.2%
CenterCenter 1.1% .3% .5% .6% 1.1% .3% .5% .6%Crystal LakeCrystal Lake .0% .0% 0.0% .5% 0.0% .5% 0.9%0.9%WindermereWindermere 4.3% 4.2% 2.9% 2.9% 4.3% 4.2% 2.9% 2.9%IntermediateIntermediate .0% .2% 1.6% .0% .2% 1.6%EMSEMS 2.0% .2% .3% .5% 2.0% .2% .3% .5%EHSEHS .4% .4% .5% .4% .9% .5% .4% .9%

PK-12 Students Receiving PK-12 Students Receiving Special EducationSpecial Education
06-0706-07 07-08 07-08 08-09 08-09 09-10 09-10DistrictDistrict 8.8% 9.8% 10.4%8.8% 9.8% 10.4%
9.4%9.4%
CenterCenter 12.5%12.5% 12.3% 12.3% 13.3% 10.7% 13.3% 10.7%Crystal LakeCrystal Lake 8 .8%8 .8% 8.7% 8.6% 8.6%8.7% 8.6% 8.6%WindermereWindermere 8.0%8.0% 5.4% 5.6% 5.8%5.4% 5.6% 5.8%IntermediateIntermediate 13.2% 13.2% 13.5% 9.7% 13.5% 9.7%EMSEMS 9.0%9.0% 9.6% 10.8% 12.1% 9.6% 10.8% 12.1%EHSEHS 9.5%9.5% 9.7% 10.0% 9.5% 9.7% 10.0% 9.5%
StateState 11.2%11.2% 11.5% 11.4% 11.4% 11.5% 11.4% 11.4%DRGDRG 10.3%10.3% 10.7% 11.0% 10.8% 10.7% 11.0% 10.8%

Kindergarten Students Who Kindergarten Students Who Attended PreschoolAttended Preschool
06-0706-07 07-08 07-08 08-0908-09 09-1009-10
DistrictDistrict 66.1% 68.9% 73.0% 66.1% 68.9% 73.0% 79%79%
CenterCenter 40.7% 40.7% 41.5% 41.5% 68.3% 65.6%68.3% 65.6%
Crystal Lake 91.7%Crystal Lake 91.7% 86.7% 86.7% 80.9%80.9% 85.7%85.7%
Windermere 71.3%Windermere 71.3% 82.9% 82.9% 73.3% 84.3%73.3% 84.3%
DRGDRG 86.2% 86.2% 87.9% 86.0% 87.9% 86.0% 85.9%85.9%
StateState 79.3% 79.3% 79.2% 79.7% 79.2% 79.7% 80.5%80.5%

Jrs/Srs Working 16/More Jrs/Srs Working 16/More Hours/WeekHours/Week
06-0706-07 07-08 07-08 08-0908-0909-1009-10
EHS 27.7%EHS 27.7% 31.0% 31.0% 23%23% 16.1% 16.1%
DRG 21.2%DRG 21.2% 21.6% 21.6% 16.9%16.9% 12.7%12.7%
State 20.2%State 20.2% 20.2% 20.2% 19%19% 13.6%13.6%

Minority PopulationMinority Population
01-0201-02 06-07 07-08 08- 06-07 07-08 08-09 09-1009 09-10
Students 4.4%Students 4.4% 7.2% 7.9% 9.4% 7.2% 7.9% 9.4% 11.1%11.1%
StaffStaff 1.0% 1.0% 2.3% 2.7% 2.3% 2.7% 2.7% 2.7%2.7% 2.7%

Average Class SizeAverage Class Size
06-07 07-08 08-09 09-10 DRG State06-07 07-08 08-09 09-10 DRG State
Grade KGrade K 19.7 20.0 21.0 20.5 17.2 18.519.7 20.0 21.0 20.5 17.2 18.5
Grade 2Grade 2 21.221.2 21.2 22.7 21.3 18.5 19.7 21.2 22.7 21.3 18.5 19.7
Grade 5Grade 5 24.024.0 26.1 24.4 24.8 20.7 21.0 26.1 24.4 24.8 20.7 21.0
Grade 7Grade 7 19.819.8 19.4 18.2 20.5 19.9 20.8 19.4 18.2 20.5 19.9 20.8
HighHigh 18.318.3 18.5 17.2 17.5 19.0 19.6 18.5 17.2 17.5 19.0 19.6

Graduation RateGraduation Rate► Class of 2006Class of 2006 97.6%97.6%► Class of 2007Class of 2007 98.0%98.0%► Class of 2008Class of 2008 92.9%92.9%► Class of 2009Class of 2009 98.9%98.9%Cumulative Four-Year Dropout RateCumulative Four-Year Dropout Rate► Class of 2006Class of 2006 2.2%2.2%► Class of 2007Class of 2007 1.9%1.9%► Class of 2008Class of 2008 6.6%6.6%► Class of 2009Class of 2009 No Longer ReportedNo Longer ReportedAnnual Dropout RateAnnual Dropout Rate► Class of 2001Class of 2001 2.4%2.4%► Class of 2006Class of 2006 .4% .4%► Class of 2007Class of 2007 .5% .5%► Class of 2008Class of 2008 1.2%1.2%► Class of 2009Class of 2009 0.4%0.4%
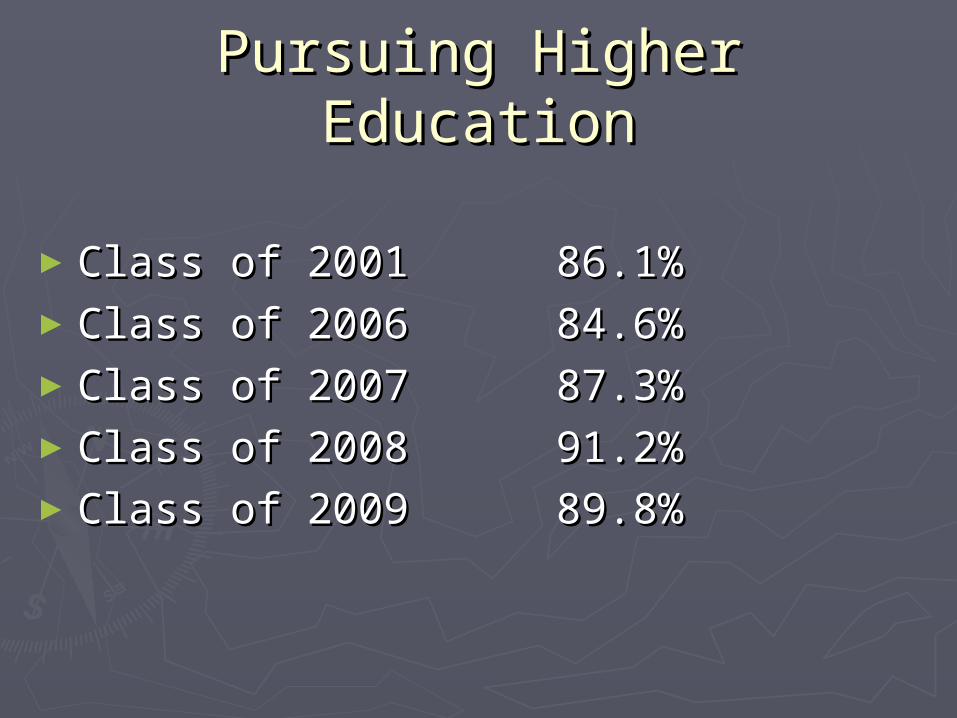
Pursuing Higher EducationPursuing Higher Education
►Class of 2001Class of 2001 86.1%86.1%►Class of 2006Class of 2006 84.6%84.6%►Class of 2007Class of 2007 87.3%87.3%►Class of 2008Class of 2008 91.2%91.2%►Class of 2009Class of 2009 89.8%89.8%

Student PerformanceStudent Performance
► SAT Results Reported 9/22/10SAT Results Reported 9/22/10► CMT Results Reported 8/25/10CMT Results Reported 8/25/10► CAPT Results Reported 8/25/10CAPT Results Reported 8/25/10
Physical FitnessPhysical Fitness EllingtonEllington StateState06-0706-07 44.6%44.6% 36.1%36.1%07-0807-08 44.5%44.5% 36.1%36.1%
08-0908-09 46.0%46.0% 36.2%36.2% 09-1009-10 49.4%49.4% 50.7%50.7%
44.5% of Districts at or Below Ellington44.5% of Districts at or Below Ellington

Staff Experience & Staff Experience & TrainingTraining
2006-20072006-2007 Ellington Ellington DRGDRG StateStateAvg. Yrs. Exp.Avg. Yrs. Exp. 17.2 17.2 15.015.0 14.4 14.4% Masters% Masters 80.1%80.1% 78.6% 78.6%
78.9%78.9%2007-20082007-2008 Avg. Yrs. Exp.Avg. Yrs. Exp. 15.4 15.4 14.3 14.3 13.6 13.6% Masters% Masters 76.4% 76.4% 75.5% 75.5% 75.6% 75.6%2008-20092008-2009Avg. Yrs. Exp.Avg. Yrs. Exp. 15.1 15.1 14.4 14.4 13.6 13.6% Masters% Masters 74.2% 74.2% 77.3% 77.3% 76.1% 76.1%2009-20102009-2010Avg. Yrs. Exp.Avg. Yrs. Exp. 15.015.0 14.514.5 13.813.8% Masters% Masters 78.1% 78.1% 79%79% 77.8%77.8%

Hours of InstructionHours of Instruction
DistrictDistrict DRG DRG StateState
ElementaryElementary 986 986 994 994 983 983
MiddleMiddle 1,036 1,036 1,034 1,018 1,034 1,018
HighHigh 1,016 1,016 1,007 1,006 1,007 1,006

Students per ComputerStudents per Computer
DistrictDistrict DRGDRG StateState
ElementaryElementary 4.14.1 3.13.1 3.23.2
MiddleMiddle 1.91.9 2.22.2 2.52.5
HighHigh 2.72.7 2.42.4 2.32.3

Revenues (Includes Revenues (Includes Construction)Construction)06-07 07-08 08-09 09-1006-07 07-08 08-09 09-10
►Ellington Ellington 63.7% 66.7% 62.7% 64.7%63.7% 66.7% 62.7% 64.7%►State State 33.7% 31.1% 35.1% 33.3%33.7% 31.1% 35.1% 33.3%►Federal Federal 2.5% 1.9% 2.0% 1.9% 2.5% 1.9% 2.0% 1.9%►Tuit/Other 0.1% 0.2%Tuit/Other 0.1% 0.2% .2% .2% .2% .2%

Revenues (Excludes Revenues (Excludes Construction)Construction)
06-07 07-08 08-09 09-1006-07 07-08 08-09 09-10
►Ellington 63.2%Ellington 63.2% 65.0% 61.6% 63.1% 65.0% 61.6% 63.1%►State State 34.1% 34.1% 32.6% 36.1% 34.8% 32.6% 36.1% 34.8%►Federal Federal 2.7% 2.7% 2.1% 2.1% 2.0% 2.1% 2.1% 2.0%►Tuit/Other 0.1%Tuit/Other 0.1% 0.2% .2% .2% 0.2% .2% .2%

Expenditures Per PupilExpenditures Per Pupil
Instructional Staff & ServicesInstructional Staff & Services
07-0807-08 08-09 09-1008-09 09-10
EllingtonEllington $6,552$6,552 $6,660 $6,870$6,660 $6,870
PK-12 DistrictsPK-12 Districts $7,153$7,153 $7,521 $7,521 $7,819$7,819
DRGDRG $6,737$6,737 $7,069 $7,380$7,069 $7,380
StateState $7,159$7,159 $7,522 $7,829$7,522 $7,829

Expenditures Per PupilExpenditures Per Pupil
Instructional Supplies & EquipmentInstructional Supplies & Equipment
07-0807-08 08-09 09-1008-09 09-10
EllingtonEllington $199$199 $206 $202$206 $202
PK-12 DistrictsPK-12 Districts $262$262 $267 $274$267 $274
DRGDRG $287$287 $282$282 $281$281
StateState $266$266 $271 $279$271 $279

Expenditures Per PupilExpenditures Per Pupil
Improvement of Instruction and Improvement of Instruction and Educational Media Services Educational Media Services
07-0807-08 08-09 09-1008-09 09-10EllingtonEllington $266$266 $298$298 $355 $355PK-12 DistrictsPK-12 Districts $443$443 $461 $474$461 $474DRGDRG $395$395 $415 $406$415 $406StateState $429$429 $446 $459$446 $459

Expenditures Per PupilExpenditures Per Pupil
Student Support ServicesStudent Support Services
07-0807-08 08-09 09-1008-09 09-10
EllingtonEllington $453$453 $487 $487 $553$553
PK-12 DistrictsPK-12 Districts $764$764 $808 $808 $863$863
DRGDRG $713$713 $769 $816$769 $816
StateState $761$761 $806 $859$806 $859

Expenditures Per PupilExpenditures Per Pupil
Administration and Support ServicesAdministration and Support Services
07-0807-08 08-09 09-10 08-09 09-10
EllingtonEllington $840 $840 $850 $850 $838$838
PK-12 DistrictsPK-12 Districts $1,256$1,256 $1,351 $1,405$1,351 $1,405
DRGDRG $1,267$1,267 $1,334 $1,400$1,334 $1,400
StateState $1,271$1,271 $1,369 $1,426$1,369 $1,426

Expenditures Per PupilExpenditures Per Pupil
Plant Operation & MaintenancePlant Operation & Maintenance
07-0807-08 08-09 09-10 08-09 09-10
EllingtonEllington $1,129$1,129 $1,103 $1,224$1,103 $1,224
PK-12 DistrictsPK-12 Districts $1,329$1,329 $1,382 $1,382 $1,469$1,469
DRGDRG $1,295$1,295 $1,357 $1,468$1,357 $1,468
StateState $1,322$1,322 $1,377 $1,462$1,377 $1,462
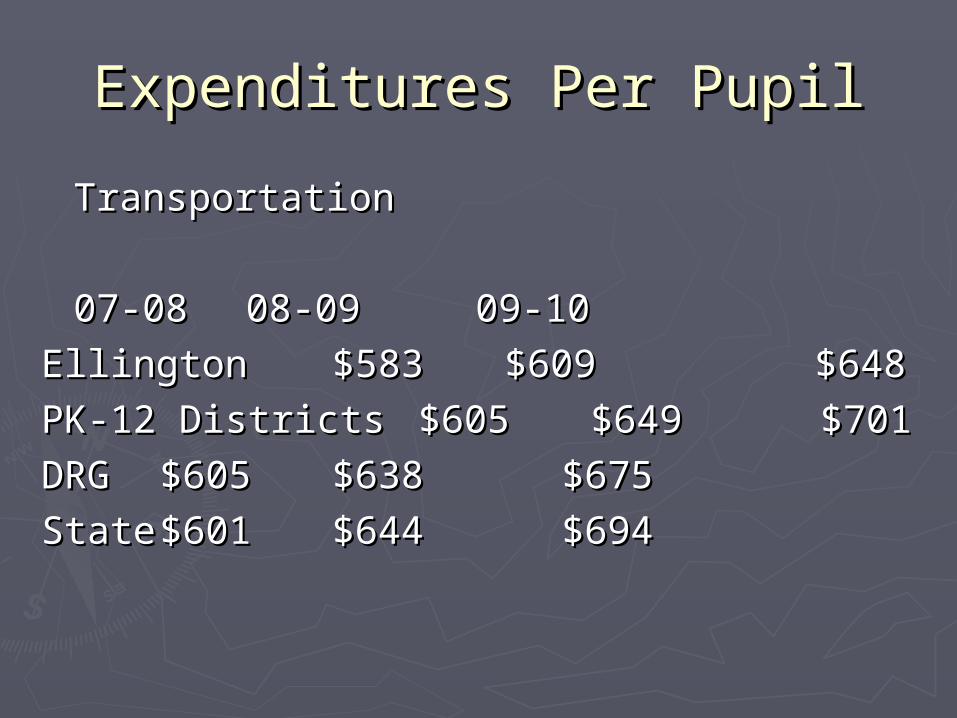
Expenditures Per PupilExpenditures Per Pupil
TransportationTransportation
07-0807-08 08-09 09-1008-09 09-10
EllingtonEllington $583$583 $609$609 $648$648
PK-12 DistrictsPK-12 Districts $605$605 $649 $701$649 $701
DRGDRG $605$605 $638 $675$638 $675
StateState $601$601 $644 $694$644 $694
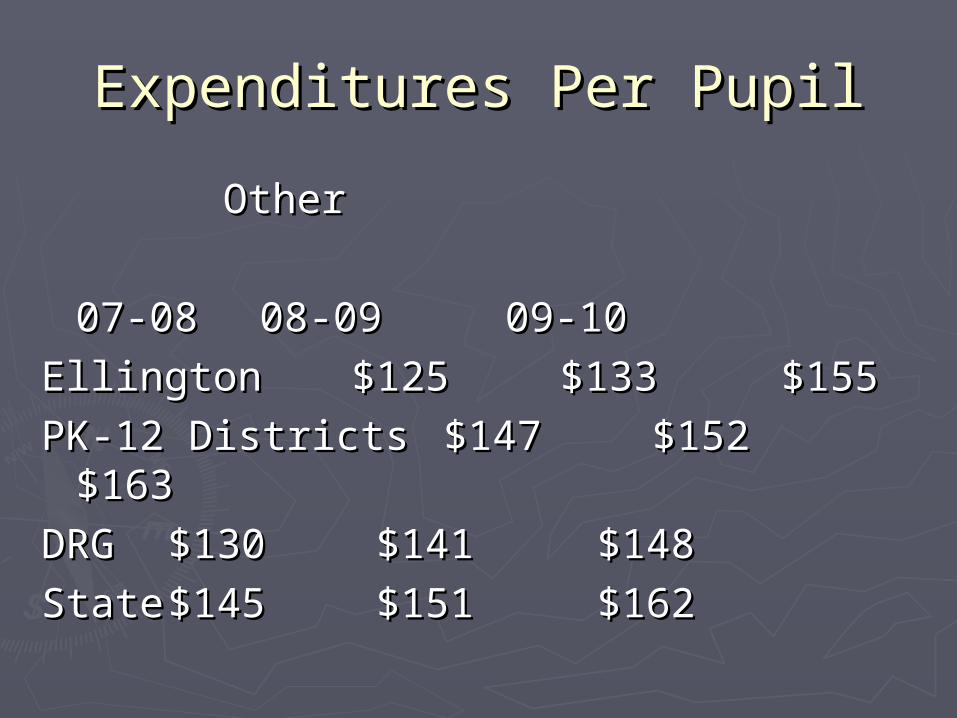
Expenditures Per PupilExpenditures Per Pupil
OtherOther
07-0807-08 08-09 09-1008-09 09-10
EllingtonEllington $125$125 $133 $155 $133 $155
PK-12 DistrictsPK-12 Districts $147$147 $152 $163 $152 $163
DRGDRG $130$130 $141 $148 $141 $148
StateState $145$145 $151 $162 $151 $162

Expenditures Per PupilExpenditures Per Pupil
Land, Buildings & Debt ServiceLand, Buildings & Debt Service
07-0807-08 08-09 09-1008-09 09-10
EllingtonEllington $ 875 $ 875 $711 $649 $711 $649
PK-12 DistrictsPK-12 Districts $1,875 $1,875 $1,791 $1,864$1,791 $1,864
DRGDRG $1,979 $1,979 $1,180 $1,030$1,180 $1,030
StateState $1,882 $1,882 $1,759 $1,825$1,759 $1,825

Special Education Special Education ExpendituresExpenditures
Percent PK-12 Used for Special EducationPercent PK-12 Used for Special Education2008-20092008-2009DistrictDistrict DRG DRG StateState20.9%20.9% 19.7%19.7% 20.5%20.5%
2009-20102009-2010DistrictDistrict DRG DRG StateState20.5%20.5% 20.2%20.2% 20.7%20.7%

Percentage of Students with Percentage of Students with DisabilitiesDisabilities
2008-20092008-2009DistrictDistrict DRG DRG StateState10.2%10.2% 10.8%10.8% 11.6%11.6%
2009-20102009-2010DistrictDistrict DRG DRG StateState9.3%9.3% 10.5%10.5% 11.6%11.6%
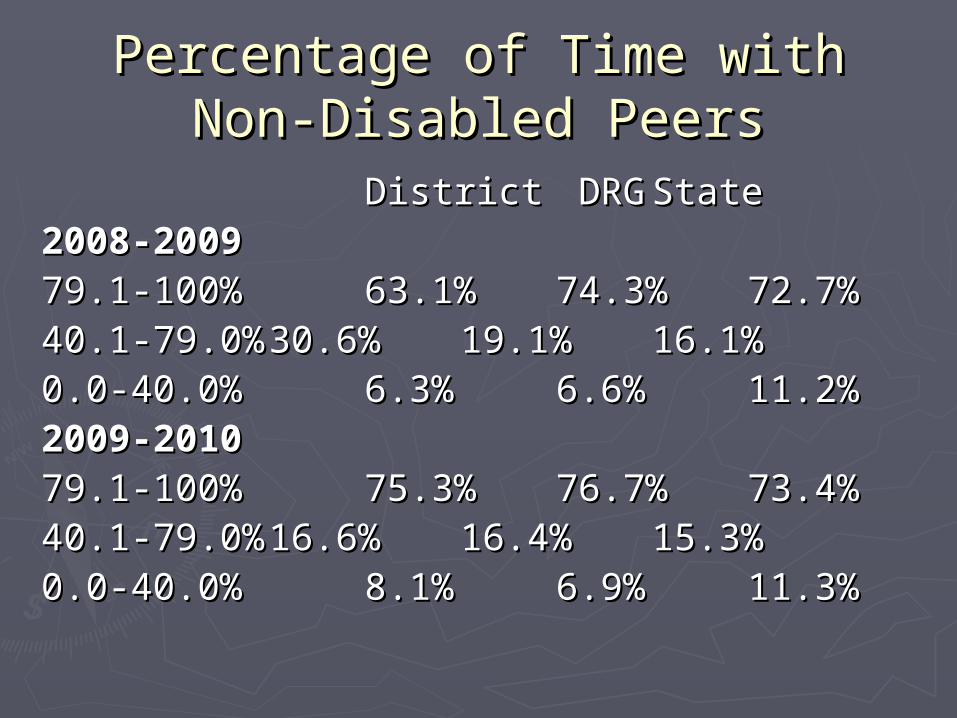
Percentage of Time with Non-Percentage of Time with Non-Disabled PeersDisabled Peers
DistrictDistrict DRG DRGStateState2008-20092008-200979.1-100%79.1-100% 63.1%63.1% 74.3%74.3% 72.7%72.7%40.1-79.0%40.1-79.0% 30.6%30.6% 19.1%19.1% 16.1%16.1%0.0-40.0%0.0-40.0% 6.3%6.3% 6.6%6.6% 11.2%11.2%2009-20102009-201079.1-100%79.1-100% 75.3%75.3% 76.7%76.7% 73.4%73.4%40.1-79.0%40.1-79.0% 16.6%16.6% 16.4%16.4% 15.3%15.3%0.0-40.0%0.0-40.0% 8.1%8.1% 6.9%6.9% 11.3%11.3%

SUMMARYSUMMARY
►Enrollment Continues to IncreaseEnrollment Continues to Increase►Class Sizes are Growing LargerClass Sizes are Growing Larger►District Need Indicators are IncreasingDistrict Need Indicators are Increasing►Student Achievement Continues to be Student Achievement Continues to be
Very StrongVery Strong►Expenditures Per Pupil are Less than Expenditures Per Pupil are Less than
State or District Reference GroupState or District Reference Group