stralem montreux
TRANSCRIPT

1 1
Stralem & Company, Inc. 645 Madison Avenue New York, NY 10022 (Tel) 212.888.8123 (Fax) 212.888.8152 www.stralem.com
STRALEM & COMPANY
LARGE-CAP EQUITY STRATEGY
Adam Abelson Vice President
Andrea Baumann Lustig
Vice President
May 2013

2
Investment Team: Stability and Experience
Private Boutique founded in 1967
$3.7 Bn. in Assets Under Management*
One Strategy-- Three Formats
History of outperformance with reduced risk
Principals Invested in the Strategy
Team Based Decision Making
Hirschel Abelson
President
50+ years Industry Experience
45 years at Stralem
Andrew Eras, CFA
Dir. Institutional Asset Mgmt.
29 years Industry Experience
11 years at Stralem
Edward Cooper, CFA
Senior Research Analyst
15 years Industry Experience
7 years at Stralem
Adam Abelson
Senior Portfolio Manager
Director of Research
21 years Industry Experience
15 years at Stralem
Andrea Baumann Lustig
Dir. Private Client Asset Mgmt.
President, Stralem Equity Fund
29 years Industry Experience
10 years at Stralem
Michael Alpert
Portfolio Manager
22 years Industry Experience
3 Years at Stralem
Philippe Labaune
Head of Trading and Operations
17 years Industry Experience
16 years at Stralem Irene Bergman
Financial Advisor
50+ years Industry Experience
40 years at Stralem
* AUM as of 3/31/13
ABOUT STRALEM

3
Large Cap Equity Strategy Snapshot
All data as of 3/31/13. Source: Stralem, The Bank of New York Mellon Corporation.
See the performance notes included in this presentation.
Product Inception: January 1967
Benchmark: S&P 500
Number of Holdings: 28-35 Positions
Long Only
Weighted Avg. Market Cap: $125.1 billion
S&P Quality Rank: A
Cash Allocation +/- 5%
US Large Cap Equity Strategy
Objective: Build long term capital by delivering excess returns with less risk
during both up and down markets

4
Performance – Rolling Periods
Stralem has consistently outperformed across all rolling time frames
Performance is stated gross of fees. See the performance notes included in this presentation.
All data is based on monthly performance and is from January 1992 to March 2013.
Source: Stralem & Co.
Monthly Percent of
Rolling Average Total Number Annualized Returns Periods Stralem
Return Period of Periods Stralem LCES S&P 500 Index Stralem Premium Outperformed
3 Years 220 12.95% 8.85% 4.10% 82%
5 Years 196 12.42% 7.87% 4.55% 93%
10 Years 136 11.31% 6.20% 5.10% 100%
15 Years 76 12.16% 7.36% 4.80% 100%
20 Years 16 11.93% 8.31% 3.61% 100%

5
Structural Framework
70% Up / 30% Down 50% Up / 50% Down
90% Up / 10% Down 70% Up / 30% Down
Bull Market: Momentum Driven Bear Market: Valuation Driven
Bull Market: Valuation Driven Bear Market: Momentum Driven
Structure portfolio to successfully navigate
each market environment
Focus is on delivering growth with capital
preservation
Increase weighting of Up Market stocks as
market declines to enhance portfolio
growth potential
Increase allocation of Down Market stocks
as momentum increases to reduce
portfolio volatility

6
Portfolio Structure
Up Market Stocks
Capture Upside and Participate When Markets Rise
New Industries
Market Innovators
Leaders in Current Cycles
Technological Shifts
Stronger Growth
New Products
More Mature Growers
Intense Focus on R&D
More Predictable Growth
Horizontal Growth
Dominant Companies
Thematic Investments
Increasing Market Share
Leading Global Brands
World Class Management
Down Market Stocks
Provide Protection and Capital Preservation When Markets Fall
Low Price to Cash Flow
High Sustainable Levels of Cash Flow
Fundamentally and Financially Secure
Purchased at a Discount to Market
High Yield Companies
Dividend Yield Above Market Average
Increasing Dividend Faster than inflation
Dividend Payment Secure – Low Payout Ratio

7
Stock Selection and Research
Stock selection process is fundamentally driven and quantitatively enhanced
S&P 500 Index stocks with Market
Cap > $4B
Dominant Companies
New Industries
New Products
Low Price/CF
High Yield
Extensive due diligence focused on investing
rather than trading securities
Security Research
Research Activities
• Industry research and theme identification
• Management Meetings/Corporate Events
• Extensive travel within US, Europe, Asia
• Discussions with private operators/suppliers
• Minimal sell-side research
Financial Analysis
• Financial Statement Analysis
• Revenue and Earnings Growth Projections
• RGV Calculations and Scenarios
Identify Critical Success Factors
• Sources of Growth
• Drivers of Profitability
• Innovation/De-innovation
• New Product Development
Fundamental Focus
• Financial Statement Transparency
• Identifiable and Strong EPS Growth
• High Earnings Purity
• Business Generating Strong Free Cash Flow
• Increasing Profit Margins
• Demonstrated Ability to Innovate
• Ability to Invest in R&D
• Strong Management - Stewards of Capital
Seek to identify high quality business models
with long term competitive advantages
Security Screening
Valuation Analysis
• Appropriate Relative Growth Value (RGV)

8
Quantitative Risk Management
Category RGV
New Industries 3.07
New Products 1.78
Dominant Companies 1.56
Up-Market Total 1.80
Price-to-Cash Flow 0.52
High Yielding 1.55
Total Down-Market 1.23
Portfolio Total 1.63
S&P 500 0.88
Portfolio Target Pricing Metrics:
Up-Market Stocks > 2x S&P500
Portfolio Total > 1.5x S&P500
Reinforces optimal sector and
category weightings
Signals need to re-balance when
metrics violated
Portfolio Construction: Risk Control Tool
2010 2011 2012ee 3yr Avg 2013 ee EPS Growth P/E RGV
Stock A $3.03 $3.69 $4.08 $3.60 $4.79 33.1% 14x 2.33
Stock B $3.63 $3.80 $3.48 $3.64 $3.83 5.3% 10x 0.53
Prevents overpaying for growth
Enforces Buy/Sell discipline
Stock Selection: Valuation Tool
Relative Growth Valuation Model (RGV)

Performance is stated gross of fees. Returns are from 1/97-3/13. See the performance notes included in this presentation.
Portfolio Structure: A Multi-Year Snapshot (12/96-12/12)
0%
25%
50%
75%
100%
125%
150%
175%
200%
225%
250%
275%
300%
325%
350%
375%
400%
425%
Portfolio Structure:
Year-End 1996
Up Market - 65%
Down Market - 35%
Portfolio Structure:
November 2000
Up Market - 60%
Down Market - 40%
Portfolio Structure:
August 2001
Up Market - 55%
Down Market - 45%
Portfolio Structure:
October 2001
Up Market - 50%
Down Market - 50%
65 CUMULATIVE QUARTERLY RETURNS
TOTAL RETURN LCES 435.0%
S&P 500 184.4%
Up-Market Re-allocation:
Sell New Industries
December 1999
Down Market Re-allocation:
Buy LP/CF Energy
April 2004
Down- Market Re-allocation:
Sell LP/CF Energy
April 2007
Portfolio Structure:
October 2008 - March 2009
Up Market - 65%
Down Market - 35%
9

10
Historical Performance
Consistent Long Term record of delivering excess returns with significantly lower volatility
All Annualized Returns in the bar chart are through 3/31/13 and are stated gross of fees.
See the performance notes included in this presentation.
10.7%
11.9%
6.3%6.7%
10.5%
8.9%
12.5% 12.7%
14.0%12.7%
5.8%5.0%
8.5%
4.3%
8.5%
14.8%
0%
10%
20%
1 Year 3 Years 5 Years 7 Years 10 Years 15 Years 20 Years 10 Year Standard Deviation
LCES S&P 500
Calendar Years Q1 2013 2012 2011 2010 2009 2008 2007 2006 2005 2004 2003 2002 2001 2000 1999
Stralem LCES 10.50 8.69 8.83 10.82 21.49 -27.41 13.59 10.68 13.51 17.42 23.30 -19.70 0.95 5.93 33.16
S&P 500 10.61 16.00 2.11 15.06 26.46 -37.00 5.49 15.79 4.91 10.88 28.68 -22.06 -11.93 -9.10 21.04

11
Economic Backdrop
$0
$5
$10
$15
$20
$25
$30
$35
$40
$45
1951 1961 1971 1981 1991 2001 2011
$ B
illio
ns
Years
Growth in US Debt and GDP (1952 - Q112)
Source: Bloomberg, Stralem & Co.
Nominal GDP
Total Debt
Total US Debt as a Percentage of GDP
100%
150%
200%
250%
300%
350%
400% 1933: 299%
2003: 301%
2009: 367%
Average:204%
Source: Fed Reserve, BEA, Historical Statistical Abstract of the US, Stralem & Co.
20%
60%
100%
140%
1951 1956 1961 1966 1971 1976 1981 1986 1991 1996 2001 2006 2011
Household Debt to Disposable Income
Source: Fed Flow of Funds Report (F.100 and L.1), Bloomberg, Stralem & Co.
Liability Driven Recession
GDP growth fueled by excessive leverage
Consumer and Government remain over levered
Liability holders lack control
Economic recovery will be slow and below trend
No quick fixes—remedies take time
Deleveraging process will occur for several years
Consumer Driven Economy Impacted
70% of US Economy
Unemployment remains high—U6 vs. U3
Wages remain stagnant

Risk Management
12
Excesses of prior Bull Market have yet to be fully resolved Leverage remains excessive
Sovereigns still fragile
Low and Middle market consumers remain constrained
Structural Headwinds Persist Deleveraging Global Economy
Stagnant Job Growth
High Unemployment/Flat Personal Income
Expanding Income Inequality
Austerity Programs
Macro Risks Continue Unwinding of Unprecedented Central Bank Liquidity
Managing a return to rising rate environment
Ongoing geopolitical risks
Bull Market within a Structural Bear Market Earnings Driven by Stock Buybacks and Cost cutting—
Peak Corporate Margins
Positioned for A Momentum-Driven Bear Market
Allocation to Down Market Stocks
High Quality Focus

Growth Opportunities
13
Expansion of the Global Middle Class
The “Urbanization” of Emerging Markets is driving
demand for Western goods and services
Aggregate GDP of BRICs quadrupled over last decade
from $3T to $12T
Continuation of the Industrial Revolution
Global secular trends remain firmly in place
Strong demand for power, energy, machinery, mining
Proliferation of Mobile Technology
Internet traffic growing 29% per year from 2011-2016
Consumer demand shifting to mobile
Globalization of Disease and Health Care Issues
Demographics driving health care demand
Cost pressure driving innovation
China, Brazil, India to Account for One-Third of Smartphones by
2016
Source: Goldman Sachs

14
Stralem Investment Focus…
Large and innovative companies built to survive and thrive during periods of economic volatility
Strong Balance Sheet and Cash Generation
Can finance suppliers and customers to support consistent and predictable growth
Ability to reinvest capital into business without accessing capital markets
Low cost of capital advantage creates investment opportunities
Revenue Diversification and Global Reach
Multiple revenue streams prevent a reliance on any single product or market
Take advantage of emerging market growth rates that far exceed developed markets
Continued investment in innovation
Reduced Risk Profile
Focus on mega-cap securities
Disciplined stock entry/exit points, not chasing momentum
Long term investment approach

Portfolio Positioning
15
Overweight Industrials Access to global infrastructure, energy and urbanization trends
High barriers to entry
Geographic and product diversity
Select Exposure to Technology Access to tech growth trends in mobility, cloud and enterprise
Avoidance of end market exposure (No Apple)
Targeted Exposure to Consumer Economic pressures on consumer spending
Decreased access to credit
Highly leveraged
Overweight High Yield Companies High yield in a low interest rate environment
Stable and recurring cash flow
Decrease portfolio volatility and provide downside protection
No Exposure To Financials
Lack of financial statement and earnings transparency
Fundamental headwinds
Leverage remains a concern

Current Portfolio
16 See the performance notes included in this presentation.
C at e g o ry C o mp any Targ e t % C at e g o ry C o mp any Targ e t %
N ew Indust r ies Cisco Systems Price t o C ash F low Chevron Corp
Google Exxon M obil
M icrosoft
Oracle
Qualcomm
Subt o t al: 12 .5% Subt o t al: 8 .0 %
N ew Product s Abbott Laboratories High Y ield AT&T
Abbvie Dominion Resources
Celgene M erck & Co
Thermo Fisher Scient if ic NextEra Energy
Pfizer
PPL Corporat ion
Subt o t al: 7.5% Southern Company
D ominant C ompanies Coca-Cola Subt o t al: 2 4 .0 %
Danaher
Dow Chemicals D own- M arket Subt o t al: 3 2 .0 %
Dupont
Eaton Corporat ion C ash 3 .8 %
Federal Express
General Electric
Internat ional Business M achines
M cDonald's
Phillip M orris Internat ional
Schlumberger
United Technologies
Visa
Subt o t al: 4 4 .2 %
U p- M arket Subt o t al: 6 4 .2 %

Appendix

UCITS IV Fund
18
4 Year Track Record
Launched Adviser share class August 2008; Institutional class added November 2008
Distribution and Capitalization shares
Registered in 9 countries
Assets of $125M*
Shareholders from Switzerland, Germany, UK, Luxembourg, Austria, Netherlands
Private Banks, Insurance Companies, Asset Managers, Other Institutions, Individuals
Fully tax transparent in Germany
Dollar denominated, no currency hedging
US Large Cap Equity Strategy portfolio; trading done by Stralem
KTL Luxembourg is Management Company
KBL acts as custodian; Citi is sub-custodian for all US securities
Audited by Deloitte
Website with all documentation www.stralemucits.com
*As of 5/13/2013.

UCITS IV Fund-Fees
19
TER capped at 1.53% by Investment Manager for Institutional Shares
TER capped at 2.19% by Investment Manager for Adviser Shares
Management Fee at 80bps (I shares) and 1.30% (A shares)
20
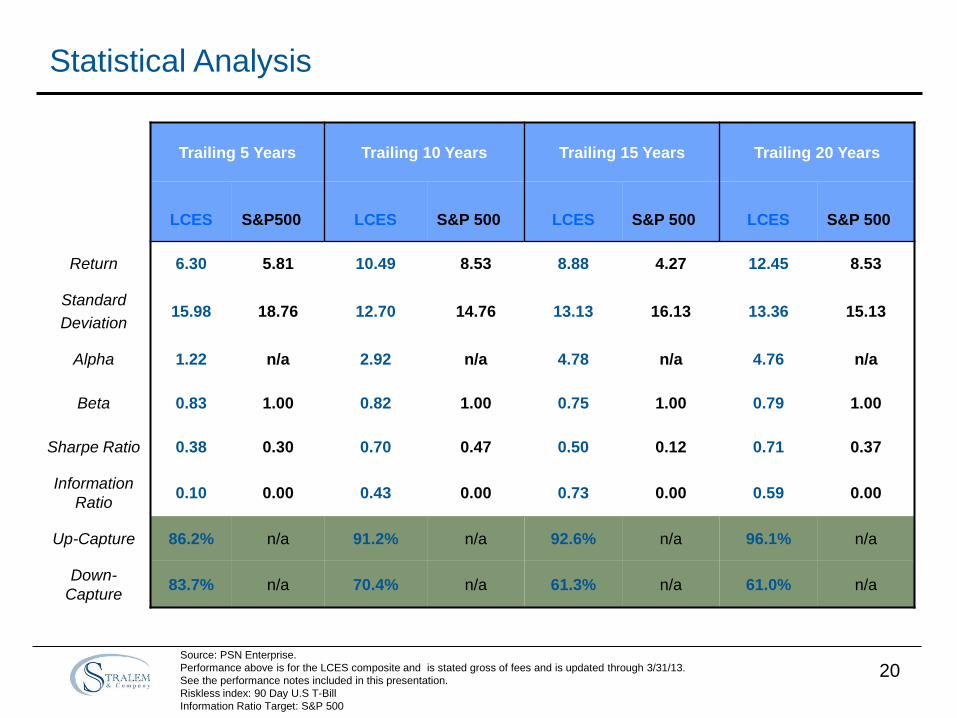
Statistical Analysis
Source: PSN Enterprise.
Performance above is for the LCES composite and is stated gross of fees and is updated through 3/31/13.
See the performance notes included in this presentation.
Riskless index: 90 Day U.S T-Bill
Information Ratio Target: S&P 500
Trailing 5 Years Trailing 10 Years Trailing 15 Years Trailing 20 Years
LCES
S&P500
LCES
S&P 500
LCES
S&P 500
LCES
S&P 500
Return 6.30 5.81 10.49 8.53 8.88 4.27 12.45 8.53
Standard
Deviation 15.98 18.76 12.70 14.76 13.13 16.13 13.36 15.13
Alpha 1.22 n/a 2.92 n/a 4.78 n/a 4.76 n/a
Beta 0.83 1.00 0.82 1.00 0.75 1.00 0.79 1.00
Sharpe Ratio 0.38 0.30 0.70 0.47 0.50 0.12 0.71 0.37
Information
Ratio 0.10 0.00 0.43 0.00 0.73 0.00 0.59 0.00
Up-Capture 86.2% n/a 91.2% n/a 92.6% n/a 96.1% n/a
Down-
Capture 83.7% n/a 70.4% n/a 61.3% n/a 61.0% n/a

Large Cap Equity Strategy Risk/Reward
Supplemental Information as of March 2013, 5 Year period. Risk Index: S&P 500. Risk-less Index: 90 Day U.S. T-Bill.
Source: PSN Enterprise
Performance is stated gross of fees. See the performance notes included in this presentation.
21
16 17 18 19 20 21 22 STANDARD DEVIATION
4
5
6
7
RA
TE
OF
RE
TU
RN
Standard & Poor's 500
More Return Less Risk
Less Return Less Risk
More Return More Risk
Less Return More Risk
Stralem & Co. LCES
Standard & Poor's 500
ROR Std Dev Pop Alpha Beta
6.30 17.83 1.11 0.83
5.81 21.09 0.00 1.00
22
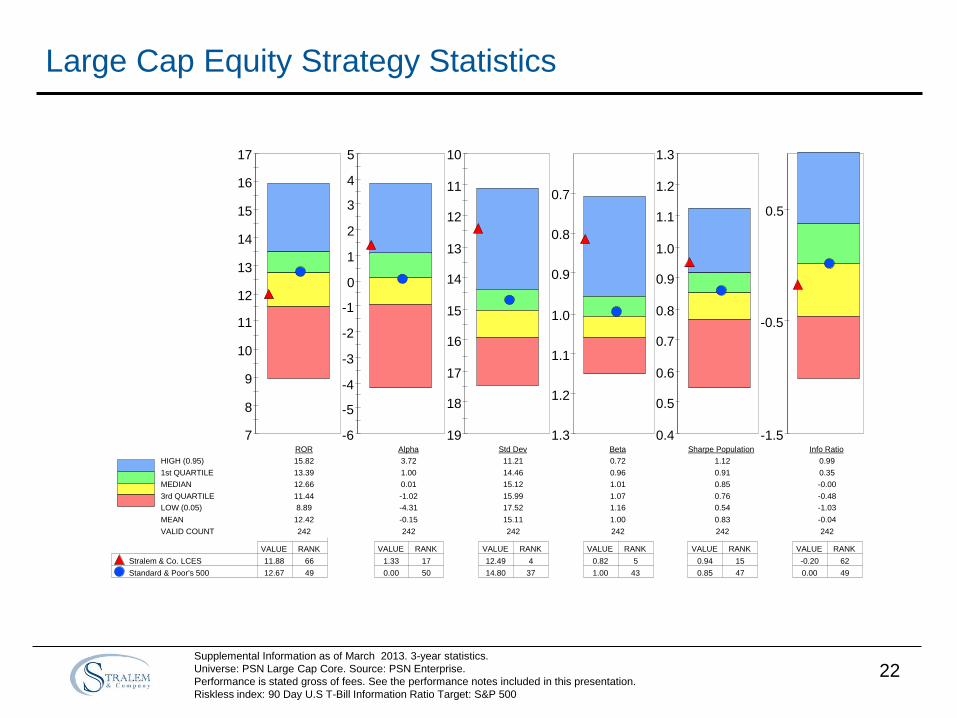
Large Cap Equity Strategy Statistics
Supplemental Information as of March 2013. 3-year statistics.
Universe: PSN Large Cap Core. Source: PSN Enterprise.
Performance is stated gross of fees. See the performance notes included in this presentation.
Riskless index: 90 Day U.S T-Bill Information Ratio Target: S&P 500
7
8
9
10
11
12
13
14
15
16
17
-6
-5
-4
-3
-2
-1
0
1
2
3
4
5 10
11
12
13
14
15
16
17
18
19
0.7
0.8
0.9
1.0
1.1
1.2
1.3 0.4
0.5
0.6
0.7
0.8
0.9
1.0
1.1
1.2
1.3
-1.5
-0.5
0.5
HIGH (0.95)
1st QUARTILE
MEDIAN
3rd QUARTILE
LOW (0.05)
MEAN
VALID COUNT
ROR
15.82
13.39
12.66
11.44
8.89
12.42
242
Alpha
3.72
1.00
0.01
-1.02
-4.31
-0.15
242
Std Dev
11.21
14.46
15.12
15.99
17.52
15.11
242
Beta
0.72
0.96
1.01
1.07
1.16
1.00
242
Sharpe Population
1.12
0.91
0.85
0.76
0.54
0.83
242
Info Ratio
0.99
0.35
-0.00
-0.48
-1.03
-0.04
242
VALUE RANK
Stralem & Co. LCES 11.88 66
Standard & Poor's 500 12.67 49
VALUE RANK
1.33 17
0.00 50
VALUE RANK
12.49 4
14.80 37
VALUE RANK
0.82 5
1.00 43
VALUE RANK
0.94 15
0.85 47
VALUE RANK
-0.20 62
0.00 49
23
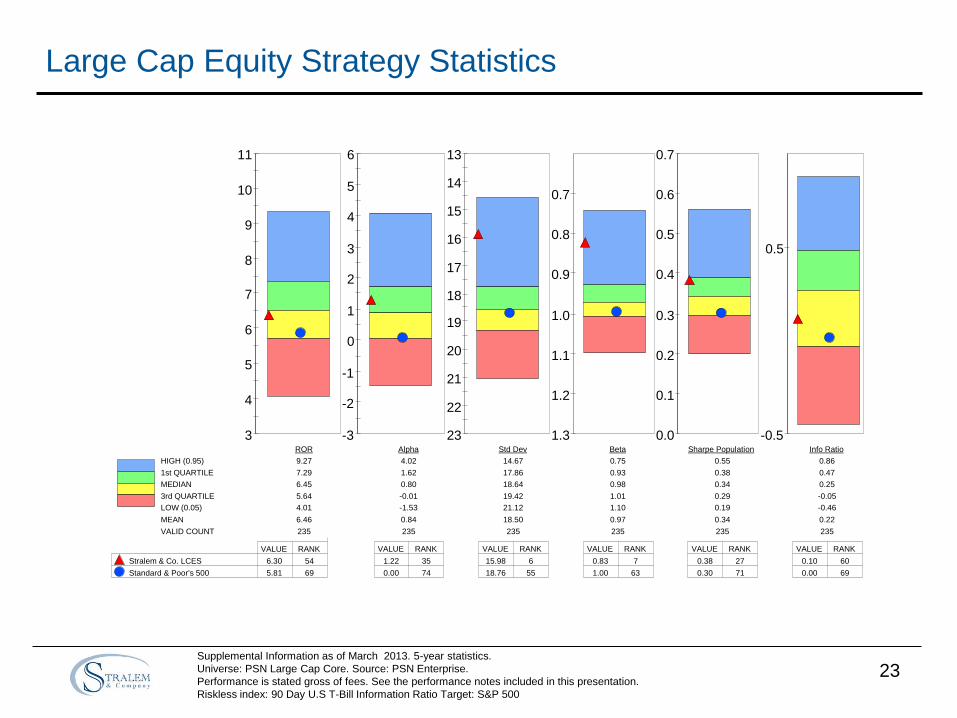
Large Cap Equity Strategy Statistics
Supplemental Information as of March 2013. 5-year statistics.
Universe: PSN Large Cap Core. Source: PSN Enterprise.
Performance is stated gross of fees. See the performance notes included in this presentation.
Riskless index: 90 Day U.S T-Bill Information Ratio Target: S&P 500
3
4
5
6
7
8
9
10
11
-3
-2
-1
0
1
2
3
4
5
6 13
14
15
16
17
18
19
20
21
22
23
0.7
0.8
0.9
1.0
1.1
1.2
1.3 0.0
0.1
0.2
0.3
0.4
0.5
0.6
0.7
-0.5
0.5
HIGH (0.95)
1st QUARTILE
MEDIAN
3rd QUARTILE
LOW (0.05)
MEAN
VALID COUNT
ROR
9.27
7.29
6.45
5.64
4.01
6.46
235
Alpha
4.02
1.62
0.80
-0.01
-1.53
0.84
235
Std Dev
14.67
17.86
18.64
19.42
21.12
18.50
235
Beta
0.75
0.93
0.98
1.01
1.10
0.97
235
Sharpe Population
0.55
0.38
0.34
0.29
0.19
0.34
235
Info Ratio
0.86
0.47
0.25
-0.05
-0.46
0.22
235
VALUE RANK
Stralem & Co. LCES 6.30 54
Standard & Poor's 500 5.81 69
VALUE RANK
1.22 35
0.00 74
VALUE RANK
15.98 6
18.76 55
VALUE RANK
0.83 7
1.00 63
VALUE RANK
0.38 27
0.30 71
VALUE RANK
0.10 60
0.00 69

24
Large Cap Equity Strategy Statistics
Supplemental Information as of March 2013. 10-year statistics.
Universe: PSN Large Cap Core. Source: PSN Enterprise.
Performance is stated gross of fees. See the performance notes included in this presentation.
Riskless index: 90 Day U.S T-Bill Information Ratio Target: S&P 500
7.5
8.5
9.5
10.5
11.5
-1.0
0.0
1.0
2.0
3.0
4.0 12.0
13.0
14.0
15.0
16.0
17.0
0.7
0.8
0.9
1.0
1.1
1.2
0.4
0.5
0.6
0.7
0.8
0.9
-0.5
0.5
HIGH (0.95)
1st QUARTILE
MEDIAN
3rd QUARTILE
LOW (0.05)
MEAN
VALID COUNT
ROR
11.67
10.04
9.36
8.79
7.60
9.46
169
Alpha
3.75
1.78
0.95
0.35
-0.52
1.10
169
Std Dev
12.21
14.24
14.74
15.21
16.51
14.70
169
Beta
0.79
0.95
0.98
1.01
1.07
0.97
169
Sharpe Population
0.74
0.58
0.53
0.48
0.41
0.53
169
Info Ratio
0.88
0.54
0.33
0.12
-0.29
0.32
169
VALUE RANK
Stralem & Co. LCES 10.49 14
Standard & Poor's 500 8.53 86
VALUE RANK
2.92 5
0.00 88
VALUE RANK
12.70 3
14.76 54
VALUE RANK
0.82 4
1.00 66
VALUE RANK
0.70 1
0.47 83
VALUE RANK
0.43 37
0.00 86

25
Investment Professionals
HIRSCHEL B. ABELSON, PRESIDENT & CHIEF INVESTMENT OFFICER: Mr. Abelson co-founded Stralem & Company Incorporated in 1966. He
became President in June of 1973. Mr. Abelson serves as Stralem’s Chief Investment Officer overseeing the firm’s investment strategy and is an officer
of Stralem Equity Fund. Prior to founding Stralem, Mr. Abelson was a partner in corporate finance as well as an economic Adviser at Ladenburg,
Thalmann which he joined in 1956. Mr. Abelson has managed and/or served on Boards of companies in the food service, housing, manufacturing,
computer products, specialty retailing, radio broadcasting and publishing industries. From 1987 – 2000, Mr. Abelson served on the trustee investment
committee of Cornell University. He is a member of the Board of Trustees at Pitzer College where he serves on the Investment Committee.
Education: BA, Cornell University, MBA, Cornell University
ADAM S. ABELSON, SENIOR PORTFOLIO MANAGER: Mr. Abelson leads the firm's research effort overseeing the implementation of the US Large-
Cap Equity Strategy. Mr. Abelson co-authors the firm's quarterly "West of the Hudson" letter, which is the product of the team's research trips around the
world. He serves as an officer of Stralem Equity Fund and a Director of Stralem Investment Fund (UCITS). MR. Abelson joined Stralem in 1998 after
managing business units within the emerging technologies, consumer products and hotel/gaming industries.
Education: BA, Pitzer College, Claremont Colleges
ANDREA BAUMANN LUSTIG, DIRECTOR, PRIVATE CLIENT ASSET MANAGEMENT; PRESIDENT, STRALEM EQUITY FUND: Ms. Lustig leads
the firm's marketing to private clients and wealth managers. She is President of Stralem Equity Fund (US) and a Director of Stralem Investment Fund
(UCITS). Prior to joining Stralem in 2003, Ms. Lustig was a Vice President with Bernstein Investment Research and Management where she spent five
years as a Financial Advisor working extensively with private clients. She joined Bernstein after eleven years at Booz, Allen & Hamilton, Inc., an
international management consulting firm, where she was a Principal in the Strategy Practice and the Director of Operations for Financial Services in the
US and Europe. Prior to Booz, Allen, Ms. Lustig was a Financial Analyst in Mergers & Acquisitions at Morgan Stanley & Co., Inc. and an Associate in
Investment Banking at Jefferies & Co. Ms. Lustig is also President of the Association for the Restoration of Jewish Works and Institutions in France
(www.arifusa.org). Ms. Lustig is a former Trustee of The Horace Mann School where she was President of the Parents Association. She is also Chair of
Annual Giving for the Princeton Class of 1980, a member of the Scholarship Committee for Le Rosey, a Steering Committee member of the Socrates
Society of the Aspen Institute, and a Board Member of the Madison Avenue Business Improvement District.
Education: BA, MPA Princeton University; MBA, Yale University. Fluent in French
ANDREW J. ERAS, CFA DIRECTOR, INSTITUTIONAL ASSET MANAGEMENT: Mr. Eras leads the firm's marketing to consultants and institutions.
Prior to joining Stralem in 2002, Mr. Eras was a Vice President with Bernstein Investment Research and Management where he spent three years as a
Pension Advisor in the Institutional Sales Group. Mr. Eras joined Bernstein after five years as Institutional Sales Manager at The Bank of Tokyo-
Mitsubishi. Prior to that, he spent five years as an internal wholesaler in the Capital Markets Group at Prudential Securities and five years as a Vice
President at Dreyfus Securities. Mr. Eras is a member of the CFA Institute and NYSSA and is a CFA Charterholder.
Education: BA, State University of New York (SUNY) at Albany

26
Investment Professionals
PHILIPPE T. LABAUNE, VICE PRESIDENT, DIRECTOR, TRADING & OPERATIONS: Mr. Labaune joined Stralem in 1997 where he directs all
trading operations for the firm. Mr. Labaune is also a Vice President of Stralem Equity Fund. Prior to joining Stralem, Mr. Labaune was a trader in
charge of ADR's at Société Générale Securities Corp.
Education: DEUG Catholic University of Lyon; BA, MBA, Pace University. Fluent in French
MICHAEL J. ALPERT, PORTFOLIO MANAGER: Mr. Alpert focuses on research for the firm's US Large Cap Equity Strategy. Prior to joining
Stralem in 2010, Mr. Alpert was a Managing Director at J&W Seligman & Co where he was the Portfolio Manager and Head of the Seligman Small
Company Growth Team. Mr. Alpert joined J&W Seligman in 1999 from business school as an Investment Analyst and became Portfolio Manager
in 2006. He had security selection responsibility in a variety of sectors including, Consumer, Technology, Industrials, Financials and Commercial
Services. Prior to business school, Mr. Alpert was a Manager for 7 years at Andersen Consulting where he did Technology and Strategic
Consulting in the Communications Industry Group.
Education: BA, University of Connecticut Honors Program, MBA Wharton School of the University of Pennsylvania
EDWARD N. COOPER, CFA, SENIOR RESEARCH ANALYST: Mr. Cooper is a senior member of the firm's research team. Prior to joining
Stralem 2006, Mr. Cooper spent ten years with Bloomberg L.P., a financial information provider, where he worked as an Equity Fundamental
Analyst., a Fixed Income Research Analyst, and a French Translator with the Localization Group. In his positions at Bloomberg, Mr. Cooper
specialized in security-level and portfolio-level analytics. He placed 1st out of a class of 40 in the 6-week intensive Bloomberg Analytics Desk
training program. Mr. Cooper is a member of the CFA Institute and NYSSA and is a CFA Charterholder. He also served in the U.S. Peace Corps in
Togo, West Africa.
Education: AB, Bowdoin College; MBA, Rutgers University. Fluent in French, Spanish and Mandarin Chinese.
IRENE BERGMAN, SENIOR VICE PRESIDENT: Ms. Bergman joined Stralem & Co. in 1973 where she has been a financial advisor and account
manager for domestic and foreign clients. Prior to Stralem, she was a senior investment professional in the International Department of Loeb,
Rhoades & Co. For ten years prior to Loeb, Rhoades, Ms. Bergman was Assistant Manager in the Foreign Department of Hallgarten & Co. where
she was active in merger arbitrages and authored a weekly market letter.
Education: Bismarck Lyceum – Berlin. Languages: Fluent in Dutch, German

27
Performance Notes
Stralem & Company (“Stralem”) is an independent, SEC registered investment adviser established in 1966. The Large Cap Equity Strategy ™ Composite (LCES) consists of fully discretionary large
capitalization equity accounts. The investment objective of the LCES is to deliver above market returns with less risk during both up and down markets. The investment philosophy of the Large Cap Equity
Strategy is predicated on the belief that there are four types of market environments, two types of bull markets and two types of bear markets each characterized by momentum and valuation factors. Market
environments affect portfolio structure so it is critical to identify and prepare for changing market environments. The Large Cap Equity Strategy adds value by purchasing a set of fundamentally solid
growth companies along with a set of companies that deliver strong cash flow and adjusting the balance between these two groups depending on where we are in the market cycle. Stralem defines the LCES
as a conservative growth strategy that also focuses on preserving capital during down markets.
For comparison purposes, the composite is measured against the S&P 500 and Russell 1000 Growth indices. The S&P 500 index is widely recognized as a leading indicator of the U.S. equity markets. The
Russell 1000 Growth Index measures the performance of the large-cap growth segment of the U.S. equity universe. It includes those Russell 1000 companies with higher price-to-book ratios and higher
forecasted growth values.
Stralem claims compliance with the Global Investment Performance Standards (GIPS®) and has prepared and presented this report in compliance with the GIPS standards. Stralem has been independently
verified for the periods January 1, 1992 through December 31, 2012. Verification assesses whether (1) the firm has complied with all the composite construction requirements of the GIPS standards on a
firm-wide basis and (2) the firm’s policies and procedures are designed to calculate and present performance in compliance with the GIPS standards. The Large Cap Equity Strategy Composite has been
examined for the periods January 1, 1992 through December 31, 2012. The verification and performance examination reports are available upon request.
The Large Cap Equity Strategy Composite was created July 1, 2002.
The Large Cap Equity Strategy Composite has been examined by an independent third party verifier (Ashland Partners & Company LLP). The firm maintains a complete list and description of composites,
which is available upon request. To receive a complete list and description of Stralem's composites contact Stralem at 212-888-8123.
Results are based on fully discretionary accounts under management, including those accounts no longer with the firm. Past performance is not indicative of future results. Policies for valuing portfolios,
calculating performance, and preparing compliant presentations are available upon request.
The U.S. Dollar is the currency used to express performance. Returns are presented both gross and net of management fees and include the reinvestment of all income. There are portfolios included in the
composite which have directed brokerage arrangements and are not charged trading commissions by their broker. These portfolios represent less than 2% of composite assets. Performance for these
accounts do not include transaction costs, and it has been determined that there is no material impact on composite performance. Returns are presented gross of custodial fees and withholding taxes but net
of all trading expenses. Gross returns will be reduced by investment advisory fees and other expenses that may be incurred in the management of the account. Actual investment advisory fees incurred by
clients may vary. Net of fee performance is calculated using the composite actual net performance during the period. Prior to 2006, net performance is calculated using the highest client's management fee
in the composite. From 2000 - 2005 the highest fee was 1.50%. Prior to 2000 the highest fee was 1.00%. A fee schedule is an integral part of a complete presentation and is described in Part II of the firm’s
ADV, which is available upon request. The annual composite dispersion presented is an asset-weighted standard deviation calculated for the accounts in the composite the entire year. The investment
management fee schedule is as follows: 0.80% on the first $5 million, 0.70% on the next $20 million, and 0.50% on the remainder. Actual investment advisory fees incurred by clients may vary. Clients
may have different fee arrangements than the above fee schedule with fees that are higher or lower depending on when the contract was entered into and the services provided. Accounts that require
additional resources for administration, management and servicing may be charged an advisory fee of up to 1.25% per annum. Upon request, Stralem will also provide its clients with a fulcrum fee
arrangement, which includes a lower, fixed advisory fee plus a performance based fee. Fulcrum fees arrangements may vary among clients.
Prior to 1997, carve-outs are included in this composite and performance reflects required total segment plus cash returns. All cash not directly related to fixed income is included in the equity carve-out.
100% of composite assets were comprised of carve-out segments prior to 1997. There are no carve-out segments in the composite subsequent to 1996.
These presentation materials are intended for use by the recipient named on the front cover hereof for the exclusive purpose of evaluating the investment advisory services of Stralem & Company
Incorporated in an one-on-one presentation. Any other use is strictly prohibited. These presentation materials and any attachments delivered separately herewith may contain privileged or confidential
information of Stralem & Company Incorporated. Accordingly, neither this booklet nor any portion hereof may be reproduced or redistributed without the prior written consent of Stralem & Company
Incorporated. Disclosure of the information presented in this booklet to anyone other than the recipient's employees, officers, directors, or financial or legal representatives is also prohibited without the
prior written consent of Stralem & Company Incorporated. Do not distribute this to clients unless you are using this information in a one-on-one presentation with the disclosures set forth above.
All rights reserved. Stralem & Company Incorporated. 2013