strabag se investor presentation february 2019
TRANSCRIPT

STRABAG SEINVESTOR PRESENTATION
FEBRUARY 2019

This presentation is made by STRABAG SE (the "Company") solely for use at investor meetings and is furnished to you solely for your information.
This presentation speaks as of February 2019. The facts and information contained herein might be subject to revision in the future. Neither the delivery of this presentation nor any further discussions of the Company with any of the recipients shall, under any circumstances, create any implication that there has been no change in the affairs of the Company since such date. None of the Company or any of its parents or subsidiaries or any of such person's directors, officers, employees or advisors nor any other person (i) accepts any obligation to update any information contained herein or to adjust it to future events or developments or (ii) makes any representation or warranty, express or implied, as to, and no reliance should be placed on, the accuracy or completeness of the information contained in this presentation. None of the Company or any of its parents or subsidiaries or any of their directors, officers, employees and advisors nor any other person shall have any liability whatsoever (in negligence or otherwise) for any loss howsoever arising, directly or indirectly, from any use of this presentation. The same applies to information contained in other material made available at the meeting.
This document is selective in nature and is intended to provide an introduction to, and overview of, the business of the Company. Where any information and statistics are quoted from any external source, such information or statistics should not be interpreted as having been adopted or endorsed by the Company as being accurate.
This presentation contains forward-looking statements relating to the business, financial performance and results of the Company and/or the industry in which the Company operates. These statements generally are
identified by words such as "believes“, "expects”, "predicts”, "intends”, "projects”, "plans”, "estimates”, "aims”, "foresees”, "anticipates”, "targets”, and similar expressions. The forward-looking statements, including but not limited to assumptions, opinions and views of the Company or information from third party sources, contained in this presentation are based on current plans, estimates, assumptions and projections and involve uncertainties and risks. Various factors could cause actual future results, performance or events to differ materially from those described in these statements. The Company does not represent or guarantee that the assumptions underlying such forward-looking statements are free from errors nor do they accept any responsibility for the future accuracy of the opinions expressed in this presentation. No obligation is assumed to update any forward-looking statements.
By accepting this presentation you acknowledge that you will be solely responsible for your own assessment of the market and of the market position of the Company and that you will conduct your own analysis and be solely responsible for forming your own view of the potential future performance of the Company's business.
DISCLAIMER
Investor Presentation February 20192

STRABAG AT A GLANCE THE CONSTRUCTION SECTOR WITHIN EVOLVING GLOBAL THEMES
FINANCIAL PERFORMANCE
APPENDIX
1 2 3
4 5
THE STRABAG STRATEGY & INVESTMENT PROPOSITION
Investor Presentation February 20193

STRABAG AT A GLANCE1

● Output volume 2018: € 16.3 billion● Net income 2017: € 292 million● 75,460 employees● >700 locations in more than 80 countries● Highly innovative: Central Technical Division with nearly 1,000
engineers, TPA (Quality & Innovation) with 880 people● Equity ratio: >30%● Investment grade rating by S&P: BBB, outlook stable● Strong brands: STRABAG & ZÜBLIN
FACTS & FIGURES MARKETS
OUTPUT VOLUME BY REGION (2018)
STRABAG AT A GLANCE
#2
SaudiArabia
OmanAbu Dhabi
Qatar
#1
#1#1#1
#1
#2
#3
Colombia
Chile
#1
Germany48%
Austria16%
CEE22%
Rest of Europe8%
Rest of world7%
Investor Presentation February 20195
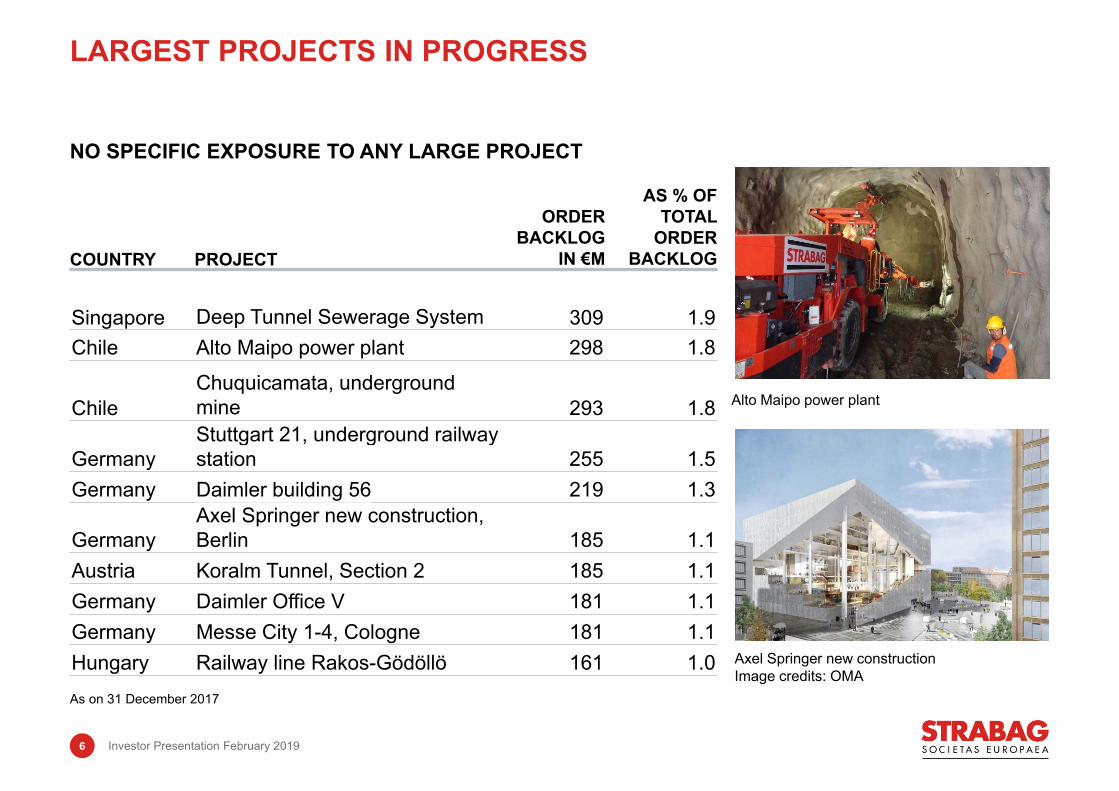
COUNTRY PROJECT
ORDER BACKLOG
IN €M
AS % OF TOTAL
ORDER BACKLOG
Singapore Deep Tunnel Sewerage System 309 1.9Chile Alto Maipo power plant 298 1.8
ChileChuquicamata, underground mine 293 1.8
GermanyStuttgart 21, underground railway station 255 1.5
Germany Daimler building 56 219 1.3
GermanyAxel Springer new construction, Berlin 185 1.1
Austria Koralm Tunnel, Section 2 185 1.1Germany Daimler Office V 181 1.1Germany Messe City 1-4, Cologne 181 1.1Hungary Railway line Rakos-Gödöllö 161 1.0
NO SPECIFIC EXPOSURE TO ANY LARGE PROJECT
As on 31 December 2017
LARGEST PROJECTS IN PROGRESS
Alto Maipo power plant
Axel Springer new constructionImage credits: OMA
6 Investor Presentation February 2019

Building of an arch bridge
Size: € 22 million (=60% share)
Project schedule: 2013–2017
Project scope: 475 m long arch bridge with a span of 260 m
TAMINA BRIDGE –SWITZERLAND
Financing, planning, building and operating
Size: € 330 million
Project schedule: 2014–2017
Project scope: 57 km motorway, 25-year operating period
PPP-MOTORWAY N17/N18 – IRELAND
Building of a twin-tube rail tunnel between Tulfes–Pfons
Size: € 380 million (=51% share)
Project schedule: 2014–2019
Project scope: 38 km twin-tube rail tunnel, exploratory and rescue tunnel
BRENNER BASE TUNNEL –AUSTRIA
Construction of new office and production buildings in Zug, Switzerland
Size: ~ € 100 million
Project schedule: 2016–2018
Project scope: General contractor, BIM 5D® applied
OFFICE & PRODUCTION BUILDINGS FOR SIEMENS
Picture: Thomas Böhm, Tiroler Tageszeitung
FLAGSHIP PROJECTS – EXAMPLES
Picture: Siemens Schweiz AG
Investor Presentation February 20197
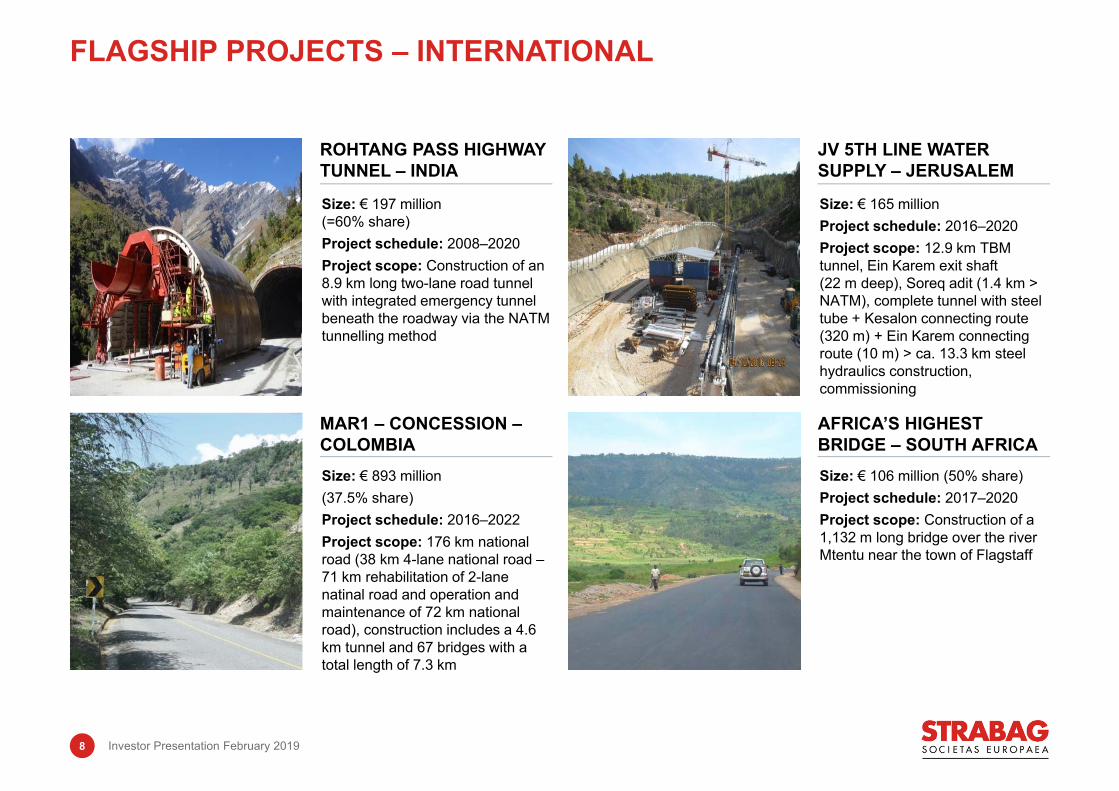
FLAGSHIP PROJECTS – INTERNATIONAL
Size: € 197 million (=60% share)Project schedule: 2008–2020Project scope: Construction of an 8.9 km long two-lane road tunnel with integrated emergency tunnel beneath the roadway via the NATM tunnelling method
ROHTANG PASS HIGHWAY TUNNEL – INDIA
Size: € 165 millionProject schedule: 2016–2020Project scope: 12.9 km TBM tunnel, Ein Karem exit shaft (22 m deep), Soreq adit (1.4 km > NATM), complete tunnel with steel tube + Kesalon connecting route (320 m) + Ein Karem connecting route (10 m) > ca. 13.3 km steel hydraulics construction, commissioning
JV 5TH LINE WATER SUPPLY – JERUSALEM
Size: € 893 million(37.5% share)Project schedule: 2016–2022Project scope: 176 km national road (38 km 4-lane national road –71 km rehabilitation of 2-lane natinal road and operation and maintenance of 72 km national road), construction includes a 4.6 km tunnel and 67 bridges with a total length of 7.3 km
MAR1 – CONCESSION –COLOMBIA
Size: € 106 million (50% share)Project schedule: 2017–2020Project scope: Construction of a 1,132 m long bridge over the river Mtentu near the town of Flagstaff
AFRICA’S HIGHEST BRIDGE – SOUTH AFRICA
Investor Presentation February 20198

North + West South + EastInternational +
Special Divisions
Regions/Areas
Germany, Poland, Benelux, Scandinavia, Ground
Engineering
Austria, Switzerland, Hungary, Czech Republic, Slovakia,
Adriatic, Rest of Europe, Environmental Engineering,
Russia
International, Tunnelling, Services, Real Estate
Development, Infrastructure Development, Construction
Materials
Output volume (€m) 6,843 4,242 3,404
Order backlog (€m) 8,138 4,505 3,944
EBIT (€m) 199 205 62
EBIT margin (%) 3.1 5.0 2.4
Employees 23,366 17,916 25,618
4th, non-operating segment “Others”, output volume 1%, not shown
BUSINESS SEGMENT CONTRIBUTION 2017
29% of output volume
23% of output volume
47% of output volume
Investor Presentation February 20199

(€m) 2017 2016 %Output volume 14,621 13,491 8Revenue 13,509 12,400 9EBITDA 835 855 -2EBITDA adjusted 8271
EBIT 448 425 6EBIT adjusted 3971
Net income after minorities 279 278 0Cash flow from operating activities 1,345 264 409Cash flow from investing activities -333 -434 23Balance sheet total 11,054 10,378 7Group equity 3,398 3,265 4Equity ratio 30.7% 31.5%Net debt (+)/cash (-) -1,335 -449 -197Δ% was calculated with original, not rounded figures therefore, rounding differences may occur.
1 Adjusted for a non-operating profit in the amount of € 27.81 million.
KEY FINANCIALS
Investor Presentation February 201910

INTEGRATED MODEL TAKES ADVANTAGE OF ● local management skills● market knowledge● cost and efficiency synergies● risk diversification
COMPREHENSIVE COUNTRY NETWORK ENABLES STRABAG TO● make more use of technology and
machinery ● follow clients around the world
Only countries with a minimum annual output volume and a minimum order backlog of € 1 million are considered.
COMPREHENSIVE COUNTRY NETWORK
Investor Presentation February 201911

THE CONSTRUCTION SECTOR WITHIN EVOLVING GLOBAL THEMES
2

GERMANY: DAILY TRAFFIC LOAD 2030F
● By 2050 66% of the global population will live in cities (today: 54%) – an increase of the urban population by 2.5 billion.
Higher need for infrastructure● McKinsey: USD 57 trillion infrastructure investment
needed by 2030 to keep up with global economy, 4% annual growth rate for construction companies
● Significant need for rehabilitation and extension of the German transportation network within the next ten years – € 2.6 billion of additional investments p.a. necessary over 15 years according to Daehre Commission 2012
● Investments into German federal roads
2018e: € 13.9 billion / A-roads: € 7.2 billion
● “Bundesverkehrswegeplan 2030”: German investment plan with total sum of € 270 billion (focused on infrastructure in the Western part)
Sources: BMVI, Verkehrsverflechtungsprognose 2030 – Netzumlegungen, August 2015, Bundeshaushalt Einzelplan 12, Bundesverkehrswegeplan; Report of the Daehre Commission in December 2012; http://ec.europa.eu/cli; ma/policies/brief/eu/index_en.htm; „Voices on Infrastructure“, Global Infrastructure Initiative by McKinsey & Company
FIVE EUROPEAN TRENDS:(1) URBANISATION/DEMOGRAPHICS
Vehicles(thousands/day)
>9070-9050-7030-5020-3015-2010-15<10
Investor Presentation February 201913

0
45
Slovenia Germany Croatia Austria Hungary CzechRepublic
Slovakia Bulgaria Poland Romania
km m
otor
way
/ 1,
000
km2
1995 2006 2016Source: Eurostat
EXAMPLE:MOTORWAY DENSITY IN DIFFERENT MARKETS
Investor Presentation February 201914

● Investment of USD 48 trillion needed to just meet the world’s energy needs by 2035, according to McKinsey1
● EU: 2030 climate and energy framework sets 3 targets: At least 40% cuts in greenhouse gas emissions At least 27% share of renewable energy At least 27% improvement of energy efficiency
● Buildings account for the largest share of total EU final energy consumption (40%) and produce about 35% of all greenhouse gas emissions2
Clients increasingly ask for energy-efficient solutions, environmentally friendly products and a sustainable business conduct of suppliers.Own building materials network provides a high barrier to entry for other market participants, as the permits for building new mixing plants are not granted easily due to environmental concerns.
1 „Voices on Infrastructure: Rethinking engineering and construction“, Global Infrastructure Initiative by McKinsey & Company, October 20162 European Commission: http://ec.europa.eu/growth/sectors/construction_en (last accessed 24 August 2018)
FIVE EUROPEAN TRENDS:(2) ENERGY/SUSTAINABILITY
A2 Poland
Investor Presentation February 201915

● Historically low interest rates and highly volatile financial environment make real estate an attractive investment alternative for some investor groups
● Low financing costs facilitate investment into real estate
STRABAG Real Estate Development Tanzende Türme, Hamburg
FIVE EUROPEAN TRENDS:(3) FINANCIAL ENVIRONMENT
Investor Presentation February 201916
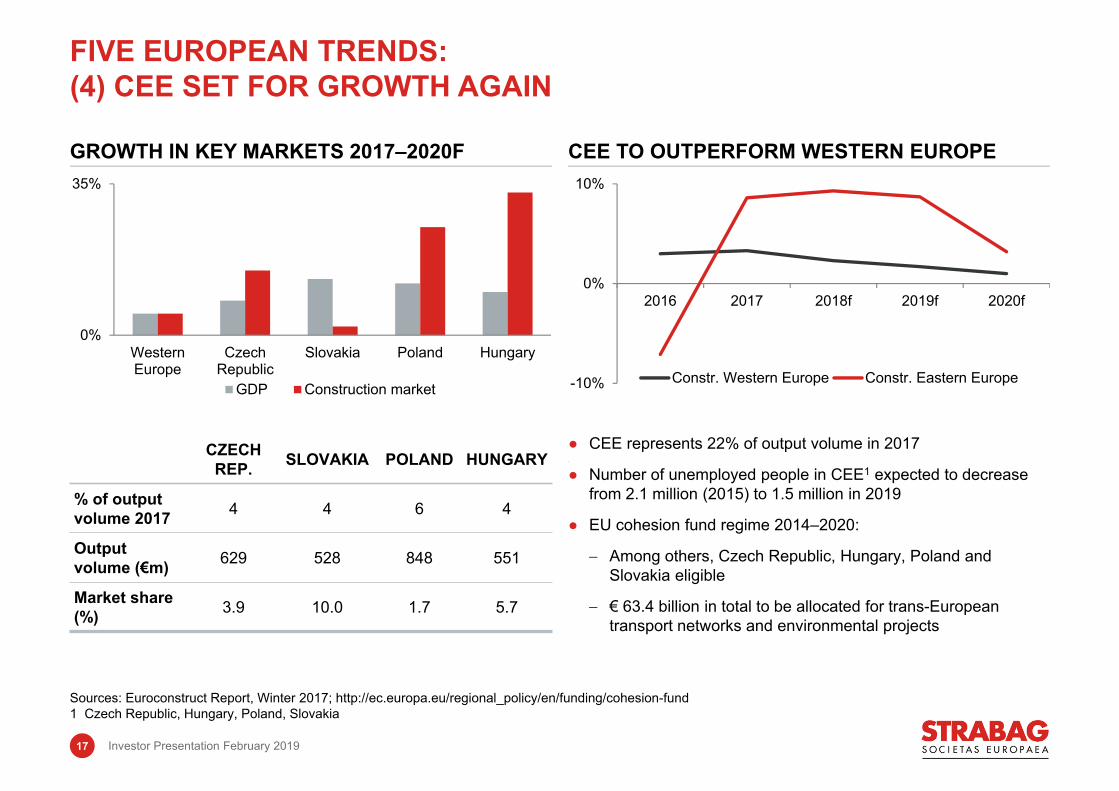
0%
35%
WesternEurope
CzechRepublic
Slovakia Poland Hungary
GDP Construction market
GROWTH IN KEY MARKETS 2017–2020F
CZECH REP. SLOVAKIA POLAND HUNGARY
% of output volume 2017 4 4 6 4
Output volume (€m) 629 528 848 551
Market share (%) 3.9 10.0 1.7 5.7
-10%
0%
10%
2016 2017 2018f 2019f 2020f
Constr. Western Europe Constr. Eastern Europe
CEE TO OUTPERFORM WESTERN EUROPE
● CEE represents 22% of output volume in 2017
● Number of unemployed people in CEE1 expected to decrease from 2.1 million (2015) to 1.5 million in 2019
● EU cohesion fund regime 2014–2020:
Among others, Czech Republic, Hungary, Poland and Slovakia eligible
€ 63.4 billion in total to be allocated for trans-European transport networks and environmental projects
Sources: Euroconstruct Report, Winter 2017; http://ec.europa.eu/regional_policy/en/funding/cohesion-fund 1 Czech Republic, Hungary, Poland, Slovakia
FIVE EUROPEAN TRENDS:(4) CEE SET FOR GROWTH AGAIN
Investor Presentation February 201917

CONSTRUCTION SECTOR LAGGING BEHIND REGARDING PRODUCTIVITY GAINS1
Less than 6% of construction companies use digital instruments for planning holistically.
<6%
Source: „Digitalisierung der Bauwirtschaft“, Roland Berger, 20161 Figures for Germany; period under consideration: 10 years
FIVE EUROPEAN TRENDS:(5) DIGITALISATION
Construction industry
4%Producing industry
27%Manufacturing industry
34%
of players in the construction sector agree that digitalisation will effect all their processes.
93%
Investor Presentation February 201918

-10%
0%
10%
2014 2015 2016 2017e 2018e
Residential Other building construction Civil
CONSTRUCTION SUBSEGMENTS GERMANY
-10%
0%
10%
2014 2015 2016 2017e 2018e
Germany Austria Eastern Europe
Public62%
Private38%
STRABAG CLIENT STRUCTURE
CONSTRUCTION OUTPUT BY COUNTRIES
● Public client:The price is mostly the dominant criterion.
● Private client:Often opts for the best offer, not necessarily the lowest.
Source: Euroconstruct
CONSTRUCTION SEGMENTS HAVE THEIR OWN BUSINESS MODELS AND CYCLES
Investor Presentation February 201919

SELECTION CRITERIA IN CONSTRUCTION
Financial strength
References
Technology& Innovation
Constructionmaterials supply
Experience andKnow-how of employees
Clients’ selection criteria
Price
Investor Presentation February 201920

THE STRABAG STRATEGY & INVESTMENT PROPOSITION
3

“STRABAG is a European-based technology group for construction services,
a leader in innovation and financial strength. We create added value for our
clients by integrating the most diverse services and assuming responsibility
for them: We bring together people, materials and machinery at the right place
and at the right time in order to realise even complex construction
projects – on schedule, of quality and at the best price.”
A EUROPEAN-BASED TECHNOLOGY GROUP FOR CONSTRUCTION SERVICES
STRABAG takes an agreed scope of responsibility and part of the risk, thereby relieving the client e.g. of the risk of delays and cost overruns.Professional and market experience as well as financial strength needed to create added valueHelps clients meet their goals (time, quality, lower costs)Technology/Innovation: Differentiation through superior technology and innovative solutions
Investor Presentation February 201922

SIX STRATEGIC FIELDS
Investor Presentation February 201923

(1) Margin Upside Strategic priority: Strengthening risk and opportunity management Strategic priority: Implementing efficiency-rising measures proposed by task force
(2) Flexible Business Model, Selective Diversity Strategic priority: Showing flexibility Strategic priority: Staying diversified Strategic priority: Offering top technology and sustainability
(3) Financial Strength Strategic priority: Maintaining financial strength
(4) Attractive Dividends on a reliable level
THE STRABAG INVESTMENT PROPOSITION
Investor Presentation February 201924

-3%
-3 %0%
-6%
8%
-8%
5%
2013 2014 2015 2016 2017 2018
5 %
2.1%2.3%
2.6%
3.2%
≥3.3%
0%
4%
2013 2014 2015 2016 2017 2018
3.3%
TARGET 2018 OF 3.3% EBIT MARGIN1
● Comprehensive risk management
TOP-LINE GROWTH NOT IN THE FOCUS
● Forecast for output volume 2018 should clearly exceed € 15.0 billion (+3%)
1 2016 adjusted for a non-operating profit in the amount of € 27.81 million; 2018 adjusted for a positive non-operating one-off due to the acquisition of the remaining 50 % interest in a German concession company in the amount of € 55.31 million
(1) MARGIN UPSIDE: TARGETS
8%
>3%
5%
Investor Presentation February 201925

● Four-eyes-principle
● Internal price committees (including a STRABAG SE board member when project volume ≥€ 70 m)
● Internal Audits
● Organisational structure with central divisions
● Management information system:
“We have developed a management information system that helps us to ensure that the same standards apply in all regions where STRABAG is active. This means: clear criteria for the assessment of new projects, a standardised process for the submission of bids and control systems serve as filters to avoid loss-bringing projects.”
Thomas Birtel, CEO
RISK MANAGEMENT INSTRUMENTS
● Joint Venture with the client
● Cost + fee
● Guaranteed maximum price
● Lump-sum
● Unit pricing
TYPES OF CONTRACTS
COMPOSITION OF THE ORDER BACKLOG
(1) MARGIN UPSIDE: RISK MANAGEMENT
14%Total of the ten largest projects in the order
backlog
12,443Construction sites
per year
Investor Presentation February 201926

(2) FLEXIBLE BUSINESS MODEL, SELECTIVE DIVERSITY: RESILIENCE IN A VOLATILE INDUSTRY
1 2016 adjusted for a non-operating profit in the amount of € 27.81 million.
OUTPUT VOLUME (€M) ORDER BACKLOG (€M)
EBITDA (€M) AND EBITDA MARGIN (%)1 EBIT (€M) AND EBIT MARGIN (%)1
13,573 13,566 14,290 13,491 14,621
0
20000
2013 2014 2015 2016 2017
13,470 14,40313,135
14,81616,592
0
20000
2013 2014 2015 2016 2017
397262 282 341
0
1000
2013 2014 2015 2016 2017
3.2%
2.1% 2.3%2.6%
3.3%
827
695 720816
0
1000
2013 2014 2015 2016 2017
6.9% 6.2%
5.6% 5.8%6.2%
835
448
20,000 20,000
1,000 1,000
Investor Presentation February 201927

Own40%
Sub-contractors
60%
SUBCONTR. BUILDING & CIVIL ENGINEERING
● Diversifying geographically
● Top market positions in stable home markets
● Offer services along the entire construction value chain
Own70%
Sub-contractors
30%
SUBC. TRANSPORTATION INFRASTRUCTURE
DIVERSIFIED PORTFOLIO BALANCES CYCLICAL/PROJECT-DRIVEN NATURE OF CONSTRUCTION
(2) FLEXIBLE BUSINESS MODEL, SELECTIVE DIVERSITY: SUBCONTRACTING AND PORTFOLIO MIX
Transportation Infrastructure
37%
Building Construction &
Civil Engineering 37%
Services 9%
International & Tunneling 9%
Construction Materials 6%
Project development & Concessions
2%
Own70%
Investor Presentation February 201928

● Asphalt mixing plants 2522
● Concrete mixing plants 1462
● Total quarries and gravel pits 1542
● Cement mixing plants 53
● Production of 3.9 million m³ of concrete, 15.8 million tons of asphalt and 1.2 million tons of cement in 2017
● Sales revenue of € 585 million in 2017
STRABAG FACILITIES1
● Hedge against price fluctuations, securing supply
● Existing quarries as effective entry barriers – lack of permits for new sites
● 30% in joint venture (at equity-consolidated since Q3/2011) with LafargeHolcim secures access to cement in Central and Eastern Europe
● Further optimisation of raw materials network and increased self-sufficiency except in asphalt
OWN COVERAGE OF MATERIAL NEEDS (%)
HIGHLIGHTS
1 December 20172 Includes active facilities from joint ventures and associates3 Thereof four in JV with LafargeHolcim (STRABAG share 30%) and one in another investment (STRABAG share 25.6%)
(2) FLEXIBLE BUSINESS MODEL, SELECTIVE DIVERSITY: OWN DENSE CONSTRUCTION MATERIALS NETWORK
0%
100%
Asphalt Concrete Cement Stone/Gravel2017 2016
18%
78%
26% 24%
78%
28% 28%17%
Investor Presentation February 201929

NUMBER OF STRABAG’S PPP1 PROJECTS SELECTED PPP PROJECTS
PPP STRATEGY SELECTED PPP PROJECTS
1 Public-Private Partnership/Build-Operate-Transfer
(2) FLEXIBLE BUSINESS MODEL, SELECTIVE DIVERSITY: STEADY INCOME THROUGH CONCESSION BUSINESS
Vocational schools, Germany Motorway A8, Germany
COUNTRY PROJECTTOTAL
COST (€M) % SHARECONCESSION
UNTIL STATUS
PL A2 Section II 1,543 10 2037 Operation
HU M5 Motorway 1,292 100 2031 Operation
HU M6 Motorway 966 50 2037 Operation
COL MAR1 893 37.5 2045 In progress
GER Schools,Mülheim 52 100 2045 Operation
GER Ministries, Potsdam 41 100 2035 Operation
● Focus on infrastructure and large public buildings● PPP/BOT1 in home markets, Eastern Europe and
increasingly in selected international markets (insufficient legal framework in some countries)
● Importance as public procurement method due to cost advantages
● High barriers to entry due to necessary PPP expertise and financial strength
36 37 34 35 38
0
50
2013 2014 2015 2016 2017
Investor Presentation February 201930

TARGET MARKETS
● Output 2017: € 1.1 billion
● ~ 10,000 employees (FTE)
● Broad range of customers: Airbus, Audi, Commerzbank, Deutsche Bahn, DFS, Hahn-Gruppe, ESPRIT, IMMOFINANZ, Jungheinrich, Nordex, ORSAY, RWE, Telefónica Deutschland, Vodafone, WealthCap, etc.
● Active in Germany, Austria, Hungary, Poland, Czech Republic, Slovakia
● #4 market position in German facility management (“Lünendonk” 2017 ranking)
● Long-term contract with client Deutsche Telekom AG will end June 2019
● Consolidated in the International + Special Divisions segment
KEY FACTS 2017
KEY ACCOUNTS
(2) FLEXIBLE BUSINESS MODEL, SELECTIVE DIVERSITY: PROPERTY & FACILITY SERVICES
Commerzbank Tower, Frankfurt, Germany
DFS Deutsche Flugsiche-rung HeadquartersFrankfurt, Germany
City Tower, Praha, Czech Republic
Investor Presentation February 201931

3D MODEL: DEFINING THE “TO BE BUILT” 4D – TIME: WHEN ARE WORKS EXECUTED?
5D – PROCESS: MATERIALS, ORDERS● Single data pool as an answer to specialisation
and growing number of companies involved● Risk management: Inconsistencies detected
earlier● Clients get a clearer picture of the impacts
resulting from alterations, renovations, additions● Budget and time overruns minimized
ADVANTAGES OF BIM 5D®
(2) OFFERING TECHNOLOGY AND SUSTAINABILITY: BIM 5D® COULD BE A REVOLUTION IN CONSTRUCTION
Investor Presentation February 201932

BIM 5D® ALSO APPLICABLE FOR TRANSPORTATION INFRASTRUCTURE PROJECTS
● 3D visualisation● Topographic mapping via drones and other
innovative hard- & software● Model-based quantity take-off during tender stage
and quantity on-site controlling in execution phase● Model-linked 4D time tables● Integrated logistics concepts and simulations● Model-based machine control on-site
Isometrics of a combined traffic & bridge construction model
(2) OFFERING TECHNOLOGY AND SUSTAINABILITY:INTELLIGENT PROCESS ENGINEERING
Investor Presentation February 201933

1.1 %
3.2 %
1.9 %1.5 %
0.6 %0.2 % 0.2 % 0.1 % 0.1 %
0%
4% % of total headcount
750 500 500450
150 125 105 100 900
2000 Number of employees ● Central Technical Division – organisation in charge of planning and execution of R&D projects
● Focus on building construction and civil engineering
● 24 locations
● TPA – organisation focused on optimising technical processes, workplace safety and quality
● Focus on transportation infrastructure
● STRABAG’s competence centre for quality management and construction R&D
● 130 locations
● Total R&D spending: ~ € 10-15 million p.a.
1 Analysis carried out by STRABAG R&D department in 2014
STRABAG AND PEERS: R&D/TECHNICAL DIVISION STAFF HEADCOUNT1
(2) OFFERING TECHNOLOGY AND SUSTAINABILITY: CASE STUDY – CENTRAL TECHNICAL DIVISION/TPA
Central Technical DivisionTPA
STRABAG Peers
STRABAG Peers
800
0
2,000
Investor Presentation February 201934

13.6% 13.8% 13.9% 14.9% 14.9%
8.6% 8.5% 8.7% 8.4% 9.0%
0%
16%
2013 2014 2015 2016 2017Women as % of management Women as % of staff
TARGET: GROW SHARE OF WOMEN IN TOTAL EMPLOYMENT AND MANAGEMENT EACH YEAR
(2) OFFERING TECHNOLOGY AND SUSTAINABILITY: EXAMPLE ON NON FINANCIAL TARGETS – WOMEN
Investor Presentation February 201935
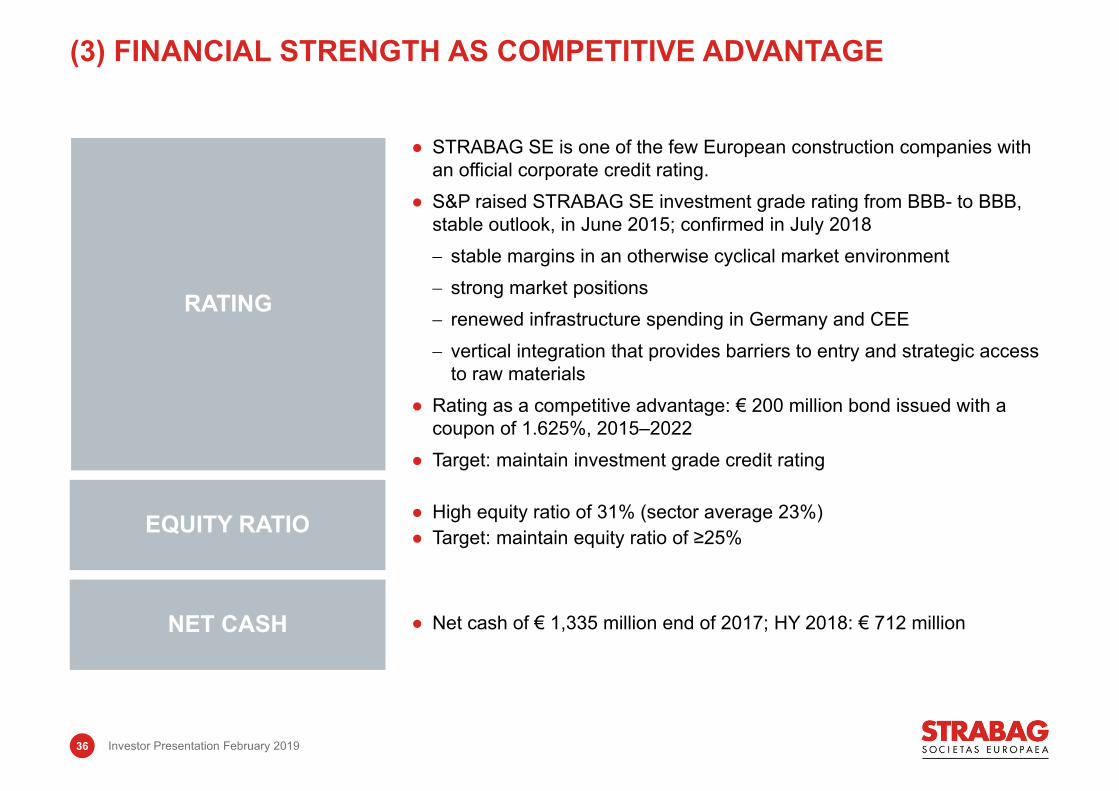
(3) FINANCIAL STRENGTH AS COMPETITIVE ADVANTAGE
RATING
● STRABAG SE is one of the few European construction companies with an official corporate credit rating.
● S&P raised STRABAG SE investment grade rating from BBB- to BBB, stable outlook, in June 2015; confirmed in July 2018 stable margins in an otherwise cyclical market environment strong market positions renewed infrastructure spending in Germany and CEE vertical integration that provides barriers to entry and strategic access
to raw materials● Rating as a competitive advantage: € 200 million bond issued with a
coupon of 1.625%, 2015–2022● Target: maintain investment grade credit rating
EQUITY RATIO
NET CASH
● High equity ratio of 31% (sector average 23%)● Target: maintain equity ratio of ≥25%
● Net cash of € 1,335 million end of 2017; HY 2018: € 712 million
Investor Presentation February 201936

DEBT REPAYMENT PROFILE (€M)
TERM INTEREST VOLUME ISIN
2012–2019 4.25% € 100 m AT0000A0V7D8
2013–2020 3.00% € 200 m AT0000A109Z8
2015–2022 1.625% € 200 m AT0000A1C741
● Cash and surety credit lines (31 December 2017): € 7.7 billion (thereof cash credit lines of € 0.4 billion)
● Bond issue: € 200 million, 1.625 %, 2015-2022
● € 2.0 billion syndicated surety loan (by 2023)
● € 400 million syndicated cash credit line (by 2023)
DIVERSIFIED MEANS OF FINANCING
CORPORATE BONDS
(3) FINANCIAL STRENGTH: DIVERSIFIED FINANCING
18.50
0
300
2019 2020 2021 2022
Bonds Bonded loan
100
200200
Investor Presentation February 201937

114 128156
278 2792.1%
0.9%
0.5 %
1.0%
0
350
2013 2014 2015 2016 2017
1.2%
2.2%
NET INCOME A.M. (€M) AND MARGIN (%)
2.72
1.11 1.251.52
2.71
0
3
2013 2014 2015 2016 2017
1.30
0.45 0.500.65
0.95
41% 40% 43%35%
48%
0%
100%
0
2
2013 2014 2015 2016 2017€
DIVIDEND (€) AND PAYOUT RATIO (%)
EARNINGS PER SHARE (€) DIVIDEND (€) AND PAYOUT RATIO (%)
(4) ATTRACTIVE DIVIDENDS:CONSISTENT PAYOUT RATIO
0%
0%
€
Investor Presentation February 201938

-14.8%
4.4%
-14.7%
3.4%
3.1%
2.4%-2.5%
-20%
50%
2013 2014 2015 2016 2017
Return from share price Return from dividends
3.6%
-14.7%
2.9%
2.4
42.7%
29.7%
1.1%%
(4) ATTRACTIVE DIVIDENDS: TOTAL SHAREHOLDER RETURN 2013–2017
Dividend policy: 30-50 % of net income after minorities distributed as a dividend
Ø dividend yield: 3.0%
Investor Presentation February 201939
Dividend yield based on average share price

FINANCIAL PERFORMANCE
4

Investor Presentation February 201941
9M/18: OUTPUT VOLUME ROSE BY 12 %
OUTPUT VOLUME (€M)
11,64610,383
14,621
0
20.000
9M/18 9M/17 2017
● Driven especially by German building construction & civil engineering business, Americas, Austria and Poland
12%
ORDER BACKLOG (€M)
18,16116,038 16,592
0
20.000
9M/18 9M/17 2017
13% ● Order backlog remains above € 18 billion
● Large orders from the group’s largest markets, e.g. Germany, Poland and Hungary
● Q2: triple-digit million-euro contract extension for Alto Maipo tunnelling project, Chile
20,000
20,000

Investor Presentation February 201942
571448
835
-100
1.000
9M/18 9M/17 2017
9M/18: EBITDA AND EBIT POSITIVELY IMPACTED BY ONE-OFF, UNDERLYING EARNINGS HIGHER AS WELL
EBITDA (€M)
● Positive non-operating one-off in the amount of € 55.31 million due to the acquisition of the remaining 50% interest in PANSUEVIA (“step-up”)
● EBITDA adjusted by one-off: € 516 million (+15%)
● Q3/18: EBITDA adjusted +6%
● Depreciation and amortisation decreased by 2%
● EBIT adjusted by one-off: € 244 million (+43%)
● Q3/18: EBIT adjusted +10%
27%
299
171
448
-100
500
9M/18 9M/17 2017
75%
1,000
EBIT (€M)

Investor Presentation February 201943
1.74
0.80
2.72
-1
3
9M/18 9M/17 2017
178
82
279
-100
300
9M/18 9M/17 2017
9M/18: NET INCOME AFTER MINORITIES MORE THAN DOUBLED
NET INCOME AFTER MINORITIES (€M)
● Net interest income at € -10 million after € -35 million in 9M/17, when negative internal exchange rate differences had burdened
● Earnings attributable to minority shareholders € 9 million (9M/17: € 5 million)
EARNINGS PER SHARE (€)
117%117%

Investor Presentation February 201944
(€m) 9M/18 2017Share capital 110 110Capital reserves 2,315 2,315Retained earnings 1,017 945Non-controlling interests 34 27Equity 3,477 3,398Provisions 1,139 1,161Financial liabilities 1,128 883Other liabilities 82 78Deferred taxes 105 24Non-current liabilities 2,456 2,145Provisions 672 747Financial liabilities 333 411Trade payables 3,684 3,402Other current liabilities 870 950Current liabilities 5,559 5,511Equity & Liabilities 11,492 11,054
(€m) 9M/18 2017Intangible assets 495 499Rights from concessionarrangements 622 0PP&E & investment property 2,080 1,942Equity-accounted investments 358 350Other investments 196 183Concession receivables 636 662Other receivables 238 271Deferred taxes 143 189Non-current assets 4,768 4,096Inventories 787 1,138Trade and other receivables 4,147 2,996Concession receivables 36 34Cash and cash equivalents 1,754 2,790Current assets 6,724 6,958
Assets 11,492 11,054
9M/18: HIGH EQUITY RATIO DESPITE BALANCE SHEET GROWTH
ASSETS1 EQUITY AND LIABILITIES1
1 Rounding differences might occur.

Investor Presentation February 201945
(€m) 9M/18 ∆% 9M/17Cash – beginning of period 2,790 40 1,998
Cash flow from earnings 413 31 316
∆ Working Capital -522 -30 -400
Cash flow from operating activities -109 -28 -85
Cash flow from investing activities -473 -95 -242
Cash flow from financing activities -437 -120 -199
Net change in cash -1,018 -94 -525
FX changes -18 n.m. 2
Change restricted cash -1 n.m. 1
Cash – end of period 1,753 19 1,474
9M/18: STRONGER WORKING CAPITAL INCREASE, HIGHER INVESTMENTS
Rounding differences might occur.

Investor Presentation February 201946
48% of group output volume
9M/18: NORTH + WEST: GOOD WEATHER AND GOOD BUSINESS IN GERMANY
KEY INDICATORS● Output volume increased by 15%
● EBIT higher by 71%; reflected good economic activity in the German TI segment
● Growth in orders 19%; large orders, among others:
Oldenburg–Wilhelmshaven rail upgrade line, Germany
Further sections of S7 and A1, Poland
Copenhagen’s Carlsberg quarter, Denmark
ODE building in Amsterdam, Netherlands
● Outlook:
Output volume 2018 expected to surpass last year’s record
German BC&CE should continue to contribute positively to output volume and earnings despite tense situation on subcontractor market
Excellent year for TI, but labour remains a limiting factor
Poland: capacity shortage led to double-digit percent price increases last year, but high order backlog enables greater project selection
COMMENTS
SHARE OF GROUP OUTPUT VOLUME
BC&CE: Building Construction & Civil EngineeringTI: Transportation Infrastructures
(€m) 9M/18 Δ% 9M/17
Output volume 5,556 15 4,814
Revenue 5,015 11 4,517
Order backlog 9,162 19 7,697
EBIT 44 71 25
EBIT margin % 0.9 0.6
Employees 23,969 4 23,146

Investor Presentation February 201947
(€m) 9M/18 Δ% 9M/17
Output volume 3,324 9 3,044
Revenue 3,189 15 2,769
Order backlog 4,903 16 4,238
EBIT 92 -34 139
EBIT margin % 2.9 5.0
Employees 18,434 4 17,644
9M/18: SOUTH + EAST: HIGH DEMAND FOR PERSONNEL AND SUBCONTRACTOR SERVICES WEIGHS ON MARGINS
KEY INDICATORS
● Output volume climbs by 9% thanks to Austria, Croatia and Hungary
● EBIT fell by 34%; tense markets for human resources and subcontractor services and unusually strong margins in 2017
● Order backlog +16%, mainly driven by TI projects in Hungary and BC projects in Austria
● Outlook:
Output volume expected to continue to grow with attractive margins in 2018
Situation in Austria remains positive
Falling margins in Czech Republic and Slovakia
Working off high order backlog in Hungary is a challenge
COMMENTS
SHARE OF GROUP OUTPUT VOLUME
TI: Transportation Infrastructures; BC: Building Construction
29% of group output volume

Investor Presentation February 201948
9M/18: INTERNATIONAL + SPECIAL DIVISIONS REPORTS ENORMOUS GROWTH IN EBIT
KEY INDICATORS● Output volume up by 11% due to the work on large projects
in the Americas
● Sale of real estate developments and the absence of burden from large international projects benefitted earnings
● Order backlog stable:
Contract extension for Alto Maipo project, Chile
1.7 km Boyneburg tunnel, Germany
13 km tunnel sector for Woodsmith Mine, UK
Backlog fell in Italy and Austria, among others
● Outlook:
Output volume 2018 should be comparable to 2017, improved earnings expected
Real estate development, property & facility services and existing public-private partnerships should continue to make very positive earnings contributions
International focus in southeast Africa and internationally financed projects
COMMENTS
SHARE OF GROUP OUTPUT VOLUME
(€m) 9M/18 Δ% 9M/17
Output volume 2,684 11 2,419
Revenue 2,462 20 2,051
Order backlog 4,093 0 4,099
EBIT 126 413 24
EBIT margin % 5.1 1.2
Employees 26,181 1 25,815
23% of group output volume

2,344
3,436
3,932 3,854
2,468
3,736 4,051 4,034
2,257
3,420
3,884 3,930
2,427
3,828 4,129 4,238
2,600
4,276
4,770
-16456 172 218
-15991 184 225
-145125 197 249
-143110 203
-,500
5,000
Q1/14 Q2/14 Q3/14 Q4/14 Q1/15 Q2/15 Q3/15 Q4/15 Q1/16 Q2/16 Q3/16 Q4/16 Q1/17 Q2/17 Q3/17 Q4/17 Q1/18 Q2/18 Q3/18
Output volume EBIT
QUARTERLY DEVELOPMENT OF OUTPUT VOLUME AND EBIT (€M)
1 EBIT/revenue
HIGHLY SEASONAL BUSINESS
3.9%6.7%
-7.6%
EBIT
mar
gin1
-1.8% 4.9% 6.1%
-7.0%2.6% 4.9% 6.2%
-6.9%3.2%
5.5%
-5.9%
6.4%
500 -139279
-6.5%
7.2%5.4%
278
Investor Presentation February 201949
159
4.0%

Germany47%
Austria16%
CEE22%
Rest of Europe9%
Rest of world6%
OUTPUT VOLUME 2017 BY REGION
14,62113,491
0
20000
2017 2016
● Output volume rose by 8% to € 14.6 billion
● Especially strong increase in German transportation infrastructure and Austrian building construction
German share in group output volume continually rising
● Upward trend also in CEE core markets
OUTPUT VOLUME (€M)
OUTPUT VOLUME INCREASED IN NUMEROUS MARKETS
+8%20,000
Investor Presentation February 201950

Germany42%
Austria12%
CEE25%
Rest of Europe10%
Rest of world11%
ORDER BACKLOG 2017 BY REGION
16,59214,816
0
20000
2017 2016
ORDER BACKLOG (€M)
SEVERAL LARGE CONTRACTS LED TO RECORD ORDER BACKLOG
+12%20,000 ● Several large orders from diverse fields and
markets:
Transportation infrastructure in Hungary and Poland
Building construction and civil engineering in Germany
Tunnelling in Singapore
Investor Presentation February 201951

448 425
0
1000
2017 2016
EBIT (€M) AND EBIT MARGIN (%)
835 855
0
1000
2017 2016
● EBITDA 2016 clean of non-operating non-recurringitem: € 827 million, EBITDA margin 6.7%
● Earnings improvements in several markets, e.g. Germany
● Recognition of a receivable from a concessionproject
● EBIT clean of non-operating non-recurring item: € 397 million, EBIT margin 3.2%
● Extraordinary depreciation allowances significantlyreduced
● All three operative segments contrbuted toearnings improvement
EBITDA (€M) AND EBITDA MARGIN (%)
EBIT HIGHER DESPITE POSITIVE ONE-OFF IN 2016,EBIT MARGIN AT 3.3% – TARGET OF ≥3.0% SOLIDLY ACHIEVED
-2%
+6%
6.2% 6.9%
3.3% 3.4%
1,000
1,000
Investor Presentation February 201952

279 278
0
300
2017 2016
NET INCOME A. MINORITIES (€M) & MARGIN (%)
2.72 2.71
0
3
2017 2016
EARNINGS PER SHARE (€)
EARNINGS PER SHARE STABLE
0%0%
2.1% 2.2%
● Net interest income strongly worsened due to absence of positive foreign currency effects
● Effective tax rate at 30.6% slightly improved (2016: 33.0%)
● Earnings owed to minority shareholders increased from € 4 million to € 13 million, as in 2016 minority shareholders, which still existed at that time, helped to carry winter losses
● Squeeze-out at STRABAG AG, Germany, only completed on 29 December 2017
Investor Presentation February 201953

(€m) 2017 2016 Δ%Output volume 14,620.89 13,491.03 8Revenue 13,508.72 12,400.46 9
Changes in inventories/own work capitalised -48.09 55.55 n.m.
Other operating income 282.99 235.83 20
Construction materials, consumables and services used -8,839.87 -7,980.01 -11
Personnel cost -3,367.17 -3,210.91 -5Other operating expenses -842.79 -795.85 -6Share of profit or loss of associates 123.99 106.18 17Net income from investments 16.80 43.93 -62EBITDA 834.58 855.18 5EBITDA adjusted 827.371
Δ% was calculated with original, not rounded figures therefore, rounding differences might occur.
1 Adjusted for a non-operating profit in the amount of € 27.81 million.
GROUP INCOME STATEMENT 2017
Investor Presentation February 201954

(€m) 2017 2016 Δ%EBITDA 834.58 855.18 5Margin (%) 6.2 6.9Margin adjusted (%) 6.71
Depreciation and amortisation -386.22 -430.27 9EBIT 448.36 424.91 25EBIT adjusted 397.101
Margin (%) 3.3 3.4Margin adjusted (%) 3.21
Net interest income -27.15 -3.78 85Income tax expense -128.85 -139.13 -4Net income 292.36 282.00 55Attributable to minority interest 13.45 4.35 -83Attributable to equity holders of the parent 278.91 277.65 78Earnings per share (€) 2.72 2.71 78Δ% was calculated with original, not rounded figures therefore, rounding differences might occur.
1 Adjusted for a non-operating profit in the amount of € 27.81 million.
GROUP INCOME STATEMENT 2017 (CONT.)
Investor Presentation February 201955

0.45 0.50 0.65 0.95 1.30
41% 40% 43% 35% 48%
0%
100%
0
2
2013 2014 2015 2016 2017
● Dividend per share of € 1.30 proposed (+37%)
● Payout ratio of 48% at higher end of predetermined payout range of 30–50% of net income after minorities
● STRABAG has distributed a dividend within the predetermined payout range every year since the IPO in 2007
(PROPOSED) DIVIDEND (€) AND PAYOUT RATIO (%)
HIGHEST DIVIDEND SINCE IPO PROPOSED: € 1.30 PER SHARE
€
€
Investor Presentation February 201956

(€m) 2017 2016Share capital 110 110Capital reserves 2,315 2,315Retained earnings 945 761Non-controlling interests 27 79Equity 3,398 3,265Provisions 1,161 1,112Financial liabilities 883 1,224Trade payables & other liab. 78 63Deferred taxes 24 21Non-current liabilities 2,145 2,420Provisions 747 810Financial liabilities 411 203Trade payables 3,402 2,818Other current liabilities 950 862Current liabilities 5,511 4,693Equity & Liabilities 11,054 10,378
(€m) 2017 2016Intangible assets 499 496PP&E & investment property 1,942 1,936Associated companies 350 348Other financial assets 183 167Concession receivables 662 683Trade and other receivables 271 254Deferred taxes 189 246Non-current assets 4,096 4,130Inventories 1,138 1,183Trade and other receivables 2,996 3,031Concession receivables 34 31Cash and cash equivalents 2,790 2,003Current assets 6,958 6,248
Total assets 11,054 10,378
ASSETS LIABILITIES AND EQUITY
Rounding differences might occur.
HIGH EQUITY RATIO AND NET CASH POSITION
Investor Presentation February 201957

-74-249
-1,094
-449
-1,335-1500
0
1500
2013 2014 2015 2016 2017
NET DEBT (+)/NET CASH (-) (€M)
30.7% 30.6% 31.0% 31.5% 30.7%
0
0
2013 2014 2015 2016 2017
● Equity ratio remains at 31%; target: ≥25%
● Net cash position at untypically high level
Uncharacteristically high advance payments in the fourth quarter 2017
Normalisation expected over 2018
● S&P confirmed corporate credit rating of BBB (outlook: stable) in July 2017
NET CASH POSITION EXPANDED AND HIGH EQUITY RATIO MAINTAINED
40
EQUITY RATIO (%)1,500
-1,500
Investor Presentation February 201958

(€m) 2017 ∆% 2016
Cash – beginning of period 1,998 -27 2,727
Cash flow from earnings 634 -8 690
∆ Working Capital 711 n.m. -426
Cash flow from operating activities 1,345 409 264
Cash flow from investing activities -333 23 -434
Cash flow from financing activities -235 58 -564
Net change in cash 777 n.m. -734
FX changes 10 100 5
Change restricted cash 5 n.m. 0
Cash – end of period 2,790 40 1,998
Rounding differences might occur.
CASH AND CASH EQUIVALENTS OF € 2.8 BILLION
Investor Presentation February 201959

0
4000
Cash1.1.2017
CFO CFI CFF Currencytranslation
Restrictedcash
Cash31.12.2017
1,998
1,345
-333-235 10
2,790
5
CASH DEVELOPMENT (€M)
● Unusually strong working capital reduction
● Lower investments in property, plant and equipment
COMMENTS
CFO: Cash flow from operating activities CFF: Cash flow from financing activities CFI: Cash flow from investing activities (net CAPEX)
CASH AT € 2.8 BILLION
4,000
Investor Presentation February 201960

-19-209 -139
552
-107-263
-49
1,001
-418 -330-172
494
-64-206 -122
1,103
-1300
0
1300
Q1 Q2 Q3 Q4 Q1 Q2 Q3 Q4 Q1 Q2 Q3 Q4 Q1 Q2 Q3 Q42014 2015 2016
WORKING CAPITAL PATTERN: CASH OUTFLOWS IN Q1–3; INFLOWS IN Q4 (€M)
COMMENTS
● Working capital outflows generally occur over the first nine months of the year due to business seasonality
● Unusually high improvement of working capital in Q4/2015 and Q4/2017 due to uncharacteristically high advance payments – reversal in 2018 expected
EXTRAORDINARILY HIGH CASH INFLOW IN Q4/2017
2017
1,300
-1,300
Investor Presentation February 201961

582
-426
711
-800
0
800
2015 2016 2017
Δ WORKING CAPITAL (€M)
1,240
264
1,345
320434
333
0
1500
2015 2016 2017
CFO VS. CFI (€M)
320434
333475 430 386
0
1000
2015 2016 2017
CFI VS. DEPRECIATION (€M)
FCF OF OVER € 1 BILLION IN 2017
1,500 1,000
● Exceptionally high FCF in 2015 and 2017
● Purchase of PP&E at € 458 million (2016: € 412 million), thereof ~ € 250 million maintenance CAPEX
● 2017 depreciation includes goodwill impairment of € 2 million (2016: € 5 million)
● Extraordinary depreciation allowances significantly reduced in 2017
Investor Presentation February 201962

47% of group output
volume
KEY INDICATORS
● Output volume 11% higher
● EBIT rose due to stronger project earnings
● Order backlog (+16%) driven again to new recordlevel by Germany and Poland
● Outlook:
Order backlog hints at higher output volume in 2018
Germany: Positive outlook for buildingconstruction and civil engineering as well as fortransportation infrastructure
Capacities increasingly scarce
Poland: especially positive in rail construction, higher activity in building construction and civilengineering
Scandinavia: Lasting upward trend
COMMENTS
SHARE OF GROUP OUTPUT VOLUME
NORTH + WEST BENEFITS FROM GERMANY
(€m) 2017 Δ% 2016
Output volume 6,843 11 6,175
Revenue 6,378 10 5,802
Order backlog 8,138 16 7,030
EBIT 199 17 170
EBIT margin % 3.1 2.9
Employees 23,366 5 22,233
Investor Presentation February 201963

29% of group output volume
(€m) 2017 Δ% 2016
Output volume 4,242 6 4,001
Revenue 4,073 5 3,889
Order backlog 4,505 29 3,483
EBIT 205 9 188
EBIT margin % 5.0 4.8
Employees 17,916 1 17,758
KEY INDICATORS
● Output volume increased by 6%, driven by Austria, Hungary and Slovakia
● EBIT 5% higher due to improvements in severalcountries
● Order backlog soared (+29%)
● Outlook:
Increase in output volume expected for 2018
Furher dynamic building construction in thegreater Vienna region and fierce competition in Austrian transportation infrastructure business
Subcontractor prices rising above all in Slovakia, Czech Republic and Hungary
COMMENTS
SHARE OF GROUP OUTPUT VOLUME
SOUTH + EAST: STRONG AT A HIGH LEVEL
Investor Presentation February 201964

23% of group output volume
● Output volume down especially due to Italy
● EBIT hardly changed in absolute terms – number of contrary effects related to large projects
● Order backlog coined by tunnelling project for Chilean copper mine
● Outlook:
Output volume 2017 should increase slightly
Property and facility services business as well as real estate development contribute positively to earnings
Very competitive market for tunnelling and concession projects
KEY INDICATORS
● Output volume rose by 8% due to large projects in Austria, Germany and Americas
● EBIT +28%: recognition of a receivable from a concession project, settlement agreement in Middle East, burden again stemming from projectAlto Maipo, Chile
● Order backlog down by 8%: reduction of Italianproject Pedemontana
● Outlook:
Output volume 2018 should increase slightly
Real estate development continues to contributepositively to earnings
Property and facility services business: Agreement with future service provider ofDeutsche Telekom regarding transition ofemployees concluded
COMMENTS
SHARE OF GROUP OUTPUT VOLUME
INTERNATIONAL + SPECIAL DIVISIONS: EARNINGS PLUS AFTER NUMBER OF CONTRARY EFFECTS
(€m) 2017 Δ% 2016
Output volume 3,404 8 3,155
Revenue 3,029 13 2,681
Order backlog 3,944 -8 4,295
EBIT 62 28 49
EBIT margin % 2.1 1.8
Employees 25,618 -2 26,027
Investor Presentation February 201965

APPENDIX5

1 CAGR over period 2013–2017
OUTPUT VOLUME BY COUNTRY
(€m) 2013 2014 2015 2016 2017 CAGR1 (%)Germany 5,789 6,080 6,256 6,270 6,960 5Austria 1,982 2,058 2,003 2,099 2,333 4Poland 787 817 941 774 848 2Czech Republic 645 620 765 631 629 -1Hungary 496 544 594 448 551 3Slovakia 340 427 716 461 528 12Americas 263 255 310 348 385 10Switzerland 386 359 343 378 320 -5Middle east 323 272 314 267 303 -2Benelux 400 324 302 309 294 -7Other European Countries 81 169 167 150 277 36Romania 322 181 241 254 183 -13Sweden 315 271 240 179 162 -15Denmark 152 197 219 234 159 1Russia 561 302 230 139 143 -29Croatia 133 121 68 78 120 -3Serbia 31 38 46 89 113 38Asia 103 87 92 131 99 -1Italy 168 179 188 82 67 -21Slovenia 67 68 98 65 53 -6Africa 165 158 120 78 48 -27Bulgaria 20 39 35 27 45 23Total 13,530 13,566 14,290 13,491 14,621 2
Investor Presentation February 201967

2016 (€M) CONSTRUCTION OUTPUT STRABAG OUTPUT MARKET SHARE (%)
Germany 310,809 6,270 2.0
Austria 34,948 2,097 6.0
Poland 44,936 774 1.7
Czech Republic 16,450 631 3.8
Hungary 7,480 448 6.0
Russia 113,567 139 0.1
Slovakia 4,615 461 10.0
Romania 46,970 254 0.5
Croatia 2,977 78 2.6
Slovenia 2,257 65 2.9
Serbia 2,145 89 4.1
Bulgaria 6,077 27 0.4
Switzerland 63,351 378 0.6
Benelux 114,993 309 0.3
Sweden 40,698 179 0.4
Italy 164,411 82 <0.1
Denmark 30,113 234 0.8
Sources: Euroconstruct Summer 2017, EECFA Country Reports Summer 2017, company data
STRABAG MARKET SHARE DATA
Investor Presentation February 201968

Sources: Companies’ Annual Reports; Deutsche Bauindustrie; Časopis Stavitel; OPTEN; Deloitte; 1 Habau and Rhomberg Gruppe listed with total revenue.
MARKET LEADING POSITIONS IN CENTRAL AND EASTERN EUROPEAN COUNTRIES
AUSTRIA
Output volume/Revenue 2016 (€m)
1. STRABAG 2,099
2. Porr 2,055
3. Swietelsky 1,278
4. Habau 1,1941
5. Rhomberg Gruppe 6901
GERMANY
Output volume/Revenue 2016 (€m)
1. STRABAG 6,270
2. Vinci 2,689
3. Goldbeck 1,664
4. Zech Group 1,335
5. Max Bögl 1,238
CZECH REPUBLIC
Output volume/Revenue 2016 (€m)
1. Metrostav 689
2. STRABAG 583
3. Skanska 407
4. Eurovia 354
5. Swietelsky 225
POLAND
Output volume/Revenue 2016 (€m)
1. Budimex 1,260
2. Skanska 857
3. STRABAG 774
4. Polimex-Mostostal 603
5. PBG 449
WESTERN EUROPE
EASTERN EUROPEHUNGARY
Output volume/Revenue 2016 (€m)
1. STRABAG 375
2. Market 295
3. KÉSZ 240
4. Swietelsky 200
5. Duna aszfalt 180
Investor Presentation February 201969

Sources: Companies’ Annual Reports; Trend Top v Stavebnictve 05/2017; ajpes.si; bonitete.si, www.fininfo.hr, Ministry of finance Romania
MARKET LEADING POSITION IN CENTRAL AND EASTERN EUROPEAN COUNTRIES (CONT.)
SLOVAKIA
Output volume/Revenue 2016 (€m)
1. STRABAG 470
2. Eurovia 112
3. Goldbeck 103
4. Vahostav 102
5. SAG 94
CROATIA
Output volume/Revenue 2016 (€m)
1. Kamgrad 107
2. STRABAG 78
3. Tehnika 76
4. GP Krk 70
5. ZM 60
SLOVENIA
Output volume/Revenue 2016 (€m)
1. Kolektor Koling + CPG 136
2. Pomgrad 95
3. CGP 92
4. STRABAG 59
5. Gorenjska 53
ROMANIA
Output volume/Revenue 2016 (€m)
1. STRABAG 254
2. Bog'Art 109
3. Porr 92
4. Hidroconstructia 88
5. Construcii Erbasu 83
Investor Presentation February 201970
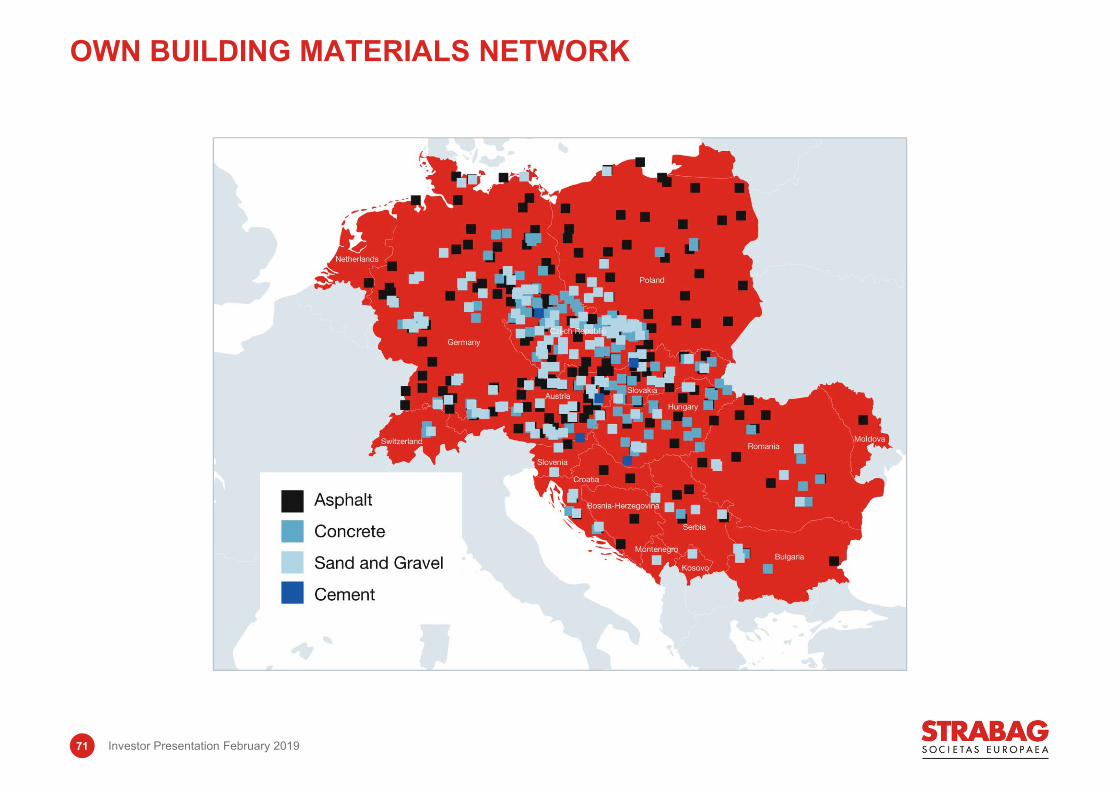
OWN BUILDING MATERIALS NETWORK
Investor Presentation February 201971

● The SPV1 is financed with equity (10%–30%) and bank debt (70%–90%)
● STRABAG – as a shareholder in the SPV –puts in equity
● Other SPV shareholders are e.g. governments, infrastructure funds and developers or other construction companies.
● The grantor pays a fee to the SPV which is used for construction, maintenance, repaying debt and paying dividends to equity partners.
● Availability and hard toll projects, forfeiting models ● Maintenance part of availability fee linked to
inflation● WACCs differ according to risk: 6%–13%● ROE targets: minimum 12%● Share of equity currently invested and committed:
€ 427 million (as at end of 2017)
TYPICAL FINANCING
410 378 370 400 427
0
700
2013 2014 2015 2016 2017
EQUITY INVESTED IN PPP (€M)
1 Special Purpose Vehicle
FINANCING PPP-PROJECTS
Investor Presentation February 201972

ILLUSTRATIVE PPP PROJECT STRUCTURE
SPC / Project Consortium / Company
Grantor
Construction Joint Venture(EPC – Contract)
Operations & Maintenance Company
STRABAG
[Public Entity]
Lenders
Insurance Providers
Project/Concession Contract
Funding Agreements
InsuranceContracts
Turnkey Design andConstruction
ContractOperations & Maintenance
Contract
ShareholdersAgreement
STRABAG
CJV Partner(s)
Partner(s)
IndependentEngineer
IndependentEngineer
Agreement
DEBT
EQU
ITY
A-Way
OJV Partner(s)
Investor Presentation February 201973

2008 Acquisition of Deutsche Telekom Immobilien und Services GmbH | Germany
2010 ● Acquisition of RIMEX Group | Germany● Acquisition of ECM Facility a.s. | Czech Republic
2012
2014
Acquisition of BWG (GSW Betreuungsgesellschaft f. Wohnungs- und Gewerbebau mbH) | GermanyAcquisition of DIW Instandhaltung | Germany
● Offsets seasonal and cyclicality factors (contracts of 3-5 years duration)
● One integrated provider for planning, construction and operation of properties
● Long-term relationship with customers, that does not end after the construction project has finished
● Growth opportunities through international market access and rising importance of lean real estate operations
EXTENDING THE VALUE CHAIN
● Real Estate Management Property Management Leasing and letting/area management
● Technical Facility Management
● Infrastructural Facility Management including technical cleaning and industrial services
● Extend business with new and existing customers
● Stable output volume of approx. € 1 billion (Deutsche Telekom accounts for approx. 60% of German revenues)
● Enter new market segments
● Set up real estate services 4.0: establish semi-automated order management by 2018, development of scalable products regarding BIM within existing buildings, sensor use cases and use of artificial intelligence.
TARGETS FOR 2018
BUSINESS SEGMENTS MILESTONES
PROPERTY & FACILITY SERVICES: STRATEGIC RATIONALE & TARGETS
Investor Presentation February 201974

Haselsteiner Family26.4%
UNIQA/Raiffeisen27.5%Rasperia Trading
25.9%
Free float13.5%
Treasury shares6.7%
SHAREHOLDER STRUCTURE SINCE 7/2016
● Core shareholders account for the majority >80% stake
● Shareholders’ syndicate extended in June 2017 by five years to end of 2022
● Flexibility: Strategic decisions can be taken and implemented very fast.
● Reduction of share capital in 2016: Withdrawal of 4 million own shares; share capital as at 22 July 2016: € 110,000,000
COMMENTS
STABLE SHAREHOLDER STRUCTURE
Investor Presentation February 201975

1 BMTI: equipment and vehicle management2 TPA: quality management, health/safety/environment and energy management, technical consultation, quality assurance, innovation management3 CML: prequalification, contract management and legal services
ORGANISATION – CENTRAL UNITS
ORGANISATIONAL STRUCTURE
Operative Segments
North + West
1 Board Member
4 DivisionsDivision Managers
37 SubdivisionsSubdivision Managers
South + East
1 Board Member
6 DivisionsDivision Managers
35 SubdivisionsSubdivision Managers
CEO
1 DivisionDivision Managers
3 SubdivisionsSubdivision Managers
International + Special Divisions
1 Board Member
8 DivisionsDivision Managers
25 SubdivisionsSubdivision Managers
BRVZAccounting, Financing, Taxes, IT, Human
Resources, Real Estate, Insurance, Project-Related Risk Management System (PRMS)/
Organisational Development, International BRVZ Coordination, Management Support
BMTI1 TPA2 CML3
Internal Auditing Corporate Communications
Zentrale Technik
Business Compliance
Central Divisions & Central Staff Divisions
CEO
CFO
As of 1 February 2018
Investor Presentation February 201976

Thomas Birtel, CEO (centre) ● Joined STRABAG in 1996● Management Board member since 2006● Born 1954 Education: Economics
Christian Harder, CFO (left) ● Joined STRABAG in 1994● Management Board member since 2013● Born 1968 Education: Business Administration
Alfred Watzl, Head of North + West Divisions segment (second right) ● Joined STRABAG in 1999● Management Board member since 2019● Born 1970 Education: Civil Engineering
Peter Krammer, Head of South + West segment (second left) ● Joined STRABAG in 1998● Management Board member since 2010● Born 1966 Education: Civil Engineering
Siegfried Wanker, Head of International + Special Devisions segment (right) ● Joined STRABAG in 1994● Management Board member since 2011● Born 1968 Education: Civil Engineering
LONG RECORD OF EXPERIENCE WITHIN STRABAG AND IN THE CONSTRUCTION SECTOR
THE MANAGEMENT BOARD
Over
100years combined experience at STRABAG
Investor Presentation February 201977

Company Date Title Target Price Rating
Commerzbank 12.2.2019Q4 output above but outlook sounds cautious € 42.0 Buy
Erste Group 15.2.2019Starke vorläufige Zahlen 2018 sowie ermutigender Ausblick 2019 € 42.9 Buy
RCB 13.2.2019Minor model update after confident FY 19 outlook € 38.5 Buy
Kepler Cheuvreux 23.1.2019 Reassuring presentation € 34.0 Hold
HSBC 14.1.2019 More light than shower € 35.0 Buy
LBBW 3.12.20182018 sollte für Strabag zu einem weiteren Rekordjahr werden € 38.0 Buy
Kepler Cheuvreux 30.11.2018 Solid 9M results € 34.0 Hold
Deutsche Bank 30.5.2018Solid start, FY output guidanceconservative € 40.0 Buy
MainFirst Bank 7.7.2017Transforming STRABAG – but to what extent? € 38.0 Neutral
STRABAG SHARE IS COVERED BY EIGHT INSTITUTIONS
Investor Presentation February 201978

0%
15%
2017 2018F 2019F
Construction total ResidentialNon-residential Public/CivilGDP growth
GROWTH IN CONSTRUCTION SEGMENTS● STRABAG is the German market leader with 2.0%
market share, 9.1% in road construction● Persistently good economic activity due to strong
increase in private consumption and public investment
● Germany should be able to keep the high level in public/civil it will have reached in 2018/19
● „Bundesverkehrswegeplan“: € 270 billion public investment into transportation infrastructure by 2030, thereof approx. 50% into A-roads
● Special need to catch up investment in bridges● A weakening is also not to be expected in building
construction by 2019● Strong need for living space, political goal:
400,000 residential units per year by 2020● Energy efficiency is one of the central goals of the
German government („Klimaschutzplan 2050“)
COMMENTS
Sources: Hauptverband der deutschen Bauindustrie May 2018; Euroconstruct June 2017
GERMANY: STRONG GROWTH IN HOME MARKET
Investor Presentation February 201979

0 90
DenmarkNetherlands
BelgiumIreland
SwedenSlovenia
AustriaBulgariaCroatia
SlovakiaCzech Republic
HungaryGermanyRomania
ItalyPoland
BUDGET EUROPEAN FUNDS1 2014–2020 (€BN)
● STRABAG – little to no direct exposure to UK
● But Brexit has a big indirect influence: UK payments to EU = payments of 20 smallest countries
● Given the reduced EU budgets as of 2021, funds for infrastructure projects could be retrieved to a greater extent in the nearer future
1 Source: European Commission; European structural and investment funds; only countries with STRABAG presence shown
BREXIT – IMPLICATIONS ON STRABAG
Investor Presentation February 201980

● Annual Report 2018 29 April 2019● Interim Report January–March 2019 29 May 2019● Annual General Meeting 2019 28 June 2019● Semi-Annual Report 2019 30 August 2019● Interim Report January–September 2019 28 November 2019
Diana Neumüller-Klein, CFAHead of Investor Relations & Corporate Communications+43 1 [email protected]
www.strabag.com
FINANCIAL CALENDAR AND IR CONTACT
Investor Presentation February 201981