stormwater management network effectiveness and
TRANSCRIPT

Received: 14 March 2017 Accepted: 24 August 2017
DO
I: 10.1002/hyp.11347S I U R BAN HYDRO LOGY
Stormwater management network effectiveness andimplications for urban watershed function: A critical review
Anne J. Jefferson1 | Aditi S. Bhaskar2 | Kristina G. Hopkins3 | Rosemary Fanelli4 |
Pedro M. Avellaneda1,5 | Sara K. McMillan6
1Department of Geology, Kent State
University, Kent, Ohio, USA
2Department of Civil and Environmental
Engineering, Colorado State University, Fort
Collins, Colorado, USA
3US Geological Survey Eastern Geographic
Science Center, Reston, Virginia, USA
4US Geological Survey MD‐DC‐DE Water
Science Center, Baltimore, Maryland, USA
5Department of Civil and Agricultural
Engineering, National University of Colombia,
Bogota, Colombia
6Department of Agricultural and Biological
Engineering, Purdue University, West
Lafayette, Indiana, USA
Correspondence
Anne J. Jefferson, Department of Geology,
Kent State University, Kent, OH, USA.
Email: [email protected]
Funding information
NSF‐EAR Postdoctoral Fellowship, Grant/
Award Number: 1349815; National Socio‐Environmental Synthesis Center (SESYNC)
National Science Foundation, Grant/Award
Number: DBI‐1052875; USDA/NIFA, Grant/
Award Number: S‐1063; Kent State University
Hydrological Processes. 2017;1–25.
AbstractDeleterious effects of urban stormwater are widely recognized. In several countries, regula-
tions have been put into place to improve the conditions of receiving water bodies, but plan-
ning and engineering of stormwater control is typically carried out at smaller scales.
Quantifying cumulative effectiveness of many stormwater control measures on a watershed
scale is critical to understanding how small‐scale practices translate to urban river health.
We review 100 empirical and modelling studies of stormwater management effectiveness at
the watershed scale in diverse physiographic settings. Effects of networks with stormwater
control measures (SCMs) that promote infiltration and harvest have been more intensively
studied than have detention‐based SCM networks. Studies of peak flows and flow volumes
are common, whereas baseflow, groundwater recharge, and evapotranspiration have received
comparatively little attention. Export of nutrients and suspended sediments have been the pri-
mary water quality focus in the United States, whereas metals, particularly those associated
with sediments, have received greater attention in Europe and Australia. Often, quantifying
cumulative effects of stormwater management is complicated by needing to separate its signal
from the signal of urbanization itself, innate watershed characteristics that lead to a range of
hydrologic and water quality responses, and the varying functions of multiple types of SCMs.
Biases in geographic distribution of study areas, and size and impervious surface cover of
watersheds studied also limit our understanding of responses. We propose hysteretic trajecto-
ries for how watershed function responds to increasing imperviousness and stormwater
management. Even where impervious area is treated with SCMs, watershed function may
not be restored to its predevelopment condition because of the lack of treatment of all
stormwater generated from impervious surfaces; non‐additive effects of individual SCMs;
and persistence of urban effects beyond impervious surfaces. In most cases, pollutant load
decreases largely result from run‐off reductions rather than lowered solute or particulate con-
centrations. Understanding interactions between natural and built landscapes, including
stormwater management strategies, is critical for successfully managing detrimental impacts
of stormwater at the watershed scale.
KEYWORDS
best management practices, cumulative effects, green infrastructure, low impact development,
stormwater control measures, stormwater management, urban catchments, urban hydrology
1 | INTRODUCTION
Stormwater run‐off is a dramatic hydrologic manifestation of many
changes that result from urbanization. Stormwater run‐off is water
that cannot infiltrate or be evapotranspired because impervious
wileyonlinelibrary.com/journa
rooftops and pavements limit access to soil and plants and quickly con-
vey run‐off into pipes and channels. Effectively managing stormwater
is a challenge faced by cities around the globe and is increasingly diffi-
cult as urban populations grow (Grimm et al., 2008). Increased precip-
itation intensity occurring in many regions as a result of climate change
Copyright © 2017 John Wiley & Sons, Ltd.l/hyp 1

2 JEFFERSON ET AL.
(Westra, Alexander, & Zwiers, 2013) further exacerbates the challenge
of stormwater management. Impacts of stormwater run‐off from
impervious surfaces are pervasive throughout urban areas. Stormwater
run‐off degrades the integrity of urban aquatic ecosystems, alters
hydrologic regimes, elevates nutrient and contaminant concentrations,
and harms aquatic plant and animal communities (Schueler,
Fraley‐McNeal, & Cappiella, 2009; Shuster, Morrison, & Webb,
2008). In the United States, urban stormwater run‐off is the third
largest source of water quality degradation in bays and estuaries
and the sixth largest source of degradation for streams, as reported
in national geospatial datasets (ATTAINS) (https://ofmpub.epa.gov/
waters10/attains_nation_cy.control), and at least $US19.2 billion of
capital investments are needed for improved stormwater manage-
ment to meet water quality requirements (United States Environmen-
tal Protection Agency, 2016). The need to improve stormwater
management practices for mitigating the impacts of urbanization
has been gaining traction across the globe (CEC, 2000; Hamel, Daly,
& Fletcher, 2013; Jia et al., 2015).
Although the effects of stormwater run‐off are often recognized
and regulated in receiving water bodies at the watershed scale,
practices to manage stormwater are generally designed for smaller
drainage areas (Roy et al., 2008). In this review, we will use stormwater
control measures (SCMs) to describe engineered stormwater manage-
ment practices, following current U.S. conventions, though the termi-
nology in use varies regionally (Fletcher et al., 2015). SCM networks
will be used to refer to the aggregation of SCMs within a watershed.
Given significant ongoing and impending investment in stormwater
management intended to improve watershed‐scale conditions, there
is an urgent need for information on cumulative effects of SCM net-
works, to inform decision‐making about trade‐offs across different
stormwater management strategies.
At the site scale, developers can often select from an array of
SCM types, and therefore, at the watershed scale, SCM networks
can include multiple types of SCM designs. Some SCMs are designed
primarily for water quantity function, whereas others have water
quality improvement as a primary or coequal goal. The choice of
SCM type can be constrained by regulations for water quantity, qual-
ity, or both (Balascio & Lucas, 2009). The first generation of SCMs
were typically designed to detain stormwater, slowly releasing it into
receiving waterways, to decrease peak flows, with limited regard to
other components of the water balance (Burns, Fletcher, Walsh,
Ladson, & Hatt, 2012; National Research Council, 2009). These
detention‐based SCMs (e.g., ponds and wetlands) are typically cen-
tralized, located within or proximal to surface waterways. Increased
residence times in such SCMs improved capture of suspended sedi-
ments and associated pollutants through sedimentation and biological
uptake of nutrients (Hathaway & Hunt, 2010). Since 2000, SCMs that
enhance infiltration, evapotranspiration, and water capture for reuse
have become increasingly popular and are encouraged by agencies
such as the United States Environmental Protection Agency (EPA,
2007). Placement of these SCMs is decentralized in upland areas, to
treat stormwater run‐off closer to the source (Petrucci, Rioust,
Deroubaix, & Tassin, 2013). This approach can include a single SCM
or SCMs arranged in a sequence, or treatment train, to provide redun-
dancy in hydrologic treatment and to maximize pollutant removal
processes. Examples of these types of SCM include green roofs,
bioretention, infiltration basins, and cisterns. Decentralized SCMs
are becoming an increasingly common component of new
development, whereas retrofitting existing developed areas with
either centralized or decentralized SCMs remains challenging due to
space constraints and social resistance (Shuster et al., 2008; Turner,
Jarden, & Jefferson, 2016). Increased used of decentralized SCMs
means that understanding the cumulative impacts of multiple SCMs
is now important even at the scale of a single neighbourhood or
development.
In this review, we examine the state of knowledge about effective-
ness of stormwater management at the watershed scale and assess its
implications for urban hydrologic function. Our first objective is to
examine what empirical and modelling investigations have elucidated
about cumulative effects of stormwater management strategies on
hydrology and water quality (nutrients and sediment) and what chal-
lenges are faced in such studies. In this review, we first summarize
the challenges to understanding cumulative effects of SCM networks,
the approaches used to study cumulative effects, and the results of
existing studies. Second, we propose a hypothesis of hysteresis behav-
iour in watershed hydrology and water quality as arising from urbaniza-
tion and stormwater management. Last, we discuss management
implications and research opportunities highlighted by existing studies
and hysteresis hypothesis.
The spatial scale of our review encompasses watersheds in which
multiple SCMs are designed to influence the hydrology of a receiving
water body, or in which there is a mixture of run‐off treated by SCMs
and untreated stormwater run‐off. Our review specifically examines
watershed‐scale effectiveness rather than single SCM input–output
studies, which have been previously reviewed (Ahiablame, Engel, &
Chaubey, 2012; Hatt, Fletcher, & Deletic, 2009; Hunt, Jarrett, Smith,
& Sharkey, 2006; Koch, Febria, Gevrey, Wainger, & Palmer, 2014;
Vogel & Moore, 2016). Our geographic scope encompasses North
America, Europe, East Asia, and Australia because of availability of
existing studies and congruence of approaches. Urban drainage
issues are important in developing regions as well, but engineered
solutions may need to be adapted in ways that are appropriate for
the social and geographical contexts (Parkinson, Tayler, & Mark, 2007;
Silveira, 2002).
2 | CHALLENGES TO UNDERSTANDINGCUMULATIVE EFFECTS OF SCM NETWORKS
Cumulative effects of SCM networks are inherently difficult to
quantify at a watershed scale. These difficulties result from needing
to separate the stormwater management signal from the signal of
urbanization itself, innate watershed characteristics that lead to a
range of hydrologic and water quality responses, and the varying func-
tions of multiple types of SCMs.
Hydrological responses of a watershed to urbanization itself
(e.g., the initial stressor) vary on both a local and regional scale and
are not necessarily predictable. The direction of some hydrological met-
rics (e.g., peak flow) responds consistently to urbanization but exhibit
large ranges in magnitude of response at similar levels of urbanization

JEFFERSON ET AL. 3
due to physiographic differences (Hopkins et al., 2015). Other hydro-
logical responses, such as baseflow, have shown contrasting responses
to urbanization because of differences in how regions are urbanized
over time, including the extent of vegetation removal or irrigation, as
well as the age of stormwater and other infrastructure (Bhaskar,
Beesley et al., 2016; O'Driscoll, Clinton, Jefferson, Manda, & McMil-
lan, 2010; Price, 2011). Response to urbanization and to SCM net-
works can also be influenced by a watershed's capacitance, where
capacitance is defined as how well the environmental setting facili-
tates stormwater run‐off entering long subsurface flowpaths or
evapotranspiring (Miles & Band, 2015). High watershed capacitance
is associated with high soil infiltration rates, gentle topography, and
deeper groundwater tables. High capacitance watersheds may be able
to recover hydrologic and water quality functions more effectively as
a result of stormwater management, than when it is implemented in
low capacitance watersheds.
In terms of water quality, increased pollutant concentrations are
well correlated with urbanization and population density (Hatt,
Fletcher, Walsh, & Taylor, 2004; Peierls, Caraco, Pace, & Cole,
1991). Although pollutant retention and removal is observed in stud-
ies at the individual SCM scale, it remains elusive at the watershed
scale with reductions in mass export highly variable and often attrib-
uted to hydrologic rather than biogeochemical drivers. Multiple fac-
tors likely influence this variability. First, biophysical processes in
SCMs vary by constituent, creating diverging patterns in effective-
ness attributed to SCM size, type, age, and location (Koch et al.,
2014; Liu et al., 2017; Pennington, Kaplowitz, & Witter, 2003). For
example, Winston, Page, and Hunt (2013) and Line and White
(2015) observed decreased total phosphorus (TP) attributed to sedi-
mentation of particulate fractions in bioretention areas, whereas
Duan, Newcomer‐Johnson, Mayer, and Kaushal (2016) found that
particulate P was retained only during high flows and subsequently
released during low flows. Second, watershed storage and release
of pollutants is also related to historical land use (Chen, Hu, Guo,
& Dahlgren, 2015; Van Meter & Basu, 2015). Accumulation of
nutrients in soils over decades of fertilizer application from agricul-
ture can lead to time lags between implementation of mitigation
practices and measurable differences in water quality (Hamilton,
2012). Third, this variability can be attributed to human actions
within urban landscapes, such as fertilizer application rates onto resi-
dential lawns as a function of age of development (Law, Band, & Grove,
2004; Zhou, Troy, & Grove, 2008). Together, this results in complex
spatial and temporal patterns of water quality that are often difficult
to disentangle.
SCM networks may need to treat a certain critical fraction of the
watershed for their effect to be detected. If only a small fraction of
impervious surfaces are draining to SCMs, we would not expect this
effect to be evident on a watershed scale, as the cumulative effect
would still be dominated by untreated impervious areas (Li, Fletcher,
Duncan, & Burns, 2017). Moreover, SCMs are often not designed to
completely mitigate all run‐off; for example, in the United States, many
state regulations require a fraction of run‐off to be regulated for water
quality treatment (MDE, 2009). Additionally, urbanization profoundly,
and often irreversibly, changes various components of the pervious
urban landscape, including soil bulk density and vegetative cover
(Gregory, Dukes, Jones, & Miller, 2006; Line & White, 2015). These
changes can affect the ability of pervious areas to infiltrate rainfall,
and under certain circumstances, pervious areas may actually behave
as sources of stormwater run‐off (Lim, 2016).
Finally, different SCM design functions can produce contrasting
effects on hydrology and water quality. In terms of hydrology, three
dominant SCM functions are detention, infiltration, and harvest for
evapotranspiration or reuse (Askarizadeh et al., 2015), with designs
that incorporate water retention effectively supplying water to the
other functions. Individual SCMs can include all three of these func-
tions to varying degrees, and an SCM network can incorporate multiple
types of SCMs with different mixes of these functions (Askarizadeh
et al., 2015). In terms of water quality, dynamic biological, physical,
and chemical processes that occur within individual SCMs act in often
inconsistent ways: transforming inorganic nutrients to organic forms
(Gold, Thompson, & Piehler, 2017), temporarily storing particulate
bound metals through filtration and sedimentation (Davis, Shokouhian,
Sharma, Minami, & Winogradoff, 2003), or removing nitrate through
denitrification (Bettez & Groffman, 2012; Collins et al., 2010; Dietz &
Clausen, 2006). SCMs designed to capture and store run‐off in
detention basins may increase sedimentation but do little to remove
dissolved nutrients. Detention ponds may retain water and increase
residence time for nutrient transformations during smaller events,
but in larger events or events with wet antecedent conditions,
residence times may be low with little effect on either hydrology
and water quality (Jefferson, Bell, Clinton, & McMillan, 2015;
Loperfido, Noe, Jarnagin, & Hogan, 2014). These examples highlight
the complexity of function within a single SCM, which gets amplified
as multiple SCMs of different designs are considered for treatment of
many constituents.
3 | RESULTS OF EXISTING STUDIES
3.1 | Scope
Empirical and modelling studies of SCM effects have largely been
concentrated in the eastern and midwestern United States, Europe,
and Australia (Table 1; Figure 1). Modelling studies cover a larger
range in watershed sizes (0.001 to 666 km2) than empirical studies
(0.006 to 202 km2; Figure 2), because they are not constrained by
sizes of actual watersheds with stormwater management. Percent
impervious area in watersheds studied have ranged from 3.8% to 85%
(Figure 2). In a few cases, all impervious area is “treated” (drains to an
SCM) (e.g., Fanelli, Prestegaard, & Palmer, 2017; Hogan, Jarnagin,
Loperfido, & Van Ness, 2014). However, other studies have focused
on watersheds with implementation of SCMs for only a fraction of
the impervious area (e.g., Bell, McMillan, Clinton, & Jefferson, 2016;
Jarden, Jefferson, & Grieser, 2016). Not all studies report the same
metrics for intensity of SCM implementation, making it difficult to
compare (e.g., effective impervious area). The broad literature of stud-
ies that focused on differing urban development intensities or styles
(e.g., compact vs. dispersed), without explicit attention to structural
SCM practices (e.g., Pyke et al., 2011), was not considered within
the scope of our review.

TABLE
1Lo
cations
whe
restud
iesofcu
mulativeeffectsofSC
Mne
tworksha
vebe
enpe
rform
ed
Site
Location
Stud
ytype
sEmpiricalstudy
design
Mode
lused
SCM
func
tion
Watershed
sizes(km
2)
Impe
rvious
area
(%)
Source
1Ann
apolis,
MD,U
SAE
GD,I
0.05–0
.61–6
5Fan
elliet
al.(2017)
2AsanT
angjun
gNew
Town,
SouthKorea
MSW
MM
H,I
1.8
Notgive
nLe
eet
al.(2012)
3Athen
s,GA,
USA
MSC
S,Storm
Net
Builder
H2.4
54
Carteran
dJackson(2007)
4Auc
klan
d,New
Zea
land
MMUSIC
D,H
,I0.83
27
Elliott,T
rowsdale,
andW
adhwa(2009)
5Baltimore,
MD,U
SAEM
PGSS
HA,S
CS
TR‐20
D,I,W
Q0.001–1
419–6
1McC
uen
,(1974),Gilroyan
dMcC
uen
(2009),
Meierdiercks,S
mith,B
aeck,a
ndMiller
(2010),
New
comer‐Johnson,K
aushal,M
ayer,a
nd
Grese
(2014),Sm
ith,S
mith,B
aeck,a
ndMiller
(2015),Duan
etal.(2016)
6Baltimore‐
Washing
ton,
MD‐D
C,U
SA
EP
D,I,W
Q0.5–3
414–5
3Pen
nino,M
cDonald,a
ndJaffe(2016)
7Beijin
g,China
MSW
MM,B
MPDSS
,process‐based
spread
shee
tmode
l
D,H
,I0.03–2
9.5
30–6
9.8
Jia,
Lu,Y
u,a
ndChen
(2012),Liu,B
ralts,
andEnge
l(2015),Xinget
al.(2016)
8Bloomington,
IL,U
SAM
PCSW
MM
D,H
,I88
27–5
0Ahiablamean
dSh
akya
(2016)
9Blacksburg,
VA,U
SAM
Ben
tley
SewerGEMS
D1.54
6.2
James
andDym
ond(2012)
10
Boston,
MA,
USA
EM
GW
inSL
AMM
I0.08–1
Notgive
nHurley
andForm
an(2011),Thomas
andVoge
l(2012)
11
Brisban
e,Australia
MSW
MM,M
USIC
H1.4–2
7.9
5–7
0Fletcher,M
itch
ell,Deletic,L
adson,
andSe
(2007),Aryal,A
shbolt,a
nd
Mcintosh
(2016)
12
Cha
pelH
ill,
NC,U
SAE
P,L
TD,I
0.03
24
Linean
dW
hite(2015)
13
Cha
rlotte,
NC,U
SAEM
GMUSIC
D.015–3
34–4
3Gagrani,Diemer,K
arl,an
dAllan(2014),
Jeffersonet
al.(2015),Bell,McM
illan
,Clin
ton,a
ndJefferson(2016,2
017)
14
Cincinn
ati,
OH,U
SAEM
BACI
RECARGA
D,H
,I0.28– 2
13–2
0Sh
uster,G
ehring,
andGerke
n(2007),
Shuster
andRhea
(2013),
Royet
al.(2014)
(Continues)
4 JEFFERSON ET AL.

TABLE
1(Continue
d)
Site
Location
Stud
ytype
sEmpiricalstudy
design
Mode
lused
SCM
func
tion
Watershed
sizes(km
2)
Impe
rvious
area
(%)
Source
15
Clarksburg,
MD,U
SAEM
P,L
TMonteCarlo
spread
shee
tmode
l
D,I,W
Q1.1
30
Hoganet
al.,(2014),Lo
perfidoet
al.(2014),
Rhea
,Jarnagin,H
ogan,L
operfido,a
ndSh
uster
(2015),Bhaskar,Hogan,a
ndArchfield
(2016)Hopkins,Lo
perfido,C
raig,N
oe,
and
Hogan(2017),Sp
arkm
an,H
ogan,H
opkins,&
Loperfido(2017)
16
ClayCoun
ty,
FL,
USA
MHEC‐H
MS
D2.5
13
Williamsan
dW
ise(2006)
17
College
Station,
TX,U
SA
MHEC‐H
MS/SW
MM
D,H
,I3
41
Dam
odaram
etal.(2010)
18
Cope
nhagen
,Den
mark
MMIKEURBAN
CS/MOUSE
I3
Notgive
nRoldin
etal.(2012)
19
Cross
Plains,
WI,USA
EP
D,I
0.77
36
Selbig
andBan
nerman
(2008)
20
Dallas/Ft.W
orth,
TX,U
SAM
SWAT
D,H
,I370
Notgive
nGiaco
moni,Gomez,&
Berglund(2014)
21
Espoo,F
inland
MSW
MM
D,H
,I0.12
38.7
Guan
,Sillan
pää,a
ndKoivusalo
(2015)
22
Eug
ene,
OR,U
SAM
SWAT
I28–2
70
2.2–9
.7W
u,B
olte,
Hulse,
andJohnson(2015)
23
Gen
oa,
Italy
MSW
MM
I0.06
60
Palla
andGnecco
(2015)
24
Green
ville,S
CE
GD
0.31–7
.26
Notgive
nHuret
al.(2008)
25
Gua
ngzhou,
China
MSU
STAIN
H,I
0.3
59
Jiaet
al.(2015)
26
Gwan
gju,
SouthKorea
MSW
MM
H,I
0.01
85
Bae
ket
al.(2015)
27
Gwinne
ttCoun
ty,
GA,U
SAE
P,L
TD
3–2
412–5
2(EIA)
Aulenbach,Joiner,a
ndPainter(2017)
28
Houston,
Tex
as,
USA
EP
I89
32
Yan
gan
dLi
(2013)
29
Indian
apolis,
IN,U
SAM
L‐THIA‐LID
D,H,I,W
Q51
45
Ahiablame,
Enge
l,an
dChau
bey
(2013),
Liu,C
hen
,andPen
g(2015)
30
IowaCity,
IA,
USA
MSC
SCN
andUNSA
T‐H
Other
8.4
50
Holm
an‐D
odds,Bradley,
andPotter
(2003)
31
Jacksonv
ille,
NC,U
SAE
BACI
D0.7–8
.35
1.2–2
8Gold
etal.(2017)
32
Kan
sasCity,
KCUSA
MSU
STAIN
I0.4
40
Leeet
al.(2012)
33
KingCoun
ty,
WA,U
SAM
Based
onHSP
FD
14.2
6–2
9(EIA)
Booth
andJackson(1997)
34
Kitch
ener,
Ontario,
Can
ada
MGAW
SER
H,I
5.75
Notgive
nZim
mer,H
eathco
te,W
hiteley
,and
Schroter(2007)
(Continues)
JEFFERSON ET AL. 5

TABLE
1(Continue
d)
Site
Location
Stud
ytype
sEmpiricalstudy
design
Mode
lused
SCM
func
tion
Watershed
sizes(km
2)
Impe
rvious
area
(%)
Source
35
Lafaye
tte,
IN,
USA
ML‐THIA‐LID
H,I
0.03–1
.1Notgive
nW
righ
t,Liu,C
arroll,Ahiablame,
and
Enge
l(2016)
36
Melbo
urne
,Australia
EM
BACI,P
MUSIC,R
ORB
D,H
,I4.5–4
013.5–7
0Fletcher
etal.(2007),Burns,Fletcher,H
att,
Anthony,
andW
alsh
(2010),Ham
elan
dFletcher
(2014),Burnset
al.(2016)
37
MichiganCity,
IN,U
SAM
L‐THIA‐LID
153.2
Notgive
nLiu,T
heller,Pijanowski,an
dEnge
l(2016)
38
Middleton,
WI,USA
EM
PInfiltrationpa
tch
spread
shee
tmode
l
D,I,W
Q0.33(15–6
3)
17–3
1(N
otgive
n)
Brander,O
wen
,andPotter
(2004),Geb
ert,
Rose,a
ndGarn(2012)
39
Montgo
mery
Coun
ty,M
D,
USA
MSC
STR‐20
D0.09
52
McC
uen
(1979)
40
Muske
gon,
MI,USA
MPLO
AD
D,H,I
137
Notgive
nSteinman
,Isely,a
ndThompson(2015)
41
Nan
jing,
China
MSC
SCN
H,I
0.58
73.8
Zhan
g,Guo,a
ndHu(2016)
42
NassauCoun
ty,
NY,U
SAEM
PUnspe
cified
groun
dwater
mode
l
I683
Notgive
nKu,H
agelin,a
ndBuxton(1992)
43
New
Castle,
new
SouthW
ales,
Australia
EM
Other
WUFS
I0.37
24
Lucasan
dCoombes
(2009)
44
New
Mex
ico,
USA
MMODFLO
W‐
Surfact,UNSA
T‐H
I0.34
31
Step
hen
s,Miller,M
oore,U
mstot,an
dSa
lvato(2012)
45
New
York
City,
NY,U
SAM
SWMM
H,I
124
1.7–4
3.7
Zah
matke
sh,B
urian
,Karam
ouz,Tavakol‐
Davan
i,an
dGoharian(2015)
46
Oklah
omaCity,
USA
MTopo
grap
hicinde
xD,H,I
666
40
Martin‐M
ikle,d
eBeu
rs,Julian,a
nd
Mayer
(2015)
47
Palermo,Italy
MIntegrated
urba
ndrain‐infiltration
BMP‐storage
tank
mode
l
WQ
0.128
68
Freni,Man
nina,
andViviani(2010)
48
Paris,F
ranc
eM
SWMM
D,H,I
0.023–5
.530
Petruccie
tal.(2012),Petruccie
tal.(2013),
Versini,Jouve
,Ram
ier,Berthier,an
dDe
Gouve
llo(2016)
49
Parma,
OH,U
SAEM
BACI
SWMM
H,I
0.11
55.5
Jarden
etal.(2016),Ave
llaned
a,Jefferson,
Grieser,a
ndBush
(2017)
50
Perth,A
ustalia
EM
GMODHMS,
MIKEURBAN
I51–1
12
24–Na
Appleyard
(1995),Barron,B
arr,an
dDonn
(2013),Lo
catelli
etal.(2017)
51
Philade
lphia,
PA,U
SAM
HEC‐H
MS,
DYNFLO
WD,I
54
17
Emerson,W
elty,a
ndTrave
r(2005),Maimone,
O'Rourke,
Knighton,a
ndThomas
(2011)
(Continues)
6 JEFFERSON ET AL.

TABLE
1(Continue
d)
Site
Location
Stud
ytype
sEmpiricalstudy
design
Mode
lused
SCM
func
tion
Watershed
sizes(km
2)
Impe
rvious
area
(%)
Source
52
Pho
enix,A
Z,U
SAE
PD
1.2–5
.649–6
9Hale,
Turnbull,Earl,Child
ers,an
dGrimm
(2015)
53
Raleigh
,NC,U
SAEM
PSW
MM
D,I
0.02–2
1.5
30–8
4(D
CIA)
Pomeroy,
Roesner,C
oleman
,andRan
kin(2008),
Wilson,H
unt,W
inston,a
ndSm
ith(2014)
54
Recklingh
ausen,
NorthRhine
‐W
estpha
lia,
German
y
MGwNeu
,HYDRUS‐2D,
SPRIN
G
I11.5
63–8
3Göbel
etal.(2004)
55
Richm
ond
,VA,
USA
MSW
MM
D,I
0.07
81
Lucasan
dSa
mple
(2015)
56
St.L
ouis,
MO,
USA
MSW
MM
H,I
93
40
DiV
ittorioan
dAhiablame(2015)
57
SaltLake
City,
UT,U
SAM
SWMM
D0.11
46
Fen
g,Burian
,andPomeroy(2016)
58
SanDiego
,CA,U
SAM
SWMM
H31
50
Walsh,P
omeroy,
andBurian
(2014)
59
Sing
apore,S
ingapo
reM
MIKEURBAN
D,I
161
66
Trinhan
dChui(2013)
60
Syracu
se,N
Y,U
SAM
MODFLO
WI
0.08
43
Endrenyan
dCollins(2009)
61
Trier,R
hine
land
‐Palatinate,
German
y
ELT
D,I
0.4
30
Kessler,M
eyer,S
eelin
g,Tressel,a
nd
Krein
(2012)
62
Tao
yuan
Coun
ty,
Taiwan
MSU
STAIN
I88
Notgive
nChen
,Shen
g,Chan
g,Kan
g,an
dLin(2014)
63
Waterford,
CT,U
SAEM
P,L
TSW
MM
D,H
,I0.02
22–3
3Hood,C
lausen,a
ndW
arner
(2007),Dietz
andClausen(2008),Bed
anan
dClausen
(2009),Rosa,C
lausen,a
ndDietz
(2015)
64
Wilm
ington,
NC,U
SAE
BACI
D,I,W
Q0.003–0
.005
60
Winston,P
ageet
al.(2013),Page,
Winston,M
ayes,P
errin,a
ndHunt(2014)
65
Wobu
rn,M
A,
USA
MDistributed
rainfall–
run‐offmode
lI
25
Notgive
nPerez‐Ped
inie
tal.(2005)
Note.Stud
ytype
indicatesem
pirical(E),mode
lling
(M),orbo
th(EM).Forem
piricalstudies,study
design
swerecatego
rizedas
compa
risons
ove
rtime:
Longterm
(LT),before‐after‐control‐im
pact(BACI)orco
mparisons
ove
rspace:
Paired(P),grad
ient
(G).SC
Mfunc
tioniscatego
rizedas
detention(D
),ha
rvest(H
),infiltration(I),a
ndex
plicitly
design
edforwater
quality(W
Q).
SWMM
=storm
water
man
agem
entmode
l.
JEFFERSON ET AL. 7

FIGURE 1 Location of empirical and modelling studies included in this review
FIGURE 2 Total impervious area (%) versus logarithmic‐scalewatershed area (km2) for watersheds where the effectiveness ofcumulative stormwater management was studied (see Table 1)
8 JEFFERSON ET AL.
3.2 | Different approaches used to study effectsof SCM networks
On the basis of our literature review, both empirical and modelling
approaches have been used to investigate the cumulative effective-
ness of SCM networks at a watershed scale, although we found model-
ling studies to be more widely used. Modelling approaches have been
used in 41 study locations, whereas 10 locations have been the focus
of purely empirical studies, and 13 locations have had both empirical
and modelling approaches deployed (Table 1). Empirical approaches
are crucial to observe what actual effect SCMs are having on water-
shed function. Yet observational monitoring can only be used where
SCMs have been installed at sufficient density such that their cumula-
tive effects can be detected. A complementary approach is to use
numerical experiments, in which modelling simulations are used to vary
SCM density, type, or location, to expand the range of SCM, flow, and
watershed conditions where we can gain information on cumulative
SCM effectiveness, match sources with mitigation, and define thresh-
olds in flow and water quality response.
We found that empirical studies used several different designs to
examine the effects of SCM networks and can be categorized into
two main study designs: (a) comparisons over time as SCMs are added
to a watershed and (b) comparisons over space between two or more
watersheds with varying levels of SCM implementation (Table 1). Each
of these two main designs then has several subtypes of approaches,
and some sites have had both comparisons over time and over space.
Studies over time can be longer term in duration as SCMs are
implemented in a watershed. We defined long‐term studies as those
with monitoring periods of 4 years or longer. Most long‐term study
locations in the review (4 out of 5 locations) paired the watershed
undergoing SCM implementation with one that has not undergone
any changes to distinguish the effect of SCM implementation from cli-
matic variability over longer monitoring periods. If the comparison
between watersheds undergoing SCM implementation with an urban
watershed with limited SCMs is established before SCMs are added,
this approach is called before‐after‐control‐impact. If an additional
undeveloped watershed is included for comparison, it is called
before‐after‐control‐reference‐impact experimental design. Most
SCM implementations studied over time are in urbanizing landscapes,
although a few studies of intensive retrofit efforts have been con-
ducted (Jarden et al., 2016; Shuster & Rhea, 2013; Walsh, Fletcher,
Bos, & Imberger, 2015). Detecting the effects of SCM implementation
over time is difficult because other changes occurring in watersheds
may mask the effect of SCMs (e.g., changes to vegetative, topographic,
and soil characteristics; import and export of water; street repair). The
second design type is more common than observing changes over time
directly and substitutes space for time, where two or more watersheds
with differing levels of SCM implementation are compared. These are
often synoptic studies that are short in duration and occur after SCMs
are implemented (e.g., 1–2 years; Meierdiercks et al., 2010; Hale et al.,
2015; Fanelli et al., 2017). Comparisons of two watersheds (a paired
approach) were more common (13 locations) than comparisons across
a gradient of SCM implementation (four locations). Space for time

JEFFERSON ET AL. 9
substitutions have similar potential difficulties as any paired watershed
study, where other factors that differ between watersheds could affect
hydrologic or water quality response. However, they are useful in
cases where long term or before‐after‐control‐impact designs are not
feasible. Ways to analyse hydrologic data to isolate the effect of SCMs
in monitoring studies of various experimental designs are discussed in
Li et al. (2017).
Most modelling studies explore effectiveness of SCM networks by
combining different types and layouts across the landscape (Elliott &
Trowsdale, 2007; Hamel et al., 2013). A common practice is to simulate
predevelopment or current development conditions (baseline) and
then sequentially add SCMs until a certain stormwater management
goal is met. A variety of model types has been used that simulate
hydrologic flowpaths and pollutant removal efficiency with a range of
numerical approaches (e.g., process‐based vs. stochastic). For example,
the stormwater management model (Rossman & Huber, 2016) repre-
sents each SCM by a combination of vertical layers, with Manning's
equation‐based overland flow, a Green–Ampt infiltration model, soil
properties, and underdrain characteristics. Watershed‐scale models
that use the Soil Conservation Service (SCS) curve number (United
States Department of Agriculture, 1986) approach (e.g., LTHIA‐LID)
simulate SCM function by modifying the curve number to lengthen
travel time and increase initial abstraction. Hydrological modelling
has been also used to optimize type, location, size, and cost of SCMs
(Baek et al., 2015; Endreny & Collins, 2009; Gilroy & McCuen, 2009;
Liu et al., 2016; Xing et al., 2016). More complex numerical models
(e.g., HYDRUS and FEFLOW), based on Richards' unsaturated flow
model coupled with soil hydraulic functions, are able to describe sub-
surface flow; however, the amount of input data and computational
effort exceed that of approaches described above. Pollutant removal
by SCMs is most commonly simulated using data‐driven removal
percentages (e.g., LTHIA‐LID) or first‐order decay (e.g., MUSIC and
SUSTAIN). Limitations of modelling studies are generally in the physi-
cal description of surface and subsurface interactions, and sewer‐storm
drainage system infiltration and exfiltration (Salvadore, Bronders, &
Batelaan, 2015), as well as in the high treatment intensity implemented
and the lack of confounding factors modelled (Li et al., 2017).
3.3 | Detention‐based SCM networks
A majority (36 of 65) of the studied locations included detention‐based
SCM networks (Table 2), though often in conjunction with harvest‐
and infiltration‐based SCMs. Detention‐based SCMs were the sole
focus of work in 10 locations. Most of these studies focused on
aspects of peak flow and run‐off volume, including water yield and
run‐off ratios. Despite the prevalence of detention SCM networks
constructed over the last 30–40 years, some aspects of hydrologic
response to these systems remain relatively understudied. For exam-
ple, few of these studies quantified the effects of detention storage
on recession coefficients and baseflow. Studies in arid and semi‐arid
regions are particularly scarce.
Empirical studies of detention‐based SCM networks have shown
mixed results. Several studies were able to detect a clear effect of
detention‐based SCMs on some hydrologic metrics. For example,
detention basins were found to substantially increase streamflow for
several days after storms in North Carolina, United States, reflecting
their designed slow release of stored water (Jefferson et al., 2015). In
an arid context where urbanization has decreased flooding from prede-
velopment Phoenix conditions, Hale et al. (2015) found that retention
basins decreased run‐off volumes. Other studies reported mixed
results. In Baltimore, Maryland, United States, a watershed with a high
density of SCMs was found to have lower annual run‐off compared to
an urban watershed with little stormwater management, but annual
run‐off was still higher than in a forested watershed (Meierdiercks
et al., 2010). Bell et al. (2016) found that total impervious area, rather
than SCM implementation, was the best predictor of peak flows and
run‐off ratio at the event scale. However, SCM implementation mitiga-
tion was a significant predictor over annual timescales.
Modelling approaches have also been used to examine cumulative
effectiveness of detention‐based SCM networks. Booth and Jackson
(1997) found that detention basins in the Pacific Northwest, United
States, were able to reduce peak flows, but that flow volume and dura-
tion were not able to be controlled by detention basins. Near
Baltimore, Maryland, United States, Smith et al. (2015) modelled the
detention basin network of the Dead Run watershed and found that
detention basins reduced peak flows by a median of 11%, whereas
an earlier study of stream gage data suggested that the basins may
have lowered water yield by increasing evaporation (Nelson, Smith, &
Miller, 2006). However, other modelling studies have found that
detention basins may increase peak flows where changes in flow
timing leads to synchronization from different parts of the watershed
(Emerson et al., 2005; McCuen, 1974, 1979). The non‐additive nature
of SCMs means that observing effectiveness on a small scale does not
mean this same effectiveness will translate to larger watershed scales.
For example, McCuen (1979) found that peak flows were reduced for
small storms at small drainage areas, but peak flows increased further
downstream.
3.4 | Infiltration‐ and harvest‐based SCM networks
Partly in response to lack of evidence that detention basins alone can
ameliorate alterations to urban hydrologic function, SCM networks
that focus on infiltration and water harvest (via evapotranspiration
and reuse) are coming into wider use (Table 1). Perhaps because these
technologies are newer, more hydrologically complex, and distributed
throughout upland areas, there are more study locations (52 of 65)
focused on cumulative effects of infiltration‐ and harvest‐based SCM
networks than of detention‐based networks (Table 1). At half (26) of
these locations, detention‐based SCMs have been included in the
studied watersheds.
Several empirical studies show reductions in peak flow from infil-
tration and harvest SCM networks (Bedan & Clausen, 2009; Jarden
et al., 2016; Wilson et al., 2014), with one study documenting an order
of magnitude decrease in median peak flow (Wilson et al., 2014). Run‐
off thresholds, or the minimum rainfall depth required to generate run‐
off, were higher in watersheds implemented with infiltration and
harvest focused SCM networks than in watersheds with direct convey-
ance or detention‐based SCMs (Fanelli et al., 2017; Hood et al., 2007;
Loperfido et al., 2014). However, in watersheds implemented with the
same SCM design, run‐off thresholds decreased with greater

TABLE
2Empiricala
ndmode
lling
stud
iesthat
repo
rted
thecu
mulativeeffectsofSC
Msonhy
drologicmetrics:P
eakflows,flow
volume(attimescales
shorter
than
annual),an
nual
water
yield(alsocalled
annu
altotalstrea
mflow
volume),run
‐offratio,tim
eto
peak,d
urationofstorm
flow,b
aseflow,recha
rge,
groun
dwater
elev
ation,
evap
otran
spiration,
andother
Site
Source
Pea
kflow
Flow
volume
Ann
ualw
ater
yield
Run
‐off
ratio
Tim
eto
peak
Durationof
storm
flow
Baseflow
Rec
harge
Groundwater
elev
ation
Eva
potran
spiration
Other
1Fan
elliet
al.(2017)
xx
xx
2Le
eet
al.(2012)
x
3Carteran
dJackson(2007)
xx
x
4Elliott
etal.(2009)
xx
x
5McC
uen(1974)
x
5Gilroyan
dMcC
uen(2009)
xx
x
5Meierdierckset
al.(2010)
xx
xx
x
5New
comer‐John
sonet
al.(2014)
xx
5Sm
ithet
al.(2015)
xx
xx
5Dua
net
al.(2016)
xx
6Pen
nino
etal.(2016)
xx
x
7Jiaet
al.(2012)
xx
7Liu,
Braltsan
dEng
el(2015)
xx
7Xinget
al.(2016)
xx
x
8Ahiab
lamean
dSh
akya
(2016)
x
9James
andDym
ond
(2012)
xx
x
10
Tho
mas
andVoge
l(2012)
x
11
Fletche
ret
al.(2007)
xx
xx
11
Aryal
etal.(2016)
xx
xx
12
Line
andW
hite
(2015)
xx
13
Gagrani
etal.(2014)
xx
x
13
Jeffersonet
al.(2015)
xx
x
13
Belle
tal.(2016)
xx
xx
14
Shusteret
al.(2007)
xx
xx
14
Shusteran
dRhe
a(2013)
xx
xx
x
15
Hoganet
al.(2014)
xx
x
15
Lope
rfidoet
al.(2014)
xx
xx
x
15
Rhe
aet
al.(2015)
x
15
Bha
skar,H
ogan,
Archfield
(2016)
xx
xx
x
15
Hopk
inset
al.(2017)
xx
xx
x
16
Williamsan
dW
ise(2006)
xx
xx
xx
17
Dam
oda
ram
etal.(2010)
xx
18
Roldin
etal.(2012)
x
19
Selbig
andBan
nerm
an(2008)
xx
xx
xx
(Continues)
10 JEFFERSON ET AL.

TABLE
2(Continue
d)
Site
Source
Pea
kflow
Flow
volume
Ann
ualw
ater
yield
Run
‐off
ratio
Tim
eto
peak
Durationof
storm
flow
Baseflow
Rec
harge
Groundwater
elev
ation
Eva
potran
spiration
Other
20
Giaco
moni
etal.(2014)
xx
21
Gua
net
al.(2015)
xx
x
22
Wuet
al.(2015)
xx
xx
x
23
Palla
andGne
cco(2015)
xx
x
24
Hur
etal.(2008)
xx
x
25
Jiaet
al.(2015)
xx
27
Aulen
bach
etal.(2017)
xx
x
28
Yan
gan
dLi
(2013)
x
29
Ahiab
lameet
al.(2013)
x
29
Liu,
Che
nan
dPen
g(2015)
xx
30
Holm
an‐D
odd
set
al.(2003)
xx
xx
xx
x
32
Leeet
al.(2012)
x
33
Booth
andJackson(1997)
xx
34
Zim
mer
etal.(2007)
xx
xx
xx
x
35
Wrigh
tet
al.(2016)
xx
36
Fletche
ret
al.(2007)
xx
xx
36
Burns
etal.(2010)
xx
xx
36
Ham
elan
dFletche
r(2014)
xx
xx
x
36
Burns
etal.(2016)
x
38
Brand
eret
al.(2004)
xx
38
Geb
ertet
al.(2012)
xx
x
39
McC
uen(1979)
xx
xx
x
41
Zha
nget
al.(2016)
xx
42
Kuet
al.(1992)
xx
x
43
Lucasan
dCoombe
s(2009)
xx
xx
44
Step
hens
etal.(2012)
xx
x
45
Zah
matke
shet
al.(2015)
xx
48
Petruccie
tal.(2012)
xx
x
48
Petruccie
tal.(2013)
xx
48
Versini
etal.(2016)
xx
x
49
Jarden
etal.(2016)
xx
xx
49
Ave
llane
daet
al.(2017)
xx
50
App
leyard
(1995)
xx
50
Barronet
al.(2013)
xx
xx
xx
xx
(Continues)
JEFFERSON ET AL. 11

TABLE
2(Continue
d)
Site
Source
Pea
kflow
Flow
volume
Ann
ualw
ater
yield
Run
‐off
ratio
Tim
eto
peak
Durationof
storm
flow
Baseflow
Rec
harge
Groundwater
elev
ation
Eva
potran
spiration
Other
50
Locatelli
etal.(2017)
x
51
Emersonet
al.(2005)
xx
51
Maimone
etal.(2011)
xx
52
Haleet
al.(2015)
xx
xx
x
53
Pomeroyet
al.(2008)
xx
x
53
Wilsonet
al.(2014)
xx
xx
54
Göbe
letal.(2004)
xx
xx
xx
55
Lucasan
dSa
mple(2015)
xx
x
56
DiV
ittorioan
dAhiab
lame(2015)
x
57
Fen
get
al.(2016)
xx
58
Walsh
etal.(2014)
xx
59
Trinh
andChu
i(2013)
xx
xx
x
60
End
reny
andCollins
(2009)
x
61
Kessler
etal.(2012)
xx
xx
xx
xx
63
Hoodet
al.(2007)
xx
xx
xx
63
Dietz
andClausen
(2008)
xx
63
Bed
anan
dClausen
(2009)
xx
xx
63
Rosa
etal.(2015)
xx
xx
64
Page,
Winston,
Mayes,P
errin,
andHun
t(2015)
x
64
Winston,
Pageet
al.(2013)
xx
xx
x
65
Perez‐Ped
inie
tal.(2005)
x
Note.S
CM
=storm
water
controlm
easure.
12 JEFFERSON ET AL.

JEFFERSON ET AL. 13
impervious cover, suggesting a decreased SCM benefit in watersheds
with high impervious cover (Fanelli et al., 2017). Studies investigating
run‐off volume after implementation of harvest and infiltration SCMs
found little change (Dietz & Clausen, 2008; Line & White, 2015; Selbig
& Bannerman, 2008), or small but statistically significantly decreased
run‐off volume (Shuster & Rhea, 2013). Water yield (mean annual
streamflow) was found to be lower in low impact development (LID)
watersheds, with infiltration‐ and harvest‐based SCM networks,
compared to direct conveyance or detention‐based SCM watersheds
(Bedan & Clausen, 2009; Bhaskar, Hogan, Archfield, 2016; Hogan
et al., 2014), but still higher than forested watersheds (Bhaskar, Hogan,
Archfield, 2016; Hogan et al., 2014). Where discharge measurements
were taken only within the storm sewer network, infiltration and har-
vest SCMs were shown to decrease run‐off volumes (Avellaneda
et al., 2017; Jarden et al., 2016), but the measurement location would
not account for longer, deeper flowpaths that contribute to baseflow.
In modelling studies, peak flow and volume are consistently found
to decrease with harvest and infiltration SCMs across climates
(Avellaneda et al., 2017; Brander et al., 2004; Feng et al., 2016; Gilroy
& McCuen, 2009; Holman‐Dodds et al., 2003; Perez‐Pedini et al.,
2005). However, in some situations, peak flows could be exacerbated
with wet antecedent conditions and use of infiltration SCMs (Williams
& Wise, 2006). Hydrological effects of SCMs increased linearly with
effective impervious area reduction, as modelled by scenarios
implementing different densities of green roofs and permeable pave-
ment (Palla & Gnecco, 2015). Furthermore, simulation results revealed
that a minimum of 5% effective impervious area reduction was
required for an SCM network to provide any noticeable hydrologic
benefit (e.g., a 3% reduction in peak flow but no changes in run‐off vol-
ume), which is equivalent to replacing 16% of the watershed's parking
and road surfaces with permeable pavement (Palla & Gnecco, 2015).
However, the implementation of infiltration‐based SCMs on at least
11% of effective impervious areas (equivalent to 16% roads and 20%
roofs) were required to reduce peak flows by 10% and run‐off volumes
by 5%. In San Diego, California, United States, surface run‐off volume
reduction increases linearly with the percentage of impervious area
targeted by a rainwater harvesting scenario (Walsh et al., 2014). Also,
available storage capacity and hydrological performance showed a lin-
ear increasing relationship in that study. Other studies have revealed
non‐additive effects of SCM networks. Numerical simulations have
shown greater run‐off volume reduction when SCMs were imple-
mented near a watershed's outlet (Di Vittorio & Ahiablame, 2015).
Perez‐Pedini et al. (2005) argued that factors such as soil infiltration
properties, land use, watershed network connectivity, upstream
contributing area, and distance to stream channel are factors that
influence the ability of SCMs to control run‐off; however, these
relationships are complex and unlikely to be explained by most urban
hydrological models.
Infiltration‐ and harvest‐based SCM networks have also been
shown, via models, to affect multiple water balance components. For
example, when green roofs and bioretention cells were modelled in
an urban catchment in Salt Lake City, Utah, United States, run‐off
volume was reduced, and actual evapotranspiration was increased for
an average weather year and when compared to baseline developed
condition (Feng et al., 2016). Using a calibrated and validated
stormwater management model for both development and stormwater
treatment conditions, Avellaneda et al. (2017) quantified a reduction of
surface run‐off and an increase in infiltration for a catchment equipped
with bioretention cells, rain gardens, and rain barrels. Although the
combination of all types of SCMs led to larger changes in water bal-
ance components than any components individually, bioretention cells
outperformed the cumulative effects of rain gardens and rain barrels.
Some studies have explicitly focused on changes to groundwater
recharge and baseflow as affected by infiltration‐based SCM networks.
In an empirical study with infiltration SCMs, baseflow and total
streamflow increased significantly during development, as vegetative
cover decreased, compared to a detention‐based urban watershed
and a forested watershed (Bhaskar, Hogan, Archfield, 2016). In the
same watershed, streamflow recessions were more gradual after
urbanization with infiltration‐based SCMs compared to during urbani-
zation. In another small watershed, groundwater levels were found not
to significantly increase over time as urbanization with infiltration facil-
ities took place, although stormflow became better controlled (Kessler
et al., 2012). Although an infiltration‐based SCM in Annapolis, Mary-
land, United States, did intercept run‐off for small rainfall events,
baseflow in the stream was significantly lower than in forested refer-
ence streams; there was no difference in baseflow between the water-
shed implemented with SCMs and an adjacent urban watershed with
no SCM implementation (Fanelli et al., 2017). Infiltration SCMs
implemented in Boston were found to raise water tables in a small
but significant way (Thomas & Vogel, 2012). Modelling simulations
showed that increased infiltration SCMs could lead to greater recharge
(Endreny & Collins, 2009; Göbel et al., 2004; Holman‐Dodds et al.,
2003; Maimone et al., 2011), although results were mixed on the mag-
nitude of these changes on a watershed scale for baseflow (Hamel &
Fletcher, 2014) and evapotranspiration (Holman‐Dodds et al., 2003).
A few studies simulated interactions between greater infiltration and
combined sewer systems (Endreny & Collins, 2009; Maimone et al.,
2011; Roldin et al., 2012). In Perth (Western Australia), implementation
of extensive stormwater infiltration led to a rise in groundwater levels,
which could potentially cause seepage above terrain; an increase in
baseflow; and higher localized evapotranspiration rates due to the rise
in groundwater levels in non‐urban areas (Barron et al., 2013; Locatelli
et al., 2017).
3.5 | Cumulative effects of SCMs on water quality
Results from the majority of studies suggest that implementation of
SCMs reduces mass export of dissolved (e.g., soluble reactive phos-
phorus [SRP] and nitrate) and particulate (e.g., total suspended solids
and total phosphorus) pollutants and that the primary mechanism
underlying these patterns is hydrological rather than biogeochemical
(Table 3). Monitoring SCM implementation over time at the watershed
scale, for both detention‐ and infiltration‐based networks, shows that
pollutant load reductions are frequently tied to reductions in run‐off
generation (Ahiablame et al., 2013; Dietz & Clausen, 2008; Hale
et al., 2015; Selbig & Bannerman, 2008; Steinman et al., 2015). For
example, Bedan and Clausen (2009) observed significant reductions
to peak discharge and total flow volume in an LID watershed, which
translated to load reductions for nitrate (NO3−) and total Kjedahl

TABLE
3Empirical(E)an
dmode
lling
(M)stud
iesthat
repo
rted
thecu
mulativeeffectsofSC
Msonwater
quality
Site
Source
Stud
ytype
Ann
ual/ev
ent
scale
Load
Eve
ntmea
nco
nce
ntration
Baseflow
conce
ntration
Diss.
Nutrien
tsPart.
Nutrien
tsTSS
Metals,ba
cteria,
andother
Diss.
Nutrien
tsPart.
Nutrients
TSS
Metals,bacteria,
andother
4Elliotet
al.(2009)
MA
xx
x
5New
comer‐John
sonet
al.(2014)
EE
xx
5Dua
net
al.(2016)
EE
xx
xx
6Pen
nino
etal.(2016)
E/M
Ax
x
10
Hurleyan
dForm
an(2011)
MA
x
11/3
6Fletche
ret
al.(2007)
MA
xx
12
Line
andW
hite
(2015)
EA
xx
x
13
Gagrani
etal.(2013)
MA/E
xx
xx
13
Belle
tal.(2017)
EE
xx
x
14
Royet
al.(2014)
EA
x
15
Hopk
inset
al.(2017)
EE
xx
xx
15
Sparkm
anet
al.(2017)
MA
xx
19
Selbig
andBan
nerm
an(2008)
EA
xx
24
Hur
etal.(2008)
EE
xx
26
Bae
ket
al.(2015)
ME
x
28
Yan
gan
dLi
(2013)
EA
x
29
Ahiab
lameet
al.(2013)
MA
29
Liu,
Che
nan
dPen
g(2015)
MA
xx
xx
31
Gold
etal.(2017)
EA/E
xx
xx
32
Leeet
al.(2012)
MA
x
36
Burns
etal.(2016)
EA
xx
xx
37
Liuet
al.(2016)
MA
xx
x
38
Geb
ertet
al.(2012)
EA
xx
xx
40
Steinm
anet
al.(2015)
MA
xx
46
Martin‐M
ikle
etal.(2015)
MA
xx
47
Freni
etal.(2010)
ME
x
52
Haleet
al.(2015)
EE
xx
xx
xx
xx
(Continues)
14 JEFFERSON ET AL.

TABLE
3(Continue
d)
Site
Source
Stud
ytype
Ann
ual/ev
ent
scale
Load
Eve
ntmea
nco
nce
ntration
Baseflow
conce
ntration
Diss.
Nutrien
tsPart.
Nutrien
tsTSS
Metals,ba
cteria,
andother
Diss.
Nutrien
tsPart.
Nutrients
TSS
Metals,bacteria,
andother
53
Wilsonet
al.(2014)
EE
xx
xx
xx
62
Che
net
al.(2014)
MA
xx
x
63
Dietz
andClausen
(2008)
EA
xx
63
Bed
anan
dClausen
(2009)
EA
xx
xx
xx
xx
63
Rosa
etal.(2015)
MA/E
x
64
Winston,
Pageet
al.(2013)
EE
xx
xx
xx
xx
64
Pageet
al.(2015)
EE
xx
xx
xx
xx
Note.Pollu
tant
load
san
dev
entmea
nco
ncen
trations
(EMC)are
sepa
ratedinto
dissolved
andpa
rticulatenu
trients,totalsuspe
nded
sedimen
ts(TSS
)and
metals,bacteria,an
dothers(e.g.,ch
lorophylla,b
ioch
emicaloxyge
nde
man
d,an
dorgan
icco
ntam
inan
ts).
JEFFERSON ET AL. 15
nitrogen, compared to a watershed with no SCMs. However, the effect
was not consistent among solutes, as they observed increased SRP
loads and total suspended sediments (TSS) loads. Similarly, a study
in Raleigh, North Carolina, United States, observed 11‐fold decreases
in peak discharge in a watershed with distributed, infiltration‐based
SCMs compared to a watershed with centralized, dry detention;
however, no differences were detected in event mean concentra-
tions (EMCs) (Wilson et al., 2014). In arid urban watersheds, nutrient
and dissolved organic carbon fluxes decreased with retention basin
density and increased with imperviousness (Hale et al., 2015).
However, these patterns were not observed in concentrations that
support the finding across studies of hydrology driving water quality.
This suggests that reductions in run‐off volume may have a larger
impact on pollutant loads than treatment within the SCM itself at
the catchment scale. However, more work is needed to understand
the impacts of run‐off storage on treatment processes and delayed
release on instream concentrations (Bell et al., 2017; Jefferson
et al., 2015).
The TP export was the most variable water quality metric, with
both increases (Selbig & Bannerman, 2008) and decreases in export
(Bedan & Clausen, 2009; Dietz & Clausen, 2008; Line & White,
2015; Wilson et al., 2014) reported in empirical studies. For exam-
ple, retention of TP at the watershed scale was primarily attributed
to high density of SCMs (such as bioretention areas and ponds) that
are highly retentive of sediment and associated pollutants (Davis,
2007). Although stormwater ponds are often considered effective
sinks of TSS and attached pollutants (Hogan & Walbridge, 2007),
in some cases, they may also generate solids through algal produc-
tion (Gold et al., 2017) or be modified with floating islands to
enhance removal of nutrients and metals (Borne, Fassman, & Tanner,
2013; Winston, Hunt et al., 2013). Monitoring studies of the effec-
tiveness of individual SCMs revealed considerable variability among
SCM types and pollutants. Physical and biological processes that
drive pollutant retention can be enhanced in SCMs, but variability
in design affects residence times and rates of retention and removal
processes (Reisinger, Groffman, & Rosi‐Marshall, 2016; Zhu, Dillard,
& Grimm, 2005). Although the potential exists for these structures
to achieve even greater water quality improvements than predicted
by run‐off reductions alone, demonstration of this at the watershed
scale is still lacking.
Modelling studies typically conduct simulations over annual or
multi‐year timescales to account for the effects of climate variability
and across stormwater implementation scenarios. For example,
Gagrani et al. (2014) used the MUSIC model to show significant reduc-
tions in total nitrogen, TP, and TSS loads in simulations with ponds and
bioretention areas compared to piped drainage. When distributed rain
gardens at the household level were added to the simulation, little
further reductions were observed. Models have also been used to
optimize pollutant removal and cost (Liu, Chen & Peng, 2015) and to
determine most acceptable areas for siting of SCMs based on biophys-
ical and societal constraints (Lee et al., 2012; Martin‐Mikle et al., 2015;
Steinman et al., 2015).
Localized conditions and temporal variability at the small water-
shed scale can have significant effects on both run‐off generation
and SCM function. During construction, low infiltration capacity
16 JEFFERSON ET AL.
through compaction of soils can lead to decreased functionality of infil-
tration SCMs (Line &White, 2015), and increased fertilization to estab-
lish vegetation can lead to increased dissolved nutrient export (Bedan
& Clausen, 2009; Line &White, 2015). Over time, short‐ and long‐term
changes in vegetation in SCMs, riparian zones, and other forested
urban areas can be a sink for nitrogen through uptake and denitrifica-
tion (Bettez & Groffman, 2012) but a source of phosphorus via leaf lit-
ter decomposition (Bratt et al., 2017; Selbig, 2016). These studies
highlight the importance of matching stormwater controls with pollut-
ant sources. For example, rain gardens in residential areas may improve
hydrologic response, but they often treat rooftop run‐off, which has
low pollutant concentrations compared to run‐off from lawns and
roads (Roy et al., 2014). Similar to hydrologic controls, type of develop-
ment within the watershed and position with the stream network may
influence changes in water quality. For example, in older urban water-
sheds, Bell et al. (2017) showed that SCM outflow concentrations of
dissolved nutrients were lower than instream, implying that SCMs
have potential to decrease stream concentrations if sufficient run‐off
is captured and treated.
Temporal variability is best seen in effectiveness of SCMs during
large storms, which can have a disproportionate effect on annual pol-
lutant export (Bell et al., 2016; Shields et al., 2008). In a 5‐year paired
watershed study in Wisconsin, United States, precipitation from small,
frequent events generated run‐off from a direct conveyance water-
shed, whereas run‐off was retained in the LID watershed (infiltration
SCMs and grassed conveyance), and large storms during either winter
months with frozen soils or saturated conditions led to increases in
export (Selbig & Bannerman, 2008).
3.6 | Common confounding factors
Two broad categories of confounding factors, built and natural envi-
ronment, were identified as potential drivers of variability in hydrologic
and biogeochemical response to watershed‐scale SCMs. Confounding
factors associated with the built environment included presence, den-
sity, function, and connectivity of impervious cover and SCMs as well
as SCM arrangement (centralized vs. distributed), age of development,
and past land use. Variability in these factors complicated interpreta-
tion of hydrologic and biogeochemical results. Confounding factors
associated with the natural environment included differences in tree
canopy cover, grass cover, fertilizer application rates, fall leaf off, local
geology and soils, and heterogeneity in precipitation amount and
intensity among study sites. These confounding factors were most
often acknowledged in studies using a paired watershed design. Differ-
ences in canopy cover among study watersheds were cited as a natural
factor influencing annual water yield (Bell et al., 2016; Bhaskar, Hogan,
Archfield, 2016; Loperfido et al., 2014). Differences in grass cover and
fertilizer application rates were cited as the primary explanation for
variability in TP export, particularly if the distributed SCM watershed
exported more TP than the direct conveyance watershed (Bedan &
Clausen, 2009). Local geology and soils were referenced as factors
associated with hydrologic trends related to groundwater recharge
flowpaths and infiltration rates (Brander et al., 2004; Holman‐Dodds
et al., 2003).
4 | HYSTERESIS RESULTING FROMURBANIZATION AND STORMWATERMANAGEMENT
We find that although the goal of stormwater management is broadly
to restore predevelopment hydrology and water quality, in practice,
this goal is rarely achieved. Instead, stormwater management shifts
the system onto a new trajectory, which may not return it to the initial
predevelopment state, a system behaviour often referred to as hyster-
esis. We posit that trajectories of watersheds undergoing development
and subsequent SCM mitigation could be conceptualized with hyster-
esis loops for metrics describing water quantity or quality. In the hys-
teresis loops, the relationship between unmitigated impervious area
and each hydrologic and water quality metric is shaped by watershed
capacitance, local climate, and non‐stormwater processes of urbaniza-
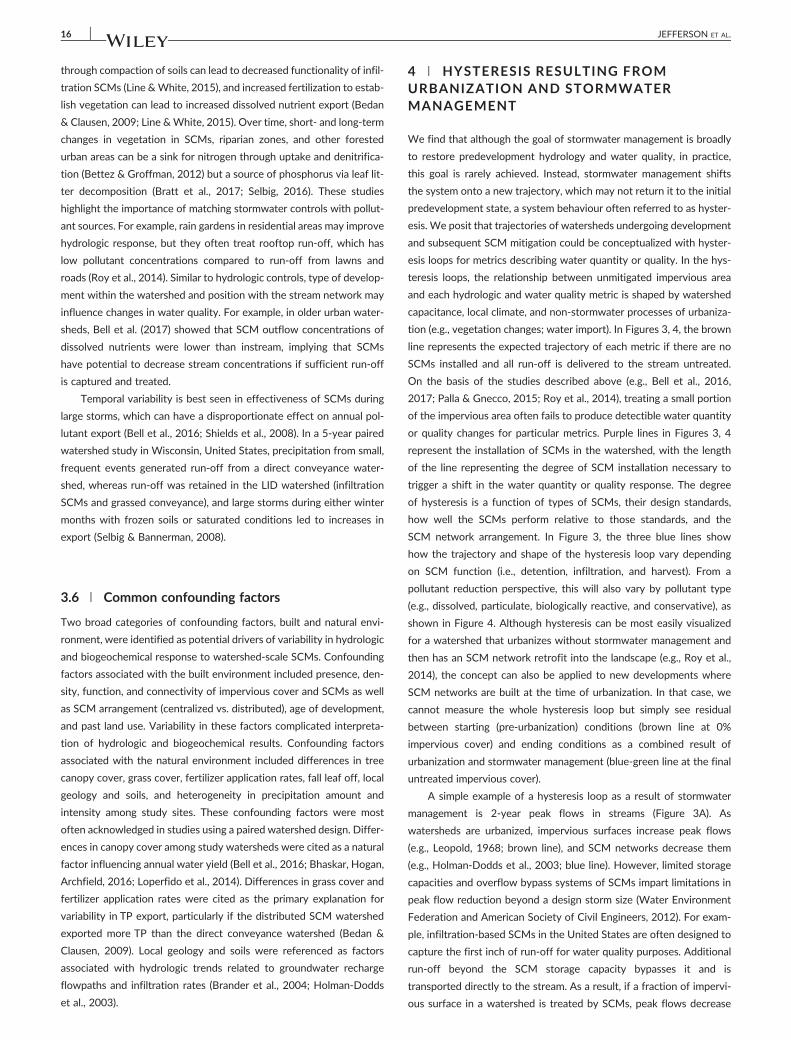
tion (e.g., vegetation changes; water import). In Figures 3, 4, the brown
line represents the expected trajectory of each metric if there are no
SCMs installed and all run‐off is delivered to the stream untreated.
On the basis of the studies described above (e.g., Bell et al., 2016,
2017; Palla & Gnecco, 2015; Roy et al., 2014), treating a small portion
of the impervious area often fails to produce detectible water quantity
or quality changes for particular metrics. Purple lines in Figures 3, 4
represent the installation of SCMs in the watershed, with the length
of the line representing the degree of SCM installation necessary to
trigger a shift in the water quantity or quality response. The degree
of hysteresis is a function of types of SCMs, their design standards,
how well the SCMs perform relative to those standards, and the
SCM network arrangement. In Figure 3, the three blue lines show
how the trajectory and shape of the hysteresis loop vary depending
on SCM function (i.e., detention, infiltration, and harvest). From a
pollutant reduction perspective, this will also vary by pollutant type
(e.g., dissolved, particulate, biologically reactive, and conservative), as
shown in Figure 4. Although hysteresis can be most easily visualized
for a watershed that urbanizes without stormwater management and
then has an SCM network retrofit into the landscape (e.g., Roy et al.,
2014), the concept can also be applied to new developments where
SCM networks are built at the time of urbanization. In that case, we
cannot measure the whole hysteresis loop but simply see residual
between starting (pre‐urbanization) conditions (brown line at 0%
impervious cover) and ending conditions as a combined result of
urbanization and stormwater management (blue‐green line at the final
untreated impervious cover).
A simple example of a hysteresis loop as a result of stormwater
management is 2‐year peak flows in streams (Figure 3A). As
watersheds are urbanized, impervious surfaces increase peak flows
(e.g., Leopold, 1968; brown line), and SCM networks decrease them
(e.g., Holman‐Dodds et al., 2003; blue line). However, limited storage
capacities and overflow bypass systems of SCMs impart limitations in
peak flow reduction beyond a design storm size (Water Environment
Federation and American Society of Civil Engineers, 2012). For exam-
ple, infiltration‐based SCMs in the United States are often designed to
capture the first inch of run‐off for water quality purposes. Additional
run‐off beyond the SCM storage capacity bypasses it and is
transported directly to the stream. As a result, if a fraction of impervi-
ous surface in a watershed is treated by SCMs, peak flows decrease

FIGURE 3 Conceptual model of urbanization and cumulative stormwater management effects on hydrologic response. The brown arrowrepresents the effects of urbanization processes where stormwater is uncontrolled. The purple arrow represents stormwater control measure(SCM) networks that treat too little impervious area for their effects to be detected. The blue arrows represent detectible effects of SCMimplementation. Long dashed lines indicate the effects of detention SCMs, short dashed lines indicate the effects of infiltration SCMs, and dashed‐dotted lines indicate the effects of harvest SCMs. The designed focus on peak flow mitigation across all SCM types means that their effect on peakflows is broadly similar, so is not broken out in (A). (A) Two‐year peak discharge versus untreated impervious cover. (B) Lag time versus untreatedimpervious cover. (C) Water yield (total annual discharge) versus untreated impervious cover. (D) Discharge recession coefficient (where highercoefficients indicate faster hydrograph recessions) versus untreated impervious cover. (E) Baseflow discharge versus untreated impervious cover
JEFFERSON ET AL. 17
but usually not by the extent they would if the treated impervious sur-
face did not exist at all. Even if 100% of impervious area is treated,
peak flows may remain higher than predevelopment flows. This con-
cept is presented in Figure 3A where the y‐intercept of blue line is
greater than the brown line.
We hypothesize that the shape of the hysteresis loop depends on
the functions supported by the SCMs. For example, lag times (e.g.,
between peak precipitation and peak discharge) tend to decrease with
urbanization (Figure 3B), whereas recession coefficients increase (i.e.,
falling limb returns to baseflow more rapidly), because of higher
drainage efficiency of engineered flowpaths (e.g., Leopold, 1968)
(Figure 3C). Detention SCMs increase lag times by having a storage
capacity that must be filled before release to the stream is maximized,
and decrease recession coefficients by supplementing flow on the
falling limb through slow release of stored water (e.g., McCuen,
1979). Infiltration‐based SCM networks can lead to even greater
delays between precipitation and arrival of SCM‐treated stormwater
at the stream by diverting water into slow subsurface flowpaths (e.g.,
Fanelli et al., 2017; Hood et al., 2007), resulting in more gradual reces-
sions (e.g., Bhaskar, Hogan, Archfield, 2016). Increased retention time
is the primary mechanism for sediment retention and therefore
reduces export of sediment and associated pollutants (e.g., Hogan &
Walbridge, 2007) but can also lead to increased production of algae
in nutrient rich systems (e.g., Gold et al., 2017), thereby increasing
particulate and dissolved organic matter (Figure 4). Conversely,
harvest‐based SCM networks would not be expected to have a large
effect on lag times or recession behaviour until substantial impervious
surface is treated, because their primary effect is to remove water from
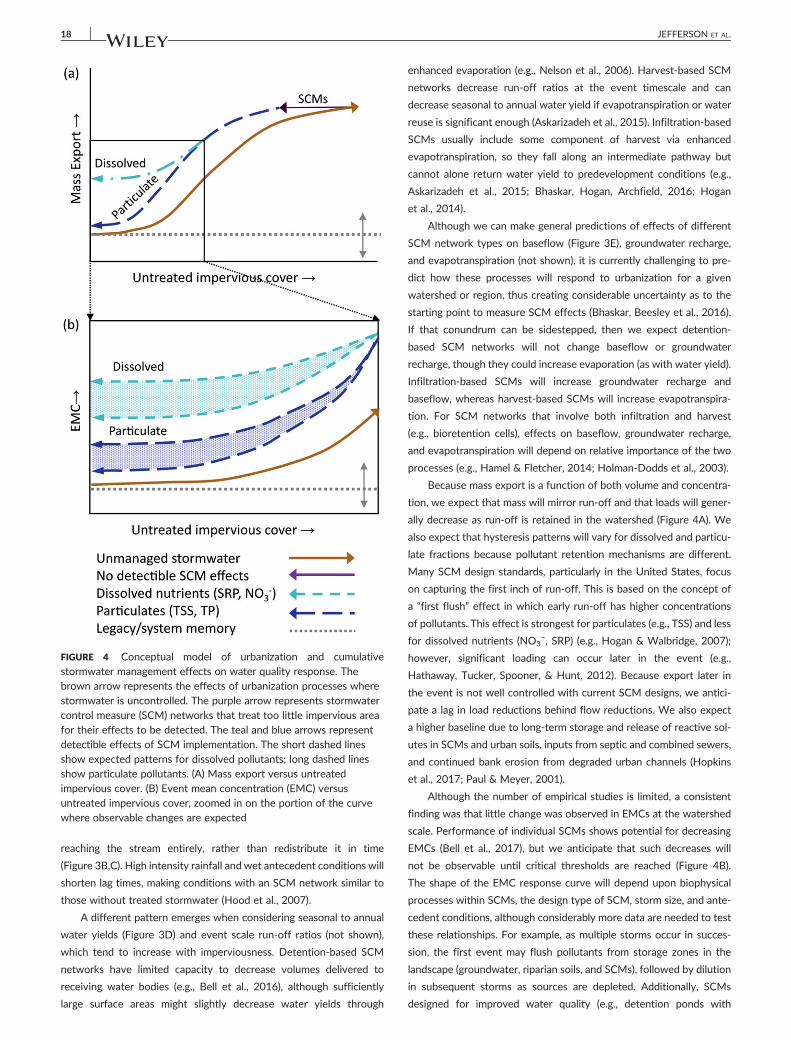
FIGURE 4 Conceptual model of urbanization and cumulativestormwater management effects on water quality response. Thebrown arrow represents the effects of urbanization processes wherestormwater is uncontrolled. The purple arrow represents stormwatercontrol measure (SCM) networks that treat too little impervious areafor their effects to be detected. The teal and blue arrows representdetectible effects of SCM implementation. The short dashed linesshow expected patterns for dissolved pollutants; long dashed linesshow particulate pollutants. (A) Mass export versus untreatedimpervious cover. (B) Event mean concentration (EMC) versusuntreated impervious cover, zoomed in on the portion of the curvewhere observable changes are expected
18 JEFFERSON ET AL.
reaching the stream entirely, rather than redistribute it in time
(Figure 3B,C). High intensity rainfall and wet antecedent conditions will
shorten lag times, making conditions with an SCM network similar to
those without treated stormwater (Hood et al., 2007).
A different pattern emerges when considering seasonal to annual
water yields (Figure 3D) and event scale run‐off ratios (not shown),
which tend to increase with imperviousness. Detention‐based SCM
networks have limited capacity to decrease volumes delivered to
receiving water bodies (e.g., Bell et al., 2016), although sufficiently
large surface areas might slightly decrease water yields through
enhanced evaporation (e.g., Nelson et al., 2006). Harvest‐based SCM
networks decrease run‐off ratios at the event timescale and can
decrease seasonal to annual water yield if evapotranspiration or water
reuse is significant enough (Askarizadeh et al., 2015). Infiltration‐based
SCMs usually include some component of harvest via enhanced
evapotranspiration, so they fall along an intermediate pathway but
cannot alone return water yield to predevelopment conditions (e.g.,
Askarizadeh et al., 2015; Bhaskar, Hogan, Archfield, 2016; Hogan
et al., 2014).
Although we can make general predictions of effects of different
SCM network types on baseflow (Figure 3E), groundwater recharge,
and evapotranspiration (not shown), it is currently challenging to pre-
dict how these processes will respond to urbanization for a given
watershed or region, thus creating considerable uncertainty as to the
starting point to measure SCM effects (Bhaskar, Beesley et al., 2016).
If that conundrum can be sidestepped, then we expect detention‐
based SCM networks will not change baseflow or groundwater
recharge, though they could increase evaporation (as with water yield).
Infiltration‐based SCMs will increase groundwater recharge and
baseflow, whereas harvest‐based SCMs will increase evapotranspira-
tion. For SCM networks that involve both infiltration and harvest
(e.g., bioretention cells), effects on baseflow, groundwater recharge,
and evapotranspiration will depend on relative importance of the two
processes (e.g., Hamel & Fletcher, 2014; Holman‐Dodds et al., 2003).
Because mass export is a function of both volume and concentra-
tion, we expect that mass will mirror run‐off and that loads will gener-
ally decrease as run‐off is retained in the watershed (Figure 4A). We
also expect that hysteresis patterns will vary for dissolved and particu-
late fractions because pollutant retention mechanisms are different.
Many SCM design standards, particularly in the United States, focus
on capturing the first inch of run‐off. This is based on the concept of
a “first flush” effect in which early run‐off has higher concentrations
of pollutants. This effect is strongest for particulates (e.g., TSS) and less
for dissolved nutrients (NO3−, SRP) (e.g., Hogan & Walbridge, 2007);
however, significant loading can occur later in the event (e.g.,
Hathaway, Tucker, Spooner, & Hunt, 2012). Because export later in
the event is not well controlled with current SCM designs, we antici-
pate a lag in load reductions behind flow reductions. We also expect
a higher baseline due to long‐term storage and release of reactive sol-
utes in SCMs and urban soils, inputs from septic and combined sewers,
and continued bank erosion from degraded urban channels (Hopkins
et al., 2017; Paul & Meyer, 2001).
Although the number of empirical studies is limited, a consistent
finding was that little change was observed in EMCs at the watershed
scale. Performance of individual SCMs shows potential for decreasing
EMCs (Bell et al., 2017), but we anticipate that such decreases will
not be observable until critical thresholds are reached (Figure 4B).
The shape of the EMC response curve will depend upon biophysical
processes within SCMs, the design type of SCM, storm size, and ante-
cedent conditions, although considerably more data are needed to test
these relationships. For example, as multiple storms occur in succes-
sion, the first event may flush pollutants from storage zones in the
landscape (groundwater, riparian soils, and SCMs), followed by dilution
in subsequent storms as sources are depleted. Additionally, SCMs
designed for improved water quality (e.g., detention ponds with

JEFFERSON ET AL. 19
wetland vegetation) would cause different response than SCMs
designed for flood control or water capture (Koch et al., 2014).
5 | MANAGEMENT IMPLICATIONS ANDNEXT STEPS FOR RESEARCH
Hydrology of urban watersheds with managed stormwater differs from
predevelopment conditions for several reasons. First, despite
“treating” an impervious area by design, stormwater management is
typically not designed with sufficient storage to mitigate all run‐off
from that area. Second, SCM effectiveness at the site scale is not sim-
ply additive to cumulative effectiveness of SCM networks at the
watershed scale because of differential time lags, SCM interaction,
inconsistent water quality mechanisms, and spatial arrangement. Last,
impacts of urbanization beyond impervious surfaces continue to alter
hydrology. Conceptually, it is possible to return to a predevelopment
hydrologic condition (Askarizadeh et al., 2015) without the residuals
illustrated in the above hysteresis curves if SCM networks perfectly
mitigate all effects of urbanization.
Given designs of individual SCMs, an SCM network aiming to
achieve predevelopment hydrologic function may have to include
redundant SCMs to ensure no run‐off is generated. Micro‐scale source
control SCMs (e.g., permeable pavement sidewalks and driveways,
downspouts with dry wells, and streetside swales) that treat run‐off
directly where it is generated could be effective at treating the full vol-
ume of stormwater generated across a wide range of hydrologic condi-
tions. Redundant and micro‐scale SCM networks could be cost
prohibitive in many areas, especially where stormwater control is
retrofitted into existing urban areas. Such strategies may be easier to
implement in new development, where SCM networks are explicitly
included in the initial development. The concept of watershed capaci-
tance should be expanded to include the ease with which an effective
SCM network can be implemented, given available space, existing
infrastructure, and natural landscape characteristics.
Regulatory frameworks or economic incentive structures would
likely need to change to encourage widespread adoption of
stormwater management strategies that emphasize redundant SCMs
or micro‐scale source control for all surfaces, as may be needed to
attain predevelopment hydrologic and water quality conditions. Inten-
sification of precipitation extremes in a globally changing climate may
spur such stormwater management strategies as current approaches
become insufficient to protect communities and infrastructure from
flooding or minimize environmental degradation.
Review of existing literature on cumulative effects of stormwater
management suggests several key areas where research is needed.
Hysteresis curves (Figures 3–4) are based on available data and under-
standing of processes driving hydrologic and water quality response
but ultimately serve as a suite of testable hypotheses for future
research across regions with varying watershed capacitance. Because
it is rare to be able to track a watershed along the full hysteresis path-
way illustrated, creative approaches to modelling and empirical studies
are needed to disentangle the magnitude and causes of hysteresis and
residuals between predevelopment and managed stormwater condi-
tions. The preponderance of studies in temperate and humid
environments also means that a different set of hysteresis curves
may be needed for tropical and arid or semi‐arid regions, where
existing literature is much sparser.
One obvious, but difficult, next step is that we need more empirical
studies on cumulative SCM effectiveness, particularly for watersheds
that are large (>20 km2) and have a high intensity of urbanization and
SCM treatment. At these larger scales, commonly used modelling
approaches tend to simplify reality to such an extent that important
nuances may be missed, because including all processes would result
in complex models, with high data needs and computing requirements.
For empirical studies, it is difficult to identify where large, highly urban
and highly treated watersheds exist, as larger watersheds tend to have
low SCM treatment intensity (Bell et al., 2016). However, one of many
institutional barriers to regional implementation of stormwater
management is uncertainty in regional‐scale performance of SCM
networks, which can only be addressed by a larger number of
regional‐scale studies in a variety of settings (Roy et al., 2008).
This work identifies the need for a common set of response met-
rics reported across studies, enabling more robust meta‐analyses.
Across 89 studies of hydrologic response, there were 28 metrics
reported, and across 34 studies of water quality, 17 different pollut-
ants were reported at event and annual scales. Even where common
metrics were used, reference conditions to which metrics could be
compared were variable (undeveloped, direct conveyance, or
detention SCMs), making quantitative comparisons difficult. Simulta-
neously, it is important to note that much more is known about peak
flows, flow volumes, and water yields than other aspects of the
hydrograph (e.g., recession) or water balance components (e.g., evapo-
transpiration and groundwater recharge), yet these hydrologic func-
tions play important roles in influencing biogeochemical processes
and ecosystem function. The paucity of empirical studies on water
quality response highlights additional challenges including sample
collection and analysis cost, logistical constraints, and highly variable
responses. Advances in sensor technology (Rode et al., 2016) have
great potential to rapidly advance our understanding of temporal
dynamics, but these are currently often cost prohibitive.
Hydrological and water quality models that incorporate SCM
effectiveness have great potential to enhance understanding of hyster-
esis effects shown in Figures 3 and 4. However, SCM model parame-
ters are typically based on observational monitoring studies of single
SCMs. As these are aggregated to the watershed scale, it is important
to consider interacting effects of SCMs in series (e.g., treatment trains),
age of practices, and effectiveness across a range of storm sizes and
antecedent conditions. These issues are particularly important as
hydrologic intensification is expected to increase.
This synthesis of 100 studies reveals broad patterns of SCM net-
work effectiveness and supports current practices that emphasize infil-
tration and harvest SCMs rather than detention‐based SCM networks.
However, examining these studies revealed gaps in our understanding
of how SCM networks can be implemented to restore hydrologic func-
tion in diverse climatic and urban settings at a variety of scales. Our
findings also emphasize that instream improvements in water quality
are often the result of run‐off reduction, rather than biophysical pro-
cesses happening within individual SCMs. Despite the body of work
reviewed here, it is clear that there is significant need for research to

20 JEFFERSON ET AL.
fill these gaps and inform design and management of SCM networks
and enhance protection of communities and aquatic ecosystems.
ACKNOWLEDGMENTS
Any use of trade, firm, or product names is for descriptive purposes
only and does not imply endorsement by the U.S. Government. P. A.
was supported by a postdoctoral fellowship from Kent State Univer-
sity. A. B. was partially supported by NSF‐EAR Postdoctoral Fellowship
1349815. K. H. was partially supported by a postdoctoral fellowship
from the National Socio‐Environmental Synthesis Center (SESYNC)
National Science Foundation Award DBI‐1052875. S. M. acknowl-
edges support of USDA/NIFA S‐1063. The authors thank William
Selbig from the U.S. Geological Survey and an anonymous reviewer,
whose comments greatly improved this manuscript.
ORCID
Anne J. Jefferson http://orcid.org/0000-0002-0585-9602
Aditi S. Bhaskar http://orcid.org/0000-0001-9803-4003
Kristina G. Hopkins http://orcid.org/0000-0003-1699-9384
Rosemary Fanelli http://orcid.org/0000-0002-0874-1925
Pedro M. Avellaneda http://orcid.org/0000-0002-5883-0344
Sara K. McMillan http://orcid.org/0000-0001-7197-7079
REFERENCES
Ahiablame, L. M., Engel, B. A., & Chaubey, I. (2012). Effectiveness of lowimpact development practices: Literature review and suggestions forfuture research. Water, Air, and Soil Pollution, 223(7), 4253–4273.https://doi.org/10.1007/s11270‐012‐1189‐2
Ahiablame, L. M., Engel, B. A., & Chaubey, I. (2013). Effectiveness of lowimpact development practices in two urbanized watersheds:Retrofitting with rain barrel/cistern and porous pavement. Journal ofEnvironmental Management, 119, 151–161. https://doi.org/10.1016/j.jenvman.2013.01.019
Ahiablame, L. M., & Shakya, R. (2016). Modeling flood reduction effects oflow impact development at a watershed scale. Journal of EnvironmentalManagement, 171, 81–91. https://doi.org/10.1016/j.jenvman.2016.01.036
Appleyard, S. (1995). The impact of urban development on recharge andgroundwater quality in a coastal aquifer near Perth, Western Australia.Hydrogeology Journal, 3(2), 65–75. https://doi.org/10.1007/s100400050072
Aryal, S. K., Ashbolt, S., & Mcintosh, B. S. (2016). Assessing and mitigatingthe hydrological impacts of urbanisation in semi‐urban catchmentsusing the storm water management model. Water Resources Manage-ment, 5437–5454. https://doi.org/10.1007/s11269‐016‐1499‐z
Askarizadeh, A., Rippy, M. A., Fletcher, T. D., Feldman, D. L., Peng, J.,Bowler, P., … Grant, S. B. (2015). From rain tanks to catchments: Useof low‐impact development to address hydrologic symptoms of theurban stream syndrome. Environmental Science & Technology, 49(19),11264–11280. https://doi.org/10.1021/acs.est.5b01635
Aulenbach, B. T., Joiner, J. K., & Painter, J. A. (2017). Hydrology and waterquality in 13 watersheds in Gwinnett County, Georgia, 2001–15. USGeological Survey Scientific Investigations Report 2017–5012.
Avellaneda, P. M., Jefferson, A. J., Grieser, J. M., & Bush, S. A. (2017). Sim-ulation of the cumulative hydrological response to green infrastructure.Water Resources Research, 53, 3087–3101. https://doi.org/10.1002/2016WR019836
Baek, S. S., Choi, D. H., Jung, J. W., Lee, H. J. H., Lee, H. J. H., Yoon, K. S., …Cho, K. H. (2015). Optimizing low impact development (LID) forstormwater runoff treatment in urban area, Korea: Experimental andmodeling approach. Water Research, 86, 122–131. https://doi.org/10.1016/j.watres.2015.08.038
Balascio, C. C., & Lucas, W. C. (2009). A survey of storm‐water manage-ment water quality regulations in four mid‐Atlantic states. Journal ofEnvironmental Management, 90(1), 1–7. https://doi.org/10.1016/j.jenvman.2007.10.006
Barron, O. V., Barr, A. D., & Donn, M. J. (2013). Effect of urbanisation onthe water balance of a catchment with shallow groundwater. Journalof Hydrology, 485, 162–176. https://doi.org/10.1016/j.jhydrol.2012.04.027
Bedan, E. S., & Clausen, J. C. (2009). Stormwater runoff quality and quantityfrom traditional and low impact development watersheds (1). Journal ofthe American Water Resources Association, 45(4), 998–1008. https://doi.org/10.1111/J.1752‐1688.2009.00342.X
Bell, C. D., McMillan, S. K., Clinton, S. M., & Jefferson, A. J. (2016). Hydro-logic response to stormwater control measures in urban watersheds.Journal of Hydrology, 541, 1488–1500. https://doi.org/10.1016/j.jhydrol.2016.08.049
Bell, C. D., McMillan, S. K., Clinton, S. M., & Jefferson, A. J. (2017). Charac-terizing the effects of stormwater mitigation on nutrient export andstream concentrations. Environmental Management, 59(4), 604–618.https://doi.org/10.1007/s00267‐016‐0801‐4
Bettez, N. D., & Groffman, P. M. (2012). Denitrification potential instormwater control structures and natural riparian zones in an urbanlandscape. Environmental Science & Technology, 46(20), 10909–10917.https://doi.org/10.1021/es301409z
Bhaskar, A. S., Beesley, L., Burns, M. J., Fletcher, T. D., Hamel, P., Oldham, C.E., & Roy, A. H. (2016). Will it rise or will it fall? Managing the complexeffects of urbanization on base flow. Freshwater Science, 35(1), 293–310. https://doi.org/10.1086/685084
Bhaskar, A. S., Hogan, D. M., & Archfield, S. A. (2016). Urban base flow withlow impact development. Hydrological Processes, 30(18), 3156–3171.https://doi.org/10.1002/hyp.10808
Booth, D. B., & Jackson, C. R. (1997). Urbanization of aquatic systems: Deg-radation thresholds, stormwater detection, and the limits of mitigation.JAWRA Journal of the American Water Resources Association, 33(5),1077–1090. https://doi.org/10.1111/j.1752‐1688.1997.tb04126.x
Borne, K. E., Fassman, E. A., & Tanner, C. C. (2013). Floating treatment wet-land retrofit to improve stormwater pond performance for suspendedsolids, copper and zinc. Ecological Engineering, 54, 173–182. https://doi.org/10.1016/j.ecoleng.2013.01.031
Brander, K. E., Owen, K. E., & Potter, K. W. (2004). Modeled impacts of de-velopment type on runoff volume and infiltration performance. JAWRAJournal of the American Water Resources Association, 40(4), 961–969.
Bratt, A. R., Finlay, J. C., Hobbie, S. E., Janke, B. D., Worm, A. C., & Kemmitt,K. L. (2017). Contribution of leaf litter to nutrient export during wintermonths in an urban residential watershed. Environmental Science &Technology. acs.est.6b06299 https://doi.org/10.1021/acs.est.6b06299
Burns, M. J., Fletcher, T. D., Hatt, B. E., Anthony, R., & Walsh, C. J. (2010).Can allotment‐scale rainwater harvesting manage urban flood riskand protect stream health? Novatech 7th International Conference.2010: 1–10.
Burns, M. J., Fletcher, T. D., Walsh, C. J., Ladson, A. R., & Hatt, B. E. (2012).Hydrologic shortcomings of conventional urban stormwater manage-ment and opportunities for reform. Landscape and Urban Planning,105(3), 230–240. https://doi.org/10.1016/j.landurbplan.2011.12.012
Burns, M., Fletcher, T. D., Walsh, C., Bos, D., Imberger, S., Duncan, H., & Li, C.(2016). Hydrologic and water quality responses to catchment‐wideimplementation of stormwater control measures. Novatech 2016 Interna-tional Conference. 2016: 1–4.
Carter, T., & Jackson, C. R. (2007). Vegetated roofs for stormwater manage-ment at multiple spatial scales. Landscape and Urban Planning, 80(1–2),84–94. https://doi.org/10.1016/j.landurbplan.2006.06.005
CEC. (2000). Directive of the European Parliament and of the Council (CEC)2000/60 establishing a framework for community action in the field ofwater policy. Luxembourg.
Chen, C. F., Sheng, M. Y., Chang, C. L., Kang, S. F., & Lin, J. Y. (2014). Appli-cation of the SUSTAIN model to a watershed‐scale case for water

JEFFERSON ET AL. 21
quality management. Water, 6(12), 3575–3589. https://doi.org/10.3390/w6123575
Chen, D., Hu, M., Guo, Y., & Dahlgren, R. A. (2015). Influence of legacyphosphorus, land use, and climate change on anthropogenic phospho-rus inputs and riverine export dynamics. Biogeochemistry, 123(1–2),99–116. https://doi.org/10.1007/s10533‐014‐0055‐2
Collins, K. A., Lawrence, T. J., Stander, E. K., Jontos, R. J., Kaushal, S. S.,Newcomer, T. A., … Cole Ekberg, M. L. (2010). Opportunities and chal-lenges for managing nitrogen in urban stormwater: A review andsynthesis. Ecological Engineering, 36(11), 1507–1519. https://doi.org/10.1016/j.ecoleng.2010.03.015
Damodaram, C., Giacomoni, M. H., Prakash‐Khedun, C., Holmes, H., Ryan,A., Saour, W., & Zechman, E. (2010). Simulation of Combined BestManagement Practices and Low Impact Development SustainableStormwater Management. Journal of the American Water ResourcesAssociation, https://doi.org/10.1111/j.1752‐1688.2010.00462.x
Davis, A. P. (2007). Field performance of bioretention: Water quality. Envi-ronmental Engineering Science, 24(8), 1048–1064. https://doi.org/10.1089/ees.2006.0190
Davis, A. P., Shokouhian, M., Sharma, H., Minami, C., & Winogradoff, D.(2003). Water quality improvement through bioretention: Lead, copper,and zinc removal. Water Environment Research, 75(1), 73–82. Availableat: http://www.jstor.org/stable/25045664
Di Vittorio, D., & Ahiablame, L. (2015). Spatial translation and scaling up oflow impact development designs in an urban watershed. Journal ofWater Management Modeling, 1–9. https://doi.org/10.14796/JWMM.C388
Dietz, M. E., & Clausen, J. C. (2006). Saturation to improve pollutant reten-tion in a rain garden. Environmental Science & Technology, 40(4), 1335–1340. https://doi.org/10.1021/es051644f
Dietz, M. E., & Clausen, J. C. (2008). Stormwater runoff and export changeswith development in a traditional and low impact subdivision. Journal ofEnvironmental Management, 87(4), 560–566. https://doi.org/10.1016/j.jenvman.2007.03.026
Duan, S., Newcomer‐Johnson, T., Mayer, P., & Kaushal, S. (2016). Phospho-rus retention in stormwater control structures across streamflow inurban and suburban watersheds. Water, 8(9), 390. https://doi.org/10.3390/w8090390
Elliott, A. H., & Trowsdale, S. A. (2007). A review of models for low impacturban stormwater drainage. Environmental Modelling & Software, 22(3),394–405. https://doi.org/10.1016/j.envsoft.2005.12.005
Elliott, A. H., Trowsdale, S. A., & Wadhwa, S. (2009). Effect of aggregationof on‐site storm‐water control devices in an urban catchment model.Journal of Hydrologic Engineering, 14(9), 975–983.
Emerson, C. H., Welty, C., & Traver, R. G. (2005). Watershed‐scale evalua-tion of a system of storm water detention basins. Journal of HydrologicEngineering, 10(3), 237. https://doi.org/10.1061/(ASCE)1084‐0699(2005)10:3(237)
Endreny, T., & Collins, V. (2009). Implications of bioretention basin spatialarrangements on stormwater recharge and groundwater mounding.Ecological Engineering, 35(5), 670–677. https://doi.org/10.1016/j.ecoleng.2008.10.017
EPA. (2007). Use of green infrastructure in NPDES permits and enforce-ment Available at: https://www.epa.gov/sites/production/files/2015‐10/documents/gi_memo_enforce_0.pdf [Accessed 23 August 2017]
Fanelli, R., Prestegaard, K., & Palmer, M. (2017). Evaluation of infiltration‐based stormwater management to restore hydrological processes inurban headwater catchments. Hydrological Processes. https://doi.org/10.1002/hyp.11266
Feng, Y., Burian, S., & Pomeroy, C. (2016). Potential of green infrastructureto restore predevelopment water budget of a semi‐arid urban catch-ment. Journal of Hydrology, 542, 744–755. https://doi.org/10.1016/j.jhydrol.2016.09.044
Fletcher, T. D., Mitchell, V. G., Deletic, A., Ladson, T. R., & Se, A. (2007). Isstormwater harvesting beneficial to urban waterway environmentalflows? 265–272 https://doi.org/10.2166/wst.2007.117
Fletcher, T. D., Shuster, W., Hunt, W. F., Ashley, R., Butler, D., Arthur, S.,… Viklander, M. (2015). SUDS, LID, BMPs, WSUD and more – Theevolution and application of terminology surrounding urban drainage.Urban Water Journal, 12(7), 525–542. https://doi.org/10.1080/1573062X.2014.916314
Freni, G., Mannina, G., & Viviani, G. (2010). Urban storm‐water quality man-agement: Centralized versus source control. Journal of Water ResourcesPlanning and Management, 136(2), 268–278.
Gagrani, V., Diemer, J. A., Karl, J. J., & Allan, C. J. (2014). Assessing thehydrologic and water quality benefits of a network of stormwater con-trol measures in a SE US Piedmont watershed. Journal of the AmericanWater Resources Association, 50(1), 128–142. https://doi.org/10.1111/jawr.12121
Gebert, W. A., Rose, W. J., & Garn, H. S. (2012). Evaluation of the effects ofCity of Middleton stormwater‐management practices on streamflowand water‐quality characteristics of Pheasant Branch, Dane County,Wisconsin, 1975–2008. US Geol Surv Sci Invest Rep, 5014.
Giacomoni, M. H., Gomez, R., & Berglund, E. Z. (2014). Hydrologic impactassessment of land cover change and stormwater management usingthe hydrologic footprint residence. JAWRA Journal of the AmericanWater Resources Association, 5, 1242. https://doi.org/10.1111/jawr.12187
Gilroy, K. L., & McCuen, R. H. (2009). Spatio‐temporal effects of low impactdevelopment practices. Journal of Hydrology, 367(3–4), 228–236.https://doi.org/10.1016/j.jhydrol.2009.01.008
Göbel, P., Stubbe, H., Weinert, M., Zimmermann, J., Fach, S., Dierkes, C., &Coldewey, W. G. (2004). Near‐natural stormwater management and itseffects on the water budget and groundwater surface in urban areastaking account of the hydrogeological conditions. Journal of Hydrology,299(3–4), 267–283.
Gold, A. C., Thompson, S. P., & Piehler, M. F. (2017). Water quality beforeand after watershed‐scale implementation of stormwater wet pondsin the coastal plain. Ecological Engineering, 105, 240–251. https://doi.org/10.1016/j.ecoleng.2017.05.003
Gregory, J., Dukes, M., Jones, P., & Miller, G. (2006). Effect of urban soilcompaction on infiltration rate. Journal of Soil and Water Conservation,61(3), 117–124.
Grimm, N. B., Faeth, S. H., Golubiewski, N. E., Redman, C. L., Wu, J., Bai, X.,& Briggs, J. M. (2008). Global change and the ecology of cities. Science,319(5864), 756–760. https://doi.org/10.1126/science.1150195
Guan, M., Sillanpää, N., & Koivusalo, H. (2015). Assessment of LID practicesfor restoring pre‐development runoff regime in an urbanized catchmentin southern Finland. Water Science and Technology, 71(10), 1485–1491.https://doi.org/10.2166/wst.2015.129
Hale, R. L., Turnbull, L., Earl, S. R., Childers, D. L., & Grimm, N. B. (2015).Stormwater infrastructure controls runoff and dissolved material exportfrom arid urban watersheds. Ecosystems, 18(1), 62–75. https://doi.org/10.1007/s10021‐014‐9812‐2
Hamel, P., Daly, E., & Fletcher, T. D. (2013). Source‐control stormwatermanagement for mitigating the impacts of urbanisation on baseflow:A review. Journal of Hydrology, 485, 201–211. https://doi.org/10.1016/j.jhydrol.2013.01.001
Hamel, P., & Fletcher, T. D. (2014). The impact of stormwater source‐con-trol strategies on the (low) flow regime of urban catchments. WaterScience and Technology, 69(4), 739–745. https://doi.org/10.2166/wst.2013.772
Hamilton, S. K. (2012). Biogeochemical time lags may delay responses ofstreams to ecological restoration. Freshwater Biology, 57, 43–57.https://doi.org/10.1111/j.1365‐2427.2011.02685.x
Hathaway, J. M., & Hunt, W. F. (2010). Evaluation of storm‐water wet-lands in series in Piedmont North Carolina. Journal of EnvironmentalEngineering, 136(1), 140–146. https://doi.org/10.1061/(ASCE)EE.1943‐7870.0000130
Hathaway, J. M., Tucker, R. S., Spooner, J. M., & Hunt, W. F. (2012). A tra-ditional analysis of the first flush effect for nutrients in stormwater

22 JEFFERSON ET AL.
runoff from two small urban catchments. Water, Air, & Soil Pollution,223(9), 5903–5915. https://doi.org/10.1007/s11270‐012‐1327‐x
Hatt, B. E., Fletcher, T. D., Walsh, C. J., & Taylor, S. L. (2004). The influenceof urban density and drainage infrastructure on the concentrations andloads of pollutants in small streams. Environmental Management, 34(1).https://doi.org/10.1007/s00267‐004‐0221‐8
Hatt, B. E., Fletcher, T. D., & Deletic, A. (2009). Hydrologic and pollutantremoval performance of stormwater biofiltration systems at the fieldscale. Journal of Hydrology, 365(3–4), 310–321. https://doi.org/10.1016/j.jhydrol.2008.12.001
Hogan, D., Jarnagin, S. T., Loperfido, J. V., & Van Ness, K. (2014). Mitigatingthe effects of landscape development on streams in urbanizing water-sheds. Journal of the American Water Resources Association, 50(1),163–178. https://doi.org/10.1111/jawr.12123
Hogan, D. M., & Walbridge, M. R. (2007). Urbanization and nutrient reten-tion in freshwater riparian wetlands. Ecological Applications, 17(4),1142–1155. https://doi.org/10.1890/06‐0185
Holman‐Dodds, J. K., Bradley, A. A., & Potter, K. W. (2003). Evaluation ofhydrologic benefits of infiltration based urban storm water manage-ment. Journal of the American Water Resources Association, 39(1), 205–215. https://doi.org/10.1111/j.1752‐1688.2003.tb01572.x
Hood, M. J., Clausen, J. C., & Warner, G. S. (2007). Comparison ofStormwater lag times for low impact and traditional residential develop-ment. Journal of the American Water Resources Association, 43(4), 1036–1046. https://doi.org/10.1111/j.1752‐1688.2007.00085.x
Hopkins, K. G., Loperfido, J. V., Craig, L. S., Noe, G. B., & Hogan, D. M.(2017). Comparison of sediment and nutrient export and runoff charac-teristics from watersheds with centralized versus distributedstormwater management. Journal of Environmental Management, 203,286–298. https://doi.org/10.1016/j.jenvman.2017.07.067
Hopkins, K. G., Morse, N. B., Bain, D. J., Bettez, N. D., Grimm, N. B., Morse,J. L., … Suchy, A. K. (2015). Assessment of regional variation instreamflow responses to urbanization and the persistence of physiogra-phy. Environmental Science & Technology, 49(5), 2724–2732. https://doi.org/10.1021/es505389y
Hunt, W. F., Jarrett, A. R. R., Smith, J. T., & Sharkey, L. J. (2006). Evaluatingbioretention hydrology and nutrient removal at three field sites in NorthCarolina. Journal of Irrigation and Drainage Engineering, 132(6), 600–608.https://doi.org/10.1061/(ASCE)0733‐9437(2006)132:6(600)
Hur, J., Schlautman, M. A., Templeton, S. R., Karanfil, T., Post, C. J., Smink, J.A., … Hayes, J. C. (2008). Does current management of storm waterrunoff adequately protect water resources in developing catchments?Journal of Soil and Water Conservation, 63, 2.
Hurley, S. E., & Forman, R. T. T. (2011). Stormwater ponds and biofilters forlarge urban sites: Modeled arrangements that achieve the phosphorusreduction target for Boston's Charles River, USA. Ecological Engineering,37(6), 850–863. https://doi.org/10.1016/j.ecoleng.2011.01.008
James, M. B., & Dymond, R. L. (2012). Bioretention hydrologic perfor-mance in an urban stormwater network. Journal of HydrologicEngineering, 17(3), 431–436. https://doi.org/10.1061/(ASCE)HE.1943‐5584.0000448
Jarden, K. M., Jefferson, A. J., & Grieser, J. M. (2016). Assessing the effectsof catchment‐scale urban green infrastructure retrofits on hydrographcharacteristics. Hydrological Processes, 30(10), 1536–1550. https://doi.org/10.1002/hyp.10736
Jefferson, A. J., Bell, C. D., Clinton, S. M., & McMillan, S. K. (2015). Applica-tion of isotope hydrograph separation to understand contributions ofstormwater control measures to urban headwater streams. HydrologicalProcesses, 29(25), 5290–5306. https://doi.org/10.1002/hyp.10680
Jia, H., Lu, Y., Yu, S. L., & Chen, Y. (2012). Planning of LID – BMPs for urbanrunoff control: The case of Beijing Olympic Village. Separation and Puri-fication Technology, 84, 112–119. https://doi.org/10.1016/j.seppur.2011.04.026
Jia, H., Yao, H., Tang, Y., Yu, S. L., Field, R., & Tafuri, A. N. (2015). LID‐BMPsplanning for urban runoff control and the case study in China. Journal of
Environmental Management, 149, 65–76. https://doi.org/10.1016/j.jenvman.2014.10.003
Kessler, S., Meyer, B., Seeling, S., Tressel, E., & Krein, A. (2012). Influence ofnear‐to‐nature stormwater management on the local water balanceusing the example of an urban development area. Water EnvironmentResearch, 84(5), 441–451. https://doi.org/10.2175/106143012X13347678384729
Koch, B. J., Febria, C. M., Gevrey, M., Wainger, L. A., & Palmer, M. A. (2014).Nitrogen removal by stormwater management structures: A data syn-thesis. JAWRA Journal of the American Water Resources Association,50(6), 1594–1607. https://doi.org/10.1111/jawr.12223
Ku, H. F. H., Hagelin, N. W., & Buxton, H. T. (1992). Effects of urban storm‐runoff control on ground‐water recharge in Nassau County, New York.Ground Water, 30(4), 507–514. https://doi.org/10.1111/j.1745‐6584.1992.tb01526.x
Law, N., Band, L., & Grove, M. (2004). Nitrogen input from residential lawncare practices in suburban watersheds in Baltimore county, MD. Journalof Environmental Planning and Management, 47(5), 737–755. https://doi.org/10.1080/0964056042000274452
Lee, J. G., Selvakumar, A., Alvi, K., Riverson, J., Zhen, J. X., Shoemaker, L., &Lai, F.‐H. (2012). A watershed‐scale design optimization model forstormwater best management practices. Environmental Modelling &Software, 37, 6–18. https://doi.org/10.1016/j.envsoft.2012.04.011
Leopold, L. (1968). Hydrology for urban land planning – A guidebook on thehydrologic effects of urban land use. Washington, D.C.: U.S. GeologicalSurvey.
Li, C., Fletcher, T. D., Duncan, H. P., & Burns, M. J. (2017). Can stormwatercontrol measures restore altered urban flow regimes at the catchmentscale? Journal of Hydrology, 549, 631–653. https://doi.org/10.1016/j.jhydrol.2017.03.037
Lim, T. C. (2016). Predictors of urban variable source area: A cross‐sectionalanalysis of urbanized catchments in the United States. Hydrological Pro-cesses, 30(25), 4799–4814. https://doi.org/10.1002/hyp.10943
Line, D. E., & White, N. M. (2015). Runoff and pollutant export from aLID subdivision in North Carolina. Journal of Environmental Engineer-ing, 142(1). 4015052 https://doi.org/10.1061/(ASCE)EE.1943‐7870.0001018
Liu, W., Chen, W., & Peng, C. (2015). Influences of setting sizes and combi-nation of green infrastructures on community's stormwater runoffreduction. Ecological Modelling, 318, 236–244. https://doi.org/10.1016/j.ecolmodel.2014.11.007
Liu, Y. Z., Bralts, V. F., & Engel, B. A. (2015). Evaluating the effectiveness ofmanagement practices on hydrology and water quality at watershedscale with a rainfall‐runoff model. Science of the Total Environment,511, 298–308. https://doi.org/10.1016/j.scitotenv.2014.12.077
Liu, Y. Z., Engel, B. A., Flanagan, D. C., Gitau, M. W., McMillan, S. K., &Chaubey, I. (2017). A review on effectiveness of best managementpractices in improving hydrology and water quality: Needs and oppor-tunities. Science of the Total Environment, 601–602, 580–593. https://doi.org/10.1016/j.scitotenv.2017.05.212
Liu, Y. Z., Theller, L. O., Pijanowski, B. C., & Engel, B. A. (2016). Optimalselection and placement of green infrastructure to reduce impacts ofland use change and climate change on hydrology and water quality:An application to the Trail Creek watershed, Indiana. Science of theTotal Environment, 553, 149–163. https://doi.org/10.1016/j.scitotenv.2015.02.116
Locatelli, L., Mark, O., Steen, P., Arnbjerg‐nielsen, K., Deletic, A., Roldin, M.,& John, P. (2017). Hydrologic impact of urbanization with extensivestormwater infiltration. Journal of Hydrology, 544, 524–537. https://doi.org/10.1016/j.jhydrol.2016.11.030
Loperfido, J. V., Noe, G. B., Jarnagin, S. T., & Hogan, D. M. (2014). Effects ofdistributed and centralized stormwater best management practices andland cover on urban stream hydrology at the catchment scale. Journal ofHydrology, 519(PC), 2584–2595. https://doi.org/10.1016/j.jhydrol.2014.07.007

JEFFERSON ET AL. 23
Lucas, S. A., & Coombes, P. J. (2009). The performance of infiltrationtrenches constructed to manage stormwater runoff from an existingurbanised catchment in H2009: 32nd hydrology and water resourcessymposium, Newcastle: Adapting to change (p. 390). EngineersAustralia.
Lucas, W. C., & Sample, D. J. (2015). Reducing combined sewer overflowsby using outlet controls for green stormwater infrastructure: Casestudy in Richmond, Virginia. Journal of Hydrology, 520, 473–488.https://doi.org/10.1016/j.jhydrol.2014.10.029
Maimone, M., O'Rourke, D., Knighton, J., & Thomas, C. (2011). Potentialimpacts of extensive stormwater infiltration in Philadelphia. Environ-mental Engineer and Scientist: Applied Research and Practice, 14, 29–39.
Martin‐Mikle, C. J., de Beurs, K. M., Julian, J. P., & Mayer, P. M. (2015). Iden-tifying priority sites for low impact development (LID) in a mixed‐usewatershed. Landscape and Urban Planning, 140, 29–41. https://doi.org/10.1016/j.landurbplan.2015.04.002
Maryland Department of Environment. (2009). Maryland stormwaterdesign manual Available at: http://mde.maryland.gov/programs/water/StormwaterManagementProgram/Pages/stormwater_design.aspx [Accessed 23 August 2017]
McCuen, R. H. (1974). A regional approach to urban storm water detention.Geophysical Research Letters, 1(7), 321–322.
McCuen, R. H. (1979). Downstream effects of stormwater managementbasins. Journal of the Hydraulics Division, 105(11), 1343–1356.
Meierdiercks, K. L., Smith, J. A., Baeck, M. L., & Miller, A. J. (2010). Analysesof urban drainage network structure and its impact on hydrologicresponse. JAWRA Journal of the American Water Resources Association,46(5), 932–943. https://doi.org/10.1111/j.1752‐1688.2010.00465.x
Miles, B., & Band, L. E. (2015). Green infrastructure stormwater manage-ment at the watershed scale: Urban variable source area andwatershed capacitance. Hydrological Processes, 29(9), 2268–2274.https://doi.org/10.1002/hyp.10448
National Research Council (2009). Urban stormwater management in theUnited States. Washington, D.C: The National Academies Press.
Nelson, P. A., Smith, J. A., & Miller, A. J. (2006). Evolution of channel mor-phology and hydrologic response in an urbanizing drainage basin.Earth Surface Processes and Landforms, 31(9), 1063–1079. https://doi.org/10.1002/esp.1308
Newcomer‐Johnson, T. A., Kaushal, S. S., Mayer, P. M., & Grese, M. M.(2014). Effects of stormwater management and stream restoration onwatershed nitrogen retention. Biogeochemistry, 121(1), 81–106.https://doi.org/10.1007/s10533‐014‐9999‐5
O'Driscoll, M., Clinton, S., Jefferson, A., Manda, A., & McMillan, S. (2010).Urbanization effects on watershed hydrology and in‐stream processesin the southern United States. Water, 2(3), 605–648. https://doi.org/10.3390/w2030605
Page, J. L., Winston, R. J., Mayes, D. B., Perrin, C. A., & Hunt, W. F. III(2014). Retrofitting residential streets with stormwater controlmeasures over sandy soils for water quality improvement at thecatchment scale. Journal of Environmental Engineering, 141(4).4014076. https://doi.org/10.1061/(ASCE)EE.1943-7870.0000898
Page, J. L., Winston, R. J., Mayes, D. B., Perrin, C. A., & Hunt, W. F. III(2015). Retrofitting Residential Streets with Stormwater ControlMeasures over Sandy Soils for Water Quality Improvement at theCatchment Scale. Journal of Environmental Engineering, 141(4).4014076. https://doi.org/10.1061/(ASCE)EE.1943-7870.0000898
Palla, A., & Gnecco, I. (2015). Hydrologic modeling of low impact develop-ment systems at the urban catchment scale. Journal of Hydrology, 528,361–368. https://doi.org/10.1016/j.jhydrol.2015.06.050
Parkinson, J., Tayler, K., & Mark, O. (2007). Planning and design of urbandrainage systems in informal settlements in developing countries. UrbanWater Journal, 4(3), 137–149. https://doi.org/10.1080/15730620701464224
Paul, M. J., & Meyer, J. L. (2001). Streams in the urban landscape. AnnualReview of Ecology and Systematics, 32(1), 333–365. https://doi.org/10.1146/annurev.ecolsys.32.081501.114040
Peierls, B. L., Caraco, N. F., Pace, M. L., & Cole, J. J. (1991). Human influenceon river nitrogen. Nature, 350, 386–387.
Pennington, S. R., Kaplowitz, M. D., & Witter, S. G. (2003). Reexaminingbest management practices for improving water quality in urban water-sheds. Journal of the American Water Resources Association, 39(5),1027–1041. https://doi.org/10.1111/j.1752‐1688.2003.tb03690.x
Pennino, M. J., McDonald, R. I., & Jaffe, P. R. (2016). Watershed‐scaleimpacts of stormwater green infrastructure on hydrology, nutrientfluxes, and combined sewer overflows in the mid‐Atlantic region. Sci-ence of the Total Environment, 565, 1044–1053.
Perez‐Pedini, C., Limbrunner, J. F., Vogel, R. M., Asce, M., Limbrunner, J. F.,& Vogel, R. M. (2005). Optimal location of infiltration‐based best man-agement practices for storm water management. Journal of WaterResources Planning and Management, 131(6), 441–448. https://doi.org/10.1061/(ASCE)0733‐9496(2005)131:6(441)
Petrucci, G., Deroubaix, J. F., De Gouvello, B., Deutsch, J. C., Bompard, P., &Tassin, B. (2012). Rainwater harvesting to control stormwater runoff insuburban areas. An experimental case‐study. Urban Water Journal, 9(1),45–55. https://doi.org/10.1080/1573062X.2011.633610
Petrucci, G., Rioust, E., Deroubaix, J.‐F., & Tassin, B. (2013). Do stormwatersource control policies deliver the right hydrologic outcomes? Journal ofHydrology, 485, 188–200. https://doi.org/10.1016/j.jhydrol.2012.06.018
Pomeroy, C., Roesner, L., Coleman, J. II, & Rankin, E. (2008). Protocols forstudying wet weather impacts and urbanization patternsWater Environ-ment Research Foundation and IWA Publishing.
Price, K. (2011). Effects of watershed topography, soils, land use, and cli-mate on baseflow hydrology in humid regions: A review. Progress inPhysical Geography, 35(4), 465–492. https://doi.org/10.1177/0309133311402714
Pyke, C., Warren, M. P., Johnson, T., LaGro, J., Scharfenberg, J., Groth, P., …Main, E. (2011). Assessment of low impact development for managingstormwater with changing precipitation due to climate change. Land-scape and Urban Planning, 103(2), 166–173. https://doi.org/10.1016/j.landurbplan.2011.07.006
Reisinger, A. J., Groffman, P. M., & Rosi‐Marshall, E. J. (2016). Nitrogen‐cycling process rates across urban ecosystems (G Muyzer, ed.). FEMSMicrobiology Ecology, 92(12). fiw198 https://doi.org/10.1093/femsec/fiw198
Rhea, L., Jarnagin, T., Hogan, D., Loperfido, J. V., & Shuster, W. (2015).Effects of urbanization and stormwater control measures on stream flows in the vicinity of Clarksburg , Maryland, USA. Hydrological Pro-cesses, 29, 4413–4426. https://doi.org/10.1002/hyp.10505
Rode, M., Wade, A. J., Cohen, M. J., Hensley, R. T., Bowes, M. J., Kirchner, J.W., … Jomaa, S. (2016). Sensors in the stream: The high‐frequencywave of the present. Environmental Science & Technology, 50(19),10297–10307. https://doi.org/10.1021/acs.est.6b02155
Roldin, M., Fryd, O., Jeppesen, J., Mark, O., Binning, P. J., Mikkelsen, P. S., &Jensen, M. B. (2012). Modelling the impact of soakaway retrofits oncombined sewage overflows in a 3 km2 urban catchment in Copenha-gen, Denmark. Journal of Hydrology, 452–453, 64–75. https://doi.org/10.1016/j.jhydrol.2012.05.027
Rosa, D. J., Clausen, J. C., & Dietz, M. E. (2015). Calibration and verificationof SWMM for low impact development. Journal of the American WaterResources Association, 51(3), 746–757. https://doi.org/10.1111/jawr.12272
Rossman, L. A., & Huber, W. C. (2016). Storm water management modelreference manual volume I – Hydrology. U.S. Environmental ProtectionAgency EPA/600/R‐15/162
Roy, A. H., Wenger, S. J., Fletcher, T. D., Walsh, C. J., Ladson, A. R., Shuster,W. D., … Brown, R. R. (2008). Impediments and solutions to sustainable,watershed‐scale urban stormwater management: Lessons from Austra-lia and the United States. Environmental Management, 42(2), 344–359.https://doi.org/10.1007/s00267‐008‐9119‐1
Roy, A. H., Rhea, L. K., Mayer, A. L., Shuster, W. D., Beaulieu, J. J., Hopton,M. E., … Amand, A. S. (2014). How much is enough? Minimal responses

24 JEFFERSON ET AL.
of water quality and stream biota to partial retrofit stormwater manage-ment in a suburban neighborhood. PloS One, 9(1). e85011
Salvadore, E., Bronders, J., & Batelaan, O. (2015). Hydrological modelling ofurbanized catchments: A review and future directions. Journal ofHydrology, 529, 62–81. https://doi.org/10.1016/j.jhydrol.2015.06.028
Schueler, T. R., Fraley‐McNeal, L., & Cappiella, K. (2009). Is imperviouscover still important? Review of recent research. Journal of HydrologicEngineering, 14(4), 309–315. https://doi.org/10.1061/(ASCE)1084‐0699(2009)14:4(309)
Selbig, W. R. (2016). Evaluation of leaf removal as a means to reducenutrient concentrations and loads in urban stormwater. Science ofthe Total Environment, 571, 124–133. https://doi.org/10.1016/j.scitotenv.2016.07.003
Selbig, W. R., & Bannerman, R. T. (2008). A comparison of runoff quantityand quality from two small basins undergoing implementation of con-ventional and low‐impact‐development (LID) strategies: Cross Plains,Wisconsin, water years 1999–2005 US Geological Survey Special Investi-gations Report 2008–5008
Shields, C. A., Band, L. E., Law, N., Groffman, P. M., Kaushal, S. S., Savvas, K.,… Belt, K. T. (2008). Streamflow distribution of non‐point source nitro-gen export from urban‐rural catchments in the Chesapeake Baywatershed. Water Resources Research, 44(9). W09416 https://doi.org/10.1029/2007WR006360
Shuster, W., & Rhea, L. (2013). Catchment‐scale hydrologic implications ofparcel‐level stormwater management (Ohio USA). Journal of Hydrology,485, 177–187. https://doi.org/10.1016/j.jhydrol.2012.10.043
Shuster, W. D., Gehring, R., & Gerken, J. (2007). Prospects for enhancedgroundwater recharge via infltration of urban storm water runoff: Acase study. Journal of Soil and Water Conservation, 62(3), 129–137.
Shuster, W. D., Morrison, M. A., & Webb, R. (2008). Front‐loading urbanstormwater management for success–a perspective incorporating cur-rent studies on the implementation of retrofit low‐impactdevelopment. Cities and the Environment, 1(2), 1–15.
Silveira, A. L. L. (2002). Problems of modern urban drainage in developingcountries. Water Science and Technology, 45(7), 31–40.
Smith, B. K., Smith, J. A., Baeck, M. L., & Miller, A. J. (2015). Exploring stor-age and runoff generation processes for urban flooding through aphysically based watershed model. Water Resources Research, 51,1552–1569. https://doi.org/10.1002/2014WR016085
Sparkman, S. A., Hogan, D. M., Hopkins, K. G., & Loperfido, J. V. (2017).Modeling Watershed-Scale Impacts of Stormwater Management withTraditional versus Low Impact Development Design. Journal of theAmerican Water Resources Association. https://doi.org/10.1111/1752-1688.12559
Steinman, A. D., Isely, E. S., & Thompson, K. (2015). Stormwater runoff toan impaired lake: Impacts and solutions. Environmental Monitoring andAssessment, 187(9). https://doi.org/10.1007/s10661‐015‐4776‐z
Stephens, D. B., Miller, M., Moore, S. J., Umstot, T., & Salvato, D. J. (2012).Decentralized groundwater recharge systems using roofwater andstormwater runoff. Journal of the American Water Resources Association,48(1), 134–144. https://doi.org/10.1111/j.1752‐1688.2011.00600.x
Thomas, B. F., & Vogel, R. M. (2012). Impact of storm water recharge prac-tices on Boston groundwater elevations. Journal of HydrologicEngineering, 17(8), 923–932. https://doi.org/10.1061/(ASCE)HE.1943‐5584.0000534
Trinh, D. H., & Chui, T. F. M. (2013). Assessing the hydrologic restoration ofan urbanized area via an integrated distributed hydrological model.Hydrology and Earth System Sciences, 17(12), 4789–4801. https://doi.org/10.5194/hess‐17‐4789‐2013
Turner, V. K., Jarden, K. M., & Jefferson, A. J. (2016). Resident perspectiveson green infrastructure in an experimental suburban stormwater man-agement program. Cities and the Environment, 9(1). art. 4
United States Department of Agriculture. (1986). Urban hydrology for smallwatersheds. SCS Technical Release 55. Washington, D.C.
United States Environmental Protection Agency. (2016). CleanWatersheds Needs Survey 2012 https://doi.org/10.1017/CBO9781107415324.004
Van Meter, K. J., & Basu, N. B. (2015). Catchment legacies and time lags: Aparsimonious watershed model to predict the effects of legacy storageon nitrogen export. PloS One, 10(5). e0125971 https://doi.org/10.1371/journal.pone.0125971
Versini, P., Jouve, P., Ramier, D., Berthier, E., & DeGouvello, B. (2016). Use ofgreen roofs to solve storm water issues at the basin scale – Study in theHauts‐de‐Seine County (France). Urban Water Journal, 13(4), 372–381.
Vogel, J. R., &Moore, T. L. (2016). Urban stormwater characterization, control,and treatment. https://doi.org/10.2175/106143016X14696400495938
Walsh, T. C., Pomeroy, C. A., & Burian, S. J. (2014). Hydrologic modelinganalysis of a passive, residential rainwater harvesting program in anurbanized, semi‐arid watershed. Journal of Hydrology, 508, 240–253.https://doi.org/10.1016/j.jhydrol.2013.10.038
Walsh, C. J., Fletcher, T. D., Bos, D. G., & Imberger, S. J. (2015). Restoring astream through retention of urban stormwater runoff : A catchment‐scale experiment in a social – Ecological system. Freshwater Science,34(February), 1161–1168. https://doi.org/10.1086/682422
Water Environment Federation and American Society of Civil Engineers.(2012). Design of Urban Stormwater Controls. WEF manual of practiceno. 23/ASCE manuals and reports on engineering practice no. 87.McGraw–Hill.
Westra, S., Alexander, L., & Zwiers, F. (2013). Global increasing trends inannual maximum daily precipitation. Journal of Climate, 26(11), 3904–3918. https://doi.org/10.1175/JCLI‐D‐12‐00502.1
Williams, E. S., & Wise, W. R. (2006). Hydrologic impacts of alternativeapproaches to storm water management and land development. Journalof the American Water Resources Association, 42(2), 443–455. https://doi.org/10.1111/j.1752‐1688.2006.tb03849.x
Wilson, C. E., Hunt, W. F., Winston, R. J., & Smith, P. (2014). Comparison ofrunoff quality and quantity from a commercial low‐impact and conven-tional development in Raleigh, North Carolina. Journal of EnvironmentalEngineering, 141(2). 5014005
Winston, R. J., Hunt, W. F., Kennedy, S. G., Merriman, L. S., Chandler, J., &Brown, D. (2013). Evaluation of floating treatment wetlands as retrofitsto existing stormwater retention ponds. Ecological Engineering, 54,254–265. https://doi.org/10.1016/j.ecoleng.2013.01.023
Winston, R. J., Page, J. L., & Hunt, W. F. (2013). Catchment scale hydrologicand water quality impacts of residential stormwater street retrofits inWilmington, North Carolina. In Green streets, highways, and development2013 (pp. 159–172). Reston, VA: American Society of Civil Engineers.https://doi.org/10.1061/9780784413197.014
Wright, T. J., Liu, Y. Z., Carroll, N. J., Ahiablame, L. M., & Engel, B. A. (2016).Retrofitting LID practices into existing neighborhoods: Is it worth it?Environmental Management, 57(4), 856–867. https://doi.org/10.1007/s00267‐015‐0651‐5
Wu, H., Bolte, J. P., Hulse, D., & Johnson, B. R. (2015). Landscape andurban planning a scenario‐based approach to integrating flow‐ecol-ogy research with watershed development planning. Landscape andUrban Planning, 144, 74–89. https://doi.org/10.1016/j.landurbplan.2015.08.012
Xing, W., Li, P., Cao, S., Gan, L., Liu, F., & Zuo, J. (2016). Layout effects andoptimization of runoff storage and filtration facilities based on SWMMsimulation in a demonstration area. Water Science and Engineering, 9(2),115–124. https://doi.org/10.1016/j.wse.2016.06.007
Yang, B., & Li, S. J. (2013). Green infrastructure design for stormwater run-off and water quality: Empirical evidence from large watershed‐scalecommunity developments. Water, 5(4), 2038–2057. https://doi.org/10.3390/w5042038
Zahmatkesh, Z., Burian, S. J., Karamouz, M., Tavakol‐Davani, H., &Goharian, E. (2015). Low‐impact development practices to mitigate cli-mate change effects on urban stormwater runoff: Case study of newYork City. Journal of Irrigation and Drainage Engineering, 141(1).https://doi.org/10.1061/(asce)ir.1943‐4774.0000770

JEFFERSON ET AL. 25
Zhang, X., Guo, X., & Hu, M. (2016). Hydrological effect of typical lowimpact development approaches in a residential district. Natural Haz-ards, 80(1), 389–400. https://doi.org/10.1007/s11069‐015‐1974‐5
Zhou, W., Troy, A., & Grove, M. (2008). Modeling residential lawn fertiliza-tion practices: Integrating high resolution remote sensing withsocioeconomic data. Environmental Management, 41(5), 742–752.https://doi.org/10.1007/s00267‐007‐9032‐z
Zhu, W.‐X., Dillard, N. D., & Grimm, N. B. (2005). Urban nitrogen biogeo-chemistry: Status and processes in green retention basins.Biogeochemistry, 71(2), 177–196. https://doi.org/10.1007/s10533‐005‐0683‐7
Zimmer, C. A., Heathcote, I. W., Whiteley, H. R., & Schroter, H. (2007). Low‐impact‐development practices for stormwater: Implications for urbanhydrology. Canadian Water Resources Journal, 32(3), 193–212. https://doi.org/10.4296/cwrj3203193
How to cite this article: Jefferson AJ, Bhaskar AS, Hopkins
KG, Fanelli R, Avellaneda PM, McMillan SK. Stormwater man-
agement network effectiveness and implications for urban
watershed function: A critical review. Hydrological Processes.
2017;1–25. https://doi.org/10.1002/hyp.11347