stormwater control plan - updated minimum grade of ditch 0.8% to allow positive drainage to...
TRANSCRIPT

214 N St. Francis 67202
Stormwater Control PlanSunflower CCR LandfillKDHE Permit Number 420Holcomb, KS
Prepared for:Sunflower Electric Power Corporation
AEC File No. 16058:4908August, 2016
Sunflower Electric Power Corporation Stormwater Control Plan July 2016Sunflower CCR Landfill 40 CFR 257.81
i4908/16058\Stormwater Control Plan Allied Environmental Consultants, Inc.
TABLE OF CONTENTS
PROFESSIONAL ENGINEER STATEMENT ii
ATTACHMENTS
ATTACHMENT 1 – DESIGN DRAWINGSATTACHMENT 2 – STORMWATER CALCULATION DISCUSSION
Sunflower Electric Power Corporation Stormwater Control Plan July 2016Sunflower CCR Landfill 40 CFR 257.81
ii4908/16058\Stormwater Control Plan Allied Environmental Consultants, Inc.
PROFESSIONAL ENGINEERING STATEMENT
In accordance with our Professional Services Agreement with Sunflower Electric Power Corporation, Allied Environmental Consultants, Inc. (AEC) prepared the Stormwater Control Plan for Phase 3A at the Sunflower Coal Combustion Residue (CCR) Landfill in Holcomb, Kansas. The Project included preparing design calculations and design drawings of the stormwater controls for the active phase of landfill development (Phase 3A). In accordance with the documentation listed as follows, our Statement of Professional Opinion shown below is stipulated.
As documented by the Sunflower Electric CCR Landfill Stormwater Control Plan dated August 4,2016As documented by the Attached Stormwater Calculation Discussion dated August 4, 2016.
Therefore, as an officer of Allied Environmental Consultants, Inc., and in accordance with the above conditions and documentation, the following statement of Professional Opinion is hereby made: It is my Professional Opinion that the Stormwater Control Plan completed for this Project substantially conforms with 40 CFR 257.81 entitled “Run-on and run-off controls for CCR Landfills”, and provides stormwater controls for the 25 year 24 hour storm as stipulated therein.
Engineer: __________________________Theodore B. Francis, P.E.
Date: _____________________
*-*-*-*-*
TH
EODORE B . FRANC
IS
PROFESS I ONAL ENGI NEER
KANSAS
L
I CENSED
TTTTTTTTTTTTTHHHHHHHHHHHHHHHHHHHHHHHHHHHHHHHHHHHHHHHHHHHHHHHHHHHHHHHHHHHHHHHHHHHHHHHHHHHHHHHHHHHHHHHHHHHHHHHHHHHHHHHHHHHHHHHHHHHHHHHHHHHHHHHHH
EEEEEEEEEEEEEEEEEEEEEEEEEEEEEEEEEEEEEEEEEEEEEEEEEEEEEEEEEEEEEEEEEEEEOOOOOOOOOOOOOOOOOOOOOOOOOOOOOOOOOOOOOOOOOOOOOOOOOOOOODDDDDDDDDDDDDDDDDDDDDDDDDDDDDDDDDDDDDDDDDDDDDDDDDDDDDDDDDDDDDDDDDDDDDDDDDDDDDDDDDOOOOOOOOOOOOOOOOOOOOOOOOOOOOOOOOOOOOOOOOOOOOOOOOOOOOOOOOOOOOOOOOOOOOOOR FRARR
NNNNCCCCCCCCCCCCCCCCCCCCCCCCCCCCCCCCCCCCCCCCCCCCCCCCCCCCCCCCCCCCCCCCCCCCCCCCCCCCCCCCCCCCCCCCCCCCCCCCCCCCCCCCCCCCCCCI S
LLLLLLLLLLLLLLLLLLLLLLLLLLLLLLLLLLLLLLLLLL
IIIIIIIIIIIIIII CCCCCCCCCCCCCCCCCCCCCCCCCCCCCCCCCCCCCCCCCCCCCCCCCCCCCCCCCCCCCCCEEEEEEEEEEEEEEEEEEEEEEEEEEEEEEEEEEEEEEENNNNNNNNNNNNNNNNNNNNNNNNNNNNNNNNNNNNNNNNNNNNNNNNNNNNNNNNNSSEEEEEEEEEEEEEEEEEEEEEEEEEEEEEEEEEEEEEEEEEEEEEEEEEEEEEEEEED8/4/2016

ATTACHMENT 1
DESIGN DRAWINGS
GAS
GAS
GAS
GAS
GAS
GAS
GAS
GAS
GAS
GAS
GAS
GAS
GAS
GAS
GAS
GAS
GAS
GAS
GAS
GAS
GAS
GAS
GAS
GAS
GAS
GAS
GAS
OUTSIDE ACTIVELANDFILLDRAINAGE AREA:49.5 ACRES
PHASE 3A DRAINAGEAREA: 23.5 ACRES
CLOSEDPHASESDRAINAGEAREA: 7.3ACRES
EVAPORATIONBASIN DRAINAGEAREA: 6 ACRES
S:\P
RO
JEC
TS\S
UN
FLO
WE
R E
LEC
TRIC
PO
WE
R C
OR
PO
RA
TIO
N -
4908
\160
58 -
LAN
DFI
LL S
TOR
MW
ATE
R M
AN
AG
EM
EN
T P
LAN
\CA
DD
\SU
NFL
OW
ER
DS
GN
LOC
ALC
OO
RD
.DW
G
DATE:
SHT:
DWN BY:
CHKD BY:
PROJECT:
SHT:
SU
NFL
OW
ER
ELE
CTR
ICC
CR
LA
ND
FILL
RE
VIS
ION
S
DR
AIN
AG
E A
RE
AS
AN
D C
ALC
ULA
TIO
NS
1
214
N. S
T. F
RA
NC
IS ●
WIC
HIT
A, K
S 6
7202
● 3
16.2
62.5
698
Feet0 250 500
- Existing Contours (Major/Minor)- Proposed Contours (Major/Minor)- Leased Area Boundary- Phase Boundary- Drainage Area- Phase NumberTopography From Field Surveys and USGS National Elevation Data
Coordinates assumed local coordinate system as defined in Permit Design Set
SUNFLOWER ELECTRIC CCR LANDFILLSTORMWATER CONTROL PLAN
KDHE Permit No: 420
1
LEGEND
TH
EODORE B . FRANC
IS
PROFESS I ONAL ENGI NEER
KANSAS
L
I CENSED
TTTTTTTTTTTTHHHHHHHHHHHHHHHHHHHHHHHHHHHHHHHHHHHHHHHHHHHHHHHHHHHHHHHHHHHHHHHHHHHHHHHHHHHHHHHHHHHHHHHHHHHHHHHHHHHHHHHHHHHHHHHHHHHHHHHHHHHHHHHHHHHHHHHHH
EEEEEEEEEEEEEEEEEEEEEEEEEEEEEEEEEEEEEEEEEEEEEEEEEEEEEEEEEEEEEEEOOOOOOOOOOOOOOOOOOOOOOOOOOOOOOOOOOOOOOOOOOOOOOOOOOOOOOOOOOOOOOOOOOODDDDDDDDDDDDDDDDDDDDDDDDDDDDDDDDDDDDDDDDDDDDDDDDDDDDDDDDDDDDDDDDDDDDDDDDDDDDDDDDDDDDDDDDDDDDDDDDDDDDDDOOOOOOOOOOOOOOOOOOOOOOOOOOOOOOOOOOOOOOOOOOOOOOOOOOOOOOOOOOOOOOOOOOOOOOOOOOOOOOOOOOOR FRARR
NNNCCCCCCCCCCCCCCCCCCCCCCCCCCCCCCCCCCCCCCCCCCCCCCCCCCCCCCCCCCCCCCCCCCCCCCCCCCCCCCCCCCCCCCCCCCCCCCCCCCCCCCCCCCCCCCCCI S
LLLLLLLLLLLLLLLLLLLLLLLLLLLLLLLLLLLLLLLLLLLLLL
IIIIIIIIIIIIIIIIIIIIIIII CCCCCCCCCCCCCCCCCCCCCCCCCCCCCCCCCCCCCCCCCCCCCCCCCCCCCCCCCCEEEEEEEEEEEEEEEEEEEEEEEEEEEEEEEEEEEEEEEEEEEEEEEEEEENNNNNNNNNNNNNNNNNNNNNNNNNNNNNNNNNNNNNNNNNNNNNNNNNNNNNNNNNNNNNSEEEEEEEEEEEEEEEEEEEEEEEEEEEEEEEEEEEEEEEEEEEEEEEEEEEEEEEEEEEEEEEEED
8/4/2016
3 (MAX)
1
P1
DITCH LANDFILL TOE
WASTE
8" FLY ASH/SAND BASE, 3-INCHESFLY ASH TILLED INTO 6 INCHESSAND; COMPACTED TO 90%PROCTOR MAXIMUM DENSITY AT2%+/- OPTIMUM MOISTURE (TYP.)
18" COMPACTED BOTTOMASH; 6" LIFTS COMPACTED TO
90% STANDARD PROCTORMAXIMUM DRY DENSITY (TYP.)
2.5' MIN.
PERIMETERROAD ℄
10.0'
2.5' MIN.
SLOPEVARIES,MEETEXIST.
3:1 SLOPE
3:1 SLOPE
TYPICAL PERIMETER ROAD SECTION ALONG LANDFILL1" = 5'
SLOPE WILL VARYBASED ON WASTE
PLACEMENT
2900
2920
2940
2960
0+00 2+00 4+00 6+00 8+00 10+00 12+00 14+00 16+00 18+00 20+00 22+00 24+00 26+00 28+00 29+45
32.6'27.2'
487.7'
70.8' 240.5'
45.0'150.9'
83.4'
158.2'
102.8'
41.7'921.4' 8.0'
499.8'
4.7% 0.8%
1.8%
1.3%
2.0%
104105
106107 109
110
111 113114
115
116118
119121
122
TOP OF ROAD
DITCH PHASE 3A TOEP2
PROFILE P1HORIZONTAL SCALE: 1" = 200'VERTICAL SCALE: 1" = 20' GRADES TO BE FIELD VERIFIED AND SUBJECT TO CHANGE;
ESTIMATED MINIMUM GRADE OF DITCH 0.8% TO ALLOW POSITIVE DRAINAGE TO EVAPORATION BASIN.
Reach 1 Reach 2
Reach 3
Reach 4
Reach 5
EXISTINGGROUND
18" RIP-RAP LININGD50 = 6"
P16" FILTERCOURSEBACKING
8" FLY ASH/SAND BASE,3-INCHES FLY ASH TILLEDINTO 6 INCHES SAND
18" COMPACTEDBOTTOM ASH
PERIMETERROAD ℄ 3:1 SLOPE
2.5' MIN.
TYPICAL RIP-RAP SECTION INSTALL RIP-RAP AT BASIN LETDOWN TIE INAND DITCH CONNECTION AND ELSEWHERE ASNEEDED TO MINIMIZE EROSION.
3:1 SLOPE
MEET EXIST.
MEET EXIST.
1" = 5'
GAS
GAS
GAS
GAS
GAS
GAS
GAS
GAS
GAS
GAS
GAS
GAS
GAS
122
P1
P2
3A
1
6
2B
4 89
11
10
3B
EX
ISTI
NG
CO
NTA
CT
WA
TER
EV
AP
OR
ATI
ON
BA
SIN
EVAPORATION BASIN:830' X 305'; 12' DEEP; 3:1 SIDE SLOPESSEE PERMIT DRAWINGS FOR DETAILS
ACTIVE
CLOSED
CLOSED
PERIMETER ROADBLOCKS RUN-ONTO ACTIVE AREA
TOE DITCH DIRECTSCONTACT WATER TOEVAPORATION BASIN
PERIMETER
ROAD ℄
DITCH LANDFILL TOE
TIE DITCH INTOEXISTING CONCRETELETDOWN
PERIMETERROAD
DITCH
DITCH P1
EVAPORATION
BASINTIE EXERIOR DITCH INTO
CONTACT DITCH ANDEVAPORATION BASIN
122
2950
2960
0+00 1+00 2+00 3+00 3+50
207.0' 81.1'13.1'
2.4%
101
102
103104
P1
PROFILE P2HORIZONTAL SCALE: 1" = 100'VERTICAL SCALE: 1" =10'
WASTE
SLOPE VARIES3:1 MAX
TOP OF ROAD
EXISTINGGROUND
DITCH CONTROL POINTS
POINT #
101
102
103
104
105
106
107
108
109
110
111
112
113
114
115
116
117
118
119
120
121
122
ELEVATION
2944.42
2949.33
2951.08
2950.87
2946.76
2941.67
2940.32
2942.81
2940.00
2935.90
2919.34
2920.00
2918.06
2917.96
2914.91
2905.06
2906.23
2904.17
2901.19
2901.58
2899.55
0.00
NORTHING
29782.92
29986.80
30062.85
30075.10
30094.90
30157.36
30178.80
30182.39
30219.26
30656.20
31481.66
31526.68
31507.12
31504.10
31395.96
31171.23
31160.54
31168.48
31218.92
31232.98
31232.85
31232.36
EASTING
16670.20
16706.93
16735.27
16739.83
16713.94
16632.27
16616.10
16599.54
16617.92
16834.57
17244.04
17266.40
17303.90
17311.31
17526.14
17972.54
17993.79
18016.22
18158.49
18198.17
18240.28
18398.51S:\P
RO
JEC
TS\S
UN
FLO
WE
R E
LEC
TRIC
PO
WE
R C
OR
PO
RA
TIO
N -
4908
\160
58 -
LAN
DFI
LL S
TOR
MW
ATE
R M
AN
AG
EM
EN
T P
LAN
\CA
DD
\SU
NFL
OW
ER
DS
GN
LOC
ALC
OO
RD
.DW
G
DATE:
SHT:
DWN BY:
CHKD BY:
PROJECT:
SHT:
SU
NFL
OW
ER
ELE
CTR
ICC
CR
LA
ND
FILL
RE
VIS
ION
S
RU
NO
N/R
UN
OFF
CO
NTR
OLS
2
214
N. S
T. F
RA
NC
IS ●
WIC
HIT
A, K
S 6
7202
● 3
16.2
62.5
698
Feet0 100 200
CONTROL POINT LOCATIONS ANDELEVATIONS TO BE FIELD VERIFIEDAND SUBJECT TO CHANGE
EXTERIOR DITCHDIRECTS STORMWATER
TO NATURALINFILTRATION AREAS
PLAN DETAILFeet
0 20 40
TH
EODORE B . FRANC
IS
PROFESS I ONAL ENGI NEER
KANSAS
L
I CENSED
TTTTTTTTTTTTTTTTTTHHHHHHHHHHHHHHHHHHHHHHHHHHHHHHHHHHHHHHHHHHHHHHHHHHHHHHHHHHHHHHHHHHHHHHHHHHHHHHHHHHHHHHHHHHHHHHHHHHHHHHHHHHHHHHHHHHHHHHHHHHHHHHHHHHHHHHHHHHH
EEEEEEEEEEEEEEEEEEEEEEEEEEEEEEEEEEEEEEEEEEEEEEEEEEEEEEEEEEEEEOOOOOOOOOOOOOOOOOOOOOOOOOOOOOOOOOOOOOOOOOOOOOOOOOOOOOOOOOOOOOOOOOOOOODDDDDDDDDDDDDDDDDDDDDDDDDDDDDDDDDDDDDDDDDDDDDDDDDDDDDDDDDDDDDDDDDDDDDDDDDDDDDDDDDDDDDDDDDDDDDDDDDDDDDOOOOOOOOOOOOOOOOOOOOOOOOOOOOOOOOOOOOOOOOOOOOOOOOOOOOOOOOOOOOOOOOOOOOOOOOOOOOOOOOOOOR FRARR
NNNNCCCCCCCCCCCCCCCCCCCCCCCCCCCCCCCCCCCCCCCCCCCCCCCCCCCCCCCCCCCCCCCCCCCCCCCCCCCCCCCCCCCCCCCCCCCCCCCCCCCCCCCCCCCCCCI S
LLLLLLLLLLLLLLLLLLLLLLLLLLLLLLLLLLLLLLLLLLLLLL
IIIIIIIIIIIIIIIIIIIIIII CCCCCCCCCCCCCCCCCCCCCCCCCCCCCCCCCCCCCCCCCCCCCCCCCCCCCCCEEEEEEEEEEEEEEEEEEEEEEEEEEEEEEEEEEEEEEEEEEEEEEEEENNNNNNNNNNNNNNNNNNNNNNNNNNNNNNNNNNNNNNNNNNNNNNNNNNNNNNNNNNNNNSSSSEEEEEEEEEEEEEEEEEEEEEEEEEEEEEEEEEEEEEEEEEEEEEEEEEEEEEEEEEEEED
8/4/2016
ATTACHMENT 2
STORMWATER CALCULATION DISCUSSION
Sunflower Electric Power Corporation Stormwater Control Plan July 2016Sunflower CCR Landfill 40 CFR 257.81
Attachment 2 August 4, 2016
STORMWATER CALCULATION DISCUSSION
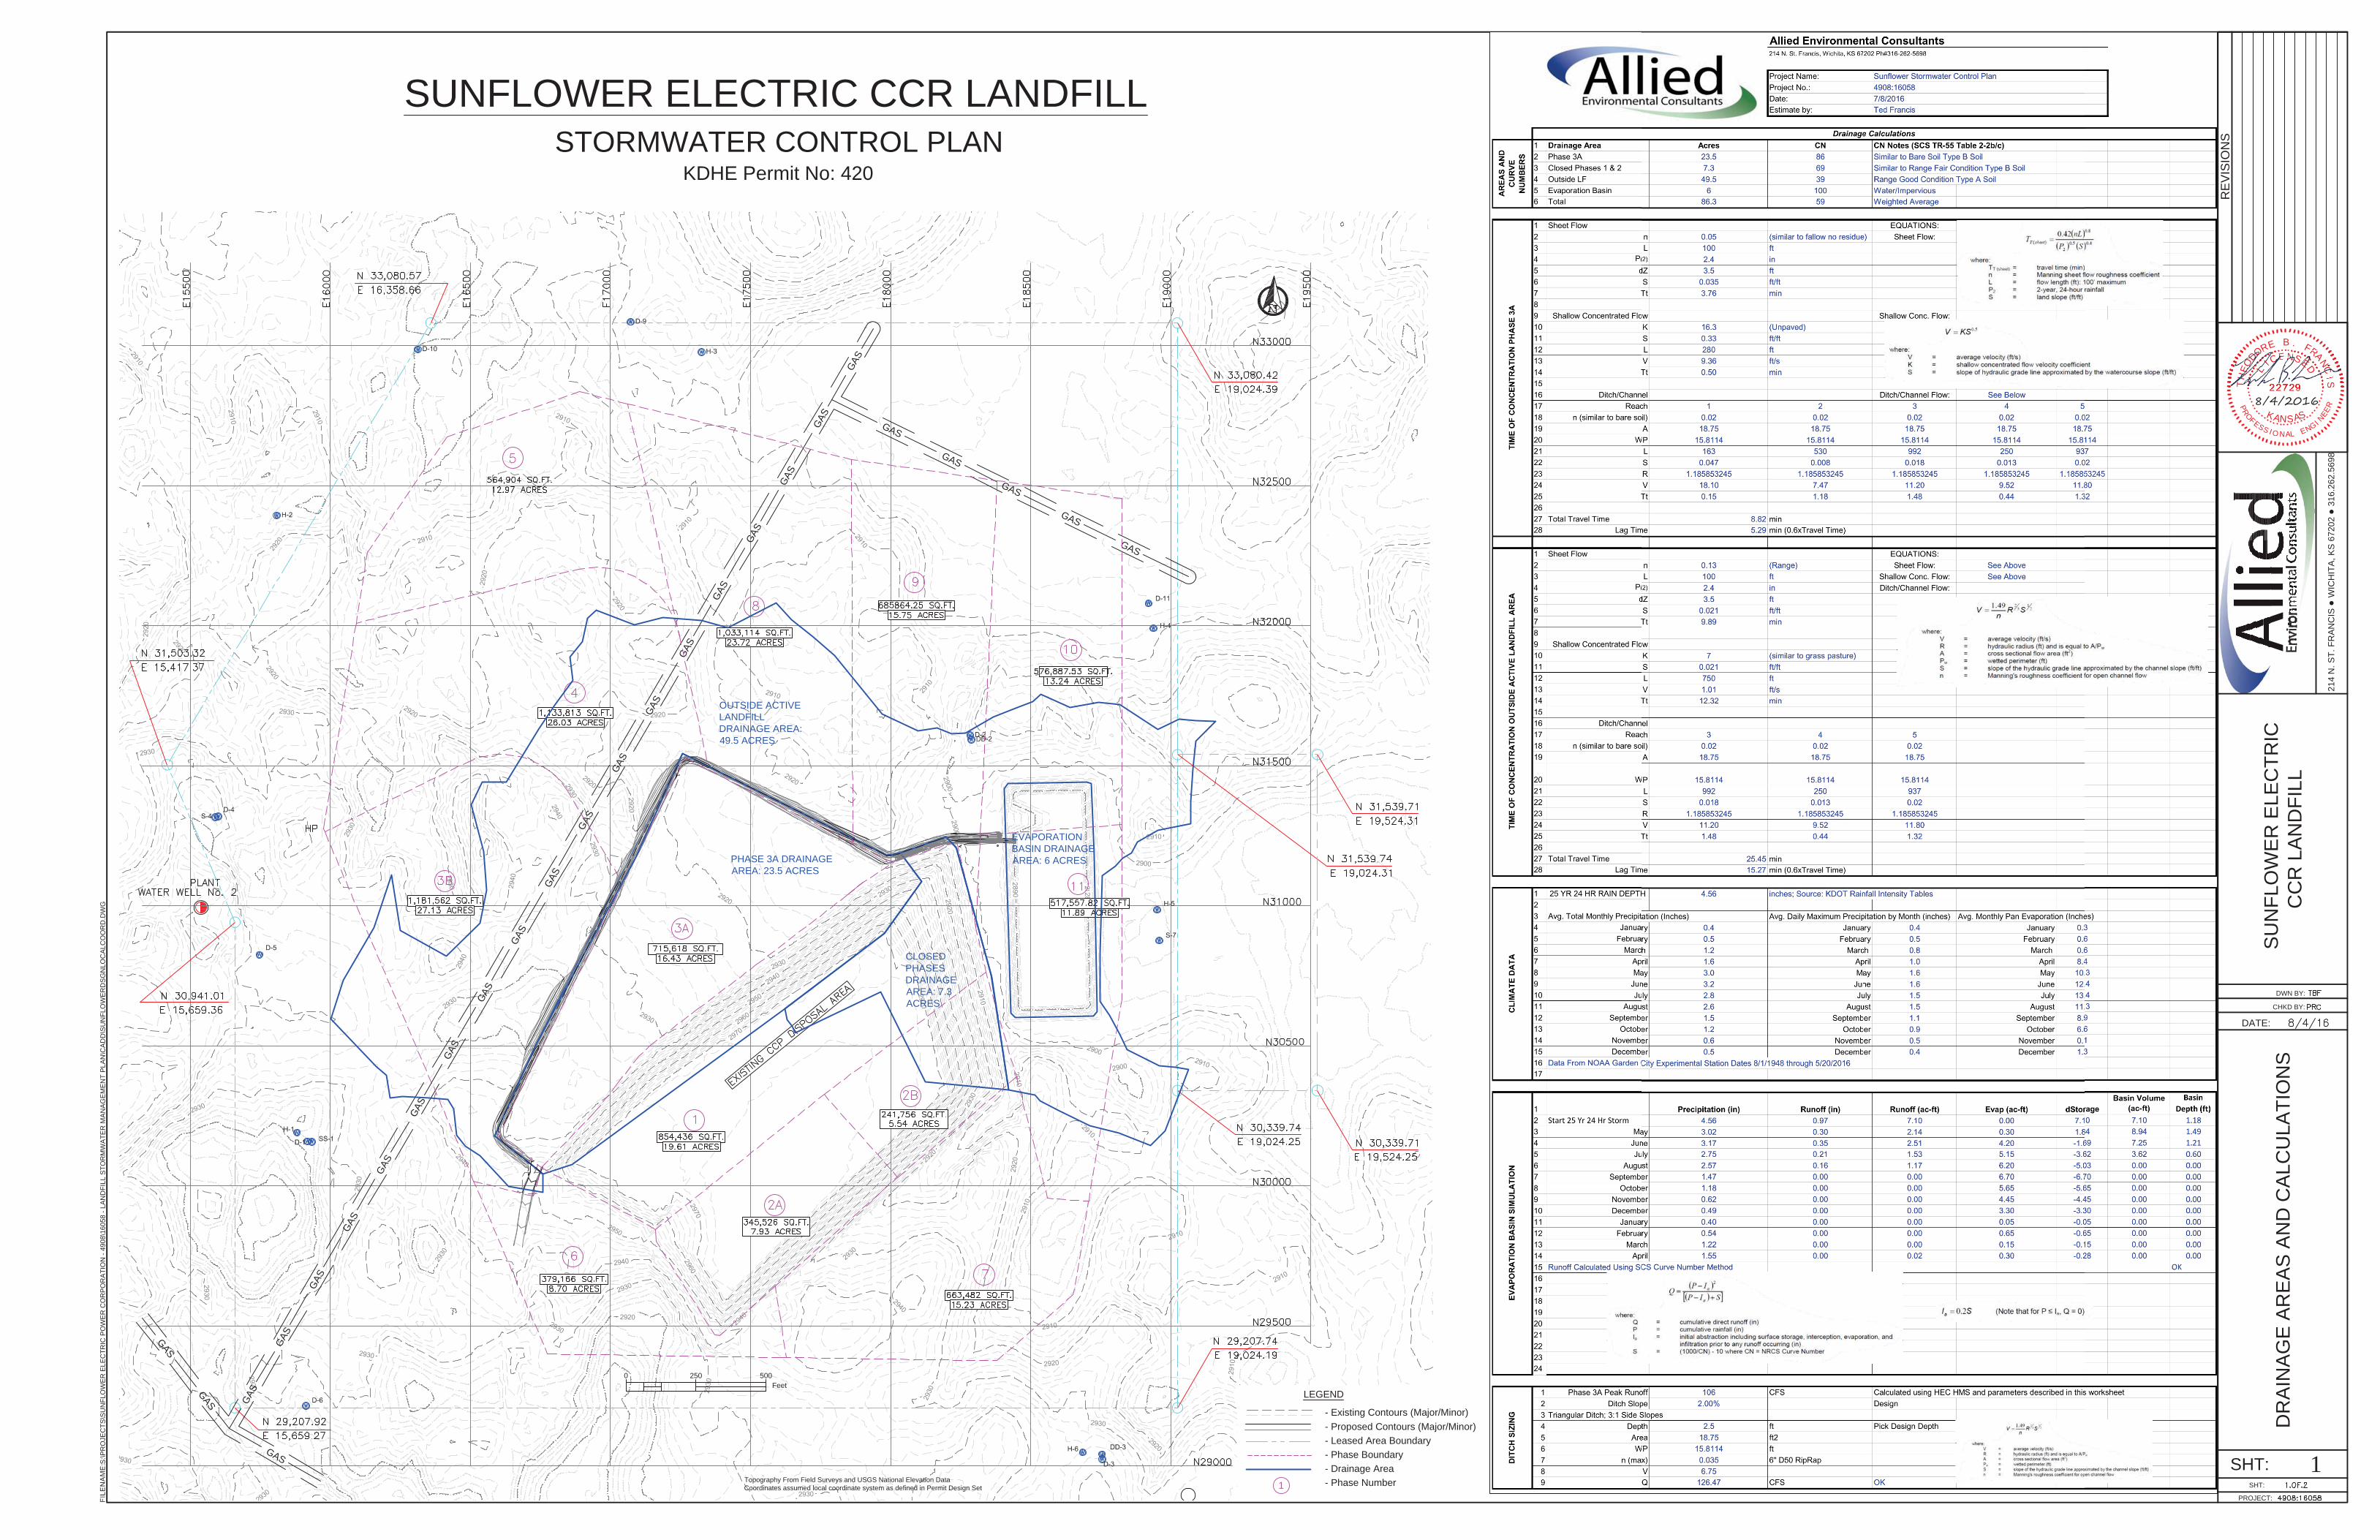
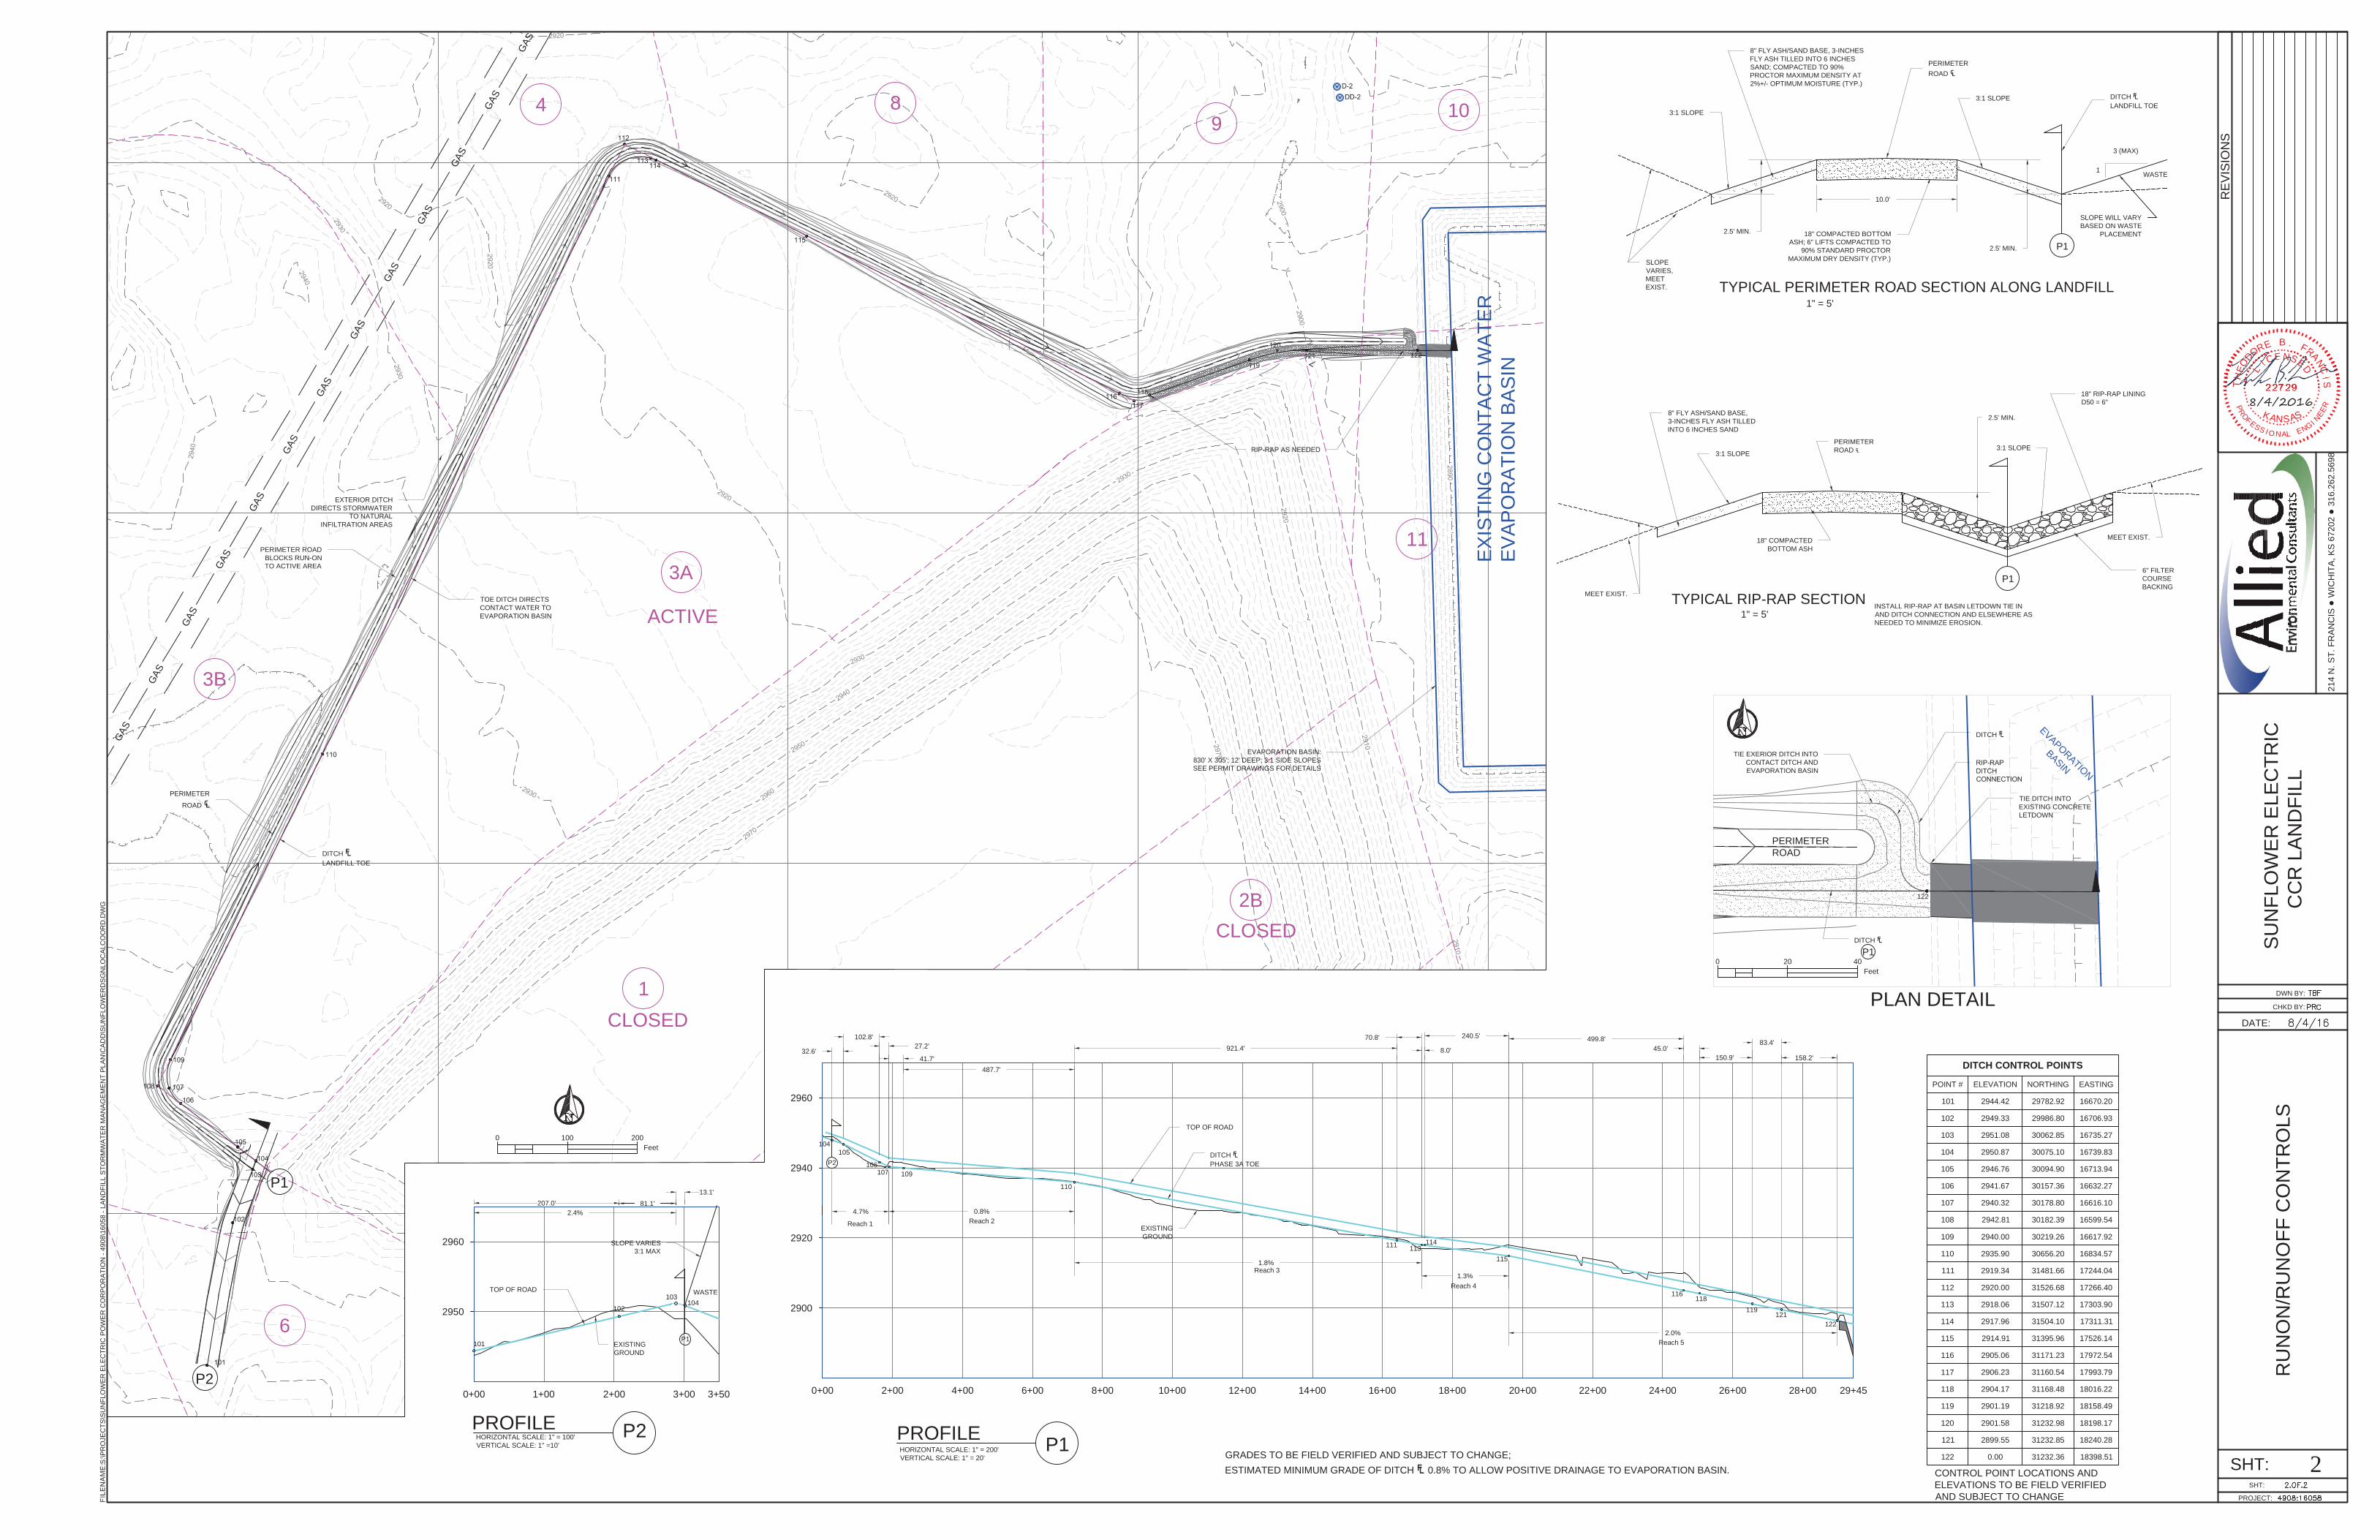
GeneralThe stormwater control system consists of berms, roads, ditches and a non-discharging basin (evaporation basin) to limit stormwater run-on into the active landfill area and control run-off of stormwater that has come in contact with Coal Combustion Residuals (CCR), hereafter referred to as “contact water.”Hydrologic and hydraulic calculations were performed to verify the sizing of the existing evaporation basin and size the various site ditches using a 25 year 24 hour storm event the “design storm.” The calculations indicate that the existing evaporation basin is more than adequately sized to retain run-off from the entire drainage area with a 25 year 24 hour storm occurring during an average rainfall year. The peak run-off discharge for the area is 106 cubic feet per second (CFS). The designed ditch, as shown on the drawing set, has a minimum depth of 2.5 feet with 3:1 side slopes, and is calculated to carry a minimum capacity of 122 CFS when flowing full; therefore having adequate capacity to carry the 25 year 24 hour storm peak run-off.
The Drainage Calculation Worksheet is presented on Sheet 1 of the Design Drawing set entitled Sunflower Electric CCR Landfill Stormwater Control Plan, dated July 7, 2016 and provides all the pertinent calculations used to evaluate stormwater flows at the site. The Worksheet consists of six sections, as discussed below, entitled:
Areas and Curve Numbers,Time of Concentration Phase 3A,Time of Concentration Outside Landfill,Climate Data,Evaporation Basin Simulation, andDitch Sizing.
Due to the complexity of unit hydrographs for the Soil Conservation Service (SCS) Peak Run-off estimation, the U.S. Army Corps of Engineers Hydrologic Modeling System (HEC-HMS) Version 4.1 was utilized to determine peak run-off for ditch sizing. Details regarding the inputs and outputs from the model are discussed in the ditch sizing section.
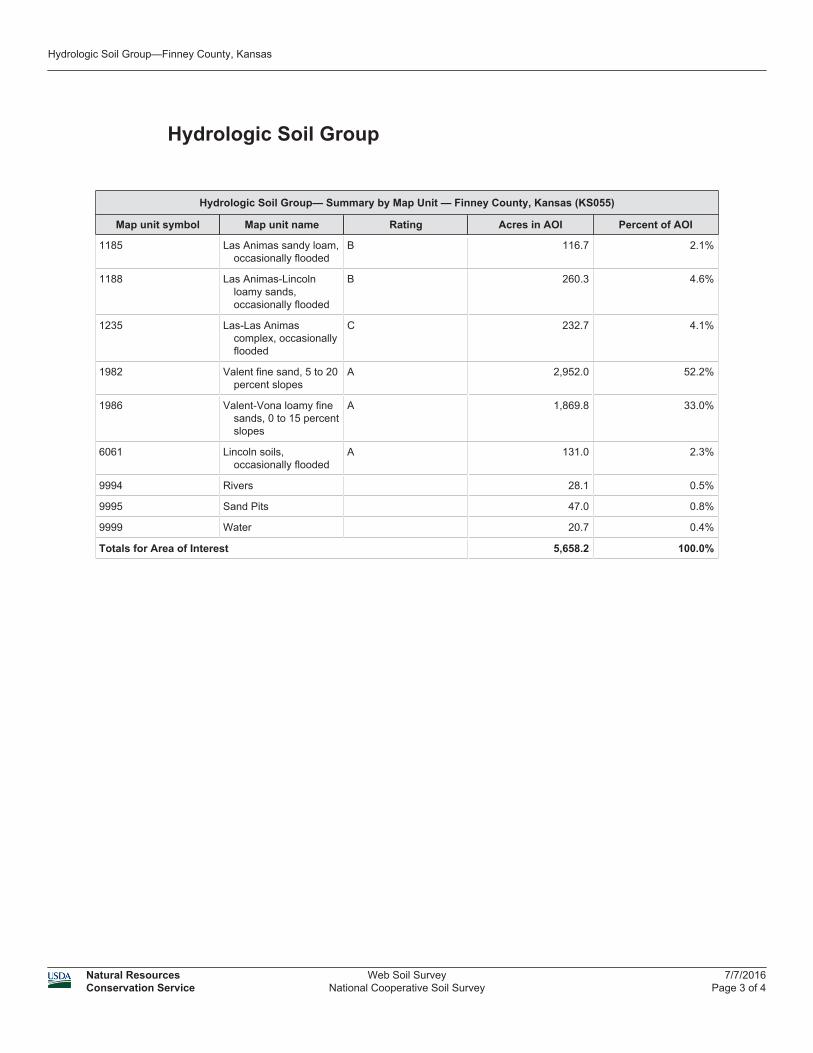
Areas and Curve NumbersThe Areas and Curve Numbers section provides the areas with different characteristics for run-off modeling purposes and the total weighted average for the entire drainage area. The areas were determined using the existing topography of the site and are shown on Sheet 1 of the drawing set. The Soil Conservation Service TR-55, along with observation of the site was used to determine appropriate curve numbers for the various areas.
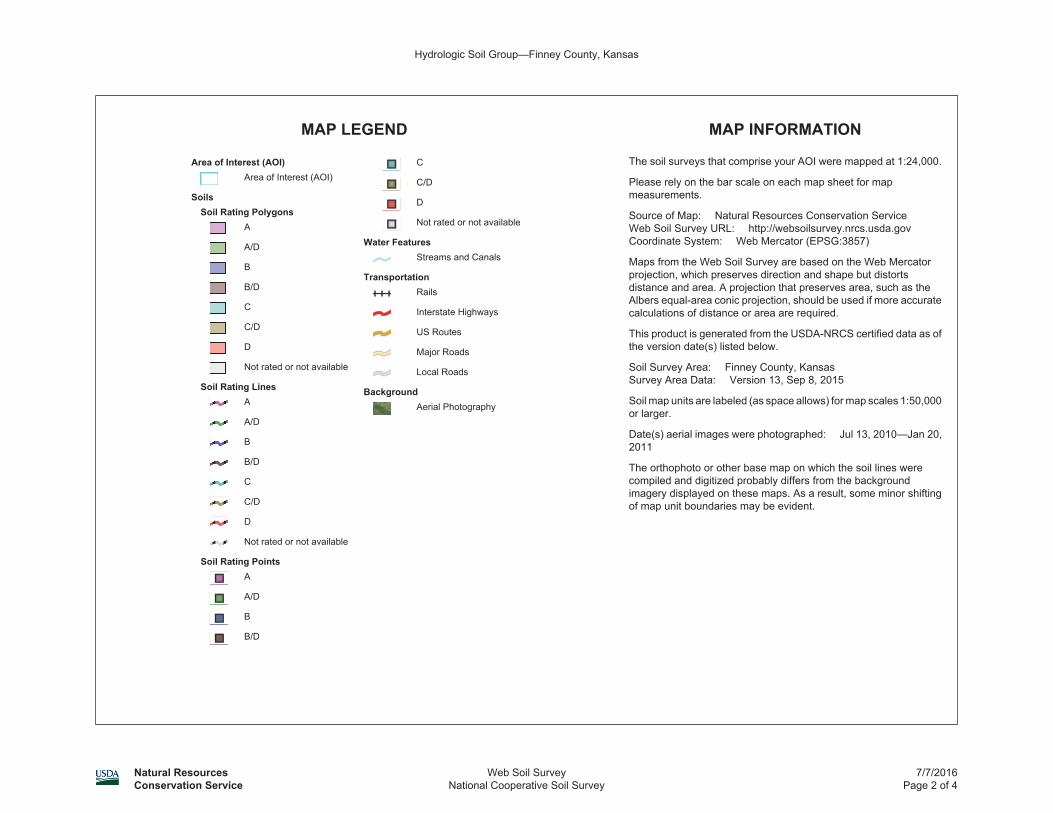
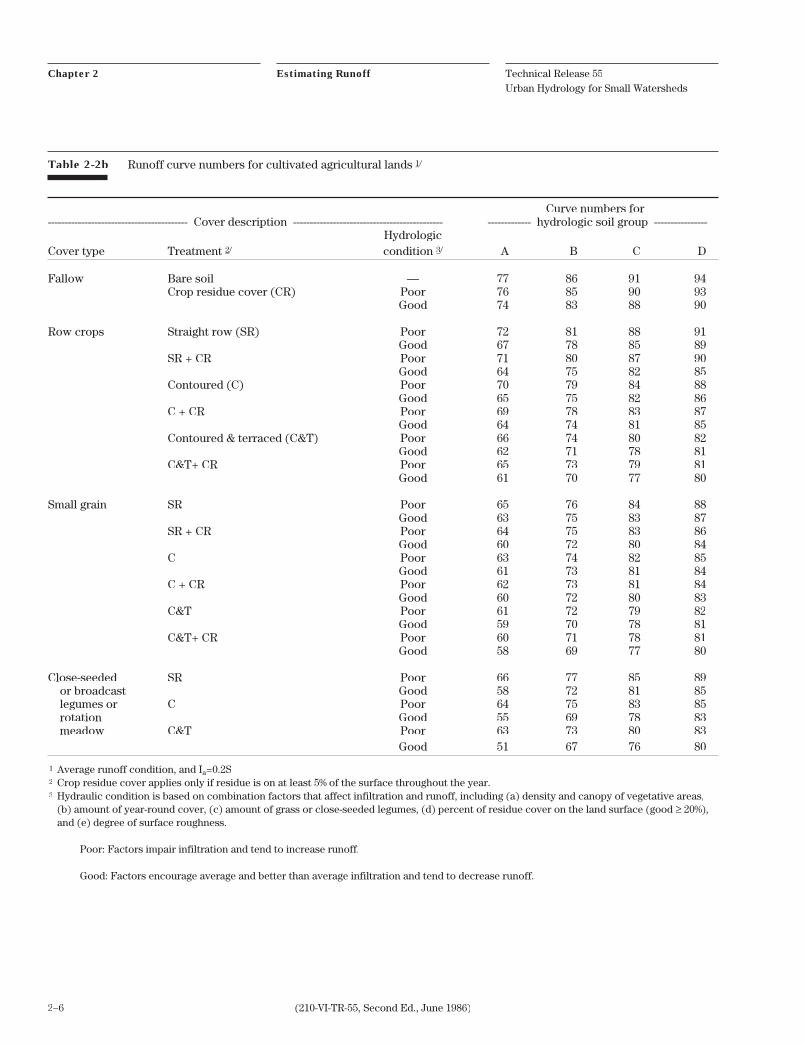
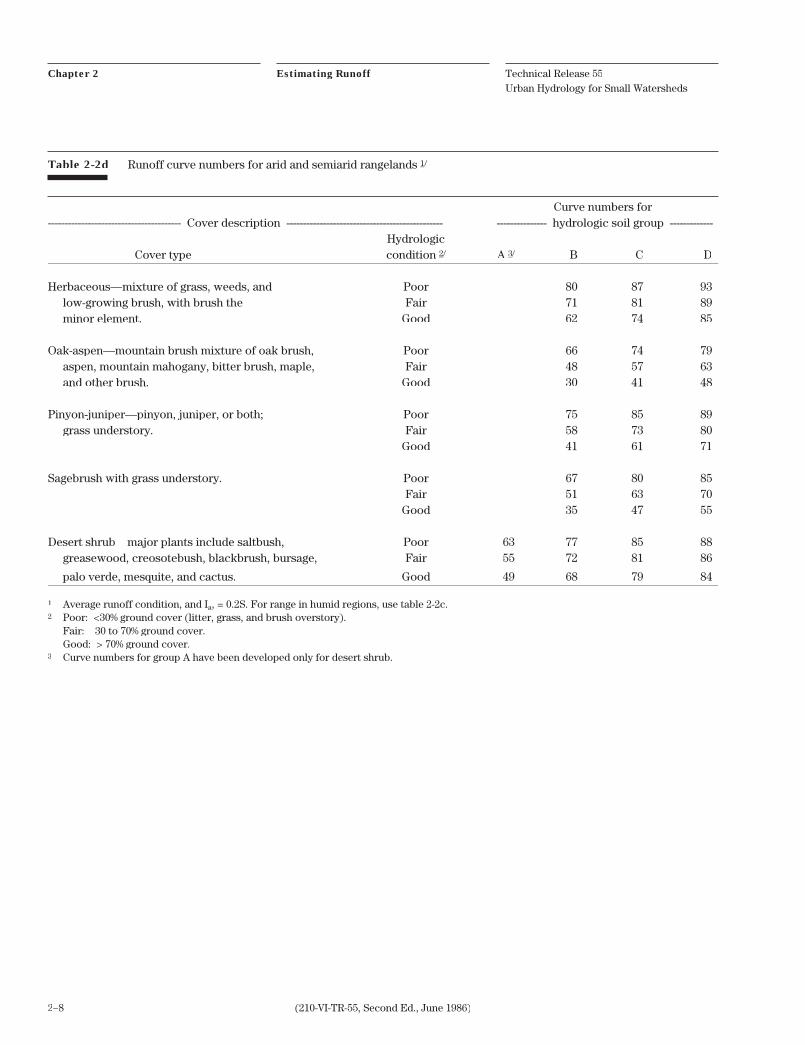
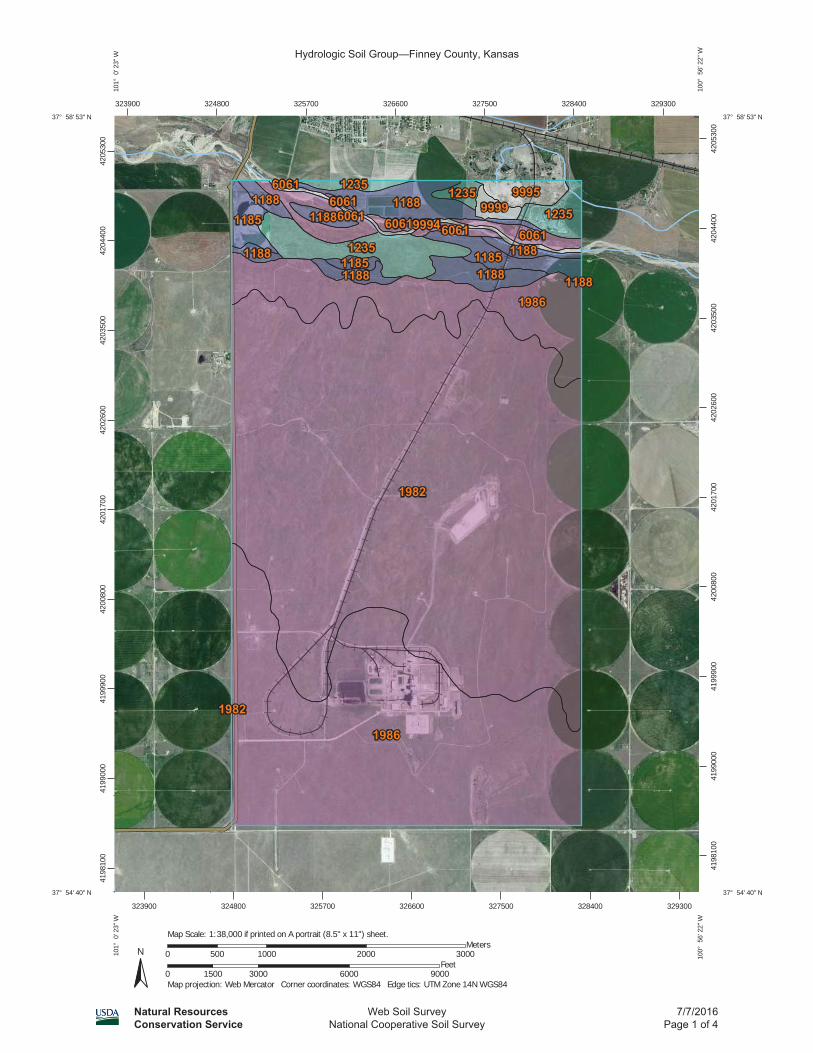
Until final closure, Phase 3A will receive deposits of hydrated/partially hydrated fly ash. AEC designated this unit with a curve number of 86 and is considered substantially similar to the Bare Soil with a hydrologic soil group of B (See TR-55 Table 2-2b). The compacted nature of the material limits the applicability of Type A soils; however, the partially hydrated nature of the fly ash and ability to retain water limits the applicability of Type C or D soils. The closed portion of the landfill (Phases 1, 2A, and 2B) were designated with a curve number of 69 in that they compare favorably to rangeland with a fair hydrologic condition and Type B soils (See TR-55 Table 2-2c). Outside the active landfill areas, AEC designated acurve number of 39 as the area compares favorably with rangeland in good hydrologic condition (i.e., >75% ground cover) and Type A soils (Valent fine sand, 5 to 20 percent slopes – USDA Web Soil Survey). Finally, the lined evaporation basin was designated a curve number of 100, as applicable to water bodies. The total drainage area is 86.3 acres with a weighted curve number of 59. This data was utilized in the evaporation basin simulation and the HEC-HMS model for determining peak run-off.
Sunflower Electric Power Corporation Stormwater Control Plan July 2016Sunflower CCR Landfill 40 CFR 257.81
Attachment 2 August 4, 2016
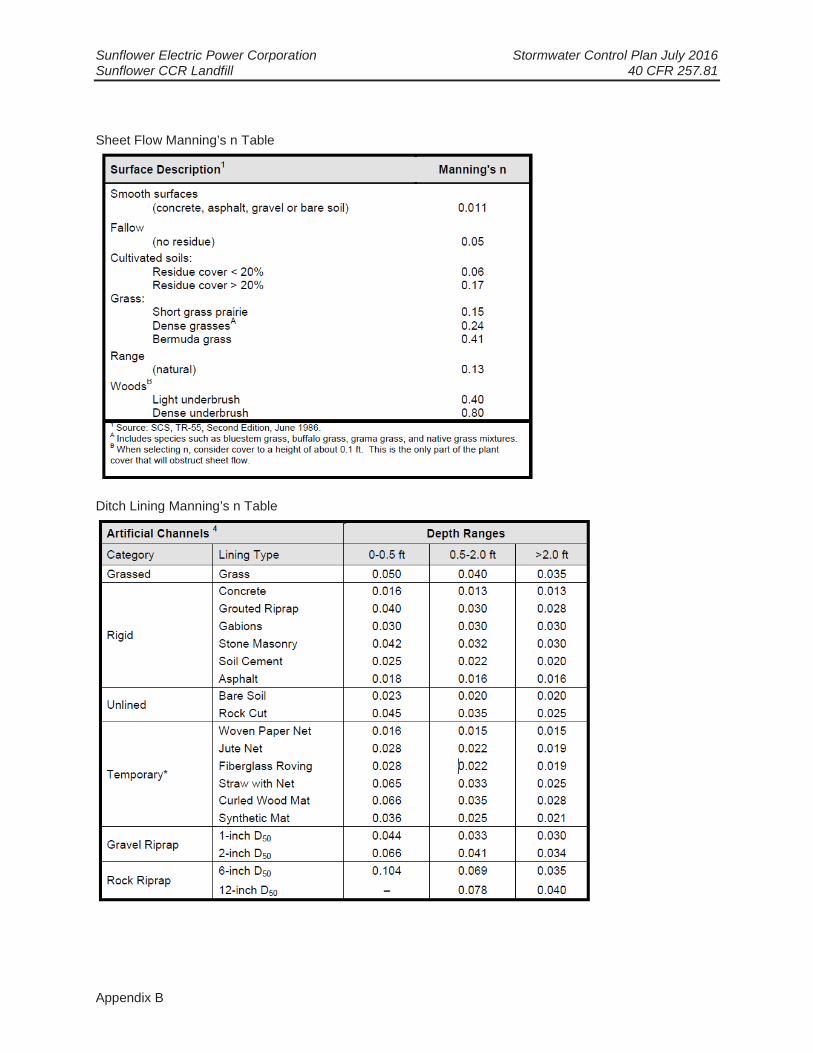
Time of ConcentrationThe “Time of Concentration” calculation section for the Phase 3A and Outside Landfill Areas determinethe time of concentration, also known as travel time, and the lag time for the two major drainage areas. For Phase 3A, the total area time of concentration was found to be 8.8 minutes with a corresponding lag time of 5.3 minutes. For Outside the Landfill areas, the time of concentration was found to be 25.5 minutes with a lag time of 15.3 minutes. AEC relied on the TR-55 and HEC 22 calculation methods and the associated variables (Manning’s n) for the selected area types. A Manning’s n of 0.05 (Fallow-no residue) was selected for Phase 3A sheet flow to estimate the projected top of the filled Phase 3A (prior to closure). A Manning’s n of 0.13 (Range-natural) was selected for Outside the Landfill sheet flow. AEC selected 16.3 for the K value to represent the shallow concentrated flow velocity coefficient for Phase 3A as defined in TR-55 as unpaved. AEC selected 7 for K to represent the shallow concentrated flow velocity coefficient for Outside the Landfill corresponding to grass pasture. For all the non-rip-rapped ditches AEC selected a Manning’s n of 0.02 corresponding to unlined-bare soil to represent the worst-case, un-vegetated ditch. For rip-rapped sections of the ditch a Manning’s n of 0.035 was utilized. Slopes and lengths were determined using the design ditch and topography.
Climate DataClimate data was collected and analyzed from NOAA for the Garden City Experimental Station, the climate data were from 8/1/1948 through 5/20/2016, almost 68 years of data. Among other parameters, the data included daily precipitation and daily pan evaporation. The daily data was averaged and cumulated to form the average monthly data. For comparative purposes, the average daily maximum precipitation was calculated. AEC obtained the 25 year, 24 hour storm event data from the KDOT Rainfall Intensity Tables for Finney County (Road Memorandum No. 97-5. November 1997).
Evaporation Basin SimulationFor the Evaporation Basin Simulation, run-off amounts were calculated using the SCS Curve Number Method from monthly precipitation values and the Total Area and Weighted Average Curve Number calculated in Areas and Curve Numbers. The Simulation begins with a 25 year 24 hour storm event occurring prior to the start of the rainy season. As a conservative estimate, the total average monthly precipitation was assumed to occur during one storm to maximize run-off. Months where precipitation did not exceed the initial abstraction (Ia), run-off was zero. The curve number of “Outside LF” was varied with values ranging from 39 to 70, all resulting in seasonal emptying of the basin. As shown in the simulation, the evaporation basin only fills a maximum of about 1.5 feet deep. The basin is actually 12 feet deep allowing for extreme excess rainfall. This agrees with statements from facility personnel, in which, they indicate that the basin rarely contains anything but localized puddles of water.
Ditch SizingAEC designed the site ditches utilizing the worst case scenario for the Phase 3A peak run-off. The Phase 3A peak run-off was determined to be 106 cubic feet per second (CFS) utilizing HEC-HMS 4.1 modeling software utilizing the SCS Curve Number Loss Method and the SCS Unit Hydrograph Transform Method and the parameters for the Phase 3A provided in the worksheet.
Two scenarios were analyzed during the ditch sizing, with the most conservative presented in the worksheet. The first was the shallowest slope (0.8%) using a bare earth Manning’s n (0.02), the second was a steeper slope (2.0%) using a riprap Manning’s n (0.035). The latter method provided the least amount of flow for the ditch cross-section. A triangular ditch with 3:1 side slopes, 2.5 feet deep will provide capacity for a minimum of 126 CFS of flow, providing enough capacity for the calculated peak run-off of 106 CFS.
*-*-*-*-*

APPENDIX A
CURVE NUMBER TABLES

Chapter 2
2–5(210-VI-TR-55, Second Ed., June 1986)
Technical Release 55Urban Hydrology for Small Watersheds
Estimating Runoff
Table 2-2a Runoff curve numbers for urban areas 1/
Curve numbers for------------------------------------------- Cover description ----------------------------------------- -----------hydrologic soil group -------------
Average percentCover type and hydrologic condition impervious area 2/ A B C D
Fully developed urban areas (vegetation established)
Open space (lawns, parks, golf courses, cemeteries, etc.) 3/:Poor condition (grass cover < 50%) .......................................... 68 79 86 89Fair condition (grass cover 50% to 75%) .................................. 49 69 79 84Good condition (grass cover > 75%) ......................................... 39 61 74 80
Impervious areas:Paved parking lots, roofs, driveways, etc.
(excluding right-of-way) ............................................................. 98 98 98 98Streets and roads:
Paved; curbs and storm sewers (excludingright-of-way) ................................................................................ 98 98 98 98Paved; open ditches (including right-of-way) .......................... 83 89 92 93Gravel (including right-of-way) ................................................. 76 85 89 91Dirt (including right-of-way) ...................................................... 72 82 87 89
Western desert urban areas:Natural desert landscaping (pervious areas only) 4/ ..................... 63 77 85 88Artificial desert landscaping (impervious weed barrier,
desert shrub with 1- to 2-inch sand or gravel mulchand basin borders) ...................................................................... 96 96 96 96
Urban districts:Commercial and business ................................................................. 85 89 92 94 95Industrial ............................................................................................. 72 81 88 91 93
Residential districts by average lot size:1/8 acre or less (town houses) .......................................................... 65 77 85 90 921/4 acre ................................................................................................ 38 61 75 83 871/3 acre ................................................................................................ 30 57 72 81 861/2 acre ................................................................................................ 25 54 70 80 851 acre ................................................................................................... 20 51 68 79 842 acres .................................................................................................. 12 46 65 77 82
Developing urban areas
Newly graded areas(pervious areas only, no vegetation) 5/ ................................................................ 77 86 91 94
Idle lands (CN’s are determined using cover typessimilar to those in table 2-2c).
1 Average runoff condition, and Ia = 0.2S.a2 The average percent impervious area shown was used to develop the composite CN’s. Other assumptions are as follows: impervious areas are
directly connected to the drainage system, impervious areas have a CN of 98, and pervious areas are considered equivalent to open space ingood hydrologic condition. CN’s for other combinations of conditions may be computed using figure 2-3 or 2-4.
3 CN’s shown are equivalent to those of pasture. Composite CN’s may be computed for other combinations of open spacecover type.
4 Composite CN’s for natural desert landscaping should be computed using figures 2-3 or 2-4 based on the impervious area percentage(CN = 98) and the pervious area CN. The pervious area CN’s are assumed equivalent to desert shrub in poor hydrologic condition.
5 Composite CN’s to use for the design of temporary measures during grading and construction should be computed using figure 2-3 or 2-4based on the degree of development (impervious area percentage) and the CN’s for the newly graded pervious areas.
Technical Release 55Urban Hydrology for Small Watersheds
Estimating RunoffChapter 2
2–6 (210-VI-TR-55, Second Ed., June 1986)
Table 2-2b Runoff curve numbers for cultivated agricultural lands 1/
Curve numbers for------------------------------------------ Cover description --------------------------------------------- ------------- hydrologic soil group ----------------
HydrologicCover type Treatment 2/ condition 3/ A B C D
Fallow Bare soil — 77 86 91 94Crop residue cover (CR) Poor 76 85 90 93
Good 74 83 88 90
Row crops Straight row (SR) Poor 72 81 88 91Good 67 78 85 89
SR + CR Poor 71 80 87 90Good 64 75 82 85
Contoured (C) Poor 70 79 84 88Good 65 75 82 86
C + CR Poor 69 78 83 87Good 64 74 81 85
Contoured & terraced (C&T) Poor 66 74 80 82Good 62 71 78 81
C&T+ CR Poor 65 73 79 81Good 61 70 77 80
Small grain SR Poor 65 76 84 88Good 63 75 83 87
SR + CR Poor 64 75 83 86Good 60 72 80 84
C Poor 63 74 82 85Good 61 73 81 84
C + CR Poor 62 73 81 84Good 60 72 80 83
C&T Poor 61 72 79 82Good 59 70 78 81
C&T+ CR Poor 60 71 78 81Good 58 69 77 80
Close-seeded SR Poor 66 77 85 89or broadcast Good 58 72 81 85legumes or C Poor 64 75 83 85rotation Good 55 69 78 83meadow C&T Poor 63 73 80 83
Good 51 67 76 80
1 Average runoff condition, and Ia=0.2S2 Crop residue cover applies only if residue is on at least 5% of the surface throughout the year.3 Hydraulic condition is based on combination factors that affect infiltration and runoff, including (a) density and canopy of vegetative areas,
(b) amount of year-round cover, (c) amount of grass or close-seeded legumes, (d) percent of residue cover on the land surface (good ≥ 20%),and (e) degree of surface roughness.
Poor: Factors impair infiltration and tend to increase runoff.
Good: Factors encourage average and better than average infiltration and tend to decrease runoff.

Chapter 2
2–7(210-VI-TR-55, Second Ed., June 1986)
Technical Release 55Urban Hydrology for Small Watersheds
Estimating Runoff
Table 2-2c Runoff curve numbers for other agricultural lands 1/
Curve numbers for--------------------------------------- Cover description -------------------------------------- ------------ hydrologic soil group ---------------
HydrologicCover type condition A B C D
Pasture, grassland, or range—continuous Poor 68 79 86 89forage for grazing. 2/ Fair 49 69 79 84
Good 39 61 74 80
Meadow—continuous grass, protected from — 30 58 71 78grazing and generally mowed for hay.
Brush—brush-weed-grass mixture with brush Poor 48 67 77 83the major element. 3/ Fair 35 56 70 77
Good 30 4/ 48 65 73
Woods—grass combination (orchard Poor 57 73 82 86or tree farm). 5/ Fair 43 65 76 82
Good 32 58 72 79
Woods. 6/ Poor 45 66 77 83Fair 36 60 73 79
Good 30 4/ 55 70 77
Farmsteads—buildings, lanes, driveways, — 59 74 82 86and surrounding lots.
1 Average runoff condition, and Ia = 0.2S.2 Poor: <50%) ground cover or heavily grazed with no mulch.
Fair: 50 to 75% ground cover and not heavily grazed. Good: > 75% ground cover and lightly or only occasionally grazed.
3 Poor: <50% ground cover.oror
Fair: 50 to 75% ground cover. Good: >75% ground cover.
4 Actual curve number is less than 30; use CN = 30 for runoff computations.5 CN’s shown were computed for areas with 50% woods and 50% grass (pasture) cover. Other combinations of conditions may be computed
from the CN’s for woods and pasture.6 Poor: Forest litter, small trees, and brush are destroyed by heavy grazing or regular burning.
Fair: Woods are grazed but not burned, and some forest litter covers the soil. Good: Woods are protected from grazing, and litter and brush adequately cover the soil.
Technical Release 55Urban Hydrology for Small Watersheds
Estimating RunoffChapter 2
2–8 (210-VI-TR-55, Second Ed., June 1986)
Table 2-2d Runoff curve numbers for arid and semiarid rangelands 1/
Curve numbers for---------------------------------------- Cover description ----------------------------------------------- --------------- hydrologic soil group -------------
Hydrologic Cover type condition 2/ A 3/ B C D
Herbaceous—mixture of grass, weeds, and Poor 80 87 93low-growing brush, with brush the Fair 71 81 89minor element. Good 62 74 85
Oak-aspen—mountain brush mixture of oak brush, Poor 66 74 79aspen, mountain mahogany, bitter brush, maple, Fair 48 57 63and other brush. Good 30 41 48
Pinyon-juniper—rr pinyon, juniper, or both; Poor 75 85 89—grass understory. Fair 58 73 80
Good 41 61 71
Sagebrush with grass understory. Poor 67 80 85Fair 51 63 70
Good 35 47 55
Desert shrub—major plants include saltbush, Poor 63 77 85 88greasewood, creosotebush, blackbrush, bursage, Fair 55 72 81 86
palo verde, mesquite, and cactus. Good 49 68 79 84
1 Average runoff condition, and Ia, = 0.2S. For range in humid regions, use table 2-2c.2 Poor: <30% ground cover (litter, grass, and brush overstory).
Fair: 30 to 70% ground cover.Good: > 70% ground cover.
3 Curve numbers for group A have been developed only for desert shrub.

APPENDIX B
MANNING’S n TABLES
Sunflower Electric Power Corporation Stormwater Control Plan July 2016Sunflower CCR Landfill 40 CFR 257.81
Appendix B
Sheet Flow Manning’s n Table
Ditch Lining Manning’s n Table
APPENDIX C
NRCS WEB SOIL SURVEY
4198
100
4199
000
4199
900
4200
800
4201
700
4202
600
4203
500
4204
400
4205
300
4198
100
4199
000
4199
900
4200
800
4201
700
4202
600
4203
500
4204
400
4205
300
323900 324800 325700 326600 327500 328400 329300
323900 324800 325700 326600 327500 328400 329300
37° 58' 53'' N10
1° 0
' 23'
' W37° 58' 53'' N
100°
56'
22'
' W
37° 54' 40'' N
101°
0' 2
3'' W
37° 54' 40'' N
100°
56'
22'
' W
N
Map projection: Web Mercator Corner coordinates: WGS84 Edge tics: UTM Zone 14N WGS840 1500 3000 6000 9000
Feet0 500 1000 2000 3000
MetersMap Scale: 1:38,000 if printed on A portrait (8.5" x 11") sheet.