storm water management and ground water - gwpc · · 2012-06-06storm water management and ground...
TRANSCRIPT

Storm Water Management and Ground WaterTom BallesteroUniversity of New Hampshire Stormwater Center
GWPC Source Water Webinar – Stormwater Management and Source Water Protection
12 July 2011
1

Acknowledgements
• Funding by CICEET/NOAA• Graduate and undergraduate students• Industry collaborators
2
Overview of Talk
• Introduction to the UNHSC• Types of Stormwater Management Systems• Hydraulic Performances• Water Quality Performance• Linkage to Groundwater• Protecting Groundwater: Do’s and Don’ts
3

4
Who We Are
scientists engineers educators

5
What We Do
BMP Performance Monitoring Targeted Research Outreach

Outreach MaterialsAnnual Reports
Journal Articles
Fact Sheets
Design SpecificationsDesign Drawings
Web Resources
http://www.unh.edu/erg/cstev
or just google UNHSC

7
BMP Performance Monitoring
Research Field Facility at UNHTc ~ 19 minutes
Watershed Boundary
TreeFilter
PorousAsphalt
Bioretention Retrofit
UNHSC Research Facility


ParallelPerformance
Evaluation•Each system uniformly sized to treat 1” runoff for 1 acre of impervious area
•WQV=3300 cf
•Qwqv=1 cfs
•Uniform contaminant loading
•Uniform storm event characteristics
•Systems lined for mass balance
•Long term record of hydrology and contaminants

Why the Center Was Created•Three-Year Study of
Conventional Systems
• Swales• Ponds
• Wet• Dry
NURP conclusion: Wet systems outperformDry systems (EPA, 1983)

11
Study Found That…
Systems failed to
improve water
quality 2/3
of the time!26%of the time systems did nothing
34%of the timesystems offered some kind of treatment
40%of the time systems exported more pollutants

Low Impact Developmentand Green Infrastructure
Stormwater management that starts with site layout and design plus includes systems designed to create hydrologic transparency
12

Types of Unit Processes
• Storage• Sedimentation• Filtration• Infiltration• Sorption• Biodegradation• Chemical alteration
13

Storage
14
Rain Barrel
Tunnels
Manufactured Chambers

Sedimentation
15Retention Pond
Stone Swale Vegetated Swale
Detention Pond
Hydrodynamic Separator

Filtration - constructed systems
16
Porous Asphalt Pervious Concrete Permeable Pavers
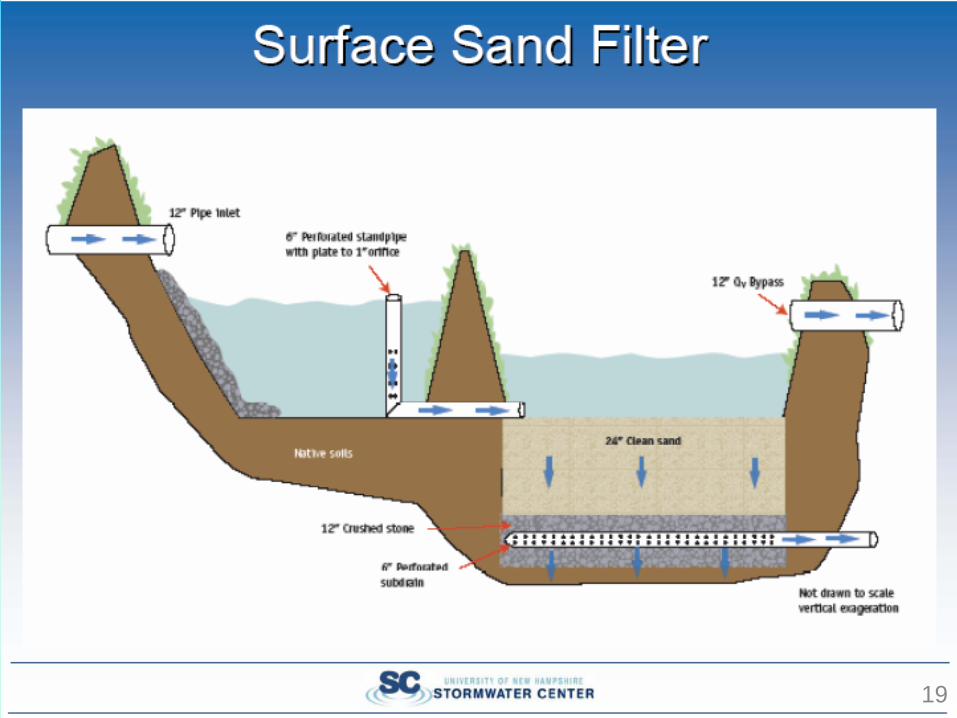
Sand Filter Ecoroof

Filtration - manufactured
17
Underground Sand Filter
Filter Unit

Filtration - Biological
18
Subsurface Gravel Wetland
Bioretention SystemTree Filter
19

Bioretention
20

Tree Filter
21

Subsurface Gravel Wetland
22

Infiltration
23
Subsurface InfiltrationIsolator Row
Infiltration Basin

Sorption/Chemical Alteration
• Selected media to target specific contaminants– Phosphorus– Metals– Nitrogen
24
Biodegradation/Biocide
• Microbially-focused efforts– Hydrocarbons– Nutrients– Microorganisms
25

Hydraulic Performance
26

Porous Asphalt Flow and Volume Attenuation
Average Annual Peak Flow Reduction is 68%
Average Annual Lag Time is 790 min
27
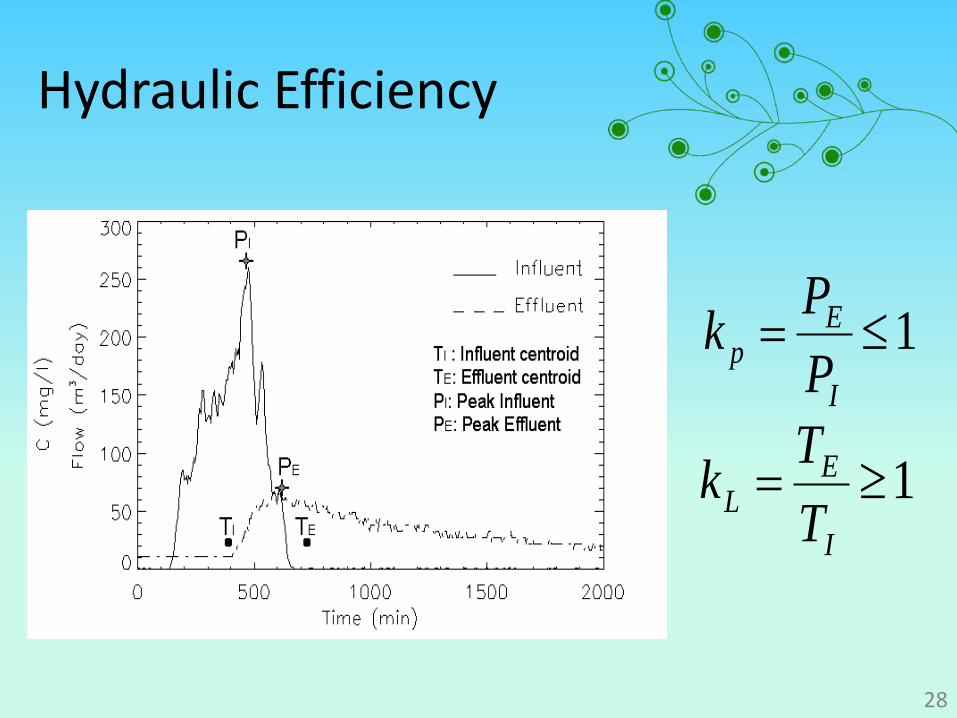
Hydraulic Efficiency
28
1≤=I
Ep P
Pk
1≥=I
EL T
Tk

29
Lag Time (kL) Peak Reduction (kP)
5 2 1 0.5 0.1
Hydraulic Performance
Water Quality Performance
30

31
Event Mean Concentration
Discharge-weighted average concentration
∫∫=
)(
)()(
tQ
tCtQEMC
∑∑≈
i
ii
QCQ

Event Mean Concentration
32
EMC

TSS Removal Efficiencies
10090
80
70
60
50
40
30
20
10
0
TSS
% R
emov
al E
ffici
ency

DIN Removal Efficiencies
10090
80
70
60
50
40
30
20
10
0
DIN
% R
emov
al E
ffici
ency

TP Removal Efficiencies
10090
80
70
60
50
40
30
20
10
0
TP %
Rem
oval
Effi
cien
cy

36

37

Retrofit Strategies
38

39
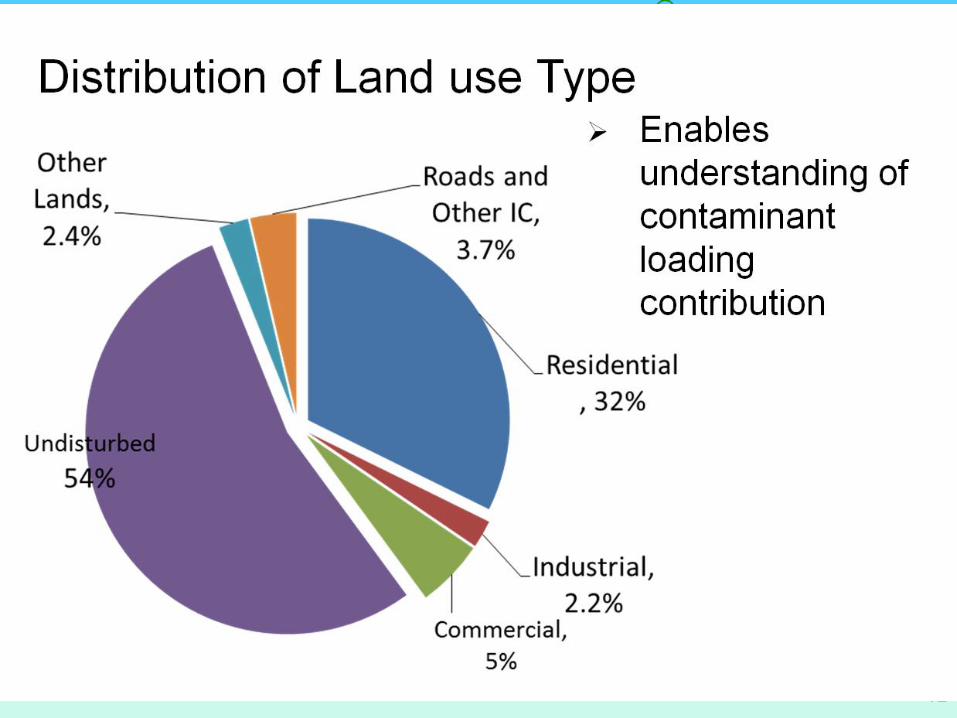
Distribution of IC Type
• Will enable targeting of IC reduction

40
Land use for WB Watershed
41
42
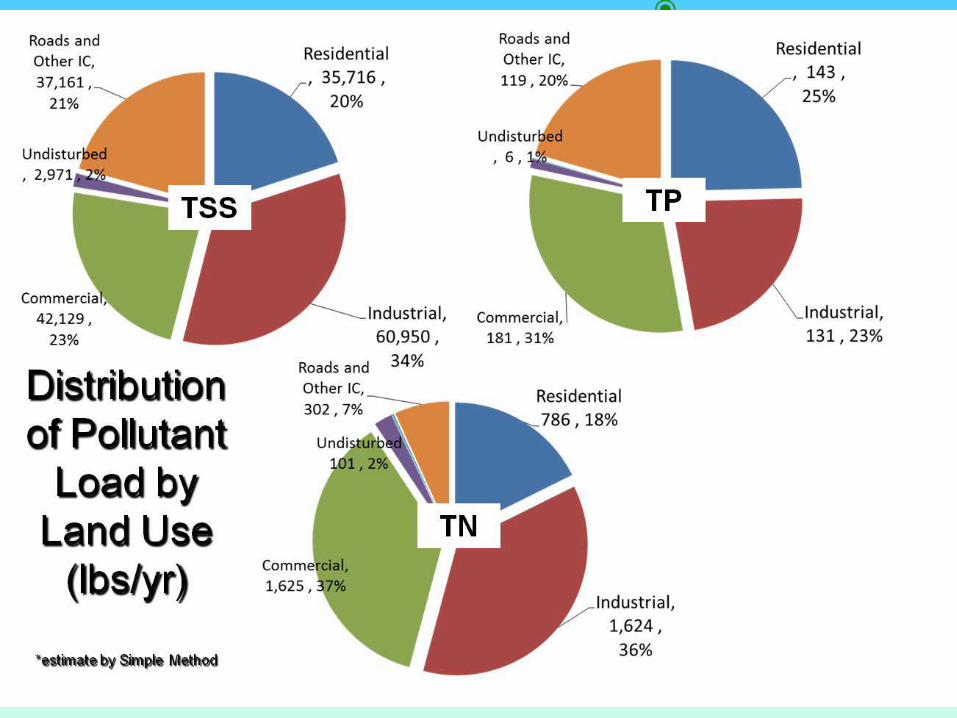
Realities
43
• LID Low hanging fruit• Substantial reductions in pollutant loading
could be achieved by addressing some of the areas with relatively low land cover but high loading and imperviousness—Commercial and Industrial

Boulder Hills, Pelham, NH 2009 Installation of 900’ of
first PA private residential road in Northeast
Site will be nearly Zero discharge
LID subdivision 55+ Active Adult Community
Large sand deposit Cost 25% greater per ton
installed7/20/2011 44

• Avoided use of 1616’ of curbing, 785’ pipe, 8 catch-basins, 2 detention basins, 2 outlet control structures
• Conventional SWM=$789,500 vs LID SWM=$740,300, $49,000 savings (6.2%)
7/20/2011 45
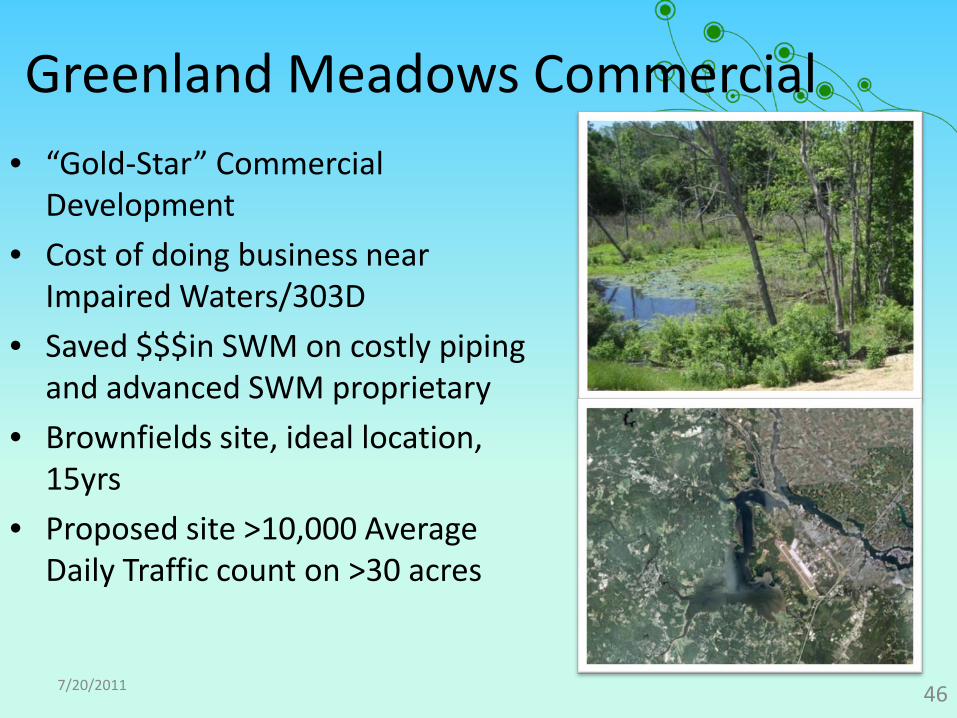
Greenland Meadows Commercial• “Gold-Star” Commercial
Development• Cost of doing business near
Impaired Waters/303D• Saved $$$in SWM on costly piping
and advanced SWM proprietary• Brownfields site, ideal location,
15yrs• Proposed site >10,000 Average
Daily Traffic count on >30 acres
7/20/2011 46

47
Effective and Economical Designs
28 ac site, initially >95% impervious, now <10%EIC, with all drainage through filtration, expected to have minimal WQ impact except thermal and chloride

7/20/2011 48

Soil Limitation?
49

50
Conventional design
Conventional Site:• connected
impervious surfaces
LID Site:• disconnected imperviousness• Rooftop to bioretention 1” WQV,
overflow to PA driveway• Driveway and Roadways as PA• Lawns to PA• 65% UDC, <10% EIC (NHDES
requirements)
LID design
Conventional design
Pavement
Lawn
Rooftop
CB

51
LID design
PorousPavement
Lawn
Rooftop
65%UDC
Bioretention

52
Total runoff Volumes
Total Runoff Volumes for Each Scenario per 1 Acre of Development
in Type A soil
0
5000
10000
15000
20000
25000
30000
1” 2yr
10yr
100y
r
2yr a
dj
10yr
adj
100y
r adj
Design storm
Tota
l Run
off V
olum
es (c
f)
LID-volume (cf)
Predevelopment-volume (cf)
Conventional-volume (cf)
Total Runoff Volumes for Each Scenario per 1 Acre of Development
in Type C Soil
0
5,000
10,000
15,000
20,000
25,000
30,000
1” 2yr10y
r100
yr
2yr adj
10yr a
dj
100yr a
dj
Design storm
Tota
l Run
off V
olum
es (c
f)
LID-volume (cf)
Predevelopment-volume (cf)
Conventional-volume (cf)

USEPA Design Requirements for Height Above Groundwater
• The recommended guidelines for depth to groundwater are established to protect groundwater contamination.
• It has been shown that heavy metals and PAHs are at background concentrations within 1.5 meters. (Mikkelsen et al., 1996; McKenzie, 1988).
• Guidelines for infiltration system installation are 3-4 feet minimum distance from water table, and 5 feet for sole source aquifers.
53

Factors to Consider for Infiltration (Pitt)
• Runoff water quality: Land Use and Cover– Roof-top—not necessarily “clean”
• Loading: 20% TSS, 70-90% N, 25% P, 10-50% of Metals and PH (Wu et al, 1998; Minton, 2002) ranges in atmospheric precip. Or rooftop runoff
– Roadways: vary by usage– Parking lots– Residential
• Source control: ideal to prevent co-mingling of dirty and clean runoff– Quality varies
• End-Of-Pipe control– Tends to have poorest water quality– Stormwater outfalls may be contaminated by Illicit discharge
containing:• Raw sewage• Other municipal, industrial, and agricultural contaminants
54
Inappropriate Recharge
• Subsurface contamination (Ex: gas stations, industrial production, abandoned mines)
• Hot spots and sole source aquifers• Insufficient depth to groundwater
55

Contaminants of Concern
• Salts• Nutrients: N and P• Metals• Petroleum hydrocarbons• Solids• Bacteria• Pesticides
56
Sub-base Materials for Infiltration Systems
• Highly permeable materials such as gravels (>16 mm) have poor removal in comparison with soils with fine-grains, such as sands. (FHWA, 2005; AdolfsonAssociates, 1995). From EPA piece w/ 1.5 m vert sep.
• Sands and soils with infiltration rates of 0.2 -3 inches per hour (from lit.) – narrow range, low
• Drainage time of 24-48 hrs• Soils with low infiltration rates can be effective for
infiltration but require storage to provide extended drain time
57

Alternate Scenarios
INFILTRATION TRENCH
POROUS ASPHALT
NATIVE MATERIALS
¾” CHOKER 4”
4”
4’ SHWT
2’ SANDY RESERVOIR BASE
NATIVE MATERIALS
2.5’ BSM
BIORETENTION
4’ SHWT
2.5’
NATIVE MATERIALS
4’ SHWT
58

Infiltration
• Minimizes site runoff volume to pre-development levels
• Peak flow reduction• Pollutant mass reduction
– Are we simply relocating contamination? Removing pollutants means that they can build up unless they break down or are removed.
7/20/2011 59

Is Infiltration a Net Advantage?
• Always consider questions like this for ALLalternatives. Too often they are only applied to LID technologies, and the result is selecting even poorer, conventional systems to address the same issue.
• There are no stormwater silver bullets…cannot infiltrate everywhere.
7/20/2011 60

Summary Conclusions
•If appropriately sited, infiltration and filtration mechanisms can be top performers
•If not they can endanger/impair groundwater resources
•Proper separation from SHWT is needed•Proper sandy subbase is needed
61
