storage media overview projec2ng future trends from … tal… · storage media overview projec2ng...
TRANSCRIPT

R.Fontana,G.Decad–IBMSystemsSeptember19,2016
StorageMediaOverviewProjec2ngFutureTrends
from2008-2015HistoricPerspec2ves
©2016IBMCorporaAon

Outline
• ADefiniAon:StorageMediaisPBshipmentsforLTOTAPE,HDD,andNAND
• AComment:FuturePredicAonsareDifficultwhilePastPerformanceisVerifable
• Topics• StorageLandscapefor2008-2015
• Moore’sLaw–Underachievingimpliescomponentsaremorevaluable
• ExabytesandMillionsofSquareInchesandArealDensity
• LandscapeComparisons:2008-2015,2012-2015,2015
• MSIExamplesandSpecificTrends
• SummaryandtheFuture
©2016IBMCorpora2onPage2Fontana,Decad–LOC2016–StorageMedia

Storage Landscape for HDD, TAPE, NAND: 2008-2015
• ThestoragecomponentlandscapehasbeenmonitoredbytrackingannualrevenueandtechnologytrendsinLTOTAPEMEDIA,HDD,andNAND• Arealdensity,Revenue• $/GBandExabyteshipments
• 2015observaAons• NAND:SignificantEBgrowthbutminimalrevenuegrowth• HDD:MinimalEBgrowthwithrevenuedecrease• LTOTAPEMEDIA:EBgrowthwithlowerrevenue• $/GBforalltechnologiesreducedbybetween16%and22%• ArealDensityslowingforHDD
• Overview
©2016IBMCorpora2onPage3Fontana,Decad–LOC2016–StorageMedia
2015%CHANGE EXABYTES REVENUE $/GB AREALDENSITY
LTOTAPEMEDIA 9.6% -10.0% -18.4% 100%*
HDD 2.9% -15.3% -16.4% 11%
NANDFLASH 32.8% 3.1% -22.1% 25%
TOTAL 6.1% -6.3% NA NA*LT07introducedlate2015effec2velydoublingdensitybut2yearproductcycle

The Bit Cell Landscape
• BitCellObservaAons–“Thereisnotmuchroomattheboeom”forHDDandNAND
• NANDStrategy–MulAlayeror3Dcells(largercellareawithmulAplelayersofcells)
• HDDStrategy–SmallercellareausingthermalwriAngof“harder”magneAcmedia
• TAPEStrategy–Moore’sLawScaling–“ThereissAllroomattheboeom”
NAND-MLC1100Gbit/in²24nmx24nm
NAND-TLC1500Gbit/in²19nmx19nm
HDD1000Gbit/in²58nmx11nm
TAPE7Gbit/in²2000nmx47nm
©2016IBMCorpora2onPage4Fontana,Decad–LOC2016–StorageMedia
NAND–TLC3D1500Gbit/in²84nmx84nm20layers
Blu-RayBD-XL75Gbit/in²180nmx180nm3layers
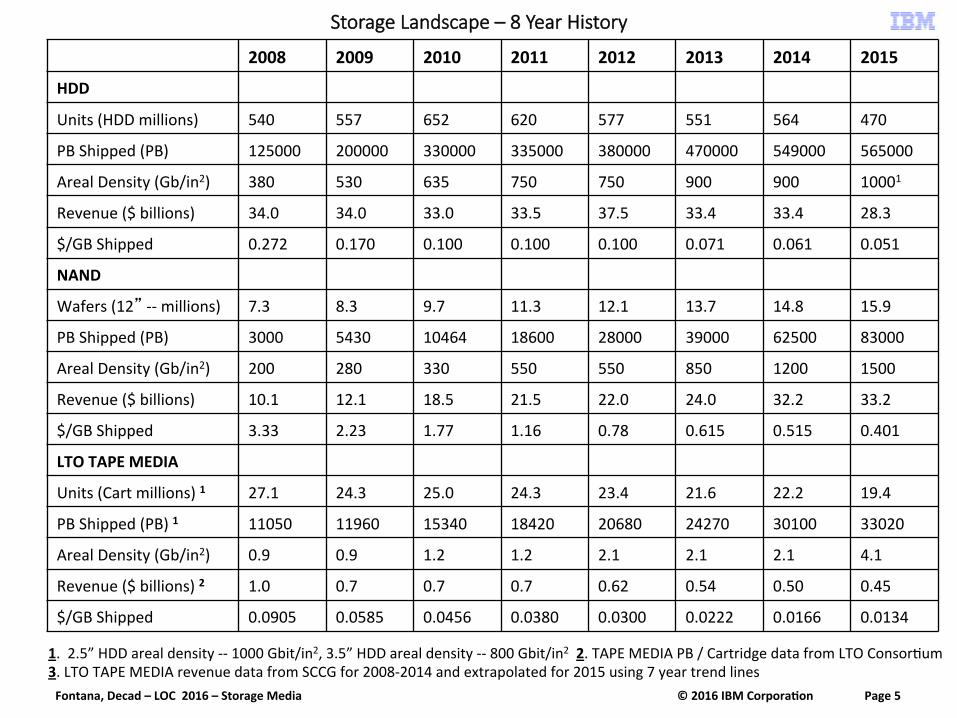
Storage Landscape – 8 Year History
1.2.5”HDDarealdensity--1000Gbit/in2,3.5”HDDarealdensity--800Gbit/in22.TAPEMEDIAPB/CartridgedatafromLTOConsorAum3.LTOTAPEMEDIArevenuedatafromSCCGfor2008-2014andextrapolatedfor2015using7yeartrendlines
2008 2009 2010 2011 2012 2013 2014 2015
HDD
Units(HDDmillions) 540 557 652 620 577 551 564 470
PBShipped(PB) 125000 200000 330000 335000 380000 470000 549000 565000
ArealDensity(Gb/in2) 380 530 635 750 750 900 900 10001
Revenue($billions) 34.0 34.0 33.0 33.5 37.5 33.4 33.4 28.3
$/GBShipped 0.272 0.170 0.100 0.100 0.100 0.071 0.061 0.051
NAND
Wafers(12”--millions) 7.3 8.3 9.7 11.3 12.1 13.7 14.8 15.9
PBShipped(PB) 3000 5430 10464 18600 28000 39000 62500 83000
ArealDensity(Gb/in2) 200 280 330 550 550 850 1200 1500
Revenue($billions) 10.1 12.1 18.5 21.5 22.0 24.0 32.2 33.2
$/GBShipped 3.33 2.23 1.77 1.16 0.78 0.615 0.515 0.401
LTOTAPEMEDIA
Units(Cartmillions)1 27.1 24.3 25.0 24.3 23.4 21.6 22.2 19.4
PBShipped(PB)1 11050 11960 15340 18420 20680 24270 30100 33020
ArealDensity(Gb/in2) 0.9 0.9 1.2 1.2 2.1 2.1 2.1 4.1
Revenue($billions)2 1.0 0.7 0.7 0.7 0.62 0.54 0.50 0.45
$/GBShipped 0.0905 0.0585 0.0456 0.0380 0.0300 0.0222 0.0166 0.0134
©2016IBMCorpora2onPage5Fontana,Decad–LOC2016–StorageMedia

Storage Media Environment -- EB
• 2015vs2012–NANDPBMarketShareIncrease,HDDPBMarketShareDecrease
HDD;380000 PB;89%
NAND,28000 PB,6%
LTOTAPE,21000 PB,5%
HDD NAND LTOTAPE
HDD;565000 PB;83%
NAND,83000 PB,12%
LTOTAPE,33000 PB,5%
HDD NAND LTOTAPE
2015PBShipments–681,000PB 2012PBShipments–429,000PB
©2016IBMCorpora2onPage6Fontana,Decad–LOC2016–StorageMedia

Storage Media – Exabytes, Areal Density, MSI DefiniQons
• Exabyte(EB)ShipmentsofStorageMediareliesonamanufacturingbase• NAND–300mmdiameterwaferstarts• HDD–Individualdriveshipmentswithheadsanddisksurfaces• LTOTAPE–Cartridgeshipmentswithmetersof½”tapewidth
• IncreasesinExabyteShipmentsofStorageMediacomesfromeitherincreasingthefactorycapacityofthemanufacturingbaseorbyincreasingtheefficiencyofstoringmorebitsperunitsurfaceareaofmanufacturedmedia• FactoryCapacityisMillionsofSquareInchesofmanufacturedmedia–MSI• BitsperUnitAreaisArealDensity–ADorGBpersquareinch
• EB=MSIxADandRevenue=EBx$/GBorRevenue=MSIxADx$/GB
• IncreaseinEBshipmentscomeswithcost:FactoriesforandMSIincreaseorR&DexpendituresforanADimprovement.
• Issue:ArealDensityandconsequently$/GBmetricshaveunderperformedinthelastthreeyears
©2016IBMCorpora2onPage7Fontana,Decad–LOC2016–StorageMedia

Storage Media – Moore’s Law RealiQes
• Moore’sLawPercepAon• $/GBdecreases30%peryearor50%everytwoyears• ADincreases40%peryearor100%everytwoyears• NET==Every2yearsthecomponentmanufacturerssell2Xmorestoragemediafor
0.5XlesscostperbitforarevenueneutralposiAon.Revenueincreasesonlyifmanufacturinginvestment(MSI)increasesorif│$/GB│reducAonsdecreases
• Moore’sLawReality• $/GBdecreased~20%/yrforthethreeyearperiod2013–2015• ArealDensity~40%/yrforNAND,26%/yrforLTOTAPE,10%/yrforHDDforthe
threeyearperiod2013-2105
• ConsequencesofMoore’sLaw($/GB)Underachieving(HDD–20%/yrvs30%/yr)• Storageismorevaluable;lesseasilyreplaced–62%increaseinreplacementcost
©2016IBMCorpora2onPage8Fontana,Decad–LOC2016–StorageMedia
4TBDrive 10PBSystem
2016Cost $160 $400K
2020Cost(20%/yr$/GBDecrease) $65 $162K
2020Cost(30%/yr$/GBDecrease) $40(Moore’sLaw) $100K(Moore’sLaw)

Storage Media Comparisons: 2008 – 2015, 2012 – 2015, and 2015
• Moore’sLawnotachieved:i.e.Densityincreasingat40%/YRand$/GBreducingat30%/YR
• Storageismorevaluable,lessreplaceable,andmustbereliableforlongerAmeperiods
©2016IBMCorpora2onPage9Fontana,Decad–LOC2016–StorageMedia
AnnualChange–last8years
AnnualChange--last3years
AnnualChange–lastyear
NAND$/GB -26% -20% -22%
HDD$/GB -21% -20% -16%
TAPE$/GB -24% -23% -19%
NANDEBShips +61% +43% +33%
HDDEBShips +24% +14% +3%
TAPEEBShips +17% +17% +10%
NANDRevenue +19% +15% +3%
HDDRevenue -3% -9% -15%
TAPERevenue -8% -9% -10%
NANDAD +33% +39% +25%
HDDAD +15% +10% +11%
TAPEAD +25% +26% +100%
Issue--RevenueDecrease
│$/GB│decrease≥
│EB│increase
Moore’sLaw–+40%/YR
Moore’sLaw–-30%/YR

Two Contrarian Trends from 2015 Data
• TotalannualmanufacturedExabytesshowsalineartrend(i.e.notexponenAal)withanannualincreaseoverthelast8yearsof77EB/YR(r2=0.98)
• TotalrevenueformanufacturedExabytesisstable,i.e.nogrowth,withdeclineinHDDrevenueabsorbedbyincreaseinNANDrevenue 0
10
20
30
40
50
60
70
2008 2009 2010 2011 2012 2013 2014 2015
Revenu
e($B)
Year
ComponentRevenue
HDD NAND LTOTAPEMEDIA
0100200300
400500600700800
2008 2009 2010 2011 2012 2013 2014 2015
Exabytes(EB)
Year
ManufacturedExabytes
HDD NAND TAPE
©2016IBMCorpora2onPage10Fontana,Decad–LOC2016–StorageMedia

Areal Density Roadmaps Not Being Updated
• TechnologyconsorAumsarelessrelevanttoindustrialdu-opoliesortri-opolies
• Arealdensityincreasesaremoredifficult,40%annualgrowthnolongerachievable
• Arealdensityroadmapsbeingarereplacedbycapacityroadmaps,i.e.whatclientsbuy
§ HDD: source ASTC 2013
0.0
1.0
2.0
3.0
4.0
5.0
6.0
7.0
8.0
9.0
2013 2014 2015 2016 2017 2018 2019 2020 2021 2022
Normalized
Value
s(20
14re
ference)
Year
3DNANDROADMAP(ITRS)
NormalizedCapacity NormalizedLayerNumber NormalizedBits/Cell
128Gb
256Gb
512Gb
1024Gb
2Bits/Cell 4Bits/Cell3Bits/Cell24Layers
96Layers
48Layers
1.0
10.0
100.0
2010 2012 2014 2016 2018 2020 2022 2024
ArealDesnity(G
b/in
2 )
Year
TapeRoadmap-- ArealDensity
§ NAND: source ITRS 2013
§ TAPE: source NSIC 2013
2015NSICRoadmap
PresentEnterpriseProducts
©2016IBMCorpora2onPage11Fontana,Decad–LOC2016–StorageMedia

0
2000
4000
6000
8000
10000
12000
14000
16000
18000
2007 2008 2009 2010 2011 2012 2013 2014 2015 2016
12"DiameterFlashNANDWaferStarts(millions)
0
5
10
15
20
25
30
2007 2008 2009 2010 2011 2012 2013 2014 2015 2016
LTOCartridgeUnits(millions)
0
100
200
300
400
500
600
700
2007 2008 2009 2010 2011 2012 2013 2014 2015 2016
HDDUnits(millions)
Revisi2ngMSI(millionsofsquareinches)forStorageComponents
• OnemeasureofstoragegrowthisMSIormillionsofsquareinchesofannuallymanufacturedstoragemedia.
• AnyincreaseinMSIcapabilityrequirescapitalinvestment
• AnincreaseinEBorPBmemoryshipmentsisaproductofincreasedMSIandADorarealdensity(i.e.thenumberofbitsthatamemorytechnologysupportsperunitarea)
• In2015LTOMedia,HDD,andNANDallincreasedEBmemoryshipmentsbutonlyNANDincreasedMSI• NANDMSI(waferstarts): +7%• HDDMSI(drivesshipped): -17%• LTOMSI(cartridgeshipped):-12%
• NANDinvestmentinMSIreflectsonNANDincreases(35%)inExabyteshipmentsofmemory
©2016IBMCorpora2onPage12Fontana,Decad–LOC2016–StorageMedia

0
2000
4000
6000
8000
10000
12000
14000
16000
18000
2007 2008 2009 2010 2011 2012 2013 2014 2015 2016
12"DiameterFlashNANDWaferStarts(millions)
2015NANDMSIObserva2ons
• Landscape:16,000,000wafers,83,000PB,$33BRevenue• $0.401/GBor$2075/wafer• 5.187TB/wafer• 11.7GB/chip(44012mmx12mmchipsperwafer)• Stateofartchipis~3Xgreateror32GB(375chips13mmx13mmperwafer)or12.0TB/wafer
• Factories• $8Bstateofartfacilitycanproduce4000wafers/dayor1.4Mwafers/yrorupto16,000PB/yr• NANDwafercapacityincreasedatalinearrateof~1,000,000peryearimplyingannualnewfactory
investmentof~$6B/year• Withoutanyincreaseinarealdensity,adoublingofPBoutputforNANDwouldrequire6new
factoriesanda$48Binvestment.
• AnMSIExample• Usingbestofbreedchip(12TB/wafer)wouldrequire47Mwaferstoreplace565EBofHDDstorage• 47Mwafersrequires32$9Bfactoriesor$288BinCapital!!èarealdensityisabeeerstrategy!!!
©2016IBMCorpora2onPage13Fontana,Decad–LOC2016–StorageMedia

0
100
200
300
400
500
600
700
2007 2008 2009 2010 2011 2012 2013 2014 2015 2016
HDDUnits(millions)
2015HDDMSIObserva2ons
• 2015Landscape:• 470,000,000drives• 565,000PB• $28.3BRevenue• $0.051/GB• $60.2/drive• 1.2TB/HDD
• 3%morePB,and17%lower$/GBimplies~15%lessrevenue
• The20%increaseinTB/HDDnotresulAngsolelyfromarealdensityincreases• Arealdensityincreaseonly10%• Productmixshiyfrom2.5”HDDto3.5”HDD(moresurfaceareaandmoreMSI)• Moreplaeers/HDD(moresurfaceareaandmoreMSI)
• MSI(i.e.numberofplaeersandnumberofheads)mayhavedecreasedin2015
• 2014Landscape:• 564,000,000drives,• 549,000PB,• $33.4BRevenue• $0.061/GB• $59.2/drive• 1.0TB/HDD
©2016IBMCorpora2onPage14Fontana,Decad–LOC2016–StorageMedia

0
5
10
15
20
25
30
2007 2008 2009 2010 2011 2012 2013 2014 2015 2016
LTOCartridgeUnits(millions)
2015 LTO TAPE Media MSI ObservaQons
• Landscape:19,400,000cartridges,33,000PB,$0.45BMediaRevenue• $0.0134/GB• $23.20/cartridge• 1.7TB/cartridge(reflecAveofLTOproductmix)• Note:LTO5capacity1.5TB,LTO6capacity2.5TB,LTO7capacity6.0TB(4Q15introducAon)
• AnMSIExample• MediaCapacityis19.4Mcartridges• Maximumcartridgecapacityis6TB• LTOPBshipmentscouldincreasefrom33,000to116,000PBshipmentswithnonewcapitalinvestment
©2016IBMCorpora2onPage15Fontana,Decad–LOC2016–StorageMedia

0.01
0.1
1
10
2007 2008 2009 2010 2011 2012 2013 2014 2015 2016
$/GB
YEAR
HDD NAND LTOTAPEMEDIA
$/GB Trends: 2008-2015
$/GB201320141YEAR%Δ7YEARANNUAL%ΔLTOTAPEMEDIA0.0240.0196-18.3%-22.9%HDD0.0710.061-14.1%-22.1%NAND0.6150.49-20.3%-27.3%
• ObservaAons• $/GBreducAonisleastforHDD• RelaAveto8yearannualaverages,
2015$/GBreducAonsareless• $/GBdataforBlu-raydatadisc,
i.e.BD-RE,arenotavailableforlargequanAAessoopAcalcomponentcomparisonsarenotpossible.Note“upsidedown”$/GBpricingfordiskcapaciAes(quanAAesof~20)withnodecreasefor25GBBDbutdropin100GBBD.
100GBBD
50GBBD
25GBBD
$/GB 2014 20151YEAR%Δ
8YEARANNUAL
%Δ
LTOTAPEMEDIA 0.0166 0.0134 -19.3% -23.9%HDD 0.061 0.051 -16.4% -21.3%NAND 0.515 0.401 -22.1% -26.1%
©2016IBMCorpora2onPage16Fontana,Decad–LOC2016–StorageMedia

0.1
1
10
100
2007 2008 2009 2010 2011 2012 2013 2014 2015 2016
Revenu
e($B)
Year
HDD NAND LTOTAPEMEDIA
Revenue Trends: 2008-2015
$/GB201320141YEAR%Δ7YEARANNUAL%ΔLTOTAPEMEDIA0.0240.0196-18.3%-22.9%HDD0.0710.061-14.1%-22.1%NAND0.6150.49-20.3%-27.3%
• ObservaAons• NANDrevenueexceedsHDDforfirstAme• SignificantHDDrevenuedecreaseleadsto
overalldropintotalcomponentrevenueforallstoragetechnologies
• SignificantNANDrevenuegrowthabovehistoricalaverages
• LTOTAPEcartridgerevenueconAnuesdeclineinthe8%to10%annualraterange
DVDRevenue
Revenue($B) 2014 20151YEAR%Δ
8YEARANNUAL
%Δ
LTOTAPEMEDIA 0.5 0.45 -10.0% -8.4%HDD 33.4 28.3 -15.3% -2.6%NAND 32.2 33.2 3.1% 18.5%
TOTALREVENUE 66.1 61.95 -6.3% 4.7%
©2016IBMCorpora2onPage17Fontana,Decad–LOC2016–StorageMedia

0.1
1
10
100
1000
10000
2007 2008 2009 2010 2011 2012 2013 2014 2015 2016
AREA
LDEN
SITY(G
b/in
2 )
YEAR
HDD NAND LTOTAPEMEDIA
Maximum Areal Density Trends: 2008-2015
$/GB201320141YEAR%Δ7YEARANNUAL%ΔLTOTAPEMEDIA0.0240.0196-18.3%-22.9%HDD0.0710.061-14.1%-22.1%NAND0.6150.49-20.3%-27.3%
(1)(2)(3)
(1) LTO7introducedYE2015(2) HDDdensityincreaserepresentsshinglemagneAcrecording–
800Gb/in2for3.5”HDDand1000Gb/in2for2.5”HDD(3) NANDdensityincreaserepresentsTLC(3bit/cell)at16nm,5F2cell
• Comments• LTOarealdensitytrackingis
straigh{orward• HDDarealdensiAesarethemaximum
reportedin2.5”HDDs.Note,thatmaximumarealdensityreportedin3.5”HDDsininthe800Gbit/in2range.
• NANDarealdensitydifficulttodeterminesincetheclassic4F2celldesignisnotrigorouslyused.
BD-RE
AREALDENSITY(Gb/in²)
2014 20151YEAR%Δ
7YEARANNUAL
%Δ
LTOTAPEMEDIA 2.1 4.3 104.8% 25.0%HDD 900 1000 11.1% 14.8%NAND 1200 1500 25.0% 33.4%
©2016IBMCorpora2onPage18Fontana,Decad–LOC2016–StorageMedia

1
10
100
1000
2007 2008 2009 2010 2011 2012 2013 2014 2015 2016
EBShipp
ed
YearHDD NAND LTOTAPEMEDIA
Exabyte Shipment Trends: 2008-2015
$/GB201320141YEAR%Δ7YEARANNUAL%ΔLTOTAPEMEDIA0.0240.0196-18.3%-22.9%HDD0.0710.061-14.1%-22.1%NAND0.6150.49-20.3%-27.3%
DVDEB
• ObservaAons• HDDEBshipmentincreasesignificantly
lessthanhistoricalaverage• LTOMediaEBshipmentincreaseisless
thanhistoricalaverage• SignificantNANDEBshipmentincrease
relaAvetoLTOTAPEandHDD.• NANDEBshipmentsexceedLTOEB
shipments(consumermarket,i.e.IPhone6)by>2X
• TotalEBshippedgrewonlyby6%!!!
EBSHIPPED 2014 20151YEAR%Δ
8YEARANNUAL
%Δ
LTOTAPEMEDIA 30.1 33.0 9.6% 16.9%HDD 549.0 565.0 2.9% 24.0%NAND 62.5 83.0 32.8% 60.7%TOTALEBSHIPPED 641.6 681.0 6.1% 25.6%
©2016IBMCorpora2onPage19Fontana,Decad–LOC2016–StorageMedia

Data CreaQon and Storage Manufacturing
$/GB201320141YEAR%Δ7YEARANNUAL%ΔLTOTAPEMEDIA0.0240.0196-18.3%-22.9%HDD0.0710.061-14.1%-22.1%NAND0.6150.49-20.3%-27.3%
• ObservaAons• Totalmanufacturedstoragein2015was
681EB,anincreaseof6%over2014manufacturedstorageEB
• Contrastthesevalueswith2013IDCclaimsthatcreatedusefuldatain2015wouldbe2180EB,anincreaseof40%over2014createdusefuldata,andthatusefuldatawouldconAnuetogrowat40%annually.
• Issue1:Shor{allbetweenphysicalstoragemanufacturedin2015vsusefuldatacreatedin2015is1500EB(2Xmorethanallstoragemanufacturedin2015).Someshor{allisabsorbedbyde-duplicaAonandbycompression.
• Issue2:Manufacturedstorageisgrowingbyatbest6%peryearvsperceiveddatagrownof40%year.
• Issue3:InviewofIssue1andIssue2,eithertheIDCforecastsarenotaccurateorstorageusersareselecAvelystoringdata
• Issue4:Manufacturedstorage(withtheexcepAonof2008-2010)isnotincreasinggeometrically
Δ
0
500
1000
1500
2000
2500
2007 2008 2009 2010 2011 2012 2013 2014 2015 2016
Exabytes
Year
DataGrowth-- Exabytes
HDD NAND
LTOTAPEMEDIA ANNUALPHYSICALSTORAGE
USEFULDATA
←RECESSION→
←CLOUD→ExponenAalHDDGrowthTunnel,Recording
ThailandFloods
©2016IBMCorpora2onPage20Fontana,Decad–LOC2016–StorageMedia

Summary
• ChangingNANDenvironment–Oversupply• 2015:30%increaseinPBshipmentswith3%increaseinrevenue• 2014:60%increaseinPBshipmentswith30%increaseinrevenue
• ChangingHDDenvironment–MarketErosion• 2015:3%increaseinPBshipmentswith15%decreaseinrevenue• 2014:17%increaseinPBshipmentswith0%revenuechange
• ChangingLTOMediaenvironment–ConAnuingRevenueDrop~8%/YRto10%/YR
• NANDrevenueexceedsHDDrevenue;NANDarealdensityexceedsHDDarealdensity
• Manufacturingenvironment–Moore’sLaw“doubling”notachieved• RevenueformanufacturedPBofstoragedecreasedby6%• TotalmanufacturedPBonlyincreasedby6%in2015.AdirectconflictwiththepercepAon
thatusefuldataincreasesat40%annually.
• Technology• TAPE–NextgeneraAonsensorintroducAon--Moore’sLawScaling• HDD–HAMR,ShingleMagneAcRecording,MorePlaeers–NotMoore’sLawScaling• NAND–Planar3bit/celldesignsat<16nm,3DmulA-layercellsat~60nm–Not
SustainedMoore’sLawScaling(24layersto48layersto96layersto…)
©2016IBMCorpora2onPage21Fontana,Decad–LOC2016–StorageMedia
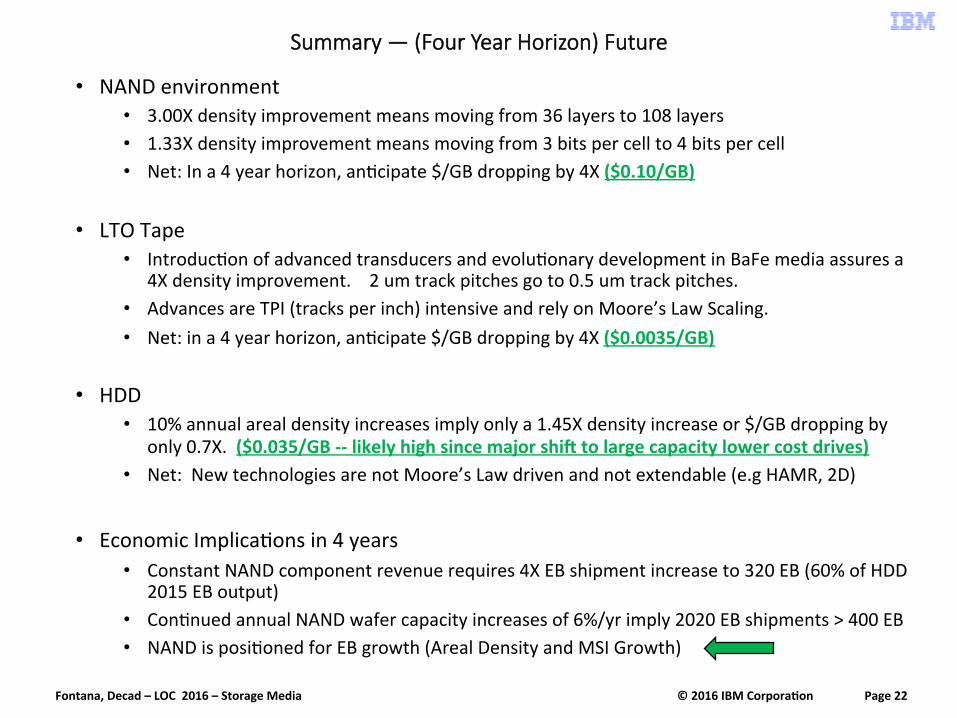
Summary — (Four Year Horizon) Future
• NANDenvironment• 3.00Xdensityimprovementmeansmovingfrom36layersto108layers• 1.33Xdensityimprovementmeansmovingfrom3bitspercellto4bitspercell• Net:Ina4yearhorizon,anAcipate$/GBdroppingby4X($0.10/GB)
• LTOTape• IntroducAonofadvancedtransducersandevoluAonarydevelopmentinBaFemediaassuresa
4Xdensityimprovement.2umtrackpitchesgoto0.5umtrackpitches.• AdvancesareTPI(tracksperinch)intensiveandrelyonMoore’sLawScaling.• Net:ina4yearhorizon,anAcipate$/GBdroppingby4X($0.0035/GB)
• HDD• 10%annualarealdensityincreasesimplyonlya1.45Xdensityincreaseor$/GBdroppingby
only0.7X.($0.035/GB--likelyhighsincemajorshimtolargecapacitylowercostdrives)• Net:NewtechnologiesarenotMoore’sLawdrivenandnotextendable(e.gHAMR,2D)
• EconomicImplicaAonsin4years• ConstantNANDcomponentrevenuerequires4XEBshipmentincreaseto320EB(60%ofHDD
2015EBoutput)• ConAnuedannualNANDwafercapacityincreasesof6%/yrimply2020EBshipments>400EB• NANDisposiAonedforEBgrowth(ArealDensityandMSIGrowth)
©2016IBMCorpora2onPage22Fontana,Decad–LOC2016–StorageMedia

Summary — Technology and the Market
• NANDenvironment
©2016IBMCorpora2onPage23Fontana,Decad–LOC2016–StorageMedia
Time
FigureofM
erit
(Reven
ue,V
olum
e,…)
MatureTechnology,StableMarket
NewTechnology,LowVolume,HighMargin
TechnologyCompaniesLead
Highgrowth,largeInvestment,mulApleplayers
ConsolidaAon,highvolumemanufacturing
Postconsumerdrivendesignpoints
HighVolume,LowerMargin,ConsumerCommodity
FlashEnterprise
HDDFlashConsumer
Tape